


Abstract
This study addresses the environmental problems stemming from greenhouse gas (GHG) emissions from public transportation in the cities of Chillán and Chillán Viejo. Specifically, it analyzes emissions from fossil-fuel-powered buses, which contribute to climate change and negatively affect people’s quality of life. Given this situation, the need to reduce these emissions and move towards more sustainable mobility systems is recognized. The main objective of this research is to estimate the CO2-equivalent reduction that could be achieved by replacing fossil-fuel-powered public transportation with electric vehicles in the aforementioned cities. To this end, the ISO 14064 methodology is used, subject to specific scope and limitations. This study reviews key aspects, including current environmental legislation, Chile’s international commitments regarding climate change, and the state of emissions in the transportation sector, to illustrate the current state of electromobility in Chile. Finally, the impact of the transition to electromobility in public passenger transport by bus is quantified, resulting in a reduction of 9429 tons of CO2 equivalent emissions, equivalent to 63.4% compared to the 2023 bus fleet, considering the average emission factor of the national electricity system for 2023. The proposal consists of implementing a 100% electric bus public transport system, highlighting its advantages in reducing emissions, improving energy efficiency, improving air quality, and reducing noise pollution. However, this requires a significant financial investment of approximately USD 57 million, excluding public charging stations for electric buses. Furthermore, public policies offering means of accelerating the transition of public transport in Chile are analyzed.
1. Introduction
Climate change has become one of the most significant challenges facing humanity in the 21st century. This phenomenon is the result of rising global temperatures due to greenhouse gas (GHG) emissions, which have reached alarming levels in recent decades. According to the Intergovernmental Panel on Climate Change (IPCC) [1] in its 2023 synthesis report, global GHG emissions in 1990 reached approximately 21 gigatons of CO2 equivalent (GtCO2eq). Since then, these emissions have increased significantly, reaching nearly 59 GtCO2eq in 2019, representing an increase of 54%.
Over time, the global community has recognized the need to address this crisis through the United Nations Framework Convention on Climate Change (UNFCCC) [2], which provides the guidelines for global agreements such as the Kyoto Protocol and the Paris Agreement (United Nations, 2024), both of which seek to limit the global temperature increase to well below 2 °C, and preferably to 1.5 °C above pre-industrial levels [3]. These efforts reflect countries’ concrete intention to reduce their carbon footprint and mitigate the adverse impacts of global warming.
In Chile, the national GHG inventory for 2020 [4] reported a total of 105,552 kilotons of CO2 equivalent [ktCO2eq], which represents an increase of 116% compared to 1990. The main drivers of this increase in emissions are the burning of fossil fuels for electricity generation and land transportation [5], the latter subcategory contributing 22,842 [ktCO2eq], which shows that this trend is related to the expansion of the vehicle fleet, population growth, increased purchasing power, and improvements in road infrastructure [5]. In this context, public transportation plays a crucial role, as it can reduce traffic congestion and, consequently, mitigate sectoral emissions. However, the heavy reliance on fossil fuels and the growing demand for mobility in cities, driven by population growth, represent significant obstacles to transitioning to more sustainable models. Furthermore, it is essential to note that air pollution remains a serious public health problem, especially for the most vulnerable populations, such as children. In 2019, air pollution was estimated to cause 4.2 million premature deaths worldwide. Exposure to fine particles has been linked to cardiovascular disease, respiratory problems, and cancer, highlighting the urgency of addressing this issue [6].
In this context, electromobility has emerged as a key solution for reducing GHG emissions, contributing not only to reducing air pollution but also to improving the quality of life in cities by creating quieter and more efficient environments [7]. Electromobility enables the electrification of a process that currently consumes significant amounts of fossil fuels. If the electricity that powers electric vehicles comes from non-conventional renewable energy sources, such as solar or wind, their benefits are amplified, as this solution aligns with the energy efficiency and sustainability goals established in Law 21,305 [8], which promotes the use of non-conventional renewable energies and regulates measures to strengthen their participation in the Chilean National Electricity System [9].
The interconnected cities of Chillan and Chillan Viejo, located in the Ñuble Region, also face significant challenges in their transportation systems. With a total population of 223,070, Chillan is the regional capital of the Ñuble Region. Nevertheless, its population is much smaller than that of other regional capitals in Chile, such as Santiago (over 8.3 million inhabitants), Valparaíso (approximately 1.9 million inhabitants), and Concepción (approximately 1.6 million inhabitants) [10]. The Regional Undersecretariat of Transportation [11] reports that the bus fleet is aging, causing the quality of service to deteriorate. Despite the reasonable coverage, operational inefficiencies and a lack of modernization have led many in the population to opt for private vehicles, intensifying traffic congestion and environmental pollution. This leads to congestion on main roads, driven by the growth of the vehicle fleet and limitations in public transportation, directly impacting the residents of these areas. Given this situation, there is an urgent need to implement a public transportation model that not only reduces GHG emissions from public buses but also optimizes urban transport. This change would improve public health, particularly air quality, a critical aspect in winter, while making the public bus system more attractive through more efficient and sustainable services. The transition to a more environmentally responsible mobility system is essential to guaranteeing a more accessible, healthy, and equitable future for generations to come.
Therefore, this study aims to estimate and analyze the impact of CO2 equivalent (CO2eq) emissions reductions resulting from the replacement of public transport buses in the cities of Chillán and Chillán Viejo with a fully electric bus fleet. While the emissions calculation methodology is based on ISO 14064 [12], it incorporates certain assumptions and simplifications. Due to their size, this methodology can be applied to the cities of Chillán and Chillán Viejo and could potentially be used in larger cities. To this end, relevant international and national environmental regulations are analyzed. The benefits and challenges of implementing electromobility in Chile are then examined, culminating in recommendations for public policies to promote electromobility across both public and private passenger transport.
2. The Environmental Situation in Chile
GHGs are gaseous components present in the atmosphere. According to the Kyoto Protocol and the Paris Agreement, the leading greenhouse gases are carbon dioxide (CO2), methane (CH4), nitrous oxide (N2O), and fluorinated compounds (HFCs and PFCs), which contribute to the greenhouse effect. This process allows solar energy to reach Earth in the form of light and heat, some of which is absorbed by the Earth’s surface and some of which is emitted back into space as infrared radiation. These gases capture this radiation, which traps heat on the Earth’s surface and keeps the planet’s temperature within a range suitable for life. However, anthropogenic activities have increased the concentration of these gases, intensifying this phenomenon and contributing to global warming [1]. In Chile, the GHG balance (55,824 ktCO2eq) is shown in Figure 1, where CO2 accounted for 53% of the total in 2020 [4].
Figure 1.
GHG balance (ktCO2eq) by gas in Chile during the year 2020, considering its capture in its total balance [4].
A key aspect to consider is the unit of measurement that quantifies GHGs based on their equivalent impact, as this enables comparisons among different gases based on their global warming potential (GWP). For this purpose, the carbon dioxide equivalent [CO2eq] unit is used, which provides a standard scale thanks to a conversion factor.
This unit allows us to calculate how many CO2 emissions would be required to cause a similar global warming effect as a specific amount of another gas, generally over 100 years. The calculation is completed by multiplying the emissions of a gas by its global warming potential (GWP), which explains why gases such as CH4 and N2O, despite being emitted in smaller quantities, can have a more significant impact. Thus, the CO2 equivalent not only facilitates measurement but also enables the practical assessment and comparison of the contributions of different gases to climate change [3].
Throughout the 20th century, advances in climate modeling and meteorological data collection enabled the identification of patterns of global warming. This growing concern led to the creation of the Intergovernmental Panel on Climate Change (IPCC) in 1988, an organization that assesses the state of the climate and publishes reports documenting rising temperatures, melting glaciers, and increasing extreme weather events [13]. According to its synthesis report, global GHG emissions were estimated at approximately 59,000,000 ± 6.6 [ktCO2eq] for 2019, representing an increase of 12% compared to 2010 and 54% compared to 1990. Most of these emissions come from the combustion of fossil fuels and industrial processes, with a notable increase in CO2 emissions. Regarding sectoral contributions, approximately 79% of emissions originate from the energy, industry, transport, and buildings sectors, while the remaining 21% is attributed to agriculture, forestry, and other land uses [1].
In the national context, Figure 2 shows the evolution of Chile’s emissions over time. In 2020, total emissions reached 105,552 ktCO2eq, an increase of 116% from 1990. It is essential to highlight that these data do not include CO2 absorption in the land use, land use change, and forestry (LULUCF) sector. If these captures were included in the emissions balance, the total would be reduced to 55,824 ktCO2eq, reflecting the carbon absorption capacity of these ecosystems [4].
Figure 2.
Historical balance of GHG emissions in Chile [4].
On the other hand, Figure 3 shows the participation of each sector in the same year (2020), highlighting that the energy sector represented 75% of total emissions; it includes various subcategories that are detailed in Figure 4. Among these categories, transport reached a total of 26,144 [ktCO2eq], of which 85% corresponded to land transport (22,842 [ktCO2eq]). This value reflects an increase of 182% compared to 1990, covering in this subcategory all motorized vehicles operating on roads [4].
Figure 3.
GHG balance (ktCO2eq) by sector in 2020.
Figure 4.
Greenhouse gas balance by subcategories addressed by the energy sector in Chile in 2020.
Since the Industrial Revolution, public transportation in Chile has undergone significant evolution. Initially, traditional horse-drawn carriages were used. However, starting in the 1920s, motorized vehicles were incorporated, quickly becoming the primary mode of transportation [14]. Since then, the transportation system has gradually modernized, resulting not only in technological advances but also in increased pollution due to GHG emissions from these vehicles. In 2018, the transportation sector in Chile emitted 28.6 million tons of CO2eq, accounting for 23% of the country’s total emissions. Of these emissions, at least half originated in urban areas, especially in cities such as Greater Santiago, Valparaíso, and Concepción (Ministry of Transportation and Telecommunications of Chile, 2022). This trend has not changed significantly in recent years; in 2020, land transport emissions accounted for 21% of total emissions [4]. This increase in pollution, which contributes to global warming, has prompted the implementation of policies and strategies to promote cleaner, more sustainable transport.
Table 1 highlights GHG emissions by region in Chile, with the Ñuble Region in thirteenth place, accounting for only 2.3% of total emissions. This information highlights the areas where reduction efforts should be focused, given the country’s commitment to achieving carbon neutrality by 2050 [7].
Table 1.
GHG emissions in [KtCO2eq] in 2020, by sector and region in Chile [15].
A study conducted in Spain analyzes the reduction in CO2 emissions in Madrid’s urban environment by replacing the conventional bus fleet with electric buses. The study shows that, by gradually replacing the current fleet over ten years (2020–2030), CO2 emissions could be reduced by up to 92.6% compared to 2018 levels. The analysis highlights that electric buses are significantly more efficient and less polluting than diesel and natural gas buses, and that the transition to a greater share of renewable energy in Spain’s energy mix will contribute to further reductions in emissions [16]. Meanwhile, another study conducted in Romania analyzes the replacement of 11 Euro 0 diesel buses in the Cluj-Napoca Public Transport Company (CTP) fleet with electric buses. The results are similar to those of the analysis conducted in Spain, showing that CO2 emissions from electricity consumed by electric buses are 2605 times lower than those generated by diesel buses, indicating a significant reduction in local pollution [17].
It should be noted that Euro standards are a set of European Union regulations that establish limits on pollutant emissions from vehicles entering a country for sale, such as nitrogen oxides (NOx), carbon monoxide (CO), and particulate matter (PM), to reduce air pollution and protect public health [18]. In Chile, bus emissions are regulated according to Euro V and Euro VI standards for new vehicles, while imported buses must comply with at least the Euro V standard [19]. Table 2 presents the emission limits, considering that the Euro VI standard requires more advanced technologies such as exhaust gas recirculation systems and diesel particulate filters. These regulations have a direct impact on public transport, especially in large cities, where fleet renewal is currently underway to comply with these standards [20]. While some of these pollutants are not direct GHGs, their control has a significant impact on climate change mitigation because they interact with other gases. Furthermore, the efficiency in reducing these pollutants indirectly contributes to reducing CO2, one of the main GHGs [21].
Table 2.
Emission limits based on the standards applicable to heavy motor vehicles in Chile and their relationship with Greenhouse Gases (GHG).
On the other hand, in Stockholm, an optimization model and life-cycle analysis were used to evaluate how electrifying public transport can reduce GHGs in the bus network, quantifying a total of 12.73 [ktCO2eq] per year, of which 95% is associated with fuel use. The results show that a combination of electric and biodiesel buses is the most cost-effective solution, achieving a 50% reduction in emissions. Furthermore, the study suggests that it is essential to consider the composition of the energy matrix and the characteristics of the batteries; it recommends future research on their life-cycle impacts and the charging infrastructure [22].
Since 2010, the use of electric vehicles has increased thanks to advances in lithium-ion battery technology, which have significantly reduced their costs and made them more competitive with internal combustion vehicles. Worldwide, there are more than three million electric vehicles, with a notable concentration in China and the United States [23]. Several countries have already made significant progress in promoting electromobility, driven by public policies that facilitate the transition, with China standing out as a global leader, operating more than 421,000 electric buses and aiming to reach more than 600,000 by 2025. Meanwhile, in the United States, California has already implemented regulations requiring public transportation agencies to transition to zero-emission buses by 2029, with more than 14,000 electric buses already in operation. The European Union aims to be carbon neutral by 2050, with countries such as Denmark and the Netherlands also leading the way in adopting electric buses [9]. In Latin America, Chile stands out as a leader in electric mobility, with a fleet of 2043 electric buses in operation, representing 40.8% of the total number of zero-emission buses circulating across the country [24].
Many initiatives are underway to convert ICE buses to electric buses. In [25], an analysis of various works is conducted in the light of the European Union’s goal of reducing greenhouse gas emissions to at least 55% by 2023 and achieving climate neutrality by 2050. These targets will only be met through a shift to sustainable mobility, including the introduction of electric vehicles in cities and the adoption of battery-electric vehicles (BEVs) for urban public transport. Finally, the SWOT analysis supports considering battery-electric buses (BEBs) to help decarbonize the transport sector and, consequently, reduce GHG emissions into the atmosphere. The environmental benefits of BEBs offset the initial purchase costs of this type of bus, and in the long run, they experience lower operational costs than diesel buses. This is due to lower battery-charging electricity costs, greater energy efficiency, and reduced maintenance costs. On the other hand, with the introduction of electric buses into urban fleets, electric energy consumption is expected to increase. However, this problem can be mitigated by scheduling fueling for nighttime hours, when prices are lower, and energy availability is greater. An interesting point of view is shown in [26], which indicates that the transportation and storage of goods account for 15% of greenhouse gas emissions in Europe, and that this figure will increase significantly by 2050. To mitigate this, the European Union has suggested shifting 30% of long-distance road freight to cleaner alternatives, such as rail or waterborne transport. In this study, the hypothesis to be tested is whether using an intermodal rail/road transport mode (rather than just roads) for the transport of some products can help reduce global CO2 emissions, even for short distances. To test this, this study investigates the carbon emissions (and transport cost reduction) generated by rail/road intermodal aggregate transport for short distances in the Madrid region (Spain), rather than the currently used direct truck transport. An analysis of variables, such as aggregate supply, demand locations and amounts, and road and rail networks, using a geographical information system, provides the associated carbon emissions of the different transport alternatives. To reduce CO2 emissions, this study proposes establishing intermodal transfer facilities near consumption centers, where materials are primarily transported by rail, with road transport limited to final delivery to consumption areas. The results show that there are products (such as aggregates) for which, even if transported over distances less than 100 km, their transport from supply to demand points via a combined rail and road system will significantly reduce carbon emissions by several thousand tons per year. Emissions reductions would range from 8000 to 55,000 tons of carbon per year, depending on the amount of aggregates initially transported by rail. For a realistic scenario with four intermodal terminals, with a material transfer capacity of 500,000 tons/year each, the reduction in carbon emissions could be around 20,000 tons compared to the base scenario. On the other hand, the authors of [27] propose that urban mobility must evolve to reduce dependency on fossil fuels by increasing public transport options and promoting active modes of transportation. This study presents a methodology to estimate the modal share required to shift car users to active modes and public transport, thereby achieving future CO2 emission reduction targets in the road transport sector. The results of the Braga (Portugal) case study show that significant changes are needed in modal shares and commuter trip distribution across transport modes to meet the ambitious targets set by the government. In Braga, almost 70% of the commuter trips are currently made by cars, and by 2040, 63% of these trips will need to be created using active modes and 32% by bus, so only 55,784.23 tonCO2 are emitted by the road transport sector, which is below the target of 59,150 tonCO2. Freight transportation plays a critical role in the global economy’s supply networks. It is heavily influenced by the activities of the industrial and manufacturing sectors, contributing significantly to their global carbon footprint (CFP). In [28], lifecycle-based CFP emissions from freight transport activities in seven selected countries (China, Japan, the United States, Canada, Brazil, Great Britain, and Germany) over 15 years are evaluated, accounting for international trade linkages with the rest of the world. For this research, we are evaluating the relationship between global CFP, gross domestic product (GDP), population, level of urbanization, and country area. The results showed that the total impacts (i.e., onsite + supply chain) for each country, which include the USA, Canada, China, Japan, Germany, Great Britain, and Brazil, are 91%, 92.17%, 96.26%, 84.75%, 82.56%, and 92.5%, respectively. China is the largest contributor to the CFP of the freight transport sector, while Great Britain has the most sustainable freight transport sector. In addition, the manufacture of coke and refined petroleum products sector has a dominant CFP share in the USA, China, Japan, and Brazil. However, warehousing and support activities for the transportation sector have the highest CFP share in Germany and Great Britain, while the land and pipeline transport sectors are dominant in Canada.
In Chillán and Chillán Viejo, Decree 48 establishes an Air Pollution Prevention and Decontamination Plan for both municipalities, aimed at reducing fine particulate matter (PM) and nitrogen oxides (NOx) by replacing at least 100 buses over five years. This process prioritizes replacing older vehicles with newer, lower-emission units [29].
Given these scenarios, it is crucial to determine how many emissions would be prevented in these localities by migrating the current public transport fleet to electric mobility. This transition would not only reduce GHG emissions but also significantly improve air quality and public health, as well as reducing noise pollution in these cities. Therefore, to properly assess the impact of this change, it is essential to conduct an analysis that quantifies the emissions avoided by electric buses compared to traditional models, while accounting for the environmental and social benefits derived from this transformation.
3. International and National (Chilean) Regulations Related to the Environment
International climate change regulations are fundamental to addressing the global warming crisis. These regulations provide a common framework for countries to work collaboratively, set clear goals, and promote coordinated solutions, as the effects are not isolated. International cooperation is essential, as the impacts of climate change require joint efforts to reduce emissions, promote renewable energy, and ensure adaptation to its effects.
The Kyoto Protocol (1997) was the first international treaty that committed industrialized countries and some developing countries to reduce their emissions. It established binding targets for the most developed countries, as they were considered the main historical contributors to climate change. The Kyoto Protocol focused on quantifiable emissions reductions between 2008 and 2012, with flexibility mechanisms such as emissions trading and clean development projects [2].
The Paris Agreement (2015), signed by 198 countries, aims to keep the increase in global temperature below 2 °C above pre-industrial levels and pursues efforts to limit it to 1.5 °C [12]. Unlike the Kyoto Protocol, it does not establish binding emissions targets; instead, it promotes national commitments known as Nationally Determined Contributions (NDCs), which each country must review and update every five years to increase reductions. This flexible, cooperation-based approach seeks to be inclusive and applicable to both developed and developing countries (Government of Chile, 2020).
It is also essential to consider the United Nations’ Sustainable Development Goals (SDGs) under the 2030 Agenda, which include several targets directly related to environmental issues. In particular, SDG 13: Climate Action aims to improve education, awareness, and human and institutional capacity to mitigate climate change, adapt to its effects, and reduce its adverse impacts [30], while SDG 11: Sustainable Cities and Communities seeks to make human settlements inclusive, safe, resilient, and sustainable, considering as key approaches the promotion of urban transport systems, such as the use of zero-emission buses and improvements in freight infrastructure, focusing on the transformation of cities to reduce their carbon footprint [31]. Therefore, these goals are closely linked to both international frameworks, such as the Paris Agreement and the Kyoto Protocol.
Regarding national regulations, Law No. 21,455, known as the Framework Law on Climate Change (2022), establishes a regulatory framework that defines measures to reduce greenhouse gas emissions and achieve carbon neutrality by 2050 [32]. This law also promotes the creation of various public policies and management instruments to address the global phenomenon of climate change. Among these, the Nationally Determined Contributions (NDCs), updated in 2020, stand out. Within the framework of the Paris Agreement, these NDCs set a goal of reducing emissions by 30% by 2030, relative to the projected level in 2016 without policies [33]. In addition, the National Air Pollution Control Plan [34] should be considered; it aims to reduce air pollution by focusing primarily on emissions of particulate matter, NO2, and other pollutants that contribute to increased GHG emissions. Although this plan does not focus exclusively on public transportation, it includes control measures for vehicle emissions, including those related to buses, all of which are subject to emission standards aligned with international standards, such as those of the European Union, where Chile is currently implementing the third phase of the Euro 6 standard [19].
In the long term, Chile’s Long-Term Climate Strategy [35] is presented as a key tool for mitigating emissions. This strategy includes specific actions to reduce greenhouse gas (GHG) emissions generated by public transportation, primarily through electromobility and the promotion of sustainable transportation systems. The plan establishes a policy framework that aligns with the Framework Law on Climate Change and the Nationally Determined Contributions (NDCs), highlighting electromobility initiatives with ambitious reduction targets [32]. Figure 5 illustrates how the law is linked to these instruments and other plans that share the same objective.
Figure 5.
Linking the Climate Change Law with other management instruments for climate change mitigation and adaptation in Chile.
The new National Electromobility Strategy [7], promoted by the Ministry of Energy, is also a state policy that aims to develop a roadmap for advancing sustainable transportation. It establishes specific goals, such as ensuring that 100% of new additions to urban public transit are electric vehicles by 2035 and that bus and taxi fleets are fully electrified by 2040. The strategy is structured around four main pillars: sustainable transportation and financing; charging infrastructure and regulation; research and human capital; and dissemination and information. Furthermore, it promotes collaboration between the public and private sectors, creates economic incentives, and implements regulations that facilitate the adoption of clean technologies, thereby improving citizens’ quality of life and contributing to environmental sustainability [7]. On the other hand, “The Roadmap for the Advancement of Electromobility in Chile” establishes concrete actions to expand the use of electric vehicles in the country by 2026. It is framed within a context of climate emergency and the need to reduce dependence on fossil fuels, given that transportation accounts for approximately 25% of the country’s greenhouse gas emissions. The measures include the implementation of 40 electric buses in Antofagasta, 42 in Coquimbo, 25 in the Biobío Region, and 12 in Atacama, with the aim of improving users’ quality of life and contributing to decarbonization goals. In addition, the electrification of smaller transportation services (taxis and shared taxis) will be promoted through co-financing programs, and regional working groups will be created to define specific plans and prioritize electromobility projects in each region [20].
Focusing on local regulations, other key instruments include the Air Pollution Prevention and/or Decontamination Plans (APPD), which aim to reduce air pollution levels to protect public health. In the case of the municipalities of Chillán and Chillán Viejo, the APPD includes the implementation of incentives and requirements for public transportation management, in addition to bus replacement measures [29]. Specifically, regarding transportation, priority is given to replacing older vehicles with those that meet Euro V or higher emissions standards. Furthermore, the plan seeks to reduce PM and NOx emissions from the public transportation system by 60% and 20%, respectively, through incentives to adopt less-polluting vehicle fleets and to implement aftertreatment systems to reduce emissions. In addition, the creation of 66 km of bike lanes is planned to promote the use of non-motorized modes of transport and improve integration with current and future transport systems.
International and national regulations establish a crucial framework for implementing policies that promote the transition of public transportation to zero-emission vehicles. In this context, the need to conduct a preliminary assessment and quantify the reduction in greenhouse gas emissions resulting from the implementation of electric buses for public transportation in the cities of Chillán and Chillán Viejo is justified.
4. Methodology
This study is structured to address the primary objective. First, we provide an overview of Chile’s environmental situation; then, we compare international and national regulations. This is followed by a quantification of CO2eq reduction. In the final stage of the article, we present an analysis of the benefits and gaps for electromobility implementation in Chile. More details are given below.
Section 2 showed the environmental situation in Chile. It presents the historical GHG balance in Chile, particularly its evolution, and it provides a detailed GHG balance by gas for 2020. Then, we show the GHG balance by sector for 2020, and, finally, we show how the GHG balance in the energy subsector highlights the transport contribution—offering a comprehensive overview of GHG emissions in Chile and allowing us to justify why it is vital to implement electromobility to decarbonize the transport subsector. Section 3 showed a comparison between international and Chilean regulations, analyzing the different international laws, such as the Kyoto protocol [2], the Paris agreement [12], and the United Nations’ Sustainable Development Goals (SDGs) under the 2030 Agenda, particularly SDG 13 [25] and SDG 11 [27]. The National regulation provides an analysis of its structure. For the first time, the Framework Law on Climate Change (2022) establishes a path for carbon neutrality by 2050. Then, the Ministry of the Environment created a National Air Pollution Control Plan [29] for saturated zones, focusing on fixed and mobile sources of particulate matter, NO2, and other pollutants that contribute to increased GHG emissions. Then, Chile established a Long-Term Climate Strategy [32]. The plan establishes a policy framework that aligns with the Framework Law on Climate Change and the Nationally Determined Contributions (NDCs). In the same section, we provide detailed information on the National Electromobility Strategy [7].
Section 4 shows how the CO2eq reduction is computed by replacing electrical buses. To this end, the annual distance by bus is estimated. These data are calculated from official data requested from the Ministry of Transport and Telecommunications, through the transparency portal. With these data and the computation, it is possible to quantify the average diesel consumption for the ICE buses. For this, the methodology used by ISO 14064 is considered [12]. Later in Section 5, the results of the quantification of CO2 emissions reduction are presented, along with a discussion of how this reduction can be improved as the emission factor of the national electrical system evolves. Section 6 presents the overall benefits of implementing electromobility in Chile, followed by Section 7, which identifies the different gaps in its implementation. On this basis, we develop a critical discussion in Section 8, finishing with the conclusions and suggestions for public policy.
Quantification of CO2eq Emissions Reduction
The breakdown of emissions, considering the global warming potential of each gas, is presented in Figure 6, where CO2 predominates at 89.5% compared to the other gases. It is worth noting that this unit is used to compare environmental impacts, facilitating the evaluation and comparison of emissions using a common term, thereby enabling a better understanding of their contribution to climate change. The data and conversions for these units are presented in Appendix A, Table A1 and Table A2.
Figure 6.
Estimation of greenhouse gas emissions, considering the global warming potential of methane (CH4), nitrous oxide (N2O), and carbon dioxide (CO2), for urban public transport in the cities of Chillán and Chillán Viejo, for the information collected in 2023.
In this case, battery-electric buses are considered, and their emissions are quantified based on the electricity consumption required to travel the exact distances as diesel-powered buses; see Table 3 [36], with more details in Appendix B. It is important to note that the emission factor used varies each year, depending on the composition of the national energy mix and the capacity factors of generators based on non-conventional renewable energy sources (NCREs), which increasingly contribute to the National Electric System. Therefore, for the electric bus fleet scenario, the emission factor of 0.242 [kgCO2eq/kWh] associated with the energy produced in Chile during the year 2023 was considered, Figure 7 [37], while, for the fossil fuel fleet, the factor of 3.011 [kgCO2eq/L] associated with mobile combustion by heavy vehicles was considered [38].
Table 3.
Fleet and kilometers traveled on a round trip and annual calculation of urban public transport in the cities of Chillán and Chillán Viejo during the year 2023.
Figure 7.
Evolution of factor emission 2020–2025 of the Chilean National System. Data obtained from [38].
Another critical aspect to consider is that, although green hydrogen (GH2) has demonstrated its potential to decarbonize key sectors, it has not yet been widely adopted due to the following significant challenges: (i) the development of GH2-generating plants, (ii) the development of adequate refueling infrastructure, and (iii) the training of the human capital necessary for its operation and maintenance [39]. While GH2 is currently being evaluated as a transportation alternative, it is still in an early stage of adoption and requires further testing and appropriate regulation for widespread implementation.
The growing concern about climate change and its repercussions for the environment and public health has led to a need to quantify greenhouse gas (GHG) emissions from various sources, with transportation among the most significant at the national level [4]. The international methodology for quantifying GHG emissions from public transportation is primarily based on ISO 14064, which establishes a systematic approach for measuring and reporting emissions from individual activities, organizations, and products [12]. The following assumptions were used to estimate the quantity of greenhouse gas (GHG) emissions:
- ◦
- The bus model, both internal combustion and electric, is the same for the entire bus fleet when calculating CO2eq emissions.
- ◦
- The calculation was based on one scenario: 100% replacement of the bus fleet.
- ◦
- To estimate the annual distance traveled, 100% of the bus fleet is considered, and 100% of the scheduled routes are assumed to be completed.
- ◦
- The number of lines and buses was requested from the Undersecretariat of Transportation and Telecommunications via the transparency portal; these are official data from 2023, [37].
- ◦
- When calculating the CO2eq emissions of the electric buses, the average emission factor of the national electricity system for 2023 was considered.
In simplified terms, the carbon footprint is calculated by collecting data on emission-generating activities and applying a specific emission factor. This study estimates fuel consumption based on kilometers traveled by the urban bus fleet in the cities of Chillán and Chillán Viejo. Conversely, to quantify emissions from migrating to an electric bus fleet, the kWh consumed to travel the exact distances is accounted for. Table 4 presents the average performance used to estimate both consumptions and Equations (1) and (2), as well as the CO2eq emissions estimates for both scenarios.
Table 4.
Performance is considered for estimating emissions from public transport in the cities of Chillán and Chillán Viejo in 2023.
Data on bus distances were requested and provided by the Undersecretariat of Transportation; these data indicated the fleet size per route and the kilometers traveled per single trip, as shown in Table 3. Additionally, online schedules were consulted to determine daily operating hours and frequency in minutes for the cities of Chillán and Chillán Viejo. This information was obtained from the webpage Moovit [40]. Using these data, the number of daily trips per bus route and the total kilometers traveled during 2023 were estimated. It should be noted that bus schedules vary throughout the week: a fixed schedule operates Monday to Friday, with less frequent service on Saturdays, Sundays, and holidays. This schedule is available in Appendix B, Table A3 and Table A4, and A5. Specifically, the number of laps is computed as follows:
In the same way, the estimated total kilometers traveled for each bus line is defined as:
The next step was to determine the emission factors. For this process, databases from public environmental agencies and government guidelines were used, including those from the Intergovernmental Panel on Climate Change (IPCC) [39] and the National Energy Commission [38]. Table 5 presents the applied factors. It is important to note that the factor reported by the IPCC is expressed in terajoules (TJ), with a total of 74,100 [kgCO2/TJ]. Therefore, the corresponding unit conversions were performed to obtain the fuel volume in liters, and the conversion information compiled in Appendix A, Table A1 and Table A2, was used.
Table 5.
Emission factors applied to estimate greenhouse gas emissions from public transport in the cities of Chillán and Chillán Viejo in 2023.
Our decision to analyze diesel-powered buses was based on an operational and economic study of the public transportation system in Chillán, conducted in collaboration with the Catholic University of the Holy Conception [41]. Conversely, the selection of battery-electric buses is based on tests performed in the cities of Chillán and Chillán Viejo [42], considering that air conditioning is not used, thereby optimizing their performance.
Another relevant aspect to consider is that the additional fuel consumption generated by traffic and frequent stops is excluded; this is because it is difficult to measure and to access information that is somewhat sensitive for the owners of the lines, such as fuel loading invoices and how many buses are actually in operation, since the operation of 100% of the fleet is also considered.
To estimate the emissions reduction, the difference between the two figures is calculated, reflecting the decrease that would be achieved if the current bus fleet were replaced by electric vehicles.
Finally, it is essential to characterize the additional benefits derived from electromobility. To identify these benefits, historical and current data on pollution levels were analyzed, complemented by a review of existing studies addressing the effects of reduced air pollutants on public health. In particular, data on the incidence of respiratory and cardiovascular diseases and their relationship to air quality were examined, providing further evidence of the importance of transitioning to cleaner, more sustainable public transport.
5. Results
The CO2eq emissions associated with public transport were quantified in 2023. The results for the cities of Chillán and Chillán Viejo are 14,871 [tonCO2eq], based on the bus fleet list presented in Table 3, which considered 291 buses, as indicated by the Undersecretary of Transport. The one-way and annual distance computations for each bus line are shown. The details of this calculation are shown in Appendix A, Table A1 and Table A2.
The emissions associated with the potential migration of conventional public transport to zero-emission buses are 5442 [tonCO2eq], representing a 63.5% reduction in CO2eq emissions from public transport, which were quantified in 2023. In particular, this CO2eq emissions reduction can be greater because the emission factor of the national electrical system was reduced to 0.21285 [kgCO2eq/kWh] in 2024, Figure 7. In this case, the public transport to zero-emission buses is 4783 [tonCO2eq], representing a 67.8% reduction in CO2eq emissions from public transport. On the other hand, for 2025, the factor emission of the national electrical system slightly increases to 0.2465 [kgCO2eq/kWh], Figure 7, and the reduction in CO2eq emissions from public transport is reduced to 62.7%.
In particular, from 2021 to 2024, the factor emission of the national electrical system decreased, but on 25 February 2025, a nationwide blackout affected 98% of the population in Chile [43]. One of the measures taken after the blackout is the reduction in electricity generation from renewable energy sources, particularly solar photovoltaic power, originating in northern Chile. This increases the availability of thermoelectric power plants, resulting in a slight increase in the emissions factor [44].
6. Benefits of Implementing Electromobility
Characterizing the benefits of migrating to electromobility involves highlighting how this shift offers advantages across environmental, economic, social, and technological domains. Table 6 summarizes some of the benefits of adopting electromobility.
Table 6.
Table outlining the advantages of migrating public transport to electromobility in Chile.
In Chillán and Chillán Viejo, the Association of Urban Taxi and Bus Owners, through Sotrapa S.A., has submitted a project to incorporate 30 electric buses, each nine meters long. This project has sought funding from the Ñuble Regional Government, and the first buses were expected to begin operating by the end of 2025 [45].
As a means of dissemination, a comprehensive awareness and education program is also proposed, including informational campaigns to highlight improvements in air quality, public health, and reduced urban noise. Likewise, the plan seeks to implement educational programs in schools and high schools to raise awareness among younger generations about the importance of sustainability and the use of clean energy, complemented by workshops and informational talks for public transport operators, and encouraging the adoption of more efficient and sustainable practices.
Despite the clear advantages of transitioning public transport to electromobility in Chile, the transition still faces significant challenges that must be addressed. Structural, operational, and economic barriers must be overcome to ensure successful implementation [7].
7. Gaps in the Implementation of Electromobility
Among the identified needs, the most prominent is the need for increased investment in the acquisition of electric buses and in the development of suitable, strategically located charging infrastructure at the terminals in the cities of Chillán and Chillán Viejo. Furthermore, it is essential to ensure an efficient energy supply through a well-planned electrical distribution network that includes both improvements to existing infrastructure and measures to create optimal conditions for the proper functioning of the charging system and the operation of the vehicles.
According to the National Electromobility Strategy, Table 7 summarizes the main barriers to the implementation of electromobility. The primary challenge is the high initial cost of electric vehicles, which is considerably higher than that of conventional vehicles. This price difference limits the technology’s widespread adoption, which in turn exacerbates social and economic segregation, as specific, more affluent sectors of the population have greater access to it. Furthermore, insufficient charging infrastructure is identified, primarily concentrated in the Metropolitan Region, which accounts for 70.3% of the national total [46]. This creates access gaps in other regions of the country, and the low interoperability between charging systems hinders route planning and the continuous operation of fleets.
Table 7.
Barriers to the implementation of electromobility in Chile.
In the regulatory sphere, there are gaps that hinder the efficient integration of electric vehicles into the system. Likewise, the need to adapt technical and regulatory standards on a large scale is recognized, as is the case with the RIC 15 Technical Specifications, which establish the safety requirements that electrical energy consumption facilities intended for charging electric vehicles currently circulating in the country must meet (Ministry of Energy, 2021). Furthermore, the Public Transport and Regional Connectivity Support Fund, established in Chile to finance projects related to public transport and regional connectivity, has been an essential tool for promoting electromobility. However, it does not include resources for electric vehicle charging stations, which generates uncertainty among public transport operators [47]. On the other hand, the D.S. Article 44 establishes that one of the key components of the Special Program for the Renewal of Buses, Minibuses, Trolleybuses, and Taxibuses is the scrapping of old vehicles, which will be replaced by cleaner and more efficient units [48].
Another relevant factor is the public policies driving the transformation of the national electricity grid, such as the Energy Policy to 2050, which aims to decarbonize the electricity system, decentralize energy systems, and position Chile as one of the world’s leading exporters of clean energy [49]. To achieve these objectives, it is crucial that Chile prioritize a secure and resilient electricity system, ensure efficient energy transmission, and implement technologies that optimize the use of renewable energy sources, such as energy storage systems. In this context, electric power terminals can play a fundamental role, not only as consumers of electricity, but also as energy producers and storage facilities. If these terminals are capable of generating and storing excess energy, they could use it to charge electric buses during off-peak hours, sell it, or supply it to the energy grid. In turn, it is necessary to coordinate closely with local operators, electricity distributors, and regional governments to ensure that growth in electricity demand from public transport does not compromise the stability of existing electrical systems or unnecessarily increase the service’s operational costs [7].
Training and human capital development are also fundamental for the effective implementation of the proposed measures. As we move towards a more sustainable public transport system, it is crucial to have a skilled workforce that can adapt to new technologies. Training operators, technicians, and professionals in the use, maintenance, and management of these vehicles and their charging infrastructure will ensure that the system functions efficiently and safely. Furthermore, standardizing job profiles and offering ongoing training programs is essential to ensure that workers are prepared to address the technical and operational challenges of electromobility, thereby promoting successful integration [19].
In the context of transitioning to a more sustainable transportation model, quantifying and monitoring emissions are critical tasks. At the national level, the National Greenhouse Gas Inventory System (SNIChile) was created to comply with international commitments under the UNFCCC [2], ensuring the sustainability, consistency, and quality of GHG inventories. As part of these commitments, it is necessary to update the inventory every two years to meet international requirements, which, in turn, requires strengthened technical capacities and specialized personnel to ensure the quality of the reported information.
While there is still no legislation specifically requiring companies to measure their emissions, this practice is promoted as part of more sustainable management, allowing for cost savings and improving corporate image. Furthermore, increasing international pressure has led some countries to require even food products to include information about their carbon footprint. This underscores the importance of all business sectors in Chile in calculating and reducing their future emissions [50]. Within this framework, the transition to electromobility is presented as a key action to reduce companies’ direct emissions, especially in sectors such as transportation, which have historically accounted for a large share of greenhouse gas emissions.
Internationally, methodologies such as the GHG Protocol and ISO 14064 are used to quantify emissions—both direct and indirect—and are essential for compiling an inventory. These standards underscore the importance of data quality, highlighting the need to establish efficient procedures for data collection and analysis and to ensure that the same data is generated and collected consistently over time (ISO, 2018). Data quality is crucial for accurately quantifying emissions, so that it represents an organization’s operations and allows for the generation of real impact indicators. In Chile, measuring and reporting carbon footprints is voluntary and is completed through the Huella Chile program [51]. It is necessary to strengthen public policies to make measurement mandatory, as this would enable a better understanding of the environmental impacts of different business activities and contribute more effectively to combating climate change. Furthermore, meeting these requirements is essential for complying with future environmental regulations, demonstrating social responsibility, and attracting conscious consumers. By quantifying their carbon footprint, organizations not only optimize resources and operate more efficiently but also make informed decisions that steer them toward a more sustainable future aligned with global demands for environmental responsibility.
8. Discussion
Electromobility in public transport is presented as a key solution for reducing greenhouse gas emissions in the cities of Chillán and Chillán Viejo. However, to make informed decisions, it is essential to have indicators that monitor environmental impact and enable the evaluation of progress toward sustainability goals. In this context, quantifying transport emissions from internal combustion engines enables monitoring progress toward electromobility objectives and ensures that actions taken are practical.
While the transition to an electric vehicle fleet offers clear benefits, it also presents significant challenges. Large investments are required, given the cost disparity between electric and internal combustion engine vehicles. A robust charging infrastructure and a reconfiguration of the energy mix are essential to ensure that electricity comes from renewable sources, thus preventing an indirect increase in pollution. Furthermore, the success of this transition depends on political and regulatory commitment, as well as the training of human capital to manage these new technologies. In this regard, the adoption of electromobility must be accompanied by comprehensive planning that addresses existing technological and logistical gaps.
Regarding the technologies developed, battery-electric vehicles (BEVs) and hydrogen-fuel-cell electric vehicles (FCEVs) offer different approaches to decarbonizing transport, each with its own advantages and challenges. BEVs are more energy efficient, have lower operating costs, and benefit from an expanding charging infrastructure, making them ideal for urban travel. However, their limited range and longer charging times can be drawbacks. In contrast, FCEVs offer faster charging times and greater range, making them suitable for heavy and long-distance transport. However, their energy efficiency is lower due to losses during hydrogen production, storage, and conversion, and the distribution infrastructure for this fuel remains limited and expensive. In both technologies, green hydrogen can play a dual role: as a renewable electricity source for BEVs and as a direct fuel for FCEVs. This synergy can be key to creating a diverse transportation system as technologies are adapted to local contexts. Therefore, battery electric vehicles (BEVs) are currently more viable for urban public transport, given technological developments and the availability of renewable energy sources such as solar and wind power, which have a significant presence in Chile’s national electricity grid.
In addition to reducing greenhouse gas emissions, electromobility helps minimize noise pollution and respiratory illnesses, common problems in many urban areas. Electric vehicles, being quieter and emission-free, can transform urban environments, creating more pleasant spaces for residents and users alike. However, this transition must address public perception, as fear of change could be an obstacle. Moving towards electric mobility remains essential for a more sustainable future. Avoiding hybrid vehicles as a transitional alternative accelerates the process, as their presence can lead operators to seek the quickest way to put them into service, which would entail the risk of not properly valuing the rechargeable battery.
One of the main obstacles to the widespread adoption of electromobility is that the current electrical grid is not prepared to meet the energy demand from a fleet of electric vehicles, especially in regions such as Ñuble, where installed capacity is insufficient.
The electrical grid’s lack of preparedness jeopardizes supply reliability and requires investment in distribution, storage, and intelligent load management. Furthermore, the high cost of electric buses hinders their integration outside of Santiago’s RED network, where initial efforts have been concentrated.
Santiago of Chile is a leader in urban electromobility, operating the largest electric bus fleet outside of China, with 3909 units currently [52]. By March 2026, it is projected that 68% of the fleet in Santiago will be electric [53], with approximately 4400 units, further solidifying its global leadership. This achievement, attained in less than a decade, is based on long-term institutional planning that combines robust legal frameworks, innovative financing, and a strategic public–private vision. The rapid adoption of electric buses has been supported by significant investment in charging infrastructure, with 48 operational charging stations (with a combined capacity exceeding 131 MW), projected to reach 54 by March 2026 [53].
However, at the national level, the total number of electric buses is 4310 [52], clearly indicating a concentration of the electromobility implementation policy to replace internal combustion buses with battery-electric buses, with only 9.3% of electric buses located in the regions. The Atacama and Antofagasta regions stand out with 121 and 108 electric buses, respectively, located in northern Chile.
Another significant challenge is the shortage of skilled personnel in electromobility, electric vehicle maintenance, and operation. At both national and international levels, various educational institutions offer specialized programs or degrees to train human capital in zero-emission technologies, which is crucial for closing the gaps in operational and maintenance capabilities.
Overcoming these barriers will require a comprehensive strategy that combines infrastructure investments, ambitious public policies, training, and awareness campaigns to bring electromobility to all regions of the country. In the metropolitan areas of the cities included in this study, barriers are intensified by the centralization of resources and planning around Santiago. In towns such as Chillán and Chillán Viejo, the lack of pilot projects could exacerbate the delay, especially if regional working groups are not established to address local needs and promote decentralized public investment.
The adoption of electric public transport in the Ñuble region is progressing slowly, as the regional government has only recently begun seeking funding to convert at least one of the 10 bus lines operating between Chillán and Chillán Viejo through the “Renew Your Vehicle” program. Furthermore, there has been a noticeable lack of interest among public transport operators in applying for subsidy programs, which are also available in Ñuble and nationwide. This lack of interest is partly due to the regulations for the Public Transport and Regional Connectivity Support Fund not including resources for the construction of electric bus terminals, which may be creating uncertainty among operators when it comes to renewing their fleets.
The lack of resources and developing infrastructure is limiting the speed of this transition. It is worth noting that the proposed electric buses for the Chillán area are valued at approximately USD 194,000 each. If we analyze this investment for the 291 buses in operation in 2023, it amounts to over USD 57 million—a highly relevant economic factor, as the country must also focus its resources. However, this investment does not include electro-terminals. Therefore, based on the progress published to date, it can be observed that the prioritization of promoting electromobility is evolving, creating uncertainty about whether the established national fleet replacement goals will be met. However, urban micromobility, such as electric bicycles and scooters, is gaining popularity as an economical and sustainable alternative that helps to decongest traffic and improve the urban environment. Other measures to reduce the gaps include creating policies tailored to the territory’s characteristics. One example of this is Supreme Decree 44 [49], which mandates the scrapping of vehicles taken out of service. However, its implementation has shortcomings, including insufficient coverage, costly bureaucratic processes, limited recycling infrastructure, regional disparities in its application, and the exclusion of certain polluting vehicles.
Chile has set clear goals to move towards carbon neutrality, including the complete electrification of urban public transport by 2035 and buses and taxis by 2040. However, achieving these goals presents challenges, including increasing installed electricity generation and storage capacity, developing adequate charging infrastructure, and investing in modern fleets. Despite these obstacles, regulatory commitments and the growing adoption of renewable energy still position Chile on a favorable path to meet its ambitious objectives. With continued efforts in technological innovation, financing, and urban planning, the transition to a sustainable transport system is not only possible but also essential to reducing sectoral emissions and improving the quality of life for the population.
9. Conclusions
This study evaluated the reduction in CO2 equivalent emissions resulting from the transition of conventional public transport to electric vehicles in the cities of Chillán and Chillán Viejo. Quantitative analysis revealed that replacing the current diesel bus fleet with electric buses could reduce total emissions by approximately 63.4%. This would translate to a reduction of 9429 tons of CO2 equivalent. The total cost of replacing the internal combustion engine bus fleet in the aforementioned cities with battery-electric buses is estimated at approximately USD 57 million. This figure was obtained by developing an estimation model to calculate CO2 equivalent emissions from conventional public transport in 2023, based on the ISO 14064 methodology. Furthermore, the emissions were projected under a transition scenario to electric vehicles. However, this quantification of CO2eq reduction has some limitations, such as: (i) it does not consider speed or the gradient of the route, only quantifying energy or fuel consumption per distance traveled, (ii) it assumes a single bus model for both the electric and internal combustion buses, a homogeneous fleet, (iii) it assumes 100% fleet replacement, and (iv) it assumes that 100% of the fleet is operational and performs all scheduled routes. Therefore, the results obtained can be improved, but they serve as a first step towards quantifying CO2eq reduction from switching to zero-emission bus technology.
This reflects the potential reduction in greenhouse gas emissions under an optimal scenario of 100% electrification of the public transport bus fleets in the cities considered in this study. In summary, the results confirm that shifting public transportation fleets to electric vehicles not only significantly mitigates climate change but also provides tangible environmental, social, and economic benefits. These findings are a fundamental contribution to the formulation of public policies that promote sustainability and improve the quality of life in the cities studied.
In general, for electromobility to benefit everyone and be sustainable over time, Chile needs to update its Energy Efficiency Law to set higher vehicle efficiency requirements; expand and unlock nationwide charging infrastructure; and create incentives for private users, including tax benefits and mechanisms such as preferential registration permits for electric vehicles. Currently, the only benefit is a reduction in registration fees for a few years. Regarding the electrification of public passenger transport, the regional governments’ “Renew Your Bus” program provides subsidies for bus replacement. Nevertheless, there is a problem: no subsidy or financing is provided for the public transport charging center, so a modification to Decree 44 is required.
Author Contributions
Conceptualization, Y.F.M. and E.E.; methodology, Y.F.M.; software, R.L.F. and R.L.; validation, S.E.R., J.C.H. and E.C.; formal analysis, Y.F.M., E.E. and R.L.F.; investigation, E.E.; resources, G.R.; data curation, Y.F.M. and E.E.; writing—original draft preparation, E.E. and G.R.; writing—review and editing, M.A. and S.E.R.; visualization, R.L.F. and R.L.; supervision, J.C.H.; project administration, G.R.; funding acquisition, E.E. All authors have read and agreed to the published version of the manuscript.
Funding
This research was funded by GORE Ñuble under grant number FIC-R 40050692-0, “Plan de acción para adopción de la electromovilidad en Ñuble”.
Institutional Review Board Statement
Not applicable.
Informed Consent Statement
Not applicable.
Data Availability Statement
All data are available in the manuscript.
Acknowledgments
The work was supported by “Centro de Energía UCSC”, and the authors acknowledge the support provided by the Thematic Network 723RT0150 “Red para la integración a gran escala de energías renovables en sistemas electricos (RIBIERSE-CYTED)” financed by the call for Thematic Networks of the CYTED (Ibero-American Program of Science and Technology for Development) for 2022.
Conflicts of Interest
The authors declare no conflicts of interest.
Appendix A
Results of the conversion of units of measurement to apply the emissions factors associated with the liters of fuel consumed by the urban public buses of the cities of Chillán and Chillán Viejo, in addition to the factors used.
Table A1.
Results when applying the conversion factors.
Table A2.
Conversion factors.
Appendix B
Bus schedules for Monday to Friday, Saturday, and Sunday in the cities of Chillán and Chillán Viejo.
Table A3.
Monday through Friday Schedule 2023 for Buses in Chillan and Chillan Viejo.
Table A4.
Saturday Schedule 2023: Bus Services for Chillan and Chillan Viejo Cities.
Table A5.
Sunday and holiday schedule 2023: Bus Services for Chillan and Chillan Viejo Cities.
References
- Intergovernmental Panel on Climate Change, Climate Change 2023. Synthesis Report. Available online: https://www.ipcc.ch/report/ar6/syr/downloads/report/IPCC_AR6_SYR_FullVolume.pdf (accessed on 26 October 2025).
- United Nations (UN). Global Challenges: Climate Change. Available online: https://www.un.org/es/global-issues/climate-change (accessed on 26 October 2025).
- Intergovernmental Panel on Climate Change (IPCC). Calentamiento global de 1.5 °C: Informe Especial del IPCC Sobre los Impactos del Calentamiento Global de 1.5 °C con Respecto a los Niveles Preindustriales y las Trayectorias Correspondientes que Deberían Seguir las Emisiones Mundiales de Gases de Efecto Invernadero, en el Contexto del Reforzamiento de la Respuesta Mundial a la Amenaza del Cambio Climático, el Desarrollo Sostenible y los Esfuerzos por Erradicar la Pobreza. 2019. Available online: https://www.ipcc.ch/site/assets/uploads/sites/2/2019/09/IPCC-Special-Report-1.5-SPM_es.pdf (accessed on 26 October 2025).
- Ministry of the Environment. Chile’s National Inventory Report 2022: National Inventory of Greenhouse Gases and Other Climate Pollutants 1990–2020; Climate Change Division: Santiago, Chile, 2023.
- Ministry of the Environment, Energy Sector. National Greenhouse Gas Inventory System of Chile. Available online: https://snichile.mma.gob.cl/sector-energia/ (accessed on 26 October 2025).
- World Health Organization. Ambient Outdoor Air Quality and Health. 2024. Available online: https://www.who.int/es/news-room/fact-sheets/detail/ambient-(outdoor)-air-quality-and-health (accessed on 15 October 2025).
- Ministry of Energy. National Electromobility Strategy. 2021. Available online: https://energia.gob.cl/sites/default/files/estrategia-nacional-electromovilidad_ministerio-de-energia.pdf (accessed on 1 October 2025).
- Ministry of Energy. Energy Efficiency Law. 2021. Available online: https://www.bcn.cl/leychile/navegar?idNorma=1155887 (accessed on 17 October 2025).
- Gutiérrez Campos, Y. Strategies and Progress in Promoting Electromobility: National and International Experience. Parliamentary Technical Advisory Service, Library of the National Congress of Chile. 2021. Available online: https://obtienearchivo.bcn.cl/obtienearchivo?id=repositorio/10221/32602/1/Estrategias_y_avances_en_la_promocion_de_la_electromovilidad_VF.pdf (accessed on 26 October 2025).
- Censo 2024; National Institute of statistics: Santiago, Chile, 2024.
- Ministry of Transport and Telecommunications, Regional Public Transport Division. Final Report of the Study Measuring Passenger Demand in Urban and Rural Public Transport Services in the Ñuble Region; CIS Associates Transport Consultants S.A.: Santiago, Chile, 2025.
- ISO 14064-1:2018; Gases de Efecto Invernadero—Parte 1: Especificación con Orientación, a Nivel de las Organizaciones, para la Cuantificación y el Informe de las Emisiones y Remociones de Gases de Efecto Invernadero. Organización Internacional de Normalización: Ginebra, Suiza, 2018.
- IPCC. IPCC Fact Sheet: What Is the IPCC? World Meteorological Organization. 2013. Available online: https://www.ipcc.ch/site/assets/uploads/2018/04/FS_what_ipcc_es.pdf (accessed on 29 October 2025).
- Daza, G. Journalism UDEC, The History of Public Transport in Greater Concepción. 2023. Available online: https://tiemporeal.periodismoudec.cl/2023/03/24/la-historia-del-transporte-publico-del-gran-concepcion/ (accessed on 29 October 2025).
- Ministry of the Environment, National System of Greenhouse Gas Inventories. Available online: https://snichile.mma.gob.cl/ (accessed on 29 October 2025).
- Grijalva, E.R.; López Martínez, J.M. Analysis of the Reduction of CO2 Emissions in Urban Environments by Replacing Conventional City Buses by Electric Bus Fleets: Spain Case Study. Energies 2019, 12, 525. [Google Scholar] [CrossRef] [Scilit]
- Todoruț, A.; Cordoș, N.; Iclodean, C. Replacing diesel buses with electric buses for sustainable public transportation and reduction of CO2 emissions. Pol. J. Environ. Stud. 2020, 29, 3339–3351. [Google Scholar] [CrossRef] [Scilit] [PubMed]
- Ministerio de Transportes y Telecomunicaciones. Decreto 55: Establece Normas de Emisión Aplicables a Vehículos Motorizados PESADOs que Indica; Biblioteca del Congreso Nacional de Chile: Santiago, Chile, 1994. Available online: https://www.bcn.cl/leychile/navegar?idNorma=8364 (accessed on 29 October 2025).
- MMA. Entró en Vigencia Nueva Norma de Emisiones para Camiones y Buses Nuevos que Ingresen al País. 2024. Available online: https://mma.gob.cl/entra-en-vigencia-nueva-norma-de-emisiones-para-camiones-y-buses-nuevos-que-ingresen-al-pais/ (accessed on 29 October 2025).
- Ministerio de Energía y Ministerio de Transportes y Telecomunicaciones. Hoja de ruta para el Avance de la Electromovilidad en Chile: Acciones Concretas para 2026 para Masificar el uso de esta Tecnología; Ministerio de Energía y Ministerio de Transportes y Telecomunicaciones: Santiago, Chile, 2023; 37p.
- European Commission. CO2 Emission Standards for Heavy-Duty Vehicles. Available online: https://climate.ec.europa.eu/eu-action/transport/road-transport-reducing-co2-emissions-vehicles/reducing-co2-emissions-heavy-duty-vehicles_en (accessed on 29 October 2025).
- Xylia, M.; Leduc, S.; Laurent, A.-B.; Patrizio, P.; van der Meer, Y.; Kraxner, F.; Silveira, S. Impact of bus electrification on carbon emissions: The case of Stockholm. J. Clean. Prod. 2018, 209, 74–87. [Google Scholar] [CrossRef] [Scilit]
- García Bernal, N. Electromovilidad: Tendencias y Experiencia Nacional e Internacional. Asesoría Técnica Parlamentaria, Comisión de Transporte y Telecomunicaciones del Senado de Chile. 2019. Available online: https://www.bcn.cl/asesoriasparlamentarias/detalle_documento.html?id=74702 (accessed on 29 October 2025).
- Monroy, M. Conoce el Ranking que Tiene a Chile Liderando la Electromovilidad en Latinoamérica, Diario La Tercera. 2023. Available online: https://www.latercera.com/mtonline/noticia/conoce-el-ranking-que-tiene-a-chile-liderando-la-electromovilidad-en-latinoamerica/7GVXYE6M2FAFNM3GHFNC6TC73Y/ (accessed on 29 October 2025).
- Ribeiro, P.J.G.; Dias, G.; Mendes, J.F.G. Public Transport Decarbonization: An Exploratory Approach to Bus Electrification. World Electr. Veh. J. 2024, 15, 81. [Google Scholar] [CrossRef] [Scilit]
- López-Acevedo, F.J.; Herrero, M.J.; Escavy Fernández, J.I.; González Bravo, J. Potential Reduction in Carbon Emissions in the Transport of Aggregates by Switching from Road-Only Transport to an Intermodal Rail/Road System. Sustainability 2024, 16, 9871. [Google Scholar] [CrossRef] [Scilit]
- Ribeiro, P.J.G.; Dias, G.; Mendes, J.F.G. Decarbonizing Urban Mobility: A Methodology for Shifting Modal Shares to Achieve CO2 Reduction Targets. Sustainability 2024, 16, 7049. [Google Scholar] [CrossRef] [Scilit]
- Abbood, K.; Meszaros, F. Carbon Footprint Analysis of the Freight Transport Sector Using a Multi-Region Input–Output Model (MRIO) from 2000 to 2014: Evidence from Industrial Countries. Sustainability 2023, 15, 7787. [Google Scholar] [CrossRef] [Scilit]
- MMA. Establece Plan de Prevención y Descontaminación Atmosférica para las Comunas de Chillán y Chillán Viejo (Decreto 48). Biblioteca del Congreso Nacional de Chile. 2016. Available online: https://www.leychile.cl/N?i=1088773&f=2016-03-28&p= (accessed on 29 October 2025).
- Chile Agenda 2030. Objetivos de Desarrollo Sostenible: Meta 13.1 a 13.b. Available online: https://www.chileagenda2030.gob.cl/indicadores/objetivos-metas-e-indicadores/?objetivo=accion-por-el-clima (accessed on 30 October 2025).
- Chile Agenda 2030. Objetivo de Desarrollo Sostenible 11: Ciudades y Comunidades Sostenibles. Available online: https://www.chileagenda2030.gob.cl/indicadores/objetivos-metas-e-indicadores/?objetivo=ciudades-y-comunidades-sostenibles (accessed on 30 October 2025).
- MMA. Ley Marco de Cambio Climático, Ley N° 21.455. 2022. Available online: https://www.bcn.cl/leychile/Navegar?idNorma=1177286&idVersion=2022-06-13 (accessed on 30 October 2025).
- Ministerio de Medio Ambiente. Actualización 2020: Contribución Determinada a Nivel Nacional (NDC) de Chile. Santiago. 2020. Available online: https://cambioclimatico.mma.gob.cl/contribucion-determinada-ndc/descripcion-del-instrumento/ (accessed on 30 October 2025).
- Ministerio de Medio Ambiente, Planes de Prevención y Descontaminación Atmosférica (PPDA). Available online: https://ppda.mma.gob.cl/ (accessed on 30 October 2025).
- Ministerio de Medio Ambiente. Estrategia Climática de Largo Plazo de Chile: Camino a la Carbono Neutralidad y Resiliencia a Más Tardar al 2050. 2021. Available online: https://cambioclimatico.mma.gob.cl/wp-content/uploads/2021/11/ECLP-LIVIANO.pdf (accessed on 30 October 2025).
- Subsecretaría de Transporte, Solicitud de Información Buses de Transporte Publico en las Ciudades de Chillan y Chillan Viejo. Available online: https://drive.google.com/drive/folders/1TlG8E2-uUBJLQEg0HA6gHNtamAj5iX9g (accessed on 26 January 2026).
- Comisión Nacional de Energía, Factor de Emisión Sistemas Eléctrico Nacional. Available online: http://energiaabierta.cl/visualizaciones/factor-de-emision-sic-sing/ (accessed on 30 October 2025).
- IPCC. Capítulo 3: Combustión móvil. In Directrices del IPCC de 2006 para los Inventarios Nacionales de Gases de Efecto Invernadero; IPCC: Geneva, Switzerland, 2006; Volume 2: Energía. [Google Scholar]
- Lizana, R. Hidrógeno Verde y Electromovilidad: Una Oportunidad para la Industria de Ñuble; Universidad Católica de la Santísima Concepción: Concepción, Chile, 2025; Available online: https://ucsc.cl/medios-ucsc/blogs-academicos/hidrogeno-verde-y-electromovilidad-una-oportunidad-para-la-industria-de-nuble/ (accessed on 30 October 2025).
- Moovit, Planificador de viajes en transporte público de Chillán. Available online: https://moovitapp.com/index/es-419/transporte_p%C3%BAblico-Chill%C3%A1n-4069 (accessed on 31 October 2025).
- Análisis Operativo y Económico del Sistema de Transporte Público en Chillán: Distancias Recorridas y Costos por Vuelta. Informe Preparado para el “Plan de Acción para la Adopción de Electromovilidad en Ñuble”, FIC-R 40050692-0, Universidad Católica de la Santísima Concepción. 2024. Available online: https://electromovilidadnuble.ucsc.cl/ (accessed on 1 November 2025).
- Gobierno Regional de Ñuble. Presentan buses eléctricos que llegarán a Ñuble con apoyo de programa especial del Gobierno Regional. 2024. Available online: https://goredenuble.cl/presentan-buses-electricos-que-llegaran-a-nuble-con-apoyo-de-programa-especial-del-gobierno-regional/ (accessed on 1 November 2025).
- Midcontinent Independent System Operator (MISO), Overview Chile Blackout—25 February 2025. Available online: https://cdn.misoenergy.org/20250610%20Markets%20Committee%20of%20the%20BOD%20Item%2004a%20Chile%20and%20Iberian%20Peninsula%20Blackouts%20Memo701553.pdf (accessed on 26 January 2026).
- Coordinador Eléctrico Nacional, CEN Presenta Estudios del 25F y Destaca Incorporación de sus Conclusiones en Medidas para Fortalecer el Sistema. Available online: https://www.coordinador.cl/novedades/cen-presenta-estudios-del-25f-y-destaca-incorporacion-de-sus-conclusiones-en-medidas-para-fortalecer-el-sistema/ (accessed on 26 January 2026).
- Lara, R.; Vaccaro, C. Así Son los Buses Eléctricos que Podrían Llegar a Chillán: Buscan Financiamiento del Gobierno. 2024. Available online: https://radiocontacto.cl/2024/04/16/asi-son-los-buses-electricos-que-podrian-llegar-a-chillan-buscan-financiamiento-del-gobierno/ (accessed on 1 November 2025).
- Superintendencia de Electricidad y Combustibles. Electromovilidad, Infraestructura de Recarga de Vehículos Eléctricos; Superintendencia de Electricidad y Combustibles: Santiago, Chile, 2025. [Google Scholar]
- Chacana, D. Desinterés en la Región de Ñuble a Programas que Buscan Implementar la Electromovilidad. 2025. Available online: https://ladiscusion.cl/desinteres-en-la-region-de-nuble-a-programas-que-buscan-implementar-la-electromovilidad/ (accessed on 2 November 2025).
- Ministerio de Transportes y Telecomunicaciones. Decreto 44 Aprueba Reglamento Programa Especial de Renovación de Buses, Minibuses, Trolebuses y Taxibuses. 2011. Available online: https://www.bcn.cl/leychile/navegar?idNorma=1028498 (accessed on 2 November 2025).
- Ministerio de Energía. Transición Energética de Chile Política Energética Nacional. 2022. Available online: https://energia.gob.cl/sites/default/files/documentos/pen_2050_-_actualizado_marzo_2022_0.pdf (accessed on 2 November 2025).
- Ministerio del Medio Ambiente, Vinculación con Otros Instrumentos. Available online: https://cambioclimatico.mma.gob.cl/contribucion-determinada-ndc/vinculacion-con-otros-instrumentos/ (accessed on 2 November 2025).
- Ministerio del Medio Ambiente, Huella Chile Programa de Gestión del Carbono. Available online: https://huellachile.mma.gob.cl/objetivo/ (accessed on 2 November 2025).
- Centro de Movilidad Sostenible, Dashboard: Electromovilidad en Movimiento, CMS, 2025. Available online: https://lookerstudio.google.com/embed/reporting/26f31e22-642a-4a4d-ab46-63c18ef48d2e/page/p_1wm5tfklrd (accessed on 26 January 2026).
- Directorio de Transporte Público Metropolitano. First Report on Electromobility, Santiago de Chile, 2024. Our Commitment to Carbon Neutrality. 2024. Available online: https://dtpm.cl/electromovilidad/archivos/INGLES%20WEB_INFORME%20DE%20ELECTROMOVILIDAD%20(1).pdf (accessed on 26 January 2026).
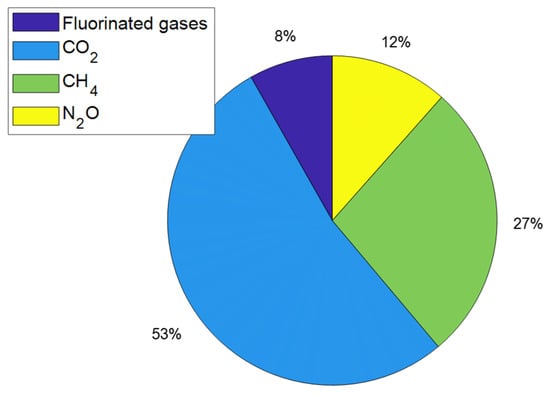
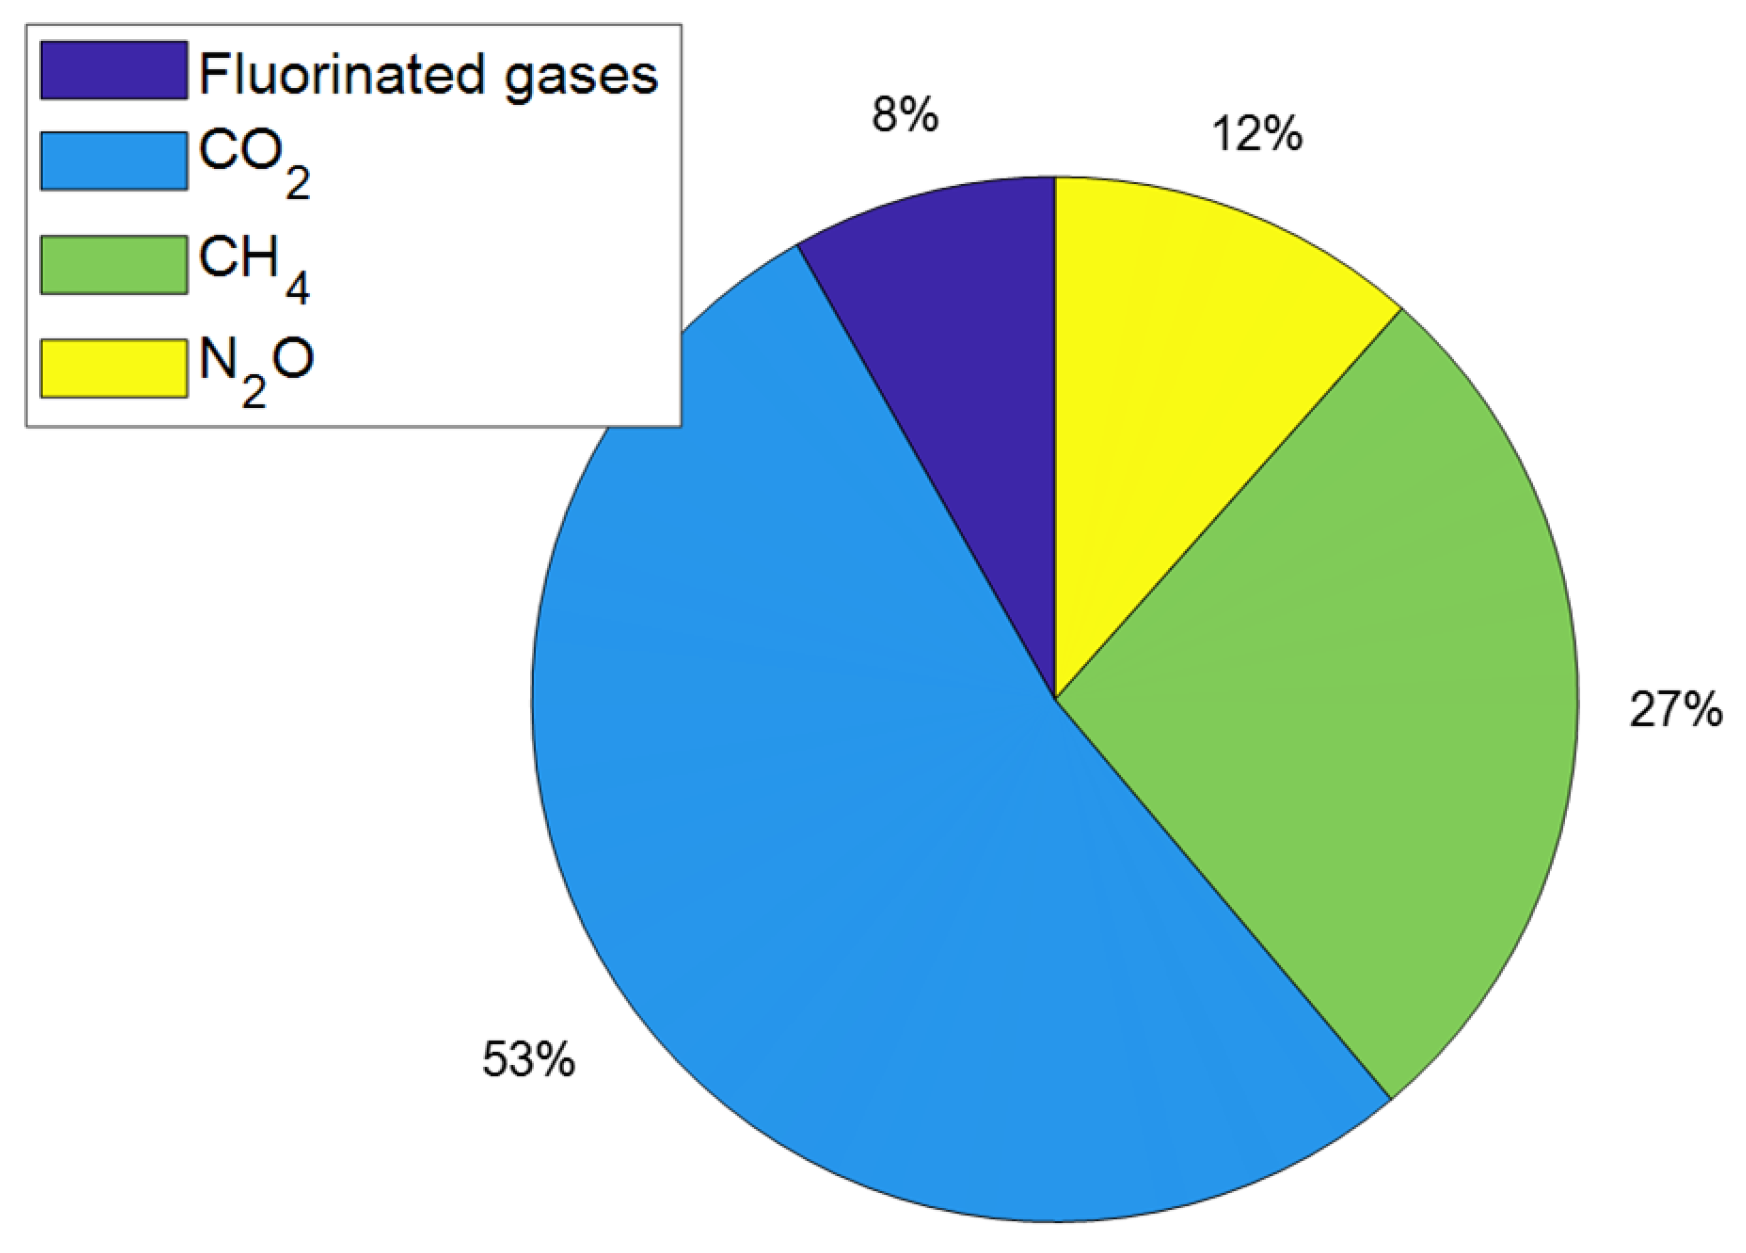
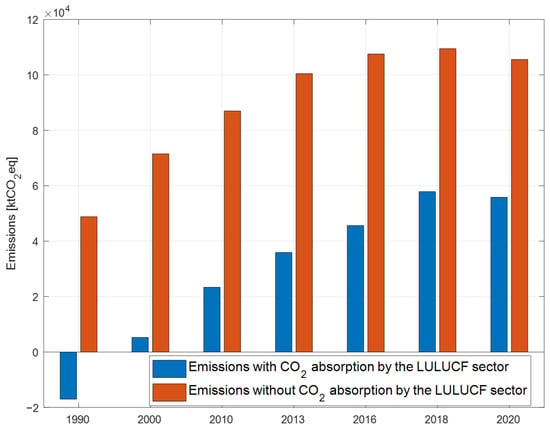
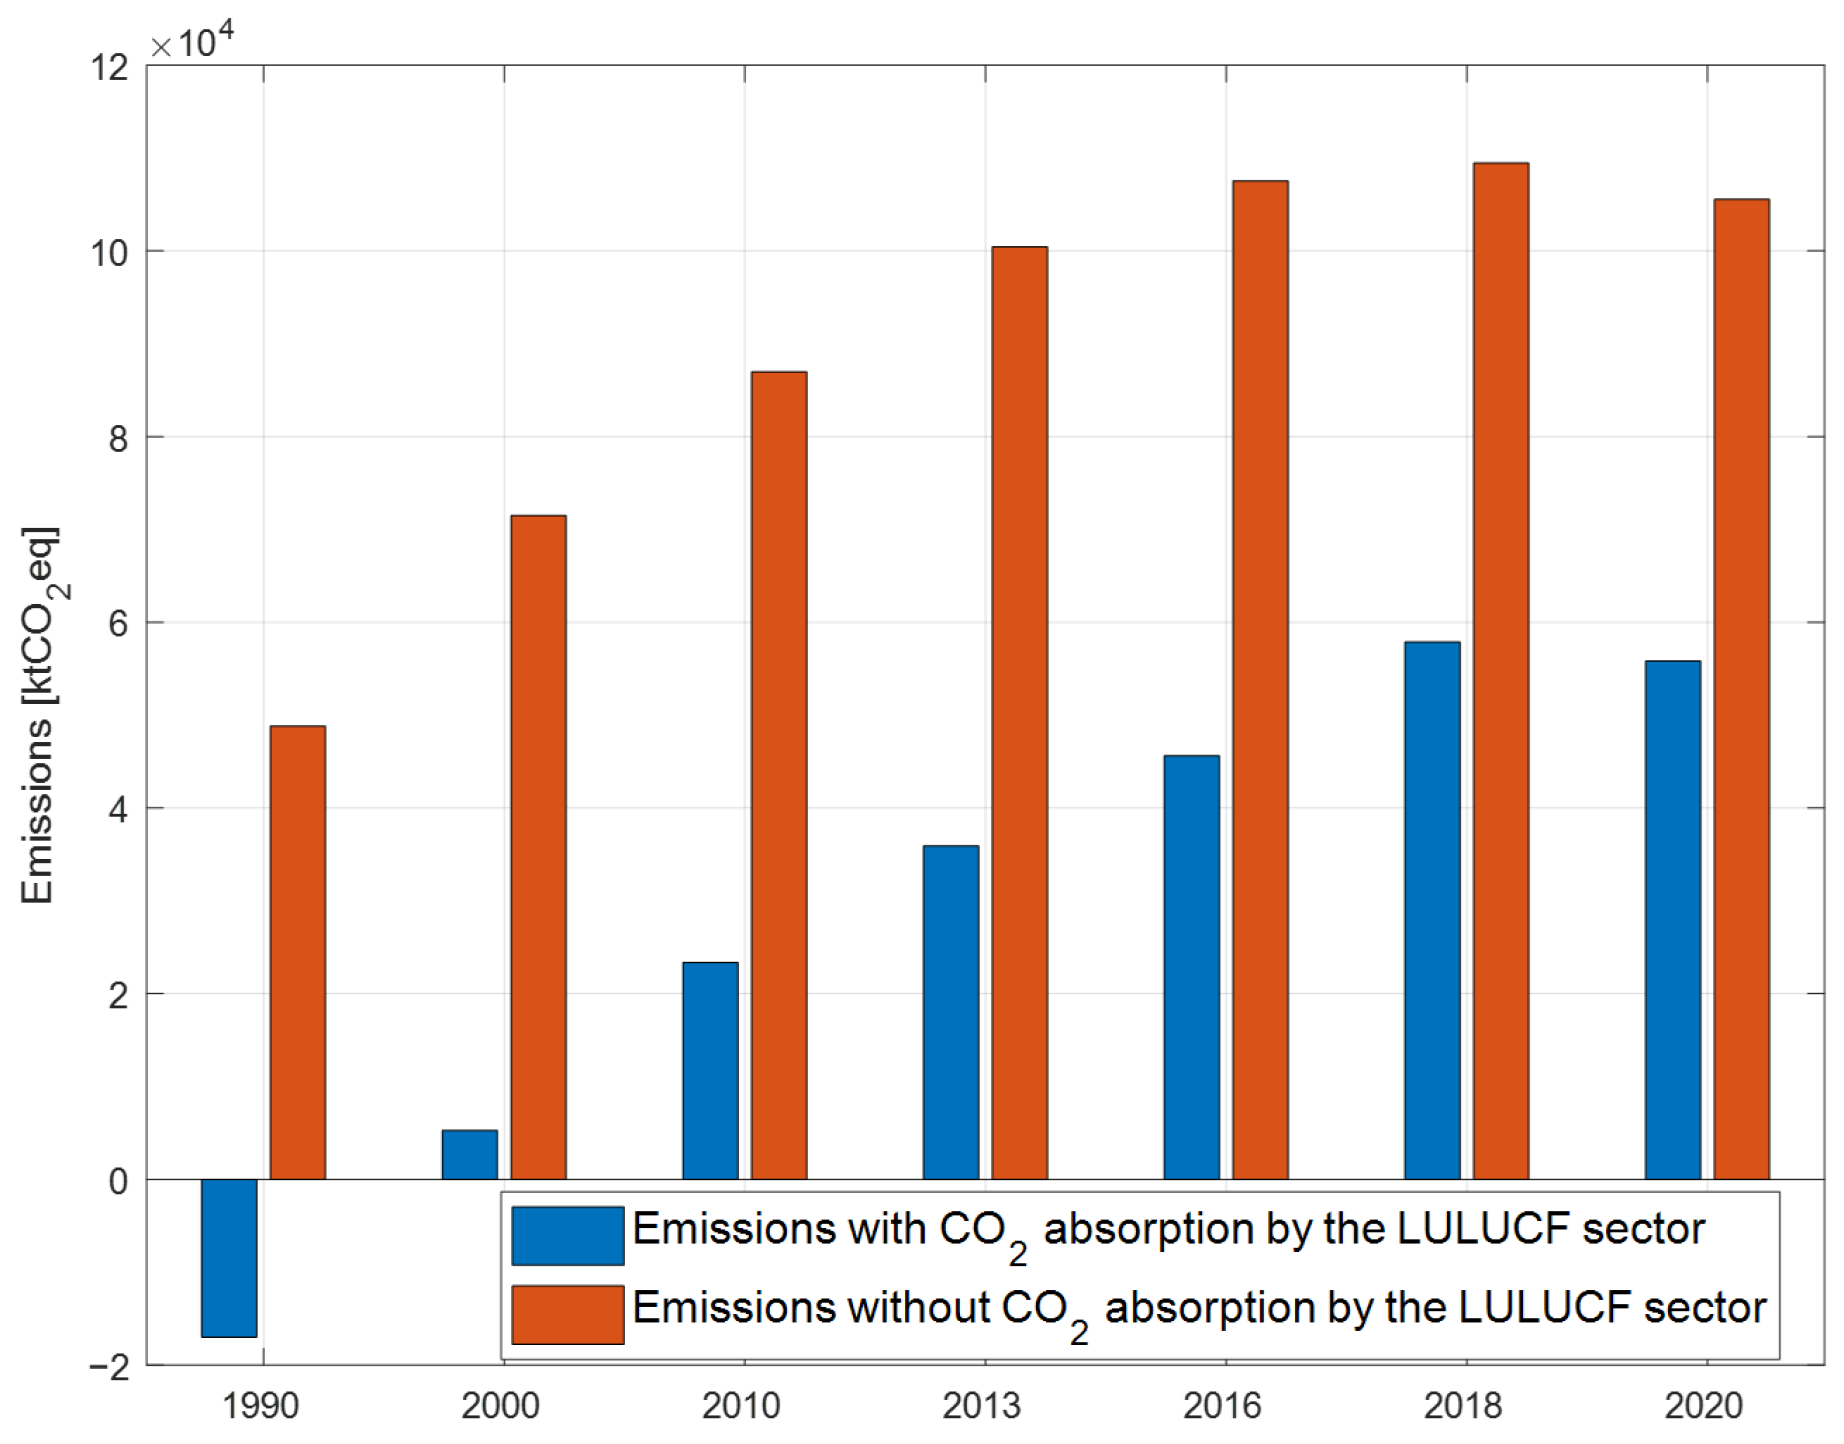
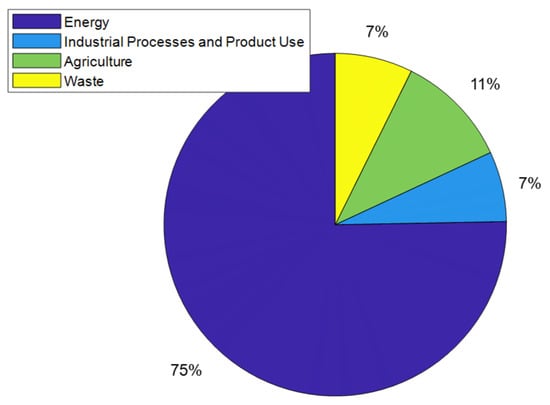
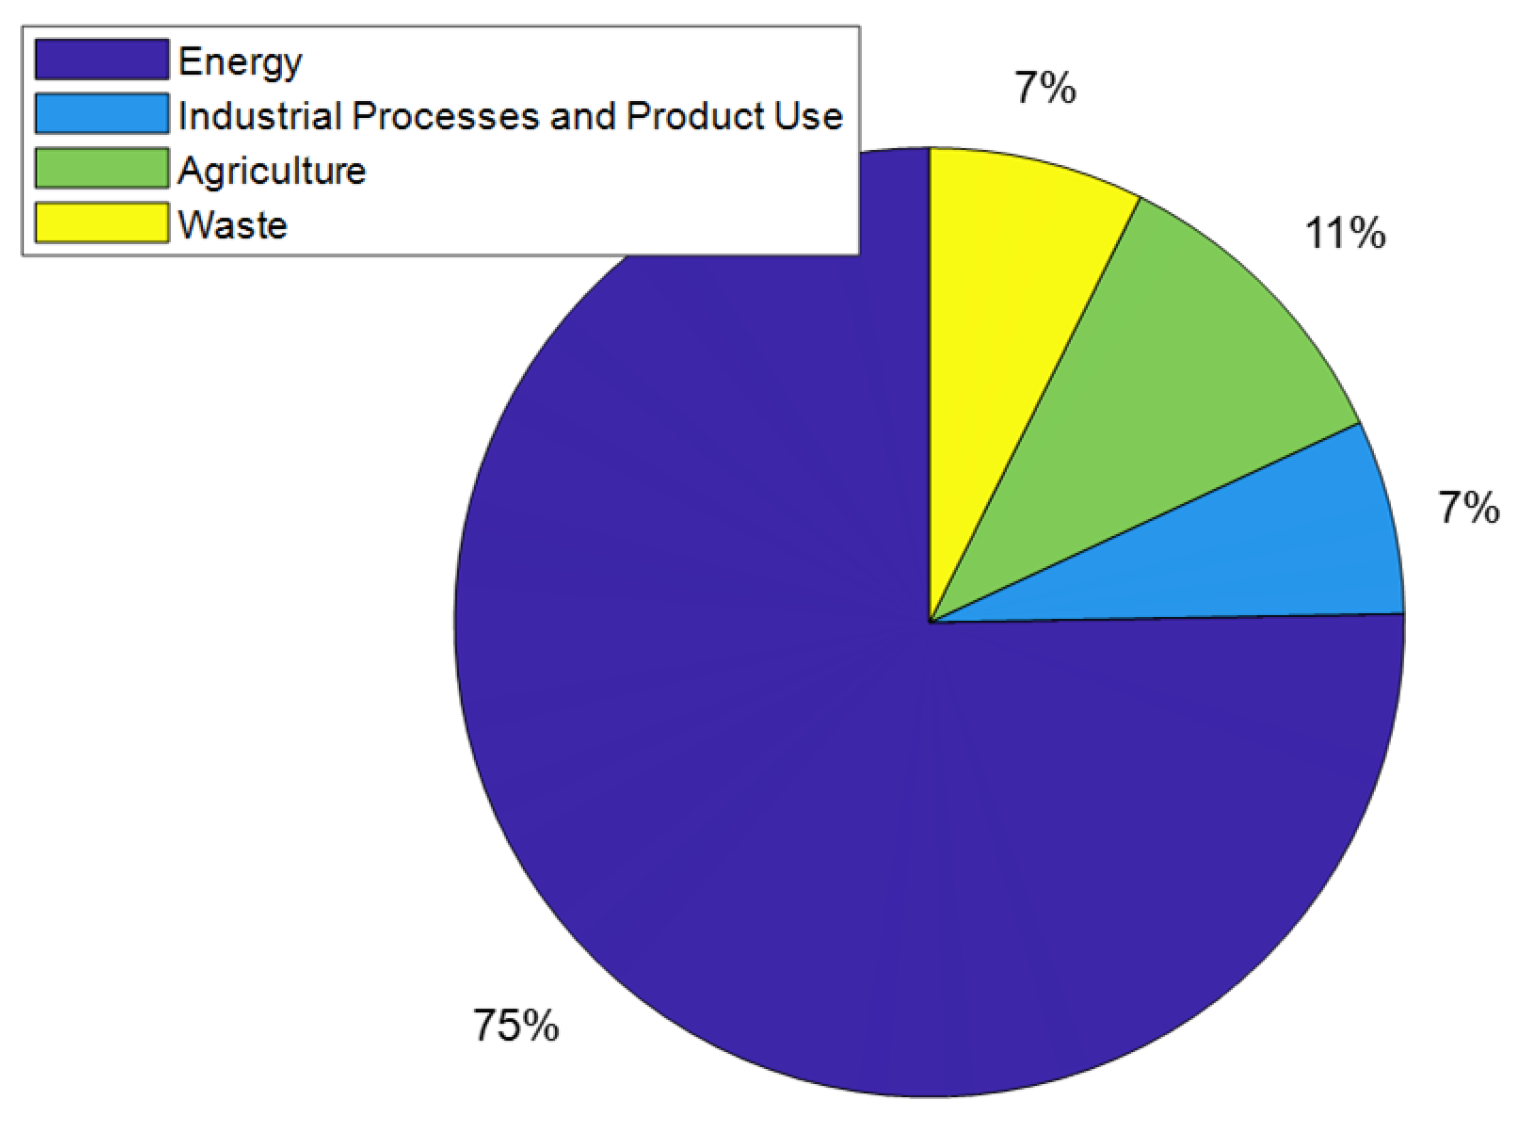
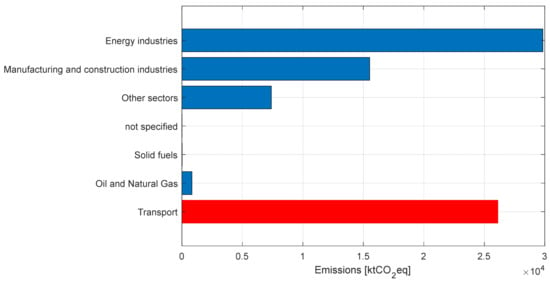
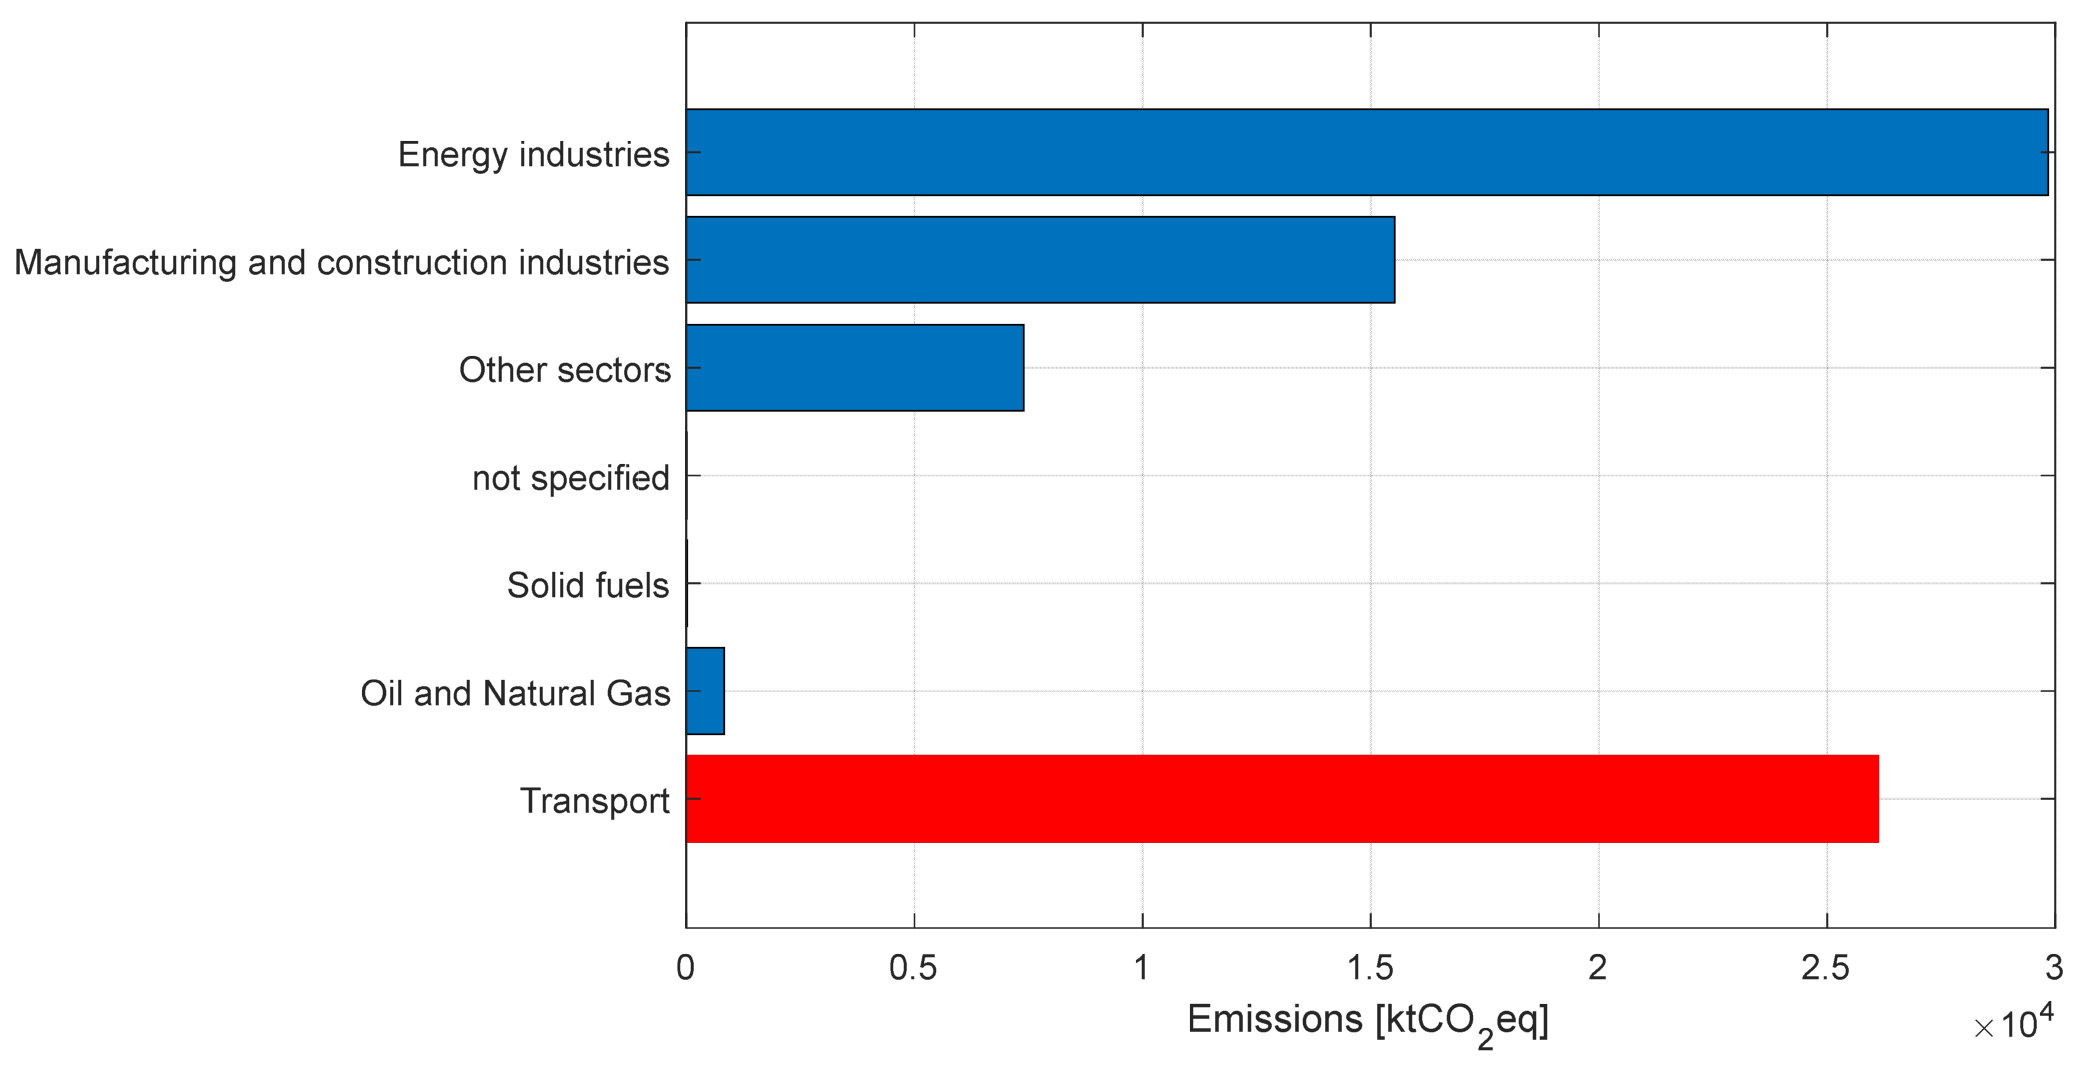
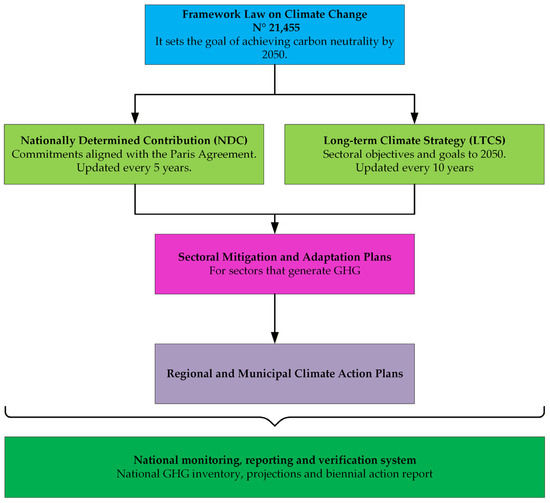
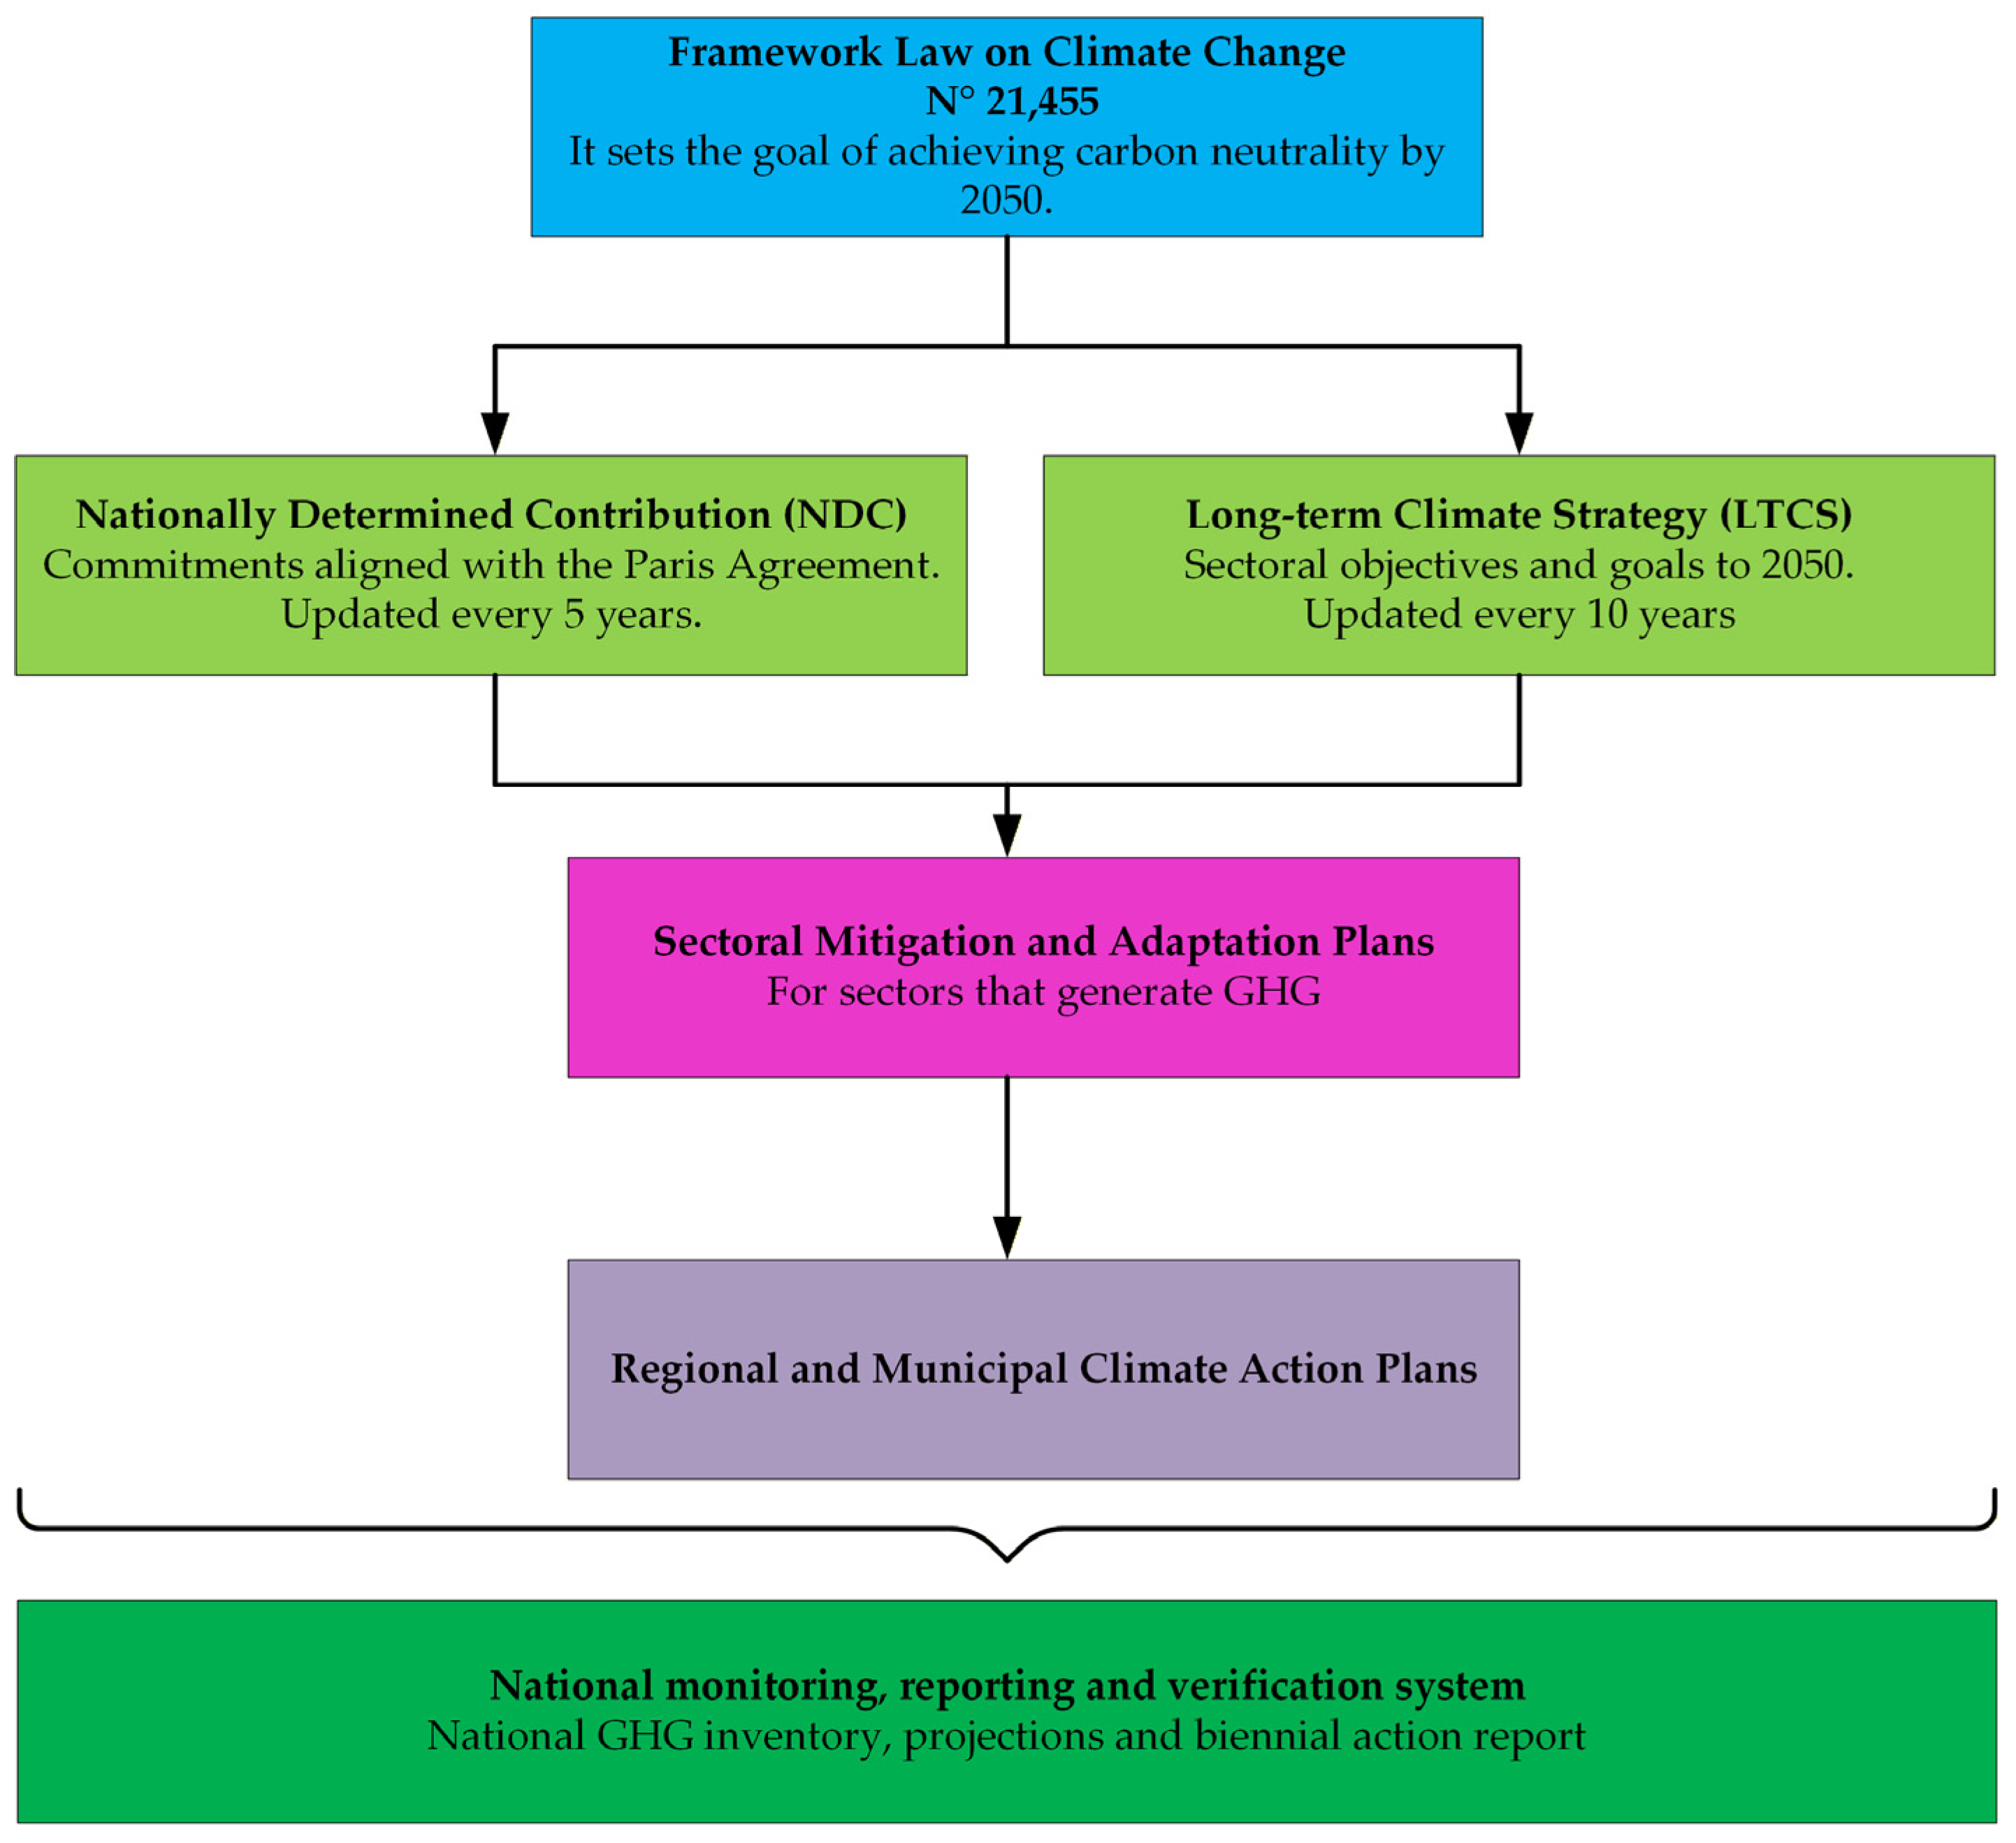
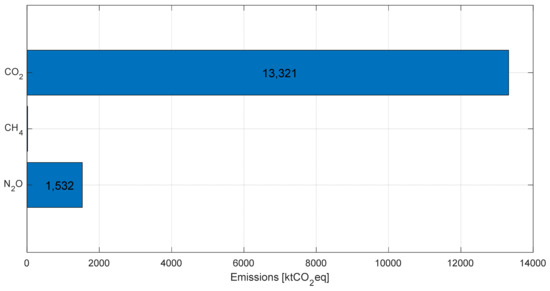
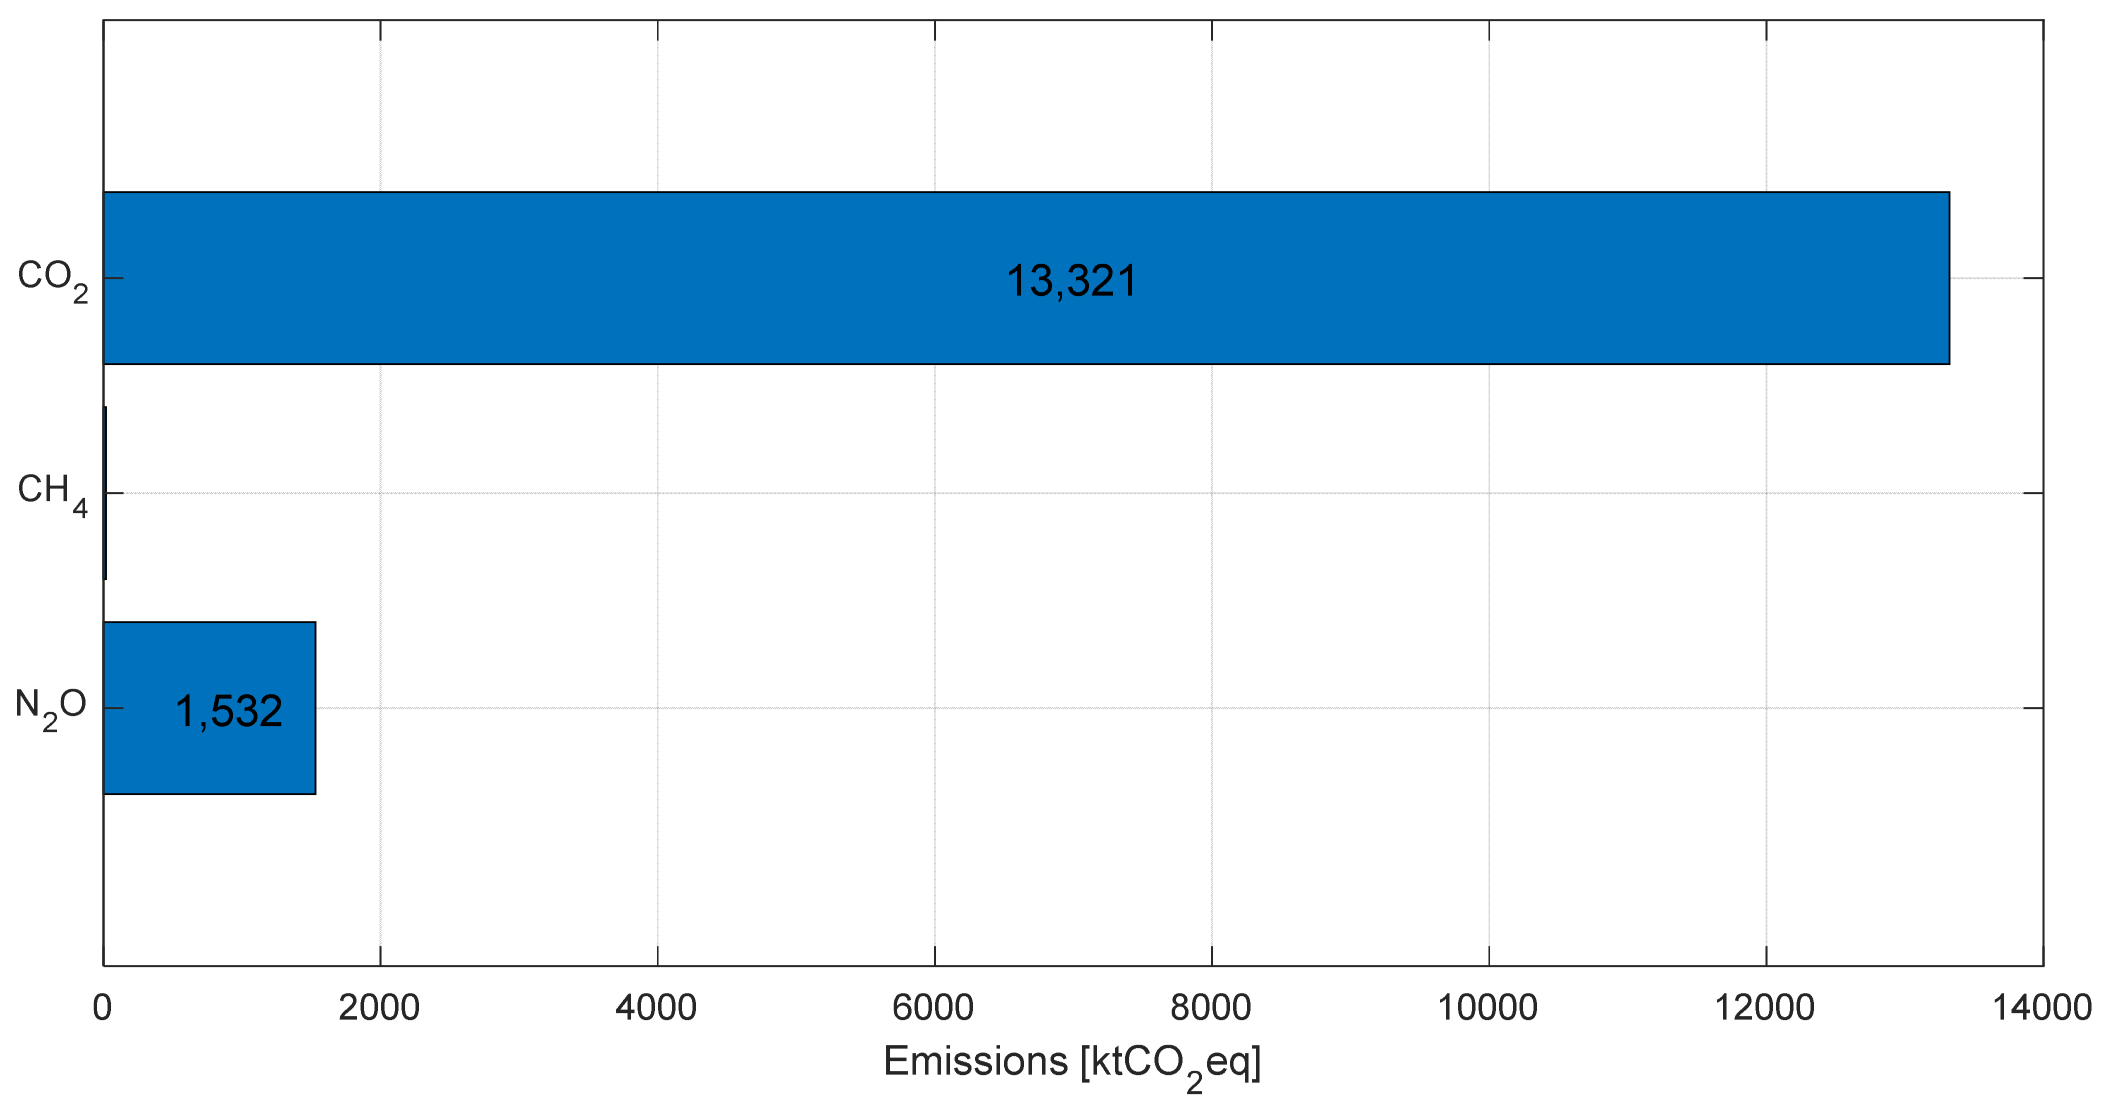
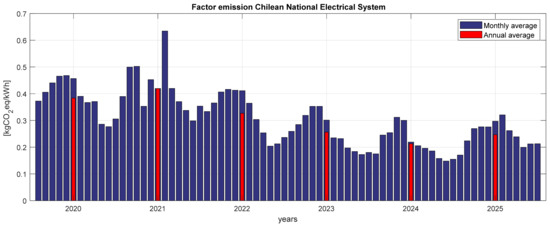
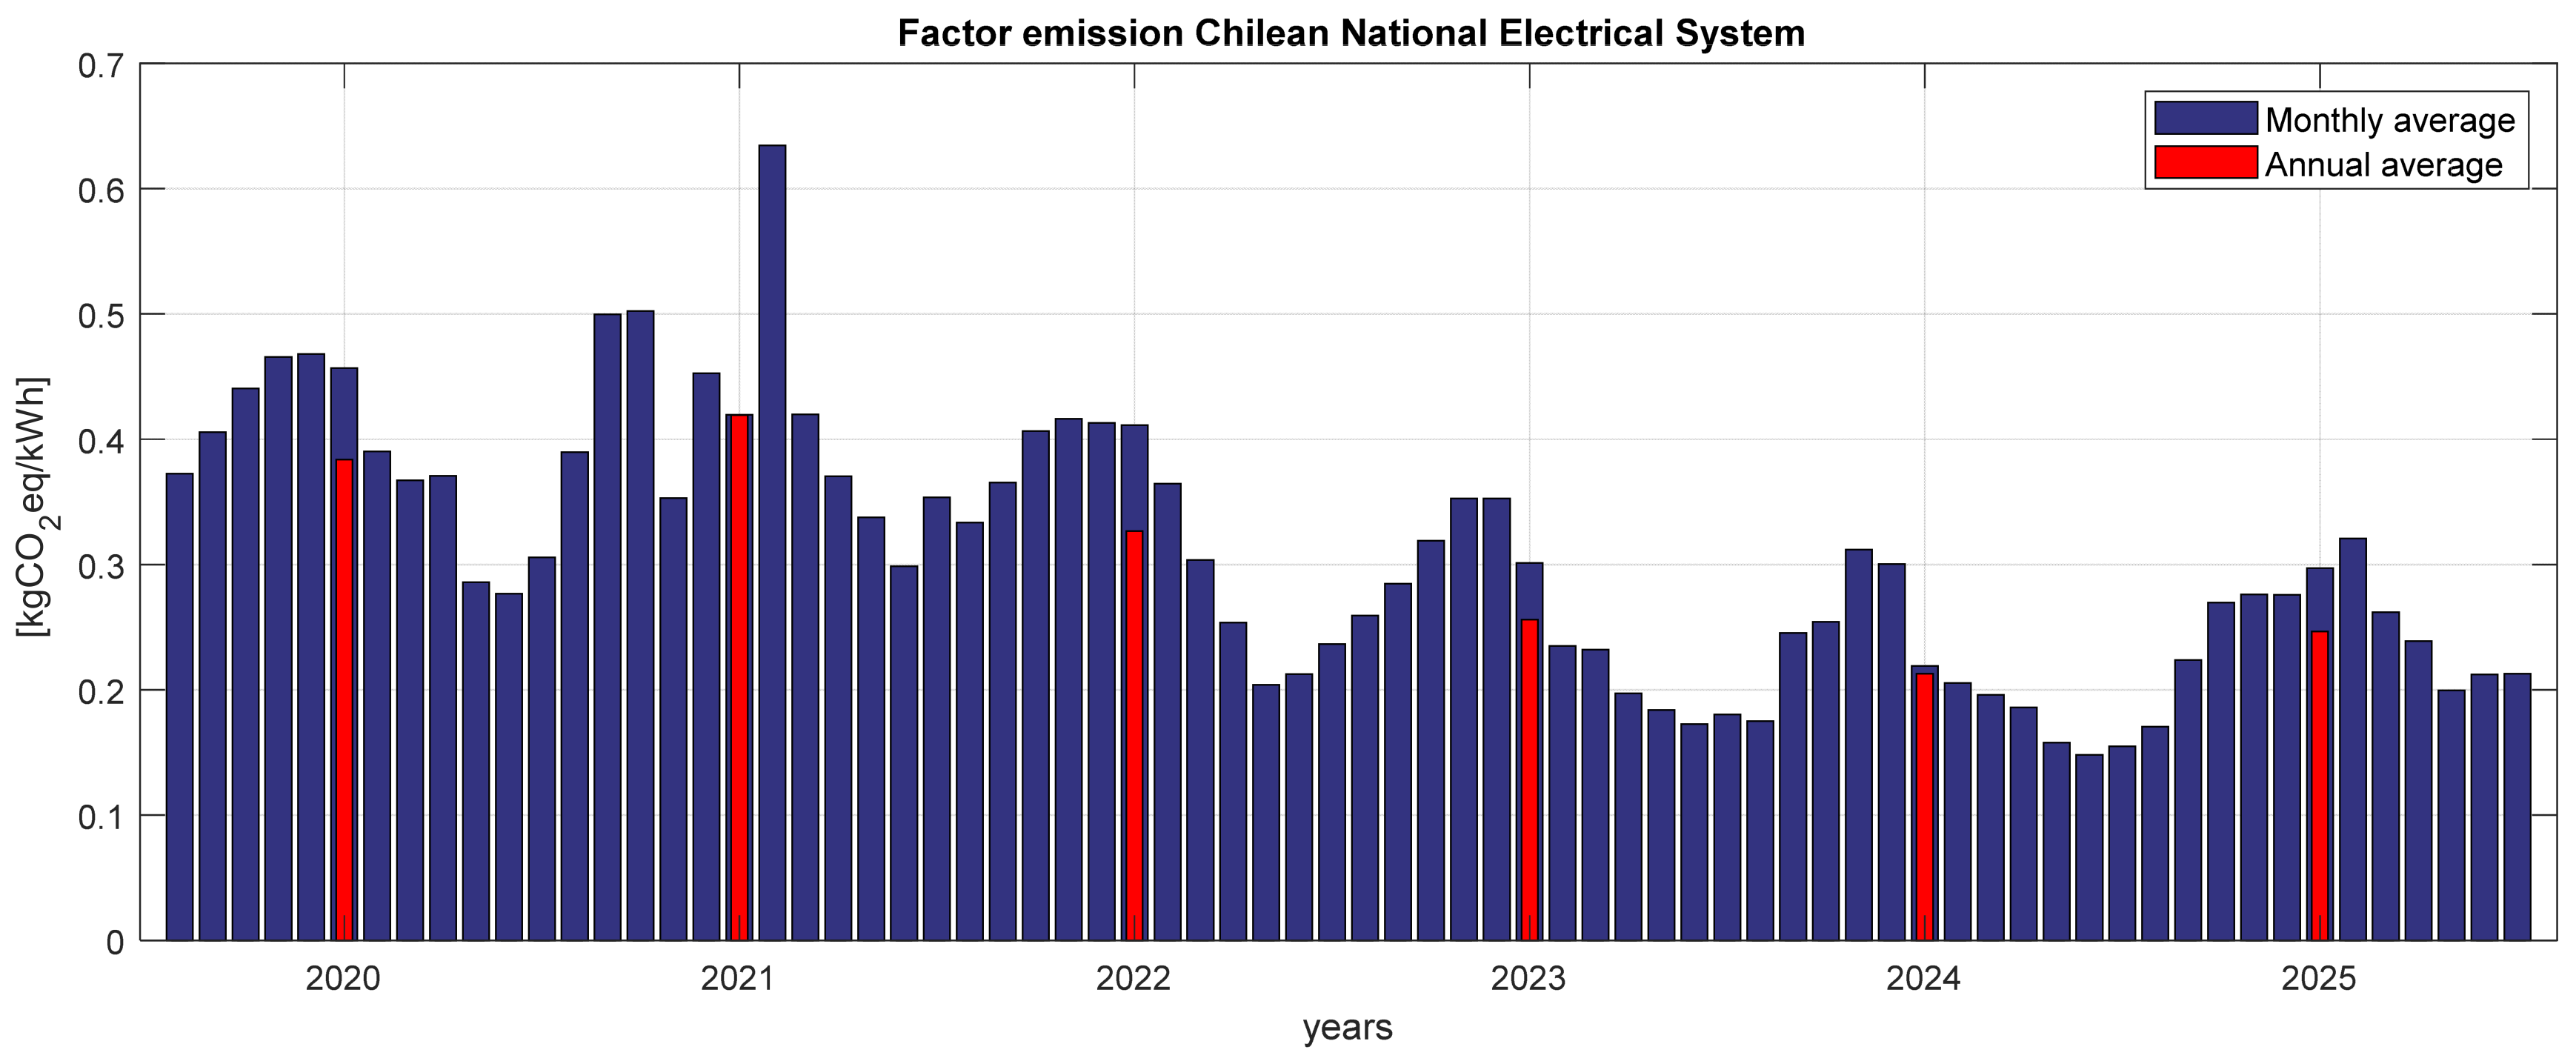

Disclaimer/Publisher’s Note: The statements, opinions and data contained in all publications are solely those of the individual author(s) and contributor(s) and not of MDPI and/or the editor(s). MDPI and/or the editor(s) disclaim responsibility for any injury to people or property resulting from any ideas, methods, instructions or products referred to in the content. |
© 2026 by the authors. Licensee MDPI, Basel, Switzerland. This article is an open access article distributed under the terms and conditions of the Creative Commons Attribution (CC BY) license.