


Abstract
Against the backdrop of global demographic transition and widening regional disparities, population shrinkage and population aging have become critical constraints on regional development, posing severe challenges to the socioeconomic resilience of shrinking areas. Taking China’s three northeastern provinces as the study area, this paper investigates the impacts of population aging on county-level socioeconomic resilience and its spatiotemporal heterogeneity. Based on population census and socioeconomic data from 143 counties in Northeast China during 2010–2020, an evaluation index system of socioeconomic resilience is constructed using the entropy weight method. Grey relational analysis, Tobit regression models, and geographically and temporally weighted regression (GTWR) are employed to conduct empirical tests. The results indicate that most counties simultaneously experience population decline and deep aging, and their interaction forms an intensified negative feedback mechanism that constrains the improvement of socioeconomic resilience. Compared with other shrinking regions in China—such as selected counties in the Yangtze River Delta and resource-rich counties in central and western China—Northeast China is distinguished by a unique set of compounded pressures, driven by the simultaneous and mutually reinforcing trends of sustained population decline and deep aging. Population aging exhibits a strong correlation with socioeconomic resilience across all dimensions, with the most pronounced association observed in transformation capacity. Population density also plays an important role, although its correlation strength is relatively weaker. Tobit regression results further confirm that population aging significantly suppresses socioeconomic resilience, whereas population density exerts a positive effect, with notable differences across various types of shrinking counties. GTWR analysis reveals significant spatial heterogeneity in the impacts of these factors on socioeconomic resilience. Overall, this study provides robust empirical evidence for formulating targeted policies and enhancing sustainable development capacity in shrinking and aging regions.
1. Introduction
With global population shrinkage, rising life expectancy, and improvements in health conditions, population aging has become a worldwide phenomenon. As a complex process of system evolution involving economic structures, social systems, and public service provision, population aging poses significant challenges to traditional regional development planning and policymaking based on growth-oriented scenarios [1], and has attracted widespread attention in the international academic community. Existing research on population aging has mainly focused on the measurement of aging levels [2], spatial distribution patterns [3], formation mechanisms [4], the socioeconomic and environmental effects of aging [5,6], and governance strategies [7].
Population aging exerts profound influences on socioeconomic development through a series of mechanisms, including reductions in labor supply, increased pressure on social security systems, and shifts in the structure of public service demand. A clear understanding of these characteristics and their underlying mechanisms is crucial for the formulation of effective governance strategies. However, existing studies remain divided on the effects of population aging, with no consensus on whether its overall impact is predominantly positive or negative. Some studies argue that aging leads to slower economic growth [8], increased fiscal burdens [7], and the aggravation of rural poverty [9]. By contrast, other studies emphasize the potential positive effects of aging under specific conditions, such as alleviating environmental pressure [6], promoting adaptive adjustments in industrial structures [5], and stimulating the development of elderly care services and social innovation [10].
Population aging is often accompanied by a decline in total population size, leading to population shrinkage; conversely, population shrinkage can further intensify aging. Existing research indicates a clear bidirectional feedback mechanism between the two: population decline accelerates aging through the outmigration of young and middle-aged groups, while aging, by weakening fertility intention and reducing migration attractiveness, further promotes population decline, creating an irreversible vicious cycle [11,12]. This structural dilemma places substantial pressure on economic development and public finances, particularly in post-industrial and resource-based cities, where social security expenditures rise sharply while fiscal capacity remains constrained, thereby necessitating innovative financial instruments and policy responses [7,8]. From an environmental perspective, aging and shrinkage influence carbon emissions and ecological protection by changing consumption patterns, land use, and industrial trajectories. In shrinking cities, population aging has a significant threshold effect on industrial upgrading and emissions reduction [5,6]. Within this context, population aging and regional sustainable development capacity are closely intertwined, with socioeconomic resilience providing a critical lens through which this relationship can be understood.
Socioeconomic resilience deserves particular attention in the context of demographic transition. Research on social resilience has gradually shifted from a macro-level framework toward micro-level analyses of the survival and adaptive capacity of regional social systems. Drastic population changes profoundly reshape the foundations and functioning of social resilience. On the one hand, the outflow of young and middle-aged populations and shrinking family size directly weaken micro-level intergenerational support networks, which have traditionally served as key pillars of resilience [13], thereby exacerbating poverty and housing instability in rural areas [9]. This finding is consistent with the regional differentiation mechanisms of aging identified by Li et al. [14] in impoverished areas of southwest China, which together lead to a marked decline in the capacity of shrinking regions to rely on internal family resources to cope with risks. On the other hand, in the context of industrial decline and the contraction of public service provision, social collectives engage in self-organization through dynamic capacities [15] to compensate for service gaps. At the same time, the mechanism through which aging affects regional development via labor supply, as emphasized by Martin and Sunley [16], becomes particularly pronounced in shrinking regions. Migration [17,18] has thus emerged as a potential means of alleviating local population shrinkage and injecting new vitality, highlighting the growing importance of cross-regional resilience networks.
Economic resilience is defined as a dynamic process in which a regional economy, when exposed to external shocks, not only mitigates the impacts of decline through resistance and rebounds through recovery, but also adapts and transforms through structural reorganization and path renewal, thereby maintaining or enhancing long-term sustainable development capacity. Meerow et al. [19] were the first to propose a comprehensive definition of urban resilience, constructing a four-dimensional framework that includes the economic dimension and laying the theoretical foundation for understanding and evaluating urban economic resilience through the “five W’s” approach. Building on this, Rose [20] further narrowed the focus to the economic system itself and developed a more refined assessment framework for economic resilience from the perspectives of conceptual definition, modeling methods, and quantifiable indicators. Subsequently, Lin et al. [21] extended this line of inquiry by establishing an operational evaluation system based on economic strength, industrial structure, and innovation capacity. To more deeply reveal the driving mechanisms of economic resilience, Martin and Sunley [16] further elaborated the channels through which aging affects regional development via labor supply and consumption structure. From the perspective of evolutionary economic geography, it has been found that enhancing economic resilience plays a key role in mitigating the impacts of aging [22], a view supported by numerous empirical studies [23,24]. In addition, factors such as institutional quality [25], urban-rural structure [26], higher education and human capital [27], immigration [18], industrial diversity [28], as well as digital finance and financial capital [29,30] are also crucial for enhancing economic resilience. Focusing on the county scale and considering the relatively small spatial units and limited availability of indicators, this study constructs an indicator system based on resistance, adaptation, and transformation capacity.
It should be emphasized that the demographic challenges faced by Northeast China are not an isolated phenomenon. Comparable patterns have been extensively documented in post-socialist and formerly communist regions of Eastern Europe. Following the political and economic transformations that began in the late 1980s, many Eastern European countries have undergone sustained population decline, selective outmigration of younger and more mobile labor forces, and an accelerated intensification of population aging [31]. These interrelated demographic processes have generated profound structural constraints on regional development capacity, fiscal sustainability, and social resilience. In particular, they have contributed to self-reinforcing demographic-economic feedback loops, which are highly comparable to the challenges encountered by China’s old industrial bases and resource-dependent regions [32]. Accordingly, incorporating insights from the post-communist literature offers an important international perspective for advancing the understanding of how population shrinkage and aging jointly shape regional socioeconomic resilience [33].
Socioeconomic resilience reveals the sustainable development status of human social and economic activities. The correlation between population aging and socioeconomic resilience operates through multiple dimensions. Economically, aging directly leads to reductions in labor supply and structural aging, potentially suppressing regional innovation and productivity [16], while residents’ savings behavior, changes in consumption structure, and the direction and efficiency of fixed asset investment together shape the economic foundation for regional responses to shocks [29]. Socially, aging increases fiscal pressure on social security and public services and, through the outflow of young and middle-aged populations, weakens traditional intergenerational family support networks [13]. However, crises may stimulate the emergence of new resilience organizations, with social collectives self-organizing through dynamic capacity to fill service gaps [15]. Migration-based cross-regional social networks thus become an important resource for social resilience [17]. Environmentally and spatially, urbanization patterns, industrial structure, and corresponding environmental pressures are closely linked to regional resilience, and unreasonable urbanization and high-environmental-cost growth models may erode the long-term foundations of resilience [5]. Population density, as an indicator of population concentration, and spatial connectivity between regions influence resilience through mechanisms such as knowledge spillovers, economies of scale, and market accessibility [34]. The rates of change in population density and population size are two variables that reveal the degree of population decline. In this study, the rate of change in population density is used as an indicator to compare the extent of population decline and its subsequent effects on socioeconomic resilience.
Existing research has primarily focused on the linear effects of single demographic factors and has not systematically revealed how scale shrinkage and structural aging interact with, offset, or reinforce each other at the macro level [35], thereby forming unique regional social resilience feedback mechanisms and spatiotemporal heterogeneity. Although substantial progress has been made in studies on multidimensional rural resilience characteristics [36,37], the development of resilience concepts [38], and the foundational role of economic resilience [16,20], clear limitations remain. Most studies emphasize the linear effects of a single demographic factor and thus fail to fully uncover the synergistic effects and feedback mechanisms operating under the dual pressures of scale shrinkage and structural aging [39]. Furthermore, research scales tend to be primarily concentrated at the urban or provincial levels, with insufficient attention paid to counties, which are the basic units of regional development and key carriers of policy implementation. In particular, systematic investigations of county-level socioeconomic resilience remain scarce, constraining a deeper understanding of intra-regional differentiation. Finally, previous analyses have often relied on static or global models and therefore fail to capture the complex interactions and non-stationary characteristics of demographic structure and regional resilience across space and time, making it difficult to answer the key question of where and when these mechanisms play a role. This limitation is especially pronounced in regions such as China’s northeastern provinces, which are simultaneously confronted with population decline and deep aging, where systematic analyses of spatiotemporal heterogeneity remain lacking. Second, prior research has largely concentrated on urban or provincial scales, paying limited attention to counties as the basic units of regional development and pivotal arenas for policy implementation. In particular, systematic investigations of county-level socioeconomic resilience remain scarce, which constrains a more nuanced understanding of intra-regional heterogeneity. Third, from a methodological perspective, much of the existing evidence is derived from static or global models that are ill-suited to capturing the complex spatiotemporal interactions and non-stationary dynamics between demographic structure and regional resilience. As a result, the literature has struggled to address the core question of where and when specific mechanisms operate. This limitation is especially salient in the three northeastern provinces, a representative context characterized by the concurrence of population shrinkage and deep aging, yet lacking comprehensive spatiotemporal heterogeneity assessments. In terms of theoretical contribution, this study integrates population shrinkage and population aging within a unified regional resilience framework. Departing from earlier work that either isolates a single demographic dimension or remains confined to macro-level analyses of economic resilience, we conceptualize at the county scale a “shrinkage–aging–resilience erosion” mechanism, thereby extending the explanatory reach of resilience theory to demographic transitions in shrinking regions. Empirically, this study offers fine-grained county-level evidence for Northeast China. Existing research on resilience in this region has predominantly been conducted at provincial or prefecture-city scales, which may mask substantial internal spatial differentiation. Using 143 county units, we reveal pronounced within-province disparities and identify stage-contingent effects of demographic factors across different phases of shrinkage. Methodologically, we employ the GTWR model to characterize spatiotemporal non-stationarity in the relationship between demographic structure and socioeconomic resilience. Compared with the global or static models commonly used in provincial-scale studies, GTWR enables the detection of spatially and temporally varying effects of population aging—including positive effects in some contexts and negative effects in others—thus providing more policy-relevant evidence to support place-based and differentiated interventions.
Population shrinkage has become a common challenge confronting post-industrial cities and regions worldwide, and its formation mechanisms and impact pathways are highly complex and spatially heterogeneous. This study seeks to clarify the complex causal mechanisms linking demographic transition and regional resilience, with the “population decline—aging—resilience weakening” feedback mechanism in counties of China’s three northeastern provinces being both representative and nationally distinctive. Compared with the stronger buffering capacity observed in eastern coastal regions and the development constraints in central and western China that are often shaped by a single dominant stressor, counties in Northeast China face a more complex configuration of compounded and interacting pressures. Accordingly, Northeast China provides an informative empirical setting for unpacking the underlying mechanisms through which demographic structural change influences socioeconomic resilience.
The conclusions of this study deepen the understanding of the compounded effects of population decline and aging, providing theoretical support for the formulation of policies aimed at regional coordinated development and the enhancement of socioeconomic resilience. In addition, the findings offer new insights into improving socioeconomic resilience in regions facing the dual pressures of population decline and aging, which is crucial for achieving sustainable regional development and advancing the modernization of governance systems amid profound population structural transitions.
2. Study Area Overview and Data Sources
2.1. Study Area Overview
In the early period following the founding of the People’s Republic of China, the northeastern region, relying on its strong economic base and resource endowments, established itself as the industrial core and became a prominent driver of national economic development. However, with the gradual southward shift in China’s economic center, the northeast region has experienced a dramatic population decline. Over the past two decades, the region has undergone sustained economic recession and population outflow, leading to urban shrinkage and suburbanization. This study focuses on the three northeastern provinces of China—Liaoning, Jilin, and Heilongjiang—and takes 143 county-level administrative units within these provinces as the empirical study area, see Figure 1. As one of the most representative regions in China’s demographic transition process, the area exhibited pronounced population decline and deep aging from 2010 to 2020. According to data from the Seventh National Population Census, the total permanent population of the three northeastern provinces has continued to decrease, with population loss at the county level being particularly prominent, forming a pattern of widespread population shrinkage. Simultaneously, the degree of population aging has intensified, further strengthening the constraints on the stability and recovery capacity of county-level socioeconomic systems.
Figure 1.
The study area. Note: This map is based on the standard map (Review No. GS(2024)0650) obtained from the Standard Map Service of the Ministry of Natural Resources of the People’s Republic of China. The base map boundaries remain unaltered.
The “population shrinkage—aging—resilience weakening” feedback loop observed in counties in the northeastern provinces is both typical and nationally distinctive. Compared with the stronger resilience-buffering capacity of coastal eastern regions and the development challenges of central and western regions, where single pressures tend to dominate, northeastern counties face a more complex situation in which multiple pressures interact simultaneously. As a result, this region provides an ideal case for exploring the intrinsic mechanisms linking demographic changes and socioeconomic resilience. The selection of this region for in-depth analysis not only helps to clarify its own path toward sustainable development but also offers theoretical insights and practical references for counties across China facing similar issues.
2.2. Indicator Selection
To systematically examine the mechanisms through which population decline and aging affect county-level socioeconomic resilience, as shown in Table 1, a comprehensive indicator system is constructed to reveal the relationships among the dependent variable, core independent variables, and control variables (Table 1).
Table 1.
The variable descriptions.
County-level socioeconomic resilience, as the dependent variable in this study [40,41,42], is measured using the entropy weight method to construct a comprehensive evaluation system. This system comprises three core dimensions: resistance, adaptability, and transformation capacity. Resistance is characterized by five indicators—per capita regional GDP, economic growth rate, industrial upgrading index, fiscal self-sufficiency rate, and per capita disposable income of rural residents—reflecting a county’s basic capacity to withstand external shocks. Considering the specific regional context of Northeast China, its development trajectory is jointly shaped by resource dependence–induced industrial path lock-in and state-led revitalization initiatives. Many counties in the region exhibit highly specialized and relatively undiversified industrial structures; the associated industrial decline imposes persistent structural constraints on socioeconomic resilience. Accordingly, the industrial upgrading index is incorporated as a key component of the socioeconomic resilience measure. Moreover, the “Northeast Revitalization Strategy” and related talent-retention policies are proxied by the local fiscal self-sufficiency ratio, which may partially moderate the relationship between demographic structural change and socioeconomic resilience. Taken together, these contextual conditions differentiate Northeast counties from other shrinking regions and further underscore the distinctiveness of the study area. Adaptability is measured by four indicators—per capita retail sales of social consumer goods, number of medical and health beds per 10,000 people, number of social institutional beds per 10,000 people, and the proportion of agricultural value added to total output—reflecting the capacity for adjustment and adaptation under pressure. Transformation capacity is assessed using five indicators—per capita total agricultural machinery power, proportion of tertiary industry value added, proportion of the young and middle-aged labor force, proportion of the population with higher education, and the teacher-student ratio in general secondary schools—indicating a county’s long-term potential for structural transformation. This evaluation system, comprising 14 specific indicators across three dimensions (see Table 2), provides a methodological foundation for the comprehensive quantification of county-level socioeconomic resilience [9,20,43,44].
Table 2.
The socioeconomic resilience indicator system.
In the selection of explanatory variables, this study focuses on two core dimensions: population decline and population aging. Population decline is measured using the population density indicator, which effectively reflects the degree of population concentration per unit area and its changing trends. Population aging is measured using the aging coefficient, defined as the proportion of the population aged 65 and above relative to the total population. This indicator directly reflects the degree of aging in the county-level population structure [45,46,47,48].
To control for the influence of other potential factors, a set of control variables is also introduced. Per capita urban and rural residents’ savings balance reflects the financial liquidity of the resident sector and the potential level of domestic demand. Per capita fixed asset investment represents the driving role of capital investment in economic development. The urbanization rate captures the urban-rural population structure and the stage of social development. Additionally, environmental factors are considered, including per capita carbon emissions, which indicate the environmental pressure associated with regional economic development, and the annual average PM2.5 concentration, which reflects regional air quality and the living environment [20,45].
2.3. Data Sources
The data used in this study were obtained from the China County Statistical Yearbook, Heilongjiang Province County Statistical Yearbook, Liaoning Province County Statistical Yearbook, and Jilin Province County Statistical Yearbook. Carbon dioxide emissions data were derived from the Global Atmospheric Research Emissions Database (EDGAR) (https://edgar.jrc.ec.europa.eu/emissions_data_and_maps (Accessed 10 January 2025)). Using Rsoftware (4.5.0), the original gridded data were converted into raster format and then aggregated by administrative unit to obtain county-level carbon emissions data. NDVI data were sourced from the MODIS-NDVI (MOD13A3) dataset released by NASA (https://ladsweb.modaps.eosdis.nasa.gov/search/ (Accessed 1 February 2025)), with a spatial resolution of 1000 m.
3. Research Methods and Theoretical Framework
3.1. Entropy Weight Method
The entropy weight method [49] was applied to the quantitative assessment of development levels by determining the weights of evaluation indicators, thereby providing a basis for comprehensive evaluation. In this study, the method was mainly used to measure the development level of socioeconomic resilience. The calculation process was as follows.
- Non-dimensional processing: To eliminate dimensional differences among indicators, the range normalization method was adopted to standardize the data and obtain a standardized matrix:where represents the number of indicators and represents the number of counties.
- The information entropy of indicator was calculated aswhere and .
- The weight of indicator was calculated aswhere and .
- The comprehensive evaluation of the -th year for each subsystem is given bywhere is the comprehensive evaluation value of socioeconomic resilience.
3.2. Gray Relational Model
Gray relational analysis is primarily used to reveal the strength of relationships among subsystems within a complex system [50]. Compared with correlation analysis and regression analysis, gray relational analysis can more realistically and objectively reflect key influencing factors and their differences within the system. In this study, gray relational analysis was applied to quantitatively assess the relationships between population density and socioeconomic resilience, as well as between population aging and socioeconomic resilience, across different dimensions and indicators. The calculation formulas are as follows:
where represents the gray relational degree between socioeconomic resilience and population density or population aging, and denotes the gray relational coefficient of indicator in year with respect to population density or population aging, with values ranging from [0, 1]; ∆ia is the absolute difference between the reference sequence and the comparative sequence; ∆ₘₐₓthe absᵢₙ are the maximum and minimum values among all absolute differences, respectively; and ρ is the distinguishing coefficient, which was set to 0.5 in this study. According to classification criteria commonly adopted in related studies, the gray relational degree is divided into three levels: indicates a weak association, indicates a moderate association, and indicates a strong association.
3.3. Panel Tobit Model
To investigate the causal relationships between influencing factors and socioeconomic resilience, and considering that the socioeconomic resilience values in the study are bounded between 0 and 1 as limited dependent variables, the Tobit model [51] was adopted to address regression issues associated with such data. Accordingly, a Tobit model was constructed to analyze the relationships between county-level socioeconomic resilience in the three northeastern provinces and its influencing factors. The model is specified as follows:
where denotes the socioeconomic resilience level of region at time t; represents the -th influencing factor at time ; is the estimated coefficient; is the constant term; and is the random error term.
3.4. Spatiotemporal Geographically Weighted Regression Model
The geographically weighted regression (GWR) model [52] extends traditional global regression models by explicitly incorporating spatial relationships, thereby revealing spatial variation in the effects of independent variables on the dependent variable. Building on this, the spatiotemporal geographically and temporally weighted regression (GTWR) model introduces a time dimension, enabling a joint analysis of the factors influencing socioeconomic resilience and effectively addressing the non-stationarity of spatiotemporal processes. The basic form of the model is as follows:
where is the socioeconomic resilience level of unit ; is the number of study units; is the number of explanatory variables for unit ; denote the spatiotemporal coordinates of unit ; represents the regression coefficient of the -th explanatory variable; and is the residual term.
3.5. Theoretical Framework
Recent scholarship on shrinking regions has increasingly highlighted the particular relevance of post-socialist contexts. Within these settings, population decline is deeply intertwined with deindustrialization, institutional reconfiguration, and large-scale outmigration, forming a complex and path-dependent process of regional transformation [33]. Research on post-socialist shrinking cities further suggests that shrinkage should not be interpreted merely as a demographic outcome, but rather as a multidimensional restructuring trajectory shaped by historical legacies and uneven patterns of regional development. In addition, European scholars have developed typologies of urban shrinkage and demonstrated that different stages and forms of population decline can generate highly heterogeneous socioeconomic consequences [33]. Empirical evidence from countries such as Poland indicates that shrinkage is often accompanied by rising pressures on local governance capacity and the emergence of differentiated policy response pathways [53]. Collectively, these insights provide a valuable comparative foundation for the present study. Against this backdrop, this research seeks to investigate how population aging interacts with varying degrees of population shrinkage, thereby reshaping county-level socioeconomic resilience.
This study is situated within the macro context of demographic transition and regional development disparities and focuses on the complex interactive relationship among population shrinkage, population aging, and socioeconomic resilience. Figure 2 presents a theoretical analysis framework constructed by integrating perspectives from population geography and regional resilience research. The core of this framework comprises three key concepts: population shrinkage, population aging, and socioeconomic resilience. In this study, population shrinkage primarily reflects the continuous decline in county-level permanent population size and the reduction in population density, indicating a weakening of regional population agglomeration capacity [11]. Population aging refers to the process by which the proportion of elderly people in the population increases, profoundly affecting regional development through channels such as labor supply, consumption structure, and social security expenditure [5,6]. Socioeconomic resilience is defined as a region’s ability to resist, adapt to, and transform in response to internal and external shocks [16]. In this study, socioeconomic resilience is operationalized as a comprehensive evaluation system comprising resistance, adaptability, and transformation capacity [20,21].
Figure 2.
The theoretical framework of the relationships among population density, population aging, and socioeconomic resilience.
These three elements form a dynamic and mutually reinforcing triadic interaction structure. Population shrinkage is often accompanied by the selective outmigration of young and middle-aged labor, which directly accelerates the aging process. Deepening aging further suppresses fertility intention and reduces regional attractiveness, thereby exacerbating population shrinkage and creating an irreversible negative feedback loop [12]. This composite pressure of “shrinkage—aging” jointly affects regional socioeconomic resilience, potentially weakening resistance, constraining adaptability, and ultimately challenging transformation capacity, thus forming a closed-loop mechanism of “shrinkage—aging—socioeconomic resilience weakening.” Consequently, the impact of aging on resilience may differ in magnitude and even direction depending on a region’s industrial foundation and innovation capacity [28], evolve dynamically over time with development stages and policy interventions [35], and exhibit spatial non-stationarity, characterized by geographic differentiation such as core-periphery and urban-rural patterns [18,26].
The association between population aging and socioeconomic resilience operates through multiple pathways. Economically, aging directly leads to a reduction in labor supply and structural aging, which may suppress regional innovation and productivity [16]. Changes in residents’ saving behavior, consumption structure, and the direction and efficiency of fixed asset investment jointly shape the economic foundation of regions in responding to shocks [29]. Socially, aging intensifies fiscal pressure on social security and public services, and weakens traditional intergenerational family support networks as a result of the outflow of young and middle-aged populations [13]. However, crises may also give rise to new organizational forms of resilience, with social collectives self-organizing through dynamic capacity to fill service gaps [40], while migration-driven cross-regional social networks become an important resource for social resilience [17]. From an environmental and spatial perspective, urbanization patterns, industrial structure, and associated environmental pressures are closely linked to regional resilience, and unreasonable urbanization and high-environmental-cost growth models may erode the long-term foundations of resilience [5]. Population density, as an indicator of population concentration, together with spatial connectivity between regions, influences resilience through mechanisms such as knowledge spillover, economies of scale, and market accessibility [34].
This study distinguishes different types of population shrinkage and adopts models that capture spatiotemporal non-stationarity to reveal the heterogeneity of influencing mechanisms across shrinkage stages and their spatiotemporal variation. In summary, population shrinkage and population aging, as core explanatory variables, influence the socioeconomic resilience system comprising resistance, adaptability, and transformation capacity through economic, social, environmental, and spatial pathways. These effects are moderated by a series of control variables, with both the intensity and direction of impacts exhibiting pronounced spatiotemporal heterogeneity as well as heterogeneity across different types of population shrinkage. By systematically linking macro-level demographic transitions with micro-level regional resilience responses, this framework provides a theoretical foundation for the empirical examination of the effects of population aging on socioeconomic resilience in the context of population shrinkage.
4. Results
4.1. Spatiotemporal Patterns of Population Shrinkage, Population Aging, and County-Level Socioeconomic Resilience
4.1.1. Spatiotemporal Pattern of Population Shrinkage
Population shrinkage is measured as the percentage change in the permanent resident population between the Sixth National Population Census (2010) and the Seventh National Population Census (2020). Consistent with widely used typologies in the shrinking-cities and population-decline literature, we classify counties into four stages to capture the progressive deepening of shrinkage. Specifically, counties are categorized as mildly shrinking (−15% to 0%), moderately shrinking (−30% to −15%), severely shrinking (−45% to −30%), or extremely shrinking (<−45%). This staged classification has been extensively applied in empirical research to differentiate levels of population loss and to examine their stage-contingent socioeconomic consequences [4,11,54]. Conceptually, a decline exceeding 15% is often regarded as indicating the onset of shrinkage, whereas losses of 30–45% or more typically correspond to deep shrinkage, frequently associated with accelerated outmigration, mounting fiscal stress, and diminished public service capacity. Given the pronounced heterogeneity in county-level demographic trajectories in Northeast China, this tiered approach provides a clearer basis for identifying spatially heterogeneous resilience effects across stages of shrinkage. The measurement results are reported in Table 3, and the spatial distribution is illustrated in Figure 3. During 2010–2020, county-level population shrinkage in Northeast China was pronounced. With the exception of Yanji City in Jilin Province—the only unit experiencing population growth—the remaining 142 counties and county-level cities recorded population decline, with shrinking counties accounting for 99.30% of the total. Counties experiencing moderate shrinkage constituted the largest group (72 counties, 50.3%), followed by those with mild and severe shrinkage (34 counties each, 23.8%), while only two counties fell into the extreme shrinkage category (1.4%). The average magnitude of population change varied substantially across shrinkage types: the growth-type county recorded a population increase of 47.308, whereas extreme-shrinkage counties exhibited an average decline of 21.880. Overall, the region displayed a pattern of widespread shrinkage with marked depth differentiation, as shown in Table 3.
Table 3.
The number, proportion, and degree of shrinkage of counties by population shrinkage type, 2010–2020.
Figure 3.
The population density and degree of population shrinkage in the three northeastern provinces in 2010 and 2020.
In terms of spatial heterogeneity (Figure 3), population shrinkage across counties in Northeast China exhibited a clear gradient of “higher in the north than in the south, and higher in inland areas than in border/coastal areas”. Counties experiencing severe shrinkage or above were mainly concentrated in three areas. The first cluster comprises forest-region counties, represented by Mohe City (−35.219%), Tahe County (−29.885%), and Huma County (−44.788%). Affected by the implementation of the Natural Forest Protection Program, harsh climatic conditions, and poor accessibility, forestry-related employment opportunities have contracted sharply, leading to sustained population out-migration. The second cluster includes traditional agricultural counties, such as Baiquan County (−38.175%), Mingshui County (−38.175%), and Qinggang County (−39.388%). Improvements in agricultural mechanization have generated substantial surplus labor, while limited local non-agricultural employment opportunities have further accelerated population loss. In contrast, counties with relatively mild shrinkage are mainly of two types: (i) border port cities (e.g., Yanji and Hunchun), which retain some population-attracting capacity through cross-border trade, border tourism, and other specialized industries; and (ii) coastal counties or those located in the peri-urban belts of major cities (e.g., Changhai County in Dalian and Liaozhong District in Shenyang), where the development of the marine economy or spillover effects from core urban areas help to alleviate population shrinkage pressures. Compared with other shrinking regions in China, county-level population shrinkage in the three northeastern provinces is more prominently characterized by being territory-wide, persistent, and shaped by the concurrence of multiple shrinkage types. By contrast, the Yangtze River Delta—China’s most highly concentrated urban agglomeration in terms of population and industry—continues to exhibit an overall tendency toward concentration in core metropolitan areas and along major transport corridors. At the county scale, the observed “shrinkage versus growth” pattern in the Yangtze River Delta more often reflects population redistribution associated with industrial upgrading and spatial restructuring. Even when population decline occurs in some counties, it is typically embedded in an internal reorganization process marked by “strong agglomeration–strong differentiation,” rather than a region-wide, unidirectional contraction. Empirical evidence further indicates that population dynamics in the Yangtze River Delta are closely linked to the evolving structure of the urban agglomeration, migration networks, and inter-city spatial linkages, giving rise to pronounced intra-regional differentiation and re-agglomeration processes [55]. This comparison underscores the regionally contingent nature of population shrinkage in China and highlights the distinct demographic trajectory of Northeast China.
4.1.2. Spatiotemporal Pattern of Population Aging
Population aging was measured by the share of residents aged 65 years and above. Following the United Nations classification, county-level aging was divided into six categories: young (0–4%), adult stage I (4–5.5%), adult stage II (5.5–7%), elderly stage I (7–10%), elderly stage II (10–14%), and elderly stage III (>14%). In 2010, the distribution of population aging types across counties in Northeast China was highly diverse, covering all categories from the young to elderly stage II. Elderly stage I dominated (67.13%), and no county had yet entered elderly stage III. By 2020, this pattern had shifted fundamentally: 96.5% of counties had progressed to elderly stage III, while the remaining five counties were classified as elderly stage II. All younger categories (young and adult stages) had disappeared entirely, indicating that within just one decade, the counties of Northeast China collectively transitioned from an “aging society” to a “deeply aging society”, as shown in Table 4.
Table 4.
Changes in the number of county units by population aging type.
Along the gradient of population shrinkage intensity, as shown in Table 5 and Figure 4, the only population-growth county, Yanji City, was classified as elderly stage I in 2010, with an aging level of 8.95%; by 2020, it had risen to elderly stage II (14.82%), representing an increase of 65.59%, as illustrated in Table 5. In contrast, population aging accelerated markedly in shrinking counties. Mild-shrinkage counties increased from 9.21% to 17.15% (86.21% growth); moderate-shrinkage counties from 8.36% to 16.99% (103.23% growth); severe-shrinkage counties from 8.27% to 17.13% (107.13% growth); and extreme-shrinkage counties from 8.37% to 19.31% (130.70% growth). This clear gradient indicates that with each upward shift in the shrinkage category, the growth rate of aging increases by approximately 20–25 percentage points. Such a pattern is likely related to the cumulative effects of structural constraints, including uneven regional development, difficulties in industrial restructuring, and spatially unequal provision of public services. From the perspective of demographic structural pressures, county-level aging in Northeast China has rapidly shifted within a relatively short period toward pervasive deep aging and has synchronously overlapped with population shrinkage, thereby generating compounded pressures. By contrast, although counties in the Yangtze River Delta have also experienced intensifying aging, its spatiotemporal pattern is better characterized by differentiated trajectories along core–periphery and district–county gradients. Between 2010 and 2020, aging levels across counties in the Yangtze River Delta urban agglomeration increased overall, giving rise to several clusters of severe aging and belts of rapid aging growth. These patterns indicate that, under sustained population inflows and relatively ample public-service resources, aging pressures in the Yangtze River Delta are more likely to manifest as structural differentiation rather than a region-wide, uniformly intensifying process [56].
Table 5.
Population aging levels and distribution of county units by population shrinkage type, 2010–2020.
Figure 4.
The levels and growth rates of population aging in the three northeastern provinces in 2010 and 2020.
During structural transition, resource-rich regions in central and western China often exhibit a combination of relatively weak demographic system development, selective outmigration, and industrial path dependence, which collectively intensifies age-structure pressures. Studies of China’s resource-based shrinking cities further show that these regions frequently face structural imbalances in coordinating the “population–land–industry” system, with the population subsystem remaining a comparatively weak component. Taken together, this evidence suggests that resource-rich areas in central and western China are susceptible to the compounded challenges of population loss and aging; nevertheless, the magnitude of shrinkage and aging there is generally far lower than that observed in the three northeastern provinces [57,58].
4.1.3. Spatiotemporal Pattern of County-Level Socioeconomic Resilience
Figure 5 shows that county-level socioeconomic resilience in Northeast China followed an overall upward trajectory during 2010–2020, rising from 0.210 to 0.388. Nevertheless, pronounced regional heterogeneity persisted throughout the period. In 2010, the spatial distribution of socioeconomic resilience exhibited a distinct “higher in the north and lower in the south” gradient. High-resilience areas were predominantly concentrated in northern border counties, whereas low-resilience areas formed contiguous clusters. Xunke County ranked among the high-resilience counties, with a socioeconomic resilience level of 0.415 in 2010, indicating a relatively strong capacity for sustained development. In contrast, Kedong County displayed a comparatively low initial resilience level, recording a value of only 0.130 in the same year.
Figure 5.
The county-level socioeconomic resilience and growth rates in the three northeastern provinces in 2010 and 2020.
By 2020, the spatial pattern had evolved into a new configuration characterized by “higher resilience in the northeast and lower resilience in the southwest,” accompanied by increasingly pronounced spatial agglomeration. Raohe County exhibited the highest level of socioeconomic resilience, at 0.617. Conversely, Chaoyang County in south-central Liaoning Province recorded the lowest level, at 0.236, reflecting the uneven nature of regional transformation and development. Several counties, including Mingshui and Taonan, demonstrated rapid growth in socioeconomic resilience, with growth rates of 268.9% and 205.3%, respectively, underscoring their strong adaptive capacity and development potential. By contrast, counties such as Luobei experienced relatively modest growth, with an increase of only 6.3%, highlighting the heterogeneous responses of counties to external shocks. Further analysis by population shrinkage type reveals a clear negative relationship between shrinkage intensity and the magnitude of resilience improvement. As the only population-growth county during the study period, Yanji City experienced a steady increase in socioeconomic resilience from 0.311 to 0.426, reflecting a relatively stable development trajectory. Notably, counties undergoing moderate shrinkage still achieved rapid gains in resilience despite demographic pressure, suggesting a comparatively strong capacity for structural adjustment. However, as population shrinkage intensified, the overall level of socioeconomic resilience declined, as shown in Table 6, underscoring the structural constraints that severe population decline imposes on county-level sustainable development.
Table 6.
The levels of socioeconomic resilience by population shrinkage type, 2010–2020.
4.2. Grey Relational Analysis
To further clarify the strength of internal linkages among population aging, population density, and the dimensions of socioeconomic resilience, the grey relational analysis (GRA) model was applied, as shown in Figure 6, Figure 7, Figure 8 and Figure 9. The results show that population aging and population density have strong associations with overall socioeconomic resilience.
Figure 6.
The associations between the population aging level and overall and dimension-specific socioeconomic resilience. Note: PG = population growth; MiS = mild shrinkage; MoS = moderate shrinkage; SeS = severe shrinkage; CrS = critical shrinkage.
Figure 7.
The associations between population density and overall and dimension-specific socioeconomic resilience. Note: PG = population growth; MiS = mild shrinkage; MoS = moderate shrinkage; SeS = severe shrinkage; CrS = critical shrinkage.
Figure 8.
The associations between the population aging level and the overall and dimension-specific socioeconomic resilience under different types of population shrinkage. Note: The degree of association in 2010 (a) and 2020 (b) was calculated and compared. PG = population growth; MiS = mild shrinkage; MoS = moderate shrinkage; SeS = severe shrinkage; CrS = critical shrinkage.
Figure 9.
The associations between population density and overall and dimension-specific socioeconomic resilience under different types of population shrinkage. Note: The degree of association in 2010 (a) and 2020 (b) was calculated and compared. PG = population growth; MiS = mild shrinkage; MoS = moderate shrinkage; SeS = severe shrinkage; CrS = critical shrinkage.
From a temporal perspective, during 2010–2020, the mean grey relational grades between population aging and overall socioeconomic resilience across different shrinkage types ranged from 0.942 to 0.953. In 2020, the severe-shrinkage group exhibited the highest association (0.953), whereas the population-growth group showed a relatively lower value (0.941). This gradient implies that in areas experiencing more pronounced population loss, aging tends to impose stronger constraints on socioeconomic resilience, as illustrated in Figure 6. Dimension-specific results further indicate that the transformation capacity dimension generally exhibited the highest association with aging. For the population-growth county, the grey relational grade between aging and transformation capacity reached 0.970 in 2020, underscoring the particularly prominent role of aging in shaping long-term structural transformation. By contrast, the association between aging and adaptive capacity varied only slightly across shrinkage types, indicating a relatively stable effect of aging on counties’ adaptive capacity, as shown in Figure 8.
In comparison, population density was also found to be strongly associated with socioeconomic resilience. The overall correlation degree between population density and socioeconomic resilience across counties with different shrinkage types ranges from 0.928 to 0.953, but remains slightly lower than that associated with population aging, as illustrated in Figure 7. This suggests that in the context of population shrinkage in Northeast China, the influence of demographic aging (i.e., changes in population structure) is marginally stronger than that of population scale reduction. Notably, population density exhibited consistently high associations with the resistance dimension. For example, in extreme-shrinkage counties, the grey relational grade between population density and resistance reached 0.963 in 2010, suggesting that population concentration provides substantial support for baseline shock resistance. By contrast, the association between population density and transformation capacity was relatively weaker, suggesting that in areas undergoing severe depopulation, relying on population size alone becomes less effective in sustaining transformation momentum, as shown in Figure 9.
4.3. Tobit Model Regression Results
A Tobit model was employed to examine the effects of multiple determinants on county-level socioeconomic resilience, as shown in Table 7. The baseline estimation results reveal substantial heterogeneity in both the direction and magnitude of effects. Among the key explanatory variables, population density was found to have a significantly positive coefficient (0.1249897), suggesting that an appropriate degree of population agglomeration can generate economies of scale and improve the efficiency of public service provision. By contrast, population aging exerted a significant negative effect (−0.8114969), implying that declining labor supply and rising social security burdens constrain county-level development and thereby weaken socioeconomic resilience. With respect to the control variables, household savings were found to significantly promote resilience, whereas fixed asset investment had a significantly negative effect, implying that an investment structure oriented toward scale expansion does not necessarily translate into stronger resilience. The coefficient of the urbanization rate is not statistically significant, indicating that increasing urbanization alone is insufficient to improve resilience. Among environmental factors, PM2.5 concentration was found to have a positive coefficient (0.0031729), pointing to a more complex relationship between industrial development and environmental pressure, while per capita carbon emissions did not exhibit a significant effect.
Table 7.
The Tobit regression results for different types of population shrinkage.
As shown in Table 7, population density remained significantly positive in mildly, moderately, and severely shrinking counties, but its coefficient was found to decline with increasing shrinkage intensity, indicating a diminishing agglomeration effect under deeper depopulation. Population aging was negative in mildly and severely shrinking counties but became positive in moderately shrinking counties, revealing a nonlinear pattern characterized by “negative at both ends and positive in the middle”. Household savings were positive in mildly and severely shrinking counties but negative in moderately shrinking counties. Fixed asset investment shifted from significantly negative in mildly shrinking counties to positive in moderately and severely shrinking counties. The urbanization rate was significantly negative in both moderately and severely shrinking counties. Per capita carbon emissions were negative in mildly shrinking counties but positive in moderately and severely shrinking counties. PM2.5 concentration was positive in moderately shrinking counties but became negative in severely shrinking counties. Overall, these findings underscore pronounced heterogeneity in both the direction and magnitude of influencing factors across different stages of population shrinkage.
4.4. GTWR Model Results
4.4.1. Analysis of Overall Effects
In this study, the geographically and temporally weighted regression (GTWR) model was applied to investigate the spatially heterogeneous effects of multiple determinants on socioeconomic resilience. Compared with the ordinary least squares (OLS) and geographically weighted regression (GWR) models, the GTWR model exhibited markedly superior explanatory power and model performance. Specifically, the GTWR model achieved an R2 value of 0.956, exceeding those of the OLS model (0.849) and the GWR model (0.922). Moreover, its corrected Akaike Information Criterion (AICc) value (−527.355) was substantially lower than those obtained from the OLS (−248.125) and GWR (−391.867) models. The AICc differences were far greater than the commonly accepted threshold of 3, indicating a significant improvement in goodness of fit. Therefore, the GTWR model was selected as the most appropriate approach for capturing the spatiotemporal heterogeneity of the influencing factors on socioeconomic resilience and for conducting subsequent spatial analysis. Because GTWR estimates are sensitive to the specification of the temporal bandwidth and the spatial kernel function, we calibrate the model using a bandwidth selection procedure that minimizes the corrected Akaike Information Criterion (AICc). This approach reduces the risk of both over-smoothing and excessive localization, thereby improving the reliability of parameter estimates. Spatially, we employ an adaptive kernel that adjusts the neighborhood size in response to local sample density. By allowing the effective bandwidth to expand in sparse areas and contract in dense areas, the adaptive kernel alleviates the instability associated with fixed bandwidths and enhances the robustness of the estimated results [58,59]. Based on the GTWR results, pronounced spatiotemporal dynamics were observed in the mechanisms shaping county-level socioeconomic resilience across Northeast China. The estimated effects of the influencing factors varied not only across space but also over time, indicating clear temporal non-stationarity, see Figure 10.
Figure 10.
The spatial distribution of the GTWR coefficients.
As illustrated in Figure 10, population aging and population density exhibited distinct impact patterns. The effect of population aging showed strong regional differentiation. In counties surrounding major metropolitan centers such as Shenyang and Dalian, the estimated coefficients were the highest (reaching up to 1.506) and indicate a positive association with socioeconomic resilience. These areas are better able to cope with aging-related challenges due to stronger economic foundations, more comprehensive public service systems, and more developed elderly care industries. In contrast, in rural and resource-dependent counties—such as those around Hegang and Fushun—where the outflow of working-age populations continues, population aging was found to be associated with weaker socioeconomic resilience, with coefficients as low as −0.137. This spatial contrast suggests that the development effects of aging are highly dependent on local economic conditions and institutional capacity.
Unlike the spatially differentiated effects of population aging, population density showed a broadly negative effect. The estimated coefficients reached a minimum of −5.053 and were mostly distributed between −0.5 and −5.0, with stronger negative effects concentrated in resource-based cities and densely populated county seats. This finding implies that under sustained population outflow, higher-density areas may face compounded development pressures, including aging infrastructure and increasing burdens on public service provision. From a temporal perspective, the effects of these factors evolved systematically during 2010–2020: the spatial extent of positive aging gradually contracted, while the negative effect of population density intensified, which is consistent with the overall demographic trajectory of the region. Spatially, counties along the Harbin–Dalian (Ha–Da) railway corridor tend to exhibit a stronger capacity to maintain socioeconomic resilience, whereas resource-dependent areas and agricultural counties on the eastern and western flanks face greater development constraints. This divergence reflects both historically shaped industrial spatial configurations and differences in local adaptive capacity.
4.4.2. GTWR Results for Different Types of Population Shrinkage
To further reveal heterogeneity in the underlying mechanisms under conditions of population shrinkage, separate GTWR models were estimated for different shrinkage types. The results indicate that the effects of the core explanatory variables and control variables on county-level socioeconomic resilience differ substantially across shrinkage categories, while several common patterns can be identified; see Figure 11.
Figure 11.
The changes in regression coefficients across different types of population shrinkage. Note: X1 = population shrinkage; X2 = population aging; a1 = per capita savings of urban and rural res-idents (yuan); a2 = per capita fixed asset investment; a3 = urbanization rate; a4 = per capita carbon emissions; a5 = annual mean PM2.5 concentration.
As shown in Figure 11, a consistent finding across all shrinkage types relates to household savings and fixed asset investment. Household savings were found to exert a stable positive effect in every shrinkage category, indicating that savings—an important source of local capital accumulation—can support improvements in socioeconomic resilience even in shrinking regions. In contrast, fixed asset investment is generally associated with negative effects, suggesting that the prevailing investment structure is not well aligned with the practical requirements of enhancing regional socioeconomic resilience. Despite these commonalities, the magnitude of effects varied markedly by shrinkage type. In mildly shrinking counties, population density emerged as the most important driver, with a coefficient of 0.185, implying that agglomeration forces remain an important contributor to resilience. In moderately shrinking counties, population aging showed the strongest positive association (coefficient = 0.215), which may reflect relatively stable demographic structures in these areas, where the accumulated experience and social capital of older residents can contribute positively to development. In severely shrinking counties, however, population density exhibited the strongest negative effect, with a coefficient of −1.247, indicating that under conditions of pronounced depopulation, maintaining relatively high population density may become a burden rather than an advantage. Overall, mildly shrinking counties can still benefit from conventional agglomeration effects, with the combined influence of population density and household savings supporting resilience. Moderately shrinking counties display stronger adaptive capacity and may transform aging-related pressures into developmental momentum. In contrast, severely shrinking counties face the most acute challenges, where low effective density and inefficient investment are particularly prominent, and the effectiveness of traditional development pathways deteriorates sharply.
5. Discussion
5.1. Spatial Differentiation of County-Level Socioeconomic Resilience and Underlying Mechanisms
County-level socioeconomic resilience across Northeast China was found to exhibit a complex spatial pattern, evolving from a gradient of “higher in the north and lower in the south” to a configuration characterized by “higher in the northeast and lower in the southwest.” Border counties (e.g., Xunke and Raohe) generally maintain relatively higher levels of resilience, in sharp contrast to the comparatively lagging performance of some traditional industrial counties in central–southern Liaoning. This spatial differentiation is jointly shaped by historical path dependence, industrial structure, and policy responses. Border areas benefit from place-specific policy support—such as border-opening initiatives and ecological compensation—as well as from the relative stability of specialized sectors (e.g., agriculture/forestry and tourism), which partially buffer the shocks associated with population shrinkage. In contrast, parts of central–southern Liaoning remain constrained by the path-dependent “Northeast China phenomenon,” in which the decline of heavy and chemical industries, together with insufficient cultivation of new growth engines, has substantially weakened transformative capacity. The GTWR estimates further demonstrate pronounced spatial heterogeneity in the effects of population shrinkage and aging—together with fixed-asset investment and the urbanization rate—on socioeconomic resilience. This pattern substantiates the context-dependent and spatially non-stationary nature of regional resilience processes [16,22]. Population shrinkage undermines resilience primarily through labor-force depletion, market contraction, and intensifying fiscal stress, culminating in a “shrinkage trap” in counties experiencing severe outmigration [7]. By contrast, counties located near central cities or at border-port nodes tend to retain agglomeration advantages that buffer these adverse impacts, yielding a clear core–periphery gradient [33]. The influence of population aging is likewise spatially differentiated. Aging can constrain long-run transformative capacity by deteriorating the labour-force structure and increasing welfare burdens [1,16]. Nevertheless, core counties with stronger public service systems may partially offset these pressures through adaptive adjustments and the expansion of the silver economy [5]. In resource-dependent peripheral counties, however, vulnerability is further amplified as outmigration erodes intergenerational support networks [13]. Crucially, bidirectional feedback between shrinkage and aging reinforces these spatial disparities. In counties along the Harbin–Dalian railway corridor, where infrastructure endowments are relatively strong and locational advantages persist, fixed-asset investment and urbanization can still exert positive effects. In severely shrinking inland counties, by contrast, similar inputs exhibit markedly weaker returns and may even become counterproductive. These findings imply that resilience-oriented policies should adopt place-based, differentiated pathways rather than uniform, one-size-fits-all interventions.
5.2. Multidimensional Pathways Linking County-Level Demographic Structure and Socioeconomic Resilience
Evidence from the GRA and Tobit regression jointly suggests that population aging influences regional socioeconomic resilience through multiple pathways encompassing economic, social, and governance dimensions. Economically, aging is most strongly associated with transformation capacity, supporting the core mechanism whereby aging weakens long-term transformation potential by reducing labor supply and suppressing innovation dynamics [16]. Socially, aging intensifies pressure on social security systems and, through the outflow of working-age populations, erodes traditional intergenerational support networks that constitute a key foundation of social resilience [13]. Importantly, this study identified nonlinear effects of aging and heterogeneity across stages of population shrinkage. Population aging exerts significantly negative impacts in mildly and severely shrinking counties, but shows a positive effect in moderately shrinking counties. One plausible explanation is that under moderate shrinkage, demographic pressure may induce adaptive industrial restructuring [5] and stronger forms of social self-organization [15], thereby partially offsetting the disadvantages associated with aging. Once shrinkage surpasses a certain threshold, such as in severely shrinking counties, regions may lose this adaptive capacity and re-enter a negative feedback loop. Similar mechanisms have been widely documented across post-communist Eastern Europe. In many shrinking regions of Poland, Romania, and other post-socialist countries, the combination of population aging and sustained outmigration has aggravated a growing mismatch between rising demand for elderly care services and declining local fiscal capacity. This imbalance has consequently weakened regional adaptive and transformative capacity [32,53]. Empirical evidence from these contexts further indicates that once population decline surpasses a critical threshold, conventional development strategies become progressively less effective. Local communities then encounter increasing challenges in maintaining public service provision and sustaining social support networks [31]. These international experiences corroborate the stage-dependent heterogeneity identified in this study and underscore the need for differentiated, resilience-oriented governance pathways in response to demographic decline [54].
5.3. Policy Implications and Practical Pathways for County Development
Based on these findings, policy priorities should be differentiated according to the stage of population shrinkage. For counties trapped in a deep negative cycle characterized by “high aging–low socioeconomic resilience,” policy efforts should focus on social protection and the maintenance of basic functioning. This includes safeguarding essential public services through fiscal transfers, while enabling local social capital and community organizations to maintain stable social networks. For moderately shrinking counties that exhibit adaptive potential, policy should emphasize industrial cultivation and structural upgrading, encouraging the development of aging-friendly sectors such as the silver economy, ecological agriculture, and local service industries. Meanwhile, fixed asset investment should be redirected away from scale expansion toward efficiency enhancement and livelihood improvement. Finally, for the small number of border or specialized counties with relatively high resilience, policy should aim to foster them as regional “resilience growth poles,” leveraging their spillover and driving effects to mitigate broader regional declines in resilience. Overall, policy interventions should be oriented toward breaking the vicious cycle of “population shrinkage–aging–resilience weakening” and promoting synergistic improvements in both social and economic resilience.
5.4. Study Limitations and Future Directions for County-Level Research
This study has several limitations. First, the analysis is conducted primarily at the county (macro) scale, which enables the identification of broad associations and potential mechanisms but does not directly capture the behavioral decision-making of micro-level actors (e.g., households and firms). As a result, the underlying drivers of resilience formation cannot be fully established. Second, the indicator system is not explicitly tailored to regional development characteristics, which may constrain the interpretability of resilience comparisons across heterogeneous contexts. Future research could strengthen and extend this work in at least three directions: (1) Develop a more fine-grained measurement framework for socioeconomic resilience that integrates objective and subjective indicators, and incorporates policy-related variables to more explicitly assess how policy and institutional arrangements shape resilience outcomes. (2) Combine qualitative approaches (e.g., interviews, case studies) and survey-based evidence to examine, from a micro perspective, the adaptive strategies of individuals and communities under demographic change and their contributions to regional resilience. (3) Expand the empirical scope to other representative shrinking regions across China for comparative analysis, thereby testing the generalizability of the findings and further identifying place-specific pathways for enhancing socioeconomic resilience under diverse regional conditions.
6. Conclusions
To systematically evaluate how population aging shapes regional socioeconomic resilience under population shrinkage, this study introduced resilience theory into the shrinking population literature and proposed a triadic “population shrinkage–aging–socioeconomic resilience” analytical framework. Using 143 counties in the three northeastern provinces of Northeast China as the empirical context, and integrating the entropy-weight method, GRA, Tobit regression, and GTWR, the spatiotemporal interactive relationships between demographic structural change and socioeconomic resilience were revealed. The main conclusions are as follows.
Counties in Northeast China are characterized by the simultaneous occurrence of region-wide population shrinkage and deep aging, together forming a pronounced negative feedback loop. During 2010–2020, all counties except Yanji experienced population decline, and counties with moderate or higher levels of shrinkage accounted for as much as 75.5%. Meanwhile, population aging accelerated rapidly: by 2020, 96.5% of counties had entered the deep-aging stage. Although socioeconomic resilience increased overall, substantial regional heterogeneity persisted, with the spatial pattern evolving from “higher in the north and lower in the south” to “higher in the northeast and lower in the southwest”. Relative to the three northeastern provinces, where both population shrinkage and aging are markedly more severe, partially shrinking counties in the Yangtze River Delta tend to exhibit more localized population decline, while aging follows a differentiated trajectory rather than a uniform, synchronous intensification. Resource-rich regions in central and western China are also prone to the compounded pressures of outmigration and aging; however, the magnitude of shrinkage and aging there remains substantially lower than that observed in the Northeast. Together, these cross-regional contrasts further accentuate the distinctive demographic profile of the three northeastern provinces as the focal study area.
GRA further revealed strong associations between population aging and overall socioeconomic resilience as well as all resilience dimensions, with the strongest association observed for transformative capacity, particularly in severely shrinking counties. Population density was also found to be strongly associated with socioeconomic resilience, although its influence was slightly weaker than that of aging.
The effects of determinants on socioeconomic resilience are complex. Tobit estimation results indicated that population density and household savings promote socioeconomic resilience, whereas population aging, fixed asset investment, per capita carbon emissions, the urbanization rate, and PM2.5 concentration exhibit negative or nonlinear effects. Population density was found to remain significantly positive across shrinkage types, but its effect diminished as shrinkage deepened. The impact of aging was found to be nonlinear and to vary by shrinkage stage: it was significantly negative in mildly and severely shrinking counties but shifted from negative to positive in moderately shrinking counties, demonstrating pronounced stage-dependent heterogeneity.
The GTWR results confirmed substantial spatiotemporal heterogeneity in the effects of influencing factors. Counties at different shrinkage stages respond differently to key drivers: mildly shrinking counties can still benefit from conventional agglomeration effects; moderately shrinking counties display stronger adaptive capacity, transforming part of the demographic pressure into developmental momentum; while severely shrinking counties face the most severe challenges, with the effectiveness of traditional development pathways deteriorating sharply.
Author Contributions
Conceptualization, D.L. and Y.Z.; methodology, D.L.; software, D.L.; validation, D.L., Y.Z. and X.W.; formal analysis, D.L.; investigation, D.L.; resources, D.L.; data curation, D.L.; writing—original draft preparation, D.L.; writing—review and editing, D.L.; visualization, D.L.; supervision, D.L.; project administration, D.L.; funding acquisition, Y.Z. All authors have read and agreed to the published version of the manuscript.
Funding
This work was supported by National Social Science Fund of China (16BJY039), Natural Science Foundation of Heilongjiang Province (D2018003).
Institutional Review Board Statement
Not applicable.
Informed Consent Statement
Not applicable.
Data Availability Statement
The data presented in this study are openly available in: the China County Statistical Year-book, Hei-long jiang Province County Statistical Yearbook, Liaoning Province County Statistical Yearbook, and Jilin Province County Statistical Yearbook. Carbon dioxide emissions data were derived from the Global Atmospheric Research Emissions Data-base (EDGAR) (https://edgar.jrc.ec.europa.eu/emissions_data_and_maps). Using R(4.5.0) software, the original gridded data were converted into raster format and then aggregated by administrative unit to obtain county-level carbon emissions data. NDVI data were sourced from the MODIS-NDVI (MOD13A3) dataset released by NASA (https://ladsweb.modaps.eosdis.nasa.gov/search/), with a spatial resolution of 1000 m.
Conflicts of Interest
The authors declare no conflicts of interest.
Correction Statement
This article has been republished with a minor correction to the image quality of Figure 9. This change does not affect the scientific content of the article.
References
- Heller, P.S. The challenge of an aged and shrinking population: Lessons to be drawn from Japan’s experience. J. Econ. Ageing 2016, 8, 85–93. [Google Scholar] [CrossRef] [Scilit]
- Yang, Y.; Dolega, L.; Darlington-Pollock, F. Ageing in Place Classification: Creating a geodemographic classification for the ageing population in England. Appl. Spat. Anal. Policy 2023, 16, 583–623. [Google Scholar] [CrossRef] [Scilit] [PubMed]
- Gutiérrez Posada, D.; Rubiera Morollón, F.; Viñuela, A. Ageing places in an ageing country: The local dynamics of the elderly population in Spain. Tijdschr. Econ. Soc. Geogr. 2018, 109, 332–349. [Google Scholar] [CrossRef] [Scilit]
- Peng, W.; Fan, Z.; Duan, J.; Gao, W.J.; Wang, R.; Liu, N.; Li, Y.G.; Hua, S.E. Assessment of interactions between influencing factors on city shrinkage based on geographical detector: A case study in Kitakyushu, Japan. Cities 2022, 131, 103958. [Google Scholar] [CrossRef] [Scilit]
- He, X.; Gao, W.; Guan, D.; Zhou, L. Nonlinear mechanisms of CO2 emissions in growing and shrinking cities: An empirical study on integrated effects of aging and industrial structure in Japan. J. Clean. Prod. 2024, 462, 142665. [Google Scholar] [CrossRef] [Scilit]
- Marini, L.; Batáry, P.; Carmenta, R.; Gaston, K.J.; Gordon, R.; Macinnis-Ng, C.; Mori, A.S.; Nuñez, M.; Barlow, J. Ecology and conservation under ageing and declining human populations. J. Appl. Ecol. 2024, 61, 1982–1988. [Google Scholar] [CrossRef] [Scilit]
- Carbonaro, G.; Leanza, E.; McCann, P.; Francesca, M. Demographic decline, population aging, and modern financial approaches to urban policy. Int. Reg. Sci. Rev. 2018, 41, 210–232. [Google Scholar] [CrossRef] [Scilit]
- Maestas, N.; Mullen, K.J.; Powell, D. The Effect of Population Aging on Economic Growth, the Labor Force, and Productivity. Am. Econ. J. Macroecon. 2023, 15, 306–332. [Google Scholar] [CrossRef] [Scilit]
- Anthopoulou, T.; Partalidou, M.; Nikolaidou, S.; Stamatopoulou, G. Poverty and housing precariousness in rural areas under the lens of social resilience. Revealing societal implications of lived experiences of rural poverty. Soc. Impacts 2025, 6, 100119. [Google Scholar] [CrossRef] [Scilit]
- Aulino, F. Narrating the future: Population aging and the demographic imaginary in Thailand. Med. Anthropol. 2017, 36, 319–331. [Google Scholar] [CrossRef] [Scilit]
- Reynaud, C.; Miccoli, S. Depopulation and the aging population: The relationship in Italian municipalities. Sustainability 2018, 10, 1004. [Google Scholar] [CrossRef] [Scilit]
- Hauer, M.E.; Jacobs, S.A.; Kulp, S.A. Climate migration amplifies demographic change and population aging. Proc. Natl. Acad. Sci. USA 2024, 121, e2206192119. [Google Scholar] [CrossRef] [Scilit] [PubMed]
- Wu, F. Intergenerational support and life satisfaction of older parents in China: A rural–urban divide. Soc. Indic. Res. 2022, 160, 1071–1098. [Google Scholar] [CrossRef] [Scilit]
- Li, Y.H.; Huang, H.Q.; Song, C.Y. Rural resilience in impoverished areas of southwest China: A case study of chongqing. Hum. Geogr. 2022, 37, 97–105. (In Chinese) [Google Scholar] [CrossRef]
- Dagdeviren, H.; Capucha, L.; Calado, A.; Donoghue, M.; Estêvão, P. Structural foundations of social resilience. Soc. Policy Soc. 2020, 19, 539–552. [Google Scholar] [CrossRef] [Scilit]
- Martin, R.; Sunley, P.; Gardiner, B.; Tyler, P. How regions react to recessions: Resilience and the role of economic structure. Reg. Stud. 2016, 50, 561–585. [Google Scholar] [CrossRef] [Scilit]
- Sakdapolrak, P.; Sterly, H.; Borderon, M.; Bunchuay-Peth, S.; Naruchaikusol, S.; Ober, K.; Porst, L.; Rockenbauch, T. Translocal social resilience dimensions of migration as adaptation to environmental change. Proc. Natl. Acad. Sci. USA 2024, 121, e2206185120. [Google Scholar] [CrossRef] [Scilit]
- Huang, X. Immigration and economic resilience in the Great Recession. Urban Stud. 2021, 58, 1885–1905. [Google Scholar] [CrossRef] [Scilit]
- Meerow, S.; Newell, J.P.; Stults, M. Defining urban resilience: A review. Landsc. Urban Plan. 2016, 147, 38–49. [Google Scholar] [CrossRef] [Scilit]
- Rose, A. Defining and measuring economic resilience to disasters. Disaster Prev. Manag. 2004, 13, 307–314. [Google Scholar] [CrossRef] [Scilit]
- Lin, Y.; Peng, C.; Chen, P.; Zhang, M. Conflict or synergy? Analysis of economic-social-infrastructure-ecological resilience and their coupling coordination in the Yangtze River economic Belt, China. Ecol. Indic. 2022, 142, 109194. [Google Scholar] [CrossRef] [Scilit]
- Boschma, R. Towards an evolutionary perspective on regional resilience. Reg. Stud. 2015, 49, 733–751. [Google Scholar] [CrossRef] [Scilit]
- Brown, L.; Greenbaum, R.T. The role of industrial diversity in economic resilience: An empirical examination across 35 years. Urban Stud. 2017, 54, 1347–1366. [Google Scholar] [CrossRef] [Scilit]
- Hundt, C.; Holtermann, L. The role of national settings in the economic resilience of regions—Evidence from recessionary shocks in Europe from 1990 to 2014. Growth Change 2020, 51, 180–206. [Google Scholar] [CrossRef] [Scilit]
- Song, G.; Peng, C.; Tang, C.; Song, L. Multiscale study on differences in regional economic resilience in China. Environ. Dev. Sustain. 2024, 26, 29021–29055. [Google Scholar] [CrossRef] [Scilit]
- Pavel, A.; Moldovan, B.A.; Kourtit, K.; Nijkamp, P. Urban or rural: Does it make a difference for economic resilience? A modelling study on economic and cultural geography in Romania. Sustainability 2020, 12, 3776. [Google Scholar] [CrossRef] [Scilit]
- Howard, G.; Weinstein, R.; Yang, Y. Do universities improve local economic resilience? Rev. Econ. Stat. 2024, 106, 1129–1145. [Google Scholar] [CrossRef] [Scilit]
- Bristow, G.; Healy, A. Innovation and regional economic resilience: An exploratory analysis. Ann. Reg. Sci. 2018, 60, 265–284. [Google Scholar] [CrossRef] [Scilit]
- Kharel, R.; Rodríguez-Pose, A. Devolution and economic resilience in Nepal. World Dev. 2025, 195, 107154. [Google Scholar] [CrossRef] [Scilit]
- Azad, M.J.; Pritchard, B. Financial capital as a shaper of households’ adaptive capabilities to flood risk in northern Bangladesh. Ecol. Econ. 2022, 195, 107381. [Google Scholar] [CrossRef] [Scilit]
- Mykhnenko, V.; Turok, I. East European Cities—Patterns of Growth and Decline, 1960–2005. Int. Plan. Stud. 2008, 13, 311–342. [Google Scholar] [CrossRef] [Scilit]
- Hospers, G.-J. Coping with shrinkage in Europe’s cities and towns. Urban Des. Int. 2013, 18, 78–89. [Google Scholar] [CrossRef] [Scilit]
- Haase, A.; Rink, D.; Grossmann, K. Shrinking cities in post-socialist Europe: What can we learn from their analysis for theory building today? Geogr. Ann. Ser. B Hum. Geogr. 2016, 98, 305–319. [Google Scholar] [CrossRef] [Scilit]
- Giannakis, E.; Papadas, C.T. Spatial connectivity and regional economic resilience in turbulent times. Sustainability 2021, 13, 11289. [Google Scholar] [CrossRef] [Scilit]
- Ye, C.S.; Hu, M.S.; Lu, L.; Dong, Q.; Gu, M.L. Spatio-temporal evolution and factor explanatory power analysis of urban resilience in the Yangtze River Economic Belt. Geogr. Sustain. 2022, 3, 299–311. [Google Scholar] [CrossRef] [Scilit]
- McManus, P.; Walmsley, J.; Argent, N.; Baum, S.; Bourke, L.; Martin, J.; Pritchard, B.; Sorensen, T. Rural Community and Rural Resilience: What is important to farmers in keeping their country towns alive? J. Rural Stud. 2012, 28, 20–29. [Google Scholar] [CrossRef] [Scilit]
- Scott, M. Resilience: A conceptual lens for rural studies? Geogr. Compass 2013, 7, 597–610. [Google Scholar] [CrossRef] [Scilit]
- Li, Y.; Song, C.; Huang, H. Rural resilience in China and key restriction factor detection. Sustainability 2021, 13, 1080. [Google Scholar] [CrossRef] [Scilit]
- Hoggart, K.; Paniagua, A. What rural restructuring? J. Rural Stud. 2001, 17, 41–62. [Google Scholar] [CrossRef] [Scilit]
- Keck, M.; Sakdapolrak, P. What is social resilience? Lessons learned and ways forward. Erdkunde 2013, 67, 5–19. [Google Scholar] [CrossRef] [Scilit]
- Maclean, K.; Cuthill, M.; Ross, H. Six attributes of social resilience. J. Environ. Plan. Manag. 2014, 57, 144–156. [Google Scholar] [CrossRef] [Scilit]
- Cubeddu, F.; Martini, E. Resilience and adaptive capacities of societies: Social and cultural strategies. Front. Sociol. 2025, 10, 1581631. [Google Scholar] [CrossRef] [Scilit]
- Aslam Saja, A.M.; Teo, M.; Goonetilleke, A.; Ziyath, A.M. An inclusive and adaptive framework for measuring social resilience to disasters. Int. J. Disaster Risk Reduct. 2018, 28, 862–873. [Google Scholar] [CrossRef] [Scilit]
- Copeland, S.; Comes, T.; Bach, S.; Nagenborg, M.; Schulte, Y.; Doorn, N. Measuring social resilience: Trade-offs, challenges and opportunities for indicator models in transforming societies. Int. J. Disaster Risk Reduct. 2020, 51, 101799. [Google Scholar] [CrossRef] [Scilit]
- Di Caro, P.; Fratesi, U. Regional determinants of economic resilience. Ann. Reg. Sci. 2018, 60, 235–240. [Google Scholar] [CrossRef] [Scilit]
- Östh, J.; Reggiani, A.; Galiazzo, G. Spatial economic resilience and accessibility: A joint perspective. Comput. Environ. Urban Syst. 2015, 49, 148–159. [Google Scholar] [CrossRef] [Scilit]
- Fekete, A.; Matos, J.C.; Teixeira, E.R. Social resilience assessment for urban fires in Guimaraes historic center. Int. J. Disaster Risk Reduct. 2025, 117, 105131. [Google Scholar] [CrossRef] [Scilit]
- Tan, J.; Zhang, P.; Lo, K.; Li, J.; Liu, S. Conceptualizing and measuring economic resilience of resource-based cities: Case study of Northeast China. Chin. Geogr. Sci. 2017, 27, 471–481. (In Chinese) [Google Scholar] [CrossRef] [Scilit]
- Li, S.Y.; Dong, W.Z.; Su, W.C.; Liu, D.; Chen, Y. Spatial-temporal pattern of rural system urbanization resilience in Chongqing at the county level. Econ. Geogr. 2025, 45, 67–76. [Google Scholar] [CrossRef]
- Ding, H.C.; Lian, M.R.; Chen, X.Y.; Liu, J.M.; Zhong, Z.C.; Zhang, Y.F.; Zhou, M.Y. Research on the correlation of port logistics and regional economic growth base on gray relational analysis method. Concurr. Comput. Pract. Exper. 2019, 31, e4744. (In Chinese) [Google Scholar] [CrossRef] [Scilit]
- Li, J.; Fu, G.; Zhao, X. Urban Economic Resilience and Supply Chain Dynamics: Evaluating Monetary Recovery Policies in Global Cities during the Early COVID-19 Pandemic. Mathematics 2024, 12, 673. [Google Scholar] [CrossRef] [Scilit]
- Ma, W.; Tian, W.; Zhou, Q.; Miao, Q. Analysis on the temporal and spatial heterogeneity of factors affecting urbanization development based on the GTWR Model: Evidence from the Yangtze River Economic Belt. Complexity 2021, 2021, 7557346. [Google Scholar] [CrossRef] [Scilit]
- Stryjakiewicz, T.; Jaroszewska, E. Shrinking cities in Poland—Recent trends of change and emerging policy responses. In Postsocialist Shrinking Cities; Routledge: Abingdon, UK, 2022; pp. 256–275. [Google Scholar] [CrossRef] [Scilit]
- Haase, A.; Bernt, M.; Großmann, K.; Mykhnenko, V.; Rink, D. Varieties of shrinkage in European cities. Eur. Urban Reg. Stud. 2016, 23, 86–102. [Google Scholar] [CrossRef] [Scilit]
- Yan, D.; Sun, W.; Sun, X. Spatiotemporal evolution of population patterns and driving factors in the Yangtze River Delta. Sci. Geogr. Sin. 2020, 40, 1285–1292. (In Chinese) [Google Scholar] [CrossRef]
- Zhou, Z.; Han, H.; Yang, C. Spatio-temporal Evolution Characteristics and Impact Mechanism of Population Aging in the Yangtze River Delta Urban Agglomeration at the County Level. Econ. Geogr. 2024, 44, 90–101. (In Chinese) [Google Scholar] [CrossRef]
- Zhang, H.; Yang, Q. Characteristics of “population–land–industry” coordinated development of resource-based shrinking cities in China. World Reg. Stud. 2024, 33, 163–177. (In Chinese) [Google Scholar] [CrossRef]
- Fotheringham, A.S.; Yang, W.; Kang, W. Multiscale geographically weighted regression (MGWR). Ann. Am. Assoc. Geogr. 2017, 107, 1247–1265. [Google Scholar] [CrossRef] [Scilit]
- Golding, N. Greta: Simple and scalable statistical modelling in R. J. Open Source Softw. 2019, 4, 1601. [Google Scholar] [CrossRef] [Scilit]
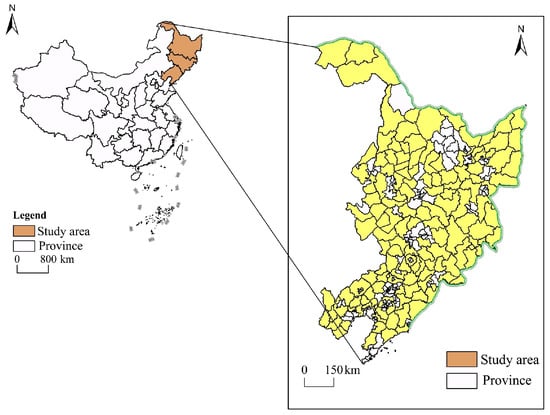
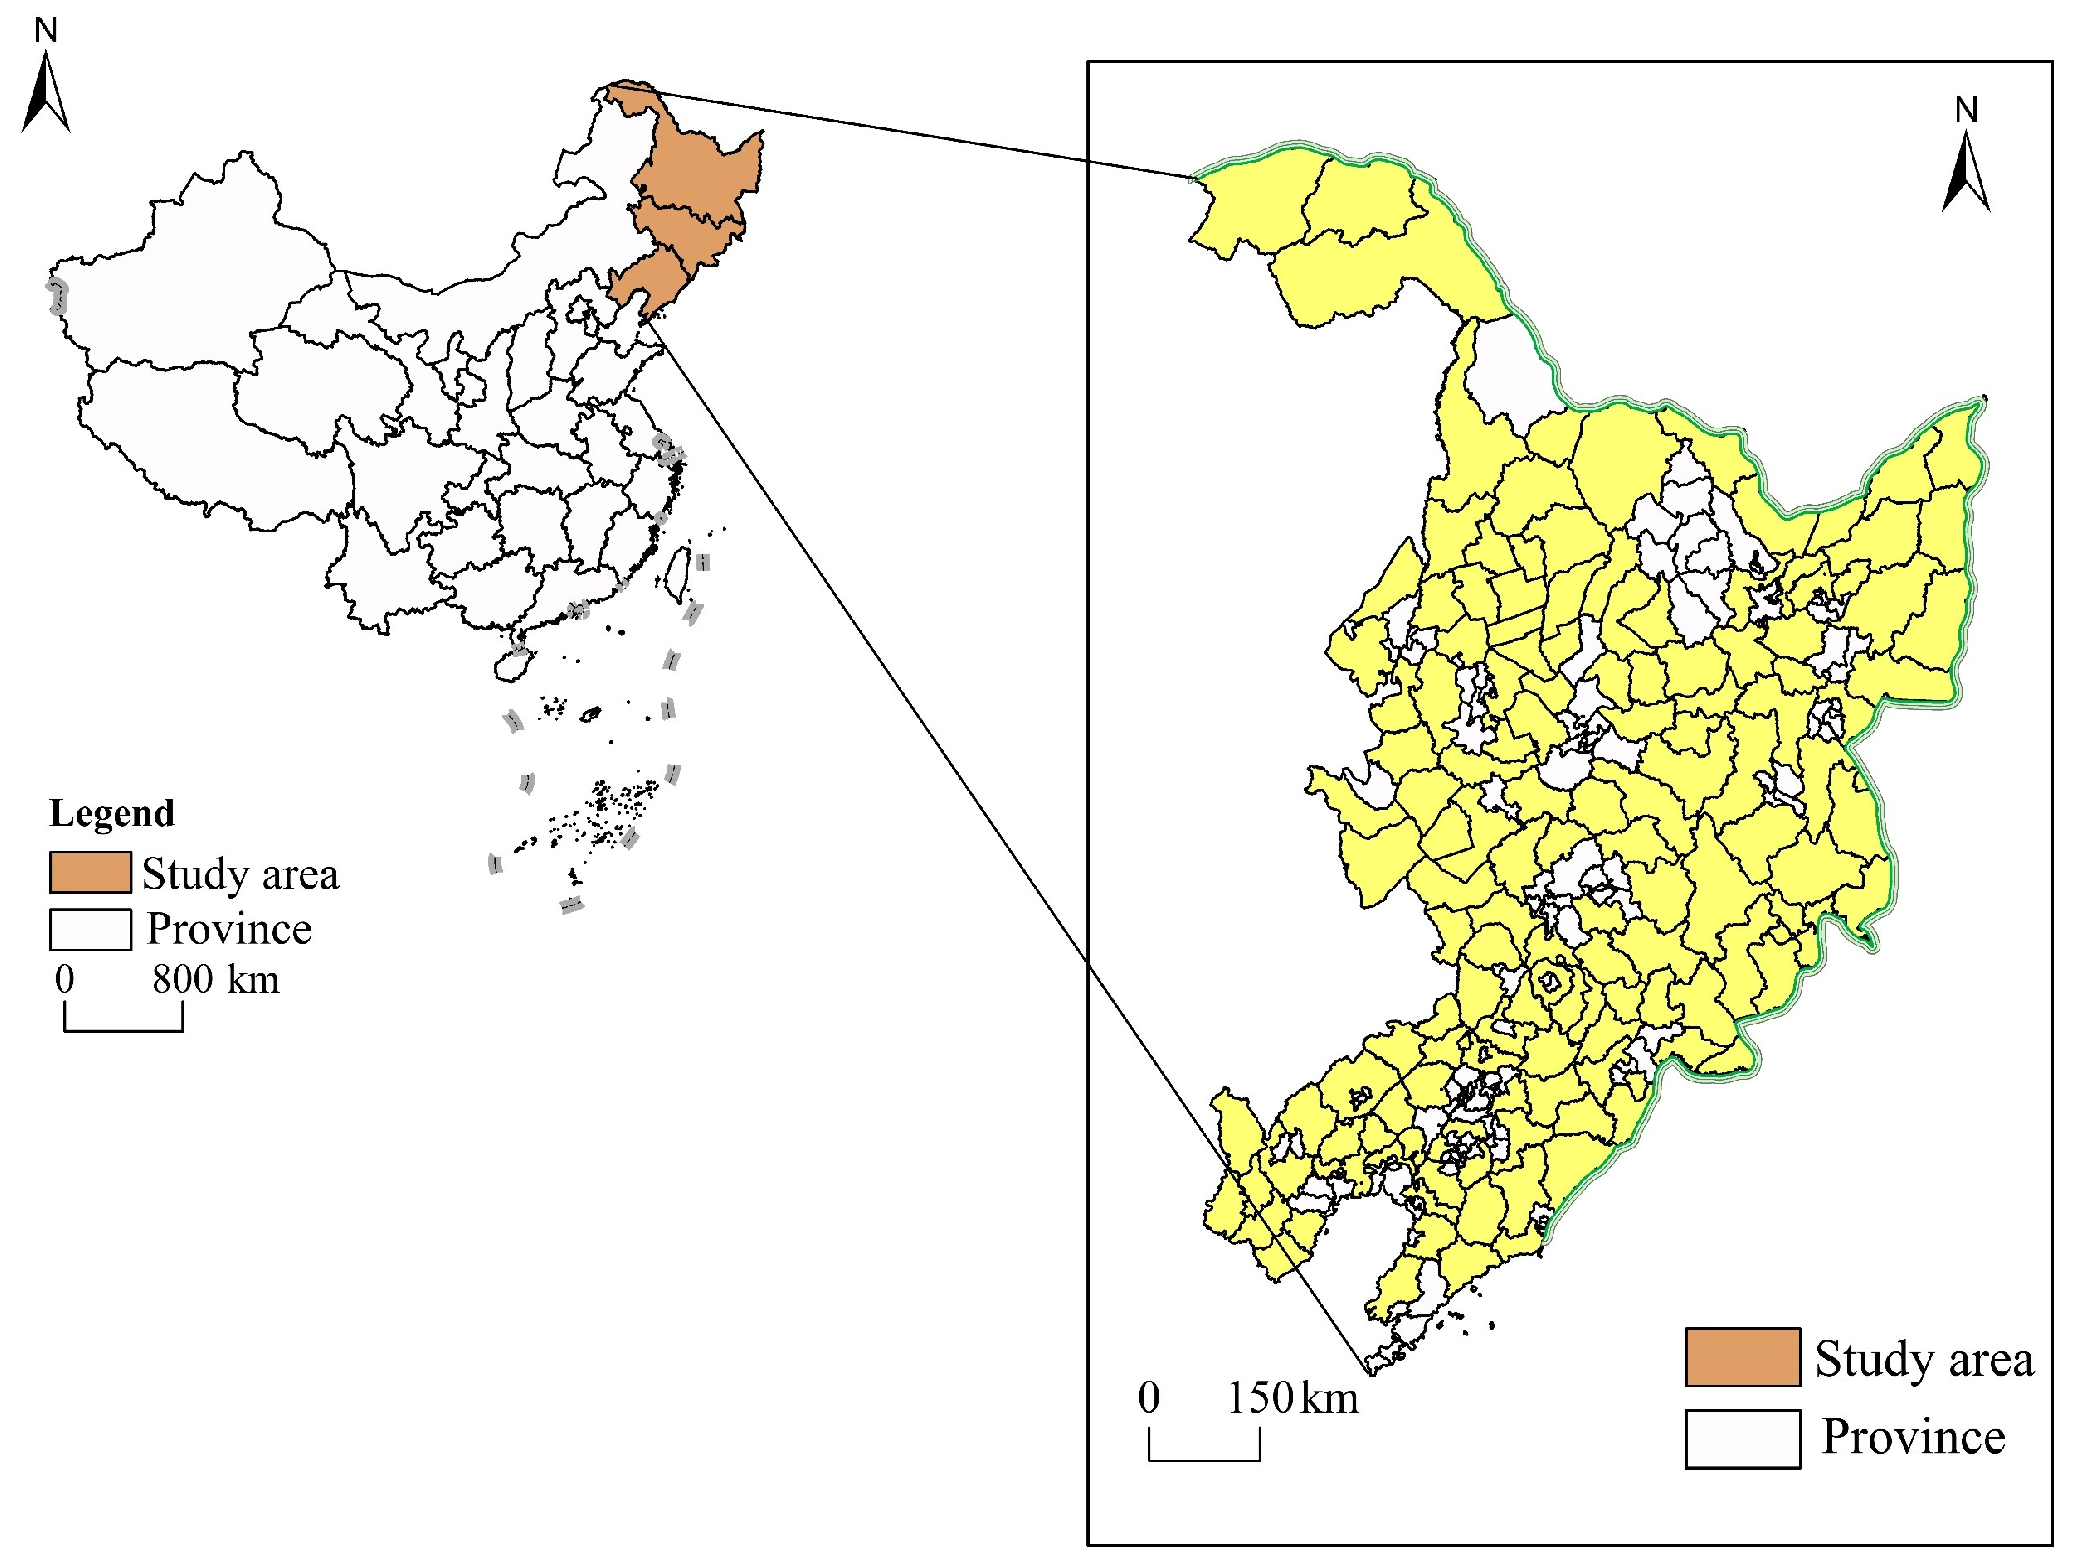
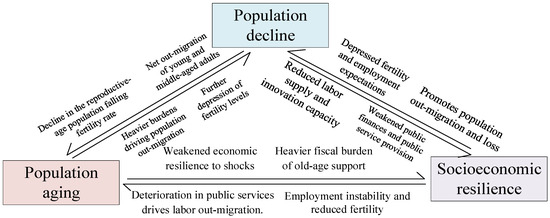
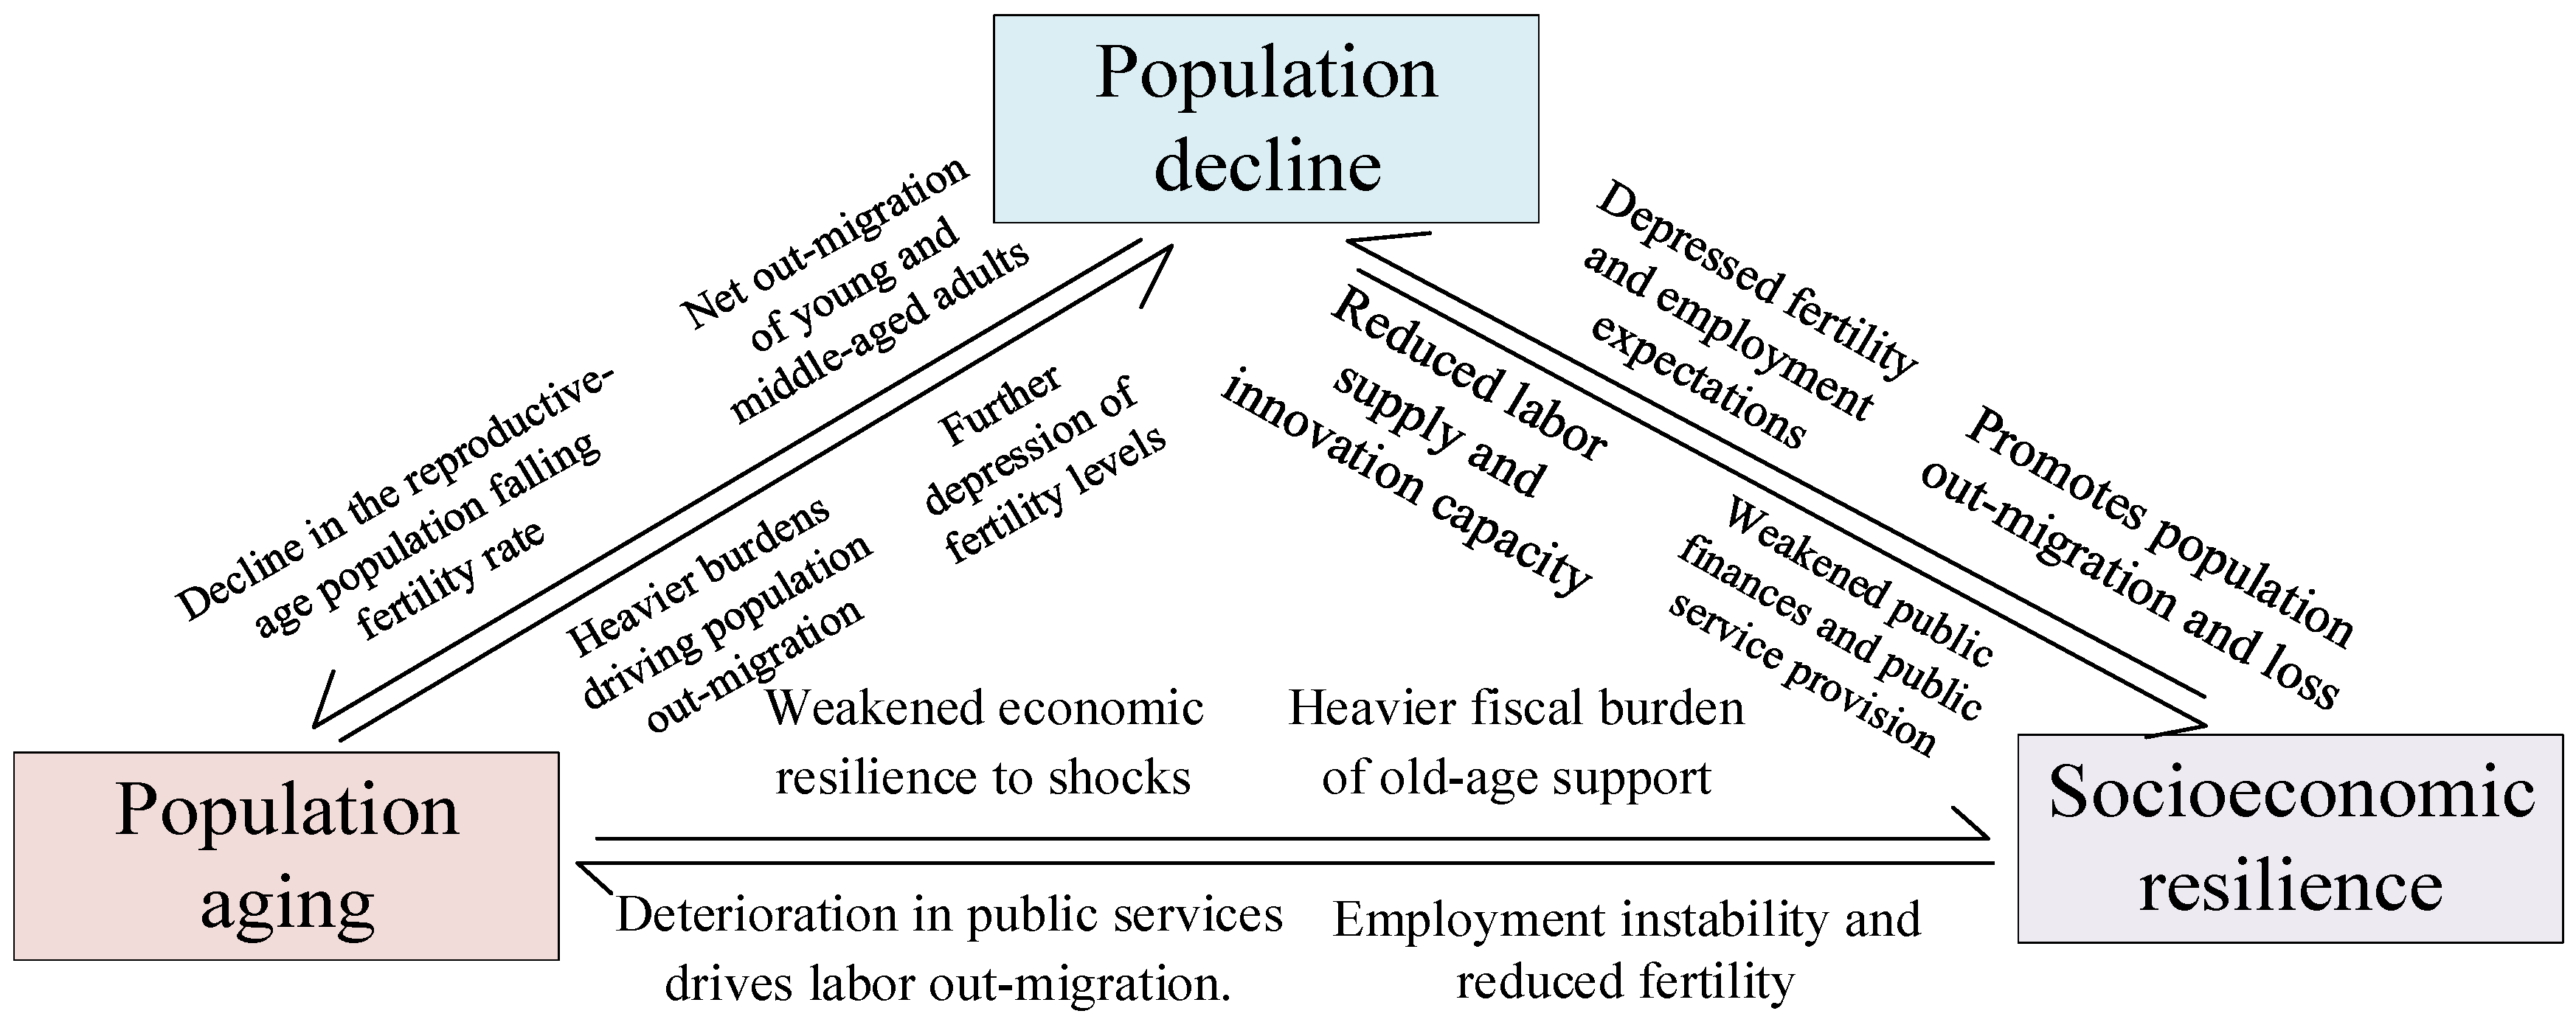
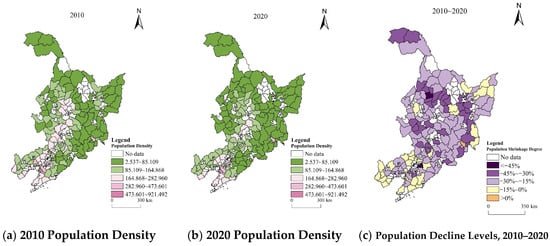
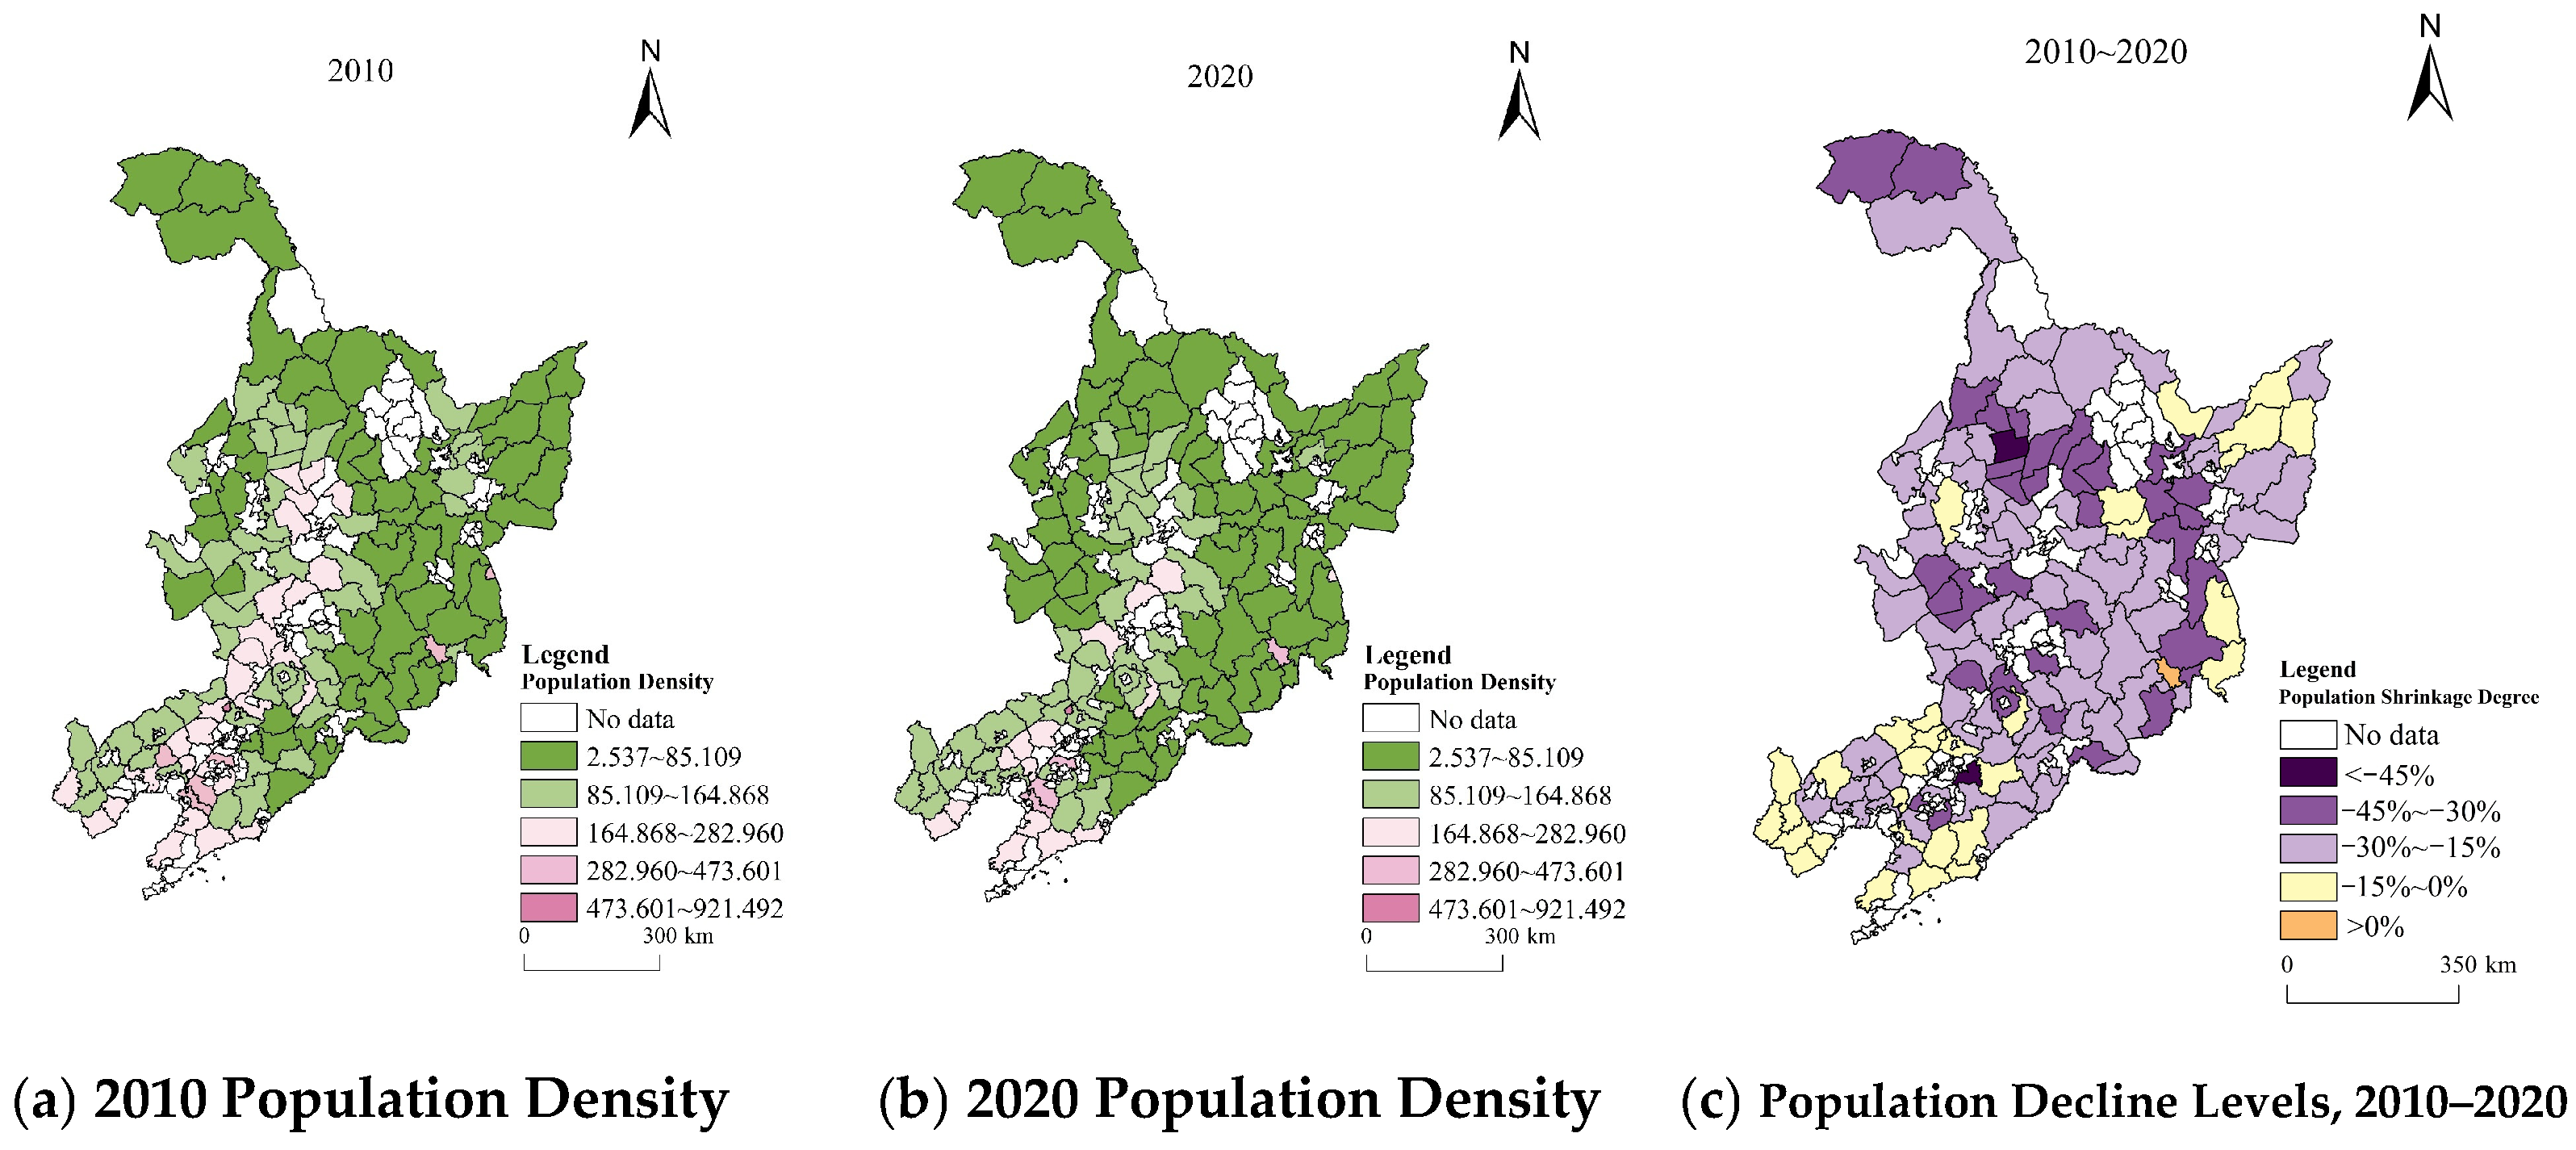
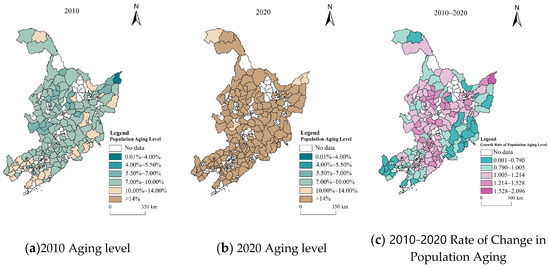
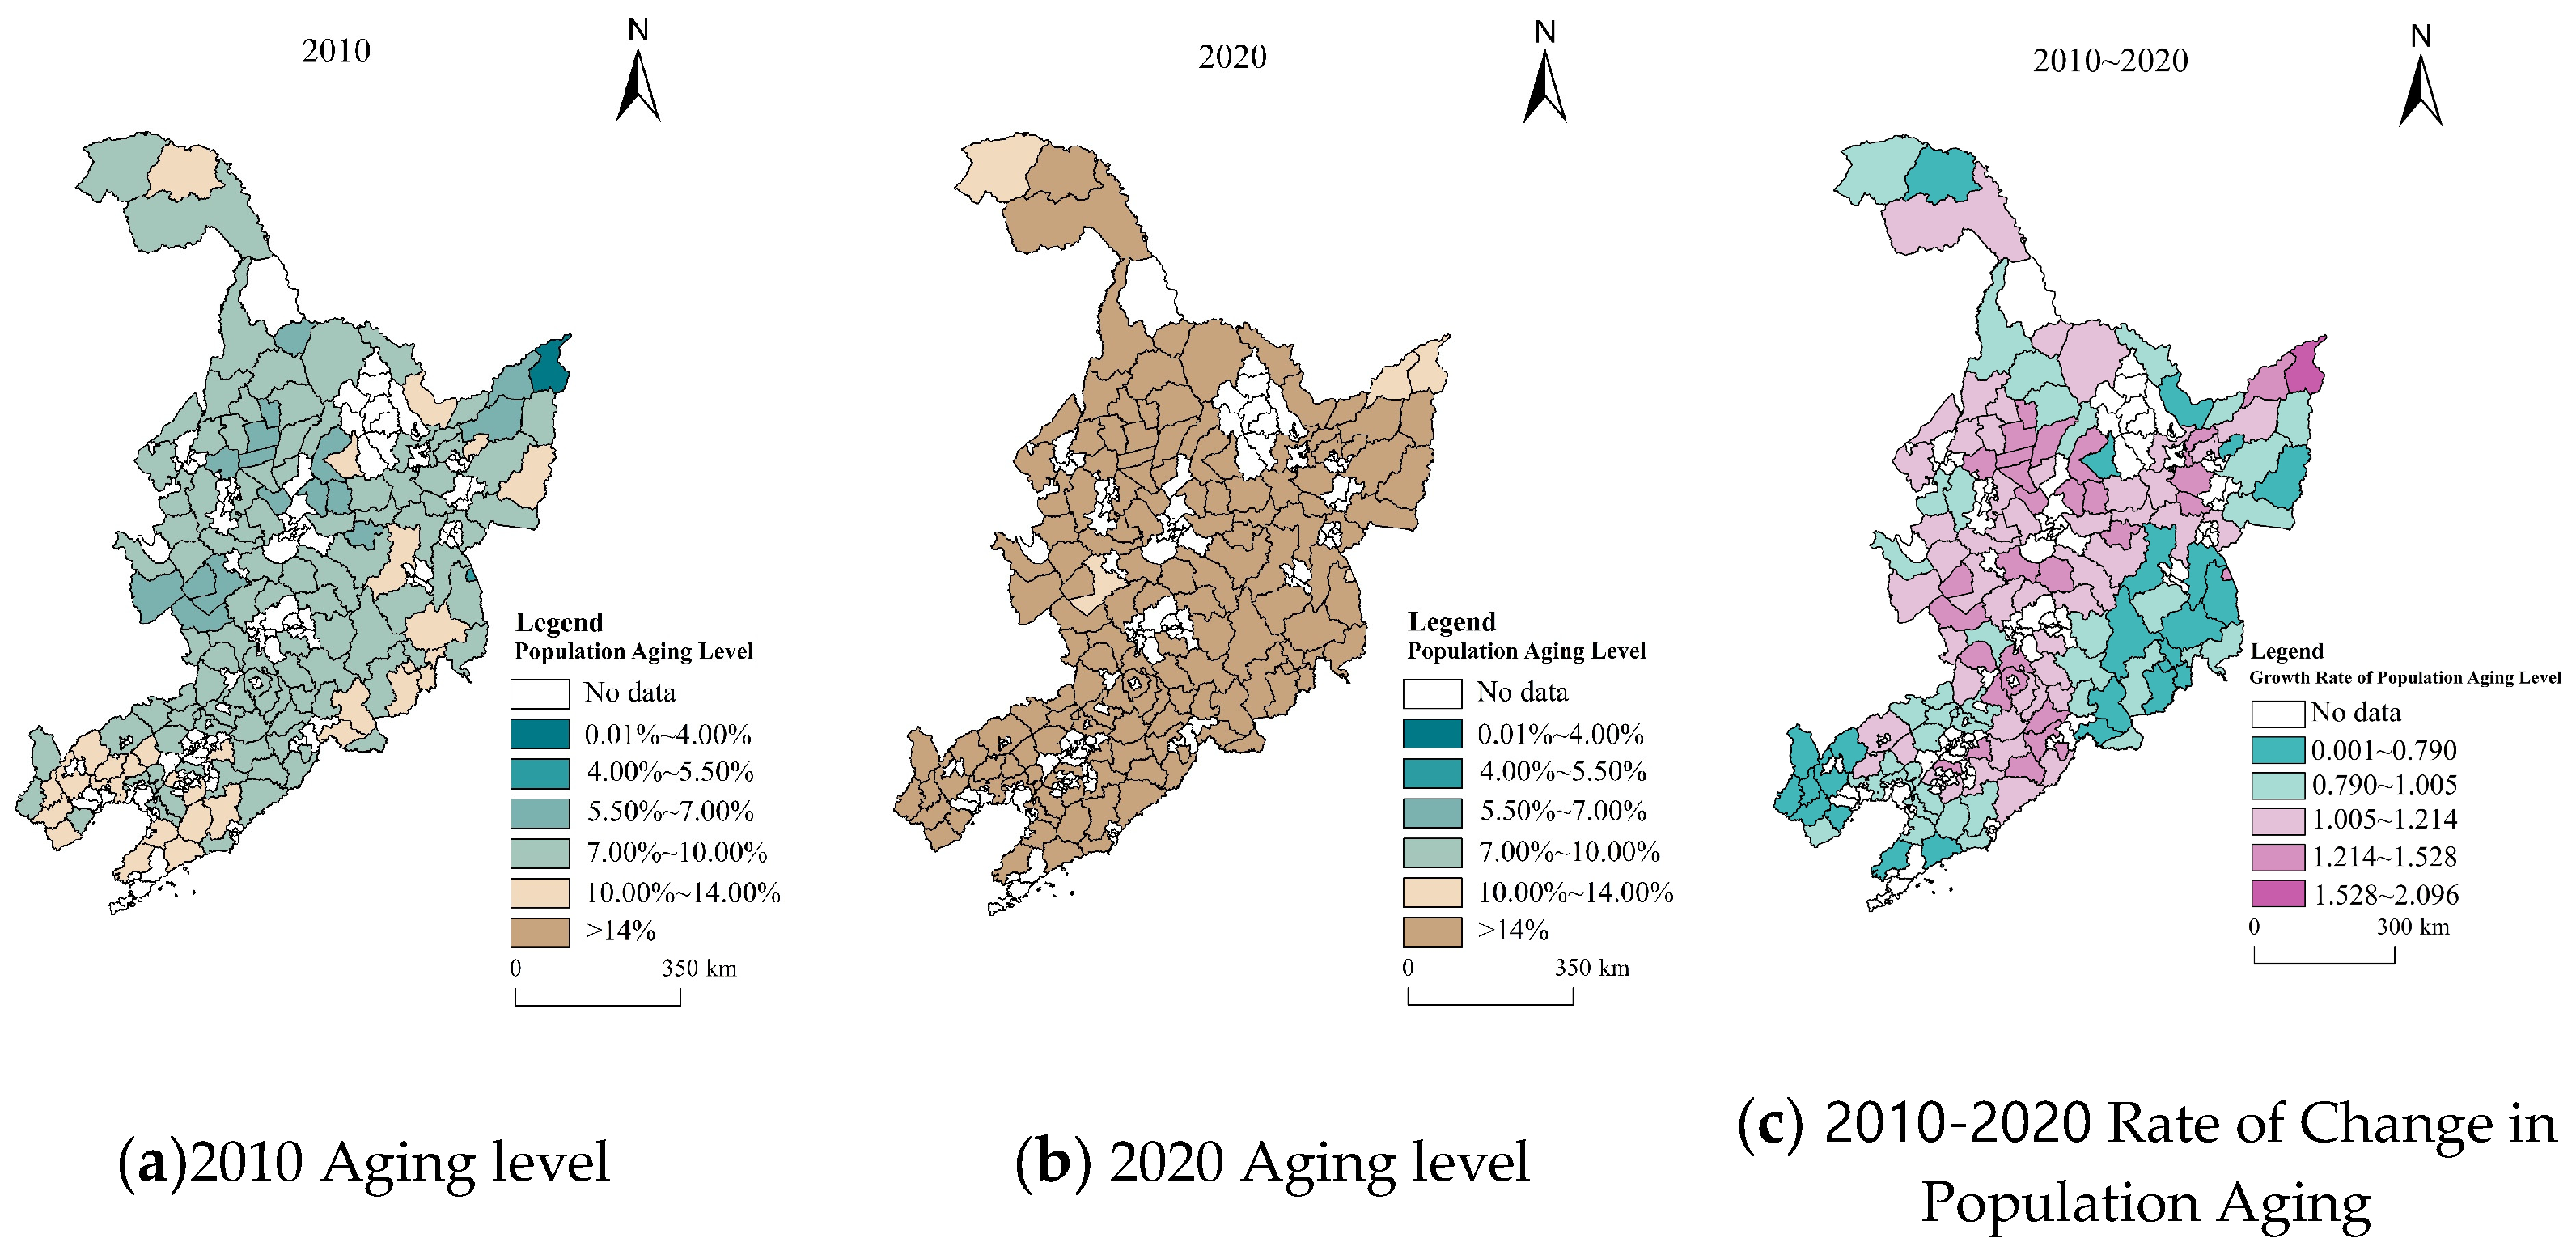
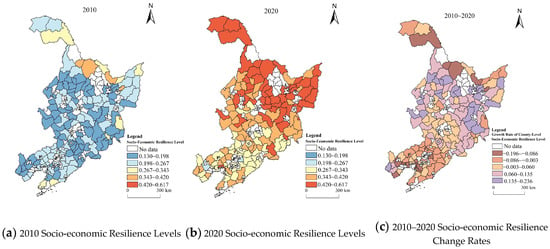
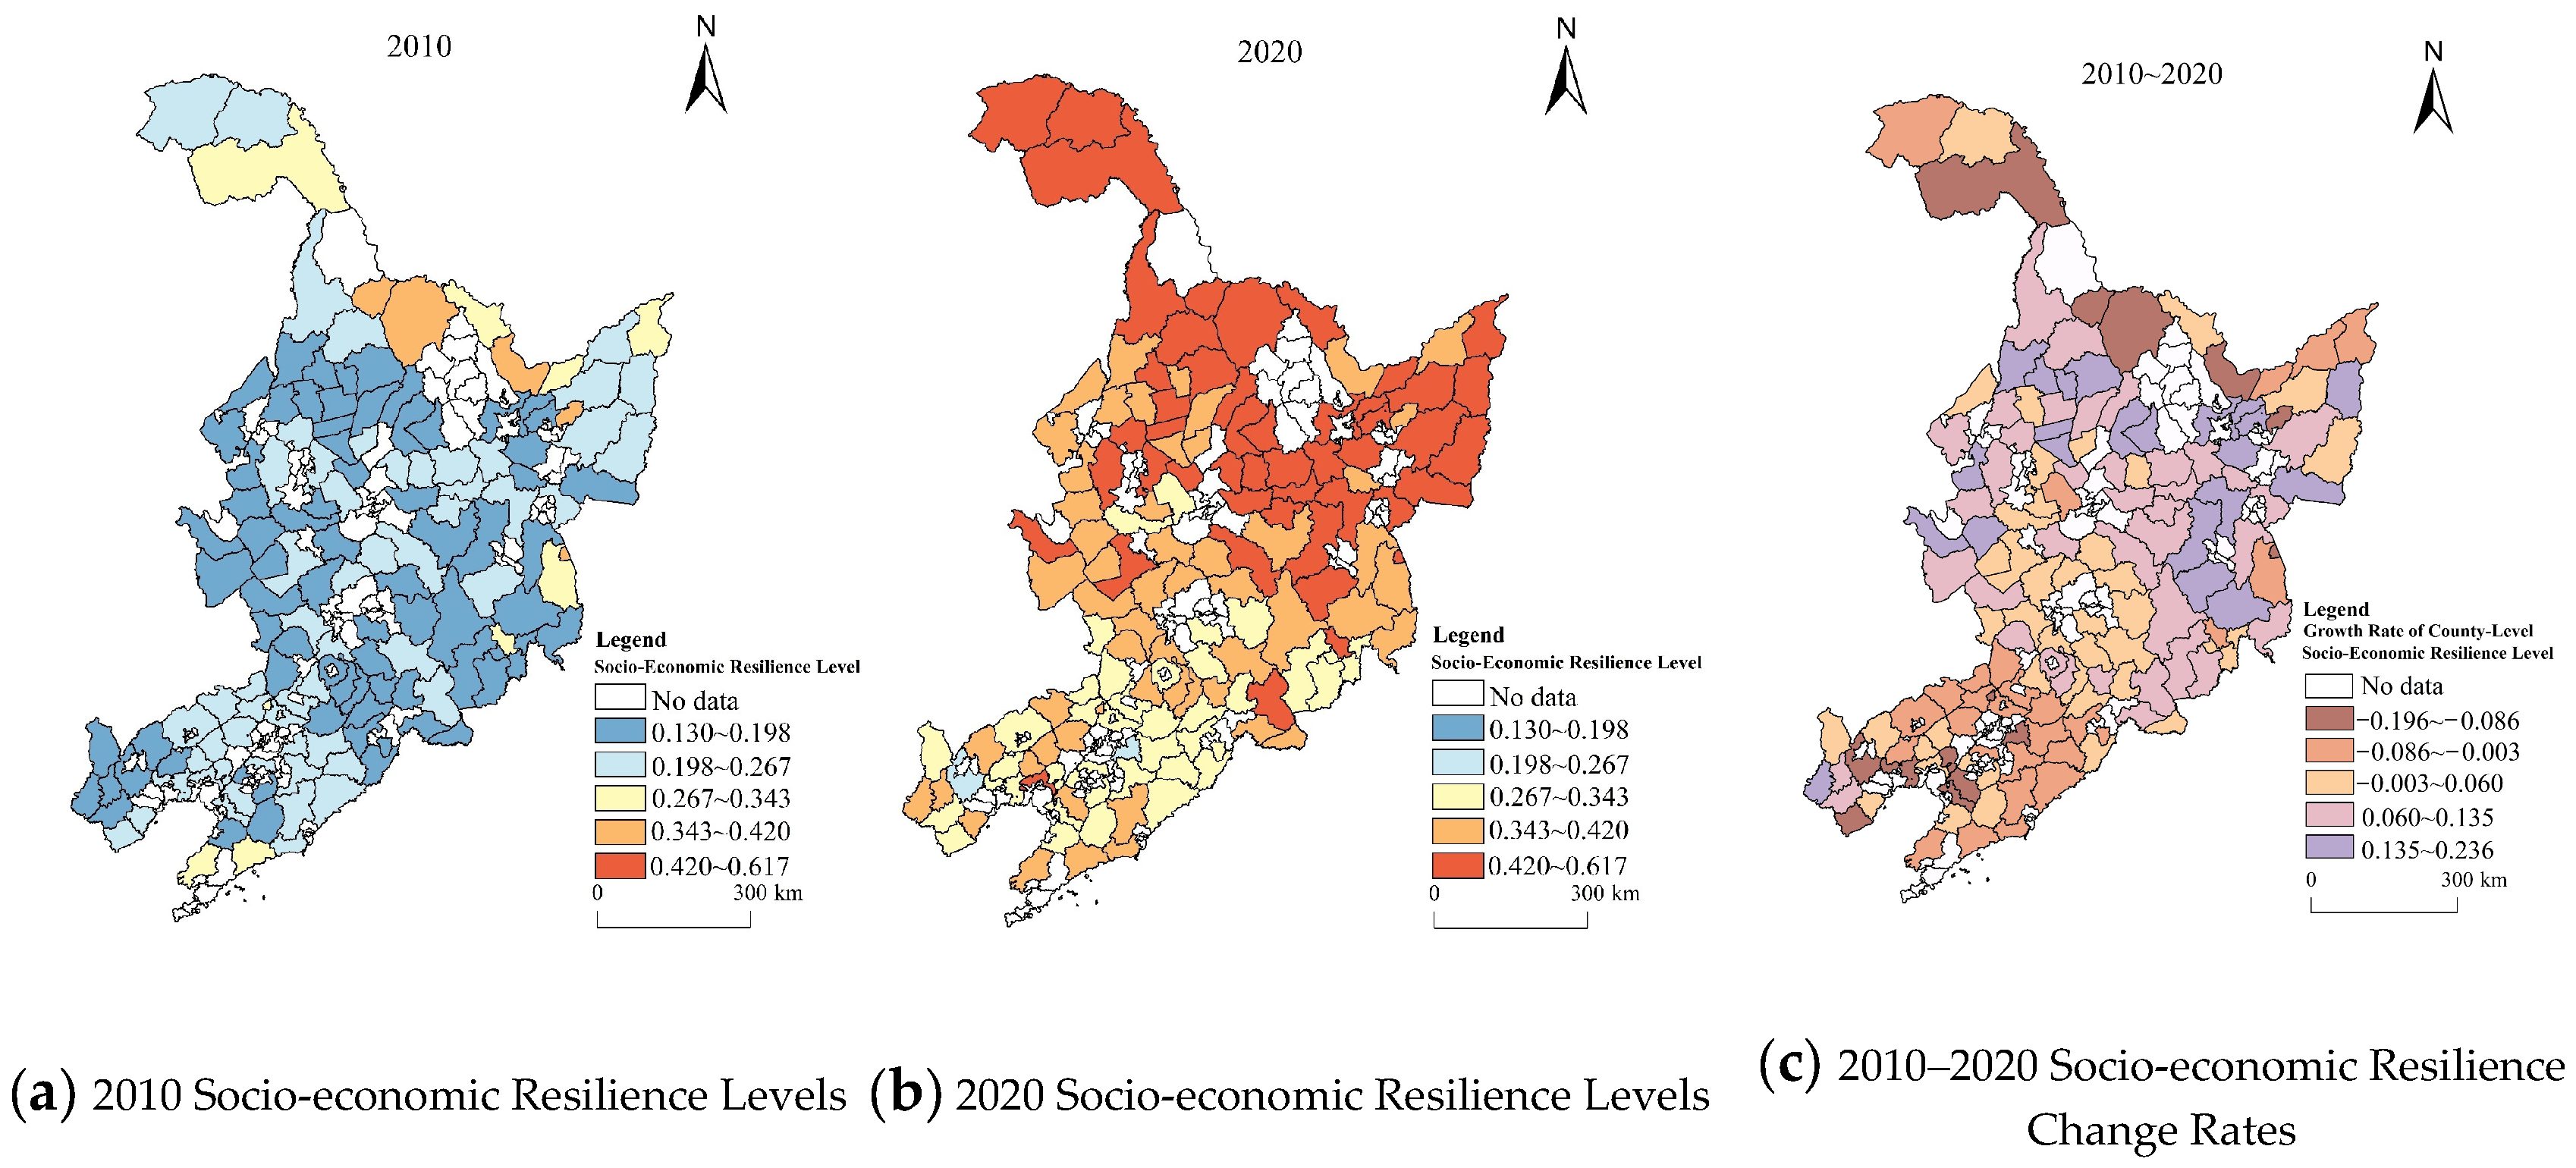
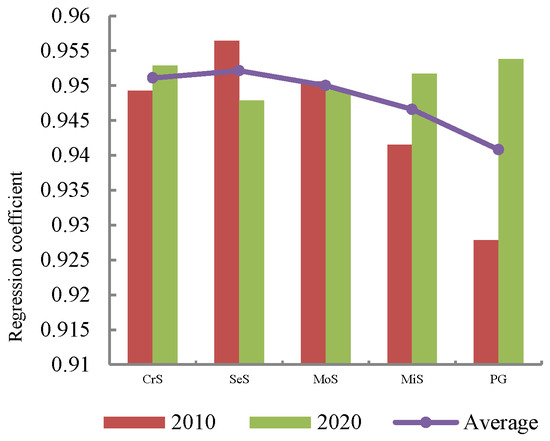
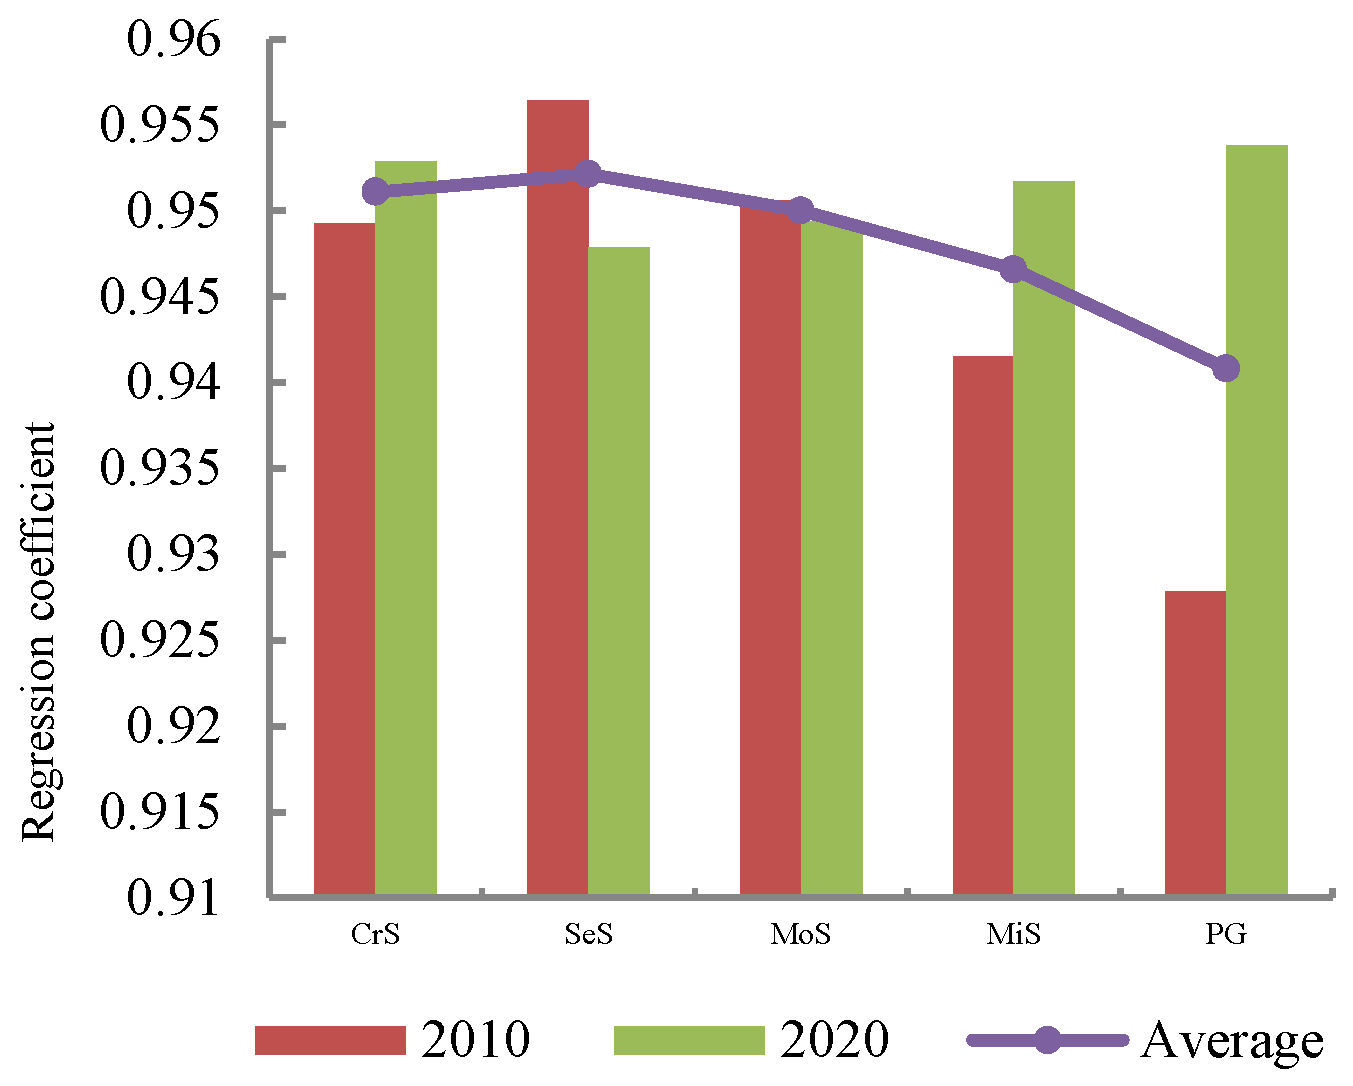
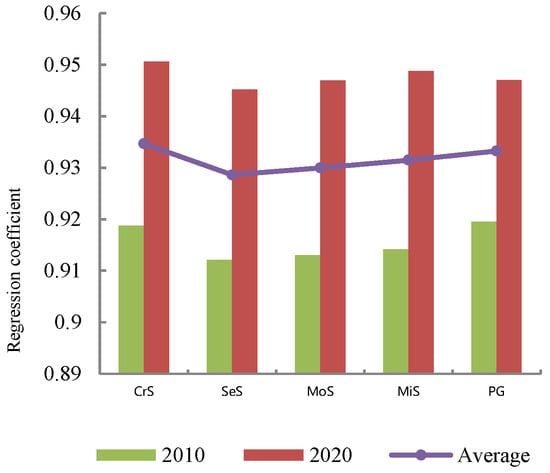
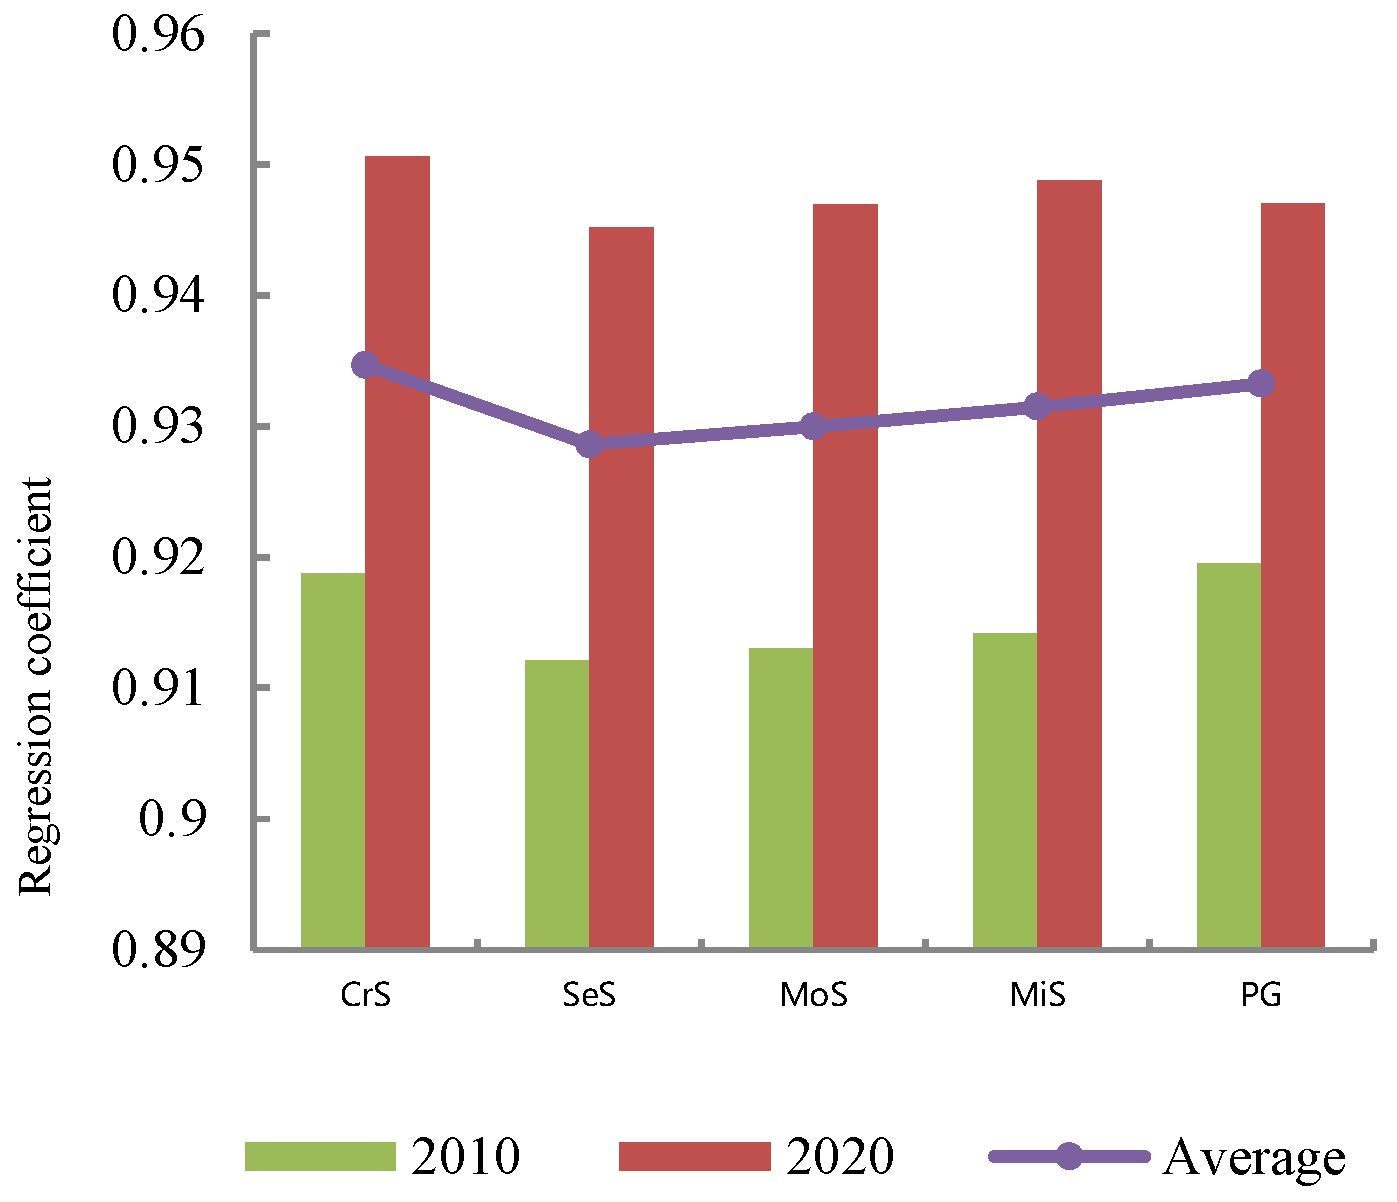
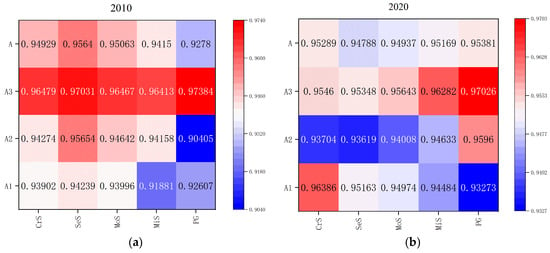
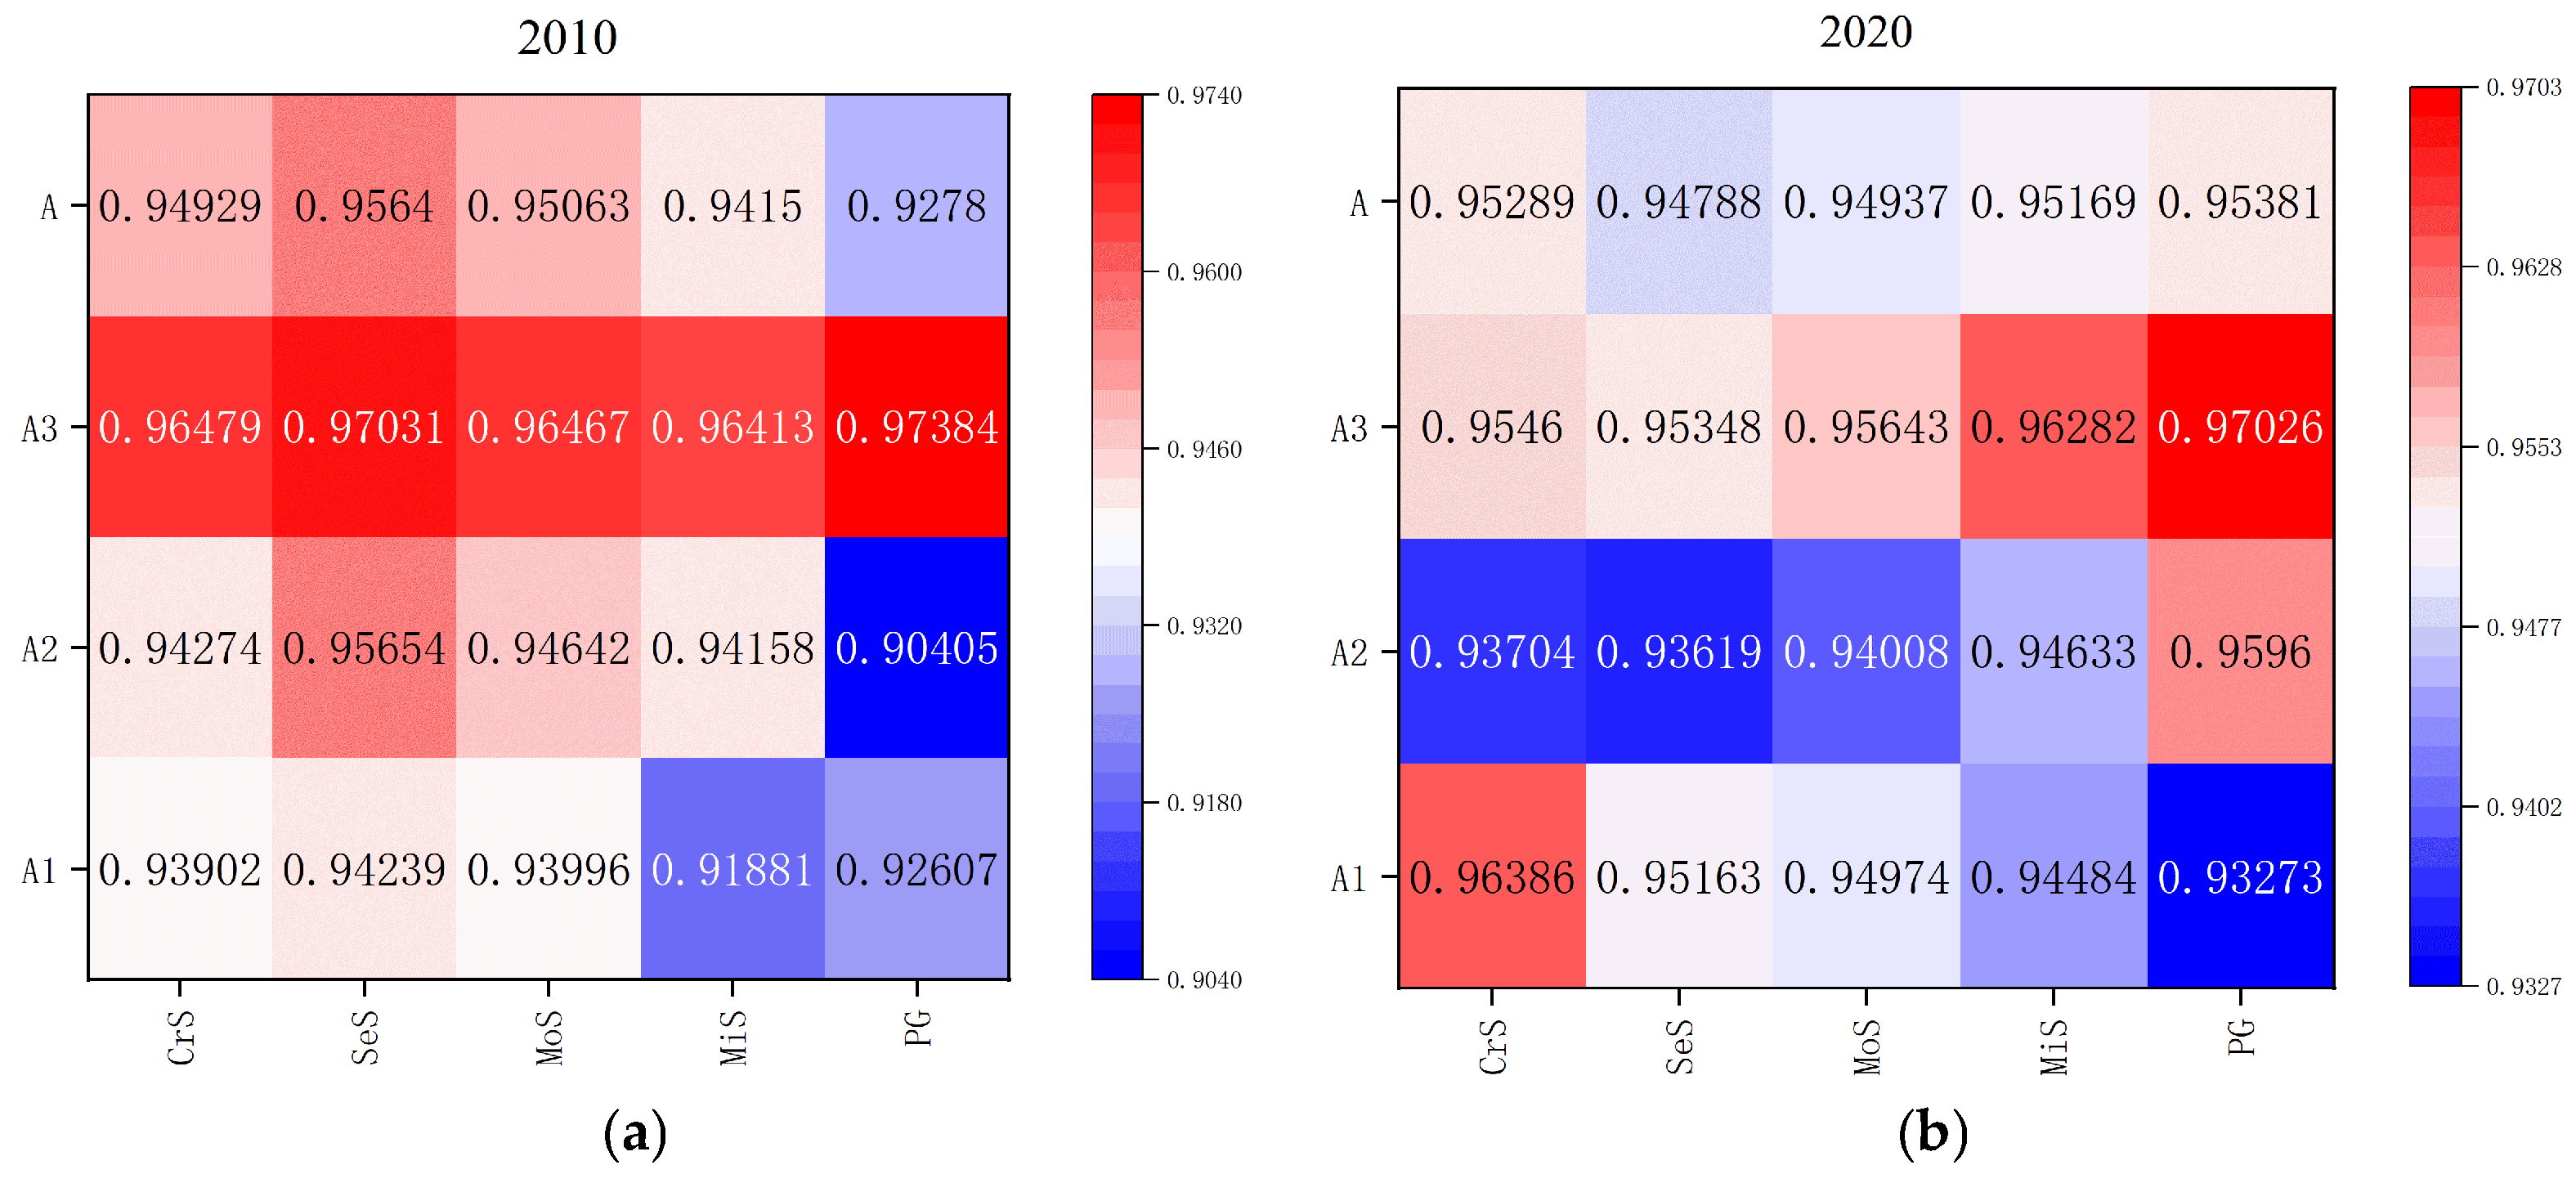
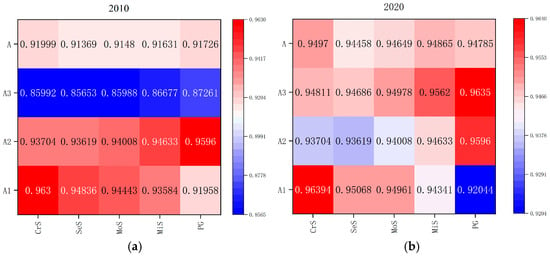
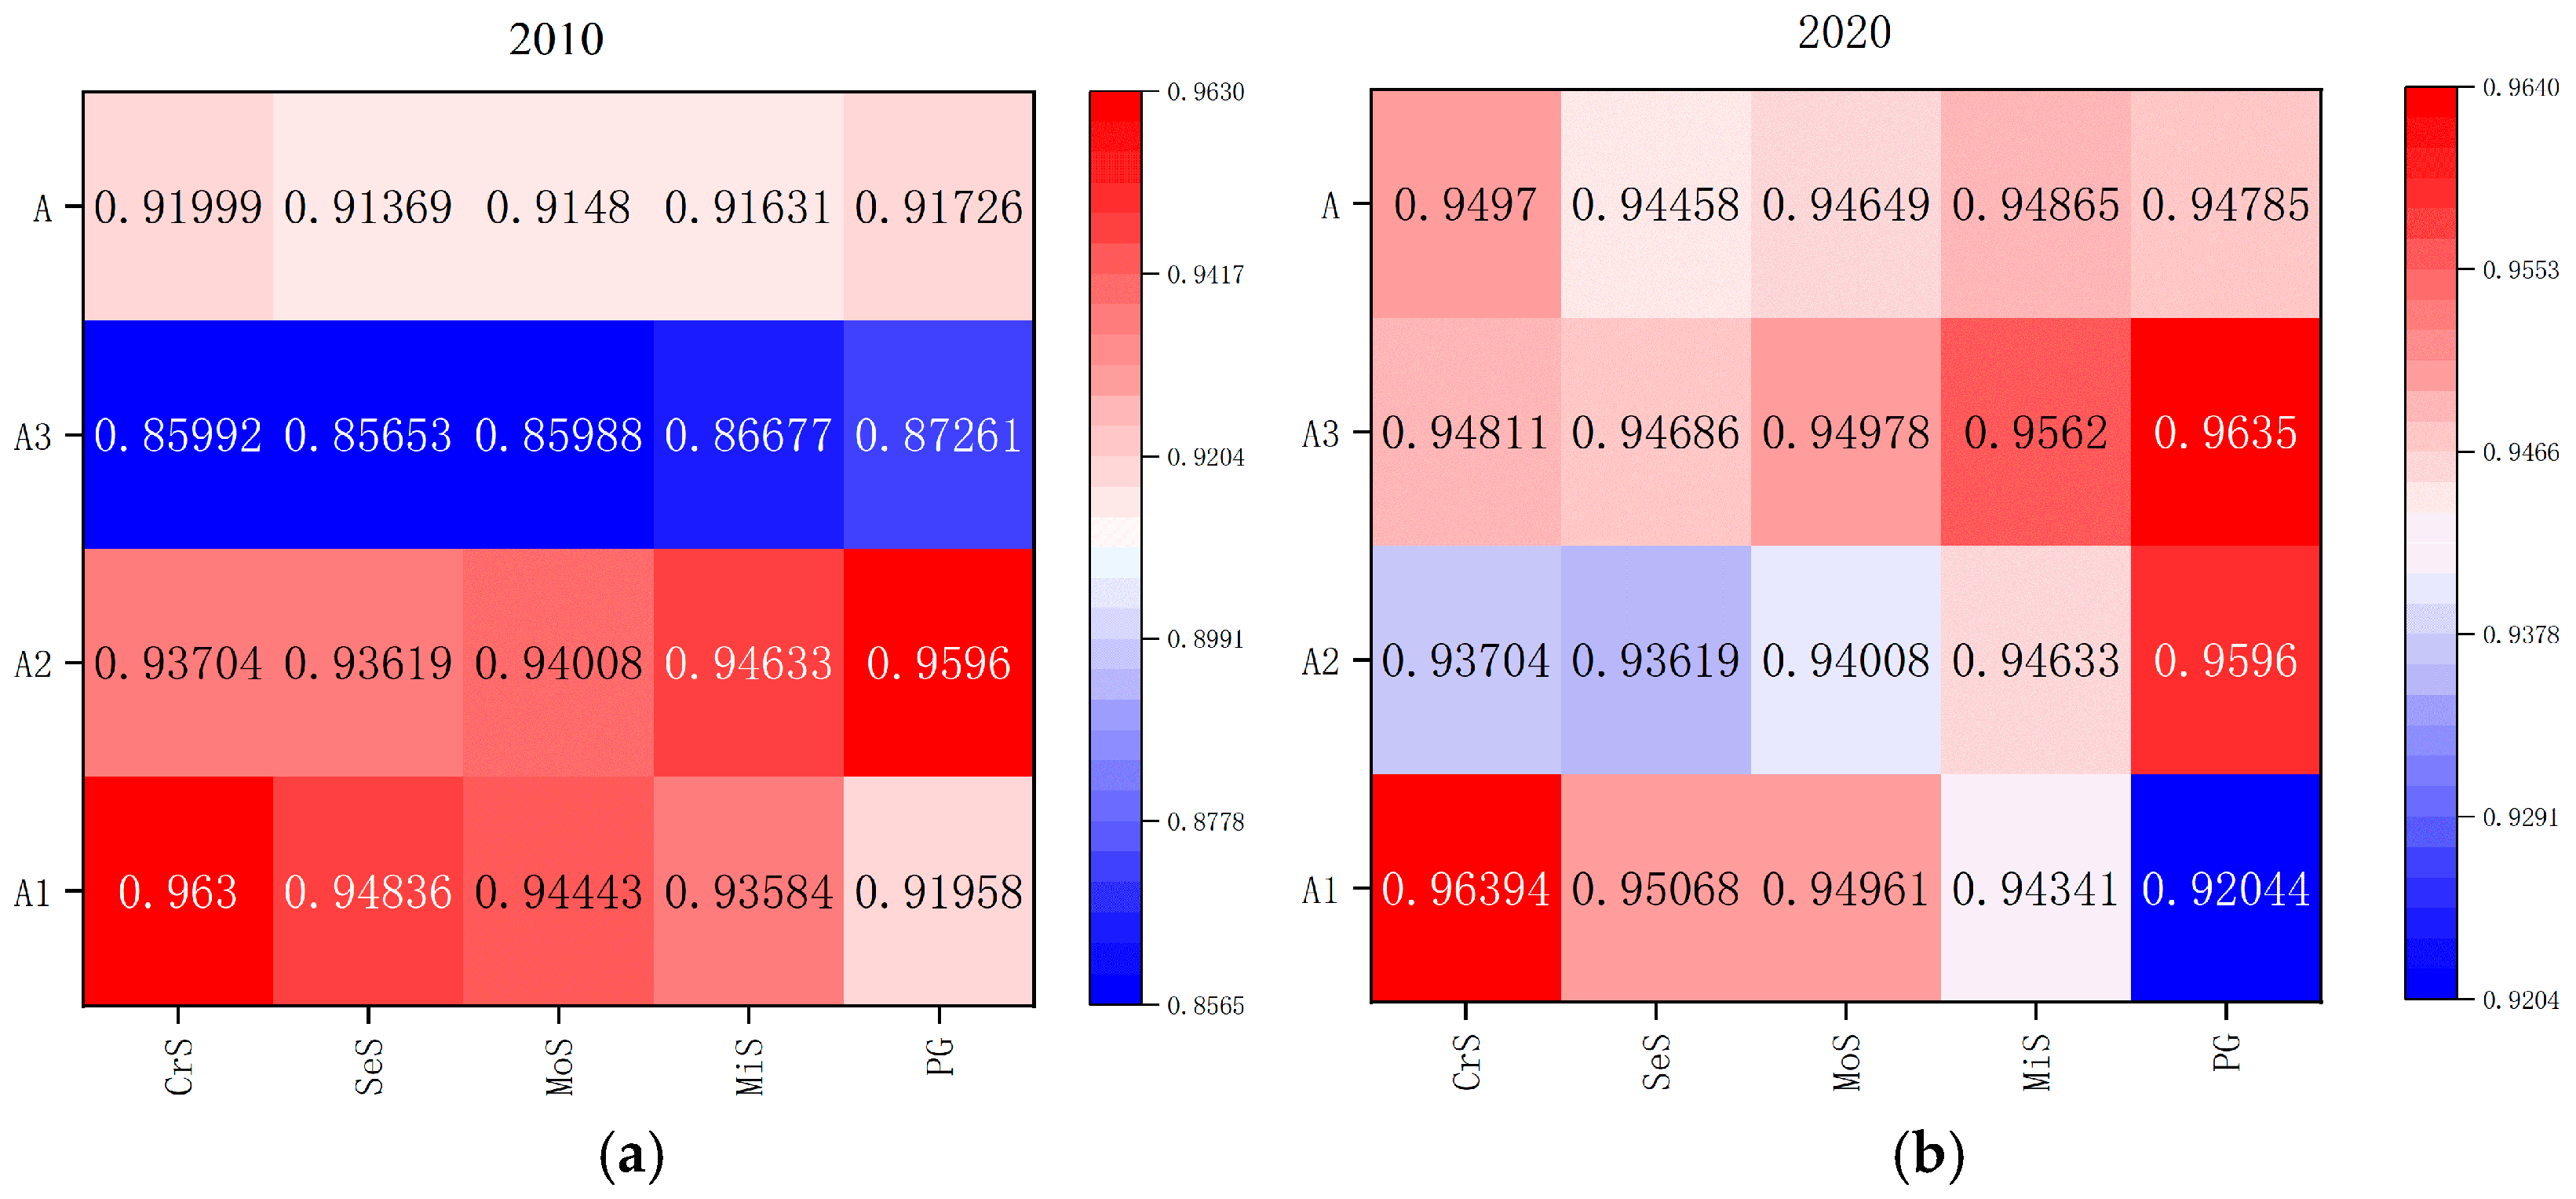
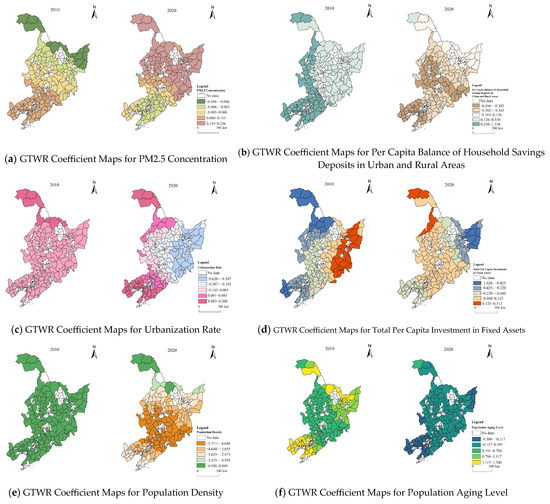
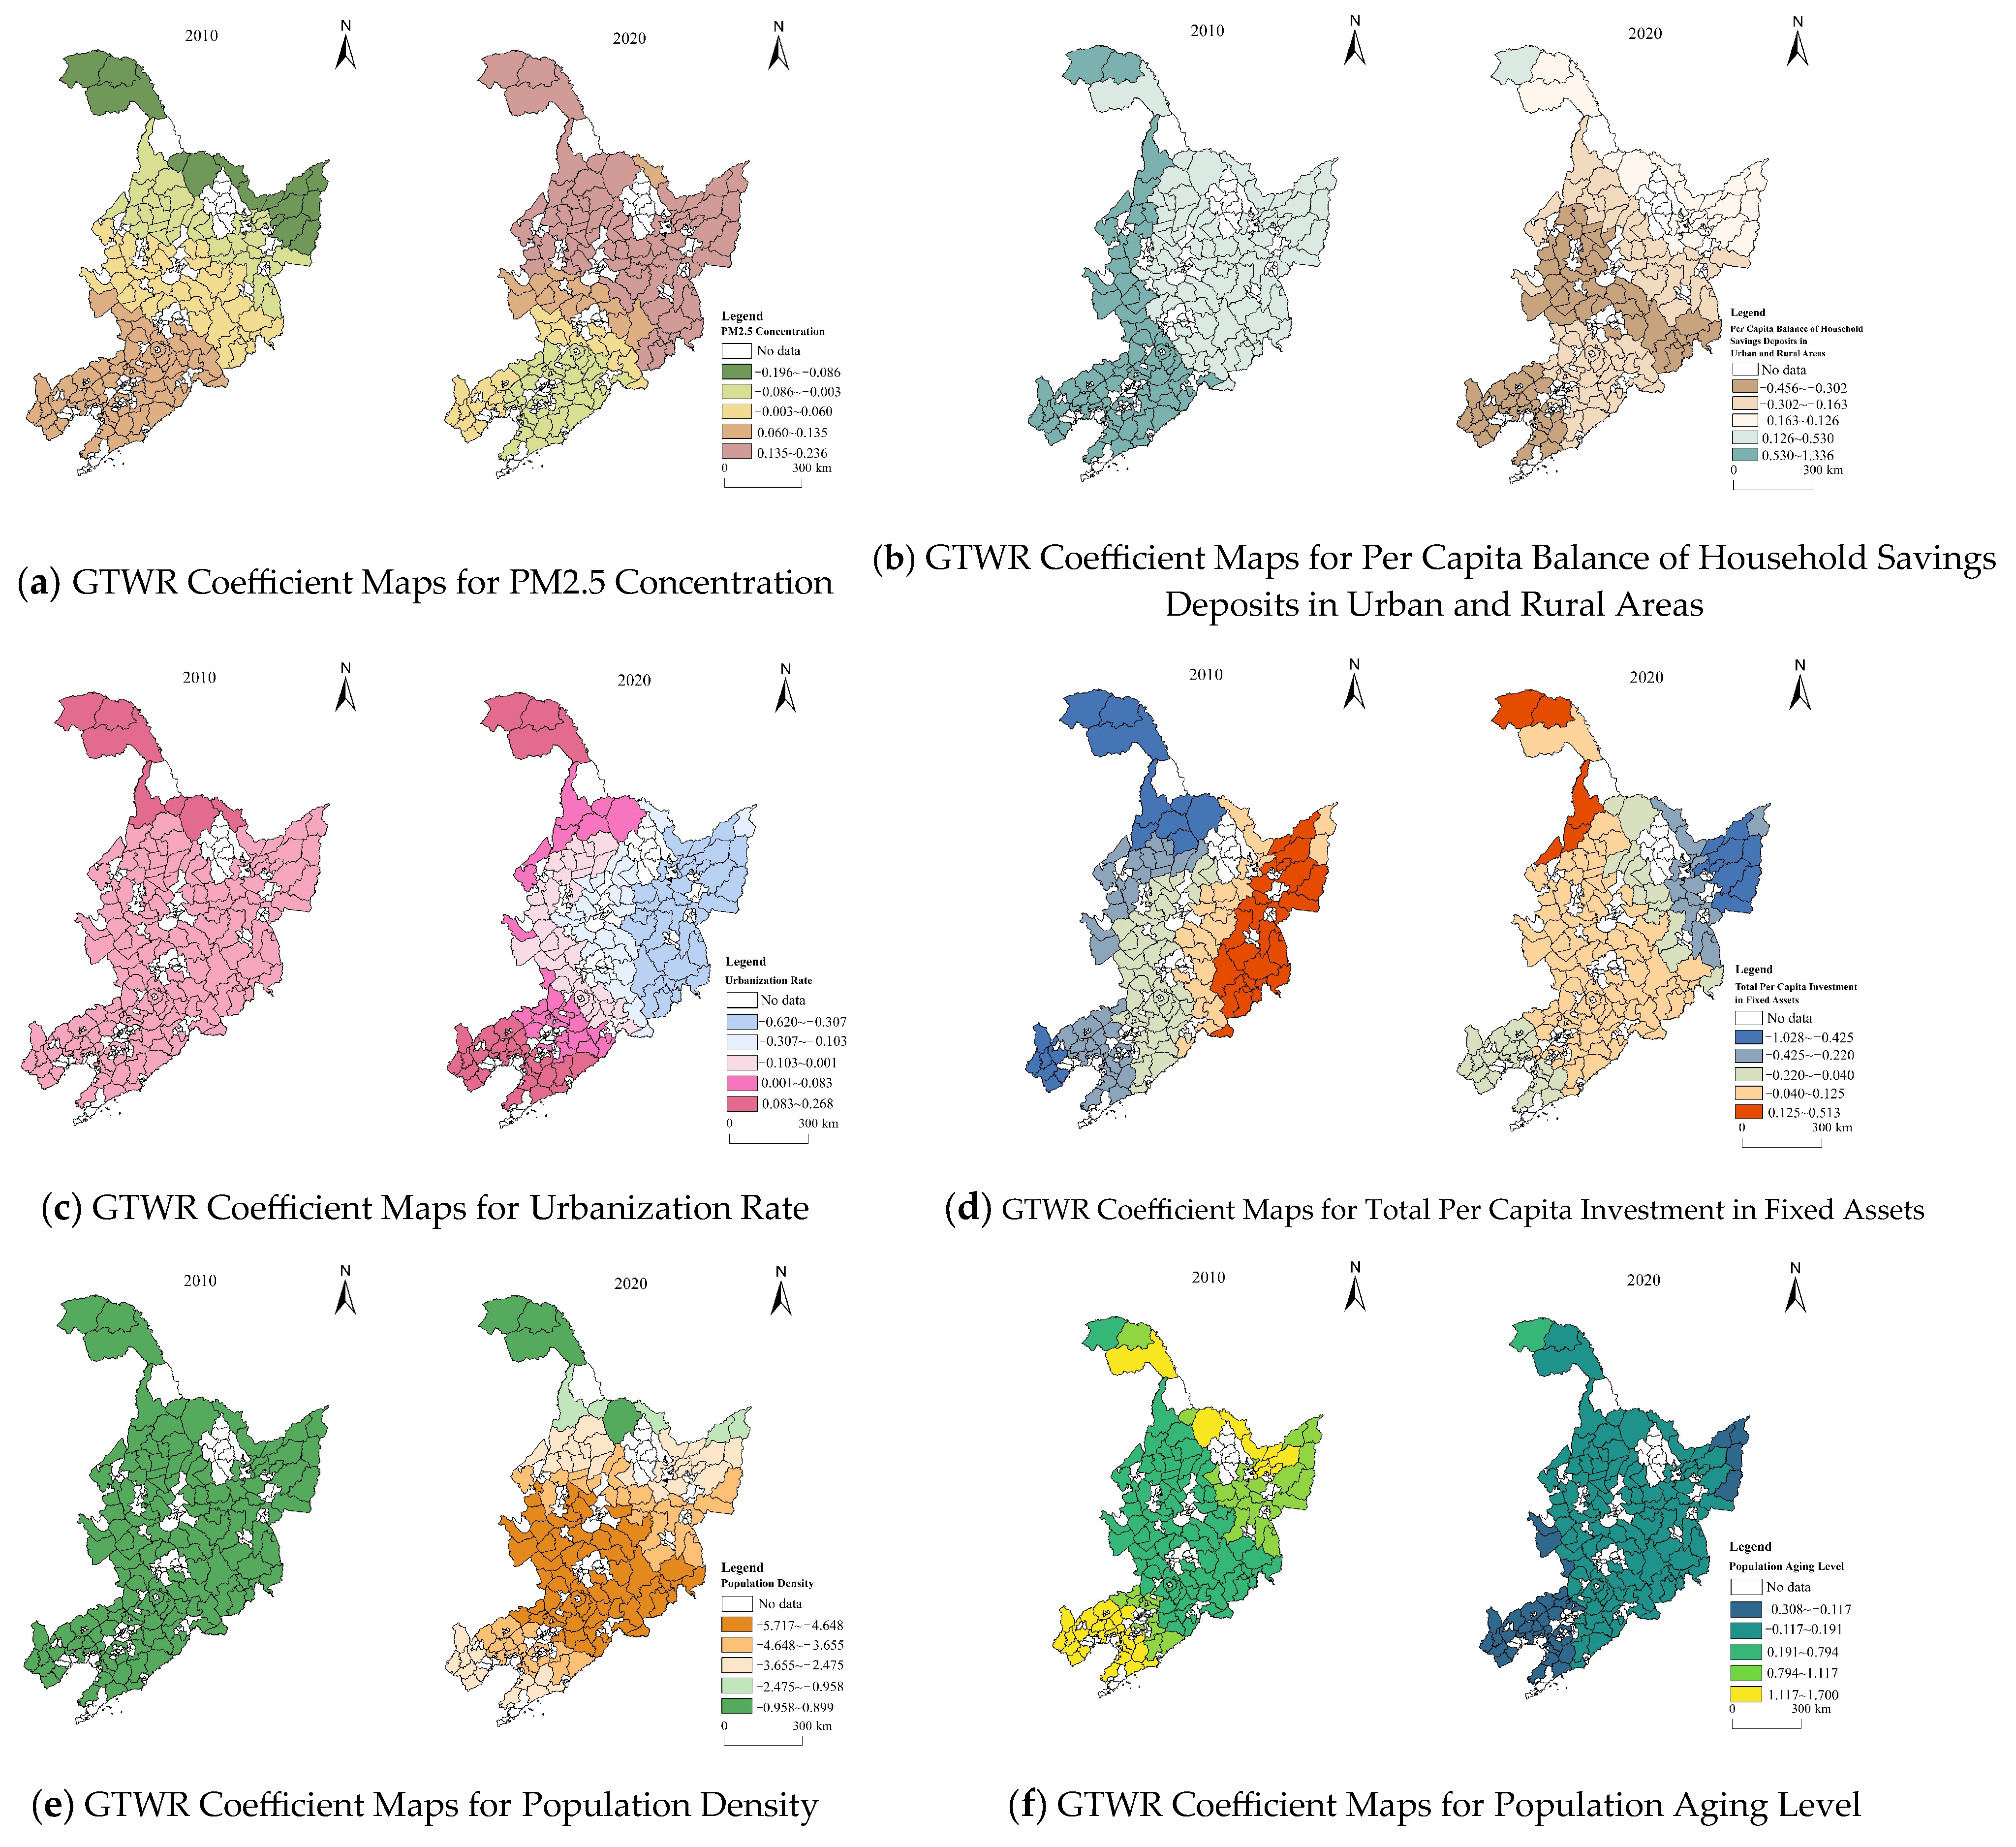
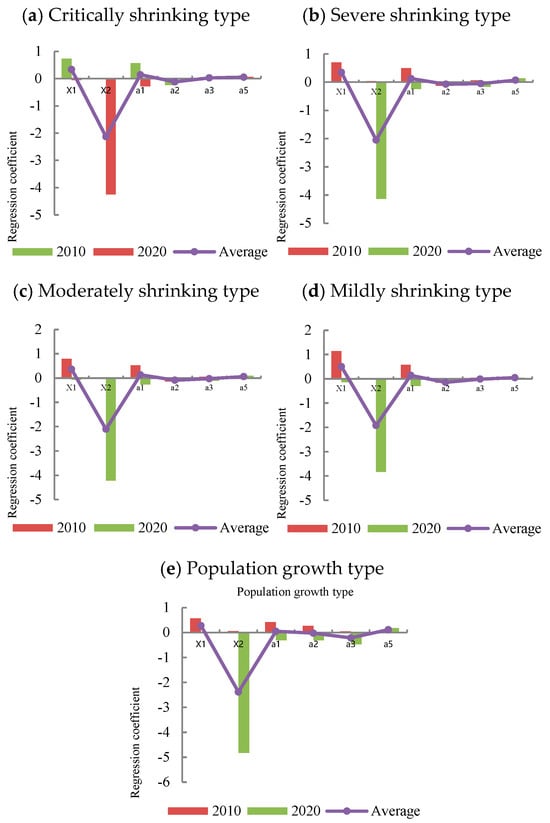
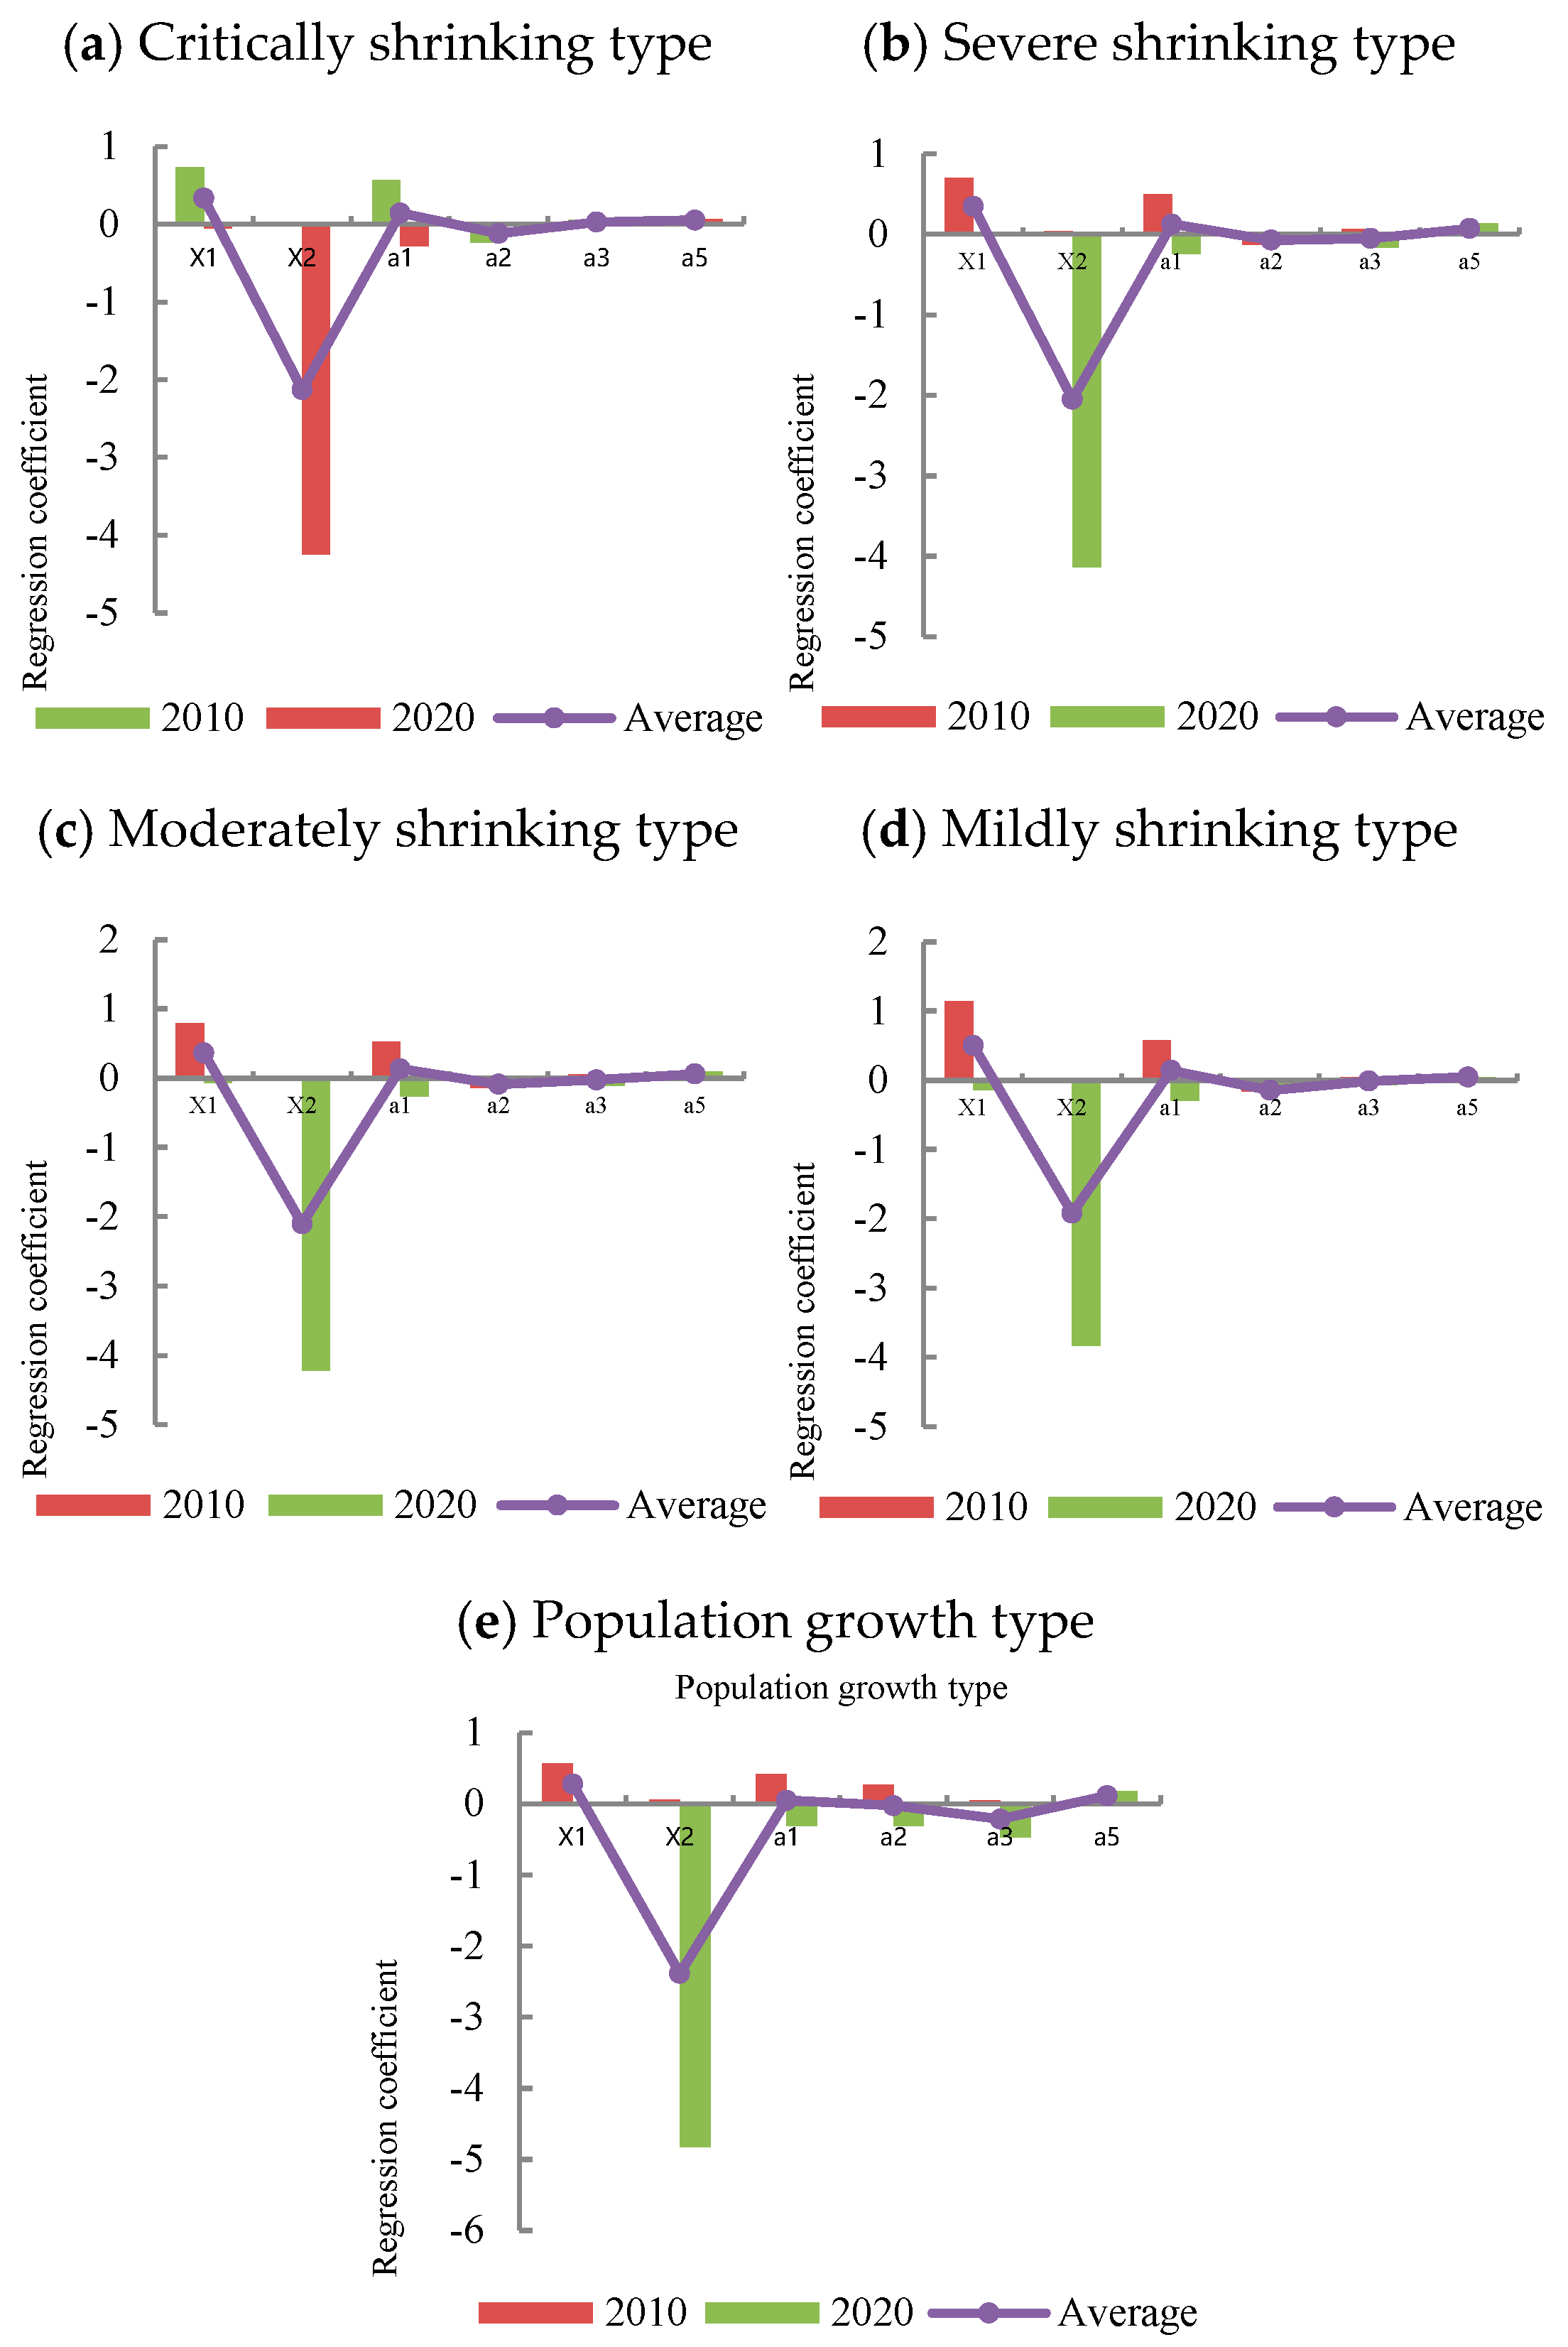

Disclaimer/Publisher’s Note: The statements, opinions and data contained in all publications are solely those of the individual author(s) and contributor(s) and not of MDPI and/or the editor(s). MDPI and/or the editor(s) disclaim responsibility for any injury to people or property resulting from any ideas, methods, instructions or products referred to in the content. |
© 2026 by the authors. Licensee MDPI, Basel, Switzerland. This article is an open access article distributed under the terms and conditions of the Creative Commons Attribution (CC BY) license.