


Abstract
Life Cycle Assessment (LCA) is widely used to evaluate the environmental impact of power generation systems and inform energy and climate policy decisions. In recent years, numerous LCA studies have examined the life-cycle implications of power plants utilizing renewable, nuclear, and fossil fuel technologies. Nevertheless, the resultant data is fragmented, exhibiting significant diversity among investigations attributable to disparities in system boundaries, technical assumptions, and methodological selections. This document offers a systematic overview of peer-reviewed LCA studies and Environmental Product Declarations (EPDs) evaluating the environmental implications of predominant power production technologies, such as solar photovoltaic, wind, hydropower, nuclear, and natural gas power plants. Various environmental effect categories are evaluated, with a specific focus on Global Warming Potential as the most frequently reported and policy-relevant metric. The review consolidates documented impact ranges, assesses the effects of plant size and technological design, and evaluates the contribution of several life cycle stages to overall environmental performance. The findings emphasize prevalent tendencies and significant variability among technologies and studies, illustrating the susceptibility of LCA results to modeling assumptions and data sources. Although current LCAs offer relevant insights into the environmental impact of electricity generation, the review highlights enduring methodological deficiencies, particularly the inadequate handling of uncertainty, the static portrayal of long-lasting infrastructures, and the lack of explicit attention to technological risk. This study consolidates and critically evaluates existing literature, providing a thorough reference on the life-cycle environmental consequences of power plants and facilitating a more educated interpretation of LCA results within energy system planning and policy analysis.
1. Introduction
Life Cycle Assessment (LCA) has emerged as a crucial methodological instrument for assessing the environmental implications of electricity generation technologies and for supporting energy and climate policy decisions. LCA facilitates systematic comparisons among technologies with significantly different technical characteristics and operational profiles by considering emissions and resource utilization throughout the entire life cycle of a power plant from raw material extraction and construction to operation, decommissioning, and waste management. As global energy systems transition toward low-carbon pathways, the application of LCA to power generation technologies has expanded rapidly. A large and growing body of literature has applied LCA to renewable, nuclear, and fossil fuel-based power plants, often focusing on climate change impacts through the Global Warming Potential (GWP) indicator. Despite this extensive literature, reported outcomes remain highly heterogeneous. For identical technology, life cycle GWP values and other environmental metrics may differ by an order of magnitude across studies. Previous research suggests that this variability is predominantly driven by methodological and modeling decisions (i.e., system boundary definition, assumptions on plant lifetime and capacity factor, background energy mixes, and data sources) rather than solely by inherent technical differences. Therefore, LCA results for power plants are more appropriately interpreted as ranges of plausible outcomes rather than as an exact point of estimation. However, existing review studies largely fall into two categories. On the one hand, technology-specific reviews provide in-depth analyses of individual systems—such as wind, hydropower, or photovoltaic plants—but limit cross-technology comparability. Recent examples encompass reviews concentrated solely on wind power facilities, examining life-cycle greenhouse gas emissions and energy performance metrics for both onshore and offshore installations [1], alongside systematic reviews on hydropower systems, which underscore methodological deficiencies and the restricted scope of environmental indicators beyond climate change [2]. A considerable amount of literature has investigated photovoltaic power plants via technology-specific life cycle assessment studies, frequently focusing on inventory development or qualitative sustainability evaluations rather than comparative life-cycle performance among various technologies [3,4]. On the other hand, system-level or scenario-based LCAs evaluate future electricity mixes or national energy pathways (e.g., [5]), which are valuable for policy analysis but do not allow transparent comparison of the life-cycle environmental performance of individual power generation technologies. A comprehensive and structured synthesis that integrates quantitative evidence across renewable, nuclear, and fossil fuel power plants at the plant level, while explicitly addressing the large variability and methodological limitations of existing studies, is still lacking.
This paper addresses this gap through a systematic review of peer-reviewed Life Cycle Assessment studies and Environmental Product Declarations (EPD) that evaluate the environmental impacts of major electricity generation technologies, including solar photovoltaic, wind, hydropower, nuclear, and natural gas power plants. The review consolidates reported impact ranges, with a particular focus on Global Warming Potential as the most widely reported and policy-relevant indicator, using a consistent functional unit. In addition, the study examines the influence of plant size and technology configuration, evaluates the contribution of different life cycle stages to overall environmental performance, and critically discusses structural limitations of current LCA practice, including the treatment of uncertainty, temporal aspects, and technological risk. This review synthesizes and critically evaluates existing evidence across technologies, offering a transparent reference framework for interpreting LCA results of power plants and supporting a more informed use of life-cycle information in energy system planning and policy analysis.
2. Methodology
This research employs a structured methodology to assess the life-cycle environmental performance of major power generation technologies, with a specific focus on GWP. The analysis is based on a systematic literature review of LCA studies, complemented by EPDs and authoritative international and European institutional reports. The objective is to synthesize plant-level life-cycle evidence and to compare the environmental burdens associated with electricity production across fundamentally different technologies. The literature search includes publications available up to 2024.
The review process started with a comprehensive keyword-based search strategy (outlined in Table 1) applied to major scientific databases (i.e., Scopus, ScienceDirect). The search terms were designed to capture LCA studies of complete power plant systems for solar photovoltaic, wind, hydropower, nuclear, and natural gas technologies. The primary quantitative indicator extracted from the literature is GWP, expressed in g CO2eq/kWh, which represents the most consistently reported and policy-relevant impact category across studies. Other environmental impact categories are acknowledged; however, due to their heterogeneous definitions, metrics, and reporting frequency, they are addressed primarily through qualitative or semi-quantitative discussion.
Table 1.
Overview of the keywords used in the literature review.
The review focused exclusively on studies evaluating entire power plant systems across their life cycle. Studies addressing isolated components (e.g., turbines, photovoltaic modules, balance-of-system elements) or system-level energy scenarios lacking explicit and comparable GWP results per unit of electricity generated were excluded. Moreover, only facilities producing electricity were considered. For solar technologies, the analysis was limited to photovoltaic power plants, excluding solar thermal and hybrid systems, even when broader solar-related keywords were used during the initial search phase.
To ensure consistency and comparability, explicit inclusion and exclusion criteria were applied. Eligible studies were required to:
- be published in peer-reviewed journals or released as verified EPDs or authoritative institutional reports;
- report life cycle GWP results quantified in g CO2eq/kWh;
- assess complete power plant systems, encompassing construction, operation, and end-of-life phases, where relevant.
Studies published in journals not related to environmental assessment or energy systems were excluded. Additional screening was conducted to remove duplicate records and studies lacking sufficient methodological transparency or quantitative life-cycle results.
The review protocol followed a multi-step procedure summarized in Table 2. After the initial keyword search, records were screened based on journal relevance and thematic scope. Abstract screening was then performed to assess alignment with the review objectives, followed by full-text analysis to verify methodological consistency and data suitability. Forward and backward snowball searches were subsequently conducted to identify additional relevant studies cited by or citing the initially selected publications. Environmental Product Declarations were included when available, particularly for renewable energy technologies, to complement peer-reviewed LCAs with standardized, product-specific life-cycle data. The final sample size for each technology reflects the cumulative outcome of these selection steps and provides a solid empirical basis for cross-technology comparison.
Table 2.
Review protocol and results.
From each selected study, quantitative GWP estimates, system boundary definitions, assumed plant lifetime, capacity factors, and the contribution of individual life cycle stages were extracted where reported. Due to the substantial variability in methodological assumptions and data sources across studies, results were synthesized as reported ranges rather than standardized point estimates. This approach allows the heterogeneity of the literature to be explicitly represented and avoids overstating the precision of comparative results. The functional unit adopted throughout the review is 1 kWh of electricity generated. This functional unit is widely used in LCA studies of power generation and enables direct comparison of life-cycle environmental burdens across different technologies. System-level characteristics—such as operational profiles, capacity factors, infrastructure requirements, and upstream supply chains—are reflected in the system boundaries and modeling assumptions of the reviewed studies rather than in the functional unit itself.
The review was conducted and reported in accordance with the Preferred Reporting Items for Systematic Reviews and Meta-Analyses (PRISMA) 2020 guidelines [6]. A completed PRISMA 2020 checklist is provided as a Supplementary Materials, and the study selection process is illustrated in Figure 1. The review protocol was not registered in a public database. The PRISMA flow diagram presents the aggregated workflow for all technologies considered and complements the disaggregated results reported in Table 2, thereby improving transparency and reproducibility.
Figure 1.
Flow diagram illustrating the study selection process for the systematic review based on PRISMA 2020 guidelines [6].
A formal risk-of-bias assessment was not conducted, as life cycle assessment studies do not follow a shared experimental design or standardized reporting framework that would allow the consistent application of conventional risk-of-bias tools. In addition, the substantial heterogeneity in system boundaries, functional units, background datasets, and modeling assumptions would make a formal scoring approach potentially misleading rather than informative. Instead, study quality was addressed during the screening phase by excluding publications lacking methodological transparency, incomplete system definitions, or quantitative life-cycle results. Accordingly, the results are synthesized through a qualitative and descriptive analysis, focusing on reported life-cycle impact ranges and on the critical comparison of methodological choices that most strongly influence the outcomes. No meta-analysis was conducted.
Figure 2 provides a schematic overview of the system boundaries and life cycle stages adopted in this review, clarifying the allocation of processes across upstream, core infrastructure, core process, downstream infrastructure, and downstream operation for the different power generation technologies.
Figure 2.
System boundaries and life cycle stages for power plants.
3. Environmental Assessment of Power Plants
This section presents the assessment of the environmental impacts associated with major power generation technologies, as identified through the literature review. The analysis focuses primarily on GWP, expressed per unit of electricity generated, and on the contribution of individual life cycle stages to overall emissions. Summary tables supporting the quantitative synthesis, together with information on data sources and methodological assumptions, are reported in Appendix A to ensure transparency and reproducibility. Other environmental dimensions are also discussed qualitatively to highlight recurring trade-offs and knowledge gaps.
3.1. Solar Power Plants
Solar photovoltaic (PV) capacity is rapidly expanding and is projected to surpass electricity generation from natural gas and coal in the coming years, emerging as one of the dominant global electricity sources. According to projections by the International Energy Agency (IEA), solar PV will maintain an annual growth rate exceeding 25% over the next decade. This expansion is driven by declining installation and production costs, supportive governmental policies, and the increasing urgency to mitigate climate change through low-carbon energy systems.
Technological improvements and economies of scale have substantially reduced the cost of solar electricity generation, which typically ranges between $0.05 and $0.10 per kilowatt-hour, depending on geographic location and project scale. Governments worldwide continue to deploy policy instruments such as feed-in tariffs, tax incentives, and renewable energy mandates to stimulate PV deployment. Beyond economic considerations, public concern regarding environmental degradation and greenhouse gas emissions further supports the diffusion of solar technologies. Despite these advantages, the environmental performance of PV systems must be assessed over their entire life cycle, as significant impacts arise outside the operational phase. Numerous life cycle assessment studies have quantified the environmental footprint of PV technologies; however, reported results vary widely due to differences in system boundaries, technological configurations, geographical context, and methodological assumptions.
Traditionally, PV systems adopt fixed-tilt configurations, in which modules are mounted at a predetermined angle to optimize annual solar irradiation capture. While this configuration is simple and cost-efficient, it does not fully exploit diurnal and seasonal solar variability. Solar tracking systems have therefore been introduced to increase electricity yield by following the sun’s trajectory, albeit at the expense of higher mechanical complexity, increased maintenance requirements, and additional material and energy inputs. The environmental performance of PV systems is also strongly affected by balance-of-system (BOS) components, including inverters, mounting structures, and electrical wiring. These elements can account for a substantial share of the embodied energy of PV installations. For example, the BOS of ground-mounted PV systems may require up to 1900 MJ/m2, largely due to the use of energy-intensive materials such as steel and concrete. Silicon-based PV technologies, particularly monocrystalline and multicrystalline (polycrystalline) silicon, continue to dominate the global market. Monocrystalline silicon modules offer higher conversion efficiencies but involve an energy-intensive production process, notably the Czochralski method, which requires around 32 kWh per kilogram of silicon. Polycrystalline silicon modules require less energy during production (approximately 7 kWh/kg) but exhibit slightly lower efficiencies. Thin-film technologies, such as amorphous silicon, reduce material and energy requirements during manufacturing, although they typically achieve lower conversion efficiency. Emerging technologies, including dye-sensitized solar cells (DSSCs) and perovskite solar cells, have attracted increasing attention due to their potential for lower production costs and reduced embodied energy. Nevertheless, limitations related to long-term stability, scalability, and degradation currently restrict their large-scale deployment. For most silicon-based PV systems, the manufacturing phase represents the dominant contributor to life-cycle environmental impact. This phase includes the extraction and purification of quartz sand into solar-grade silicon (99.99% purity), requiring approximately 8 kWh of thermal energy and 49 kWh of electricity per kilogram of silicon. Additional materials include glass, copper for cables, and iron or zinc for mounting structures. The manufacturing process encompasses wafer production, cell fabrication, and module assembly, followed by transportation, installation, and grid connection. PV systems typically operate for 20 to 30 years, after which decommissioning and end-of-life management become relevant. While metals and glass can be recycled, current recycling infrastructure for PV modules remains limited, highlighting the importance of improved end-of-life strategies to reduce environmental burdens and recover valuable materials.
Life cycle inventory (LCI) data compiled by Frischknecht et al. [7] provide detailed insights into PV mounting systems and regional photovoltaic mixes, including process-level information on solar-grade silicon production across four macro-regions. Energy Payback Time (EPBT), defined as the time required for a system to generate the amount of energy consumed during its production, varies by technology and location but generally remains below five years for modern PV systems, indicating favorable energy returns over their operational lifetime. While technological progress has significantly reduced the carbon footprint of PV systems, several open issues remain evident in the reviewed literature, particularly with respect to end-of-life management and methodological consistency across studies.
Figure 3 summarizes the ranges of GWP values reported for different PV technologies, expressed per unit of electricity generated, enabling direct comparison across studies despite methodological heterogeneity. Reported GWP ranges reflect variations in material sourcing, manufacturing energy mixes, system design, and assumed lifetimes. Among commercially mature options, cadmium telluride (CdTe) consistently exhibits relatively low and narrow GWP ranges and the lowest reported maximum values, suggesting a more uniform and energy-efficient production process. In contrast, monocrystalline (Mono-Si) and polycrystalline silicon (Poly-Si) technologies display considerably broader GWP ranges, with Poly-Si reaching the highest maximum values among the technologies analyzed. This dispersion indicates that the environmental performance of silicon-based PV systems is highly sensitive to supply chain configuration, electricity mix used during manufacturing, and specific production methodologies. Thin-film technologies generally show lower GWP values due to reduced material intensity and lower embodied energy requirements. However, data availability for these technologies remains limited. Amorphous silicon (a-Si), copper indium gallium selenide (CIGS), and micromorphous silicon are each represented by a single study, highlighting the need for additional life cycle assessments to enable more robust inter-technology comparisons. The relatively low GWP values reported for a-Si, CIGS, and micromorphous silicon are consistent with the characteristics of thin-film PV, which benefit from minimal active material use. CIGS may benefit from high absorption efficiency and thin active layers, while the favorable performance of micromorphous silicon is often attributed to its tandem structure, which enhances light capture without substantially increasing energy inputs. The “Not specified” category, encompassing studies that do not distinguish between PV technologies, exhibits wide GWP variability, further emphasizing the role of factors such as material origin, manufacturing energy mix, and end-of-life assumptions in shaping life cycle results. Despite the observed variability, it is important to note that even the highest GWP values reported for PV technologies remain substantially lower than those associated with fossil fuel-based electricity generation, confirming the overall climate benefit of solar photovoltaic systems.
Figure 3.
Global Warming Potential of various photovoltaic technologies. Green lines represent the minimum value, red lines the maximum value, blue lines the range of values, while dots the average value. Note: the size of the dots represents the numerosity of studies.
Plant size also influences environmental performance. As shown in Table 3, large-scale PV installations (>50 MW) tend to exhibit narrower and lower maximum GWP ranges compared to small-scale systems (<25 MW). This trend reflects economies of scale, optimized construction practices, and more efficient BOS configurations in utility-scale projects. Small installations show greater variability, suggesting higher sensitivity to site-specific factors, including transportation distances, component selection, and local grid conditions.
Table 3.
GWP ranges for PV power plants as a function of the plant size.
The distribution of GWP contributions across life cycle stages (Figure 4) indicates that upstream processes and core infrastructure (i.e., plant construction, mounting systems) dominate total emissions, while operational and downstream (i.e., distribution systems construction and management) stages generally contribute less. However, considerable variability exists across studies due to differences in system boundary definitions and classification approaches. This variability reinforces the need for transparent and harmonized LCA methodologies when comparing PV systems.
Figure 4.
Share of Global Warming Potential across life cycle stages of photovoltaic power plants.
Beyond climate change impacts, PV power plants may exert additional environmental pressures related to land use, biodiversity, water consumption, visual impact, and health and safety considerations, as summarized in Table 4. Addressing these aspects through careful site selection, improved system design, and enhanced regulatory frameworks is essential to ensure the sustainable expansion of solar energy systems.
Table 4.
Broader environmental considerations of solar power systems.
3.2. Wind Power Plants
Wind power is projected to play a pivotal role in achieving net-zero emissions by 2050. Meeting these targets will require a substantial increase in annual wind capacity installations, alongside improvements in permitting processes, public acceptance, environmental impact mitigation, site identification, cost reduction, and project development timelines. Onshore wind power represents a mature technology supported by a well-established global supply chain, while offshore wind energy is experiencing rapid expansion due to access to higher and more stable wind resources. Technological advances in turbine design have increased energy output per unit of installed capacity, enabling economically viable projects even in regions characterized by moderate wind speeds. As a result, the cost of wind-generated electricity has declined significantly, with global average values typically ranging between $0.04 and $0.08 per kilowatt-hour, depending on location and project scale.
From a life cycle perspective, wind power systems require non-renewable material inputs (e.g., steel, concrete, and rare earth elements), and their life-cycle emissions are primarily concentrated in the manufacturing, installation, and maintenance phases. Typical operational lifetimes assumed in LCA studies are around 20 years for both onshore and offshore wind farms, although longer lifetimes are increasingly considered. The reviewed studies mostly focus on onshore installations located in Europe, with a growing body of literature addressing offshore and deep-water systems. All assessments include turbine manufacturing and foundation construction, while grid connection infrastructure is frequently, though not consistently, incorporated. Transportation, installation, and maintenance activities are generally accounted for, though the end-of-life processes are sometimes excluded or modeled differently across studies.
Offshore wind power plants often exhibit comparable or slightly higher life cycle emissions than large onshore installations, despite higher capacity factors. This difference is mainly attributable to the complexity and material intensity of offshore foundations and support structures designed to withstand harsh ocean conditions. Wind turbine systems require substantial quantities of iron, steel, copper, fiberglass, epoxy resins, concrete, and other materials. The average energy intensity reported for electricity generation from wind power is about 0.063 (±0.061) kWh of input energy per kWh of electricity generated for onshore systems and 0.055 (±0.037) kWh/kWh for offshore systems. The wide standard deviations reflect variability in turbine sizes, technological configuration, site conditions, and system boundaries. Excluding turbines with capacities below 100 kW reduces the reported energy intensity range to 0.014–0.137 kWh/kWh [8].
Wind power plants typically require several months to a few years for construction and operate for 20–30 years. Figure 5 presents the GWP ranges associated with different wind power technologies, expressed in grams of CO2 equivalent per kilowatt-hour (gCO2eq/kWh). Onshore wind systems show a broad GWP range, from 2.02 to 116 gCO2eq/kWh, reflecting sensitivity to foundation design, transportation distances, turbine size, and site-specific wind conditions. Offshore wind power shows a higher minimum GWP but a narrower and lower maximum (up to 79 gCO2eq/kWh), suggesting more consistent life cycle performance, potentially due to standardized construction practices and higher average capacity factors.
Figure 5.
Global Warming Potential of various wind technologies. Green lines represent the minimum value, red lines the maximum value, blue lines the range of values, while dots the average value. Note: the size of the dots represents the numerosity of studies.
The influence of wind resource quality on life cycle emissions is further illustrated in Table 5, which reports GWP ranges according to IEC wind classes. Sites characterized by high wind availability (IEC class I) exhibit lower and more consistent GWP values, as turbines operate closer to optimal performance, distributing embodied emissions over a larger electricity output. Medium (class II) and low (class III) wind conditions are associated with progressively higher GWP ranges, highlighting the importance of site selection in minimizing life cycle emissions.
Table 5.
GWP ranges for different wind conditions.
Figure 6 summarizes the distribution of GWP contribution across different lifecycle stages of wind power plants, presented as minimum, average, and maximum percentage contributions to the total GWP. The core infrastructure phase, which includes turbine components (i.e., blades, towers, nacelles) and foundations, represents the dominant contributor, accounting for approximately 60% of total GWP on average. Upstream processes, including raw material extraction and processing, contribute around 27% on average but exhibit high variability across studies. The core process phase, encompassing operation and maintenance, and the downstream phase related to grid infrastructure and distribution, generally contribute smaller shares, although values approaching 20% are reported in specific cases. These results indicate that material choices, foundation design, and supply chain configuration play a critical role in determining the environmental performance of wind power systems.
Figure 6.
Share of Global Warming Potential across life cycle stages of wind power plants.
In addition to climate change impacts, wind power plants are associated with a range of other environmental considerations, summarized in Table 6. These include noise emissions, biodiversity impacts, visual effects, electromagnetic fields, land use, and water consumption. While many of these impacts are site-specific, appropriate planning, technological solutions, and regulatory measures can substantially mitigate their significance.
Table 6.
Broader Environmental Considerations of Wind Power Systems.
End-of-life management of wind turbine blades represents an emerging environmental challenge due to the widespread use of glass-fiber-reinforced thermosetting polymer composites, which are difficult to recycle using conventional methods [8,9]. As installed wind capacity continues to grow, blade waste volumes are projected to increase substantially. Current disposal options, such as landfilling and incineration, present environmental limitations, including land use requirements and inefficient material recovery with hazardous by-products. Several recycling pathways are under investigation, including mechanical, thermal (e.g., pyrolysis and fluidized bed processes), and chemical recycling, although each approach faces technical, economic, and scalability constraints. Alternative strategies, such as blade reuse and repurposing in civil and architectural applications, offer promising opportunities to extend material lifetime and reduce waste generation. Table 7 summarizes the main challenges and mitigation strategies related to wind turbine blade end-of-life management.
Table 7.
Summary of Wind Turbine Blade End-of-Life Considerations.
3.3. Hydropower Plants
Hydropower has historically represented the dominant renewable electricity source worldwide, providing reliable, flexible, and dispatchable power generation that effectively complements variable renewable technologies such as solar and wind [10]. Although its global expansion has slowed in recent decades due to environmental concerns, limited availability of suitable sites, and increasing competition from alternative technologies, hydropower remains among the most cost-effective sources of electricity. It also plays a critical role in grid stability and energy storage, particularly through pumped storage systems. A major challenge for the sector is the aging of existing infrastructure, which requires significant investments for refurbishment and modernization. To sustain hydropower’s contribution to long-term decarbonization objectives, several issues must be addressed, including lengthy permitting processes, mitigation of environmental impacts, performance upgrades of existing facilities, technological innovation to enhance operational flexibility, and adaptation to hydrological changes induced by climate change.
Hydropower systems exhibit considerable heterogeneity in scale, design, and environmental performance. Technology type and project size are key determinants of lifecycle greenhouse gas emissions. Large- and medium-scale hydropower facilities typically adopt accumulation-type, pumped storage, or weir-based configurations [11]. Accumulation systems rely on reservoirs formed by dams or surge weirs to regulate water storage and electricity generation. Pumped storage plants employ two reservoirs at different elevations, allowing electricity storage through water pumping during low-demand periods and electricity generation during peak demand. Weir-type plants use river regulation structures to control flow and optimize power output. In contrast, small-scale hydropower installations, including micro and pico systems, often utilize run-of-river (ROR), small-pumped storage, or compact weir-based configurations. ROR systems generally exploit the kinetic energy of flowing water without large-scale impoundment, while small-pumped storage and weir systems may combine natural and artificial hydraulic structures.
Hydropower projects typically involve long construction timelines, often ranging from 5 to 10 years, but benefit from exceptionally long operational lifetimes that frequently exceed 50 years and can surpass 100 years in some cases. This longevity can partially offset high initial environmental and economic investments, particularly for large-scale installations, when impacts are normalized per unit of electricity generated over the full life cycle.
Figure 7 reports the ranges of GWP values associated with different hydropower technologies, expressed in grams of CO2 equivalent per kilowatt-hour. Considerable variability is observed across technologies. Canal-based systems typically exhibit moderate GWP values, likely reflecting efficient integration with existing infrastructure and limited reservoir-related impacts. Reservoir-based hydropower plants display relatively contained GWP ranges, primarily driven by emissions associated with civil construction and, in some cases, methane release from flooded biomass, particularly in tropical regions. Run-of-river systems show a wide spectrum of GWP values, reflecting sensitivity to site-specific characteristics, plant design, and assumptions regarding infrastructure requirements. Pumped storage facilities exhibit the widest GWP range, with high values typically associated with scenarios in which electricity used for pumping originates from carbon-intensive sources, combined with emissions from extensive excavation and construction activities.
Figure 7.
Global Warming Potential of various hydropower plant technologies. Green lines represent the minimum value, red lines the maximum value, blue lines the range of values, while dots the average value. Note: the size of the dots represents the numerosity of studies.
The influence of plant size on GWP is illustrated in Table 8. Both small and large hydropower plants can achieve low GWP values; however, large-scale installations generally present narrower and lower maximum GWP values. This trend reflects economies of scale, optimized design solutions, and high load factors sustained over long operational lifetimes. In contrast, small-scale hydropower systems exhibit greater variability, with some cases reporting elevated GWP values due to the disproportionate construction impacts, lower capacity factors, or less efficient infrastructure relative to electricity output. These findings emphasize the importance of site-specific assessments, particularly for small hydropower projects.
Table 8.
GWP ranges for different sizes of the hydropower plants.
The distribution of GWP contributions across life cycle stages is summarized in Figure 8. On average, the core infrastructure phase dominates total emissions, accounting for nearly 69% of total GWP. This reflects the material- and energy-intensive nature of civil works, including dam construction, excavation, and concrete production. The core process phase, related to plant operation and maintenance, shows substantial variability depending on plant efficiency and lifespan. Upstream and downstream stages contribute marginally on average but may become more relevant in specific contexts, depending on system boundary definitions and modeling assumptions. These results highlight the importance of transparent system boundary selection and consistent methodological approaches in hydropower LCAs.
Figure 8.
Share of Global Warming Potential across life cycle stages of hydropower plants.
Beyond climate change impacts, hydropower plants are associated with a range of additional environmental and social considerations, summarized in Table 9. Key concerns include land use change and habitat loss, disruption of aquatic ecosystems, greenhouse gas emissions from flooded biomass, sediment trapping, water quality alteration, and social displacement. While many of these impacts are highly site-dependent, mitigation strategies such as careful site selection, environmental flow management, sediment management techniques, and stakeholder engagement can substantially reduce adverse effects. Addressing these broader impacts is essential to ensure that hydropower development remains environmentally and socially sustainable.
Table 9.
Broader Environmental Considerations of Hydropower Systems.
3.4. Nuclear Power Plants
Nuclear energy currently contributes approximately 10% of global electricity generation, with shares approaching 20% in several advanced economies [12]. It has historically represented one of the largest sources of low-carbon electricity and continues to offer significant potential for decarbonizing power systems. Despite persistent challenges, including public acceptance issues in some regions, high upfront capital costs, and long construction timelines (typically around 12 years), nuclear power provides reliable and dispatchable electricity generation, making it a suitable complement to intermittent renewable sources.
The economics of nuclear power are influenced by multiple factors, including reactor design, construction costs, safety requirements, fuel cycle configuration, waste management, and decommissioning strategies. Reported electricity generation costs typically range between $0.02 and $0.06 per kilowatt-hour, positioning nuclear power among the most cost-competitive low-carbon sources alongside hydropower. Like fossil-based thermal power plants, nuclear facilities operate on a steam cycle; however, heat generation occurs through controlled nuclear fission reactions within the reactor core. Enriched uranium fuel undergoes fission, releasing thermal energy that is transferred to water to produce steam and drive electricity-generating turbines. Residual decay heat must be continuously removed using cooling systems, most commonly water-based, to ensure operational safety. Modern nuclear reactors are built with stringent safety protocols, including containment structures and emergency cooling systems, to prevent accidents and limit radioactive releases.
Several reactor technologies are currently in operation or under development. Pressurized Water Reactors (PWRs) and Boiling Water Reactors (BWRs) are the most widely deployed designs, both using light water as coolant and moderator, with PWRs employing separate primary and secondary circuits. Pressurized Heavy Water Reactors (HWRs) enhance fuel efficiency and allow greater flexibility in fuel cycles using heavy water. Advanced Gas-cooled Reactors (AGRs) utilize carbon dioxide as coolant and graphite as moderator, achieving relatively high thermal efficiencies. Light Water Graphite Reactors (LWGRs) and Fast Neutron Reactors (FNRs), including Fast Breeding Reactors (FBRs), represent alternative designs with distinct performance and safety characteristics. FBRs, in particular, are capable of breeding fissile material and exhibit high fuel utilization efficiency. Small Modular Reactors (SMRs) constitute an emerging class of nuclear technologies characterized by standardized, factory-fabricated components, potentially enabling shorter construction times, enhanced safety features, and reduced costs. International initiatives such as the Generation IV International Forum aim to improve reactor sustainability, safety, and efficiency, with concepts such as the Very High-Temperature Reactor (VHTR) considered among the most promising advanced designs.
Life cycle GWP estimates for nuclear power vary considerably across studies, reflecting differences in reactor technology, fuel cycle configuration, system boundaries, and regional electricity mixes [13]. A key determinant of environmental performance is the uranium enrichment process. Gaseous diffusion, an older enrichment technology, is highly energy-intensive, whereas centrifuge enrichment is substantially more energy-efficient and associated with lower emissions [14]. The carbon intensity of electricity used during enrichment further influences overall GWP; enrichment performed in regions with low-carbon electricity mixes, such as France, results in significantly lower-life-cycle emissions. Uranium ore grade also affects environmental performance, as lower-grade ores require greater energy input for extraction and processing. Several studies indicate that depletion of high-grade uranium resources could increase future life-cycle emissions associated with nuclear fuel production [15]. For example, emissions may rise by more than 100% when uranium concentration decreases from 0.15% to 0.01%, with reported values reaching up to 130 gCO2eq/kWh in extreme cases [16].
Nuclear power plants typically involve long construction phases, often ranging from 5 to 15 years or more, but compensate for these initial impacts through extended operational lifetimes that commonly exceed 60 years and may be further prolonged through refurbishment and component replacement. Figure 9 summarizes the ranges of GWP values reported for different nuclear reactor technologies, expressed in grams of CO2 equivalent per kilowatt-hour (gCO2eq/kWh). Overall, the data indicate that nuclear technologies generally achieve low lifecycle GWP values compared to fossil-based electricity generation. FBRs exhibit the lowest reported maximum GWP values, while SMRs show relatively narrow and low ranges, likely reflecting standardized design and construction approaches. LWRs and GT-MHR, in contrast, present broader ranges and higher maximum values, suggesting greater sensitivity to design choices and fuel cycle assumptions. Fusion reactors, though still at the developmental stage, show moderate GWP values that likely reflect high material and construction requirements. Generation III+ reactors display relatively contained GWP values, consistent with design improvements aimed at enhanced efficiency and safety.
Figure 9.
Global Warming Potential of various nuclear power plant technologies. (PWR = Pressurized Water Reactor; LWR = Light Water Reactor; BWR = Boiling Water Reactor; GT-MHR = Gas Turbine Modular Helium Reactor; FBR = Fast Breeding Reactor; FR = Fusion Reactor; HWR = Heavy Water Reactor; SMR = Small Modular Reactor; GCR = Gas-Cooled Reactor; Gen III+ = Generation III+ nuclear reactors). Green lines represent the minimum value, red lines the maximum value, blue lines the range of values, while dots the average value. Note: the size of the dots represents the numerosity of studies.
The influence of uranium enrichment technology on life-cycle emissions is further illustrated in Table 10. Gaseous diffusion enrichment consistently exhibits substantially higher GWP ranges than centrifuge enrichment, due to its high electricity demand. The wide variability observed within gaseous diffusion systems highlights the importance of the electricity mix used during enrichment. Although uranium ore grade is recognized as an important factor affecting environmental performance, the available literature does not yet provide sufficient data to establish a robust quantitative relationship between ore grade and GWP across all reactor types.
Table 10.
GWP ranges for different types of enrichment of nuclear power plants.
The distribution of GWP contributions across life cycle stages is presented in Figure 10. The upstream stage, encompassing uranium mining, milling, conversion, enrichment, and fuel fabrication, dominates total life-cycle emissions, contributing more than 55% on average. Core infrastructure processes -including plant construction and decommissioning- represent the second largest contribution, reflecting the material- and energy-intensive nature of nuclear facilities. Operational and downstream processes generally contribute to smaller shares but exhibit variability depending on plant efficiency, waste management strategies, and system boundary assumptions. These results indicate that the environmental performance of nuclear power is primarily governed by fuel cycle characteristics and construction practices, while electricity generation itself remains largely carbon-free.
Figure 10.
Share of Global Warming Potential across life cycle stages of nuclear power plants.
Beyond climate change impacts, nuclear power plants are associated with a range of additional environmental and social considerations, summarized in Table 11. These include air pollutant emissions during upstream processes, high water consumption for cooling, long-lived radioactive waste generation, resource availability concerns related to uranium supply, delayed carbon payback due to long construction periods, and challenges related to public acceptance and siting. Addressing these aspects through improved fuel cycle efficiency, advanced reactor designs, transparent governance, and robust waste management strategies is essential to optimizing the sustainability of nuclear power systems.
Table 11.
Broader Environmental Considerations of Nuclear Power Plants.
3.5. Natural Gas Power Plants
Natural gas accounts for about one-quarter of global electricity production, largely due to its flexibility, widespread availability, and lower environmental impact compared to other fossil fuels. Its transportability via pipelines or as liquified natural gas (LNG) enables rapid response to fluctuations in electricity demand, making natural gas power plants particularly suitable for load-following and balancing variable renewable energy sources. These plants typically have relatively short construction times, often within a few years, and operational lifetimes of around 30–40 years. Electricity generation costs generally range from $0.03 to $0.07 per kWh, depending primarily on fuel prices, plant efficiency, and regional market conditions.
Two main technological configurations dominate natural gas-based electricity generation. Simple Cycle Gas Turbines (SCGTs) operate by compressing air, mixing it with natural gas, and combusting the mixture to directly drive a turbine. SCGTs are valued for their fast startup times and operational flexibility but exhibit relatively low thermal efficiencies, typically between 30% and 40%. Combined Cycle Gas Turbine (CCGT) plants integrate a gas turbine with a steam turbine, recovering waste heat from the exhaust gases to produce additional electricity through a secondary steam cycle. As a result, CCGT systems achieve significantly higher efficiencies, commonly ranging from 40% to 75%, and are generally more favorable from both environmental and economic perspectives.
Natural gas is often regarded as a transitional fuel in the decarbonization of electricity systems, as it can reduce CO2 emissions by up to 73% compared to coal-fired power generation [20], while also emitting lower levels of SO2, NOx, and particulate matter. However, the climate benefits of natural gas are partially offset by methane (CH4) emissions occurring during fuel extraction, processing, transmission, and distribution. Methane’s high GWP makes these upstream emissions a critical determinant of the overall life-cycle environmental performance of natural gas power plants [21].
Figure 11 presents the ranges of life-cycle GWP values reported for different natural gas power plant technologies, expressed in grams of CO2 equivalent per kilowatt-hour. SCGT plants exhibit the highest GWP ranges, primarily due to their lower conversion efficiency. CCGT plants demonstrate substantially lower GWP values, reflecting improved fuel utilization. The integration of carbon capture and storage (CCS) technologies further reduces life-cycle emissions, with CCGT plants equipped with CCS showing GWP values that are significantly lower than those of conventional gas-fired systems. These results highlight the strong influence of efficiency improvements and emission control technologies on the environmental performance of natural gas electricity generation.
Figure 11.
Global Warming Potential of natural gas power plant technologies. Green lines represent the minimum value, red lines the maximum value, blue lines the range of values, while dots the average value. Note: the size of the dots represents the numerosity of studies.
CCS technologies can be implemented through pre-combustion capture, post-combustion capture, or oxy-fuel combustion, with their effectiveness depending on technological maturity, capture efficiency, energy penalties, and fuel characteristics. Reported reductions in greenhouse gas impacts range from approximately 47% to 85.5%, although these gains are accompanied by trade-offs, including increased energy demand, solvent consumption, and additional environmental impacts associated with CO2 compression, transport, and long-term storage. Carbon capture and utilization (CCU) represents an alternative or complementary approach, particularly in regions where suitable geological storage is limited. Captured CO2 can be employed in applications such as enhanced oil recovery, mineral carbonation for construction materials, or biological processes, including algae cultivation for biofuels or greenhouse applications [22]. According to Baena-Moreno et al. [23], CCU pathways can reduce life-cycle CO2 emissions by approximately 29–58%, although actual mitigation potential strongly depends on the specific utilization route and system boundaries adopted.
The contribution of different life-cycle stages to total GWP is summarized in Figure 12. On average, the core process stage—namely fuel combustion during electricity generation—accounts for approximately 90% of total life-cycle GWP, with reported values ranging from 81% to 98%. Upstream processes, including fuel extraction, processing, and transport, contribute between 2% and 6%, while core infrastructure and downstream stages generally represent a negligible share in most studies. In some cases, however, end-of-life activities and decommissioning can contribute to a non-negligible fraction of total impacts. Overall, these findings indicate that mitigation strategies for natural gas power plants should prioritize improvements in thermal efficiency, reduction in methane leakage along the supply chain, and the deployment of CCS and CCU technologies.
Figure 12.
Share of GWP across life cycle stages of natural gas power plants.
Beyond climate change impacts, natural gas power plants are associated with additional environmental considerations, summarized in Table 12. These include air pollutant emissions, water consumption for cooling, land use impacts related to pipeline and infrastructure development, and variability in life-cycle carbon footprints depending on technological configuration and emission control measures. Addressing these issues requires a combination of technological improvements, regulatory frameworks targeting methane leakage, and integrated life-cycle-based decision-making to ensure that natural gas can effectively contribute to near- and medium-term decarbonization goals.
Table 12.
Broader Environmental Considerations of Natural Gas Power Plants.
4. Discussion
The systematic review confirms that Life Cycle Assessment is a widely adopted and robust framework for evaluating the impacts of electricity generation technologies. Across solar photovoltaic, wind, hydropower, nuclear, and natural gas power plants, LCA enables the identification of key environmental hotspots along the full life cycle, supporting technology comparison and informing energy policy and system planning. At the same time, the results reveal substantial variability in reported impacts, particularly for GWP, but also for other relevant impact categories such as resource use, land occupation, and water consumption.
A central outcome of this review is that methodological choices exert a decisive influence on LCA results. Differences in system boundary definition, functional units, assumed plant lifetime and capacity factor, background electricity mixes, and levels of technological detail lead to considerable dispersion in reported environmental impacts, even within the same technology category. This variability is evident across all electricity generation options but is especially pronounced for technologies characterized by complex supply chains or large-scale infrastructure, such as nuclear power and hydropower. Consequently, direct comparisons based on individual LCA studies or average values should be interpreted with caution, as they may obscure underlying methodological inconsistencies rather than reflect intrinsic technological performance.
Despite this variability, some robust patterns emerge. The analyzed literature consistently indicates that renewable and nuclear electricity technologies exhibit relatively low life-cycle greenhouse gas emissions, with median or central values generally below 50 gCO2eq/kWh. Wind and hydropower systems typically report GWP values in the range of approximately 5–30 gCO2eq/kWh, while solar photovoltaic systems tend to fall between roughly 20 and 80 gCO2eq/kWh, depending on technology type, manufacturing location, and assumed operational lifetime. Nuclear power plants commonly display life-cycle GWP values between 5 and 25 gCO2eq/kWh, with construction and fuel cycle stages dominating total impacts. In contrast, natural gas power plants show substantially higher life-cycle emissions, particularly for combined-cycle configurations without carbon capture, with typical values between 400 and 600 gCO2eq/kWh, largely driven by combustion-related emissions. These differences are illustrated in Figure 13.
Figure 13.
Typical ranges of life cycle GWP for electricity generation technologies reported in the literature (in logarithmic scale). The central line indicates the median; boxes represent the interquartile range (IQR, Q1–Q3); whiskers extend to 1.5 × IQR; circles denote outliers.
Beyond climate change, other environmental impact categories highlight important trade-offs between technologies. Hydropower generally performs well in terms of GWP but can entail significant land use change and ecological disruption. Wind and solar technologies, while exhibiting low operational emissions, tend to show higher material- and resource-related impacts per unit of electricity due to their infrastructure-intensive nature. Importantly, the spread of reported impact values within a single technology often equals or exceeds the differences observed between technologies. This finding underscores that methodological assumptions and contextual factors play a role comparable to, or greater than, technology choice itself, reinforcing the need for careful interpretation of quantitative LCA results.
Another critical issue emerging from this review is the predominantly deterministic nature of most LCA studies. Electricity generation systems are complex socio-technical infrastructures subject to multiple sources of uncertainty, including variability in life cycle inventory data, future operational conditions, capacity factors, technological learning, and changes in background systems such as electricity mixes and material production pathways. However, the majority of reviewed studies report point estimates or broad ranges without systematically propagating uncertainty or clearly identifying its sources. This practice risks conveying a misleading sense of precision, particularly when LCA outcomes are used to support policy decisions or long-term infrastructure planning. Small numerical differences in reported GWP values are frequently interpreted as evidence of superior environmental performance, even though such differences may fall well within the uncertainty associated with modeling assumptions and data variability. The limited and non-standardized application of probabilistic LCA approaches further complicates the distinction between meaningful performance differences and methodological noise. As a result, deterministic rankings of electricity technologies based solely on LCA results should be treated with caution.
In addition to uncertainty, the review highlights structural limitations related to the temporal representation of impacts and the exclusion of technological risk. Conventional LCAs aggregate environmental impacts over the entire life cycle without accounting for the timing of emissions and benefits. This static treatment is particularly relevant for long-lived infrastructure, such as hydropower and nuclear power plants, where construction-related emissions occur upfront, while environmental benefits accrue over several decades. Moreover, technological risks associated with construction complexity, regulatory exposure, operational reliability, or extreme events are largely absent from conventional LCA frameworks, despite their relevance for large-scale energy systems.
Table 13 summarizes the main sources of uncertainty affecting LCA studies of power plants and their typical treatment in the literature. The overview illustrates that uncertainty is often implicitly embedded rather than explicitly addressed, limiting the interpretability and comparability of results. Addressing these limitations would require broader adoption of sensitivity and uncertainty analyses, improved transparency in methodological assumptions, and increased use of dynamic and probabilistic LCA approaches. Overall, the findings of this review suggest that while LCA remains an indispensable tool for assessing the environmental performance of electricity generation technologies, its results should be interpreted as ranges of plausible outcomes rather than precise values. Greater methodological harmonization, explicit uncertainty treatment, and improved temporal and risk representation would enhance the robustness of LCA-based comparisons and strengthen their relevance for supporting the energy transition.
Table 13.
Main sources of uncertainty in LCA of power plants and their typical treatment in the literature.
Following the synthesis presented in Table 13, it is important to emphasize that both the relative importance of uncertainty sources and the geographical scope of the selected studies vary substantially across power generation technologies. For solar photovoltaic systems, most LCAs are based on manufacturing processes located in East Asia, combined with deployment scenarios in Europe or North America. As a result, reported impacts are strongly influenced by assumptions regarding manufacturing electricity mixes, module transport distances, degradation rates, and system lifetime. Wind power plants are predominantly assessed in European contexts, where mature supply chains and relatively homogeneous regulatory frameworks contribute to more consistent system boundaries, with variability mainly driven by site-specific wind conditions and capacity factors. Hydropower and nuclear power plants exhibit the highest heterogeneity in both geographical scope and system definition. Hydropower LCAs span a wide range of climatic regions, including temperate and tropical areas, leading to substantial differences in land-use change, reservoir-related emissions, and infrastructure requirements. Nuclear power studies reflect diverse national fuel cycle configurations, particularly with respect to uranium mining locations, enrichment technologies, and background electricity mixes, which significantly affect upstream emissions. In contrast, natural gas power plant LCAs tend to adopt more standardized scopes focused on fuel extraction, combustion, and efficiency, yet remain highly sensitive to country-specific methane leakage rates and fuel supply chains. Across all technologies, differences in system boundary definition—particularly the inclusion or exclusion of grid infrastructure, storage, end-of-life stages, and indirect upstream processes—represent a dominant source of variability, often exceeding the influence of technology-specific design parameters. Given this combination of geographical diversity and methodological heterogeneity, life cycle results should be interpreted as indicative ranges rather than precise values. Comparative conclusions based on single-point estimates may therefore be misleading, underscoring the need for transparent reporting of country context, scope definition, and background system assumptions in future LCA studies.
Based on the evidence emerging from this review, several recommendations can be formulated to support more robust and decision-relevant LCAs of power generation technologies:
- Harmonized system boundaries should be explicitly defined and justified, particularly for infrastructure-intensive technologies (e.g., hydropower, nuclear, offshore wind), where construction, auxiliary systems, and grid connections can dominate life cycle impacts.
- Key technical assumptions, including plant lifetime, capacity factor, efficiency, and degradation rates, should be transparently reported and explored through sensitivity or scenario analyses, as small variations can substantially alter GWP outcomes.
- Geographical context and background systems (electricity mix, material production routes, fuel supply chains) must be clearly specified, as country-level differences consistently emerge as major drivers of variability across technologies.
- Upstream processes require careful modeling, especially for nuclear and natural gas systems, where fuel extraction, processing, and enrichment stages represent dominant contributors to life cycle emissions.
- Uncertainty treatment should be strengthened by moving beyond deterministic point estimates and systematically applying sensitivity or probabilistic approaches to improve result robustness and interpretability.
From a policy perspective, the findings of this review suggest that LCA-based evidence used to support energy planning should extend beyond static life-cycle indicators. Decision-making frameworks would benefit from explicitly accounting for the timing of emissions over long infrastructure lifetimes and from integrating technology-specific risk profiles, including construction delays, operational uncertainty, and exposure to extreme events, to enable more resilient and forward-looking energy transition strategies.
5. Conclusions
This systematic review synthesizes Life Cycle Assessment studies and Environmental Product Declarations concerning the environmental performance of primary electricity generation technologies, including solar photovoltaic, wind, hydropower, nuclear, and natural gas power plants. The consolidated evidence confirms substantial differences in life-cycle Global Warming Potential across technologies, with wind, hydropower, nuclear, and solar photovoltaic power plants typically exhibiting GWP values below 50 gCO2eq/kWh, while natural gas-based power generation—particularly combined-cycle plants without carbon capture—shows significantly higher impacts, typically in the range of 400–600 gCO2eq/kWh, dominated by operational emissions. Beyond climate change, the review highlights that other environmental dimensions, such as resource use, land occupation, water-related impacts, and ecological effects, play a critical role in shaping the overall environmental profile of power plants and may alter technology rankings depending on the impact category considered. Infrastructure-intensive technologies tend to exhibit higher upstream and construction-related impacts, whereas fossil-based systems are primarily influenced by fuel combustion and associated supply chains. A key finding of this review is the pronounced variability of reported LCA results within the same technology, often comparable to or exceeding differences across technologies. This variability is largely attributable to methodological choices, including system boundaries, assumptions on plant lifetime and capacity factor, background energy systems, and data sources. The widespread use of deterministic point estimates, combined with the limited and non-standardized treatment of uncertainty, risks overstating the robustness of comparative conclusions. In addition, conventional LCAs typically adopt a static representation of long-lived infrastructures and neglect technological risk, further constraining their ability to fully inform long-term energy infrastructure decisions. From a policy and planning perspective, these findings suggest that LCA results for power plants should be interpreted as indicative ranges rather than exact rankings of technologies. Transparent reporting of assumptions, sensitivity to key parameters, and explicit acknowledgment of uncertainty are essential when using LCA to support energy strategy and climate mitigation decisions. Future research should focus on enhancing LCA methodologies that explicitly incorporate uncertainty analysis, temporal dynamics, and risk considerations, while preserving transparency and comparability. Strengthening these aspects will enhance the reliability and policy relevance of LCA as a decision-support tool for the transition toward low-carbon electricity systems.
Supplementary Materials
The following supporting information can be downloaded at: https://www.mdpi.com/article/10.3390/su18041994/s1, Table S1: PRISMA checkliste.
Author Contributions
Conceptualization, B.M.; methodology, B.M.; data curation, E.B. and B.M.; writing—original draft preparation, B.M.; writing—review and editing, B.M., E.B., L.E.Z. All authors have read and agreed to the published version of the manuscript.
Funding
This research received no external funding.
Institutional Review Board Statement
Not applicable.
Informed Consent Statement
Not applicable.
Data Availability Statement
All data used in this study are derived from published literature and Environmental Product Declarations, which are cited within the paper. The harmonized datasets generated and analyzed during the current study are available from the corresponding author upon reasonable request.
Acknowledgments
This work was developed within the framework of the project “2022J534JS—Toward net-zero infrastructure: advancing the environmental and economic appraisal of power plants (NE2AP)”, funded under PRIN 2022 (Italy). Given the nature of this research project, which aims to produce basic research funded by public funds and whose results are intended to be disseminated and made accessible to the public, the cases presented were selected based on the availability and accessibility of public data.
Conflicts of Interest
The authors declare no conflicts of interest.
Appendix A
The data reported in the Appendix tables are derived from a combination of peer-reviewed literature, institutional reports, and manufacturer Environmental Product Declarations (EPDs).
Table A1.
Summary of LCA studies on the GHG intensity of hydropower generation (gCO2eq/kWh). LCA phases are indicated as: PH1 = construction & O&M, PH2 = decommissioning, PH3 = reservoir emissions.
Table A2.
Summary of LCA studies on the GHG intensity of natural gas power generation (gCO2eq/kWh). LCA phases are indicated as: PH1 = construction, PH2 = operation & maintenance (O&M), PH3 = decommissioning.
Table A3.
Summary of LCA studies on the GHG intensity of photovoltaic (PV) power generation (gCO2eq/kWh). LCA phases are indicated as: PH1 = installation, PH2 = operation & maintenance (O&M), PH3 = end of life (EoL).
Table A4.
Summary of LCA studies on the GHG intensity of wind power generation (gCO2eq/kWh). Columns include upstream, core infrastructure, core process, downstream contribution, GWP min–max, turbine rated power, and plant size.
Table A5.
Summary of LCA studies on the GHG intensity of nuclear power generation (gCO2eq/kWh).
Appendix B
Table A6.
PRISMA checklist.
References
- Das, U.; Nandi, C. Life cycle assessment of wind farm: A review on current status and future knowledge. Energy Clim. Change 2025, 6, 100206. [Google Scholar] [CrossRef] [Scilit]
- Mwakangale, J.; Cook, D.; Ogmundarson, O.; Davíðsdottir, B. A systematic review on the application of lifecycle-based approaches in assessing sustainability of hydropower. Renew. Sustain. Energy Rev. 2025, 219, 115841. [Google Scholar] [CrossRef] [Scilit]
- Jungbluth, N. Life Cycle Assessment of Crystalline Photovoltaic in the Swiss ecoinvent Database. Progress in Photovoltaics: Res. Appl. 2005, 13, 429–446. [Google Scholar] [CrossRef] [Scilit]
- Phillips, J. Determining the sustainability of large-scale photovoltaic solar power plants. Renew. Sustain. Energy Rev. 2013, 27, 435–444. [Google Scholar] [CrossRef] [Scilit]
- Gargiulo, A.; Carvalho, M.L.; Girardi, P. Life Cycle Assessment of Italian Electricity Scenarios to 2030. Energies 2020, 13, 3852. [Google Scholar] [CrossRef] [Scilit]
- Page, M.J.; McKenzie, J.E.; Bossuyt, P.M.; Boutron, I.; Hoffmann, T.C.; Mulrow, C.D.; Shamseer, L.; Tetzlaff, J.M.; Akl, E.A.; Brennan, S.E.; et al. The PRISMA 2020 statement: An updated guideline for reporting systematic reviews. BMJ 2021, 372, n71. [Google Scholar] [CrossRef] [Scilit]
- Frischknecht, R.; Stolz, P.; Krebs, L.; de Wild-Scholten, M.; Sinha, P. Life Cycle Inventories and Life Cycle Assessments of Photovoltaic Systems; Report IEA-PVPS T12-19; International Energy Agency: Paris, France, 2020; Available online: https://iea-pvps.org/wp-content/uploads/2020/12/IEA-PVPS-LCI-report-2020.pdf (accessed on 29 January 2026).
- Arvesen, A.; Hertwich, E.G. Assessing the life cycle environmental impacts of wind power: A review of present knowledge and research needs. Renew. Sustain. Energy Rev. 2012, 16, 5994–6006. [Google Scholar] [CrossRef] [Scilit]
- Rathore, N.; Panwar, N.L. Environmental impact and waste recycling technologies for modern wind turbines: An overview. Waste Manag. Res. 2022, 41, 744–759. [Google Scholar] [CrossRef] [Scilit]
- International Energy Agency (IEA). Hydropower Special Market Report (Executive Summary); International Energy Agency: Paris, France, 2021; Available online: https://www.iea.org/reports/hydropower-special-market-report/executive-summary (accessed on 29 January 2026).
- Tkáč, S. Hydro power plants, an overview of the current types and technology. SSP J. Civ. Eng. 2018, 13, 115–126. [Google Scholar] [CrossRef] [Scilit]
- International Energy Agency (IEA). Nuclear Power. 2023. Available online: https://www.iea.org/energy-system/electricity/nuclear-power#tracking (accessed on 27 June 2025).
- Gibon, T.; Menacho, A.H. Parametric Life cycle assessment of nuclear power for simplified models. Environ. Sci. Technol. 2023, 57, 14194–14205. [Google Scholar] [CrossRef] [Scilit] [PubMed]
- Fthenakis, V.M.; Kim, H.C. Greenhouse-gas emissions from solar electric- and nuclear power: A life-cycle study. Energy Policy 2007, 35, 2549–2557. [Google Scholar] [CrossRef] [Scilit]
- Pomponi, F.; Hart, J. The greenhouse gas emissions of nuclear energy—Life cycle assessment of a European pressurised reactor. Appl. Energy 2021, 290, 116743. [Google Scholar] [CrossRef] [Scilit]
- Lenzen, M. Life cycle energy and greenhouse gas emissions of nuclear energy: A review. Energy Convers. Manag. 2008, 49, 2178–2199. [Google Scholar] [CrossRef] [Scilit]
- Turconi, R.; Boldrin, A.; Astrup, T. Life cycle assessment (LCA) of electricity generation technologies: Overview, comparability and limitations. Renew. Sustain. Energy Rev. 2013, 28, 555–565. [Google Scholar] [CrossRef] [Scilit]
- Feng, K.; Hubacek, K.; Siu, X.L.; Li, X. The energy and water nexus in Chinese electricity production: A hybrid life cycle analysis. Renew. Sustain. Energy Rev. 2014, 39, 342–355. [Google Scholar] [CrossRef] [Scilit]
- Alwaeli, M.; Mannheim, V. Investigation into the Current State of Nuclear Energy and Nuclear Waste Management—A State-of-the-Art Review. Energies 2022, 15, 4275. [Google Scholar] [CrossRef] [Scilit]
- Zichittella, G.; Perez-Ramirez, J. Status and prospects of the decentralised valorisation of natural gas into energy and energy carriers. Chem. Soc. Rev. 2021, 50, 2984–3012. [Google Scholar] [CrossRef] [Scilit]
- Moore, C.W.; Zielinska, B.; Petron, G.; Jackson, R.B. Air Impacts of Increased Natural Gas Acquisition, Processing, and Use: A Critical review. Environ. Sci. Technol. 2014, 48, 8349–8359. [Google Scholar] [CrossRef] [Scilit] [PubMed]
- Marchi, B.; Zanoni, S.; Pasetti, M. Industrial Symbiosis for Greener Horticulture Practices: The CO2 Enrichment from Energy Intensive Industrial Processes. Procedia CIRP 2018, 69, 562–567. [Google Scholar] [CrossRef] [Scilit]
- Baena-Moreno, F.M.; Rodríguez-Galán, M.; Vega, F.; Alonso-Fariñas, B.; Vilches Arenas, L.F.; Navarrete, B. Carbon capture and utilization technologies: A literature review and recent advances. Energy Sources Part A Recovery Util. Environ. Eff. 2019, 41, 1403–1433. [Google Scholar] [CrossRef] [Scilit]
- Mahmud, M.A.P.; Huda, N.; Farjana, S.H.; Lang, C. Life-cycle impact assessment of renewable electricity generation systems in the United States. Renew. Energy 2020, 151, 1028–1045. [Google Scholar] [CrossRef] [Scilit]
- Li, Z.; Du, H.; Xiao, Y.; Guo, J. Carbon footprints of two large hydro-projects in China: Life-cycle assessment according to ISO/TS 14067. Renew. Energy 2017, 114, 534–546. [Google Scholar] [CrossRef] [Scilit]
- Liu, X.; Zheng, X.; Wu, L.; Deng, S.; Pan, H.; Zou, J.; Zhang, X.; Luo, Y. Techno-ecological synergies of hydropower plants: Insights from GHG mitigation. Sci. Total Environ. 2022, 853, 158602. [Google Scholar] [CrossRef] [Scilit]
- Mahmud, M.A.P.; Huda, N.; Farjana, S.H.; Lang, C. A strategic impact assessment of hydropower plants in alpine and non-alpine areas of Europe. Appl. Energy 2019, 250, 198–214. [Google Scholar] [CrossRef] [Scilit]
- Geller, M.; Meneses, A.A.D.M. Life Cycle Assessment of a Small Hydropower Plant in the Brazilian Amazon. J. Sustain. Dev. Energy Water Environ. Syst. 2016, 4, 379–391. [Google Scholar] [CrossRef] [Scilit]
- Pang, M.; Zhang, L.; Wang, C.; Liu, G. Environmental life cycle assessment of a small hydropower plant in China. Int. J. Life Cycle Assess. 2015, 20, 796–806. [Google Scholar] [CrossRef] [Scilit]
- Ribeiro, F.D.M.; Da Silva, G.A. Life-cycle inventory for hydroelectric generation: A Brazilian case study. J. Clean. Prod. 2010, 18, 44–54. [Google Scholar] [CrossRef] [Scilit]
- Tang, C.; Leng, Y.; Wang, P.; Feng, J.; Zhang, S.; Yi, Y.; Li, H.; Tian, S. Study on carbon emissions of a small hydropower plant in Southwest China. Front. Environ. Sci. 2024, 12, 1462571. [Google Scholar] [CrossRef] [Scilit]
- Bidoglio, G.; Berger, M.; Finkbeiner, M. An environmental assessment of small hydropower in India: The real costs of dams’ construction under a life cycle perspective. Int. J. Life Cycle Assess. 2019, 24, 419–440. [Google Scholar] [CrossRef] [Scilit]
- Verán-Leigh, D.; Vázquez-Rowe, I. Life cycle assessment of run-of-river hydropower plants in the Peruvian Andes: A policy support perspective. Int. J. Life Cycle Assess. 2019, 24, 1376–1395. [Google Scholar] [CrossRef] [Scilit]
- Liu, X.; Jiang, Y.; Zheng, X.; Hou, W.; Chen, X.; Xiao, S.; Zhang, X.; Deng, S.; Hao, J.; Luo, H.; et al. Moving towards co-benefits of hydropower: Ecological efficiency evaluation based on LCA and DEA. Environ. Impact Assess. Rev. 2023, 102, 107208. [Google Scholar] [CrossRef] [Scilit]
- Goswami, D.; Bhattacharjee, A.; Basak, P.; Das, U.; Nandi, C. Life cycle assessment: A perspective of improvement of hydro-plants for intensify “green electricity”. Energy Nexus 2023, 10, 100201. [Google Scholar] [CrossRef] [Scilit]
- Aung, T.S.; Fischer, T.B.; Azmi, A.S. Are large-scale dams environmentally detrimental? Life-cycle environmental consequences of mega-hydropower plants in Myanmar. Int. J. Life Cycle Assess. 2020, 25, 1749–1766. [Google Scholar] [CrossRef] [Scilit]
- Suwanit, W.; Gheewala, S.H. Life cycle assessment of mini-hydropower plants in Thailand. Int. J. Life Cycle Assess. 2011, 16, 849–858. [Google Scholar] [CrossRef] [Scilit]
- Gagnon, L.; Bélanger, C.; Uchiyama, Y. Life-cycle assessment of electricity generation options: The status of research in year 2001. Energy Policy 2002, 30, 1267–1278. [Google Scholar] [CrossRef] [Scilit]
- Wang, M.; Yao, M.; Wang, S.; Qian, H.; Zhang, P.; Wang, Y.; Sun, Y.; Wei, W. Study of the emissions and spatial distributions of various power-generation technologies in China. J. Environ. Manag. 2021, 278, 111401. [Google Scholar] [CrossRef] [Scilit]
- Wang, L.; Wang, Y.; Du, H.; Zuo, J.; Li, R.Y.M.; Zhou, Z.; Bi, F.; Garvlehn, M.P. A comparative life-cycle assessment of hydro-, nuclear and wind power: A China study. Appl. Energy 2019, 249, 37–45. [Google Scholar] [CrossRef] [Scilit]
- Mallia, E.; Lewis, G. Life cycle greenhouse gas emissions of electricity generation in the province of Ontario, Canada. Int. J. Life Cycle Assess. 2013, 18, 377–391. [Google Scholar] [CrossRef] [Scilit]
- Briones Hidrovo, A.; Uche, J.; Martínez-Gracia, A. Accounting for GHG net reservoir emissions of hydropower in Ecuador. Renew. Energy 2017, 112, 209–221. [Google Scholar] [CrossRef] [Scilit]
- Pascale, A.; Urmee, T.; Moore, A. Life cycle assessment of a community hydroelectric power system in rural Thailand. Renew. Energy 2011, 36, 2799–2808. [Google Scholar] [CrossRef] [Scilit]
- Lazo-Vásquez, D.; Urbina, C.; Rivela, B. On the Potential Environmental Repercussions of Hydroelectricity: A Contribution Based on Life Cycle Assessment of Ecuadorian Hydropower Plants. Rev. Virtual Química 2022, 14, 50–55. [Google Scholar] [CrossRef] [Scilit]
- Bor, A.; Üçtuğ, F.G. Environmental and economic life cycle assessment of a run-of-the-river type hydroelectricity power plant in Turkey. Environ. Prog. Sustain. Energy 2022, 41, e13716. [Google Scholar] [CrossRef] [Scilit]
- Simon, T.R.; Inman, D.; Hanes, R.; Avery, G.; Hettinger, D.; Heath, G. Life Cycle Assessment of Closed-Loop Pumped Storage Hydropower in the United States. Environ. Sci. Technol. 2023, 57, 12251–12258. [Google Scholar] [CrossRef] [Scilit]
- Li, X.; Gui, F.; Li, Q. Can Hydropower Still Be Considered a Clean Energy Source? Compelling Evidence from a Middle-Sized Hydropower Station in China. Sustainability 2019, 11, 4261. [Google Scholar] [CrossRef] [Scilit]
- Ueda, T.; Roberts, E.S.; Norton, A.; Styles, D.; Williams, A.P.; Ramos, H.M.; Gallagher, J. A life cycle assessment of the construction phase of eleven micro-hydropower installations in the UK. J. Clean. Prod. 2019, 218, 1–9. [Google Scholar] [CrossRef] [Scilit]
- Hanafi, J.; Riman, A. Life Cycle Assessment of a Mini Hydro Power Plant in Indonesia: A Case Study in Karai River. Procedia CIRP 2015, 29, 444–449. [Google Scholar] [CrossRef] [Scilit]
- Siddiqui, O.; Dincer, I. Comparative assessment of the environmental impacts of nuclear, wind and hydro-electric power plants in Ontario: A life cycle assessment. J. Clean. Prod. 2017, 164, 848–860. [Google Scholar] [CrossRef] [Scilit]
- Gallagher, J.; Styles, D.; McNabola, A.; Williams, A.P. Life cycle environmental balance and greenhouse gas mitigation potential of micro-hydropower energy recovery in the water industry. J. Clean. Prod. 2015, 99, 152–159. [Google Scholar] [CrossRef] [Scilit]
- Varun Prakash, R.; Bhat, I.K. Life Cycle Energy and GHG Analysis of Hydroelectric Power Development in India. Int. J. Green Energy 2010, 7, 361–375. [Google Scholar] [CrossRef] [Scilit]
- Zhang, Q.; Karney, B.; MacLean, H.L.; Feng, J. Life-Cycle Inventory of Energy Use and Greenhouse Gas Emissions for Two Hydropower Projects in China. J. Infrastruct. Syst. 2007, 13, 271–279. [Google Scholar] [CrossRef] [Scilit]
- Varun; Prakash, R.; Bhat, I.K. Life cycle greenhouse gas emissions estimation for small hydropower schemes in India. Energy 2012, 44, 498–508. [Google Scholar] [CrossRef] [Scilit]
- Vattenfall, A.B. Summary of EPD® of Electricity from Vattenfall’s Nordic Hydropower [EPD]. 2021. Available online: https://www.environdec.com/library/epd88 (accessed on 31 January 2026).
- Farquharson, D.; Jaramillo, P.; Schivley, G.; Klima, K.; Carlson, D.; Samaras, C. Beyond Global Warming Potential: A Comparative Application of Climate Impact Metrics for the Life Cycle Assessment of Coal and Natural Gas Based Electricity. J. Ind. Ecol. 2017, 21, 857–873. [Google Scholar] [CrossRef] [Scilit]
- Navajas, A.; Mendiara, T.; Goñi, V.; Jiménez, A.; Gandía, L.M.; Abad, A.; García-Labiano, F.; De Diego, L.F. Life cycle assessment of natural gas fuelled power plants based on chemical looping combustion technology. Energy Convers. Manag. 2019, 198, 111856. [Google Scholar] [CrossRef] [Scilit]
- Kazemi, A.; Moreno, J.; Iribarren, D. Economic optimization and comparative environmental assessment of natural gas combined cycle power plants with CO2 capture. Energy 2023, 277, 127661. [Google Scholar] [CrossRef] [Scilit]
- Šerešová, M.; Štefanica, J.; Vitvarová, M.; Zakuciová, K.; Wolf, P.; Kočí, V. Life Cycle Performance of Various Energy Sources Used in the Czech Republic. Energies 2020, 13, 5833. [Google Scholar] [CrossRef] [Scilit]
- Meng, F.; Dillingham, G. Life Cycle Analysis of Natural Gas-Fired Distributed Combined Heat and Power versus Centralized Power Plant. Energy Fuels 2018, 32, 11731–11741. [Google Scholar] [CrossRef] [Scilit]
- Shah, B.; Unnikrishnan, S. Sustainability assessment of gas based power generation using a life cycle assessment approach: A case study from India. Manag. Environ. Qual. Int. J. 2018, 29, 826–841. [Google Scholar] [CrossRef] [Scilit]
- Dalir, F.; Shafiepour Motlagh, M.; Ashrafi, K. Sensitivity analysis of parameters affecting carbon footprint of fossil fuel power plants based on life cycle assessment scenarios. Glob. J. Environ. Sci. Manag. 2017, 3, 75–88. [Google Scholar] [CrossRef] [Scilit]
- Barbera, E.; Mio, A.; Massi Pavan, A.; Bertucco, A.; Fermeglia, M. Fuelling power plants by natural gas: An analysis of energy efficiency, economical aspects and environmental footprint based on detailed process simulation of the whole carbon capture and storage system. Energy Convers. Manag. 2022, 252, 115072. [Google Scholar] [CrossRef] [Scilit]
- Tavakkoli, S.; Feng, L.; Miller, S.M.; Jordaan, S.M. Implications of Generation Efficiencies and Supply Chain Leaks for the Life Cycle Greenhouse Gas Emissions of Natural Gas-Fired Electricity in the United States. Environ. Sci. Technol. 2022, 56, 2540–2550. [Google Scholar] [CrossRef] [Scilit]
- Usubharatana, P.; Phungrassami, H. Life Cycle Assessment for Enhanced Efficiency of Small Power Plants by Reducing Air Input Temperature. Pol. J. Environ. Stud. 2018, 27, 1781–1793. [Google Scholar] [CrossRef] [Scilit]
- Strezov, V.; Cho, H.H. Environmental impact assessment from direct emissions of australian thermal power generation technologies. J. Clean. Prod. 2020, 270, 122515. [Google Scholar] [CrossRef] [Scilit]
- Jaramillo, P.; Griffin, W.M.; Matthews, H.S. Comparative Life-Cycle Air Emissions of Coal, Domestic Natural Gas, LNG, and SNG for Electricity Generation. Environ. Sci. Technol. 2007, 41, 6290–6296. [Google Scholar] [CrossRef] [Scilit] [PubMed]
- Phumpradab, K.; Gheewala, S.H.; Sagisaka, M. Life cycle assessment of natural gas power plants in Thailand. Int. J. Life Cycle Assess. 2009, 14, 354–363. [Google Scholar] [CrossRef] [Scilit]
- Agrawal, K.K.; Jain, S.; Jain, A.K.; Dahiya, S. A life cycle environmental impact assessment of natural gas combined cycle thermal power plant in Andhra Pradesh, India. Environ. Dev. 2014, 11, 162–174. [Google Scholar] [CrossRef] [Scilit]
- Meier, P.J.; Wilson, P.P.H.; Kulcinski, G.L.; Denholm, P.L. US electric industry response to carbon constraint: A life-cycle assessment of supply side alternatives. Energy Policy 2005, 33, 1099–1108. [Google Scholar] [CrossRef] [Scilit]
- Singh, B.; Strømman, A.H.; Hertwich, E. Life cycle assessment of natural gas combined cycle power plant with post-combustion carbon capture, transport and storage. Int. J. Greenh. Gas Control 2011, 5, 457–466. [Google Scholar] [CrossRef] [Scilit]
- Hauck, M.; Steinmann, Z.J.N.; Laurenzi, I.J.; Karuppiah, R.; Huijbregts, M.A.J. How to quantify uncertainty and variability in life cycle assessment: The case of greenhouse gas emissions of gas power generation in the US. Environ. Res. Lett. 2014, 9, 074005. [Google Scholar] [CrossRef] [Scilit]
- Volkart, K.; Bauer, C.; Burgherr, P.; Hirschberg, S.; Schenler, W.; Spada, M. Interdisciplinary assessment of renewable, nuclear and fossil power generation with and without carbon capture and storage in view of the new Swiss energy policy. Int. J. Greenh. Gas Control 2016, 54, 1–14. [Google Scholar] [CrossRef] [Scilit]
- Petrakopoulou, F.; Iribarren, D.; Dufour, J. Life-cycle performance of natural gas power plants with pre-combustion CO2 capture. Greenh. Gases Sci. Technol. 2015, 5, 268–276. [Google Scholar] [CrossRef] [Scilit]
- Kannan, R.; Leong, K.C.; Osman, R.; Ho, H.K.; Tso, C.P. Gas fired combined cycle plant in Singapore: Energy use, GWP and cost—A life cycle approach. Energy Convers. Manag. 2005, 46, 2145–2157. [Google Scholar] [CrossRef] [Scilit]
- Cuéllar-Franca, R.M.; Azapagic, A. Carbon capture, storage and utilisation technologies: A critical analysis and comparison of their life cycle environmental impacts. J. CO2 Util. 2015, 9, 82–102. [Google Scholar] [CrossRef] [Scilit]
- Hondo, H. Life cycle GHG emission analysis of power generation systems: Japanese case. Energy 2005, 30, 2042–2056. [Google Scholar] [CrossRef] [Scilit]
- Rizziconi Energia Spa. Environmental Product Declaration Rizziconi Combined-Cycle Gas Turbine Plan; EPD: Milano, Italy, 2019. [Google Scholar]
- Schultz, H.S.; Carvalho, M. Design, Greenhouse Emissions, and Environmental Payback of a Photovoltaic Solar Energy System. Energies 2022, 15, 6098. [Google Scholar] [CrossRef] [Scilit]
- Frehner, A.; Stucki, M.; Itten, R. Are alpine floatovoltaics the way forward? Life-cycle environmental impacts and energy payback time of the worlds’ first high-altitude floating solar power plant. Sustain. Energy Technol. Assess. 2024, 68, 103880. [Google Scholar] [CrossRef] [Scilit]
- Badza, K.; Soro, Y.M.; Sawadogo, M. Life cycle assessment of a 33.7 MW solar photovoltaic power plant in the context of a developing country. Sustain. Environ. Res. 2023, 33, 38. [Google Scholar] [CrossRef] [Scilit]
- Malode, S.; Prakash, R.; Mohanta, J.C. Comparative LCA of thermal power plant with CCS and solar PV system: Sustainability assessment in Indian context. Environ. Sci. Pollut. Res. 2024, 31, 62853–62876. [Google Scholar] [CrossRef] [Scilit]
- Rossi, F.; Zuffi, C.; Parisi, M.L.; Fiaschi, D.; Manfrida, G. Comparative scenario-based LCA of renewable energy technologies focused on the end-of-life evaluation. J. Clean. Prod. 2023, 405, 136931. [Google Scholar] [CrossRef] [Scilit]
- Lassio, J.G.; Castelo Branco, D.; Magrini, A.; Matos, D. Environmental life cycle-based analysis of fixed and single-axis tracking systems for photovoltaic power plants: A case study in Brazil. Clean. Eng. Technol. 2022, 11, 100586. [Google Scholar] [CrossRef] [Scilit]
- Das, J.; Ur Rehman, A.; Verma, R.; Gulen, G.; Young, M. Comparative Life-Cycle Assessment of Electricity-Generation Technologies: West Texas Case Study. Energies 2024, 17, 992. [Google Scholar] [CrossRef] [Scilit]
- Deng, Y.; Wu, J.; Yang, Q.; Chen, W.; Li, P.; Huang, C.; Deng, J.; Ji, B.; Xie, L. Life Cycle-Based Carbon Emission Reduction Benefit Assessment of Centralized Photovoltaic Power Plants in China. Sustainability 2023, 15, 16323. [Google Scholar] [CrossRef] [Scilit]
- Cocco, D.; Lecis, L.; Micheletto, D. Life Cycle Assessment of an Integrated PV-ACAES System. Energies 2023, 16, 1430. [Google Scholar] [CrossRef] [Scilit]
- Costa, D.; De Regel, S.; Espadas-Aldana, G.; Laget, H.; Kishore, R.; Meuret, Y.; Duerinckx, F. Environmental and economic impacts of photovoltaic integration in concentrated solar power plants. Sol. Energy 2024, 274, 112550. [Google Scholar] [CrossRef] [Scilit]
- Pamponet, M.C.; Maranduba, H.L.; Almeida Neto, J.A.; Rodrigues, L.B. Energy balance and carbon footprint of verylarge-scalephotovoltaic power plant. Int. J. Energy Res. 2022, 46, 6901–6918. [Google Scholar] [CrossRef] [Scilit]
- Desideri, U.; Zepparelli, F.; Morettini, V.; Garroni, E. Comparative analysis of concentrating solar power and photovoltaic technologies: Technical and environmental evaluations. Appl. Energy 2013, 102, 765–784. [Google Scholar] [CrossRef] [Scilit]
- Corona, B.; Escudero, L.; Quéméré, G.; Luque-Heredia, I.; San Miguel, G. Energy and environmental life cycle assessment of a high concentration photovoltaic power plant in Morocco. Int. J. Life Cycle Assess. 2017, 22, 364–373. [Google Scholar] [CrossRef] [Scilit]
- Oğuz, E.; Şentürk, A.E. Selection of the Most Sustainable Renewable Energy System for Bozcaada Island: Wind vs. Photovoltaic. Sustainability 2019, 11, 4098. [Google Scholar] [CrossRef] [Scilit]
- Magrassi, F.; Rocco, E.; Barberis, S.; Gallo, M.; Del Borghi, A. Hybrid solar power system versus photovoltaic plant: A comparative analysis through a life cycle approach. Renew. Energy 2019, 130, 290–304. [Google Scholar] [CrossRef] [Scilit]
- Fu, Y.; Liu, X.; Yuan, Z. Life-cycle assessment of multi-crystalline photovoltaic (PV) systems in China. J. Clean. Prod. 2015, 86, 180–190. [Google Scholar] [CrossRef] [Scilit]
- Constantino, G.; Freitas, M.; Fidelis, N.; Pereira, M. Adoption of Photovoltaic Systems Along a Sure Path: A Life-Cycle Assessment (LCA) Study Applied to the Analysis of GHG Emission Impacts. Energies 2018, 11, 2806. [Google Scholar] [CrossRef] [Scilit]
- Desideri, U.; Proietti, S.; Zepparelli, F.; Sdringola, P.; Bini, S. Life Cycle Assessment of a ground-mounted 1778kWp photovoltaic plant and comparison with traditional energy production systems. Appl. Energy 2012, 97, 930–943. [Google Scholar] [CrossRef] [Scilit]
- Hou, G.; Sun, H.; Jiang, Z.; Pan, Z.; Wang, Y.; Zhang, X.; Zhao, Y.; Yao, Q. Life cycle assessment of grid-connected photovoltaic power generation from crystalline silicon solar modules in China. Appl. Energy 2016, 164, 882–890. [Google Scholar] [CrossRef] [Scilit]
- Asdrubali, F.; Baldinelli, G.; D’Alessandro, F.; Scrucca, F. Life cycle assessment of electricity production from renewable energies: Review and results harmonization. Renew. Sustain. Energy Rev. 2015, 42, 1113–1122. [Google Scholar] [CrossRef] [Scilit]
- (Mariska) De Wild-Scholten, M.J. Energy payback time and carbon footprint of commercial photovoltaic systems. Sol. Energy Mater. Sol. Cells 2013, 119, 296–305. [Google Scholar] [CrossRef] [Scilit]
- Lamnatou, C.; Guignard, N.; Chemisana, D.; Cristofari, C.; Debusschere, V. Photovoltaic power plants with hydraulic storage: Life-cycle assessment focusing on energy payback time and greenhouse-gas emissions—A case study in Spain. Sustain. Energy Technol. Assess. 2023, 60, 103468. [Google Scholar] [CrossRef] [Scilit]
- Alam, E.; Xu, X. Life cycle assessment of photovoltaic electricity production by mono-crystalline solar systems: A case study in Canada. Environ. Sci. Pollut. Res. 2022, 30, 27422–27440. [Google Scholar] [CrossRef] [Scilit] [PubMed]
- Mehedi, T.H.; Gemechu, E.; Kumar, A. Life cycle greenhouse gas emissions and energy footprints of utility-scale solar energy systems. Appl. Energy 2022, 314, 118918. [Google Scholar] [CrossRef] [Scilit]
- Herceg, S.; Fischer, M.; Weiß, K.-A.; Schebek, L. Life cycle assessment of PV module repowering. Energy Strategy Rev. 2022, 43, 100928. [Google Scholar] [CrossRef] [Scilit]
- Luo, W.; Khoo, Y.S.; Kumar, A.; Low, J.S.C.; Li, Y.; Tan, Y.S.; Wang, Y.; Aberle, A.G.; Ramakrishna, S. A comparative life-cycle assessment of photovoltaic electricity generation in Singapore by multicrystalline silicon technologies. Sol. Energy Mater. Sol. Cells 2018, 174, 157–162. [Google Scholar] [CrossRef] [Scilit]
- Kabakian, V.; McManus, M.C.; Harajli, H. Attributional life cycle assessment of mounted 1.8 kWp monocrystalline photovoltaic system with batteries and comparison with fossil energy production system. Appl. Energy 2015, 154, 428–437. [Google Scholar] [CrossRef] [Scilit]
- Das Solar Co., Ltd. Crystalline Silicon Photovoltaic (PV) Modules [EPD]; EPD: Milano, Italy, 2023; Available online: https://www.epditaly.it/epd/crystalline-silicon-photovoltaic-pv-modules/ (accessed on 31 January 2026).
- CSI Solar Co., Ltd. Bi-Facial Mono-Crystalline Silicon Photovoltaic (PV) Modules [EPD]; EPD: Milano, Italy, 2025. [Google Scholar]
- Risen Energy Co., Ltd. Single-Glass Monocrystalline Photovoltaic Modules, The International EPD® System [EPD]; EPD International: Stockholm, Sweden, 2021; Available online: https://www.epditaly.it/en/wp-content/uploads/2016/12/EPDItaly-Risen-Energy-PV-Modules.pdf (accessed on 31 January 2026).
- Risen Energy Co., Ltd. Risen Energy 210 Series Bifacial Dual-Glass Monocrystalline Photovoltaic Modules [EPD]; EPD International: Stockholm, Sweden, 2023; Available online: https://www.environdec.com/library/epd4781 (accessed on 31 January 2026).
- Jolywood (Taizhou) Solar Technology Co., Ltd. Jolywood N-Type Bifacial Single Glass Photovoltaic Modules [EPD]; EPD International: Stockholm, Sweden, 2023; Available online: https://www.environdec.com/library/epd2181 (accessed on 31 January 2026).
- Jolywood (Taizhou) Solar Technology Co., Ltd. Jolywood N-Type Bifacial Double Glass Photovoltaic Modules [EPD]; EPD International: Stockholm, Sweden, 2023; Available online: https://www.environdec.com/library/epd2182 (accessed on 31 January 2026).
- Sunova Solar Technology Co., Ltd. Mono-Crystalline Silicon Photovoltaic (PV) Modules [EPD]; EPD: Milano, Italy, 2025; Available online: https://www.epditaly.it/epd/moduli-fotovoltaici-pv-in-silicio-monocristallino/ (accessed on 31 January 2026).
- Boviet Solar Technology Co., Ltd. Boviet Monocrystalline Photovoltaic Module (PERC and TOPCon Cells) [EPD]; EPD: Milano, Italy, 2023; Available online: https://www.epditaly.it/en/epd/boviet-monocrystalline-photovoltaic-module-perc-and-topcon-cells/ (accessed on 31 January 2026).
- Changzhou EGing Photovoltaic Technology Co., Ltd. EG-XXXM54-HLV, EG-XXXM54-HL/BF-DG, EG-XXXM72-HLV, EG-XXXM72-HL/BF-DG, EG-XXXM60-HUV, EG-XXXM60 HU/BF-DG, EG-XXXM66-HUV, EG-XXXM66-HU/BF-DG, EG XXXNT54-HLV, EG-XXXNT54-HL/BF-DG, EG-XXXNT72-HLV, EG-XXXNT72-HL/BF-DG [EPD]; EPD: Milano, Italy, 2024; Available online: https://www.epditaly.it/en/wp-content/uploads/2016/12/MR-EPDITALY0090.pdf (accessed on 31 January 2026).
- Hengdian Group DMEGC Magnetics. DMEGC Monocrystalline Photovoltaic Module (Bifacial p-Type Cells) [EPD]; EPD: Milano, Italy, 2023; Available online: https://www.epditaly.it/en/wp-content/uploads/2016/12/DMEGC-EPD2_Public-report-20230905.pdf (accessed on 31 January 2026).
- Zhengxin Photoelectric Technology (Suqian) Co., Ltd. ZXM7-SH108-xxx/M, ZXM7-SHLD144-xxx/M [EPD]; EPD: Milano, Italy, 2024; Available online: https://www.epditaly.it/en/wp-content/uploads/2016/12/MR_EPDITALY0082.pdf (accessed on 31 January 2026).
- Trina Solar Co., Ltd. NEG19RC.20, DEG21C20, NEG21C.20 [EPD]; EPD: Milano, Italy, 2024; Available online: https://www.epditaly.it/en/wp-content/uploads/2016/12/MR-EPDITALY0076-2.pdf (accessed on 31 January 2026).
- Jinko Solar Holding Co., Ltd. Mono-Crystalline Silicon Photovoltaic (PV) Modules [EPD]; EPD: Milano, Italy, 2021; Available online: https://www.epditaly.it/en/wp-content/uploads/2016/12/Jinko-EPD-final-report-20210618-1.pdf (accessed on 31 January 2026).
- Vina Solar Technology Co., Ltd. PV Modules [EPD]; EPD: Milano, Italy, 2023; Available online: https://www.epditaly.it/en/epd/lr4-72hbdvina-lr5-72hbdvina-lr572hphvina-lr5-72hibdvina-lr5-72hihvina-lr5-54hphvina-lr5-54hihvina-lr554hibvina/ (accessed on 31 January 2026).
- Feng, Y.; Zhang, L. The GHG Intensities of Wind Power Plants in China from a Life-Cycle Perspective: The Impacts of Geographical Location, Turbine Technology and Management Level. Sustainability 2023, 15, 4449. [Google Scholar] [CrossRef] [Scilit]
- Tremeac, B.; Meunier, F. Life cycle analysis of 4.5MW and 250W wind turbines. Renew. Sustain. Energy Rev. 2009, 13, 2104–2110. [Google Scholar] [CrossRef] [Scilit]
- Chen, G.Q.; Yang, Q.; Zhao, Y.H. Renewability of wind power in China: A case study of nonrenewable energy cost and greenhouse gas emission by a plant in Guangxi. Renew. Sustain. Energy Rev. 2011, 15, 2322–2329. [Google Scholar] [CrossRef] [Scilit]
- Wagner, H.-J.; Baack, C.; Eickelkamp, T.; Epe, A.; Lohmann, J.; Troy, S. Life cycle assessment of the offshore wind farm alpha ventus. Energy 2011, 36, 2459–2464. [Google Scholar] [CrossRef] [Scilit]
- Wiedmann, T.O.; Suh, S.; Feng, K.; Lenzen, M.; Acquaye, A.; Scott, K.; Barrett, J.R. Application of Hybrid Life Cycle Approaches to Emerging Energy Technologies—The Case of Wind Power in the UK. Environ. Sci. Technol. 2011, 45, 5900–5907. [Google Scholar] [CrossRef] [Scilit]
- Arvesen, A.; Birkeland, C.; Hertwich, E.G. The Importance of Ships and Spare Parts in LCAs of Offshore Wind Power. Environ. Sci. Technol. 2013, 47, 2948–2956. [Google Scholar] [CrossRef] [Scilit]
- Oebels, K.B.; Pacca, S. Life cycle assessment of an onshore wind farm located at the northeastern coast of Brazil. Renew. Energy 2013, 53, 60–70. [Google Scholar] [CrossRef] [Scilit]
- Yang, J.; Chen, B. Integrated evaluation of embodied energy, greenhouse gas emission and economic performance of a typical wind farm in China. Renew. Sustain. Energy Rev. 2013, 27, 559–568. [Google Scholar] [CrossRef] [Scilit]
- Raadal, H.L.; Vold, B.I.; Myhr, A.; Nygaard, T.A. GHG emissions and energy performance of offshore wind power. Renew. Energy 2014, 66, 314–324. [Google Scholar] [CrossRef] [Scilit]
- Reimers, B.; Özdirik, B.; Kaltschmitt, M. Greenhouse gas emissions from electricity generated by offshore wind farms. Renew. Energy 2014, 72, 428–438. [Google Scholar] [CrossRef] [Scilit]
- Noori, M.; Kucukvar, M.; Tatari, O. Economic Input–Output Based Sustainability Analysis of Onshore and Offshore Wind Energy Systems. Int. J. Green Energy 2015, 12, 939–948. [Google Scholar] [CrossRef] [Scilit]
- Atilgan, B.; Azapagic, A. Renewable electricity in Turkey: Life cycle environmental impacts. Renew. Energy 2016, 89, 649–657. [Google Scholar] [CrossRef] [Scilit]
- Ji, S.; Chen, B. LCA-based Carbon Footprint of a Typical Wind Farm in China. Energy Procedia 2016, 88, 250–256. [Google Scholar] [CrossRef] [Scilit]
- Kumar, I.; Tyner, W.E.; Sinha, K.C. Input–output life cycle environmental assessment of greenhouse gas emissions from utility scale wind energy in the United States. Energy Policy 2016, 89, 294–301. [Google Scholar] [CrossRef] [Scilit]
- Nagashima, S.; Uchiyama, Y.; Okajima, K. Hybrid input–output table method for socioeconomic and environmental assessment of a wind power generation system. Appl. Energy 2017, 185, 1067–1075. [Google Scholar] [CrossRef] [Scilit]
- Gao, C.; Na, H.; Song, K.; Dyer, N.; Tian, F.; Xu, Q.; Xing, Y. Environmental impact analysis of power generation from biomass and wind farms in different locations. Renew. Sustain. Energy Rev. 2019, 102, 307–317. [Google Scholar] [CrossRef] [Scilit]
- Lundie, S.; Wiedmann, T.; Welzel, M.; Busch, T. Global supply chains hotspots of a wind energy company. J. Clean. Prod. 2019, 210, 1042–1050. [Google Scholar] [CrossRef] [Scilit]
- Xie, J.; Fu, J.; Liu, S.; Hwang, W. Assessments of carbon footprint and energy analysis of three wind farms. J. Clean. Prod. 2020, 254, 120159. [Google Scholar] [CrossRef] [Scilit]
- Li, Q.; Duan, H.; Xie, M.; Kang, P.; Ma, Y.; Zhong, R.; Gao, T.; Zhong, W.; Wen, B.; Bai, F.; et al. Life cycle assessment and life cycle cost analysis of a 40 MW wind farm with consideration of the infrastructure. Renew. Sustain. Energy Rev. 2021, 138, 110499. [Google Scholar] [CrossRef] [Scilit]
- Vélez-Henao, J.-A.; Vivanco, D.F. Hybrid life cycle assessment of an onshore wind farm including direct and indirect services: A case study in Guajira, Colombia. J. Environ. Manag. 2021, 284, 112058. [Google Scholar] [CrossRef] [Scilit] [PubMed]
- Yildiz, N.; Hemida, H.; Baniotopoulos, C. Life Cycle Assessment of a Barge-Type Floating Wind Turbine and Comparison with Other Types of Wind Turbines. Energies 2021, 14, 5656. [Google Scholar] [CrossRef] [Scilit]
- Mahmud, M.A.P.; Farjana, S.H. Comparative life cycle environmental impact assessment of renewable electricity generation systems: A practical approach towards Europe, North Americaand Oceania. Renew. Energy 2022, 193, 1106–1120. [Google Scholar] [CrossRef] [Scilit]
- Hosseini, S.M.; Kanagaraj, N.; Sadeghi, S.; Yousefi, H. Midpoint and endpoint impacts of electricity generation by renewable and nonrenewable technologies: A case study of Alberta, Canada. Renew. Energy 2022, 197, 22–39. [Google Scholar] [CrossRef] [Scilit]
- Verma, S.; Paul, A.R.; Haque, N. Selected Environmental Impact Indicators Assessment of Wind Energy in India Using a Life Cycle Assessment. Energies 2022, 15, 3944. [Google Scholar] [CrossRef] [Scilit]
- Kabir, M.R.; Rooke, B.; Dassanayake, G.D.M.; Fleck, B.A. Comparative life cycle energy, emission, and economic analysis of 100 kW nameplate wind power generation. Renew. Energy 2012, 37, 133–141. [Google Scholar] [CrossRef] [Scilit]
- Al-Behadili, S.H.; El-Osta, W.B. Life Cycle Assessment of Dernah (Libya) wind farm. Renew. Energy 2015, 83, 1227–1233. [Google Scholar] [CrossRef] [Scilit]
- Caduff, M.; Huijbregts, M.A.J.; Althaus, H.-J.; Koehler, A.; Hellweg, S. Wind Power Electricity: The Bigger the Turbine, The Greener the Electricity? Environ. Sci. Technol. 2012, 46, 4725–4733. [Google Scholar] [CrossRef] [Scilit]
- Chipindula, J.; Botlaguduru, V.S.V.; Du, H.; Kommalapati, R.R.; Huque, Z. Life Cycle Environmental Impact of Onshore and Offshore Wind Farms in Texas. Sustainability 2018, 10, 2022. [Google Scholar] [CrossRef] [Scilit]
- Alsaleh, A.; Sattler, M. Comprehensive life cycle assessment of large wind turbines in the US. Clean Technol. Environ. Policy 2019, 21, 887–903. [Google Scholar] [CrossRef] [Scilit]
- Bhandari, R.; Kumar, B.; Mayer, F. Life cycle greenhouse gas emission from wind farms in reference to turbine sizes and capacity factors. J. Clean. Prod. 2020, 277, 123385. [Google Scholar] [CrossRef] [Scilit]
- Wang, S.; Wang, S.; Liu, J. Life-cycle green-house gas emissions of onshore and offshore wind turbines. J. Clean. Prod. 2019, 210, 804–810. [Google Scholar] [CrossRef] [Scilit]
- Wang, Y.; Sun, T. Life cycle assessment of CO2 emissions from wind power plants: Methodology and case studies. Renew. Energy 2012, 43, 30–36. [Google Scholar] [CrossRef] [Scilit]
- Bonou, A.; Laurent, A.; Olsen, S.I. Life cycle assessment of onshore and offshore wind energy-from theory to application. Appl. Energy 2016, 180, 327–337. [Google Scholar] [CrossRef] [Scilit]
- Yang, J.; Chang, Y.; Zhang, L.; Hao, Y.; Yan, Q.; Wang, C. The life-cycle energy and environmental emissions of a typical offshore wind farm in China. J. Clean. Prod. 2018, 180, 316–324. [Google Scholar] [CrossRef] [Scilit]
- Xu, L.; Pang, M.; Zhang, L.; Poganietz, W.-R.; Marathe, S.D. Life cycle assessment of onshore wind power systems in China. Resour. Conserv. Recycl. 2018, 132, 361–368. [Google Scholar] [CrossRef] [Scilit]
- Guidi, G.; Violante, A.C.; De Iuliis, S. Environmental Impact of Electricity Generation Technologies: A Comparison between Conventional, Nuclear, and Renewable Technologies. Energies 2023, 16, 7847. [Google Scholar] [CrossRef] [Scilit]
- UNECE. Carbon Neutrality in the UNECE Region: Integrated Life-Cycle Assessment of Electricity Sources. 2022. Available online: https://www.un-ilibrary.org/content/books/9789210014854 (accessed on 31 January 2026).
- Brussa, G.; Grosso, M.; Rigamonti, L. Life cycle assessment of a floating offshore wind farm in Italy. Sustain. Prod. Consum. 2023, 39, 134–144. [Google Scholar] [CrossRef] [Scilit]
- Pulselli, R.M.; Maccanti, M.; Bruno, M.; Sabbetta, A.; Neri, E.; Patrizi, N.; Bastianoni, S. Benchmarking Marine Energy Technologies Through LCA: Offshore Floating Wind Farms in the Mediterranean. Front. Energy Res. 2022, 10, 902021. [Google Scholar] [CrossRef] [Scilit]
- Chen, J.; Mao, B.; Wu, Y.; Zhang, D.; Wei, Y.; Yu, A.; Peng, L. Green development strategy of offshore wind farm in China guided by life cycle assessment. Resour. Conserv. Recycl. 2023, 188, 106652. [Google Scholar] [CrossRef] [Scilit]
- Ozoemena, M.; Cheung, W.M.; Hasan, R. Comparative LCA of technology improvement opportunities for a 1.5-MW wind turbine in the context of an onshore wind farm. Clean Technol. Environ. Policy 2018, 20, 173–190. [Google Scholar] [CrossRef] [Scilit]
- Tsai, L.; Kelly, J.C.; Simon, B.S.; Chalat, R.M.; Keoleian, G.A. Life Cycle Assessment of Offshore Wind Farm Siting: Effects of Locational Factors, Lake Depth, and Distance from Shore. J. Ind. Ecol. 2016, 20, 1370–1383. [Google Scholar] [CrossRef] [Scilit]
- Struthers, I.A.; Avanessova, N.; Gray, A.; Noonan, M.; Thomson, R.C.; Harrison, G.P. Life Cycle Assessment of Four Floating Wind Farms around Scotland Using a Site-Specific Operation and Maintenance Model with SOVs. Energies 2023, 16, 7739. [Google Scholar] [CrossRef] [Scilit]
- Garcia-Teruel, A.; Rinaldi, G.; Thies, P.R.; Johanning, L.; Jeffrey, H. Life cycle assessment of floating offshore wind farms: An evaluation of operation and maintenance. Appl. Energy 2022, 307, 118067. [Google Scholar] [CrossRef] [Scilit]
- Teffera, B.; Assefa, B.; Björklund, A.; Assefa, G. Life cycle assessment of wind farms in Ethiopia. Int. J. Life Cycle Assess. 2021, 26, 76–96. [Google Scholar] [CrossRef] [Scilit]
- Tahtah, A.; Raouti, D.; Meziane, R. Economic and ecological evaluation and optimization of the life cycle of a wind farm. Int. J. Environ. Sci. Technol. 2023, 20, 9837–9852. [Google Scholar] [CrossRef] [Scilit]
- Elmariami, A.; El-Osta, W.; Nassar, Y.; Khalifa, Y.; Elfleet, M. Life Cycle Assessment of 20 MW Wind Farm in Libya. Appl. Sol. Energy 2023, 59, 64–78. [Google Scholar] [CrossRef] [Scilit]
- Cao, Y.; Meng, Y.; Zhang, Z.; Yang, Q.; Li, Y.; Liu, C.; Ba, S. Life cycle environmental analysis of offshore wind power: A case study of the large-scale offshore wind farm in China. Renew. Sustain. Energy Rev. 2024, 196, 114351. [Google Scholar] [CrossRef] [Scilit]
- Yuan, W.; Feng, J.-C.; Zhang, S.; Sun, L.; Cai, Y.; Yang, Z.; Sheng, S. Floating wind power in deep-sea area: Life cycle assessment of environmental impacts. Adv. Appl. Energy 2023, 9, 100122. [Google Scholar] [CrossRef] [Scilit]
- Li, J.; Li, S.; Wu, F. Research on carbon emission reduction benefit of wind power project based on life cycle assessment theory. Renew. Energy 2020, 155, 456–468. [Google Scholar] [CrossRef] [Scilit]
- Gomaa, M.R.; Rezk, H.; Mustafa, R.J.; Al-Dhaifallah, M. Evaluating the Environmental Impacts and Energy Performance of a Wind Farm System Utilizing the Life-Cycle Assessment Method: A Practical Case Study. Energies 2019, 12, 3263. [Google Scholar] [CrossRef] [Scilit]
- Fonseca, L.F.S.; Carvalho, M. Greenhouse gas and energy payback times for a wind turbine installed in the Brazilian Northeast. Front. Sustain. 2022, 3, 1060130. [Google Scholar] [CrossRef] [Scilit]
- Ozsahin, B.; Elginoz, N.; Germirli Babuna, F. Life cycle assessment of a wind farm in Turkey. Environ. Sci. Pollut. Res. 2022, 29, 71000–71013. [Google Scholar] [CrossRef] [Scilit]
- Rajaei, M.; Tinjum, J.M. Life Cycle Assessment of Energy Balance and Emissions of a Wind Energy Plant. Geotech. Geol. Eng. 2013, 31, 1663–1670. [Google Scholar] [CrossRef] [Scilit]
- Ji, S.; Chen, B. Carbon footprint accounting of a typical wind farm in China. Appl. Energy 2016, 180, 416–423. [Google Scholar] [CrossRef] [Scilit]
- Martínez, E.; Sanz, F.; Pellegrini, S.; Jiménez, E.; Blanco, J. Life-cycle assessment of a 2-MW rated power wind turbine: CML method. Int. J. Life Cycle Assess. 2009, 14, 52–63. [Google Scholar] [CrossRef] [Scilit]
- Schleisner, L. Life cycle assessment of a wind farm and related externalities. Renew. Energy 2000, 20, 279–288. [Google Scholar] [CrossRef] [Scilit]
- Arvesen, A.; Nes, R.N.; Huertas-Hernando, D.; Hertwich, E.G. Life cycle assessment of an offshore grid interconnecting wind farms and customers across the North Sea. Int. J. Life Cycle Assess. 2014, 19, 826–837. [Google Scholar] [CrossRef] [Scilit]
- Jungbluth, N.; Bauer, C.; Dones, R.; Frischknecht, R. Life Cycle Assessment for Emerging Technologies: Case Studies for Photovoltaic and Wind Power (11 pp). Int. J. Life Cycle Assess. 2005, 10, 24–34. [Google Scholar] [CrossRef] [Scilit]
- Voorspools, K.R.; Brouwers, E.A.; D’haeseleer, W.D. Energy content and indirect greenhouse gas emissions embedded in ‘emission-free’ power plants: Results for the Low Countries. Appl. Energy 2000, 67, 307–330. [Google Scholar] [CrossRef] [Scilit]
- Nordex SE. Parco Eolico con Turbine Nordex DELTA4000 N163/5.X [EPD]; EPD: Milano, Italy, 2023; Available online: https://www.epditaly.it/epd/parco-eolico-con-turbine-nordex-delta4000-n163-5-x/ (accessed on 31 January 2026).
- Nordex SE. Parco Eolico con Turbine Nordex DELTA4000 N155/5.X [EPD]; EPD: Milano, Italy, 2023; Available online: https://www.epditaly.it/epd/parco-eolico-con-turbine-nordex-delta4000-n155-5-x/ (accessed on 31 January 2026).
- Xinjiang Goldwind Science & Technology Co., Ltd. Goldwind GW165-5.2/5.6/6.0 Wind Turbine [EPD]; EPD: Milano, Italy, 2022; Available online: https://www.epditaly.it/wp-content/uploads/2016/12/Revision-4_Goldwind_EPD_GW165-5.25.66.0_Final.pdf (accessed on 31 January 2026).
- Xinjiang Goldwind Science & Technology Co., Ltd. Goldwind GW155-4.5 Wind Turbine [EPD]; EPD: Milano, Italy, 2020; Available online: https://www.epditaly.it/en/wp-content/uploads/2016/12/EPD-GW155-4.5-20201217.pdf (accessed on 31 January 2026).
- Xinjiang Goldwind Science & Technology Co., Ltd. Goldwind GW136-4.2 Wind Turbine [EPD]; EPD: Milano, Italy, 2020; Available online: https://www.epditaly.it/en/wp-content/uploads/2016/12/EPD-GW136-4.2-20201217.pdf (accessed on 31 January 2026).
- Nordex SE. Wind Farm with Nordex Delta4000 N149/4.0–4.5 Wind Turbines [EPD]; EPD: Milano, Italy, 2020; Available online: https://www.epditaly.it/epd/wind-farm-with-nordex-delta4000-n149-4-0-4-5-wind-turbines/ (accessed on 31 January 2026).
- Siemens Gamesa Renewable Energy. Electricity from a European Offshore Wind Farm Using SG 11-200 Wind Turbines [EPD]; EPD International: Stockholm, Sweden, 2023; Available online: https://www.environdec.com/library/epd9790 (accessed on 31 January 2026).
- Siemens Gamesa Renewable Energy. Electricity from a European Offshore Wind Farm Using SG 14-222 Wind Turbines [EPD]; EPD International: Stockholm, Sweden, 2024; Available online: https://www.environdec.com/library/epd9791 (accessed on 31 January 2026).
- Siemens Gamesa Renewable Energy. Electricity from a European Offshore Wind Farm Using SG 14-236 Wind Turbines [EPD]; EPD International: Stockholm, Sweden, 2024; Available online: https://www.environdec.com/library/epd9792 (accessed on 31 January 2026).
- Siemens Gamesa Renewable Energy. Electricity from a European Onshore Wind Farm Using SG 6.6-155 Wind Turbines [EPD]; EPD International: Stockholm, Sweden, 2022; Available online: https://www.environdec.com/library/epd5835 (accessed on 31 January 2026).
- Siemens Gamesa Renewable Energy. Electricity from a European Onshore Wind Farm Using SG 6.2-170/6.6-170 Wind Turbines [EPD]; EPD International: Stockholm, Sweden, 2022; Available online: https://www.environdec.com/library/epd6090 (accessed on 31 January 2026).
- Siemens Gamesa Renewable Energy. Electricity from an Indian Onshore Wind Farm Using SG 3.4-145 Wind Turbines [EPD]; EPD International: Stockholm, Sweden, 2021; Available online: https://www.environdec.com/library/epd3326 (accessed on 31 January 2026).
- Siemens Gamesa Renewable Energy. Electricity from a European Onshore Wind Farm Using SG 5.0-132 Wind Turbines [EPD]; EPD International: Stockholm, Sweden, 2020; Available online: https://www.environdec.com/library/epd2156 (accessed on 31 January 2026).
- Siemens Gamesa Renewable Energy. Electricity from a European Onshore Wind Farm Using SG 5.0-145 Wind Turbines [EPD]; EPD International: Stockholm, Sweden, 2020; Available online: https://www.environdec.com/library/epd2157 (accessed on 31 January 2026).
- Siemens Gamesa Renewable Energy. Electricity from a European Onshore Wind Farm Using SG 2.6-114 Wind Turbines [EPD]; EPD International: Stockholm, Sweden, 2020; Available online: https://www.environdec.com/library/epd1965 (accessed on 31 January 2026).
- Vattenfall, A.B. Electricity from Vattenfall’s Nordic Wind Farms [EPD]; EPD International: Stockholm, Sweden, 2025; Available online: https://www.environdec.com/library/epd20040 (accessed on 31 January 2026).
- Pratiwi, S.A.; Nasruddin; Sasongko, N.A. Comparative assessment of the environmental impact of nuclear power plant technology using life cycle assessment approach: A review. IOP Conf. Ser. Earth Environ. Sci. 2023, 1267, 012041. [Google Scholar] [CrossRef] [Scilit]
- Koltun, P.; Tsykalo, A.; Novozhilov, V. Life Cycle Assessment of the New Generation GT-MHR Nuclear Power Plant. Energies 2018, 11, 3452. [Google Scholar] [CrossRef] [Scilit]
- Wang, L.; Wang, Y.; Zhou, Z.; Garvlehn, M.P.; Bi, F. Comparative Assessment of the Environmental Impacts of Hydro-Electric, Nuclear and Wind Power Plants in China: Life Cycle Considerations. Energy Procedia 2018, 152, 1009–1014. [Google Scholar] [CrossRef] [Scilit]
- Liu, B.; Peng, B.; Lu, F.; Hu, J.; Zheng, L.; Bo, M.; Shang, X.; Liu, W.; Zhang, Y.; Zhou, X.; et al. Critical review of nuclear power plant carbon emissions. Front. Energy Res. 2023, 11, 1147016. [Google Scholar] [CrossRef] [Scilit]
- Dones, R.; Heck, T.; Faist Emmenegger, M.; Jungbluth, N. Life Cycle Inventories for the Nuclear and Natural Gas Energy Systems, and Examples of Uncertainty Analysis (14 pp). Int. J. Life Cycle Assess. 2005, 10, 10–23. [Google Scholar] [CrossRef] [Scilit]
- Farjana, S.H.; Huda, N.; Parvez Mahmud, M.A.; Saidur, R. A review on the impact of mining and mineral processing industries through life cycle assessment. J. Clean. Prod. 2019, 231, 1200–1217. [Google Scholar] [CrossRef] [Scilit]
- Vattenfall, A.B. Electricity from Vattenfall’s Nuclear Power Plants [EPD]; EPD International: Stockholm, Sweden, 2023; Available online: https://www.environdec.com/library/epd923?trk=public_post_comment-text (accessed on 31 January 2026).
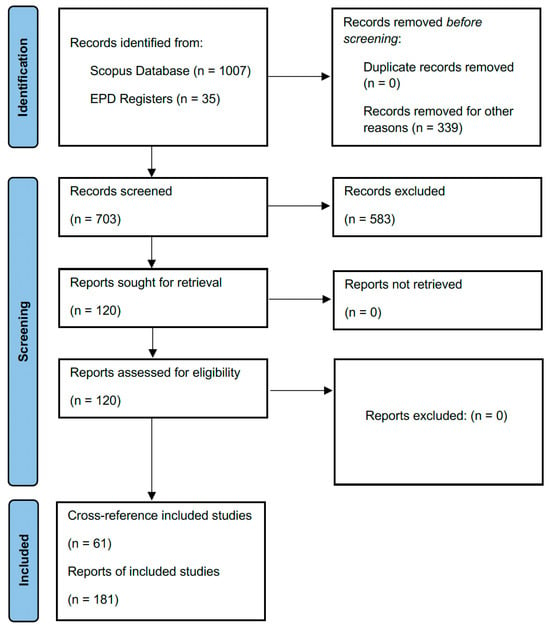
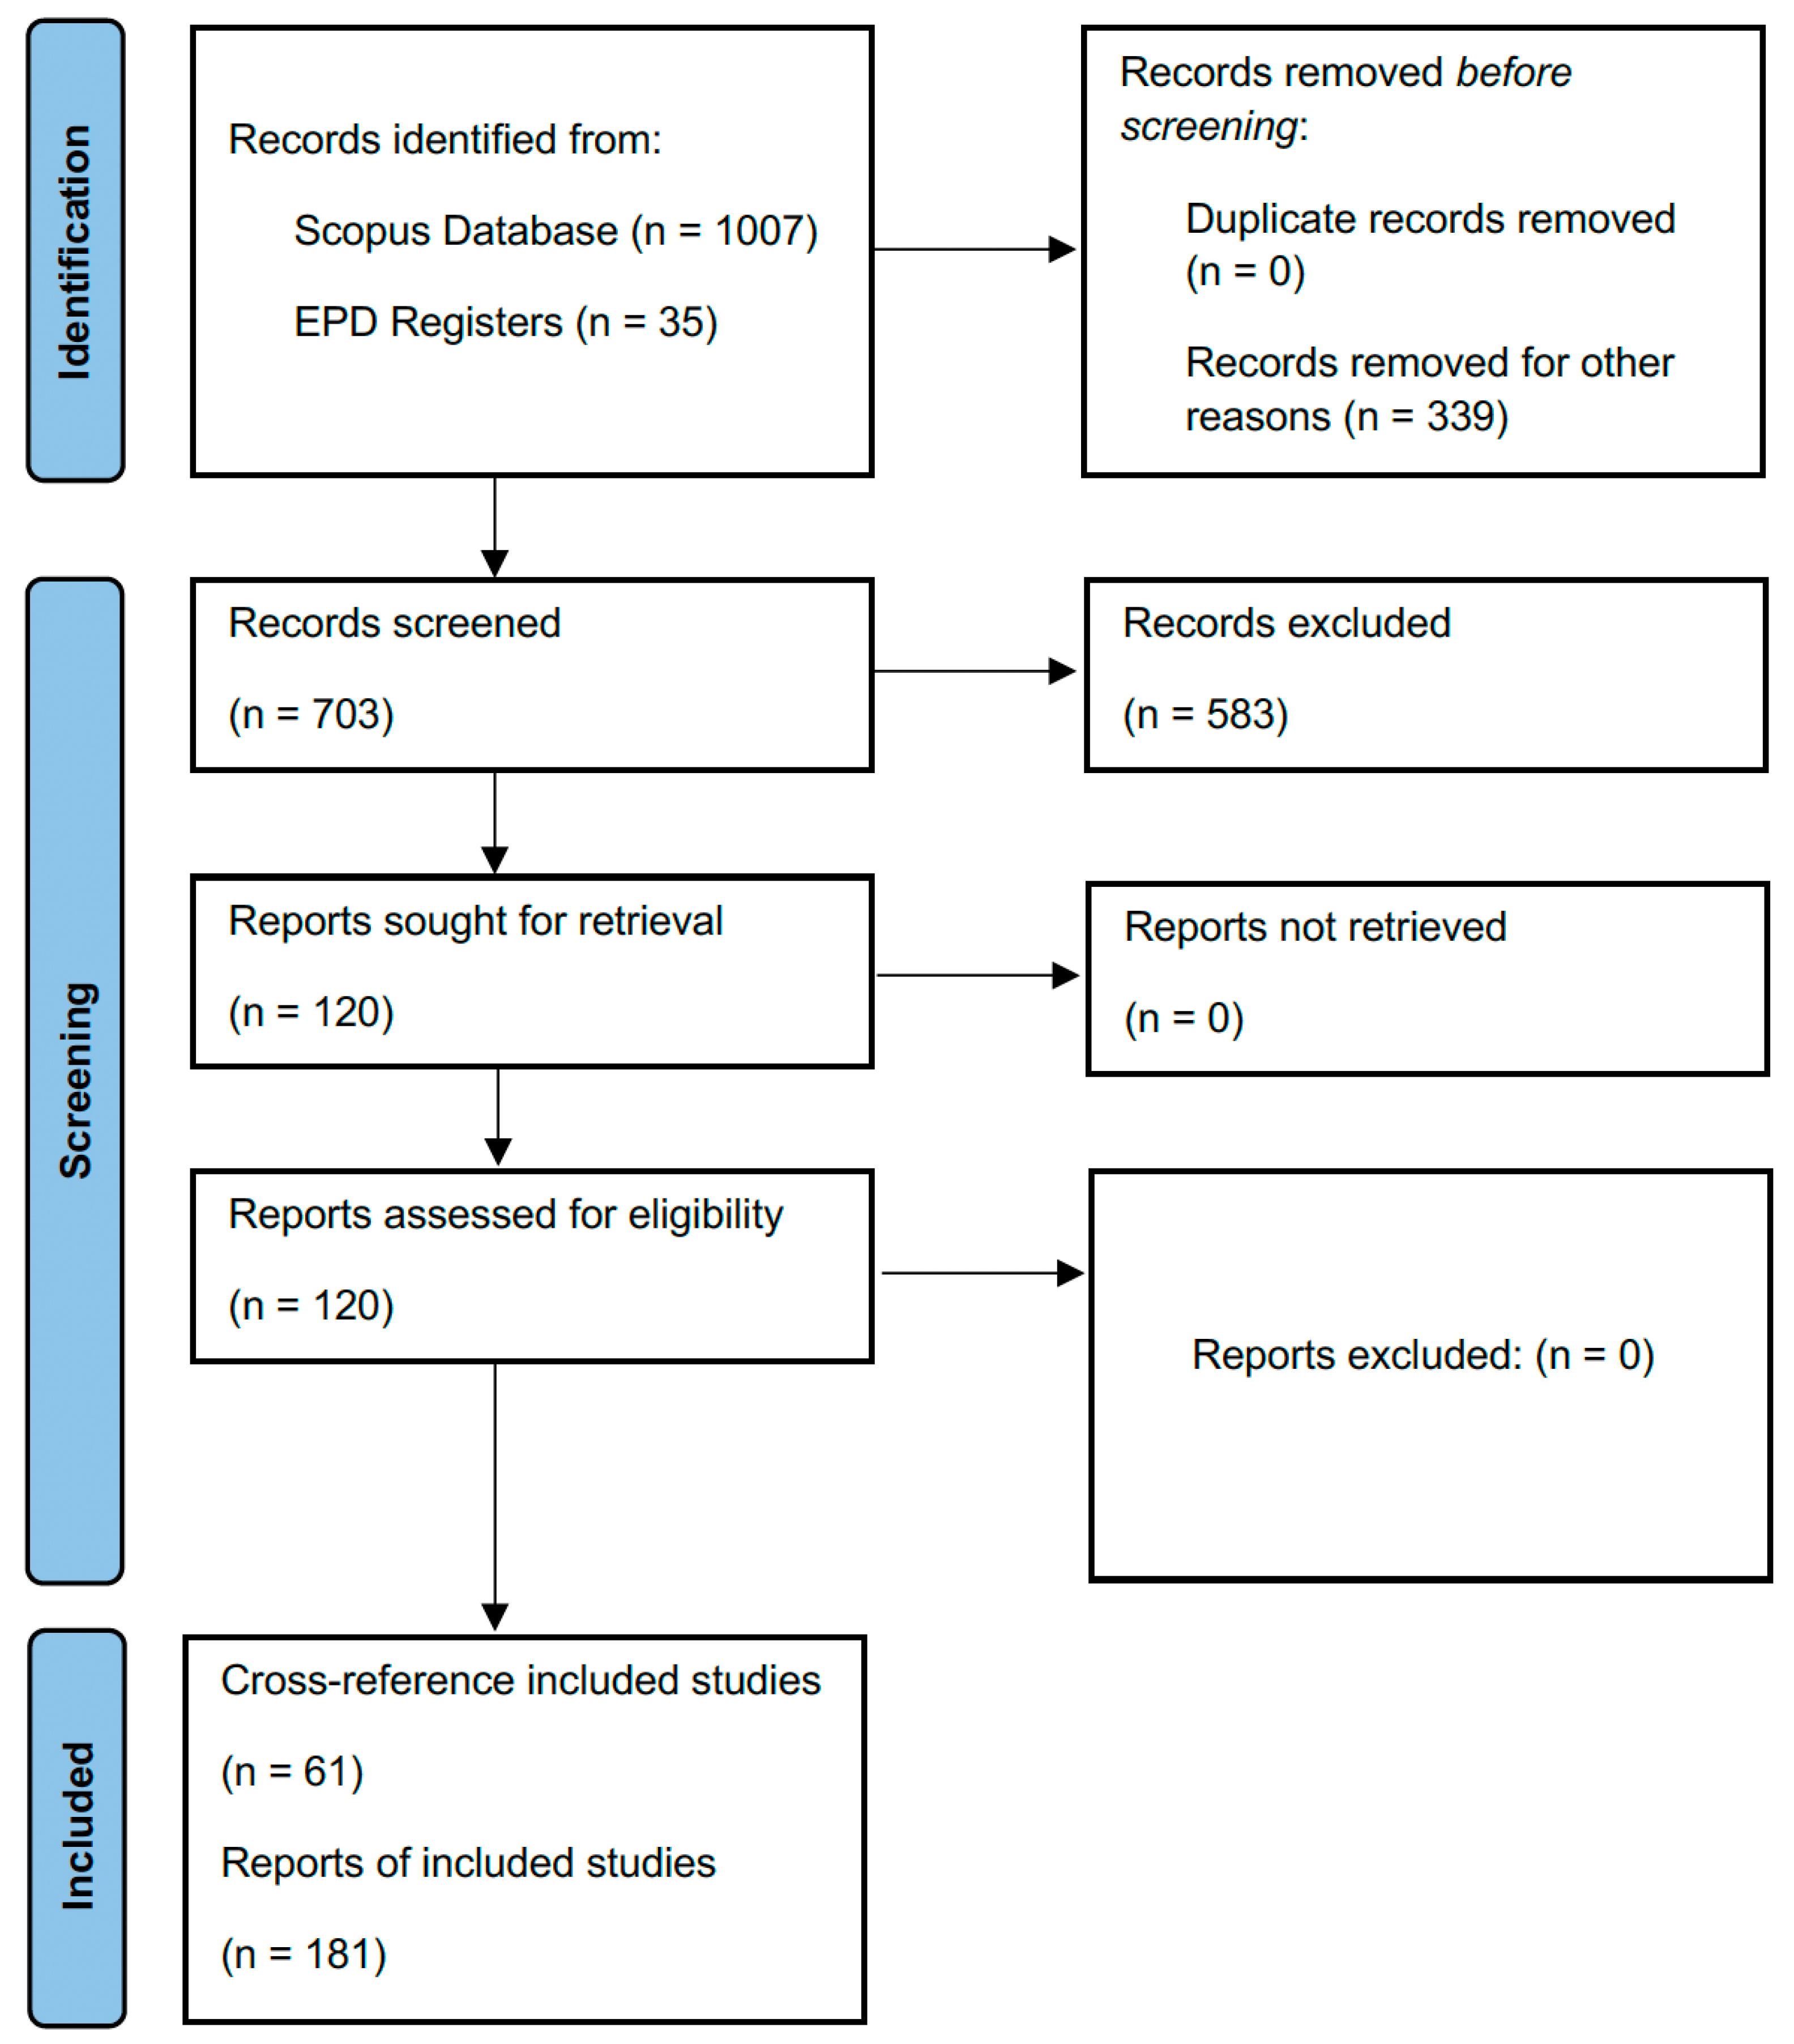
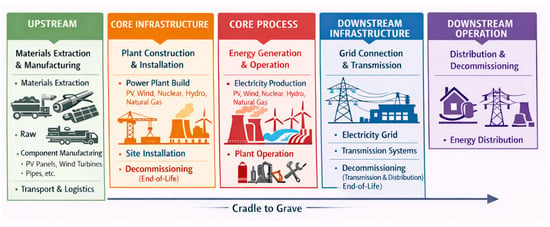
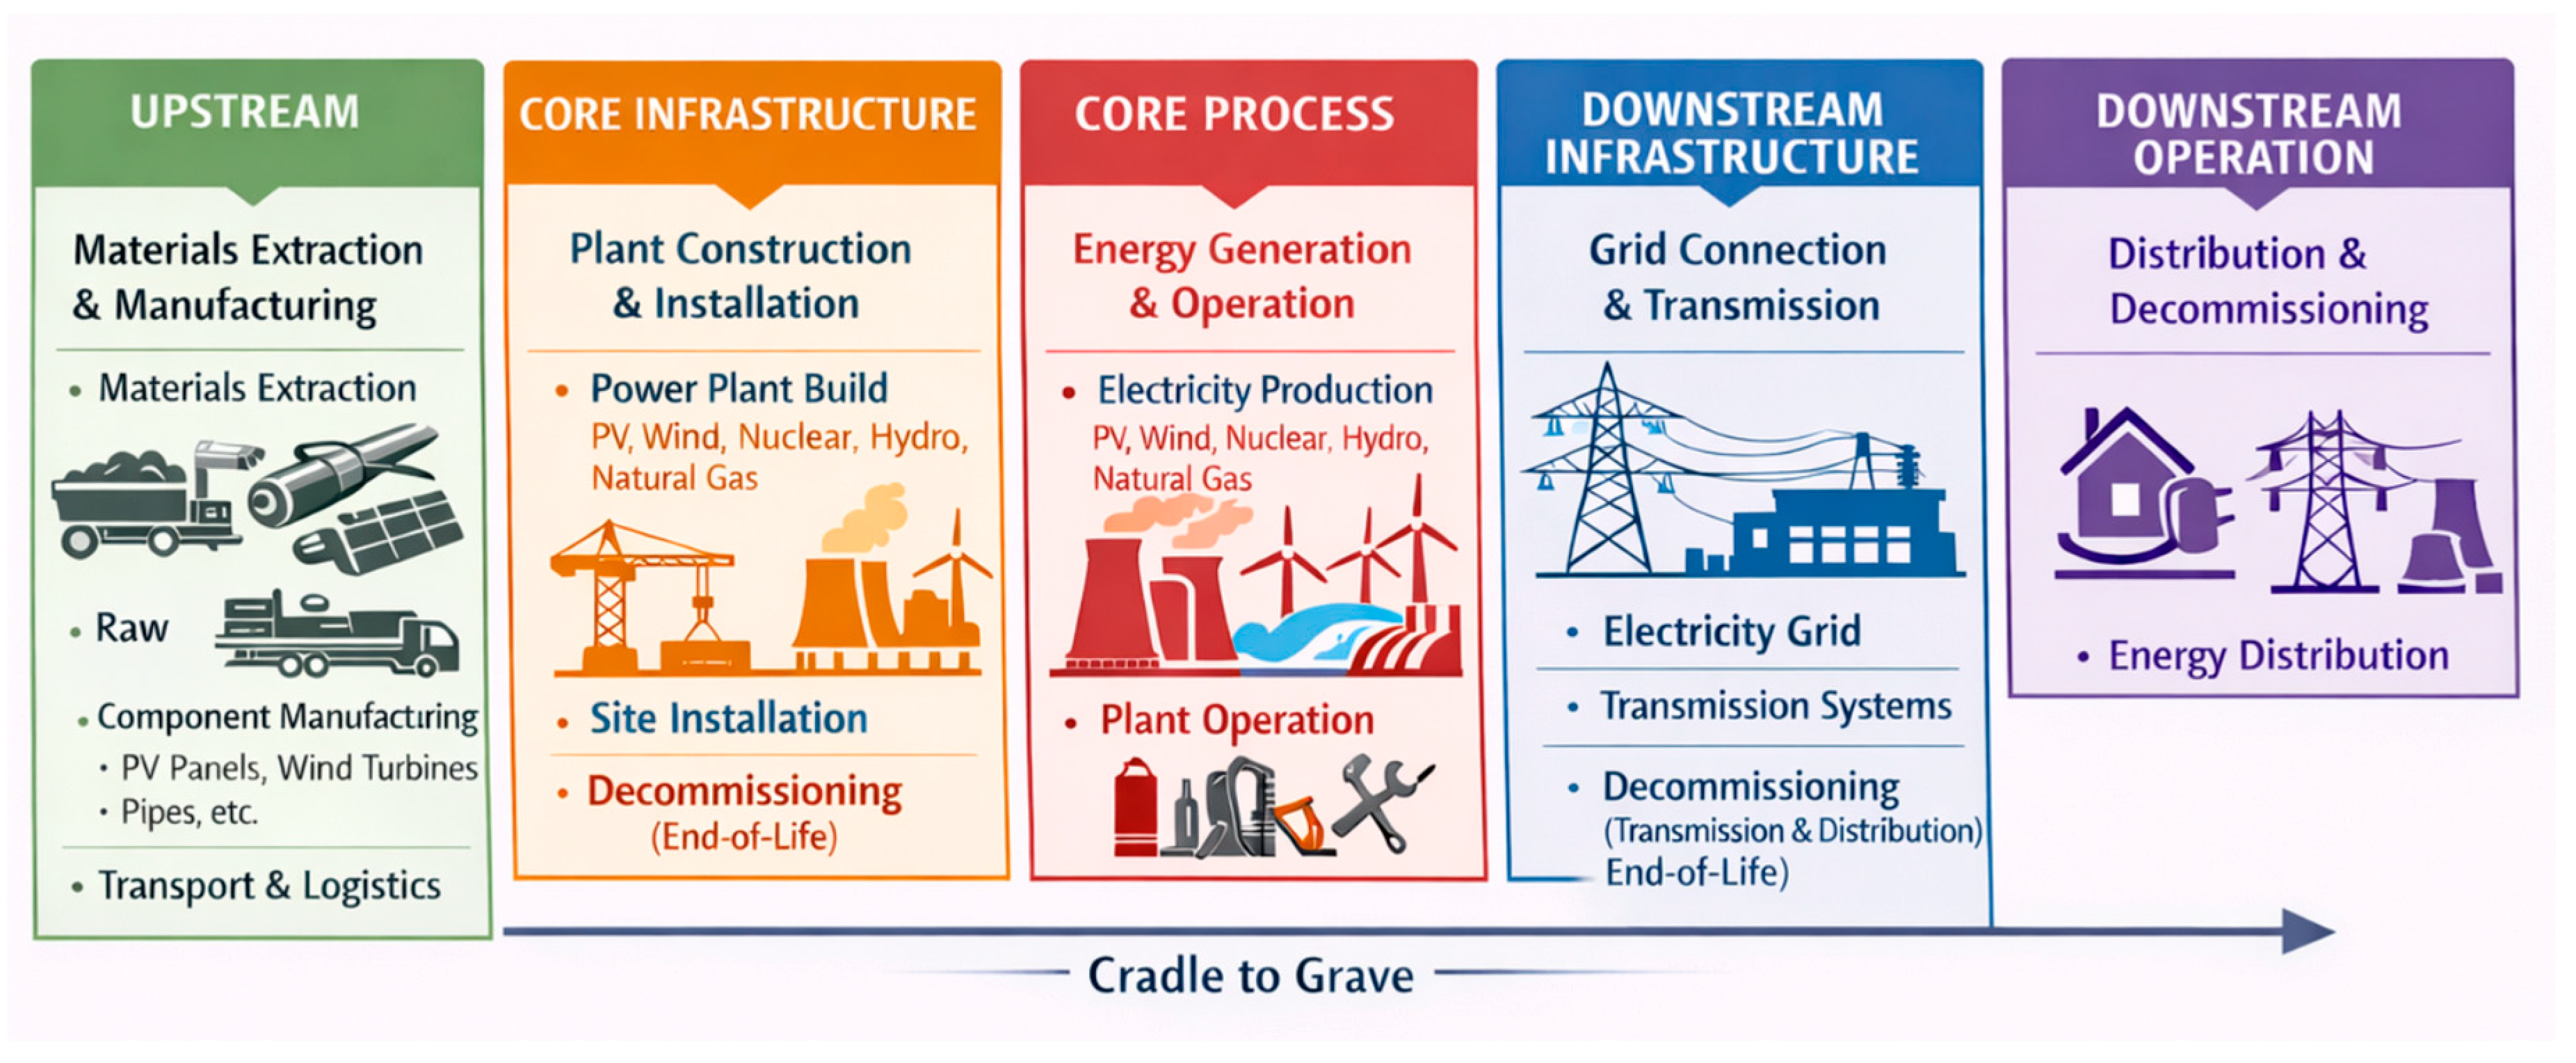
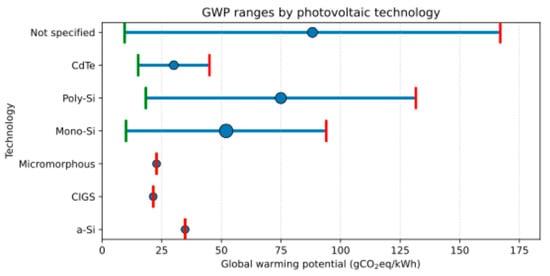
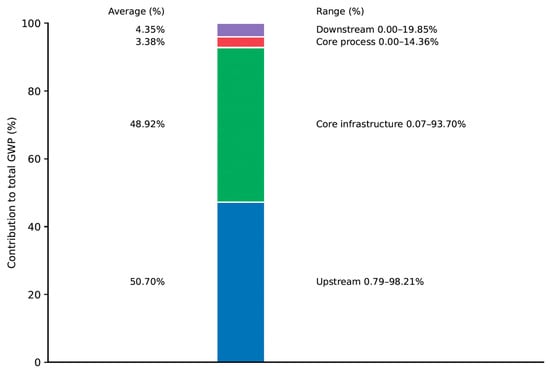
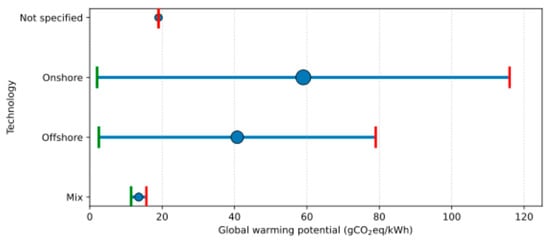
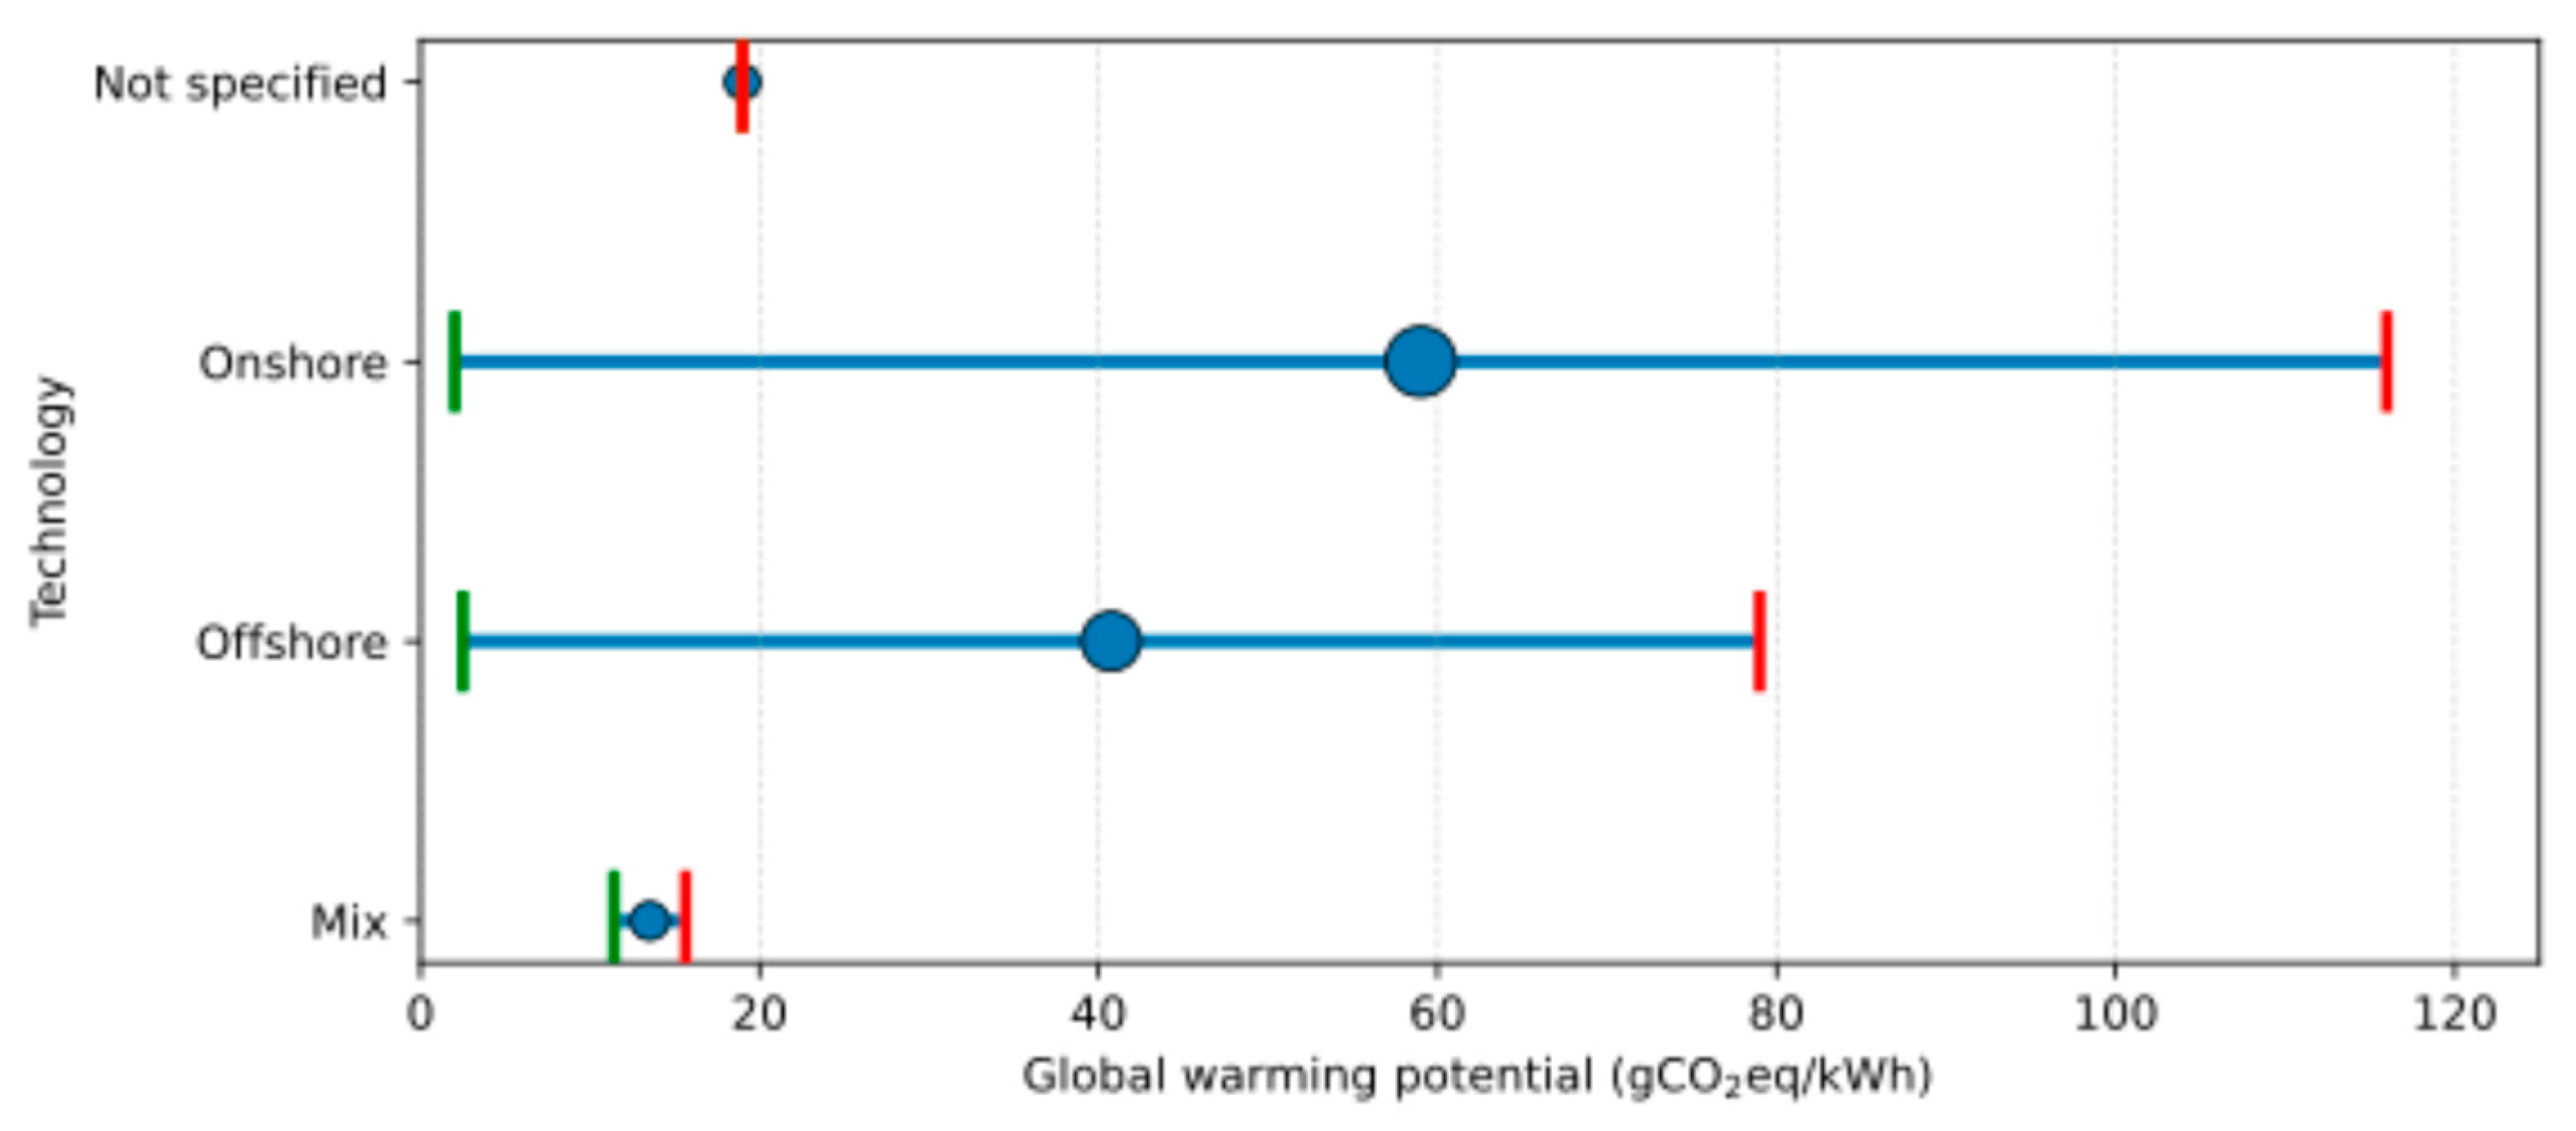
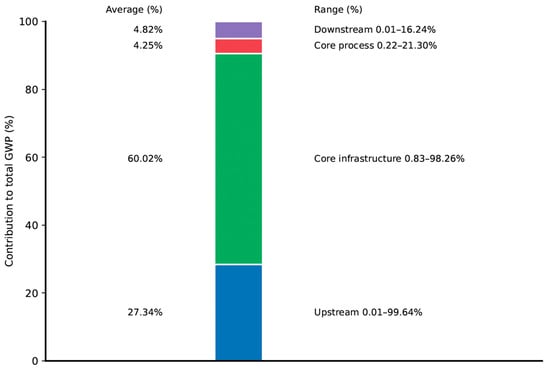
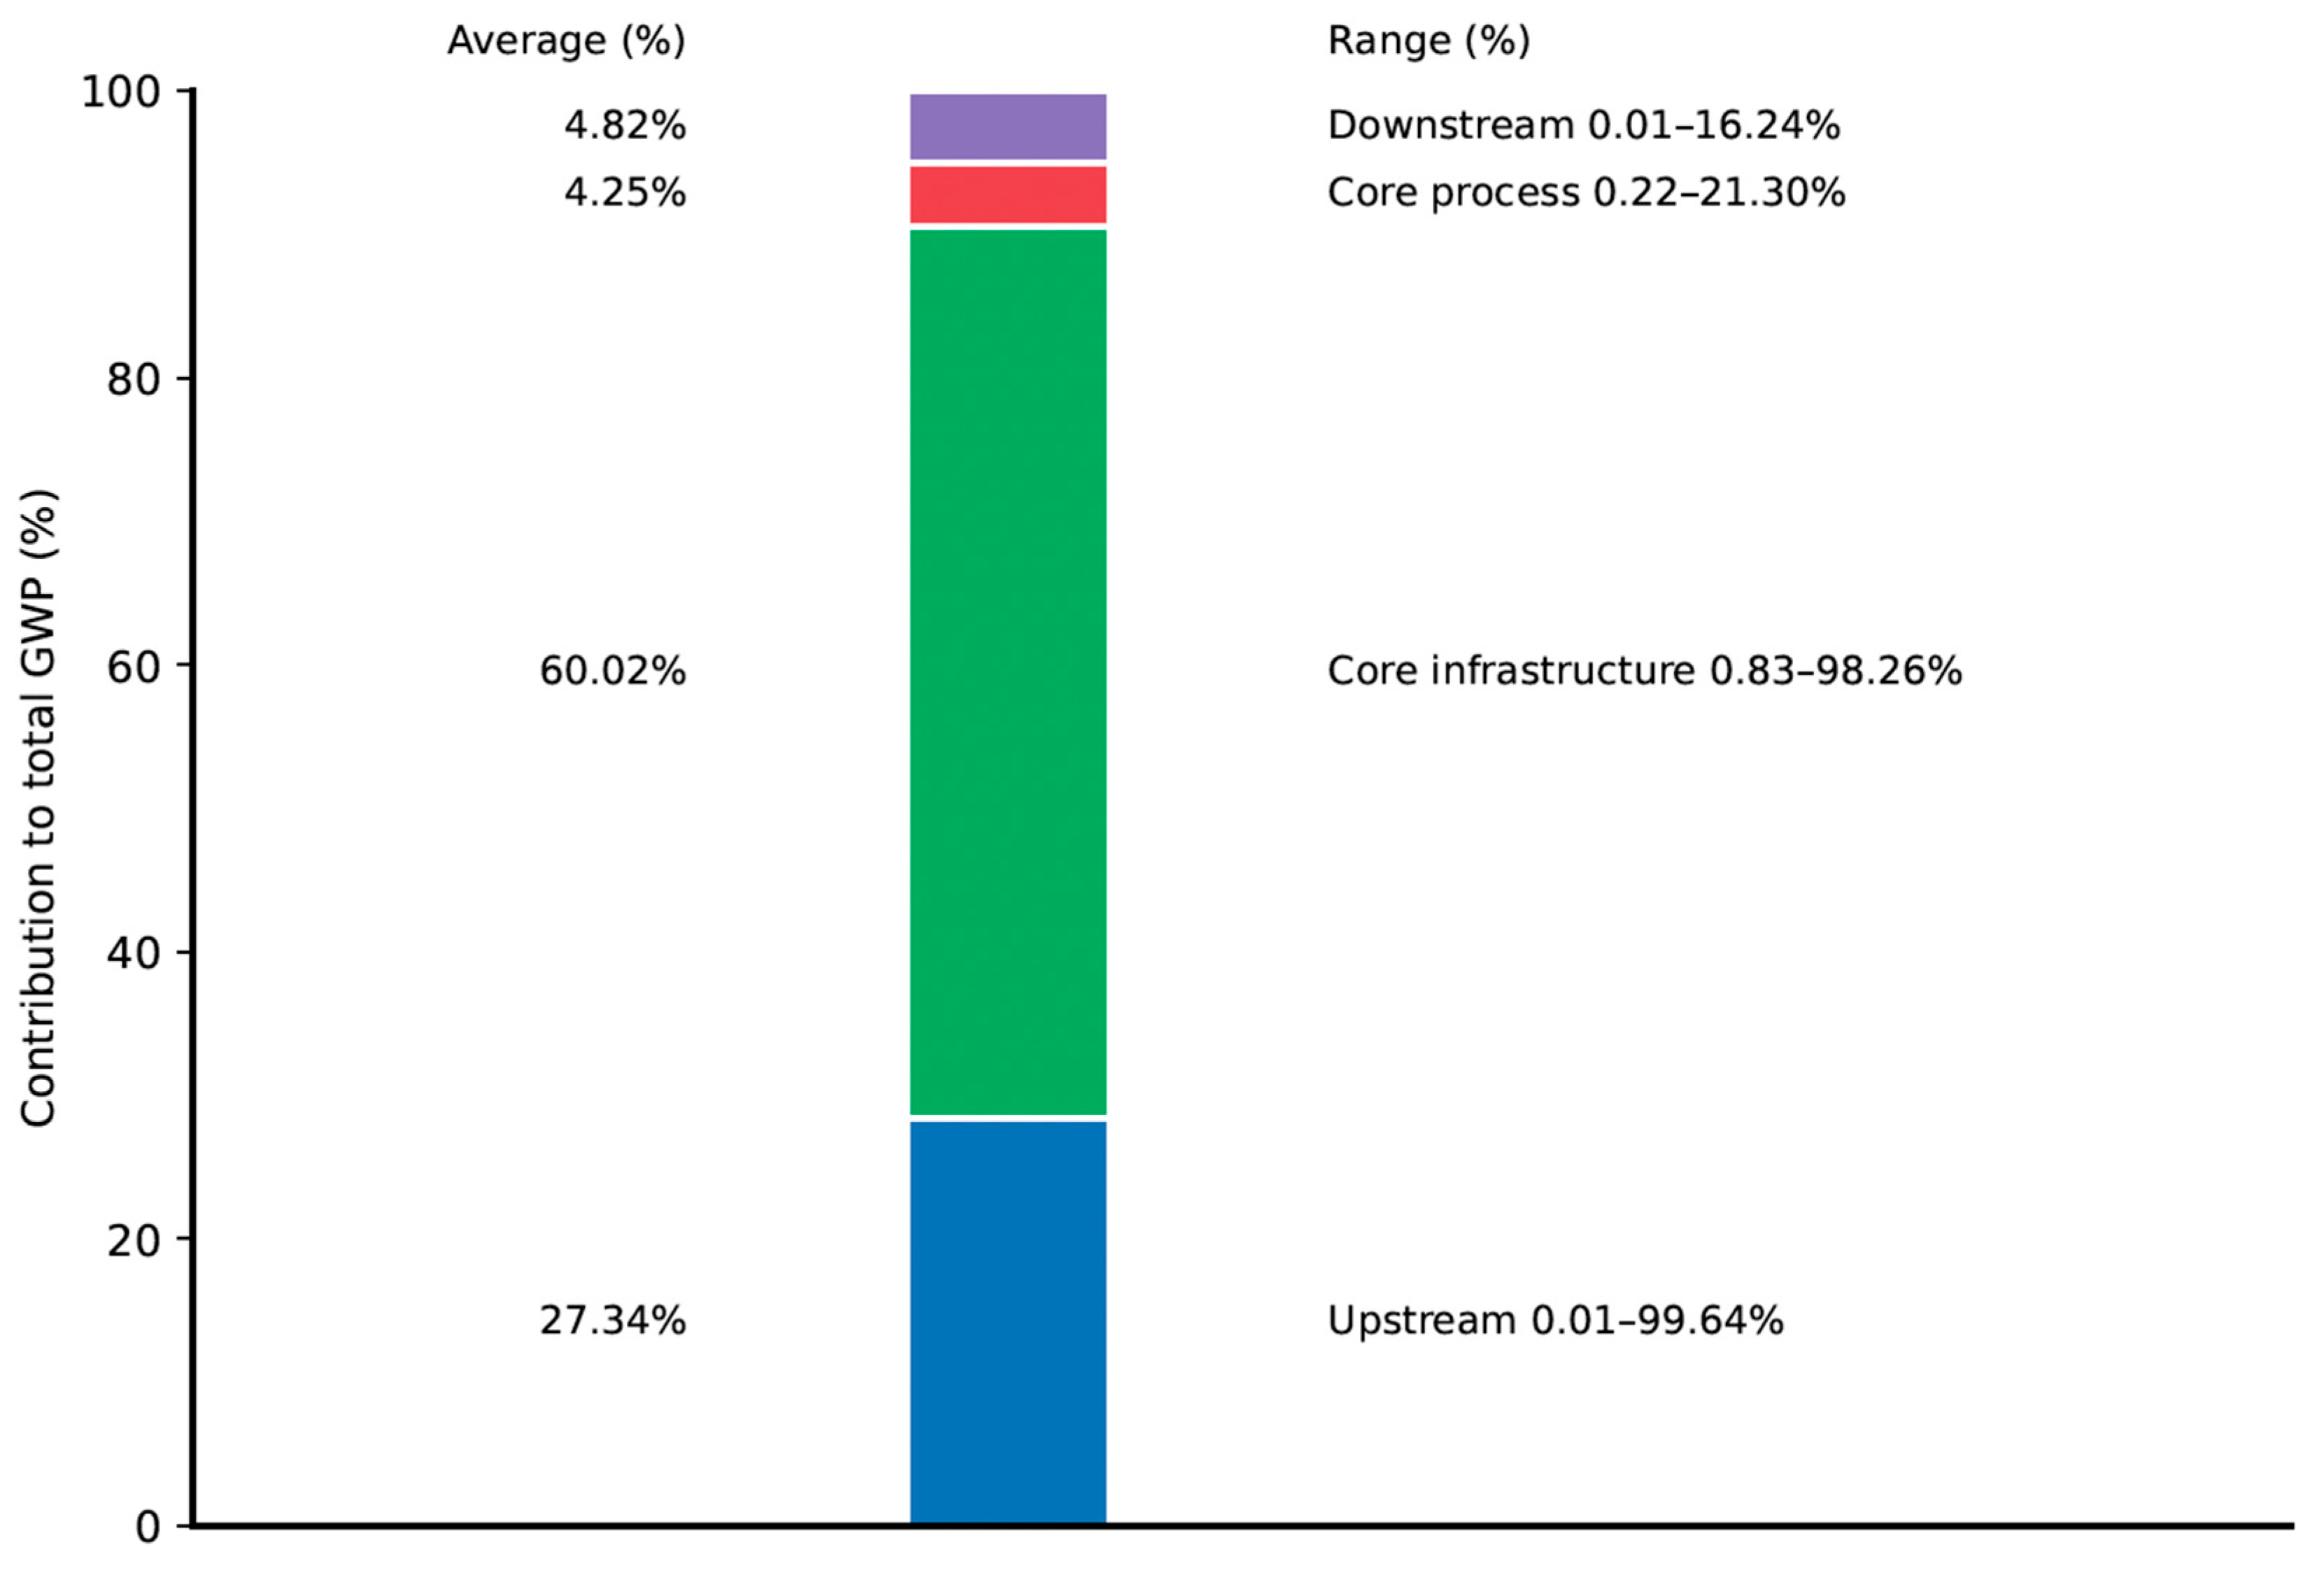
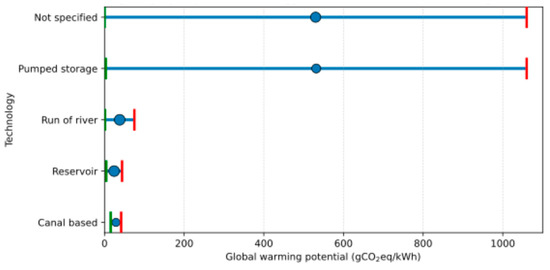
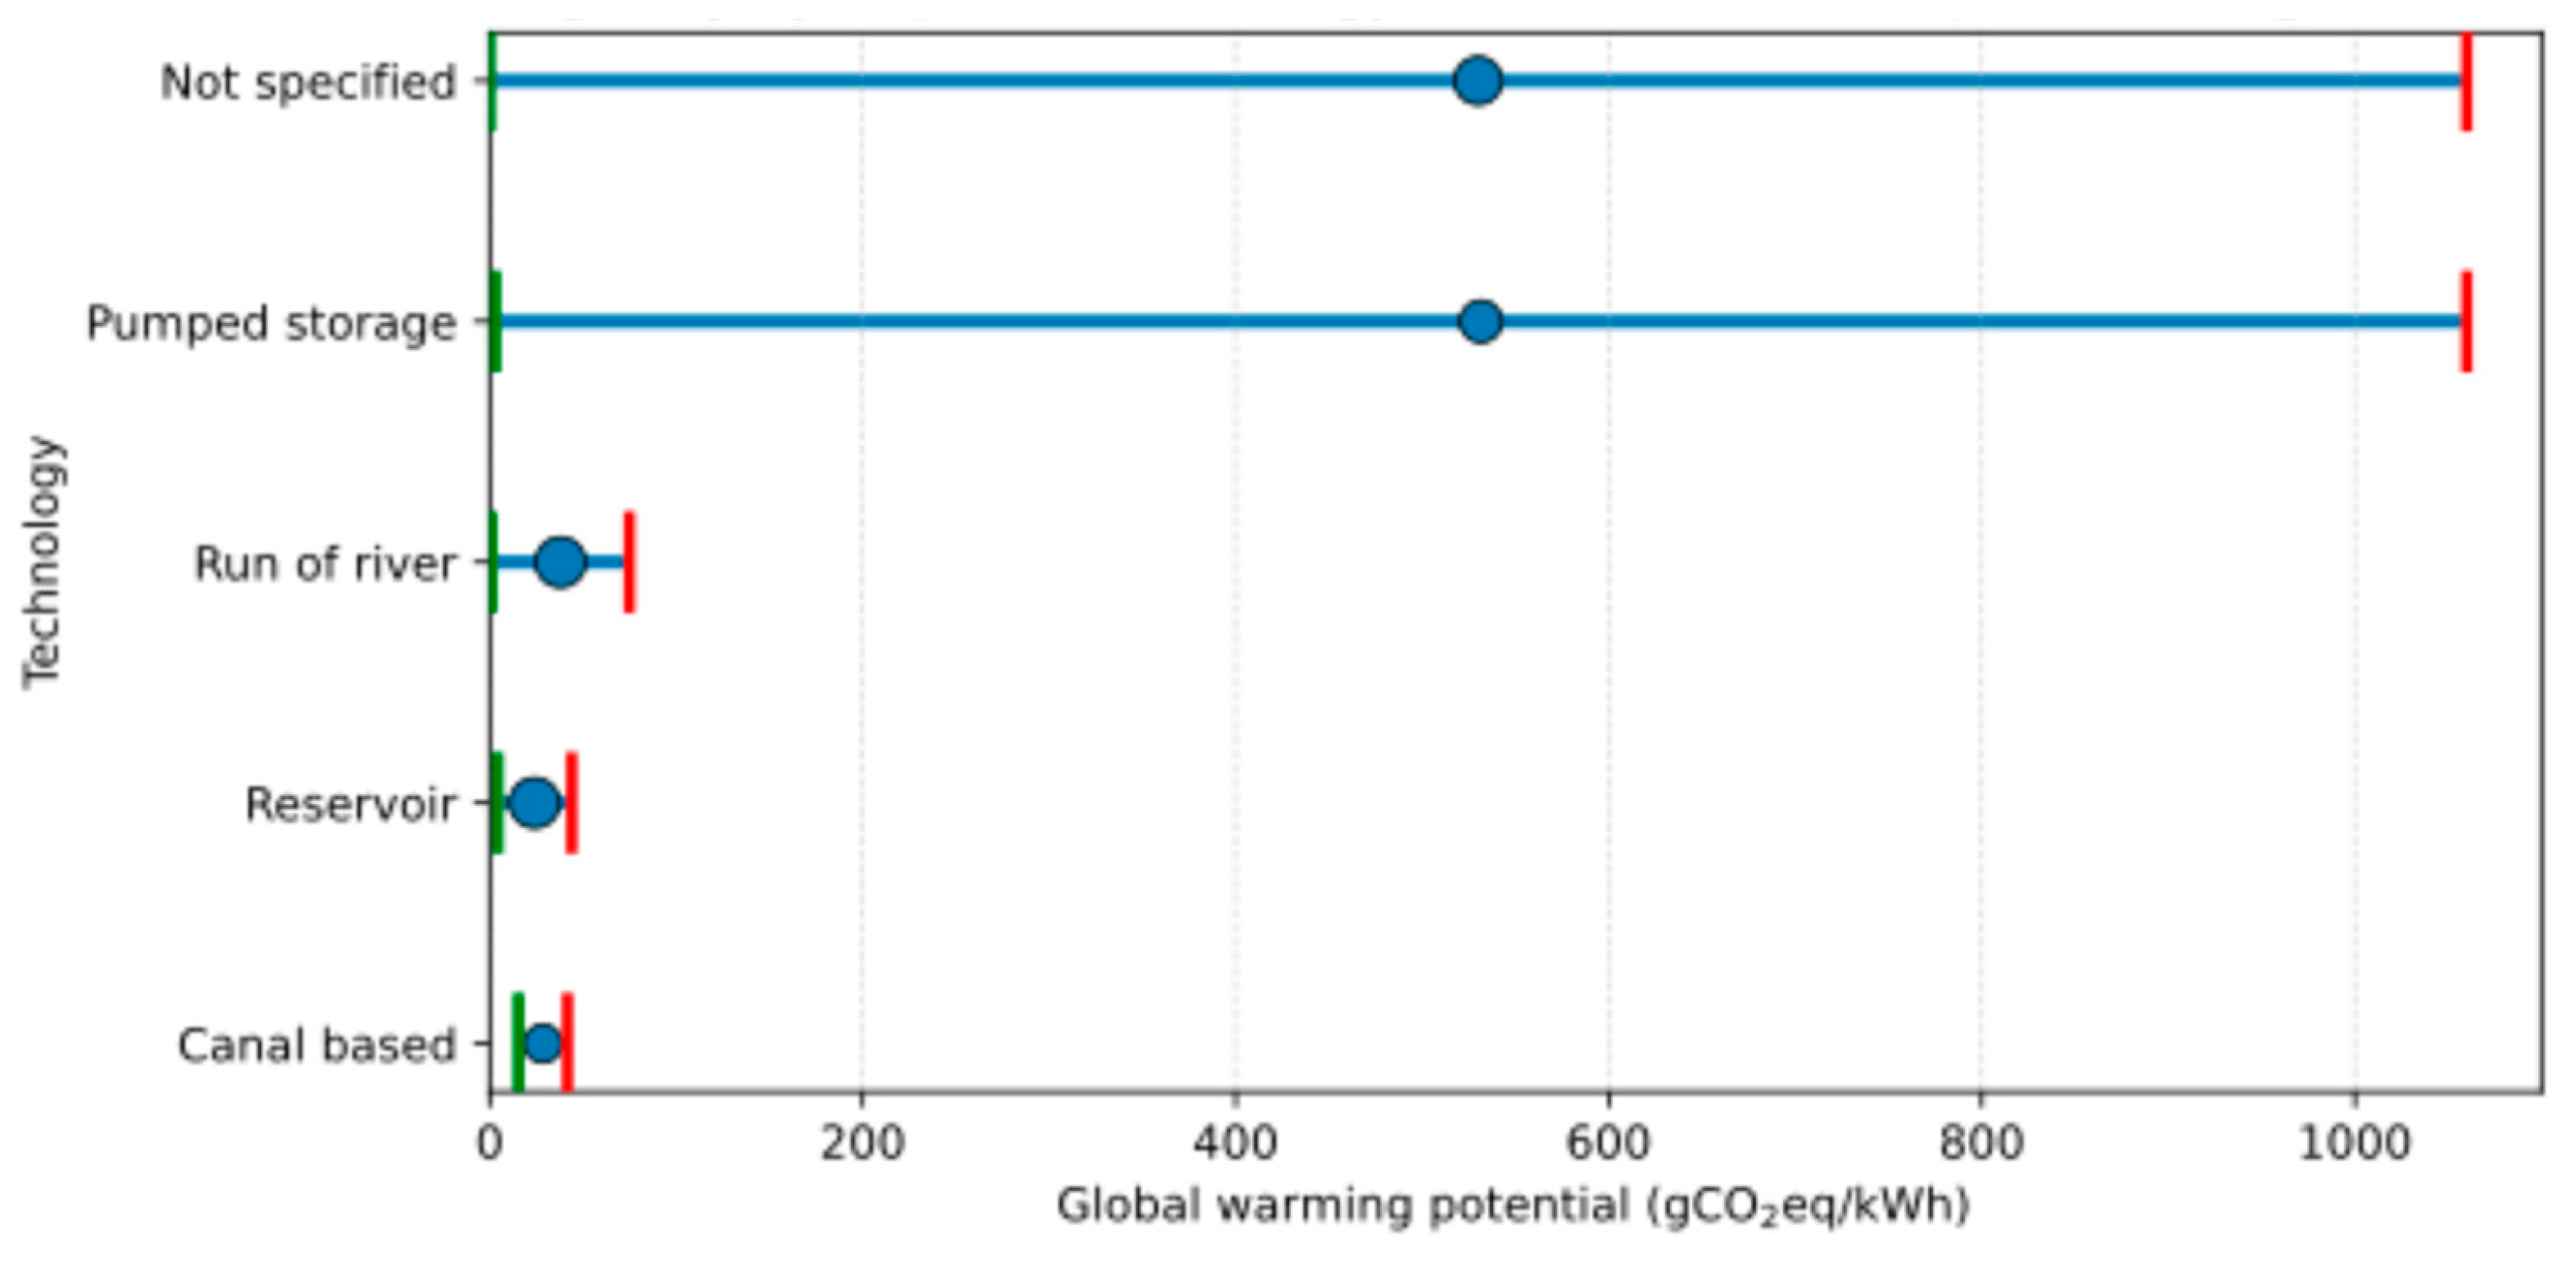
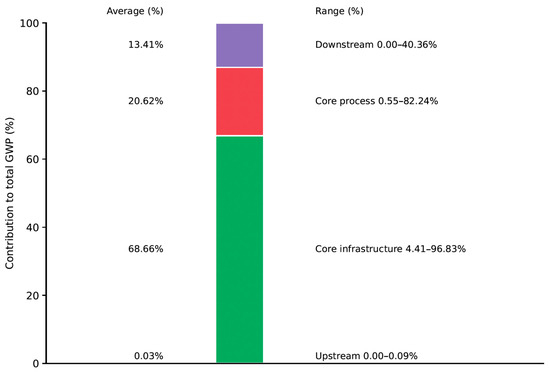
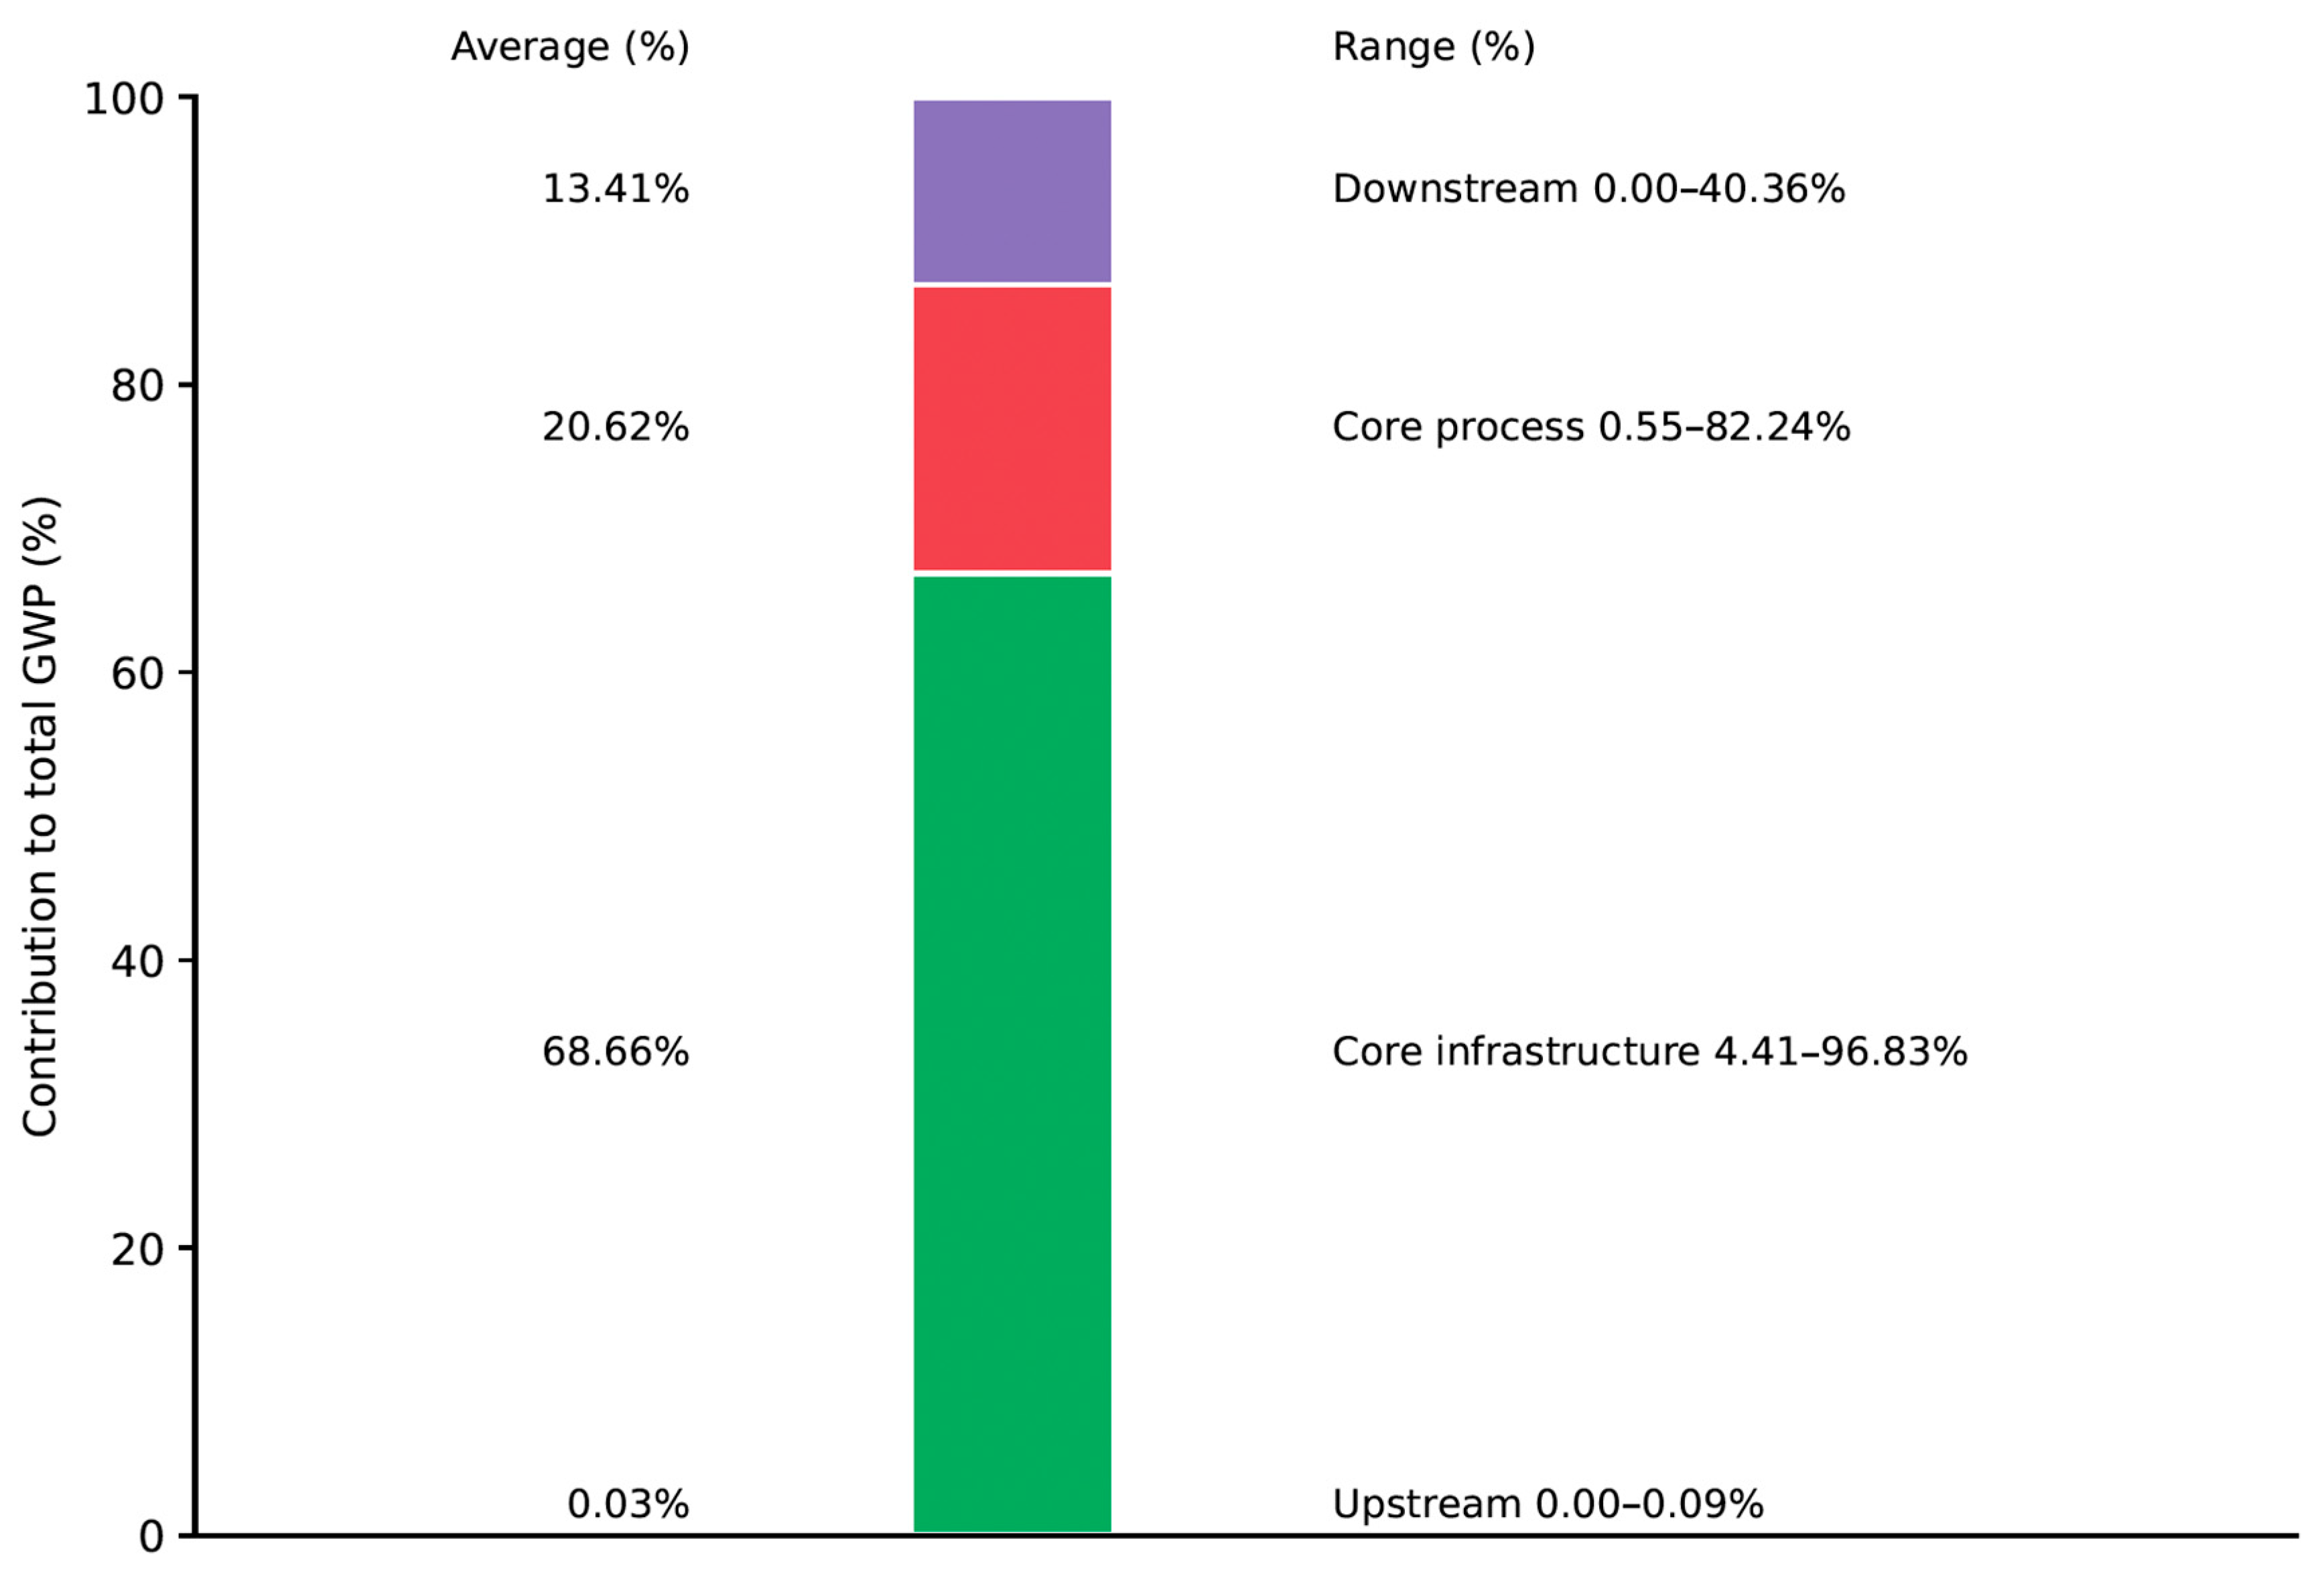
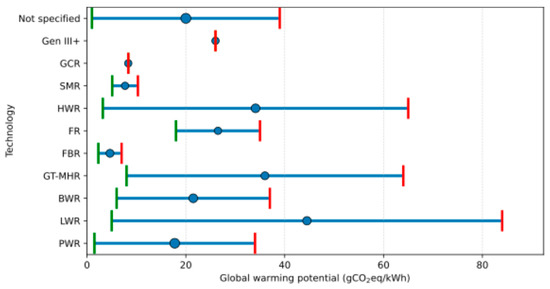
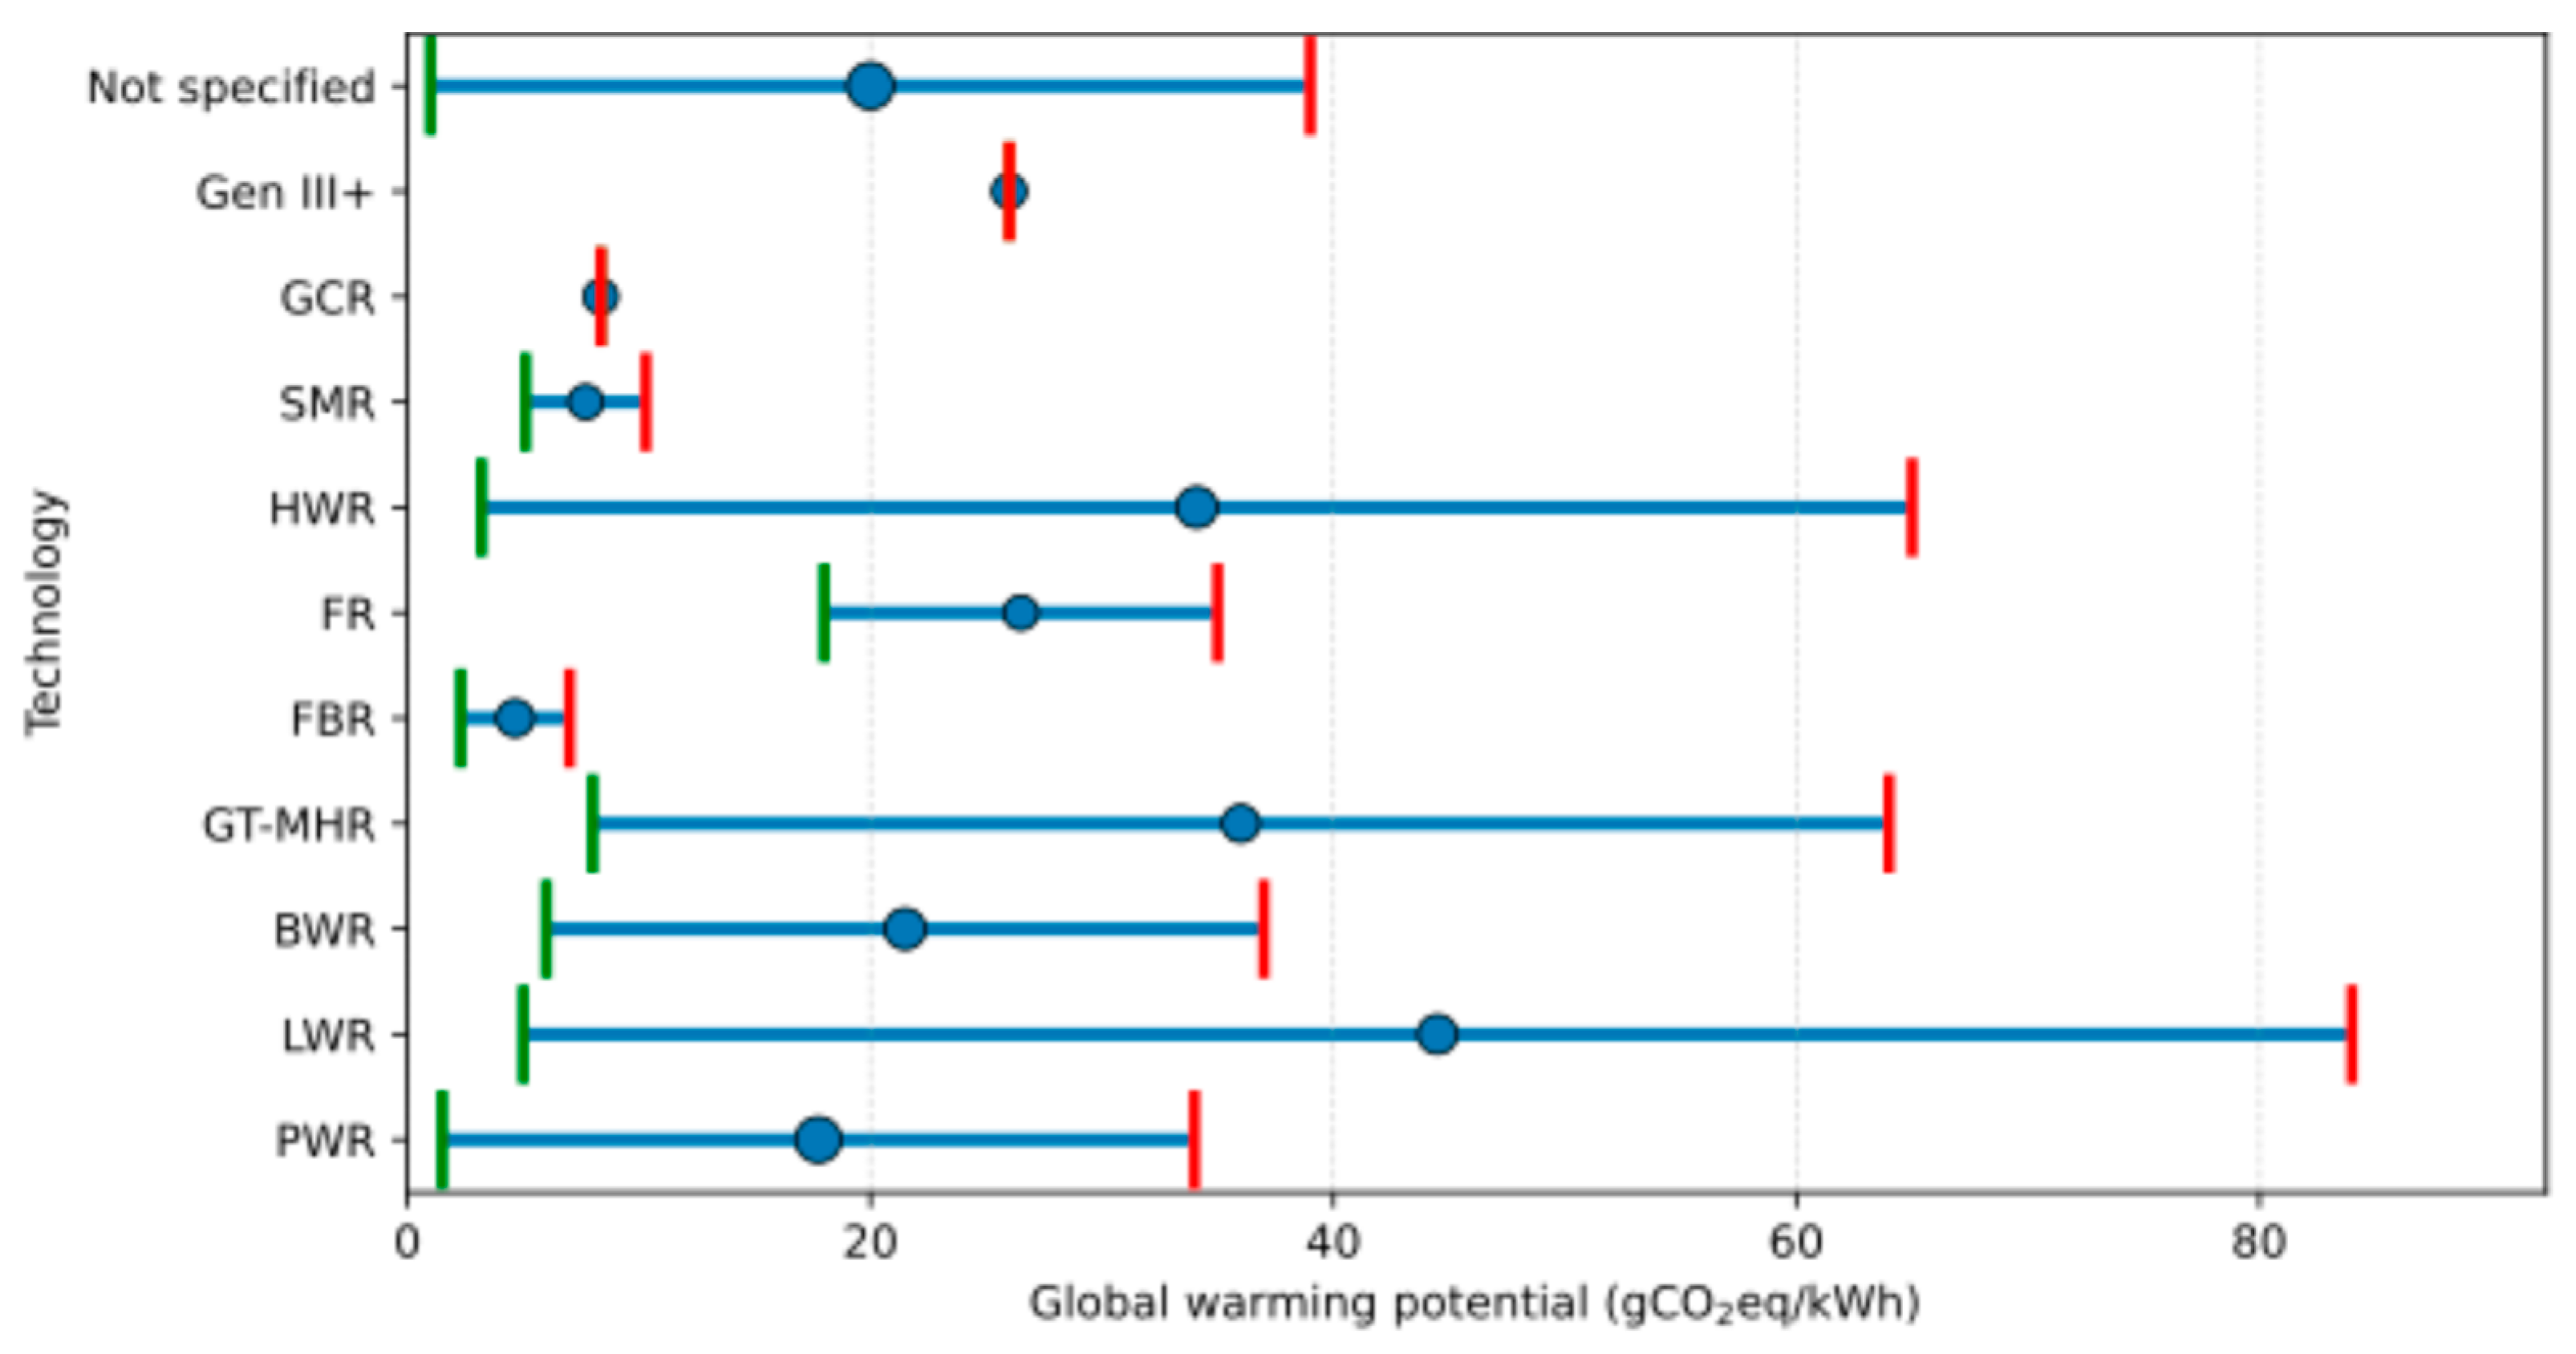
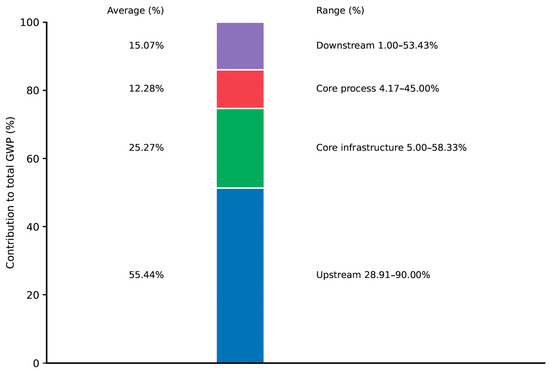
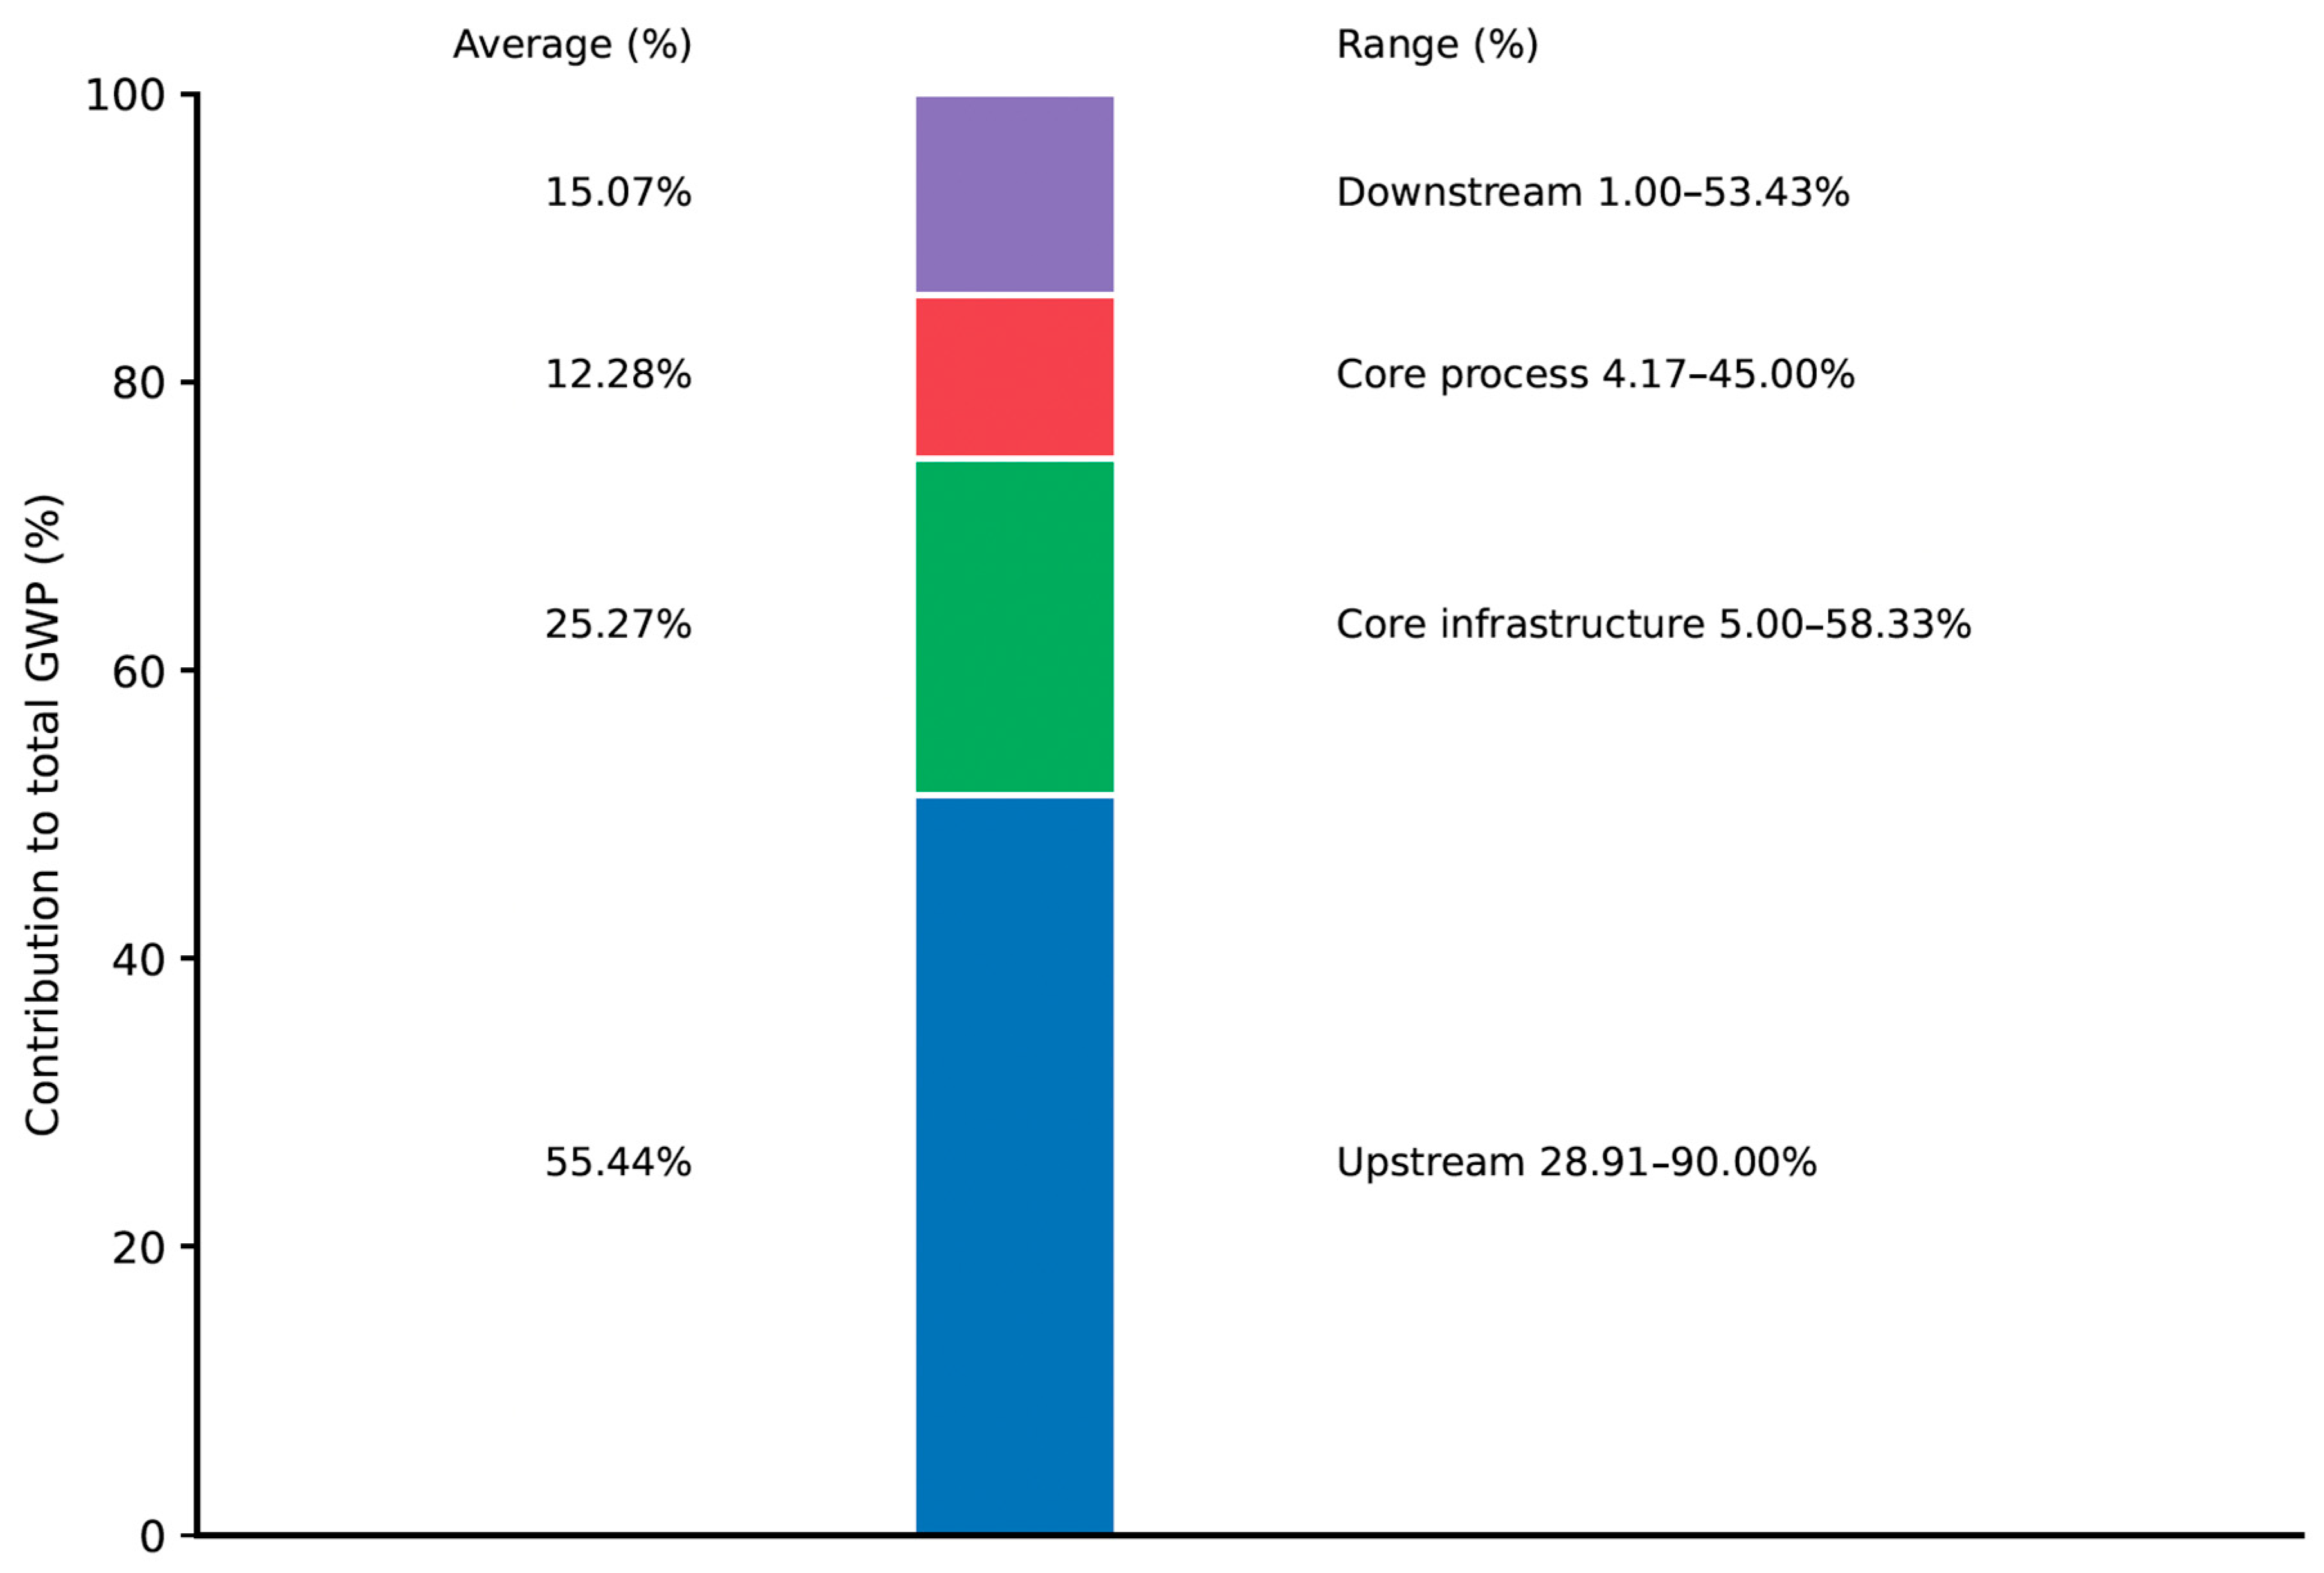
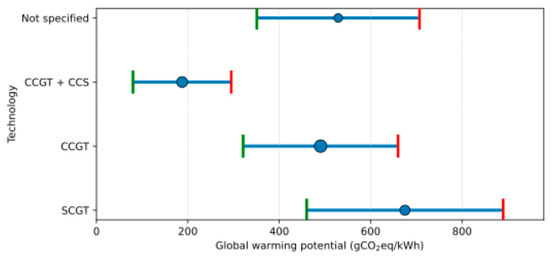
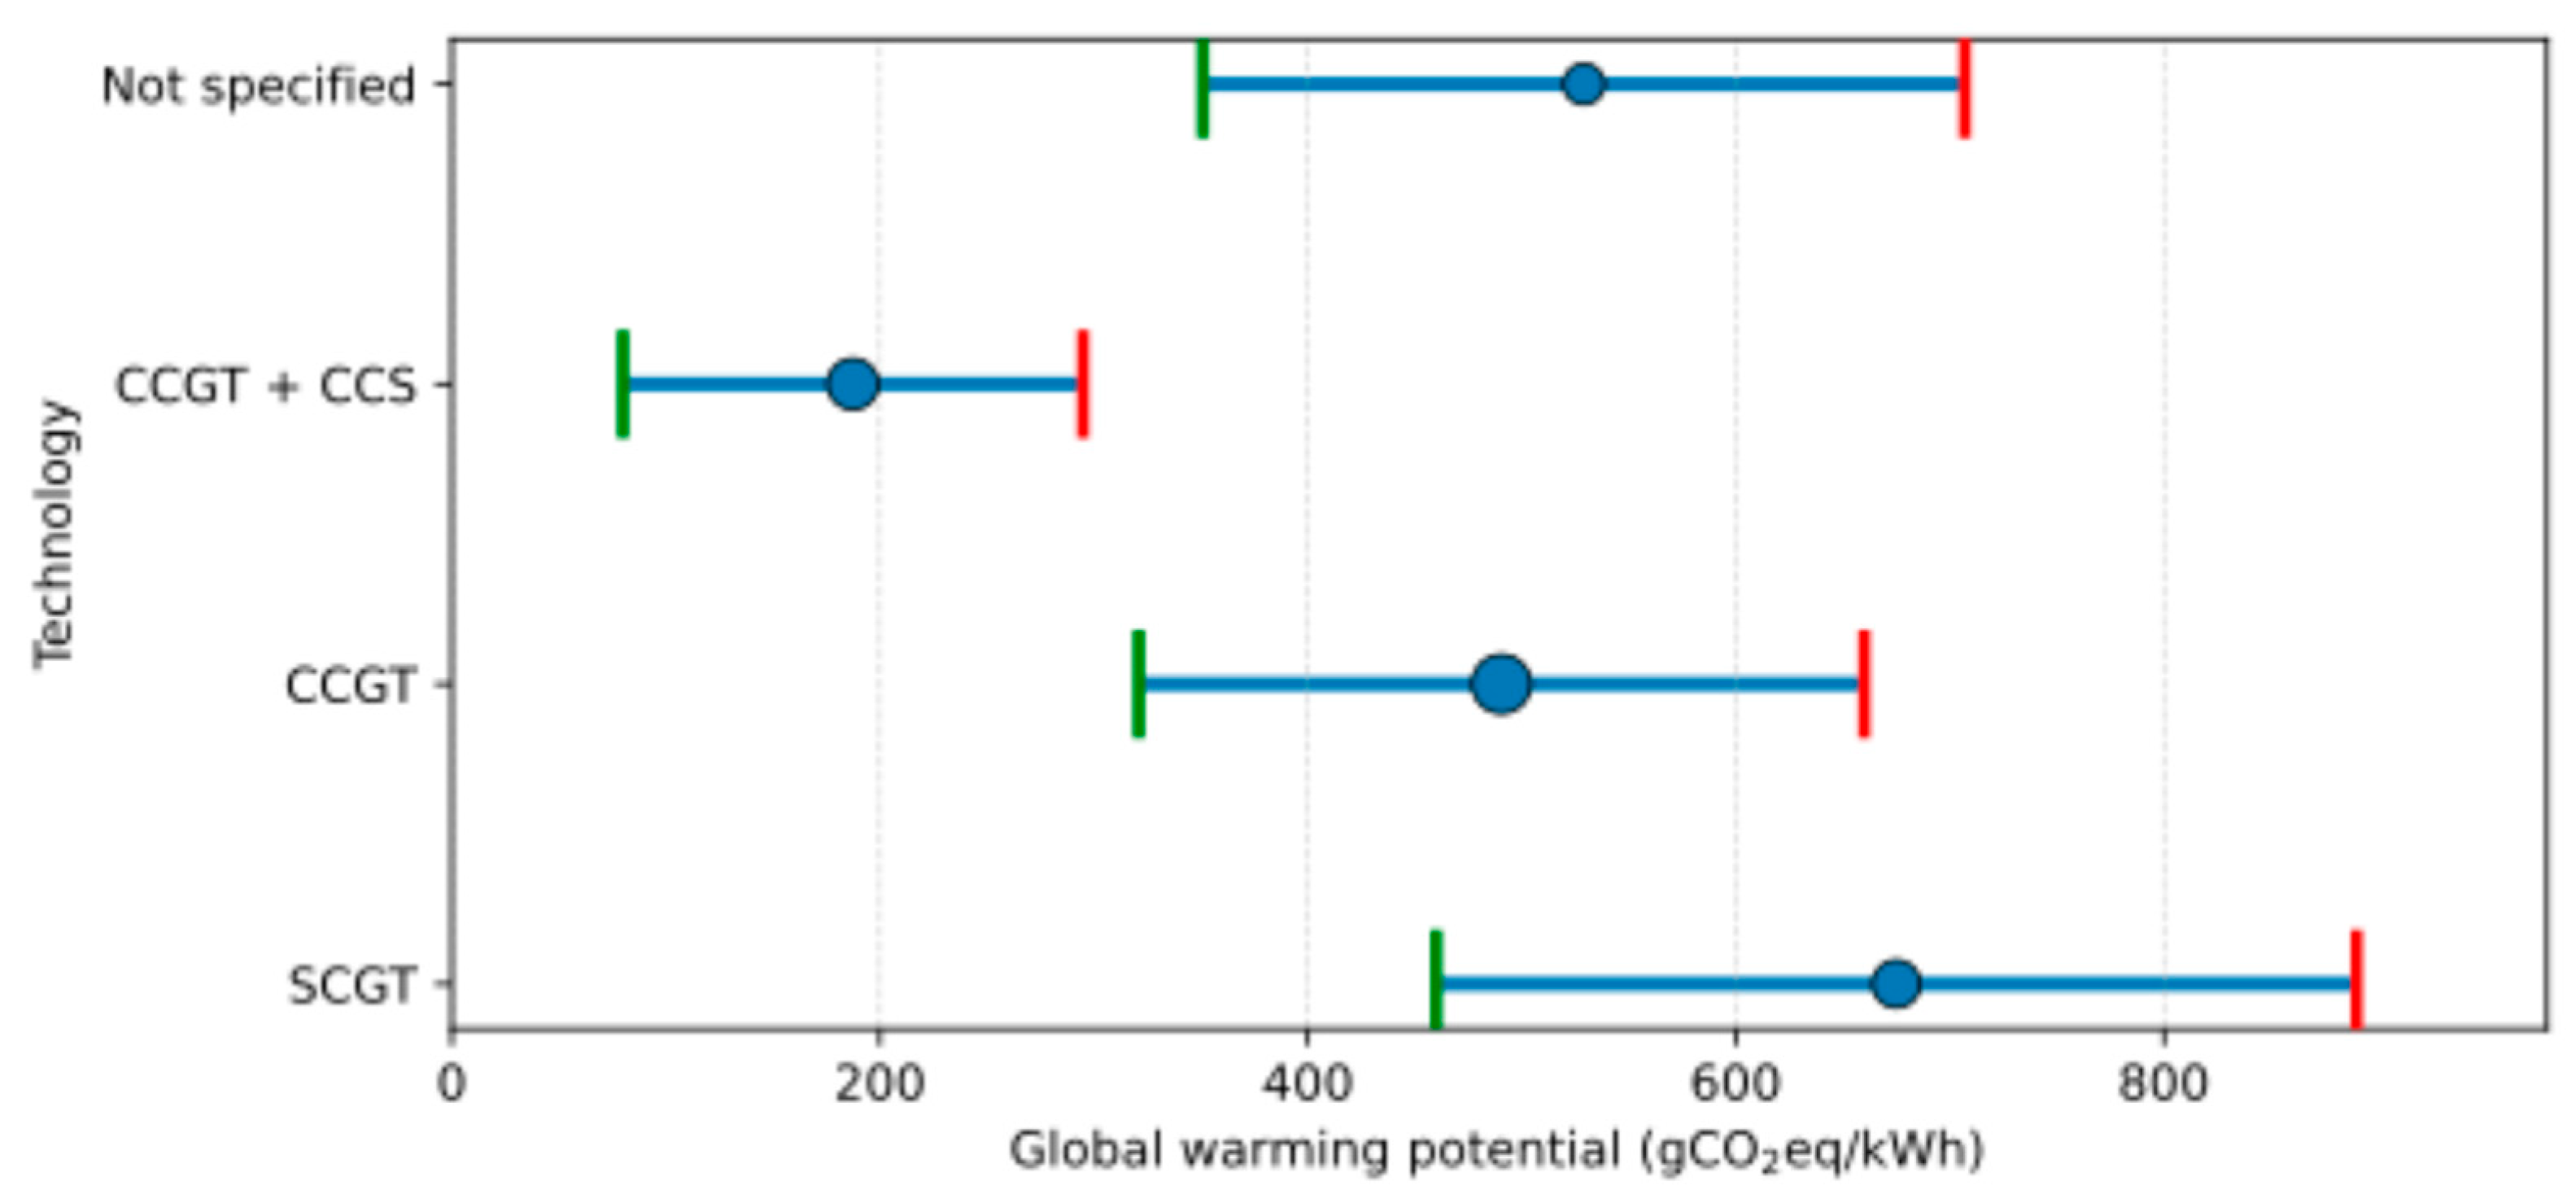
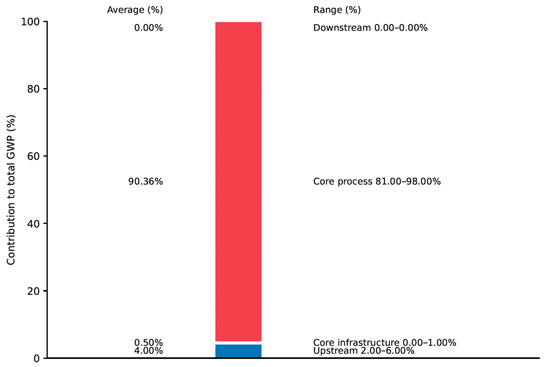
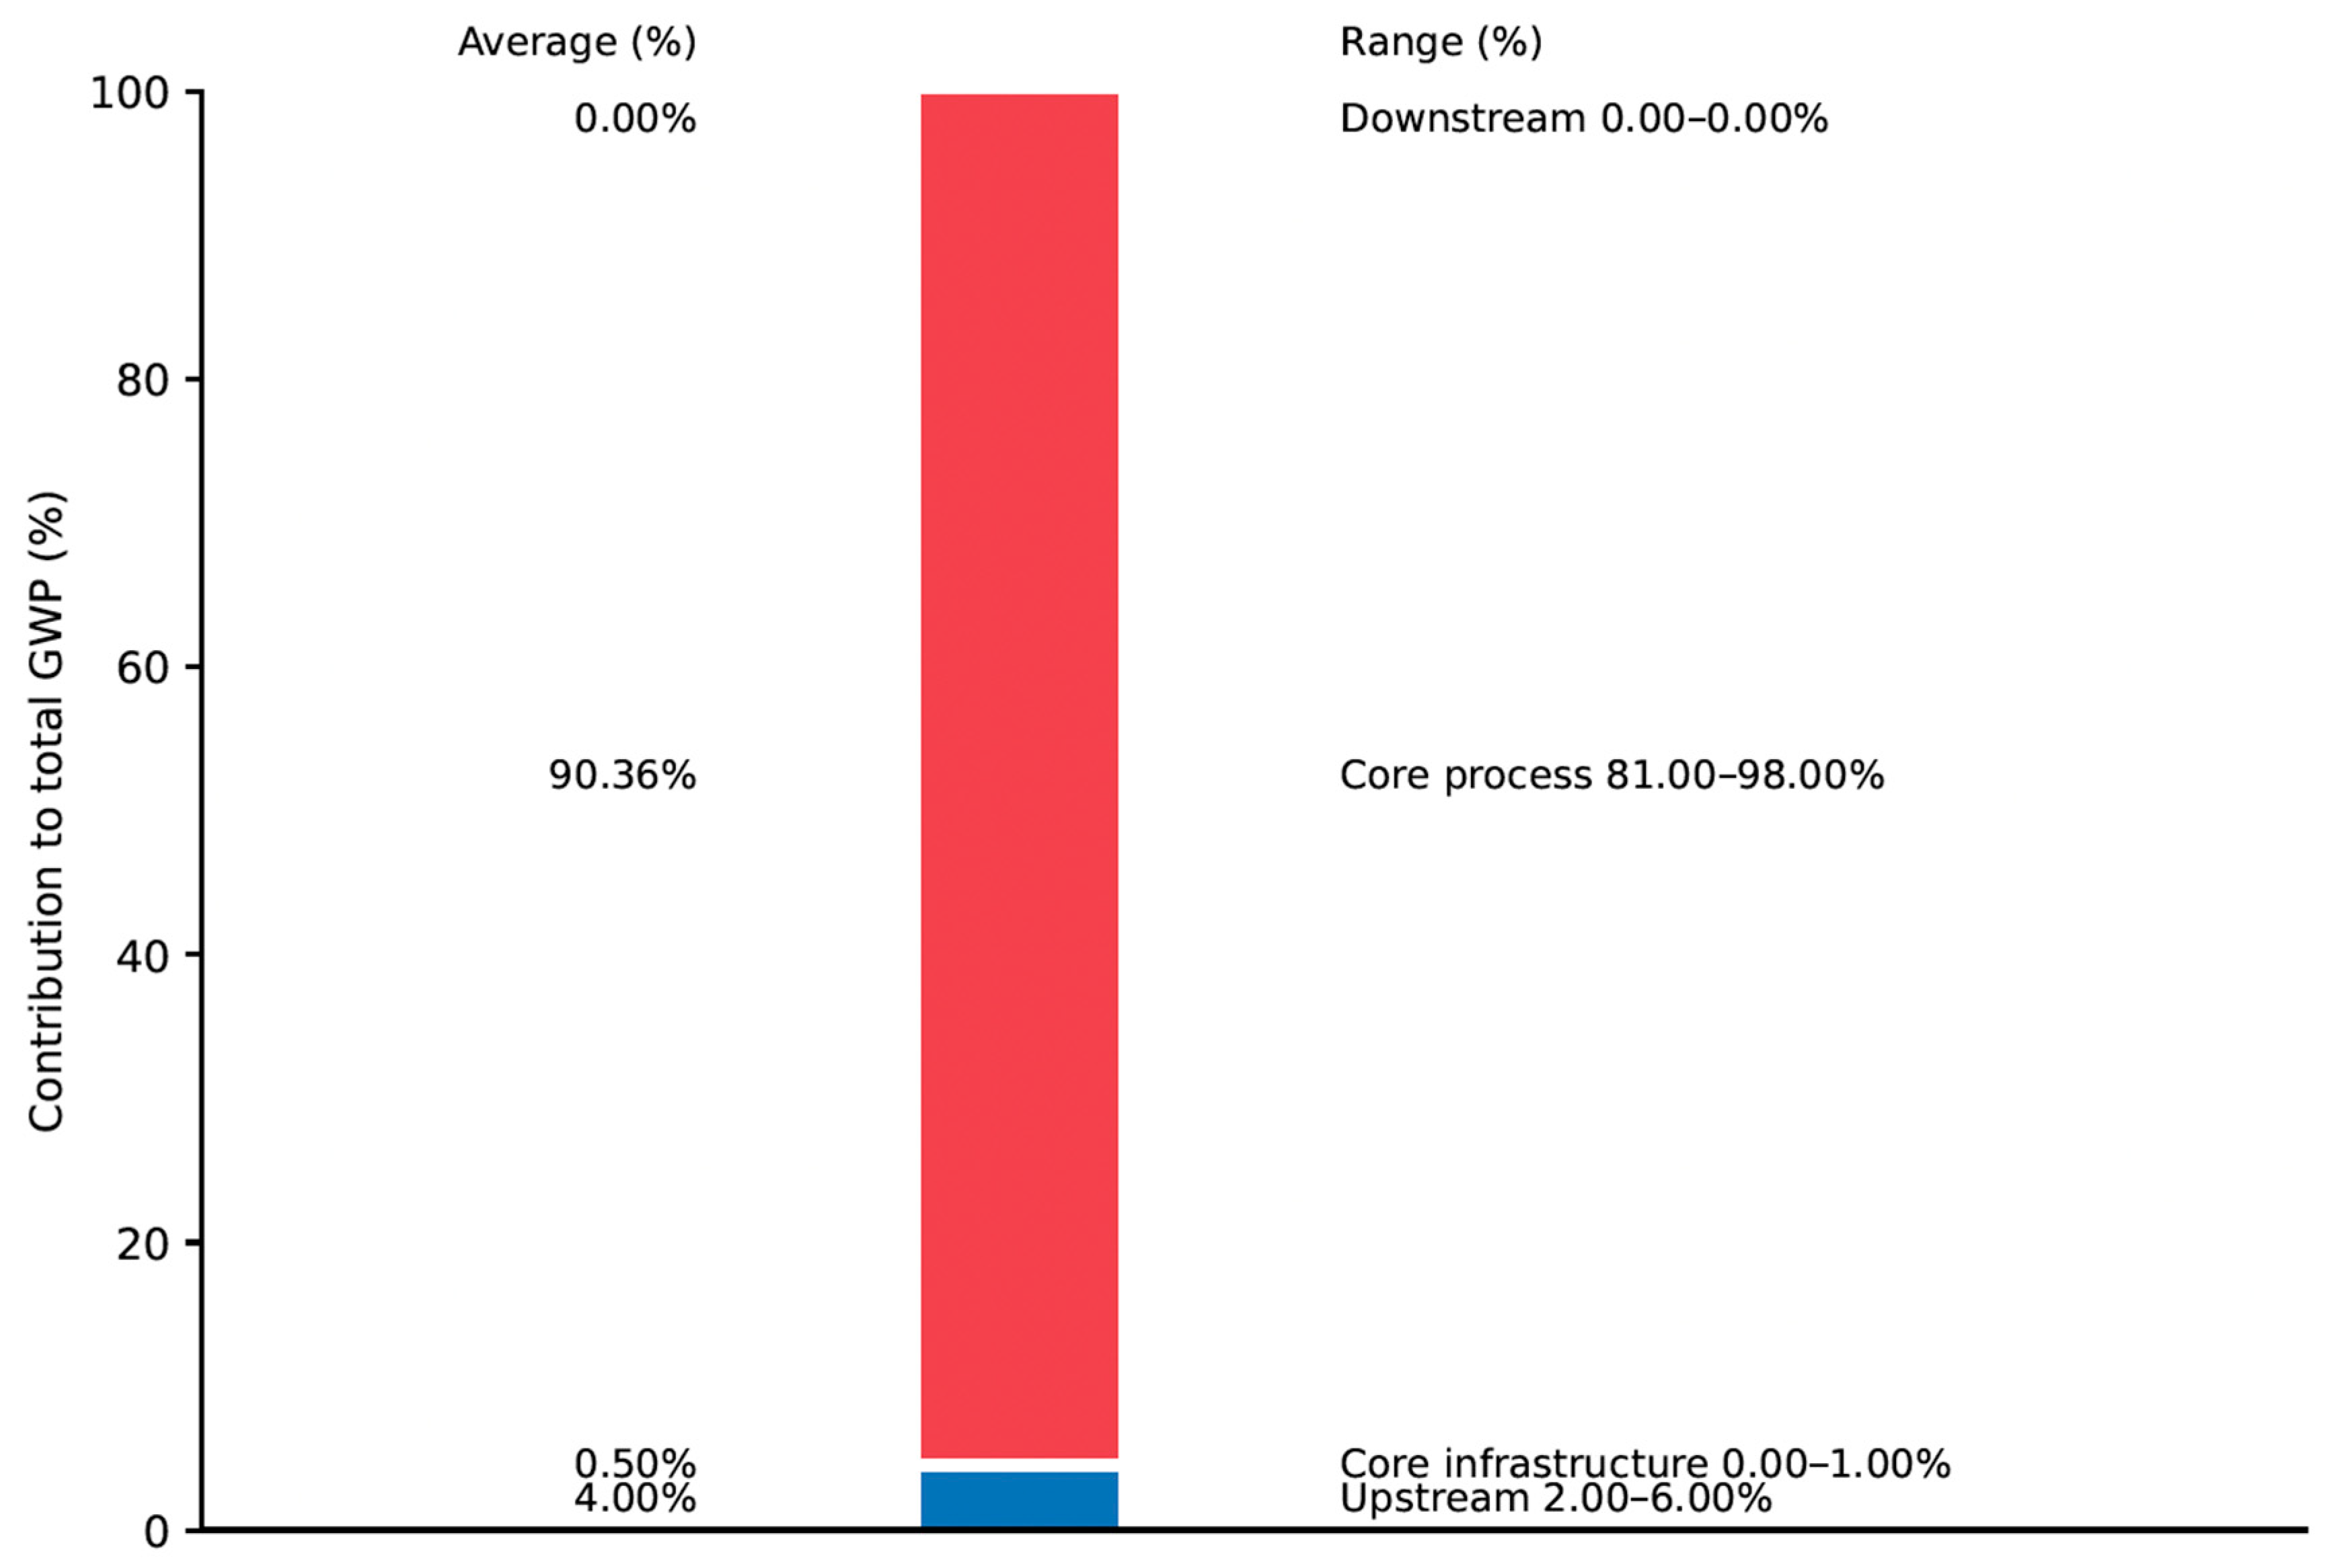
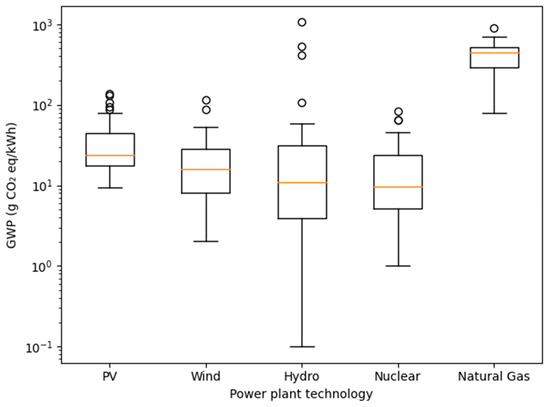
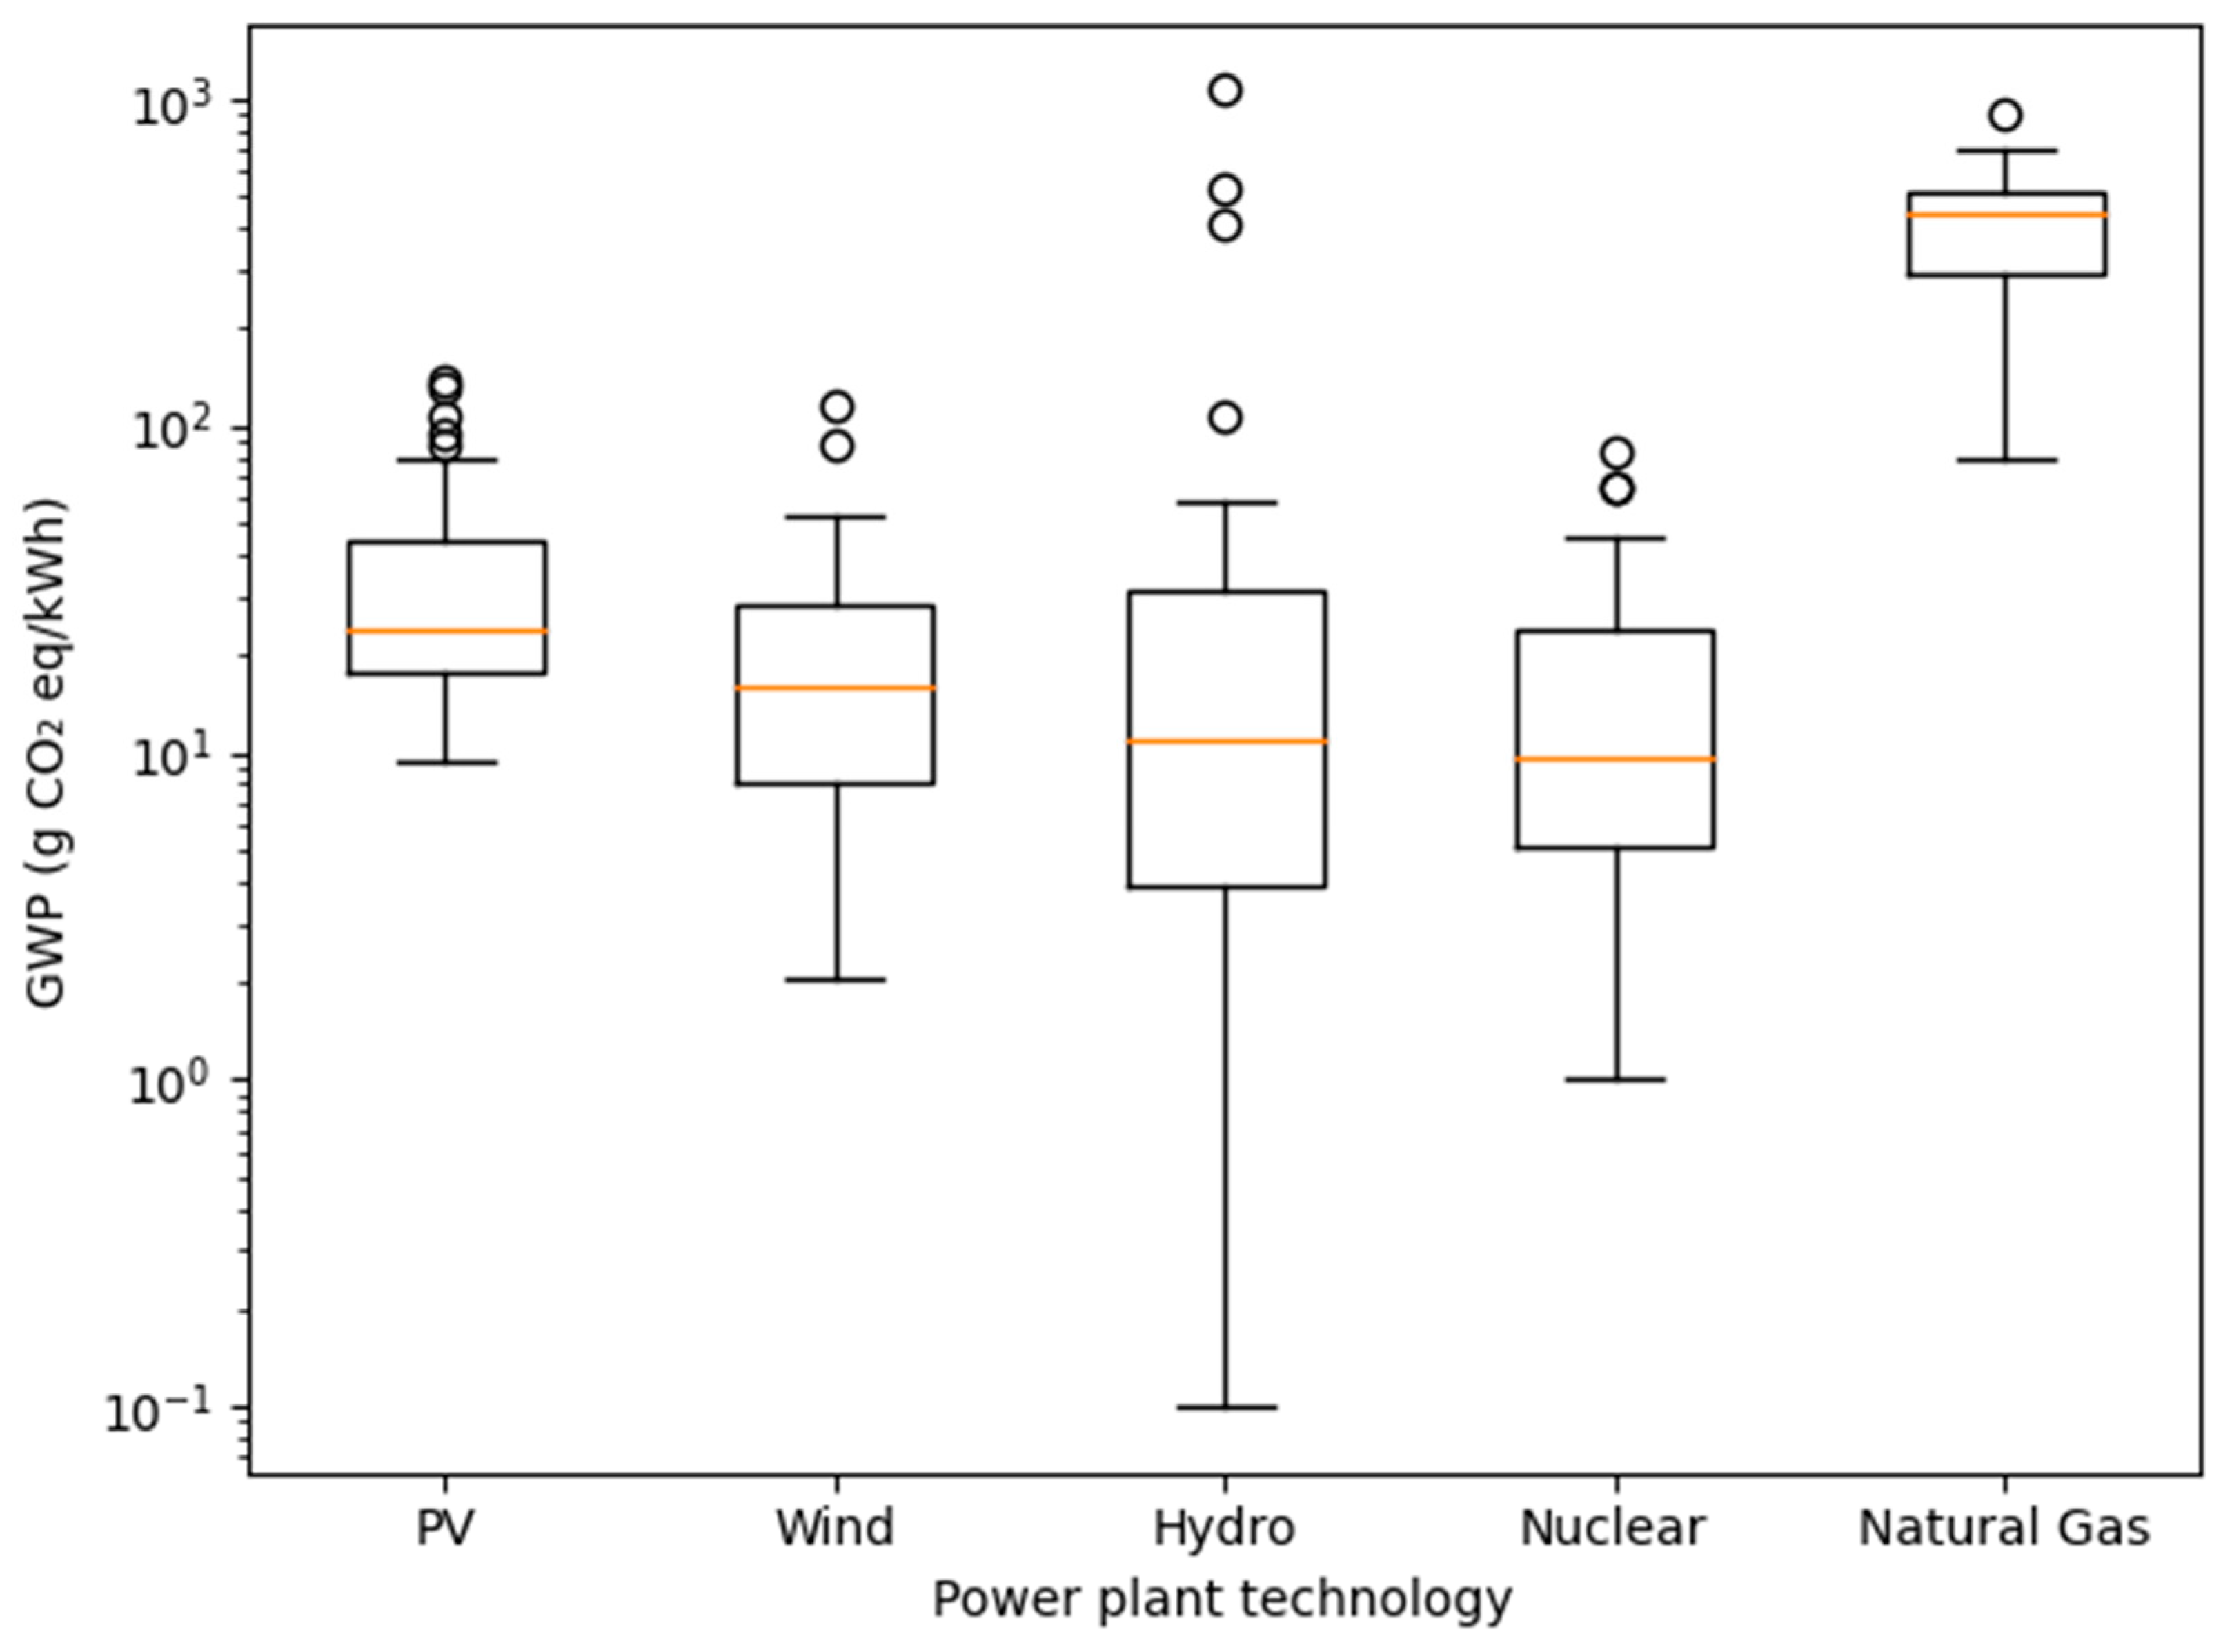

Disclaimer/Publisher’s Note: The statements, opinions and data contained in all publications are solely those of the individual author(s) and contributor(s) and not of MDPI and/or the editor(s). MDPI and/or the editor(s) disclaim responsibility for any injury to people or property resulting from any ideas, methods, instructions or products referred to in the content. |
© 2026 by the authors. Licensee MDPI, Basel, Switzerland. This article is an open access article distributed under the terms and conditions of the Creative Commons Attribution (CC BY) license.