


Abstract
South Africa’s transport sector remains a major contributor to greenhouse gas emissions, yet limited empirical evidence exists on the environmental drivers of public transport emissions at the provincial level. This study applies an extended Stochastic Impacts by Regression on Population, Affluence, and Technology (STIRPAT) framework within a dynamic panel setting to examine the determinants of provincial public transport emissions across nine South African provinces from 2015 to 2022. Rather than conducting economy-wide emissions accounting, the analysis focuses on transport-specific drivers relevant to public passenger mobility, including population, income, fuel consumption, infrastructure investment, and modal usage. A Bias-Corrected Method of Moments (BCMM) estimator is employed to address emission persistence, endogeneity, and small-sample bias, with pooled ordinary least squares and fixed-effects models used for robustness. Province fixed effects are used to control for unobserved regional heterogeneity, while common dynamic elasticities are estimated for key influencing factors. The results reveal strong dependence on emissions, indicating substantial structural persistence over time. GDP per capita emerges as the dominant and statistically significant driver of public transport emissions, while population, urbanisation, fuel consumption, transport infrastructure investment, and modal usage (road and rail) are statistically insignificant once dynamics and unobserved heterogeneity are controlled. These findings suggest that public transport emissions in South Africa are driven primarily by economic growth and entrenched structural factors rather than short-run changes in transport systems. Policy implications highlight the need for sustained low-carbon investment, technological transition, and integrated transport planning to decouple economic growth from emissions and support progress toward Sustainable Development Goals 11 and 13.
1. Introduction
The transport sector is one of the fastest-growing sources of greenhouse gas (GHG) emissions globally, accounting for nearly one-quarter of energy-related carbon dioxide emissions. This growth has been particularly pronounced in developing and emerging economies, where rapid urbanisation, rising incomes, and increasing mobility demand have intensified environmental pressures [1,2]. South Africa represents a critical case in this context. It ranks among the world’s largest emitters and contributes a substantial share of total emissions on the African continent [3]. Within South Africa, the transport sector plays a central role in national emissions, reflecting heavy reliance on fossil-fuel-based mobility systems [4,5]. Public transport is the backbone of passenger mobility in South Africa, serving most daily commuters. However, the sector remains dominated by road-based modes particularly buses and minibus taxis that rely almost exclusively on diesel and petrol [6,7]. While public transport is often viewed as a lower-emission alternative to private vehicle use, its environmental performance depends critically on fleet composition, technology, infrastructure quality, and usage patterns [8,9]. Importantly, this study focuses exclusively on emissions generated by public passenger transport services, rather than on economy-wide or freight-related transport emissions, allowing for a more targeted assessment of sector-specific drivers [10].
South Africa has articulated several policy frameworks aimed at reducing transport-related emissions, including the National Climate Change Response and the Green Transport Strategy [11]. These initiatives emphasise sustainable mobility, improved public transport infrastructure, and the gradual transition toward low-carbon technologies. Despite these commitments, transport emissions continue to rise, and substantial disparities persist across provinces in terms of economic activity, infrastructure provision, and transport system performance [12]. This raises important questions about the underlying drivers of public transport emissions and the effectiveness of current policy approaches.
Existing empirical studies on transport emissions largely rely on national-level data or static modelling frameworks. While these studies provide valuable insights, they often obscure regional heterogeneity and fail to capture the dynamic nature of emissions, particularly the role of persistence and feedback effects. Moreover, few studies explicitly focus on public transport emissions, and even fewer examine these dynamics at the subnational level in developing countries. In addition, many applications of the STIRPAT framework incorporate economy-wide indicators such as industrial structure or national energy composition, which are less directly linked to public passenger transport activity at the provincial level.
This study addresses these gaps by applying an extended Stochastic Impacts by Regression on Population, Affluence, and Technology (STIRPAT) framework within a dynamic panel setting to provincial public transport emissions in South Africa. Using data from nine provinces over the period 2015–2022, the analysis incorporates key drivers including population, GDP per capita, urbanisation, fuel consumption, transport infrastructure investment, and modal usage of road and rail public transport. These variables are selected to reflect transport-specific proxies for the population, affluence, and technology components of STIRPAT, consistent with the sectoral focus of the study.
To account for emission persistence, endogeneity, and small-sample bias inherent in short panels, the study employs a Bias-Corrected Method of Moments (BCMM) estimator, complemented by pooled ordinary least squares and fixed-effects models for robustness. Province fixed effects are used to control for time-invariant regional heterogeneity in emission levels, while the analysis estimates common dynamic elasticities for influencing factors across provinces. This approach allows the study to focus on the dynamics and determinants of public transport emissions rather than on province-specific emissions accounting.
By combining provincial-level disaggregation with a dynamic STIRPAT specification, this study contributes to literature in three important ways. First, it provides the first dynamic, province-level analysis of public transport emissions in South Africa. Second, it extends the STIRPAT framework to explicitly incorporate infrastructure investment and modal usage in a public transport context. Third, it offers robust empirical evidence on the relative importance of economic, demographic, and structural drivers of emissions, with direct implications for sustainable transport policy.
The remainder of the paper is organised as follows. Section 2 reviews the theoretical and empirical literature on the environmental drivers of transport emissions. Section 3 describes the data and methodology. Section 4 presents empirical results. Section 5 discusses the findings and their policy implications, and Section 6 concludes this study.
2. Literarature Review
2.1. Theoretical Framework
2.1.1. STIRPAT/IPAT Model
This study is grounded in the IPAT identity, which conceptualises environmental impact as a function of population, affluence, and technology. In its original deterministic form, the IPAT framework expresses environmental impact (I) as the multiplicative product of population size (P), affluence (A), and technology (T). While useful for conceptualising broad environmental pressures, the deterministic nature of IPAT limits its applicability for empirical analysis [13,14]. It is expressed as:
To overcome this limitation, the Stochastic Impacts by Regression on Population, Affluence, and Technology (STIRPAT) model reformulates IPAT into a stochastic framework that allows for econometric estimation of elasticities. By expressing the relationship in log-linear form, STIRPAT enables researchers to quantify the responsiveness of environmental impacts to changes in population, income, and technology while accounting for unobserved heterogeneity and statistical noise. This flexibility has made STIRPAT a widely adopted framework in studies of energy use, emissions, and environmental degradation [15].
or in log-linearised form:
In the context of transport emissions, the three STIRPAT components have clear interpretations. Population captures the scale of mobility demand, affluence reflects income-driven transport activity and travel intensity, and technology represents the efficiency and carbon intensity of transport systems, including vehicle technology, fuel type, and modal composition. The elasticity-based structure of STIRPAT is particularly well suited for policy-relevant analysis, as it allows for direct interpretation of how proportional changes in key drivers affect emissions outcomes [16,17].
2.1.2. Model Limitations and Granularity
Despite its strengths, the application of STIRPAT to transport emissions faces important measurement challenges. Transport emissions are often derived from aggregate fuel consumption or sector-level greenhouse gas inventories, which obscure differences across transport modes and regions [18]. Such aggregation can mask substantial variation in emission intensities between road-based and rail-based systems and limit the ability to identify causal mechanisms.
These challenges are especially relevant in developing countries, where public transport systems are heterogeneous and frequently dominated by informal or semi-formal road-based services. In South Africa, public transport includes a mix of buses, minibus taxis, and commuter rail, each with distinct energy profiles and emission characteristics. Applying STIRPAT at the provincial level and incorporating modal usage variables helps address these limitations by improving spatial and sectoral granularity, allowing for a more nuanced assessment of emission drivers [6,7,8,9].
2.1.3. Infrastructure Investment and Structural Drivers
Transport infrastructure investment is a critical structural determinant of mobility patterns and environmental outcomes [19,20]. Investment influences network capacity, modal availability, service quality, and long-term technological trajectories [20,21].
However, infrastructure investment does not automatically lead to emission reductions [22]. When investment is concentrated in road expansion or maintenance without accompanying technological upgrades, it may reinforce carbon-intensive transport patterns [23]. Moreover, the environmental benefits of infrastructure investment often materialise only over long horizons, reflecting planning delays, construction periods, and slow fleet turnover [24]. These features suggest that infrastructure investment may have limited short-run effects on emissions, particularly in dynamic settings where historical patterns exert strong influence.
2.2. Empirical Evidence on Transport Emission Drivers
A substantial empirical literature examines the determinants of transport-related emissions, with studies consistently identifying economic growth and energy use as major drivers. Many STIRPAT-based analyses find positive elasticities for income and population, indicating that increases in economic activity and scale tend to raise emissions, while technological improvements can mitigate but rarely fully offset these effects [25,26,27].
In the transport sector, evidence from both developed and developing countries suggests that rising incomes are associated with increased travel demand, higher vehicle kilometres travelled, and greater energy consumption [28,29]. While public transport has the potential to reduce per capita emissions, its effectiveness depends on fleet technology, occupancy rates, and the relative competitiveness of low-carbon modes [30]. Empirical findings on the role of urbanisation and population density are mixed, reflecting differences in spatial structure, land-use patterns, and transport system design [31].
African studies on transport emissions and decarbonisation remain limited but are gradually expanding. Anochiwa et al. [32] show that urbanisation and ICT adoption increase emissions intensity across African economies. Oladunni et al. [29] identify population growth, GDP per capita, and energy intensity as primary drivers of transport emissions in South Africa, although their national-level design obscures modal and regional heterogeneity. Charamba et al. [33] highlight heavy reliance on petrol and diesel in road-based systems, emphasising the need for modal transition analysis. Gopaul et al. [34] assess the potential of integrated rapid public transport networks in the eThekwini Municipality, showing that such systems could significantly reduce greenhouse gas emissions compared to business-as-usual scenarios. Kwakwa et al. [35] and Ntuli et al. [36], examine fleet efficiency, transport services, and mitigation scenarios, indicating that improvements in vehicle technology and modal shifts are critical for reducing emissions. Nevertheless, even when public transport interventions are implemented, their impact is often limited due to the continued dominance of older fossil fuel fleets. Collectively, these findings demonstrate the need for granular, regionally disaggregated analyses that consider both infrastructure investment and modal transitions, which is the focus of the present study.
2.3. Research Gap and Study Contribution
Three key gaps emerge from existing literature. First, there is a lack of subnational analyses that capture regional heterogeneity in transport emissions, particularly in developing countries [29,36]. Second, many studies rely on static models that do not account for emission persistence or feedback effects, despite strong theoretical reasons to expect path dependence in transport systems. Third, limited attention has been given to public transport emissions specifically, even though public transport plays a central role in sustainable mobility strategies.
In addition, many STIRPAT-based studies incorporate economy-wide structural variables, such as industrial structure or national energy composition, which are less directly linked to public passenger transport activity at the subnational level. As a result, existing evidence often conflates public transport emissions with broader economic and energy-system dynamics, limiting the ability to draw sector-specific policy insights.
This study addresses these gaps by applying an extended STIRPAT framework within a dynamic panel setting to provincial public transport emissions in South Africa. The analysis focuses explicitly on transport-relevant proxies for the population, affluence, and technology components of STIRPAT, rather than on economy-wide structural indicators. By incorporating infrastructure investment and modal usage variables and employing a Bias-Corrected Method of Moments estimator suitable for short panels, the analysis provides robust evidence on the relative importance of economic, demographic, and structural drivers.
Rather than estimating heterogeneous factor effects across provinces, the study controls for regional heterogeneity through province fixed effects and focuses on identifying common dynamic elasticities that characterise public transport emissions dynamics. In doing so, the study contributes new insights into the challenges of decoupling economic growth from transport emissions and informs policy debates on sustainable public transport development in South Africa and similar contexts.
3. Methodology
3.1. Study Area, Period, and Data Sources
This study employs an annual provincial panel dataset covering South Africa’s nine provinces, Eastern Cape, Free State, Gauteng, KwaZulu-Natal, Limpopo, Mpumalanga, North West, Northern Cape, and Western Cape over the period 2015 to 2022. The chosen period reflects the availability of consistent and comparable data across all variables of interest, yielding a balanced panel of 72 province-year observations.
Data was compiled from multiple publicly and commercially available sources. Population, GDP per capita, and urbanisation measures were obtained from Statistics South Africa. Fuel consumption data were sourced from the Department of Mineral Resources and Energy. Provincial public transport usage variables were drawn from the South African Regional Explorer while transport infrastructure investment data were obtained from National Treasury budget and expenditure reports. All data sources were cross-checked to ensure consistency in definitions, units, and provincial coverage.
3.2. Variable Construction
The dependent variable is public transport emissions, measured as greenhouse gas emissions attributable to public transport activity within each province and year. Emissions are expressed in CO2-equivalent units and transformed using the natural logarithm to stabilise variance and facilitate elasticity interpretation.
The explanatory variables reflect the extended STIRPAT framework:
- Population (POP) captures the scale of mobility demand within each province.
- GDP per capita (GDP) represents economic affluence and income-driven transport activity.
- Urbanisation (URB) proxied by population density, reflects spatial concentration and internal migration patterns.
- Fuel consumption (FC) measures energy use associated with public transport operations.
- Transport infrastructure investment (TII) captures public expenditure allocated to transport infrastructure development.
- Road public transport usage (ROPT) reflects passenger activity on buses and minibus taxis.
- Rail public transport usage (RAPT)captures commuter rail passenger volumes.
All explanatory variables are transformed into natural logarithms. This transformation reduces skewness, mitigates heteroskedasticity, and allows estimated coefficients to be interpreted as elasticities, consistent with the STIRPAT framework.
3.3. Model Specification
The empirical analysis builds on an extended STIRPAT model estimated in a dynamic panel setting. The baseline static specification can be expressed as:
where Eit denotes public transport emissions in province at time μi captures unobserved province-specific effects, and εit is the idiosyncratic error term.
To account for emission persistence and potential feedback effects, the analysis extends this specification by including a lagged dependent variable
where ln(Eit−1) measures emissions persistence, Xit represents the vector of STIRPAT variables, δt denotes year fixed effects that control for common shocks such as national policy changes, fuel price fluctuations, and the COVID-19 pandemic.
ln(Eit) = α + γ ln(Eit−1) + βXit + μi + δt + εit
3.4. Estimation Strategy
Estimating dynamic panel models with fixed effects and lagged dependent variables introduces bias in conventional estimators, particularly in panels with a short time dimension. In this study, potential endogeneity arises from several sources:
- (i)
- Dynamic feedback, where past emissions influence current transport infrastructure and operational decisions;
- (ii)
- Simultaneity, as economic activity both affects and is affected by transport performance; and;
- (iii)
- Omitted variables, such as unobserved provincial policy differences or regulatory capacity.
To address these issues, the primary estimation approach is the Bias-Corrected Method of Moments (BCMM) estimator, which is well suited for short dynamic panels with fixed effects and a limited number of cross-sectional units. BCMM corrects the small-sample bias associated with the lagged dependent variable without relying on large instrument sets, making it particularly appropriate for the present dataset with nine provinces observed over eight years.
Importantly, the estimation strategy is designed to identify average dynamic relationships between public transport emissions and their key determinants across provinces, rather than province-specific elasticities. Province fixed effects are included to control for time-invariant regional heterogeneity in emission levels, such as differences in baseline infrastructure, fleet composition, and urban structure. The coefficients on the explanatory variables therefore represent common dynamic elasticities, conditional on unobserved provincial heterogeneity.
Allowing the effects of influencing factors to vary by province (for example, through interaction terms or random slopes) would substantially increase model complexity and degrees of freedom. Given the short time dimension (T = 8) and small number of provinces (N = 9), such an approach would risk over-parameterization and unstable estimates. For this reason, the present study focuses on heterogeneity in emission levels rather than heterogeneity in factor effects, which is consistent with the primary objective of analysing the dynamics and determinants of provincial public transport emissions.
With respect to variable selection, the estimation strategy deliberately prioritises transport-specific proxies for the STIRPAT components of population, affluence, and technology. Economy-wide indicators such as industrial structure or national energy composition are excluded because they do not vary meaningfully at the provincial level in a way that can be consistently linked to public passenger transport emissions during the study period. This scope-driven choice avoids conflating public transport emissions with broader structural characteristics that are not directly relevant to sector-specific dynamics.
For robustness, the analysis also estimates pooled ordinary least squares and fixed-effects models. These static specifications serve as benchmarks to illustrate the importance of accounting for dynamics and unobserved heterogeneity. Heterogeneous factor effects across provinces represent an important extension and are explicitly noted as a direction for future research in Section 6.
3.5. Diagnostic Tests and Robustness Checks
Prior to estimation, panel unit root tests were conducted to assess stationarity. Fisher-type Augmented Dickey–Fuller and Phillips–Perron tests, along with the Hadri test. Model selection between fixed and random effects was assessed using a robust Hausman test, which strongly favoured the fixed-effects specification. Post-estimation diagnostics include tests for heteroskedasticity and serial correlation. Groupwise heteroskedasticity (χ2 (9) = 258.17, p < 0.001) was detected motivating the use of cluster-robust standard errors at the provincial level. Arellano–Bond tests (AR (1): p = 0.076; AR (2): p = 0.391), indicate no evidence of second-order autocorrelation, supporting the validity of the dynamic specification.
4. Results
4.1. Panel Stationarity and Model Adequacy
Prior to estimation, panel unit root tests were conducted to assess the time-series properties of the variables. Fisher-type Augmented Dickey–Fuller and Phillips–Perron tests, together with the Hadri stationarity test, were applied to the log-transformed series.
Table 1 above shows panel unit root results after log transformation. Before estimation, the panel series were tested for stationarity using the Fisher-type Augmented Dickey–Fuller (ADF), Phillips–Perron (PP), and Hadri test. Results indicated that most series were stationary at level I (0). Specifically, the variables Emissions (E), Population (POP), GDP per capita (GDP), Fuel Consumption (FC), Transport Infrastructure Investment (TII), and Rail Public Transport (RAPT) were stationary under Fisher-type tests, while Urbanisation (URB) showed consistent stationarity across all tests (p < 0.01). These findings confirm that the data satisfy the preconditions for consistent estimation in a dynamic panel setting. Consequently, all variables were retained in level form within the BCMM estimation framework.
Table 1.
Unit root results after log transformation.
Model selection tests further supported the use of a fixed-effects framework. A robust Hausman test rejected the null hypothesis (χ2(6) = 20.97, p = 0.0019) that random effects are appropriate, indicating the presence of unobserved provincial heterogeneity correlated with the explanatory variables. This finding justifies the inclusion of province fixed effects in all model specifications.
4.2. Baseline Dynamic STIRPAT Results
Table 2 presents the results from the Bias-Corrected Method of Moments (BCMM) estimator, which serves as the preferred specification. The model includes province fixed effects and year fixed effects to control for unobserved heterogeneity and common time shocks.
Table 2.
Bias-Corrected Method of Moments (BCMM) estimates—Dependent Variable: ln (Emissions).
The results show strong persistence in public transport emissions. The lagged dependent variable, ln(Et−1), is positive and statistically significant (0.482, p < 0.01; 95% CI: [0.299, 0.665]), indicating that emissions in one period strongly influence emissions in the next. This confirms that South Africa’s transport emissions are path-dependent, and short-term interventions alone are unlikely to achieve significant reductions. Among the explanatory variables, GDP per capita (ln (GDP)) is the only one that is consistently positive and statistically significant (0.571, p < 0.01; 95% CI: [0.333, 0.809]). This means that a 1% increase in provincial income per capita raises public transport emissions by about 0.57%, showing the strong link between economic activity and transport demand. This result aligns with previous STIRPAT studies [29,35] and South African research [37], where income growth drives emissions even in public transport systems. All other variables, population (ln(POP)), urbanisation (ln(URB)), fuel consumption (ln(FC)), transport infrastructure investment (ln(TII)), and modal usage (ln(ROPT) and ln(RAPT)) are not statistically significant. Their confidence intervals include zero, suggesting that short-term changes in demographics, infrastructure, or modal composition have limited independent effects on emissions in the dynamic model.
There are several reasons for this. First, including the lagged dependent variable may suppress short-term effects. Second, the impact of infrastructure investments and modal changes may take longer to appear, especially when low-carbon technologies are not yet widely adopted. Third, multicollinearity or measurement limitations may reduce significance. Finally, structural and technological factors often dominate demographic factors in African transport emissions [32,38,39]. The negative coefficient for transport infrastructure investment (−0.042, p = 0.412) suggests that recent spending has not yet reduced emissions. This could be due to delayed effects, misalignment with low-carbon technologies, or the continued reliance on fossil-fuel fleets [35,36,40]. Similarly, the insignificant coefficients for modal usage show that short-term changes in road or rail transport modes do not significantly affect emissions once dynamics and provincial differences are accounted for [41,42].
Overall, the results highlight that emissions are strongly influenced by past levels and economic growth, while other factors may need longer-term interventions or province-specific strategies to matter. They also suggest the importance of considering regional heterogeneity, as the effects of population, infrastructure, and modal shifts likely vary across provinces depending on existing networks and fleet size.
4.3. Comparison with Static Models
To assess the sensitivity of the results to alternative estimation strategies, pooled ordinary least squares and fixed-effects models were estimated as benchmarks (Table 3).
Table 3.
Pooled OLS, Fixed Effects and Fixed Effects with Clustered Standard Errors.
Robustness was assessed using three alternative specifications: Pooled OLS (Model 1), Fixed Effects (FE, Model 2), and Fixed Effects with Clustered Standard Errors (Model 3). Model 1 illustrates the potential implications of ignoring unobserved heterogeneity, while Model 2 captures time-invariant characteristics of each province, addressing omitted-variable bias. Model 3 retains the FE specification but clusters standard errors to account for within-province correlation. These models provide benchmarks for the bias-corrected method of moments (BCMM) dynamic estimates. Sensitivity checks using alternative year ranges and excluding pandemic years produced largely unchanged coefficient signs and magnitudes.
Across all specifications, GDP per capita consistently emerges as the only strong positive predictor of public transport emissions. In the FE model, the coefficient (18.24) supports the BCMM results, confirming that economic growth is the primary driver of emissions. While the magnitude differs from the BCMM elasticity due to structural differences between dynamic and static models, the direction and statistical significance remain stable. This pattern is consistent with upward bias in static models that fail to account for emission persistence, reinforcing the central role of affluence as identified in prior STIRPAT studies.
Several variables that appear significant in the Pooled OLS model including population, urbanisation, and fuel consumption become insignificant in the Fixed Effects specifications. Similarly, transport infrastructure investment and road and rail public transport usage also lose significance, with coefficients showing inconsistent signs and limited statistical significance across static models. This indicates that their effects are weak once unobserved heterogeneity is controlled. Year dummies behave as expected, capturing sectoral shocks in 2018 and the uneven recovery from 2020 to 2022, but they do not substantially alter the primary coefficient patterns. Overall, the comparison confirms that the dynamic BCMM estimator provides more conservative and reliable estimates of the underlying emission elasticities, while static models may overstate the effects of GDP and other variables.
4.4. Provincial Emission Patterns
Descriptive analysis reveals substantial variation in public transport emissions across provinces. Gauteng, KwaZulu-Natal, and Western Cape consistently exhibit higher emission levels, reflecting their larger economic base, higher population densities, and more extensive public transport networks. Smaller and more rural provinces display lower emission levels but follow similar temporal trends. Despite these differences in levels, the dynamic results indicate that relative emission rankings across provinces remain largely stable over time. This stability is consistent with the strong persistence captured by the lagged dependent variable and suggests limited structural change in provincial public transport systems during the study period (Table 4).
Table 4.
Descriptive Statistics.
Emissions are moderately right-skewed (mean = 13.49), indicating that a few provinces experience relatively high emissions while most incur lower levels. This pattern aligns with previous studies highlighting the unequal transport emissions in South Africa [29,43,44]. Population, GDP per capita, urbanisation, fuel consumption, transport infrastructure investment, and road and rail public transport usage show substantial variation across provinces, reflecting underlying environmental, economic, and spatial heterogeneity. These findings underscore significant spatial disparities in transport emissions and mobility outcomes, consistent with prior studies linking income inequality and access to mobility opportunities in South Africa.
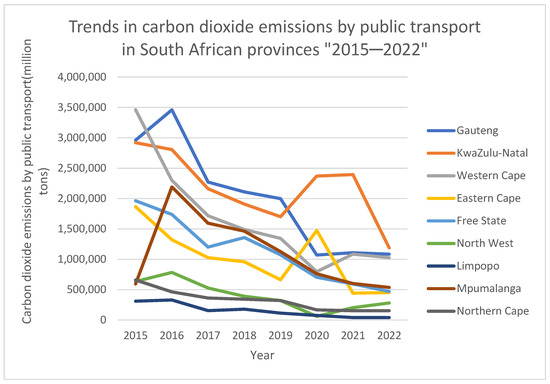
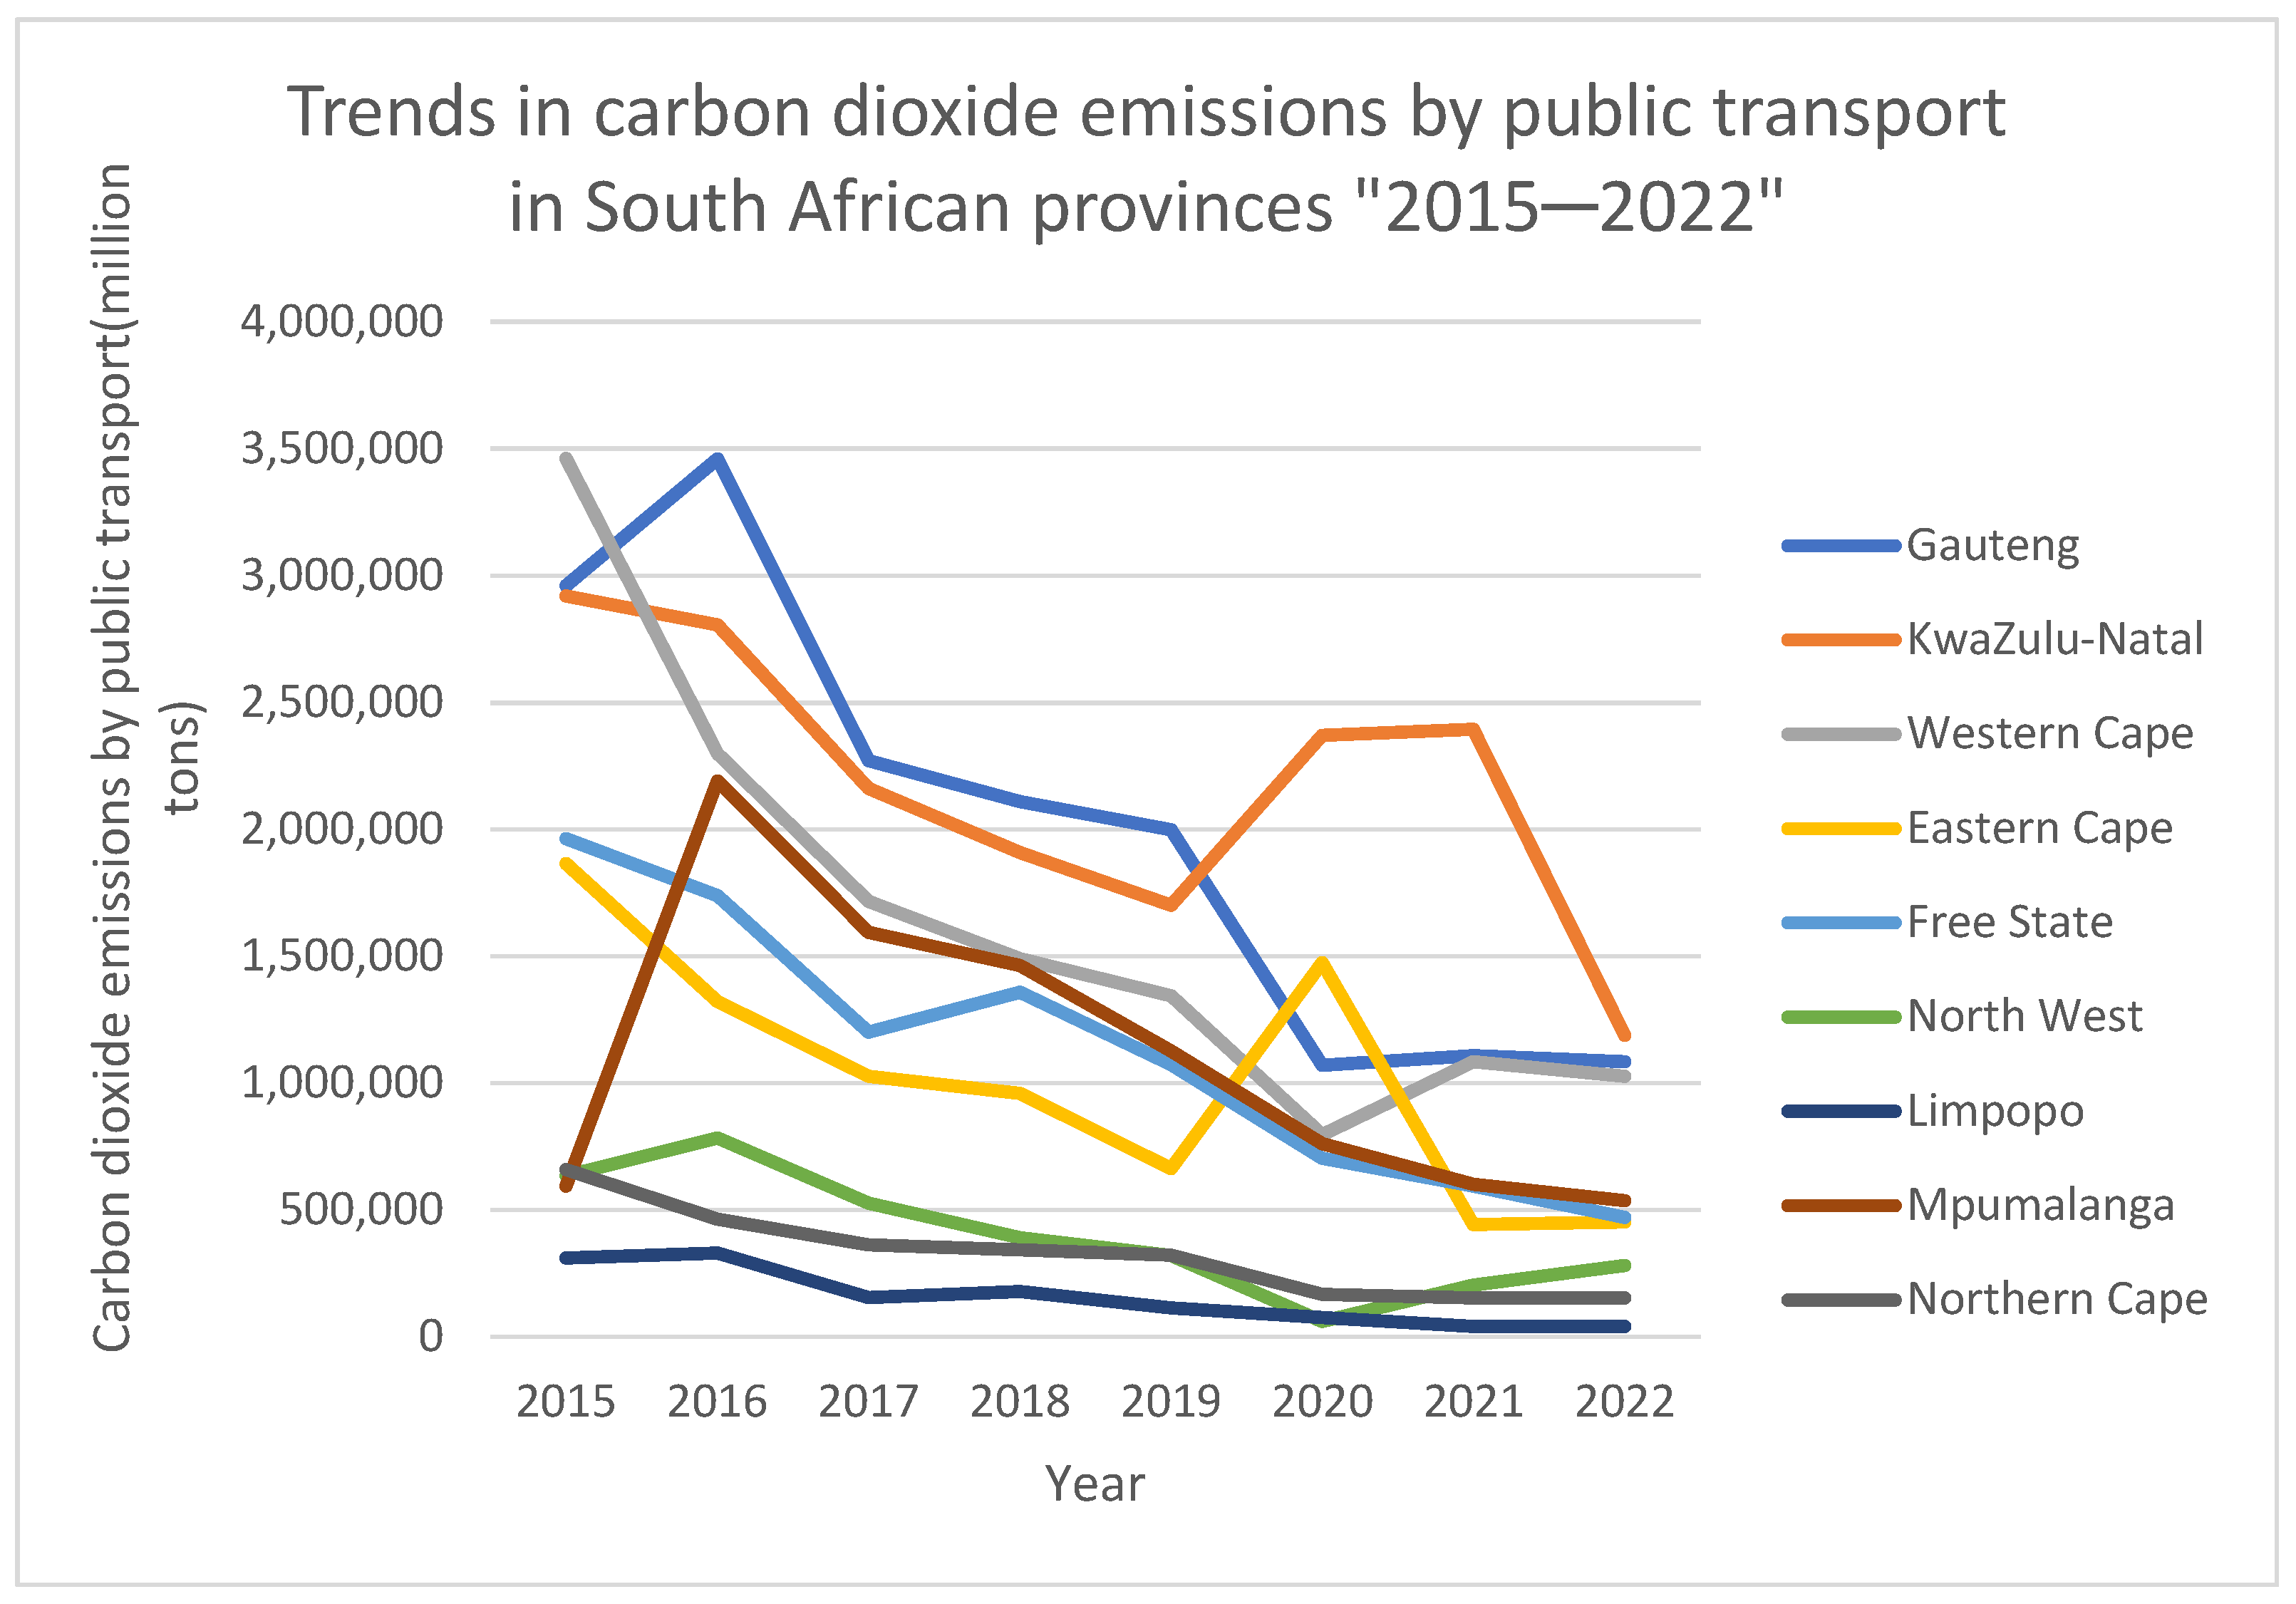
Over the period 2015 to 2019, public transport emissions generally showed a modest upward trend, followed by a decline during the pandemic years of 2020–2021, likely due to COVID-19 lockdowns. These fluctuations suggest inconsistent policy effects or changing transport demand patterns, hinting at weaker control measures or temporary shifts toward higher-emission transport modes. In Gauteng, South Africa’s economic hub, emissions show a gradual decline that has flattened in recent years, highlighting ongoing challenges such as ageing vehicle fleets and slow adoption of low-emission technologies despite high demand. KwaZulu-Natal exhibits stable emissions with slight increases toward 2021, reflecting limited success in reducing emissions even as transport needs grew.
Limpopo, in contrast, shows a steady downward trend, possibly reflecting local interventions or naturally lower baseline emissions due to less urbanised transport networks. Mpumalanga experienced a sharp spike in emissions around 2015–2016, likely associated with increased public transport activity or older vehicles, followed by a gradual decline, suggesting delayed but effective mitigation efforts. North West displays significant fluctuations, including a pandemic-related drop in 2020, followed by a rebound, indicating unstable emission reductions. Northern Cape shows a steady decline that plateaus toward the end of the period, indicating early success that later stagnated. The Western Cape generally exhibits a decreasing trend, interrupted by increases around 2019–2020, highlighting the fragility of emission reductions and vulnerability to changes in ridership or fuel sources.
Overall, the emissions data reveal an uneven picture. Many provinces experience periods of rising emissions followed by stretches of little or no change, which hinders sustained progress and reflects differences between provinces in how policies are implemented, technologies are adopted, and transport demand is managed. Pandemic-related drops in 2020 appear temporary and should not be interpreted as lasting improvements. The persistence of emissions growth post-2022 suggests that structural factors, particularly affluence, drive long-term emission dynamics. These spatial patterns mirror South Africa’s economic geography, with Gauteng, KwaZulu-Natal, and Western Cape representing the largest industrial and commercial hubs. Despite national initiatives such as the Green Transport Strategy [11] emissions in these provinces remain persistently high, highlighting the concentration of transport energy demand in economically vibrant regions (Figure 1).
Figure 1.
Trendline showing provincial public transport emissions. Source: Authors’ computation using Microsoft Excel (2025).
4.5. Summary of Key Findings
The results can be summarised as follows. First, public transport emissions in South Africa show strong persistence, highlighting substantial structural inertia in provincial transport systems and indicating that short-term interventions alone are unlikely to produce lasting reductions. Second, economic affluence measured by GDP per capita emerges as the dominant driver of emissions underscoring the strong link between economic growth and mobility demand even within public transport systems. Third, demographic factors, transport infrastructure investment, fuel consumption, and modal usage show limited short-run effects once dynamic relationships and unobserved heterogeneity are considered, suggesting that these variables may influence emissions only over longer periods or under specific regional conditions. Collectively, these findings provide a robust empirical basis for the discussion and policy recommendations presented in the following section, emphasising the need for targeted, province-specific strategies to manage emissions effectively.
5. Discussion
This study provides new evidence on the environmental drivers of public transport emissions across South Africa’s provinces using a dynamic STIRPAT framework. The results highlight two central features of provincial emission dynamics: strong structural persistence and the dominant role of economic affluence. Taken together, these findings suggest that public transport emissions in South Africa are shaped more by long-standing structural and economic conditions than by short-term changes in transport usage, infrastructure spending, or demographic factors.
5.1. Persistence and Structural Inertia in Public Transport Emissions
The positive and statistically significant coefficient on the lagged dependent variable indicates substantial path dependence on public transport emissions. This result implies that past emission levels strongly influence current outcomes, reflecting slow adjustment processes within transport systems [45]. In practice, such persistence is consistent with long vehicle lifetimes, delayed infrastructure renewal, and entrenched patterns of public transport provision [46].
In the South African context, structural inertia is reinforced by the continued dominance of diesel-powered buses and minibus taxis, limited fleet modernisation, and uneven investment in rail and bus rapid transit systems across provinces [11,36]. The stability of relative emission rankings observed in Section 4 further supports the conclusion that provincial transport systems have undergone limited structural transformation during the study period. These findings underscore the need for targeted, long-term policy interventions aimed at accelerating fleet renewal and promoting low-emission transport technologies.
5.2. Economic Affluence as the Primary Emissions Driver
GDP per capita emerges as the only explanatory variable that is consistently positive and statistically significant in the dynamic model. This finding indicates that economic growth remains tightly coupled with increased public transport emissions [47]. Rising incomes are associated with higher mobility demand, expanded service provision, and greater vehicle kilometres travelled, particularly within road-based public transport systems [48]. The magnitude of the estimated elasticity suggests that South Africa has not yet achieved meaningful decoupling between economic expansion and transport-related emissions [49]. This outcome aligns with evidence from other developing and middle-income economies, where growth-induced increases in transport activity often outweigh efficiency gains [28]. Without substantial technological change or modal restructuring, economic growth is therefore likely to continue reinforcing carbon-intensive transport patterns.
5.3. Limited Short-Run Effects of Demographic and Spatial Factors
Population size and urbanisation are statistically insignificant once dynamic effects and fixed effects are incorporated into the model. While demographic growth and spatial concentration are often associated with increased transport emissions in cross-sectional studies, their effects in the South African provincial context appear to be largely absorbed by economic activity [50]. One possible explanation is that population growth and urbanisation do not automatically translate into cleaner or more efficient public transport systems [51]. In many provinces, increased density has been accompanied by greater reliance on informal and road-based transport rather than a shift toward high-capacity, low-emission modes. As a result, demographic and spatial changes may influence emissions indirectly through income growth and structural factors, rather than exerting independent short-run effects [52].
5.4. Infrastructure Investment and Modal Usage
Transport infrastructure investment and modal usage variables (road and rail) do not exhibit statistically significant effects on emissions in the dynamic specification. This result does not imply that infrastructure investment is unimportant; rather, it suggests that current investment patterns and usage levels are insufficient to alter emission trajectories in the short run [53].
Several factors may account for this outcome. Infrastructure investments often involve long gestation periods, with emission impacts materialising only after construction, operationalisation, and fleet adjustments [53]. In addition, a substantial share of transport investment in South Africa remains directed toward road maintenance and expansion, which may reinforce existing carbon-intensive modes [20]. At the same time, declining rail service quality and limited network coverage constrain the potential for rail to substitute for road-based transport on scale [54].
5.5. Technological and Modal Lock-In
Taken together, the results point to a broader pattern of technological and modal lock-in within South Africa’s public transport system. The continued dominance of diesel-powered vehicles, limited electrification, and fragmented governance structures restrict the scope for short-run emission reductions [55]. In this context, infrastructure spending and marginal changes in usage patterns are unlikely to offset the strong influence of economic growth and historical structure. This lock-in highlights the importance of viewing transport decarbonisation as a long-term structural challenge rather than a series of incremental adjustments [45]. Without coordinated investments in low-carbon technologies, fleet renewal, and integrated transport planning, emission reductions are likely to remain modest.
5.6. Implications for Sustainable Transport Policy
The findings have several important implications for sustainable transport policy in South Africa. Strategies aimed at reducing public transport emissions must explicitly consider the link between economic growth and emissions, rather than if expanding public transport will automatically deliver environmental benefits [47,49]. Infrastructure investment should be directed toward low-carbon technologies and high-capacity systems that can clearly reduce emissions [20,30]. Policy interventions also need to consider the strong persistence in emissions, highlighting the importance of long-term commitments rather than short-term targets [33].
These findings are directly relevant to the implementation of SDG 11 (Sustainable Cities and Communities) and SDG 13 (Climate Action) [50,52]. By identifying the economic and structural roots of transport emissions, the results show the value of integrated policy frameworks that balance urban mobility, environmental sustainability, and inclusive growth [48,55]. Achieving these goals requires coupling economic expansion with technological innovation, ensuring equitable access to public transport, and long-term planning that goes beyond short-term budget cycles [21,42]. Reducing emissions in South Africa’s public transport sector will depend not only on cleaner technologies but also on sustained institutional commitment and coordination across sectors [44,45].
Taken together, these points emphasise the need for integrated transport planning that aligns economic development objectives with environmental sustainability [52,53]. The results of this study provide a solid foundation for the concluding section, which synthesises the main findings and highlights directions for future research. The findings carry several important implications for sustainable transport policy in South Africa. First, strategies aimed at reducing public transport emissions must explicitly address the link between economic growth and emissions, rather than assuming automatic environmental benefits from public transport expansion. Second, infrastructure investment should be reoriented toward low-carbon technologies and high-capacity systems with clear emission-reduction potential. Third, policy interventions should account for the strong persistence observed in emissions, emphasising long-term commitments rather than short-term targets.
6. Conclusions
This study examined the drivers of public transport emissions across South Africa’s nine provinces from 2015 to 2022 using an extended STIRPAT framework within a dynamic panel setting. By employing a Bias-Corrected Method of Moments (BCMM) estimator, the analysis accounted for emission persistence, endogeneity, and unobserved provincial heterogeneity. The results demonstrate that provincial public transport emissions are shaped primarily by economic affluence and strong structural persistence, while demographic factors, infrastructure investment, fuel consumption, and modal usage exert limited short-run influence once dynamics are considered.
The findings indicate that economic growth remains closely coupled with public transport emissions in South Africa. Without substantial technological transformation, increases in income and economic activity are likely to continue reinforcing carbon-intensive transport patterns. The strong persistence observed in emissions further suggests that historical infrastructure choices, fleet composition, and service provision continue to constrain the effectiveness of short-term policy interventions.
From a policy perspective, the results highlight the importance of long-term, structural strategies for transport decarbonisation. Efforts to reduce emissions should prioritise the transition to low-carbon public transport technologies, modernisation of vehicle fleets, rehabilitation of rail systems, and improved integration across transport modes. Aligning infrastructure investment with environmental performance objectives is essential if public transport is to play a meaningful role in supporting Sustainable Development Goals 11 and 13.
This study contributes new provincial-level evidence on public transport emissions in South Africa, but several limitations remain.
Future research could extend the present framework by allowing factor effects to vary across provinces and by incorporating more detailed data on fleet composition, fuel types, and policy interventions, as longer time series become available. Such extensions would further enhance understanding of how economic development and transport systems can be decoupled from environmental degradation in developing-country contexts.
Author Contributions
Conceptualization, F.J., S.G., J.G. and J.W.; methodology, F.J. software, F.J.; validation, F.J. and J.W.; formal analysis, F.J. and J.W.; investigation, F.J.; resources, F.J., S.G., J.G. and J.W.; data curation, F.J.; writing—original draft preparation, F.J.; writing—review and editing, F.J. and J.W.; visualisation, F.J.; supervision, S.G., J.G. and J.W.; project administration, F.J.; funding acquisition, S.G., J.G. and J.W. All authors have read and agreed to the published version of the manuscript.
Funding
This research received no external funding.
Institutional Review Board Statement
Not applicable.
Informed Consent Statement
Not applicable.
Data Availability Statement
Secondary data for this study were sourced from Statistics South Africa (Stats SA), Department of Mineral Resources and Energy (DMRE), the South African Regional Explorer and the National Treasury. However, data can be made available upon reasonable request.
Acknowledgments
The authors gratefully acknowledge the guidance and constructive feedback provided by S. Gumede, J. Goebel, and J. Wilson throughout the development of this study. We also thank V. Foye for valuable critical feedback on earlier versions of the manuscript. Further appreciation is extended to the MCom/PhD research cohort led by S. Msomi for insightful comments during the early stages of this research, as well as to the Economic Research Southern Africa (ERSA) workshops held in Gqeberha, Pretoria, and Cape Town, which contributed to improving the quality of the analysis.
Conflicts of Interest
The authors declare no conflicts of interest.
References
- Fuhr, H. Development Thinking and Practice: From Carbon-Led Growth to Low-Carbon Development. In Handbook on Global Governance and Regionalism; Edward Elgar Publishing: Cheltenham, UK, 2022; pp. 365–380. [Google Scholar]
- Climate Leadership Council Emissions Growth in the Developing World|Climate Leadership Council. 2024. Available online: https://clcouncil.org/blog/emissions-growth-in-the-developing-world/ (accessed on 20 September 2025).
- Energy Council South Africa (ESA). Five Energy Takeaways from Minister Godongwana’s Budget Speech. 2025. Available online: https://www.energycouncil.org.za/mzansi/emissions/(ecsa-2025 (accessed on 25 September 2025).
- Küfeoğlu, S. Transportation Sector Emissions. In Net Zero: Decarbonizing the Global Economies; Springer: Cham, Switzerland, 2024; pp. 493–554. [Google Scholar]
- Shammas, M.I. Mitigating CO2 Emissions in African Transport Networks under Various Policies and Scenarios of Paris Agreement Compliance. Int. J. Sustain. Energy 2024, 43, 2393403. [Google Scholar] [CrossRef] [Scilit]
- Bashingi, N.; Adedeji, J.A.; Das, D.K.; Mostafa, M.H. Challenges and Opportunities for Private-to-Public Transportation Modal Shift and Integrated Multimodal Passenger Transportation Systems in Gaborone. Transp. Res. Procedia 2024, 82, 1858–1877. [Google Scholar]
- International Renewable Energy Agency (IRENA); KfW Development Bank; Deutsche Gesellschaft für Internationale Zusam-menarbeit (GIZ). The Renewable Energy Transition in Africa; International Renewable Energy Agency: Abu Dhabi, United Arab Emirates; Frankfurt, Germany; Bonn, Germany, 2021; Available online: https://www.irena.org/-/media/Files/IRENA/Agency/Publication/2021/March/Renewable_Energy_Transition_Africa_2021.pdf (accessed on 11 October 2025).
- Angurini, M.; Venter, C. Coverage versus Frequency: Exploring Service Variability among Informal Public Transport Operators in South Africa. Findings 2025. [Google Scholar] [CrossRef] [Scilit]
- Jing, Q.; Liu, H.; Yu, W.; He, X. The impact of public transportation on carbon emissions—From the perspective of energy consumption. Sustainability 2022, 14, 6248. [Google Scholar] [CrossRef] [Scilit]
- Toledano, J.S.; Monedero, B.D.; Flores-Ureba, S.; de Blas, C.S. The efficiency of urban public transport and its impact on environmental sustainability. Sustain. Technol. Entrep. 2025, 4, 100097. [Google Scholar] [CrossRef] [Scilit]
- Department of Transport. Green Transport Strategy for South Africa: 2018–2050; Department of Transport: Pretoria, South Africa, 2018. Available online: https://www.changing-transport.org/wp-content/uploads/I_K_Green-Transport-Strategy_South-Africa_2018_EN.pdf (accessed on 11 October 2025).
- Harmse, S. An Analysis of the Regulatory Framework Required for Electric Vehicles Towards Climate Change Mitigation Action in South Africa; North-West University: Potchefstroom, South Africa, 2023. Available online: https://repository.nwu.ac.za/bitstreams/b578f0d5-8546-4614-83c3-da63e110c763/download (accessed on 11 October 2025).
- Ehrlich, P.R. Impact of Population Growth on JSTOR. Science 1971, 171, 1212–1217. [Google Scholar] [CrossRef] [Scilit]
- Ehrlich, P.R.; Holdren, J.P. One-Dimensional Economy. Bull. At. Sci. 1972, 28, 16–27. [Google Scholar]
- Dietz, T.; Rosa, E.A. Effects of Population and Affluence on CO2 Emissions. Proc. Natl. Acad. Sci. USA 1997, 94, 175–179. [Google Scholar] [PubMed]
- Mason, K.; Duggan, J.; Howley, E. Forecasting Energy Demand, Wind Generation and Carbon Dioxide Emissions in Ireland Using Evolutionary Neural Networks. Energy 2018, 155, 705–720. [Google Scholar] [CrossRef] [Scilit]
- Wang, F.; Taghvaee, V.M. Impact of Technology and Economic Complexity on Environmental Pollution and Economic Growth in Developing and Developed Countries: Using IPAT and STIRPAT Models. Environ. Sci. Pollut. Res. 2023, 30, 12345–12367. [Google Scholar] [CrossRef] [Scilit] [PubMed]
- York, R.; Rosa, E.A.; Dietz, T. STIRPAT, IPAT and ImPACT: Analytic Tools for Unpacking the Driving Forces of Environmental Impacts. Ecol. Econ. 2003, 46, 351–365. [Google Scholar] [CrossRef] [Scilit]
- Shi, J.; Bai, T.; Zhao, Z.; Tan, H. Driving economic growth through transportation infrastructure: An in-depth spatial econometric analysis. Sustainability 2024, 16, 4283. [Google Scholar] [CrossRef] [Scilit]
- Habiyaremye, A.; Thobela, M.T.; Saba, C.S. Transport infrastructure investments and economic transformation in South Africa: The case of integrated public transport network in the Gauteng Province. Transp. Res. Interdiscip. Perspect. 2025, 34, 101637. [Google Scholar] [CrossRef] [Scilit]
- Wehrle, R.; Gast, J.; Wiens, M.; Schultmann, F. On the influence of infrastructure availability on companies’ decisions toward modal shift and relocation of facilities. Transp. Res. Interdiscip. Perspect. 2023, 19, 100818. [Google Scholar]
- Ai, K.; Yan, X. Can green infrastructure investment reduce urban carbon emissions? Empirical evidence from China. Land 2024, 13, 226. [Google Scholar] [CrossRef] [Scilit]
- Biber-Freudenberger, L.; Bogner, C.; Bareth, G.; Bollig, M.; Dannenberg, P.; Diez, J.R.; Greiner, C.; Mtweve, P.J.; Klagge, B.; Kramm, T.; et al. Impacts of road development in sub-Saharan Africa: A call for holistic perspectives in research and policy. iScience 2025, 28, 111913. [Google Scholar] [CrossRef] [Scilit]
- Meng, J.; Ye, Z.; Wang, Y. Financing and investing in sustainable infrastructure: A review and research agenda. Sustain. Futures 2024, 8, 100312. [Google Scholar]
- Fan, Y.; Liu, L.C.; Wu, G.; Wei, Y.M. Analyzing Impact Factors of CO2 Emissions Using the STIRPAT Model. Environ. Impact Assess. Rev. 2006, 26, 377–395. [Google Scholar] [CrossRef] [Scilit]
- Wang, H.; Zhang, T.; Wang, X. High-Speed Railways Reduce Carbon Emissions: Mediating Effects of Green Innovation and the Resilience of Environmental Investment. Humanit. Soc. Sci. Commun. 2024, 11, 1127. [Google Scholar] [CrossRef] [Scilit]
- Foster, V.; Dim, J.U.; Vollmer, S.; Zhang, F. Understanding the Challenge of Decoupling Transport-Related CO2 Emissions from Economic Growth in Developing Countries. World Dev. Sustain. 2023, 3, 100111. [Google Scholar] [CrossRef] [Scilit]
- Ouni, M.; Mraihi, R. Impact of transport infrastructure on poverty, income inequality, and unemployment in developing countries: An assessment of sustainable development goals. Afr. Transp. Stud. 2025, 3, 100050. [Google Scholar] [CrossRef] [Scilit]
- Oladunni, O.J.; Mpofu, K.; Olanrewaju, O.A. Greenhouse Gas Emissions and Its Driving Forces in the Transport Sector of South Africa. Energy Rep. 2022, 8, 2052–2061. [Google Scholar] [CrossRef] [Scilit]
- Li, J.; Huang, Y.; Zhang, C.; Yao, D. How does public transport development contribute to carbon emission reduction? Transp. Res. Part A Policy Pract. 2025, 191, 104327. [Google Scholar] [CrossRef] [Scilit]
- Gambe, T.R.; Turok, I.; Visagie, J. The trajectories of urbanisation in Southern Africa: A comparative analysis. Habitat Int. 2023, 132, 102747. [Google Scholar] [CrossRef] [Scilit]
- Anochiwa, L.I.; Agbanike, T.F.; Chukwu, A.B.; Ikpe, M.; Otta, N.N. Urbanization and Carbon Emissions: Looking at the Role of Mobile Phone Adoption in Sub-Saharan African Countries. Environ. Sci. Pollut. Res. 2022, 29, 78526–78541. [Google Scholar] [CrossRef] [Scilit]
- Charamba, A.N.; Kumba, H.; Makepa, D.C. Assessing the opportunities and obstacles of Africa’s shift from fossil fuels to renewable sources in the southern region. Clean Energy 2025, 9, 74–93. [Google Scholar] [CrossRef] [Scilit]
- Gopaul, A.; Friedrich, E.; Stretch, D. Public Transportation and Greenhouse Gas Emissions: A Case Study of the eThekwini Municipality, South Africa. Curr. Trends Civ. Struct. Eng. 2019, 3, 1–10. [Google Scholar]
- Kwakwa, P.A.; Alhassan, H.; Adzawla, W. Environmental degradation effect on agricultural development: An aggregate and a sectoral evidence of carbon dioxide emissions from Ghana. J. Bus. Socio-Econ. Dev. 2022, 2, 82–96. [Google Scholar] [CrossRef] [Scilit]
- Ntuli, M.N.; Eloka-Eboka, A.C.; Mwangi, F.M.; Ewim, D.R.E.; Dioha, M.O. Energy sustainability and carbon dioxide emissions mitigation options for South Africa’s road transport sector. Bull. Natl. Res. Cent. 2024, 48, 37. [Google Scholar] [CrossRef] [Scilit]
- National Business Initiative (NBI). Decarbonising South Africa’s Transport Sector. 2023. Available online: https://www.nbi.org.za/wp-content/uploads/2023/08/Decarbonising-South-Africas-Transport-Sector.pdf (accessed on 10 December 2024).
- Olaoye, O.O.; Zerihun, M.F.; Tabash, M.I. Structural Transformation and Sustainable Development in Sub-Saharan Africa. Afr. J. Econ. Manag. Stud. 2025. [Google Scholar] [CrossRef] [Scilit]
- Pinto, H.; Odoi, E.; Nogueira, C.; Viana, L.F.C. Pathways to Progress: Unveiling Structural Change in Africa Through Economic Transformation, Technology, Talent, and Tourism. Economies 2025, 13, 21. [Google Scholar] [CrossRef] [Scilit]
- Alagoz, E.; Alghawi, Y. The future of fossil fuels: Challenges and opportunities in a low-carbon world. Int. J. Earth Sci. Knowl. Appl. 2024, 5, 381–388. [Google Scholar]
- Kölbl, R.; Kozek, M.; Jakubek, S. A framework for modal split and implications on transport growth and travel time savings. Transp. Policy 2024, 158, 196–210. [Google Scholar] [CrossRef] [Scilit]
- Beil, D.; Putz, L.M. Modal shift measures to increase the use of eco-friendly transport modes: A literature review. Transp. Res. Procedia 2023, 72, 4279–4286. [Google Scholar] [CrossRef] [Scilit]
- Pretorius, B.G.; Strauss, J.M.; Booysen, M.J. Uneven transitions and disparate mobility patterns for South Africa’s electric paratransit. Energy Res. Soc. Sci. 2024, 118, 103778. [Google Scholar] [CrossRef] [Scilit]
- Winkler, H.; Black, A. Creating employment and reducing emissions: Options for South Africa. Dev. South. Afr. 2024, 41, 1078–1097. [Google Scholar] [CrossRef] [Scilit]
- Solaymani, S.; Botero, J. Reducing Carbon Emissions from Transport Sector: Experience and Policy Design Considerations. Sustainability 2025, 17, 3762. [Google Scholar] [CrossRef] [Scilit]
- Wall, K. Some implications of the condition of South Africa’s public sector fixed infrastructure. Acta Structilia 2024, 31, 224–256. [Google Scholar] [CrossRef] [Scilit]
- Wu, Y.; Wan, J. The race between global economic growth and carbon emissions: Based on a comparative study of developed and developing countries. Environ. Sci. Pollut. Res. 2024, 31, 19226–19243. [Google Scholar] [CrossRef] [Scilit]
- Qiao, S.; Yeh, A.G.O. Mobility-on-demand public transport toward spatial justice: Shared mobility or Mobility as a Service. Transp. Res. Part D Transp. Environ. 2023, 123, 103916. [Google Scholar] [CrossRef] [Scilit]
- Ochi, A.; Labidi, M.A.; Saidi, Y. The nexus between pro-poor growth, inequality, institutions and poverty: Evidence from low- and middle-income developing countries. Soc. Indic. Res. 2024, 172, 703–739. [Google Scholar] [CrossRef] [Scilit]
- Salvati, L. Regional Development, Spatial Disparities, and Urbanization: A Comparative Approach. In Economic Growth, Regional Disparities, and Urban Sprawl: The Mediterranean Experience; Springer Nature: Cham, Switzerland, 2025; pp. 61–97. [Google Scholar]
- Bhunia, G.S.; Shit, P.K. Urban Morphology and Sustainable Smart Cities: Application of Geospatial Technology; Springer Nature: Cham, Switzerland, 2025. [Google Scholar]
- Pickson, R.B.; Gui, P.; Jian, L.; Boateng, E. Do population-related factors matter for carbon emissions? Lessons from different income groups of countries. Urban Clim. 2024, 55, 101934. [Google Scholar] [CrossRef] [Scilit]
- Mbanda, V.; Bonga-Bonga, L. The impact of public infrastructure investment on South Africa’s economy: Evidence from social accounting matrix and computable general equilibrium-based approaches. Qual. Quant. 2024, 58, 3535–3558. [Google Scholar]
- Bouraima, M.B.; Alimo, P.K.; Agyeman, S.; Sumo, P.D.; Lartey-Young, G.; Ehebrecht, D.; Qiu, Y. Africa’s railway renaissance and sustainability: Current knowledge, challenges, and prospects. J. Transp. Geogr. 2023, 106, 103487. [Google Scholar] [CrossRef] [Scilit]
- Sang, Y.; Zhang, Z.; Liu, S.; Song, C. Decarbonization pathways in the transport sector: A review of integrated assessment models and future directions for model improvement. Renew. Sustain.Energy Rev. 2026, 225, 116204. [Google Scholar] [CrossRef] [Scilit]

Disclaimer/Publisher’s Note: The statements, opinions and data contained in all publications are solely those of the individual author(s) and contributor(s) and not of MDPI and/or the editor(s). MDPI and/or the editor(s) disclaim responsibility for any injury to people or property resulting from any ideas, methods, instructions or products referred to in the content. |
© 2026 by the authors. Licensee MDPI, Basel, Switzerland. This article is an open access article distributed under the terms and conditions of the Creative Commons Attribution (CC BY) license.