


Abstract
Financial resilience has gained increasing attention due to its close relationship with individual wellbeing, financial inclusion, and sustainable development. This study examines how university students perceive and experience financial resilience, focusing on their perceptions, lived experiences, and actions undertaken to cope with adverse financial situations. Using data collected from 256 university students and applying Structural Equation Modeling (SEM), the study adapts a validated financial resilience scale based on financial health indicators proposed by BBVA and the Center for Financial Services Innovation (CFSI). The results support a three-factor structure reflecting actions, perceptions, and lived experiences related to financial resilience, although some indicators were excluded to achieve a parsimonious and theoretically coherent model. The findings provide empirical evidence on financial resilience in a young and potentially vulnerable population and contribute to the conceptual alignment of financial resilience with Sustainable Development Goals SDG 3 (Good Health and Well-being), SDG 4 (Quality Education), and SDG 8 (Decent Work and Economic Growth).
1. Introduction
The concept of resilience, introduced by [1] marked a fundamental shift in the understanding of system stability by proposing a systemic, holistic perspective that integrates social, economic, and ecological dimensions. From this viewpoint, resilience is defined as the capacity of a system to absorb shocks, adapt to changing conditions, and reorganize itself without losing its essential functionality [2,3,4].
In the socioeconomic sphere, resilience has become a key element in explaining the capacity of individuals and institutions to cope with adverse scenarios. Recent events, such as the COVID-19 pandemic, have highlighted the vulnerability of large segments of the population to unexpected economic shocks, significantly affecting education, employment, and overall well-being [5]. In this context, financial resilience (FR) has gained relevance, understood as the capacity of individuals to withstand and recover from economic shocks without compromising their stability and quality of life.
Financial resilience is closely linked to overall well-being and, in turn, to the Sustainable Development Goals (SDGs). In particular, it contributes to SDG 3 (Good Health and Well-being) by reducing financial stress and its negative effects on physical and mental health; to SDG 4 (Quality Education) by strengthening financial literacy as an essential life skill; and to SDG 8 (Decent Work and Economic Growth) by promoting job stability, productivity, and sustainable economic participation [6,7,8].
Recent literature has demonstrated that financial resilience is a multidimensional construct influenced by economic, psychological, and sociodemographic factors. Previous studies indicate that financial and psychological resilience mediate the relationship between income shocks and financial well-being [9], while variables such as education, gender, employment type, and cognitive abilities significantly influence financial adaptability [10,11]. Furthermore, international organizations and governments have begun developing specific indices and metrics to assess financial resilience, recognizing its importance for public policy design [12].
Despite growing academic interest, most studies have focused on households, adult workers, or institutional contexts, while financial resilience among university students has received less attention. This group represents a critical stage in the life cycle, characterized by transitions toward financial independence, early entry into the labor market, and greater exposure to economic vulnerability. Understanding how university students perceive, experience, and manage adverse financial situations is fundamental to designing educational and policy interventions that support sustainable development.
Study Objective and Scope
In this context, the main objective of this study is to analyze financial resilience in university students, based on their perceptions, lived experiences, and actions in the face of adverse financial situations. The study adopts an exploratory and confirmatory approach, focusing on adapting and validating a model to measure financial resilience in a student population. Rather than establishing causal relationships or making population inferences, the research seeks to provide empirical evidence on how financial resilience manifests in a young and potentially vulnerable group, using SDGs 3, 4, and 8 as a conceptual and interpretive framework.
2. Theoretical Framework
2.1. Financial Resilience: General Conceptualization
Financial resilience has been conceptualized as the capacity of individuals and households to cope with, absorb, and recover from adverse financial situations at the global, national, family, and individual levels [13]. This concept recognizes that economic shocks can stem not only from systemic crises but also from everyday events such as job loss, health problems, or family emergencies.
A central element in the analysis of financial resilience is its relationship with financial inclusion. Salignac et al. [14] emphasize that financial inclusion is a necessary, but insufficient, condition for resilience. While access to financial products and services is fundamental, various critics argue that traditional financial inclusion has focused excessively on service provision, neglecting people’s actual capacity to use them effectively in adverse contexts [14]. Hamid et al. [7] propose a comprehensive framework for measuring financial resilience that considers sociodemographic variables, financial education, financial inclusion, and economic resources. This approach highlights the dynamic and multidimensional nature of the construct, in which concrete financial actions (saving, debt management, spending planning) interact with perceptions and prior experiences.
2.2. Determinants and Dimensions of Financial Resilience
Empirical literature identifies multiple dimensions associated with financial resilience. Among the most relevant are savings, debt management, the existence of emergency funds, and financial education [8]. McKnight and Rucci [11] emphasize that financial resilience is a dynamic process through which households recover from crises by drawing on savings, formal loans, or social network support.
Several studies have shown that having a job or access to financial services does not necessarily guarantee high levels of financial resilience. Salignac et al. [14] in a study conducted in Australia, found that a significant number of adults exhibited high financial vulnerability despite adequate management of basic financial products. Similarly, Lusardi et al. [15] document higher levels of financial fragility in specific groups, such as low-income households and ethnic minorities. From a psychological perspective, Tahir et al. [16] demonstrated that financial resilience positively influences life satisfaction, with this effect mediated by financial well-being and moderated by non-impulsive behaviors. These findings reinforce the idea that financial resilience is not only a matter of economic resources but also of behaviors, attitudes, and cognitive abilities.
2.3. Financial Education, Well-Being, and Resilience
Financial education plays a fundamental role in strengthening financial resilience, especially among young people. Bialowolski et al. [17] point out that financial resilience tends to increase in middle life and decrease in old age, highlighting the importance of early interventions. Kass-Hanna et al. [18] emphasize the need to integrate digital literacy into financial education, particularly in emerging economies, to promote resilient financial behaviors related to saving, responsible borrowing, and risk management. In this sense, financial education is positioned as a key mechanism for reducing vulnerability and promoting long-term financial well-being.
2.4. Financial Resilience and Sustainable Development Goals
Financial resilience is closely aligned with the Sustainable Development Goals. Regarding SDG 3, evidence shows that financial stress and economic insecurity negatively affect mental and physical health, creating cycles of vulnerability that are difficult to break [6,19]. With respect to SDG 4, studies have shown the importance of pedagogy that empowers learners to work towards a sustainable future [20]. In this regard, financial education contributes to inclusive and quality education by equipping individuals with essential skills for making informed economic decisions [21]. Finally, SDG 8 is strengthened by financially resilient individuals who can adapt to changing labor markets and contribute to sustainable economic growth [22].
2.5. Theoretical Foundations of the Study
This study is based on three complementary theoretical approaches. First, Resilience Theory provides the conceptual framework for understanding the capacity of individuals and systems to absorb, adapt to, and recover from adverse events without losing their essential [1,2,3,4]. Second, Human Capital Theory emphasizes the role of education and skills in economic decision-making and long-term well-being. From this perspective, financial education constitutes an investment in human capital that strengthens individuals’ ability to manage economic risks and respond effectively to adverse financial situations [23,24,25]. Finally, Behavioral Finance Theory highlights the influence of psychological and emotional factors on financial behavior, particularly under conditions of uncertainty. This theoretical framework explains why financial decisions are not always rational and how cognitive biases, emotions, and non-impulsive behaviors influence financial resilience and financial well-being [26,27,28]. Taken together, these approaches support the conceptualization of financial resilience as a multidimensional construct based on perceptions, experiences, and actions and justify the use of SDGs 3, 4, and 8 as a conceptual and interpretive framework for analysis.
3. Method and Materials
3.1. Research Design
This study adopts a non-experimental, cross-sectional design with a quantitative approach and a hypothetico-deductive logic. The design is descriptive, exploratory, and confirmatory, which is appropriate for analyzing latent constructs, such as financial resilience, and for evaluating the internal structure of a previously developed measurement instrument. Given the exploratory nature of the study of financial resilience in university students, the research does not aim to establish causal relationships or make population inferences. Instead, the objective is to analyze the internal dimensionality of the construct as perceived and experienced by the students, and to examine the psychometric properties of the measurement model in this population.
3.2. Population and Sample
The target population consists of university students enrolled in public and private higher education institutions. The sample was obtained through non-probability self-selection sampling, a strategy commonly used in exploratory and psychometric studies with student populations [29]. A total of 256 valid questionnaires were collected, a sample size that meets the minimum criteria recommended for conducting exploratory factor analysis (EFA) and structural equation modeling (SEM), considering both the item-respondent ratio and the absolute thresholds suggested in the methodological literature. The use of non-probability sampling implies that the results should be interpreted as specific to the study context, without claiming statistical representativeness of the university population as a whole. Consequently, the findings provide analytical and theoretical evidence, rather than empirical generalization.
3.3. Instrument and Measurement of Financial Resilience
Financial resilience was measured using the scale developed by [8], which is based on financial health indicators proposed by BBVA’s Center for Education and Financial Capabilities and aligned with the conceptual framework of the Center for Financial Services Innovation (CFSI). The instrument conceptualizes financial resilience as a multidimensional construct, operationalized through three interrelated domains: Perceptions of financial health indicators, Experiences of adverse financial situations, and Actions taken to cope with financial stress (see Appendix C). Each of these domains incorporates indicators related to saving, debt management, credit history, spending planning, and insurance coverage—dimensions widely recognized in the literature as central components of financial resilience and financial well-being. The scale was administered using a Likert format, allowing participants to express the degree to which each statement reflected their perceptions, experiences, or actions.
3.4. Data Collection Procedure
Data were obtained through a self-administered questionnaire, distributed voluntarily to university students. Participation was anonymous, and participants were informed about the academic nature of the research before completing the instrument. All procedures were carried out in accordance with institutional ethical guidelines. Informed consent was obtained from all participants prior to data collection.
3.5. Reliability and Validity Assessment
To assess the internal consistency and reliability of the instrument, Cronbach’s alpha and McDonald’s omega coefficients were calculated, with values of α > 0.70 and ω > 0.70 considered acceptable according to psychometric standards. The omega coefficient was included as a supplementary indicator because it accounts for factor loadings and measurement error, yielding a more stable estimate of reliability in latent variable models.
Therefore, to validate the reliability and consistency of the scale, Cronbach’s alpha and McDonald’s Omega are utilized, with the criterion of α > 0.7 (acceptable) based on the following equations:
where α = AC; K = No. items; Vi = Variance of e/item and Vt = total variance.
where ω is the omega coefficient symbol; λi is the standardized factorial load of i.
The omega coefficient, unlike the alpha coefficient, uses factorial loadings [30], which are the weighted sum of standardized variables, making calculations more stable [31] and reflecting the true level of reliability. Secondly, it does not depend on the number of items, as indicated by its mathematical expression [32].
Regarding the normality of the data, the criteria for skewness (<2) and kurtosis (<7) are used. For this purpose, the Fisher skewness coefficient is used, and according to the criteria of [33], described in Table 1:
where the greater the sum of ∑(xi − x)3, the greater the skewness will be.
Table 1.
Skewness and kurtosis values criterion.
If the data matrix does not have normality, it is recommended to use polychoric correlation matrices, if the skewness and kurtosis exceed the values suggested by the theory [33,34,35,36,37]. Subsequently, the factorial solution obtained from exploratory factor analysis is confirmed using SEM methodology [38] where the fit of the measurement model, structural fit, and parsimony are validated [39,40,41,42].
To evaluate the data matrix, SPSS AMOS v23 was used. The indices are: χ2 (chi-square), Goodness of Fit Index (GFI), Adjusted Goodness of Fit Index (AGFI), Root Mean Square Error of Approximation (RMSEA), Root Mean Square Residuals (RMR) Tuker Lewis Index (TLI) and the Comparative Fit Index (CFI), through which the estimated model is compared with the null model that indicates the independence between the study variables.
3.6. Methodological Considerations
The use of non-probability, self-selected sampling is consistent with the exploratory nature of the study and with previous research on financial resilience in university populations. While this approach limits statistical generalizability, it is appropriate for examining relational patterns and validating measurement models in emerging research areas. Likewise, the application of SEM prioritizes model parsimony and theoretical coherence, particularly given the sample size, in accordance with established methodological recommendations.
4. Data Analysis
The data matrix is analyzed as follows: first, the scale is validated using Cronbach’s alpha and McDonald’s omega to assess the reliability and internal consistency of the test items. Overall, Cronbach’s alpha is 0.804, and deleting any item increases it to greater than 0.8. In relation to McDonald’s omega coefficient, all items exceed the threshold of 0.8 (see Table 2). Appendix A and Appendix B present tables describing Cronbach’s alpha values and individual omega coefficients for each item.
Table 2.
Reliability and internal consistency of the test, with Cronbach’s alpha and McDonald’s Omega.
Table 3 shows the frequencies of indicators from the sociodemographic profile of the respondents. The highest participation percentage was among women (52.3%; n = 134), followed by men (43.8%; n = 112), with an age range of 18–20 years (46.1%; n = 118), followed by 32.4% (n = 83) aged 21–25 years. Regarding marital status, 85.2% (n = 218) are single. 64.1% (n = 164) are enrolled in public universities, and 35.9% (n = 92) in private universities. Regarding the influence on their financial knowledge, 31.3% (n = 80) reported that their father influenced them, followed by 29.3% (n = 75) who reported that their mother influenced them, and 20.3% (n = 52) reported that no one influenced them. The status indicates that 68.8% (n = 176) are only students, followed by 25% (n = 64) who are only workers. Regarding seniority at work, 66% (n = 169) do not work, and among those who work, 10.5% (n = 27) have been working less than 1 year, 10.9% (n = 28) more than 1 year but less than 3 years, and 3.5% (n = 9) between 3 and 5 years. Among those employed, the highest percentage earns less than $3000.00 USD per month (9.8%, n = 25), whereas for 58.2% (n = 149), the question does not apply because they are not working.
Table 3.
Sociodemographic profile of the respondents.
Table 4 presents the total explained variance, which is composed of five factors accounting for 56.89% of the total variance of the phenomenon under study. Table 5 presents the rotated factor matrix in its hierarchical structure.
Table 4.
Total explained variance.
Table 5.
Rotated component matrix a.
As seen in the rotated factor matrix, the 5-factor structure obtained differs from the three-dimensional model proposed by [8].
SEM Methodology for the Analysis of the 5-Factor Structure
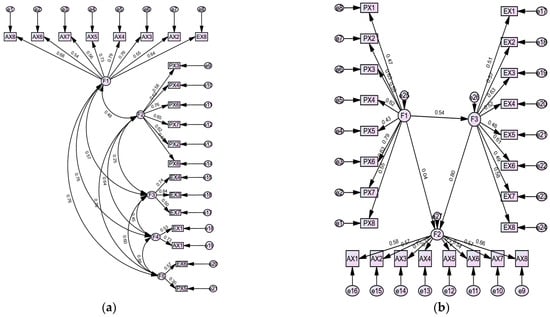
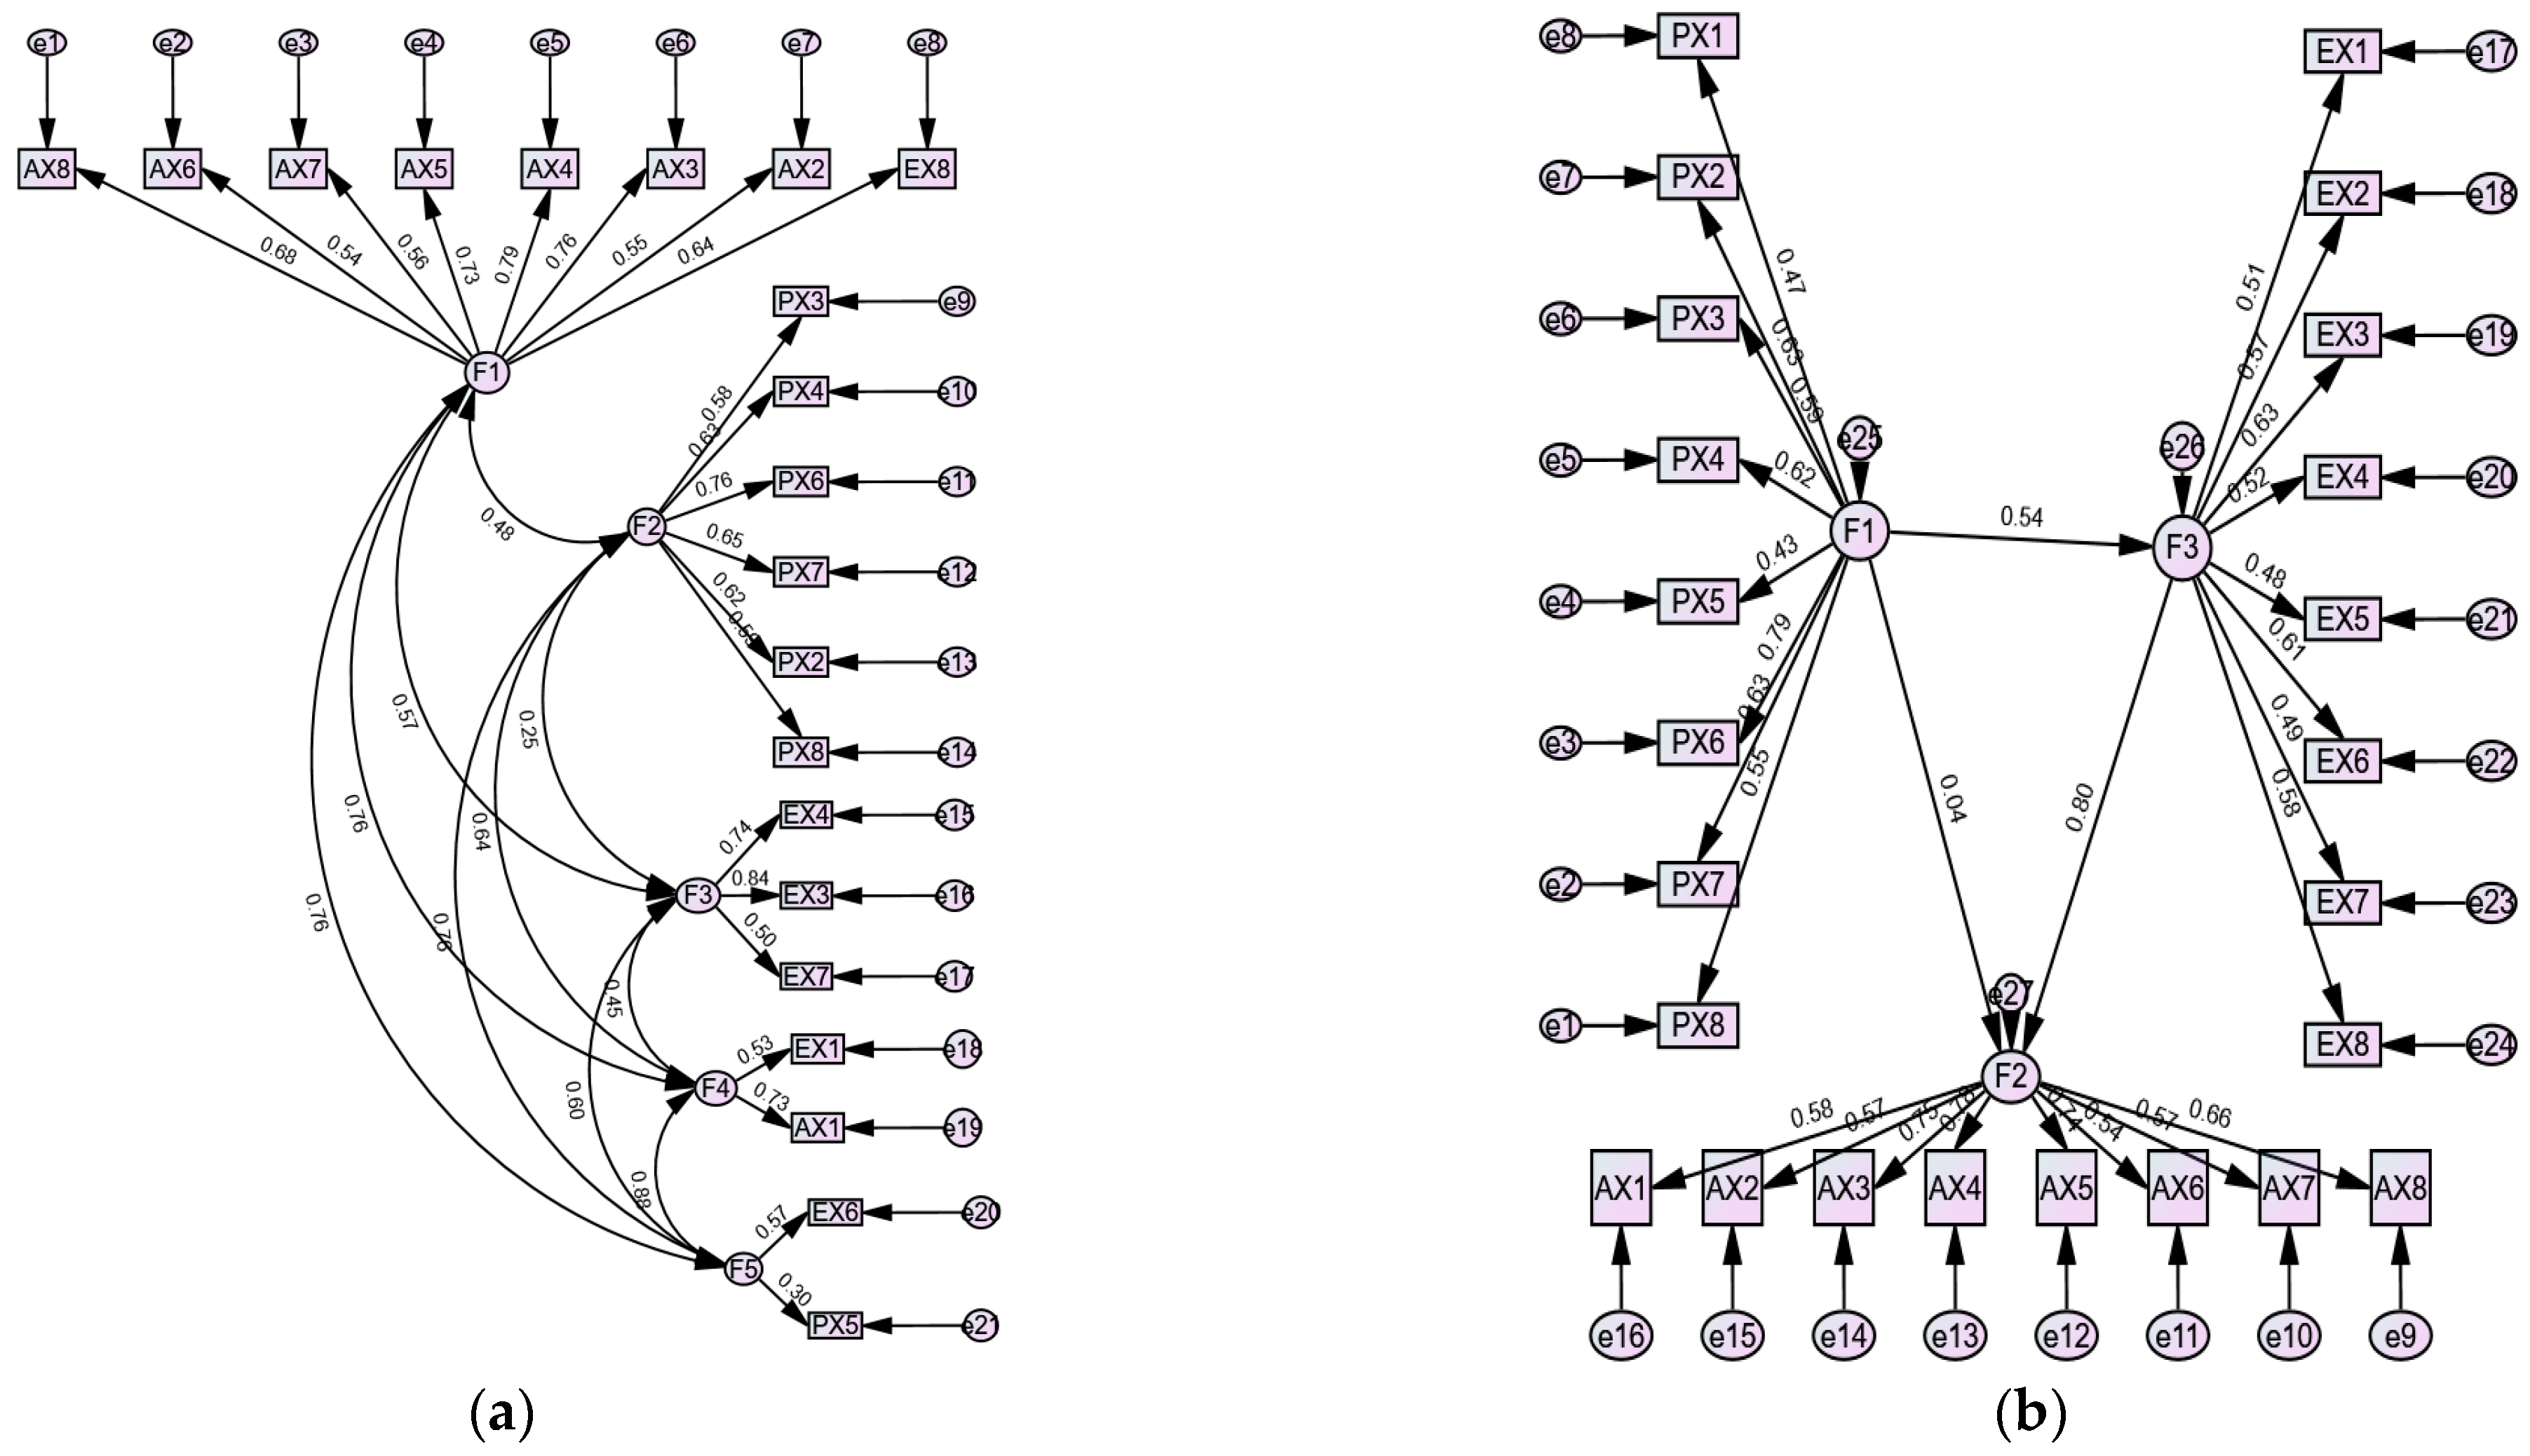
To confirm the factor solution described in Table 5, SEM is employed, and a measurement error model is specified to evaluate the unobserved latent variables incorporated. In addition, the dependency relationships between the obtained factors are verified. Figure 1 shows the initial measurement model. In parallel, a model based on the [8] proposal is presented and compared with the rotated solution (Figure 1b).
Figure 1.
Initial Factorial solution (Flores et al., 2024 [8]). (a) Initial factorial solution from EFA. Chi-square = 420.027; Degrees of freedom = 179; Probability level = 0.000. (b) Applying the tridimensional model, we have the next representation. (Chi-square = 659.114; Degrees of freedom = 249; Probability level = 0.000).
The values obtained from the maximum likelihood ratio show a probability level (0.000), which is less than 0.05, and Chi-square value of 420.027 with 179 degrees of freedom. On the other hand, the three-dimensional model by [8] yields a chi-square statistic of 659.114 with 259 degrees of freedom and a p-value of 0.000, which does not support its confirmation. Regarding the rotated solution with the Varimax criterion, the goodness-of-fit indices, structural fit, and parsimony do not align with theoretical criteria. The exclusion of indicators was guided by both statistical and theoretical criteria, aiming to achieve a parsimonious and interpretable measurement model. Items with low factor loadings were removed to ensure construct reliability and model stability, particularly in the context of SEM applied to a student sample. This procedure does not imply rejection of the underlying construct; rather, it reflects contextual differences in how financial resilience manifests among university students compared with other populations.
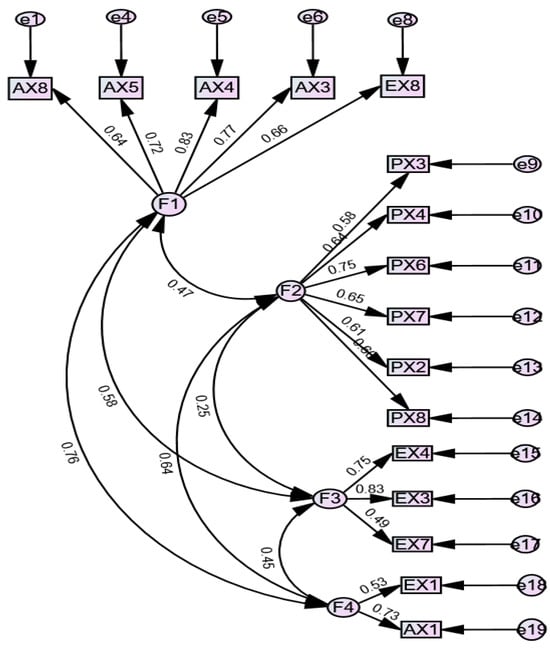
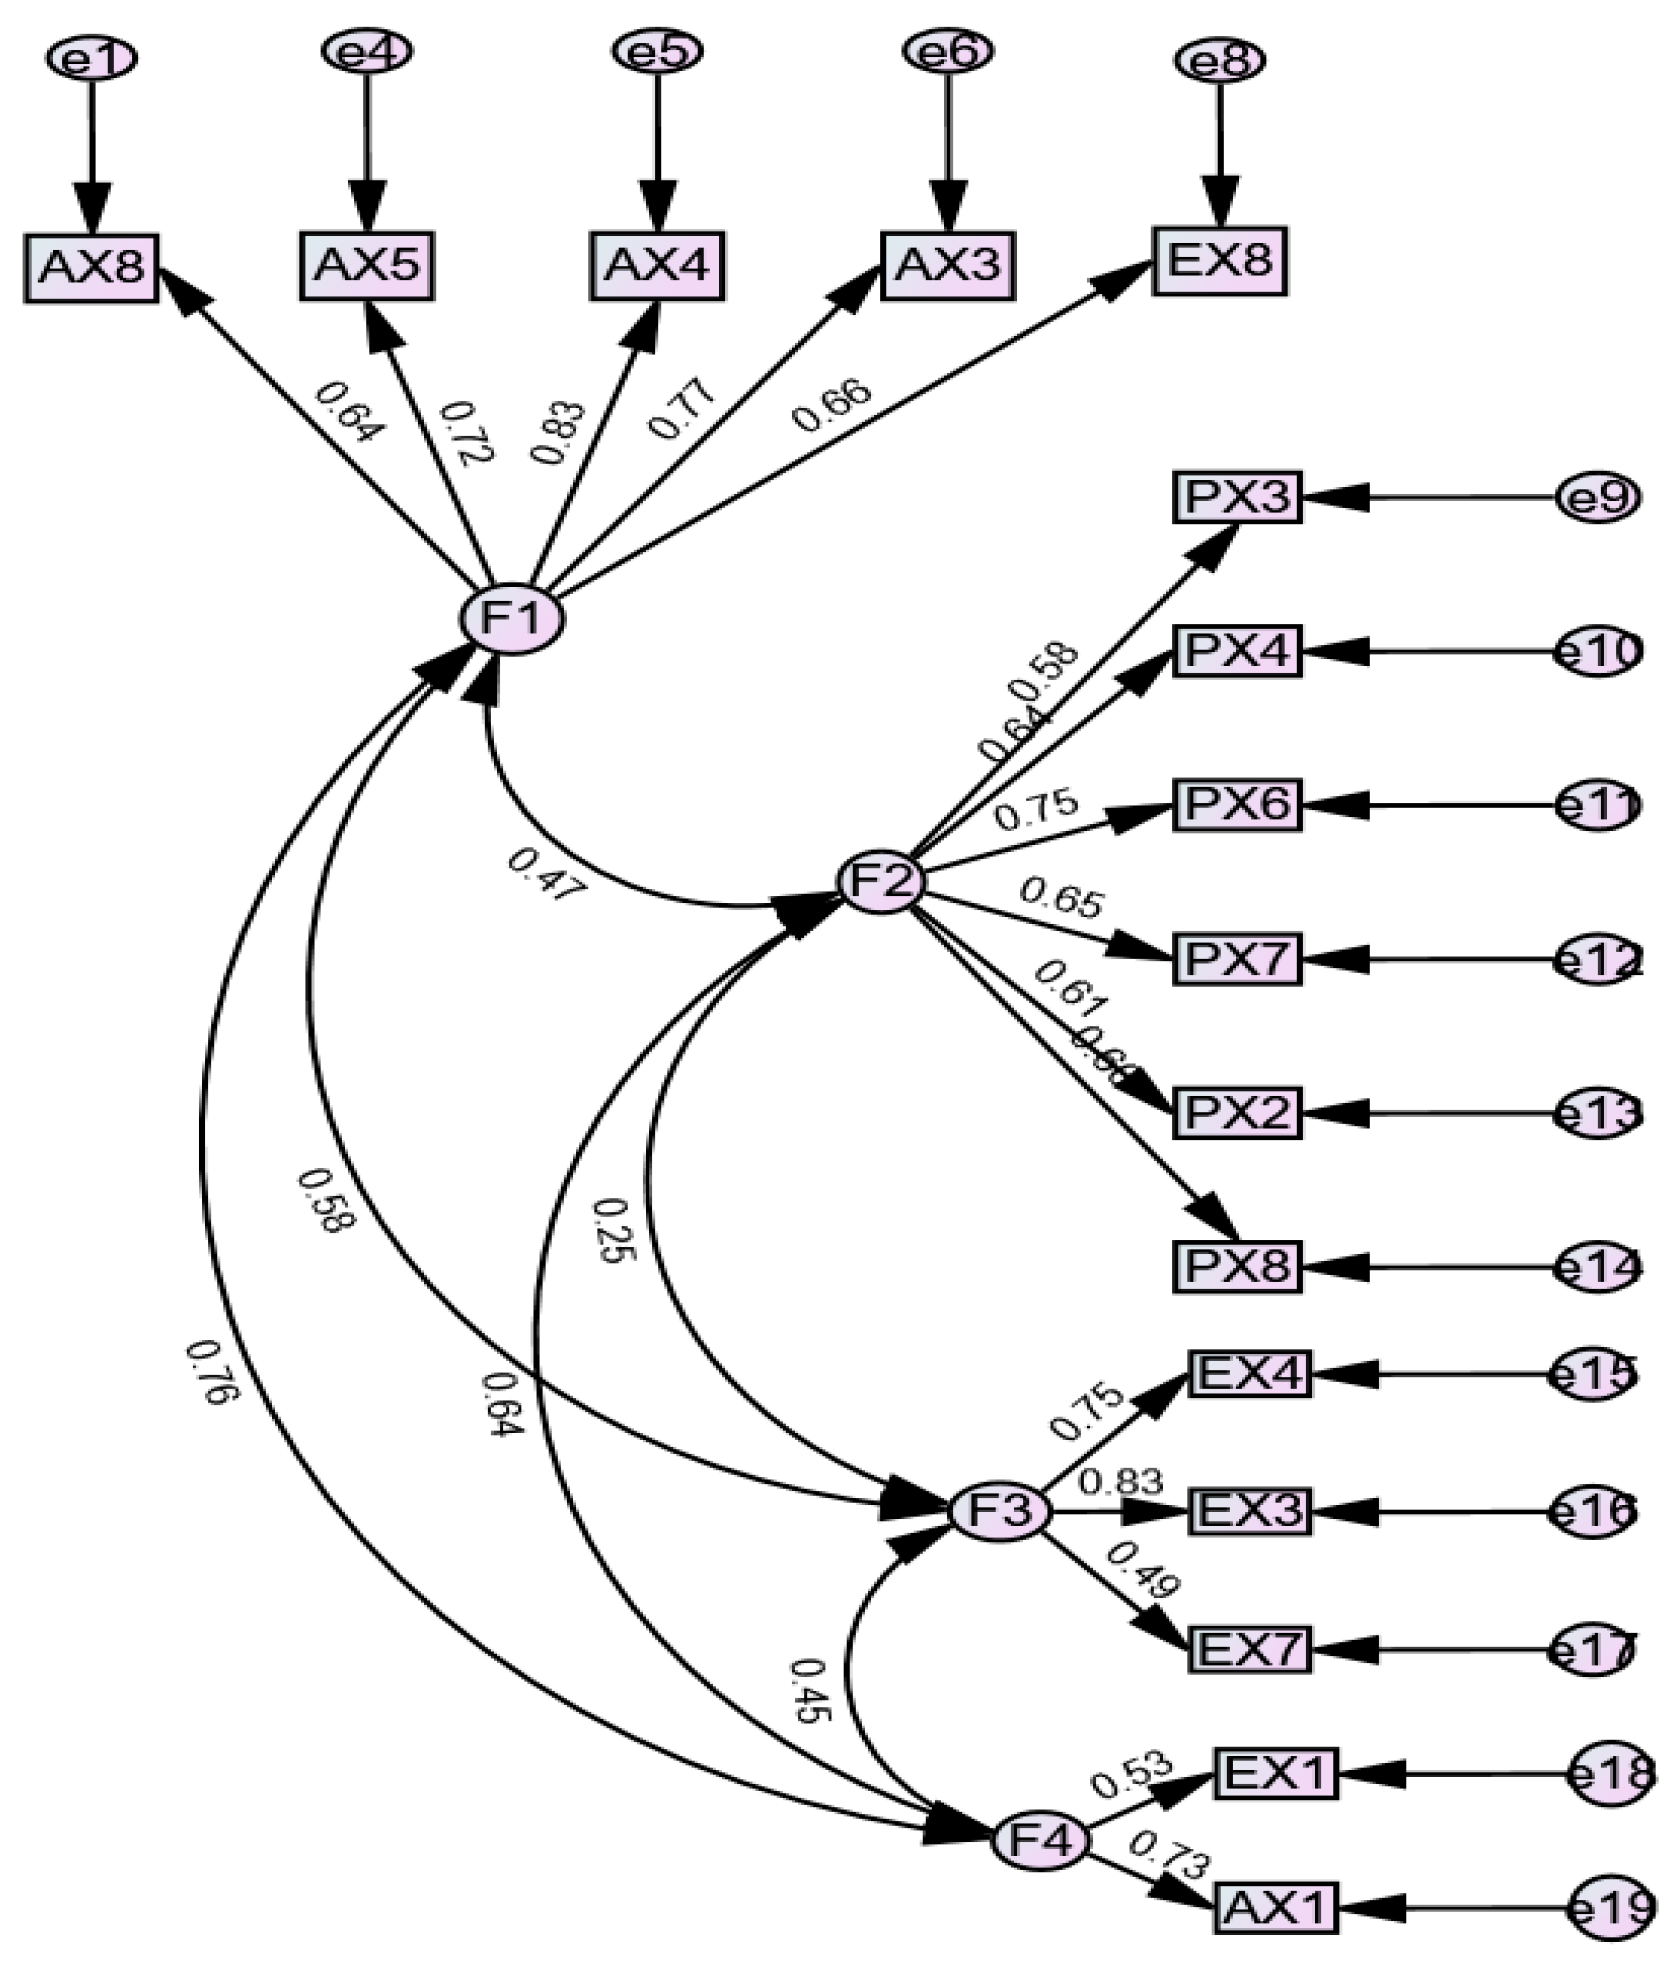
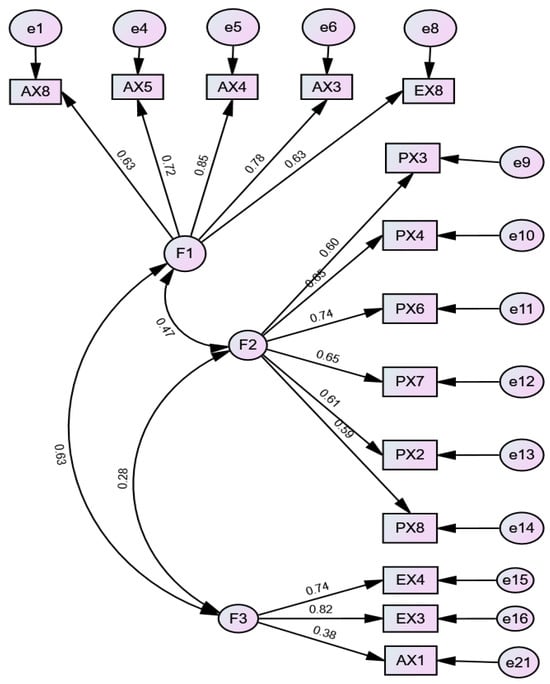
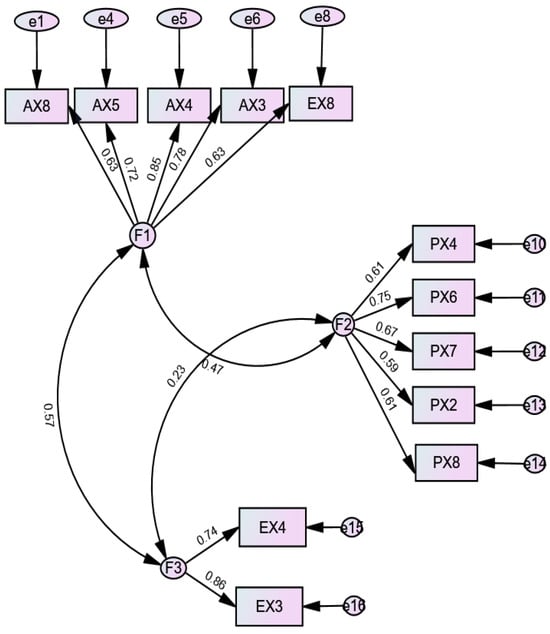
Figure 2, Figure 3, Figure 4 and Figure 5 depict adjustments to improve the model in accordance with theoretical criteria.
Figure 2.
Adjustment to the factorial solution (Chi-square = 180.186, degrees of freedom = 98, Probability level = 0.000).
Figure 3.
Adjustment to the factorial solution (Chi-square = 209.047, degrees of freedom = 74, Probability level = 0.000).
Figure 4.
Adjustment to the factorial solution (Chi-square = 96.456, degrees of freedom = 51, Probability level = 0.000).
Figure 5.
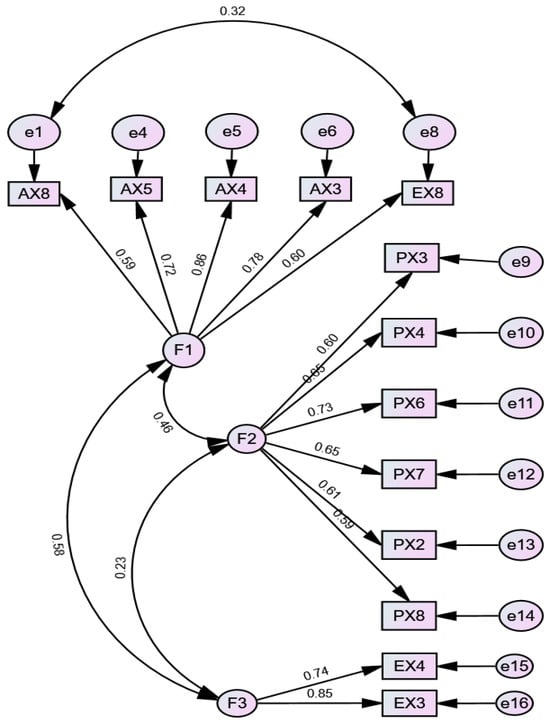
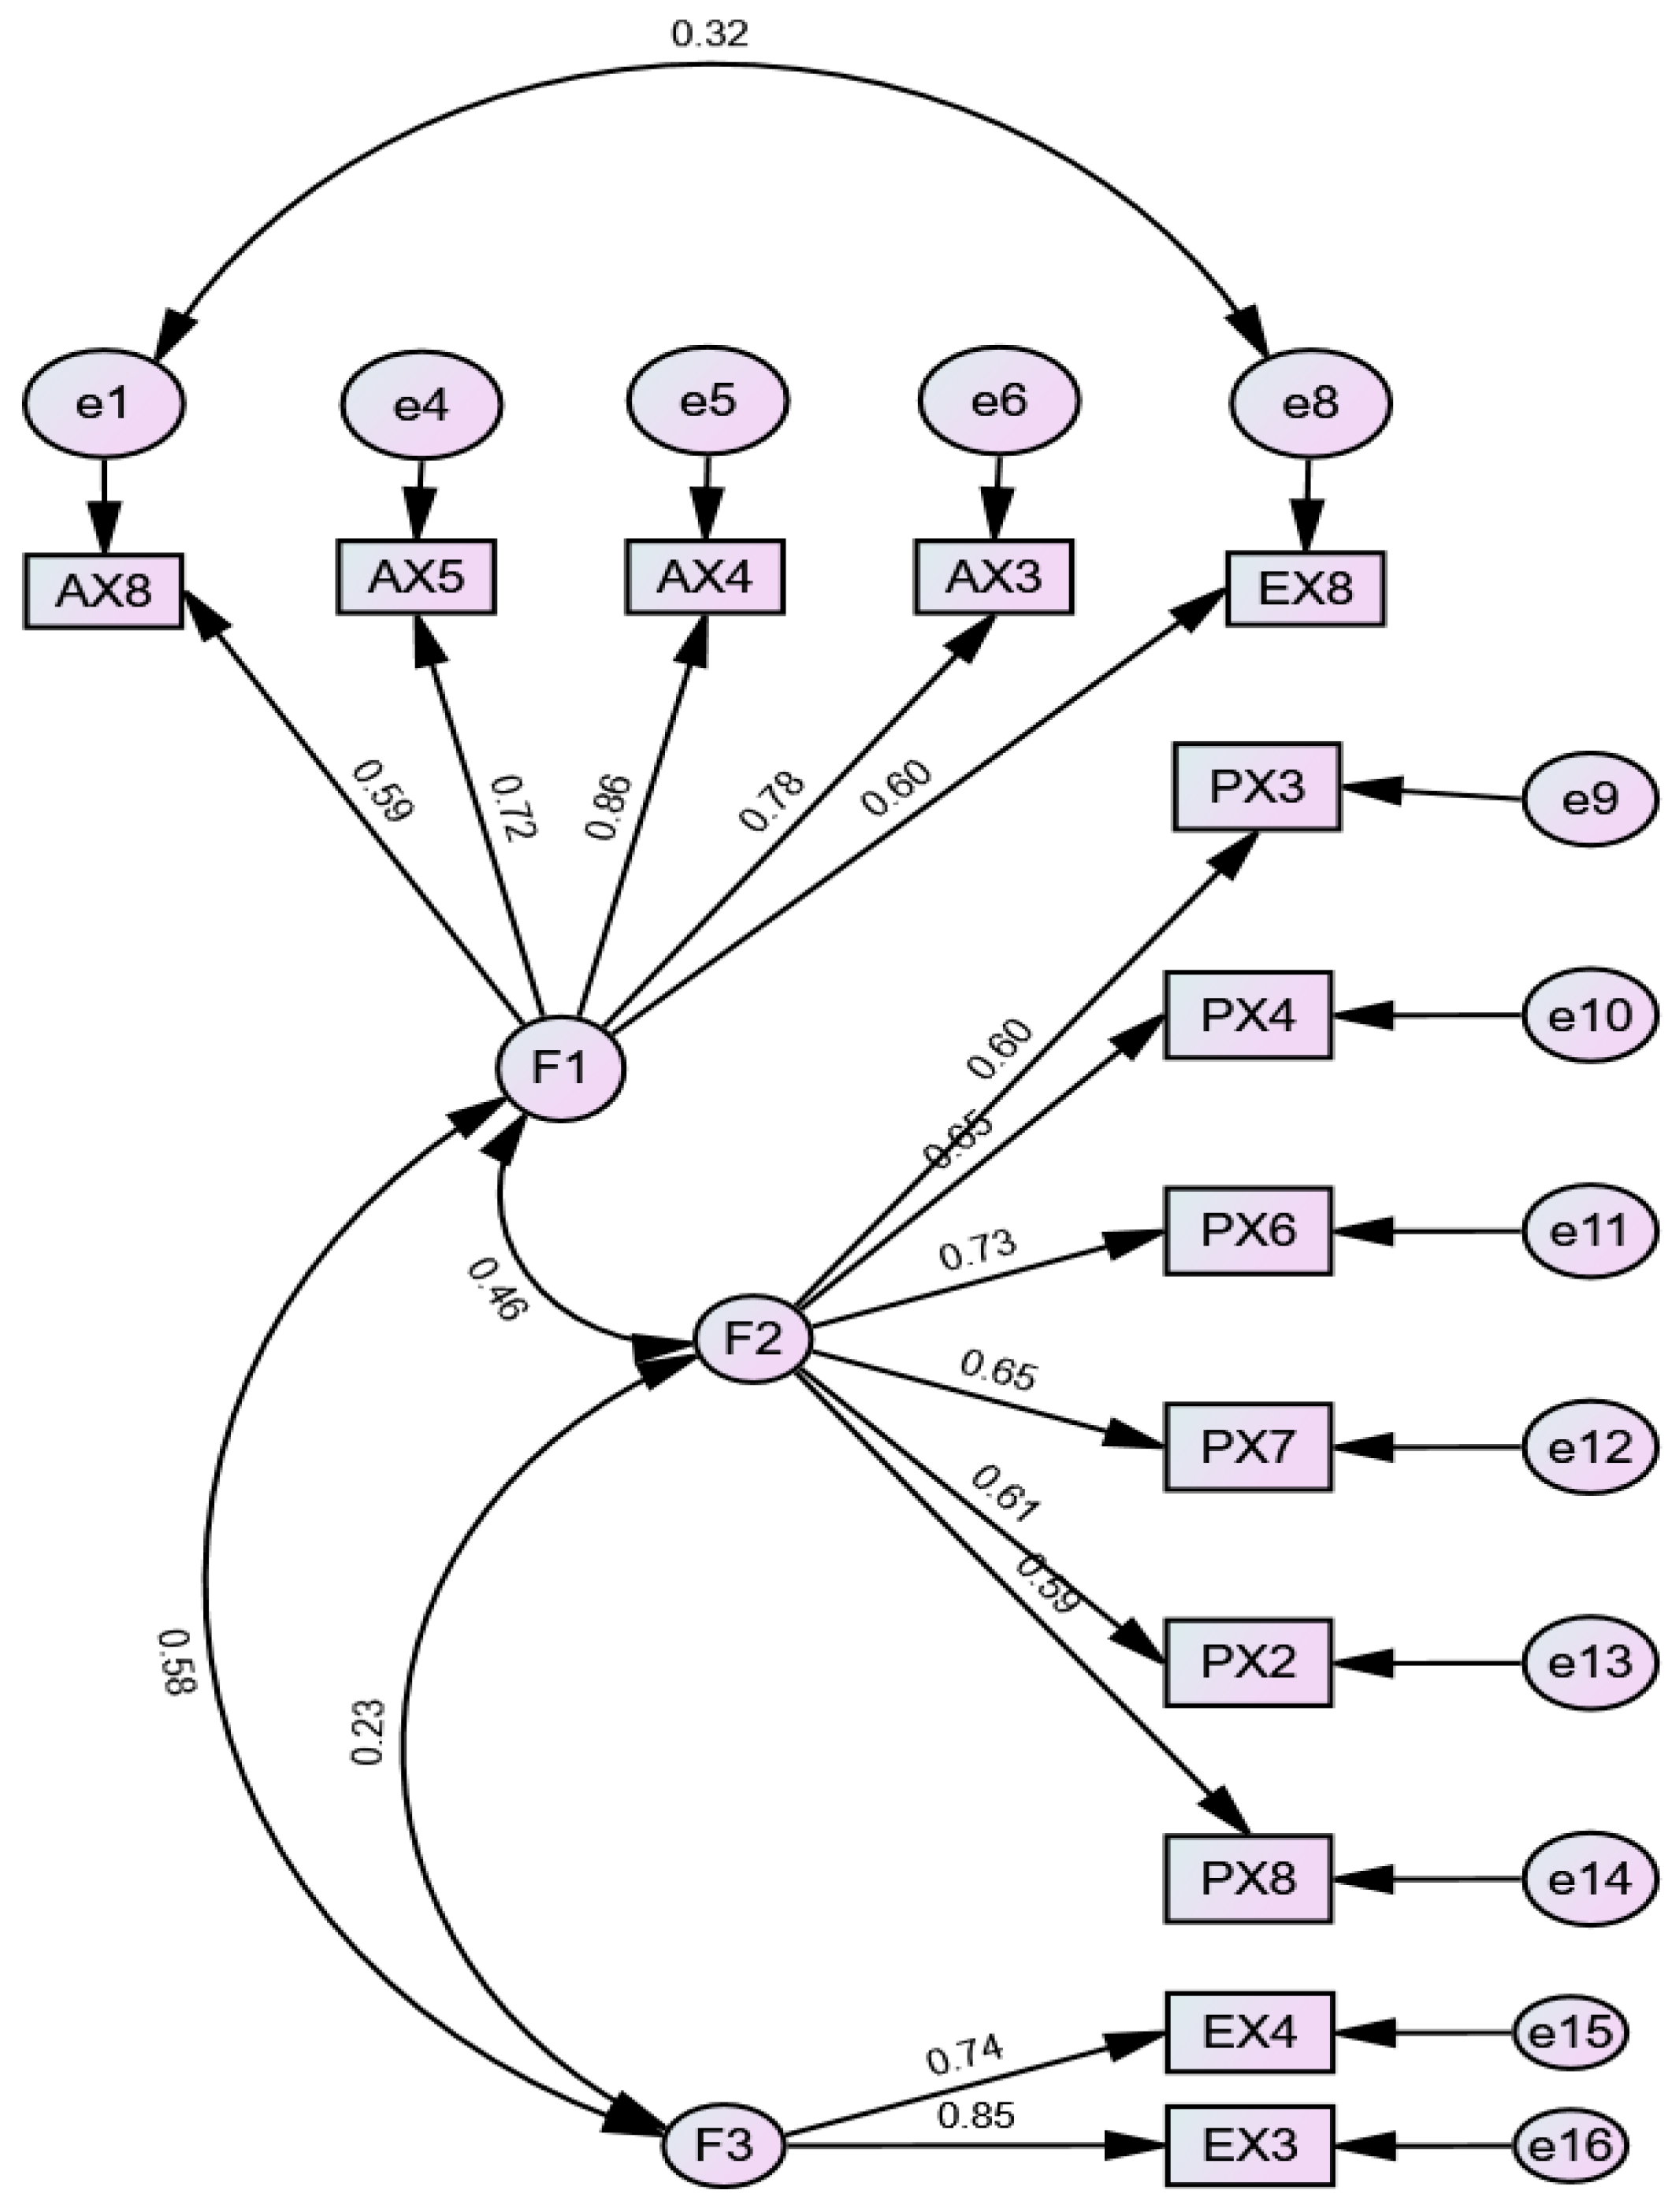
Adjusted final model of perception, lived experiences and financial resilience (Chi-square = 91.617, degrees of freedom = 61, Probability level = 0.07).
To justify the exclusion of certain items originally included in the factor structure reported in Table 5, a structural analysis was performed using AMOS, following the recommendations of Kline [43] and Hair et al. [44] on the specification and evaluation of structural equation models. Exploratory factor analysis with Varimax rotation identified items loading onto each factor and evaluated the robustness of their factor loadings in an initial five-factor model (Figure 1). Subsequently, in the initial structural model (Figure 1), it was observed that some items had factor loadings below the optimal values (≥0.7 ideal, ≥0.6 minimum acceptable), especially in factors four and five, in addition to very high correlations between factors and the presence of indicators with low loadings, which compromised the validity and reliability of the model.
In response, items with insufficient loadings were excluded, and a final three-factor model was chosen (Figure 5), which retained only items with satisfactory standardized loadings and significantly higher, consistent values (e.g., AX4 = 0.86; EX3 = 0.85). This procedure, based on statistical and theoretical criteria, yielded a more parsimonious, robust, and reliable model for representing the construct, in line with the methodological recommendations of [43,44]. A brief summary of the observed parameters is shown in Table 6 below. The adjustment reduced the model’s complexity, improved conceptual coherence, and facilitated an optimal statistical fit, evidenced by absolute, incremental, and parsimony fit indices (χ2/df, RMSEA, GFI, CFI, TLI, PGFI, PNFI) that meet the established reference criteria (see Table 7).
Table 6.
Evaluated parameters and their justification.
Table 7.
Models obtained.
5. Discussion
5.1. Interpretation of the Main Findings
The results of this study indicate that financial resilience among university students is primarily characterized by saving behavior, debt management, and spending planning, which emerge as the most relevant dimensions of the construct in this population. This finding is consistent with previous research that highlights the central role of precautionary saving and liquidity control as fundamental mechanisms for financial adaptation in contexts of economic uncertainty [8,11]. However, unlike studies of adult populations or households with stable incomes, the dimensions related to insurance or long-term investment strategies did not demonstrate sufficient empirical robustness in the student sample. This pattern suggests that financial resilience in university students is conditioned by short-term financial priorities, limited income streams, and less exposure to formal financial instruments. In this sense, financial resilience in the early stages of the life cycle appears primarily defensive, oriented toward immediate financial continuity rather than risk transfer or wealth accumulation.
5.2. Comparison to Previous Studies
The findings of this study partially converge with those reported by [8], who identify saving, debt management, and financial planning as central components of financial resilience. However, relevant differences are observed in the construct’s empirical structure, as several items related to insurance and asset diversification did not meet acceptable factor loadings in the university sample. These divergences can be attributed to contextual differences in the target population, particularly with respect to age, level of financial autonomy, and employment status. While Flores et al. [8] analyzed a more heterogeneous population with greater economic stability, this study focuses exclusively on university students, many of whom depend on family support, scholarships, or part-time jobs. Consequently, the practical relevance of formal financial products, such as insurance, may be perceived as limited or inaccessible, reducing their weight in financial decision-making.
These results also align with prior evidence that employment alone does not guarantee financial resilience when income is insufficient to cover basic needs or to cover unexpected expenses [14]. Consequently, financial resilience should be understood as a construct that depends on context and life-cycle stage, rather than as a homogeneous configuration applicable to all populations.
5.3. Methodological Considerations and Refinement of the Model
The transition from an exploratory five-factor structure to a confirmatory three-factor model reflects empirical and theoretical refinement, not an arbitrary reduction in dimensions. In psychometric research, particularly in exploratory research, it is common for initial solutions to evolve during confirmatory validation as the model’s conceptual coherence and empirical fit are assessed. Item removal was based on both statistical criteria (factor loadings greater than 0.50) and their conceptual alignment with the financial realities of the student population. This approach reduces the risk of overfitting and improves the interpretability and contextual validity of the final model. Similar strategies have been used in previous studies of financial resilience and behavioral finance, particularly in adapting instruments to new populations or cultural contexts. It is important to note that the final three-factor structure should not be interpreted as a limitation of the construct, but rather as evidence that financial resilience manifests differently across life stages, reinforcing the need for specific measurement frameworks for each population.
5.4. Sociocultural and Contextual Interpretation
The centrality of saving behavior identified in this study can also be interpreted from a sociocultural perspective. In many contexts, young people face high economic uncertainty, rising educational costs, and delayed entry into stable labor markets. These structural conditions foster a financial orientation focused on self-protection and risk avoidance, rather than long-term financial optimization. Furthermore, cultural norms regarding family support, informal networks, and collective financial responsibility can serve as partial substitutes for formal mechanisms such as insurance. This may explain why students prioritize liquid savings and debt avoidance over contractual risk-management instruments. This pattern has been documented in emerging and middle-income economies, where informal financial practices often complement—or even replace—formal financial systems.
5.5. Implications for the Sustainable Development Goals
The study’s results provide empirical evidence supporting the conceptual alignment between financial resilience and SDGs 3, 4, and 8, even though these goals are not directly measured as dependent variables. By strengthening students’ capacity to manage financial stress, financial resilience contributes to psychological and emotional well-being, in line with SDG 3 (Good Health and Well-being). Likewise, the central role of financial planning and saving reinforces the importance of financial education as a component of quality education (SDG 4) [20]. Finally, financial resilience equips students with key adaptive skills to navigate unstable labor markets and build productive career paths, indirectly supporting SDG 8 (Decent Work and Economic Growth). In this sense, financial resilience can be understood as a cross-cutting enabling capacity that indirectly contributes to the advancement of multiple dimensions of sustainable development.
5.6. Limitations and Future Research
This study has some limitations that should be considered when interpreting its results. First, the sample was obtained through non-probability self-selection sampling. While this type of sampling limits the external validity of the findings and restricts the generalizability of the results to the university population as a whole, its use is widely accepted in exploratory and psychometric studies, in which the main objective is to examine the internal structure, dimensionality, and metric properties of the instruments, rather than the estimation of population parameters [45,46,47,48]. In this sense, the results of this study should be interpreted as evidence of the patterns and configurations of the financial resilience construct in a specific university context. This is conceptually relevant for understanding the processes associated with well-being (SDG 3), quality education (SDG 4), and decent work and economic growth (SDG 8), although it does not claim to be representative of the population.
However, the use of non-probability sampling restricts the extrapolation of the results to other educational and sociocultural contexts. Future research could strengthen external validity by employing probabilistic or stratified sampling designs and by replicating the model across institutions, regions, and countries. This would enable a more robust evaluation of the contribution of financial resilience to the Sustainable Development Goals across diverse youth populations. Additionally, the sample size and the lack of stratification by variables such as geographic region, academic discipline, or employment status may have influenced the observed factor structure. Further studies with larger, more heterogeneous samples would allow comparisons across subgroups and the analysis of potential contextual differences relevant to the design of educational, financial, and labor policies aligned with the SDGs.
Finally, while the study is conceptually framed within the Sustainable Development Goals (SDGs 3, 4, and 8), these were not directly measured using specific indicators. In this regard, future research could integrate measures of mental health and well-being, academic performance, and labor-market transitions to empirically examine the mechanisms through which financial resilience contributes to sustainable development among young people.
6. Conclusions
This study analyzed financial resilience among university students, drawing on their perceptions, lived experiences, and actions in the face of adverse financial situations, using an exploratory and confirmatory approach. The results show that financial resilience in this population is primarily structured around saving, debt management, and budgeting, reflecting a configuration of the construct shaped by life-cycle stage, level of economic autonomy, and sociocultural context.
6.1. Theoretical Contributions
From a theoretical perspective, this study contributes to the literature on financial resilience by demonstrating that the construct does not manifest uniformly across populations; rather, it takes distinct configurations depending on age and socioeconomic context. Among university students, financial resilience is expressed primarily through short-term defensive mechanisms rather than through risk accumulation or transfer strategies. Furthermore, the research reinforces a multidimensional approach to financial resilience by integrating elements of Resilience Theory, Human Capital Theory, and Behavioral Finance. This integration allows us to understand financial resilience not only as an economic capacity but also as a cognitive and behavioral process influenced by education, perceptions, and prior experiences.
6.2. Methodological Contributions
From a methodological perspective, this study offers empirical evidence on the adaptation and validation of an instrument to measure financial resilience in university students. The findings show that some indicators relevant in adult populations lose explanatory power in youth contexts, highlighting the need to adjust the instruments to the characteristics of the studied group. The model refinement process, which yielded a three-factor structure, underscores the importance of assessing the contextual validity of psychometric instruments and avoiding the uncritical application of scales developed for other populations. Furthermore, the use of structural equation modeling enabled the identification of consistent relationships among the construct’s dimensions, making a significant contribution to the methodological literature on measuring financial resilience in educational contexts.
6.3. Implications for Practice and Public Policy
From an applied perspective, the results suggest that strategies aimed at strengthening the financial resilience of university students should prioritize the development of fundamental skills, such as saving, debt management, and financial planning, rather than focusing on complex or long-term financial instruments. In this process, universities play a strategic role by implementing financial education programs tailored to students’ contexts, either integrated into the academic curriculum or delivered through specialized financial support services. At the public policy level, the findings support the need to design interventions for young people that facilitate access to basic financial tools, promote precautionary saving, and reduce financial vulnerability during their formative years. In addition, these actions advance the Sustainable Development Goals, especially SDG 3 (Good Health and Well-being), SDG 4 (Quality Education), and SDG 8 (Decent Work and Economic Growth), by promoting inclusive, practical, and accessible financial education for the entire student population.
Author Contributions
A.G.-S. was responsible for conceptualization, methodology, and formal analysis. J.C.S. was responsible for writing, revising, and editing the manuscript. M.F.-B. was responsible for project administration, supervision, and validation. T.Z.-L. was responsible for data collection and curation. All authors have read and agreed to the published version of the manuscript.
Funding
This research received no external funding.
Institutional Review Board Statement
This study was conducted in accordance with the Code of Ethics of Tecnológico Nacional de México. The research protocol was approved by the Ethics Committee of the Division of Graduate Studies and Research, in compliance with the Declaration of Helsinki and alignment with the Sustainable Development Goals (SDGs) established in the United Nations 2030 Agenda for Sustainable Development.
Informed Consent Statement
Informed consent was obtained from all participants involved in the study.
Data Availability Statement
The data associated with this study can be found at http://doi.org/10.17632/cp27yppcwp.2.
Conflicts of Interest
The authors declare no conflicts of interest.
Appendix A
Item—total Statistics.
Cronbach’s Alpha.
| Items | Scale Mean If Item Deleted | Scale Variance If Item Deleted | Corrected Item-Total Correlation | Cronbach’s Alpha If Item Deleted |
| PX1 | 104.7305 | 161.092 | 0.310 | 0.798 |
| PX2 | 104.3438 | 159.803 | 0.485 | 0.792 |
| PX3 | 104.9297 | 162.042 | 0.415 | 0.795 |
| PX4 | 104.6563 | 161.866 | 0.406 | 0.795 |
| PX5 | 105.2148 | 164.342 | 0.302 | 0.799 |
| PX6 | 104.2617 | 160.272 | 0.532 | 0.792 |
| PX7 | 104.4883 | 160.698 | 0.508 | 0.792 |
| PX8 | 104.2969 | 162.704 | 0.435 | 0.795 |
| EX1 | 105.0273 | 159.376 | 0.436 | 0.793 |
| EX2 | 104.7461 | 158.865 | 0.520 | 0.791 |
| EX3 | 105.7305 | 160.480 | 0.447 | 0.793 |
| EX4 | 105.8008 | 162.717 | 0.336 | 0.797 |
| EX5 | 105.3203 | 159.999 | 0.428 | 0.794 |
| EX6 | 105.0039 | 157.141 | 0.532 | 0.789 |
| EX7 | 105.5586 | 160.028 | 0.379 | 0.795 |
| EX8 | 104.9961 | 158.945 | 0.516 | 0.791 |
| AX1 | 104.8398 | 158.566 | 0.554 | 0.790 |
| AX2 | 104.8594 | 159.557 | 0.529 | 0.791 |
| AX3 | 105.1758 | 158.106 | 0.555 | 0.790 |
| AX4 | 105.0977 | 158.073 | 0.584 | 0.789 |
| AX5 | 105.0352 | 158.787 | 0.585 | 0.790 |
| AX6 | 105.3164 | 160.994 | 0.438 | 0.794 |
| AX7 | 105.4375 | 161.620 | 0.435 | 0.794 |
| AX8 | 105.0195 | 160.576 | 0.487 | 0.793 |
Appendix B
Item—total Statistics.
(McDonald omega).
| Items | Scale Mean If Item Deleted | Scale Variance If Item Deleted | Corrected Item-Total Correlation | Multiple Correlation Square | Cronbach’s Alpha If Item Deleted | McDonald’s Omega If Item Deleted |
| PX1 | 83.2188 | 146.893 | 0.304 | 0.297 | 0.892 | 0.887 |
| PX2 | 82.8320 | 145.795 | 0.472 | 0.387 | 0.886 | 0.881 |
| PX3 | 83.4180 | 147.844 | 0.406 | 0.423 | 0.888 | 0.883 |
| PX4 | 83.1445 | 147.097 | 0.423 | 0.409 | 0.888 | 0.882 |
| PX5 | 83.7031 | 150.657 | 0.265 | 0.310 | 0.891 | 0.886 |
| PX6 | 82.7500 | 145.765 | 0.542 | 0.568 | 0.885 | 0.880 |
| PX7 | 82.9766 | 146.211 | 0.515 | 0.412 | 0.886 | 0.880 |
| PX8 | 82.7852 | 147.950 | 0.452 | 0.367 | 0.887 | 0.881 |
| EX1 | 83.5156 | 144.345 | 0.465 | 0.326 | 0.887 | 0.880 |
| EX2 | 83.2344 | 144.063 | 0.544 | 0.411 | 0.885 | 0.878 |
| EX3 | 84.2188 | 145.387 | 0.480 | 0.534 | 0.886 | 0.881 |
| EX4 | 84.2891 | 147.414 | 0.372 | 0.470 | 0.889 | 0.884 |
| EX5 | 83.8086 | 146.030 | 0.413 | 0.366 | 0.888 | 0.882 |
| EX6 | 83.4922 | 142.651 | 0.545 | 0.396 | 0.884 | 0.878 |
| EX7 | 84.0469 | 145.182 | 0.398 | 0.339 | 0.889 | 0.883 |
| EX8 | 83.4844 | 143.812 | 0.555 | 0.516 | 0.884 | 0.878 |
| AX1 | 83.3281 | 143.578 | 0.588 | 0.458 | 0.884 | 0.877 |
| AX2 | 83.3477 | 145.569 | 0.514 | 0.412 | 0.885 | 0.879 |
| AX3 | 83.6641 | 143.204 | 0.585 | 0.568 | 0.884 | 0.877 |
| AX4 | 83.5859 | 143.020 | 0.623 | 0.618 | 0.883 | 0.877 |
| AX5 | 83.5234 | 143.866 | 0.618 | 0.529 | 0.883 | 0.877 |
| AX6 | 83.8047 | 145.993 | 0.466 | 0.416 | 0.887 | 0.881 |
| AX7 | 83.9258 | 146.853 | 0.453 | 0.470 | 0.887 | 0.881 |
| AX8 | 83.5078 | 145.082 | 0.541 | 0.501 | 0.885 | 0.879 |
Appendix C
Financial resilience scale.
Part 1: perception toward financial health indicators.
| Items |
| P1.—Do you think that you should spend less than what you earn? |
| P2.—Do invoices have to be paid on time and in full? |
| P3.—Is it convenient to have enough savings in liquid financial products? |
| P4.—Have enough savings or long-term assets? |
| P5.—Have a sustainable level of debt? |
| P6.—Have a healthy credit history? |
| P7.—Have adequate insurance? |
| P8.—Plan expenses for the future? |
Part 2: Lived experience towards financial health indicators.
| Items |
| Lex1.—Personally, have you experienced a situation where you spend less than you earn? |
| Lex2.—If you had outstanding payments, did you pay the bills on time and in full? |
| Lex3.—Do you have enough savings in liquid financial products? |
| Lex4.—Do you have enough savings or long-term assets? |
| Lex5.—Currently, do you have a sustainable level of debt? |
| Lex6.—Today, do you have a healthy credit history? |
| Lex7.—Do you currently have adequate insurance in force? |
| Lex8.—In your personal life, do you plan the expenses that you will have in the immediate future and in the short term? |
Part 3: During or after some adverse financial situation.
| Items |
| Fr1.—Personally, did you take any actions to spend less than you earn? |
| Fr2.—In the event of having had pending payments, and not having paid on time: did you take any action to resolve the payment of your invoices on time and in full? |
| Fr3.—If so, did you implement any plan to increase your savings in liquid financial products? |
| Fr4.—Did you take any action to have enough savings or long-term assets? |
| Fr5.—Have you defined any strategy to maintain your debts sustainably and that you can pay when due? |
| Fr6.—If you did not have a healthy credit history, did you carry out any plan? |
| Fr7.—In case of not having adequate insurance, or having some, did you implement any plan to modify this scheme? |
| Fr8.—In case of not doing it in your personal life, did you implement a strategy to plan the expenses that you will have in the immediate future and in the short term? |
References
- Holling, C.S. Resilience and stability of ecological systems. Annu. Rev. Ecol. Syst. 1973, 4, 1–23. [Google Scholar] [CrossRef] [Scilit]
- Holling, C.S. Engineering resilience versus ecological resilience. In Engineering within Ecological Constraints; Schulze, P., Ed.; National Academy Press: Washington, DC, USA, 1996; pp. 31–44. [Google Scholar]
- Gunderson, L.H. Ecological resilience: In theory and application. Annu. Rev. Ecol. Syst. 2000, 31, 425–439. [Google Scholar] [CrossRef] [Scilit]
- Walker, B.H.; Holling, C.S.; Carpenter, S.R.; Kinzig, A. Resilience, adaptability and transformability in social–ecological systems. Ecol. Soc. 2004, 9, 5. Available online: http://www.ecologyandsociety.org/vol9/iss2/art5 (accessed on 18 August 2025). [CrossRef] [Scilit]
- Becken, S. Developing a framework for assessing resilience of tourism sub-systems to climatic factors. Ann. Tour. Res. 2013, 43, 506–528. [Google Scholar] [CrossRef] [Scilit]
- OECD. Financial Resilience and Its Importance for Long-Term Well-Being; Organisation for Economic Co-Operation and Development: Paris, France, 2021; Available online: https://www.oecd.org/en/networks/infe (accessed on 18 August 2025).
- Hamid, F.S.; Loke, Y.J.; Chin, P.N. Determinants of financial resilience: Insights from an emerging economy. J. Soc. Econ. Dev. 2023, 25, 479–499. [Google Scholar] [CrossRef] [Scilit] [PubMed]
- Flores, M.; Zamora-Lobato, T.; García-Santillán, A. Three-dimensional model of financial resilience in workers: Structural equation modeling and Bayesian analysis. Econ. Sociol. 2024, 17, 69–88. [Google Scholar] [CrossRef] [Scilit]
- Kulshreshtha, A.; Raju, S.; Muktineni, S.M.; Chatterjee, D. Income shock and financial well-being in the COVID-19 pandemic: Financial resilience and psychological resilience as mediators. Int. J. Bank Mark. 2023, 41, 1037–1058. [Google Scholar] [CrossRef] [Scilit]
- Mundi, H.S.; Vashisht, S. Cognitive abilities and financial resilience: Evidence from an emerging market. Int. J. Bank Mark. 2023, 41, 1010–1036. [Google Scholar] [CrossRef] [Scilit]
- McKnight, A.; Rucci, M. The Financial Resilience of Households: 22 Country Study with New Estimates Breakdowns by Household Characteristics and a Review of Policy Options; Centre for Analysis of Social Exclusion, London School of Economics: London, UK, 2020; Available online: http://eprints.lse.ac.uk/id/eprint/121525 (accessed on 9 November 2024).
- Yao, R.; Zhang, J. Employment status and financial resilience during the COVID-19 pandemic. Int. J. Bank Mark. 2023, 41, 992–1009. [Google Scholar] [CrossRef] [Scilit]
- BBVA. Salud Financiera: Ocho Indicadores Para Medirla [Financial Health: Eight Indicators to Measure]. 2020. Available online: https://www.bbva.com/es/salud-financiera/salud-financiera-ocho-indicadores-medirla// (accessed on 9 November 2024). (In Spanish)
- Salignac, F.; Marjolin, A.; Reeve, R.; Muir, K. Conceptualizing and measuring financial resilience: A multidimensional framework. Soc. Indic. Res. 2019, 45, 17–38. [Google Scholar] [CrossRef] [Scilit]
- Lusardi, A.; Hasler, A.; Yakoboski, P.J. Building up financial literacy and financial resilience. Mind Soc. 2021, 20, 181–187. [Google Scholar] [CrossRef] [Scilit]
- Tahir, M.S.; Shahid, A.U.; Richards, D.W. The role of impulsivity and financial satisfaction in a moderated mediation model of consumer financial resilience and life satisfaction. Int. J. Bank Mark. 2022, 40, 773–790. [Google Scholar] [CrossRef] [Scilit]
- Bialowolski, P.; Cwynar, A.; Weziak-Bialowolska, D. The role of financial literacy for financial resilience in middle-age and older adulthood. Int. J. Bank Mark. 2022, 40, 1718–1748. [Google Scholar] [CrossRef] [Scilit]
- Kass-Hanna, J.; Lyons, A.C.; Xi, F.L. Building financial resilience through financial and digital literacy in South Asia and Sub-Saharan Africa. Emerg. Mark. Rev. 2022, 51, 100846. [Google Scholar] [CrossRef] [Scilit]
- Howden Group. Financial Stress and the Negative Impact on Our Wellbeing. Available online: https://www.howdengroup.com/uk-en/financial-stress-and-negative-impact-our-wellbeing (accessed on 19 August 2025).
- Ampartzaki, M.; Kalogiannakis, M.; Papadakis, S. Deepening our Knowledge about Sustainability Education in the Early Years: Lessons from a Water Project. Educ. Sci. 2021, 11, 251. [Google Scholar] [CrossRef] [Scilit]
- United Nations. Transforming Our World: The 2030 Agenda for Sustainable Development. 2015. Available online: https://sdgs.un.org/2030agenda (accessed on 18 August 2025).
- Yadav, P.; Shaikh, I. Measuring financial resilience with consumer sentiment data from India. Int. J. Bank Mark. 2023, 41, 1083–1103. [Google Scholar] [CrossRef] [Scilit]
- Schultz, T.W. Investment in Human Capital. Am. Econ. Rev. 1961, 51, 1–17. Available online: https://www.jstor.org/stable/1818907 (accessed on 10 October 2025).
- Becker, G.S. Investment in Human Capital: A Theoretical Analysis. J. Political Econ. 1962, 70, 9–49. [Google Scholar] [CrossRef] [Scilit]
- Becker, G.S. Human Capital: A Theoretical and Empirical Analysis, with Special Reference to Education; University of Chicago Press: Chicago, IL, USA, 1964. [Google Scholar]
- Kahneman, D.; Tversky, A. Prospect Theory: An Analysis of Decision under Risk. Econometrica 1979, 47, 263–291. [Google Scholar] [CrossRef] [Scilit]
- Thaler, R.H. Mental Accounting and Consumer Choice. Mark. Sci. 1985, 4, 199–214. [Google Scholar] [CrossRef] [Scilit]
- Thaler, R.H. Behavioral Economics: Past, Present, and Future. Am. Econ. Rev. 2016, 106, 1577–1600. [Google Scholar] [CrossRef] [Scilit]
- Gallardo, K.; Vargas, A. Resiliencia y autoeficacia académica en estudiantes universitarios. Rev. Ecos Acad. 2024, 10, e1167. [Google Scholar] [CrossRef] [Scilit]
- Gerbing, D.W.; Anderson, J.C. An update paradigm for scale development incorporating unidimensionality and its assessment. J. Mark. Res. 1988, 25, 186–192. [Google Scholar] [CrossRef] [Scilit]
- Lorenzo-Seva, U.; Timmerman, M.E.; Kiers, H.A.L. The Hull Method for Selecting the Number of Common Factors. Multivar. Behav. Res. 2011, 46, 340–364. [Google Scholar] [CrossRef] [Scilit]
- McDonald, R.P. Test Theory: A Unified Treatment; Lawrence Erlbaum Associates, Inc.: Mahwah, NJ, USA, 1999. [Google Scholar]
- Kim, H.Y. Statistical notes for clinical researchers: Assessing normal distribution (2) using skewness and kurtosis. Restor. Dent. Endod. 2013, 38, 52–54. [Google Scholar] [CrossRef] [Scilit] [PubMed]
- Muthén, B.; Kaplan, D. A comparison of some methodologies for the factor analysis of non-normal Likert variables. Br. J. Math. Stat. Psychol. 1985, 38, 171–189. [Google Scholar] [CrossRef] [Scilit]
- Ogasawara, H. Asymptotic expansions of the distributions of the polyserial correlation coefficients. Behaviormetrika 2011, 38, 153–168. [Google Scholar] [CrossRef] [Scilit]
- Richaud, M. Desarrollos del análisis factorial para el estudio de ítems dicotómicos y ordinales [Developments of factor analysis for the study of dichotomous and ordinal items]. Rev. Interdiscip. 2005, 22, 237–251. Available online: http://www.scielo.org.ar/scielo.php?script=sci_isorefandpid=S1668-70272005000200006&lng=es&tlng=pt (accessed on 19 August 2025).
- Timmerman, M.E.; Lorenzo-Seva, U. Dimensionality assessment of ordered polytomous items with parallel analysis. Psychol. Methods 2011, 16, 209–220. [Google Scholar] [CrossRef] [Scilit]
- García-Santillán, A.; Venegas-Martínez, F.; Mendoza-Rivera, R. Structural equations model to explain financial knowledge on workers. Rev. Mex. Econ. Finanzas Nueva Época (REMEF) 2024, 19, e962. [Google Scholar] [CrossRef] [Scilit]
- Hair, J.; Anderson, R.; Tatham, R.; Black, W. Análisis Multivariante, 5th ed.; Prentice Hall: Madrid, Spain, 1999. [Google Scholar]
- Ho, R. Handbook of Univariate and Multivariate Data Analysis and Interpretation with SPSS, 1st ed.; Chapman and Hall/CRC: Boca Raton, FL, USA, 2006. [Google Scholar] [CrossRef] [Scilit]
- Hooper, D.; Coughlan, J.; Mullen, M.R. Structural equation modelling: Guidelines for determining model fit. Electron. J. Bus. Res. Methods 2008, 6, 53–60. Available online: https://academic-publishing.org/index.php/ejbrm/article/view/1224 (accessed on 15 January 2026).
- Schreiber, J.B.; Nora, A.; Stage, F.K.; Barlow, E.A.; King, J. Reporting structural equation modeling and confirmatory factor analysis results: A review. J. Educ. Res. 2006, 99, 323–338. [Google Scholar] [CrossRef] [Scilit]
- Kline, R.B. Principles and Practice of Structural Equation Modeling, 4th ed.; The Guilford Press: New York, NY, USA, 2016. [Google Scholar]
- Hair, J.F.; Black, W.C.; Babin, B.J.; Anderson, R.E. Multivariate Data Analysis, 8th ed.; Cengage Learning: Boston, MA, USA, 2019. [Google Scholar]
- Costello, A.B.; Osborne, J. Best practices in exploratory factor analysis: Four recommendations for getting the most from your analysis. Pract. Assess. Res. Eval. 2005, 10, 7. [Google Scholar] [CrossRef]
- DeVellis, R.F. Scale Development: Theory and Applications, 4th ed.; Sage: Thousand Oaks, CA, 2017; Available online: https://shorturl.at/33w6Y (accessed on 15 January 2026).
- Fabrigar, L.R.; Wegener, D.T.; MacCallum, R.C.; Strahan, E.J. Evaluating the use of exploratory factor analysis in psychological research. Psychol. Methods 1999, 4, 272–299. [Google Scholar] [CrossRef]
- Worthington, R.L.; Whittaker, T.A. Scale Development Research: A Content Analysis and Recommendations for Best Practices. Couns. Psychol. 2006, 34, 806–838. [Google Scholar] [CrossRef] [Scilit]

Disclaimer/Publisher’s Note: The statements, opinions and data contained in all publications are solely those of the individual author(s) and contributor(s) and not of MDPI and/or the editor(s). MDPI and/or the editor(s) disclaim responsibility for any injury to people or property resulting from any ideas, methods, instructions or products referred to in the content. |
© 2026 by the authors. Licensee MDPI, Basel, Switzerland. This article is an open access article distributed under the terms and conditions of the Creative Commons Attribution (CC BY) license.