


Abstract
In the context of intensifying industrial emissions and rapid urban sprawl, balancing environmental sustainability and economic expansion has grown more pronounced in Anyang. Drawing on land-use data spanning the years 2000, 2010, and 2020, this research employed the InVEST model to examine the spatiotemporal dynamics of habitat quality across the region. To uncover key influencing factors, this study integrated the GeoDetector method, while future habitat trends were projected to 2030 using a coupled intPLUS-InVEST simulation framework. The analysis revealed that over the past two decades, habitat quality remained consistently low, displaying a geographic gradient associated with elevated levels in western mountainous zones, along with lower levels across eastern plains. The evolution of habitat conditions appears to result from the intricate interdependencies between environmental variables, anthropogenic pressures, and industrial expansion. Projections in various development scenarios point to stark contrasts in future habitat outcomes: notably, the scenario combining industrial transformation with ecological rehabilitation fosters moderate gains and stabilizes declining trends in habitat quality. These insights emphasize the urgency of implementing robust policy mechanisms and spatially nuanced land-use strategies to facilitate Anyang’s ecological transition and ensure long-term regional sustainability.
1. Introduction
Since the early 2000s, rapid industrial expansion and urban sprawl have significantly contributed to global warming, intensifying extreme weather events and placing mounting pressure on ecological systems worldwide [1,2,3,4]. Urban biodiversity—integral to global ecological balance—is increasingly undermined by the contraction of natural habitats, land cover alterations, habitat fragmentation, and declining ecosystem functionality [5,6,7]. Within this context, habitat quality reflects an ecological capacity to sustain viable populations and ecological processes, serving as a critical indicator for evaluating the sustainability of regional development [8]. Amid growing efforts to coordinate ecological conservation with economic transformation, it is imperative to examine the spatiotemporal evolution of habitat quality, uncover its driving mechanisms, and simulate future trends in multiple development scenarios. These efforts are essential for constructing resilient territorial ecological security frameworks and advancing global sustainability goals.
Habitat quality has long attracted scholarly attention in the domains of ecology and environmental science, with research conducted across various spatial scales and analytical paradigms. Broadly, the existing literature can be classified into two approaches: (1) micro-scale assessments centered on individual species or ecological communities, often relying on field surveys and empirical indicators [9], and (2) regional-scale analyses that integrate remote-sensing data with algorithmic models to monitor spatial and temporal trends. Widely used models include social values for ecosystem services (SolVES), the maximum entropy model (MaxEnt), the habitat suitability index (HIS), and integrated valuation of ecosystem services and tradeoffs (InVEST), among which the InVEST model has gained prominence due to its operational flexibility and sound theoretical foundation [10,11,12,13]. To project future trajectories, researchers have increasingly integrated habitat models with land-use simulation tools, such as conversion of land use and its effects at small regional extent (CLUE-S), the future land-use simulation model (FLUS), cellular automata (CA)–Markov, and the more recent patch-generating land use simulation (PLUS) model, offering enhanced performance in simulating large-scale and multi-type land-use transitions [14,15,16,17]. Recent studies highlight the synergistic utility of combining PLUS with InVEST models. Zhang et al. [18] analyzed ecosystem services evolution in the Beijing–Tianjin–Hebei region using this approach, whereas Hou et al. [19] applied it to assess habitat quality under land-use change in the Fen River Basin. Wang et al. [20] employed the coupled framework for multi-scenario habitat quality projections in Bosten Lake Basin. Pan et al. [21] also evaluated long-term land use and habitat trends in Guangxi (2000–2020). These cases demonstrate the robustness of PLUS in capturing spatial land-use dynamics and the reliability of InVEST in habitat assessment.
Although the PLUS model has grown into a mainstream tool in land-use simulation, its traditional structure still faces limitations in representing complex land-use interactions. To resolve these concerns, Xun et al. [22] developed an interaction network patch-generating land-use simulation (intPLUS) model in 2025. Unlike the original PLUS model, which utilizes the simple multiplicative framework incorporating suitability probability, neighborhood effects, and randomness, intPLUS introduces a logarithmic-weighted embedding mechanism to explicitly capture interaction networks between land-use categories. This refinement allows for nuanced modeling of competitive and inhibitory relationships, while adaptive weight optimization enhances both accuracy and spatial realism in simulation results [23]. Consequently, the intPLUS model has emerged as a promising advancement in precision land-use forecasting, particularly relevant for regions experiencing rapid transformation. Despite growing attention to habitat quality at watershed and provincial scales, relatively few studies have focused on heavily industrialized urban regions, areas typically characterized by fragile ecosystems and intense anthropogenic disturbance. To advance our understanding in this area, we propose a synergistic combination of intPLUS with InVEST models to evaluate the habitat quality dynamics of such environments, using Anyang in Henan Province as a case study.
Anyang represents a prototypical industrial city undergoing accelerated land-use restructuring driven by industrial emissions, domestic wastewater, and urbanization pressures [24]. These changes have led to notable habitat degradation, posing ecological risks not only locally but also to the broader Beijing–Tianjin–Hebei ecological corridor. As a designated core region for ecological preservation and green development in the Yellow River Basin, Anyang holds strategic value in national biodiversity conservation agendas. The city’s long-term development blueprint—outlined in the “14th Five-Year Plan and 2035 Vision Goals”—explicitly prioritizes ecological sustainability and envisions the transformation of Anyang into a model of “Beautiful China” development [25]. Given this background, this study was guided by the following key questions: (1) How has habitat quality evolved in Anyang over the period of 2000–2020? (2) What are the dominant natural and anthropogenic drivers shaping spatial heterogeneity in habitat quality? (3) How might habitat quality change under future land-use trajectories characterized by distinct policy priorities?
To address these questions, this research combined the geographic detector (GeoDetector) method with the intPLUS-InVEST model to evaluate historical patterns and simulate future outcomes in four carefully constructed scenarios: natural development, urban construction, ecological conservation, and a hybrid strategy featuring industrial green transformation coupled with ecological restoration. The specific research objectives are outlined as follows: (1) to examine and visualize the spatiotemporal evolution of habitat quality in Anyang between 2000 and 2020; (2) to identify and quantify the key environmental and socioeconomic drivers of spatial habitat variation; and (3) to simulate and project the geographic configuration of habitat quality in 2030 in multiple development scenarios.
2. Methods
2.1. Study Sites
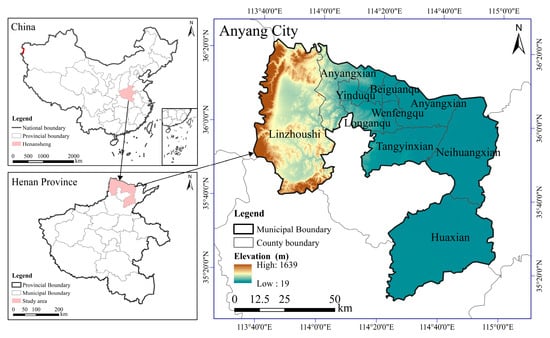
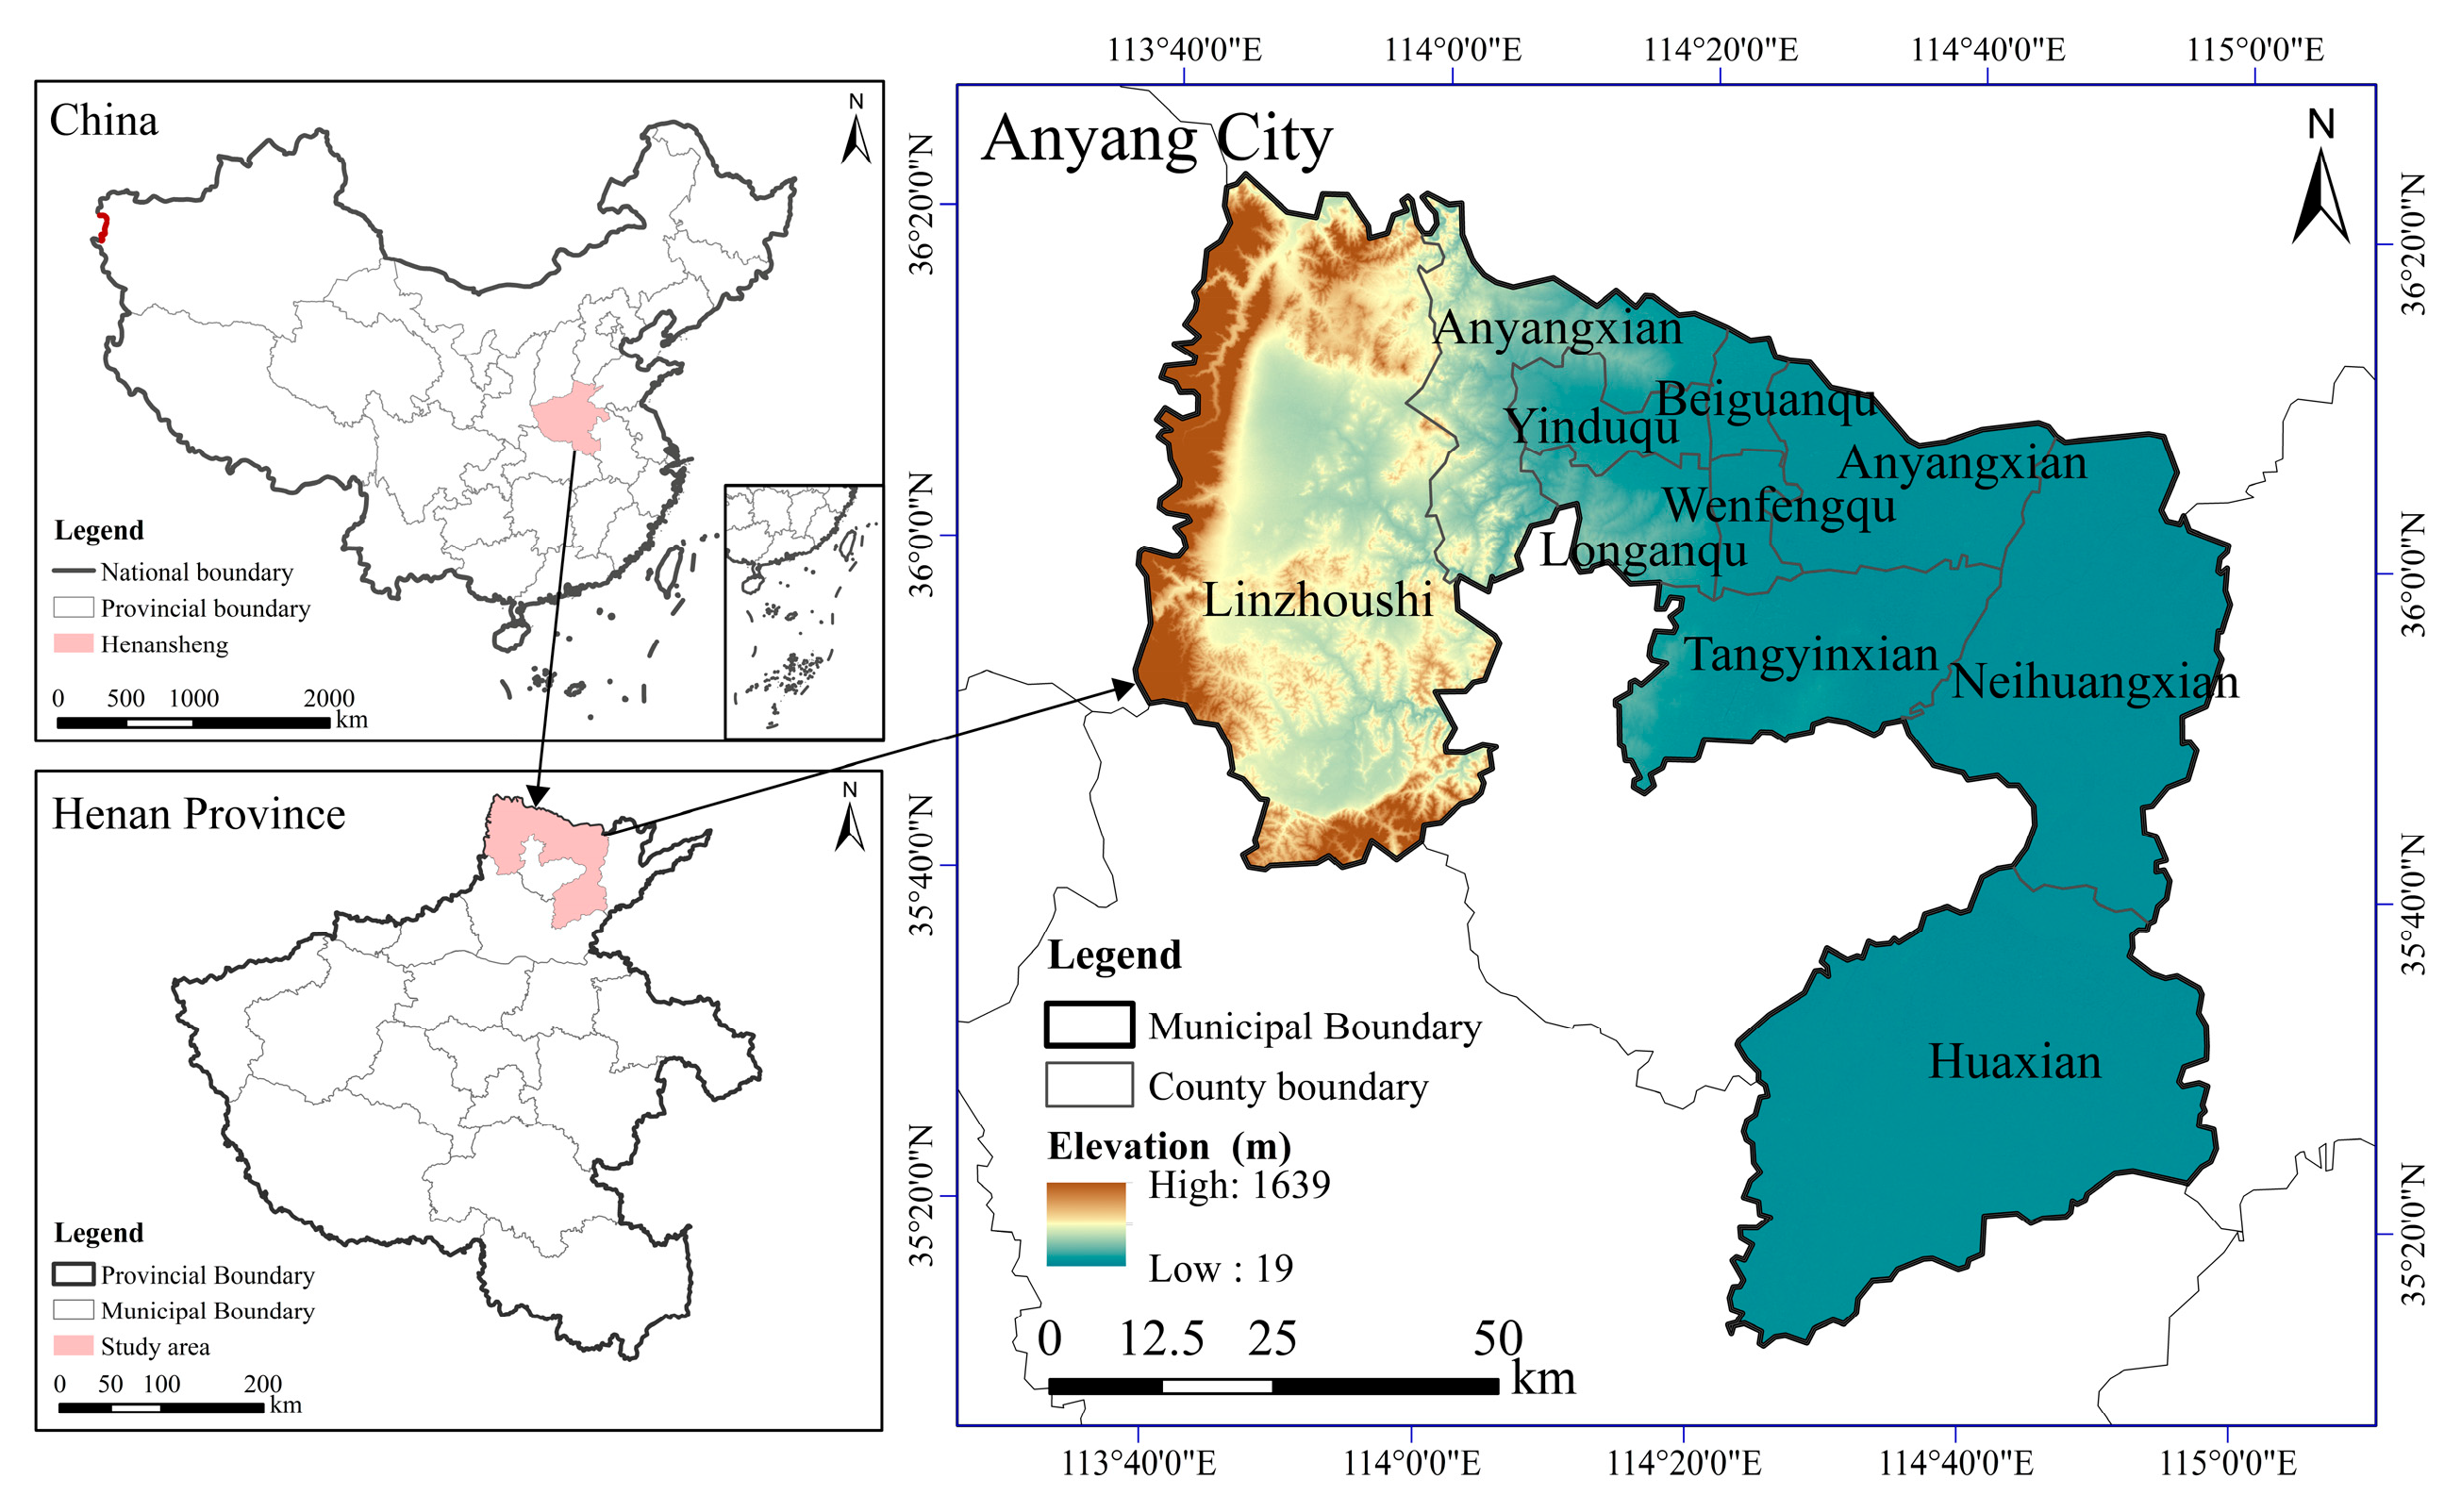
Anyang (35°12′–36°22′ N, 113°37′–114°58′ E) is located at the tri-provincial boundary of Henan, Shanxi, and Hebei, covering a total area of 7413 km2. Administratively, it governs one county-level city, four counties, and four urban districts (Figure 1). Designated as a core zone under the Ecological Conservation and High-Quality Development Plan for the Yellow River Basin, the entire city is embedded within a broader national strategic framework. As a result, Anyang benefits from the overlapping regional initiatives of the Beijing–Tianjin–Hebei Coordinated Development Plan and the Central Plains Urban Cluster strategy. Functioning as a “dual-core” city for both ecological protection and sustainable development in northern Henan, Anyang is a vital ecological security in the middle Yellow River. Its environmental agenda emphasizes integrated management of mountainous regions, water bodies, forests, farmlands, lakes, and grass lands, alongside the protection of regional water resources. This multifaceted ecological focus positions the city as a central node in the Yellow River Basin’s environmental security network. Topographically, Anyang features a west-to-east descending terrain, with the western section formed by the foothills and hills of the Taihang Mountains, while the eastern area extends into the Huang–Huai–Hai Plain. The city straddles the Haihe and Yellow River drainage areas and lies within a temperate continental monsoon climate, defined by various seasonal changes along with synchronized rainfall and temperature pattern zones. The annual mean temperature is 13.6 °C, while the average yearly rainfall measures approximately 582.9 mm. Despite its ecological significance, Anyang remains one of Henan’s key industrial centers. The city’s heavy industrial base—marked by high energy intensity and resource consumption—has led to a series of environmental pressures, including species decline, ecosystem service functionality reduction, and elevated pollutant emissions.
Figure 1.
Spatial positions of study sites in Yellow River Basin core region.
2.2. Data Sources
The data are grouped into four principal classes: foundational geospatial data, natural environmental variables, socioeconomic and human activity indicators, and datasets reflecting industrial impacts. The adopted land-use data originate from the Resource and Environment Science and Data Center of the Chinese Academy of Sciences (https://www.resdc.cn, accessed on 12 January 2025). Primarily derived from Landsat remote-sensing imagery, the dataset was generated based on human interpretation of imagery, resulting in raster files with an overall accuracy exceeding 93% and 30 m spatial resolution. Land-use information was collected for three time points: 2000, 2010, and 2020. Following cropping and projection transformation, a consistent time-series dataset specific to Anyang was constructed. In accordance with the Current Land Use Classification (GB/T 2010-2017) and customized for the purpose of this study, land-use types were sorted and integrated into eight major classes: cultivated land, forest land, grass land, waterbodies, urban land, rural residential land, industrial and mining land, and unutilized land [26].
Situated at the base of the Taihang Mountains, Anyang features an ecologically sensitive landscape grouped by heterogeneous land-use structures, intricate terrain, and significant variability in both edaphic and climatic factors [27]. Parameters including elevation, slope, and soil composition directly influence vegetation patterns and ecosystem resilience, while the average temperature and precipitation set the broader environmental context, thereby shaping ecosystem structure and productivity [28,29,30]. The share of industrial output, along with discharges of industrial wastewater, sulfur dioxide, and particulate matter, reflects the intensity of anthropogenic industrial pressure. Concurrently, gross domestic product (GDP), population density (POP), and nighttime light index (NLI) serve as quantifiable indicators of socioeconomic development and the associated human footprint [31,32,33,34,35]. Together, these factors collectively drive habitat quality and provide essential metrics for rigorous ecological assessment and conservation planning. Accordingly, grounded in relevant scholarly work and regional realities, this research selected twelve explanatory variables across three domains: natural environment, human activities, and industrial influence. These included elevation (DEM), slope (SLOPE), annual precipitation (PRE), annual mean temperature (TEM), normalized difference vegetation index (NDVI), POP, GDP, NLI, industrial output value share (IOVS), industrial wastewater discharge (IWD), industrial sulfur dioxide emissions (ISDE), and industrial dust emissions (IFE) (Table 1) [27,28,29,30,31,32,33,34,35]. For data preprocessing, all datasets were standardized within the ArcGIS 10.7 platform. A 30 m grid resolution was adopted via the “WGS_1984_UTM_Zone_50N” map coordinate framework. Spatial corrections were also implemented to address geometric distortions and eliminate positional discrepancies across data sources.
Table 1.
Spatial data types, formats, and sources.
2.3. Research Designs
2.3.1. Habitat Quality Assessment
Habitat quality was evaluated via the InVEST model. Proposed collaboratively by Stanford University, Nature Conservancy, and the World Wide Fund for Nature, InVEST serves as a comprehensive tool for assessing ecosystem services across landscapes [36,37]. It operates at the landscape scale by linking land-use types with their sensitivity to external stressors, thereby estimating habitat degradation and overall habitat condition. The model integrates several key parameters, including land-use data for the target year, spatial and attribute data of threat factors, habitat suitability scores, the sensitivity of each habitat type to specific threats, and the half-saturation constant. Through these inputs, the model generates spatially explicit habitat quality outputs in raster format [38]. Habitat quality via InVEST varies between 0 and 1, where larger metrics denote improved ecological conditions and greater capacity to sustain biodiversity. The calculation can be expressed below:
where indicates the habitat quality index for grid x in land-use type j ( = 0~1); represents the habitat suitability level for land-use type ; indicates the semi-saturation constant, typically set to half the maximum habitat degradation value; z represents the normalization constant (z = 2.5); and indicates the habitat degradation degree of grid x in land-use type j, which is determined below:
where indicates the threat factor; indicates the number of threat factors; indicates all grid cells affected by the threat factor ; refers to the number of grid cells where the threat factor occurs in the land-use distribution map; represents the weight of the threat factor ; represents the number of threat factor grid cells per grid in the land-use map; indicates the distance decay function between threat factors and habitats, tending to display linear or exponential characteristics; indicates the accessibility under local government and legal protections; and indicates the sensitivity of land-use type to .
Building on the software guidelines and the specific context of Anyang, the following land-use types were identified as threat sources: cultivated land, urban land, rural residential land, industrial and mining land, and unused land. Model parameters were derived from the relevant literature [39,40,41,42,43,44,45] and were subsequently calibrated and localized to reflect the regional attributes of Anyang (Table 2). Habitat suitability and sensitivity to threat factors differ across land use categories. According to the literature, along with local ecological properties [42,43,44,45], corresponding values were reasonably assigned on a scale from 0 to 1 (Table 3).
Table 2.
Parameter settings for habitat threat factors in Anyang.
Table 3.
Habitat suitability and sensitivity of land-use types to major threat factors.
2.3.2. GeoDetector
GeoDetector is adopted for quantitatively analyzing spatial heterogeneity and identifying its underlying driving forces [46]. It has four core modules: factor detection, interaction detection, risk area identification, and ecological differentiation testing. This work adopted the first two modules—factor detection and interaction detection—for exploration of the primary drivers influencing the geographic pattern of habitat quality in Anyang. Additionally, these modules can be used to examine how different variables jointly contribute to spatial variation patterns. Within the factor detection module, the q-statistic can determine the explanatory power of each independent variable against habitat quality outcomes. This value quantifies the degree to which a specific driver influences spatial variation in habitat quality, and
where is the explanatory power of the influencing factor on habitat quality ( = 0~1); represents the stratification of influencing factors; and indicate the number of units in layer along with the entire region, respectively; and and indicate the variance values for the entire region with layer , respectively.
The interaction effect analysis module is employed for exploring the interdependencies among multiple independent variables and to assess how their integrated influence affects the geographic variation of the dependent variable. The approach facilitates assessment of whether joint factor effects lead to greater, lesser, or unchanged explanatory strength than when considered individually. Table 4 summarizes the detailed interaction analysis outcomes.
Table 4.
Classification of two-factor interaction types.
2.3.3. intPLUS Model
The intPLUS model, a patch-level land-use simulation framework developed within the CA system, advances beyond the original PLUS model by explicitly integrating the mutually promoting and inhibiting effects among land-use types into CA transition rules. This refinement enhances model fidelity and deepens our understanding of the underlying dynamics governing land-type competition. Structurally, the model includes three core components: the land expansion analysis strategy (LEAS), the intCARS-calibration module for optimizing parameters, and the intCARS-prediction module for projecting future land-use dynamics [47]. Additionally, the approach accommodates multi-scenario configuration, enabling comparative analysis of land-use changes under diverse development trajectories.
- (1)
- Neighborhood Weight Configuration: In intPLUS, neighborhood weights assess the spatial growth tendency of each land-use category. Varying between 0 and 1, larger values suggest greater expansion momentum, whereas lower values reflect more constrained growth. Initial expansion ratios were derived for each land-use type, after which the weights were iteratively tuned based on existing research and observed land development trends in Anyang [48,49]. The finalized neighborhood weight parameters are presented in Table 5.Table 5. Neighborhood weighting factors.
- (2)
- To assess the modeling precision of the intPLUS model, land-use datasets (2000–2010) in Anyang were used as the base for parameter calibration. After multiple rounds of parameter tuning and optimization, the model was employed to generate land-use predictions for 2020. Simulated outcomes were then compared with actual 2020 land-use data, resulting in a Kappa coefficient of 0.808 and a total classification accuracy of 0.895. The figures exceeded the generally accepted reliability benchmark of 0.750 for land-use simulations, demonstrating the model’s robust predictive capability. The validation outcomes indicate that the intPLUS model is effective in forecasting future land-use patterns as well as providing a reliable basis for projecting habitat quality in Anyang by 2030 [50,51].
- (3)
- Multi-Scenario Simulation Design: Drawing on the relevant literature [52,53] and aligned with policy documents such as the Anyang 14th Five-Year Plan for Ecological Environmental Protection and Ecological Economic Development, the Anyang Territorial Spatial Plan (2021–2035), and Anyang Ecological Protection Redline Ecological Environment Supervision Measures (Trial), this study synthesized regional development trends and ecological protection requirements to define four scenario-based spatial development pathways: natural development (S1), ecological protection (S2), urban construction (S3), and industrial green transformation + ecological restoration (S4).
Building on the actual conditions in 2020 and the planning directives outlined in Anyang’s forward-looking policy documents, transition probabilities were calibrated for each development trajectory (Table 6). With reference to the established literature and policy guidelines—and adjusted to reflect local conditions in Anyang—land-use conversion cost matrices were constructed for the four scenarios (Table 7).
Table 6.
Scenario settings for land-use simulation.
Table 7.
Conversion matrix settings under different scenarios.
2.4. Research Framework
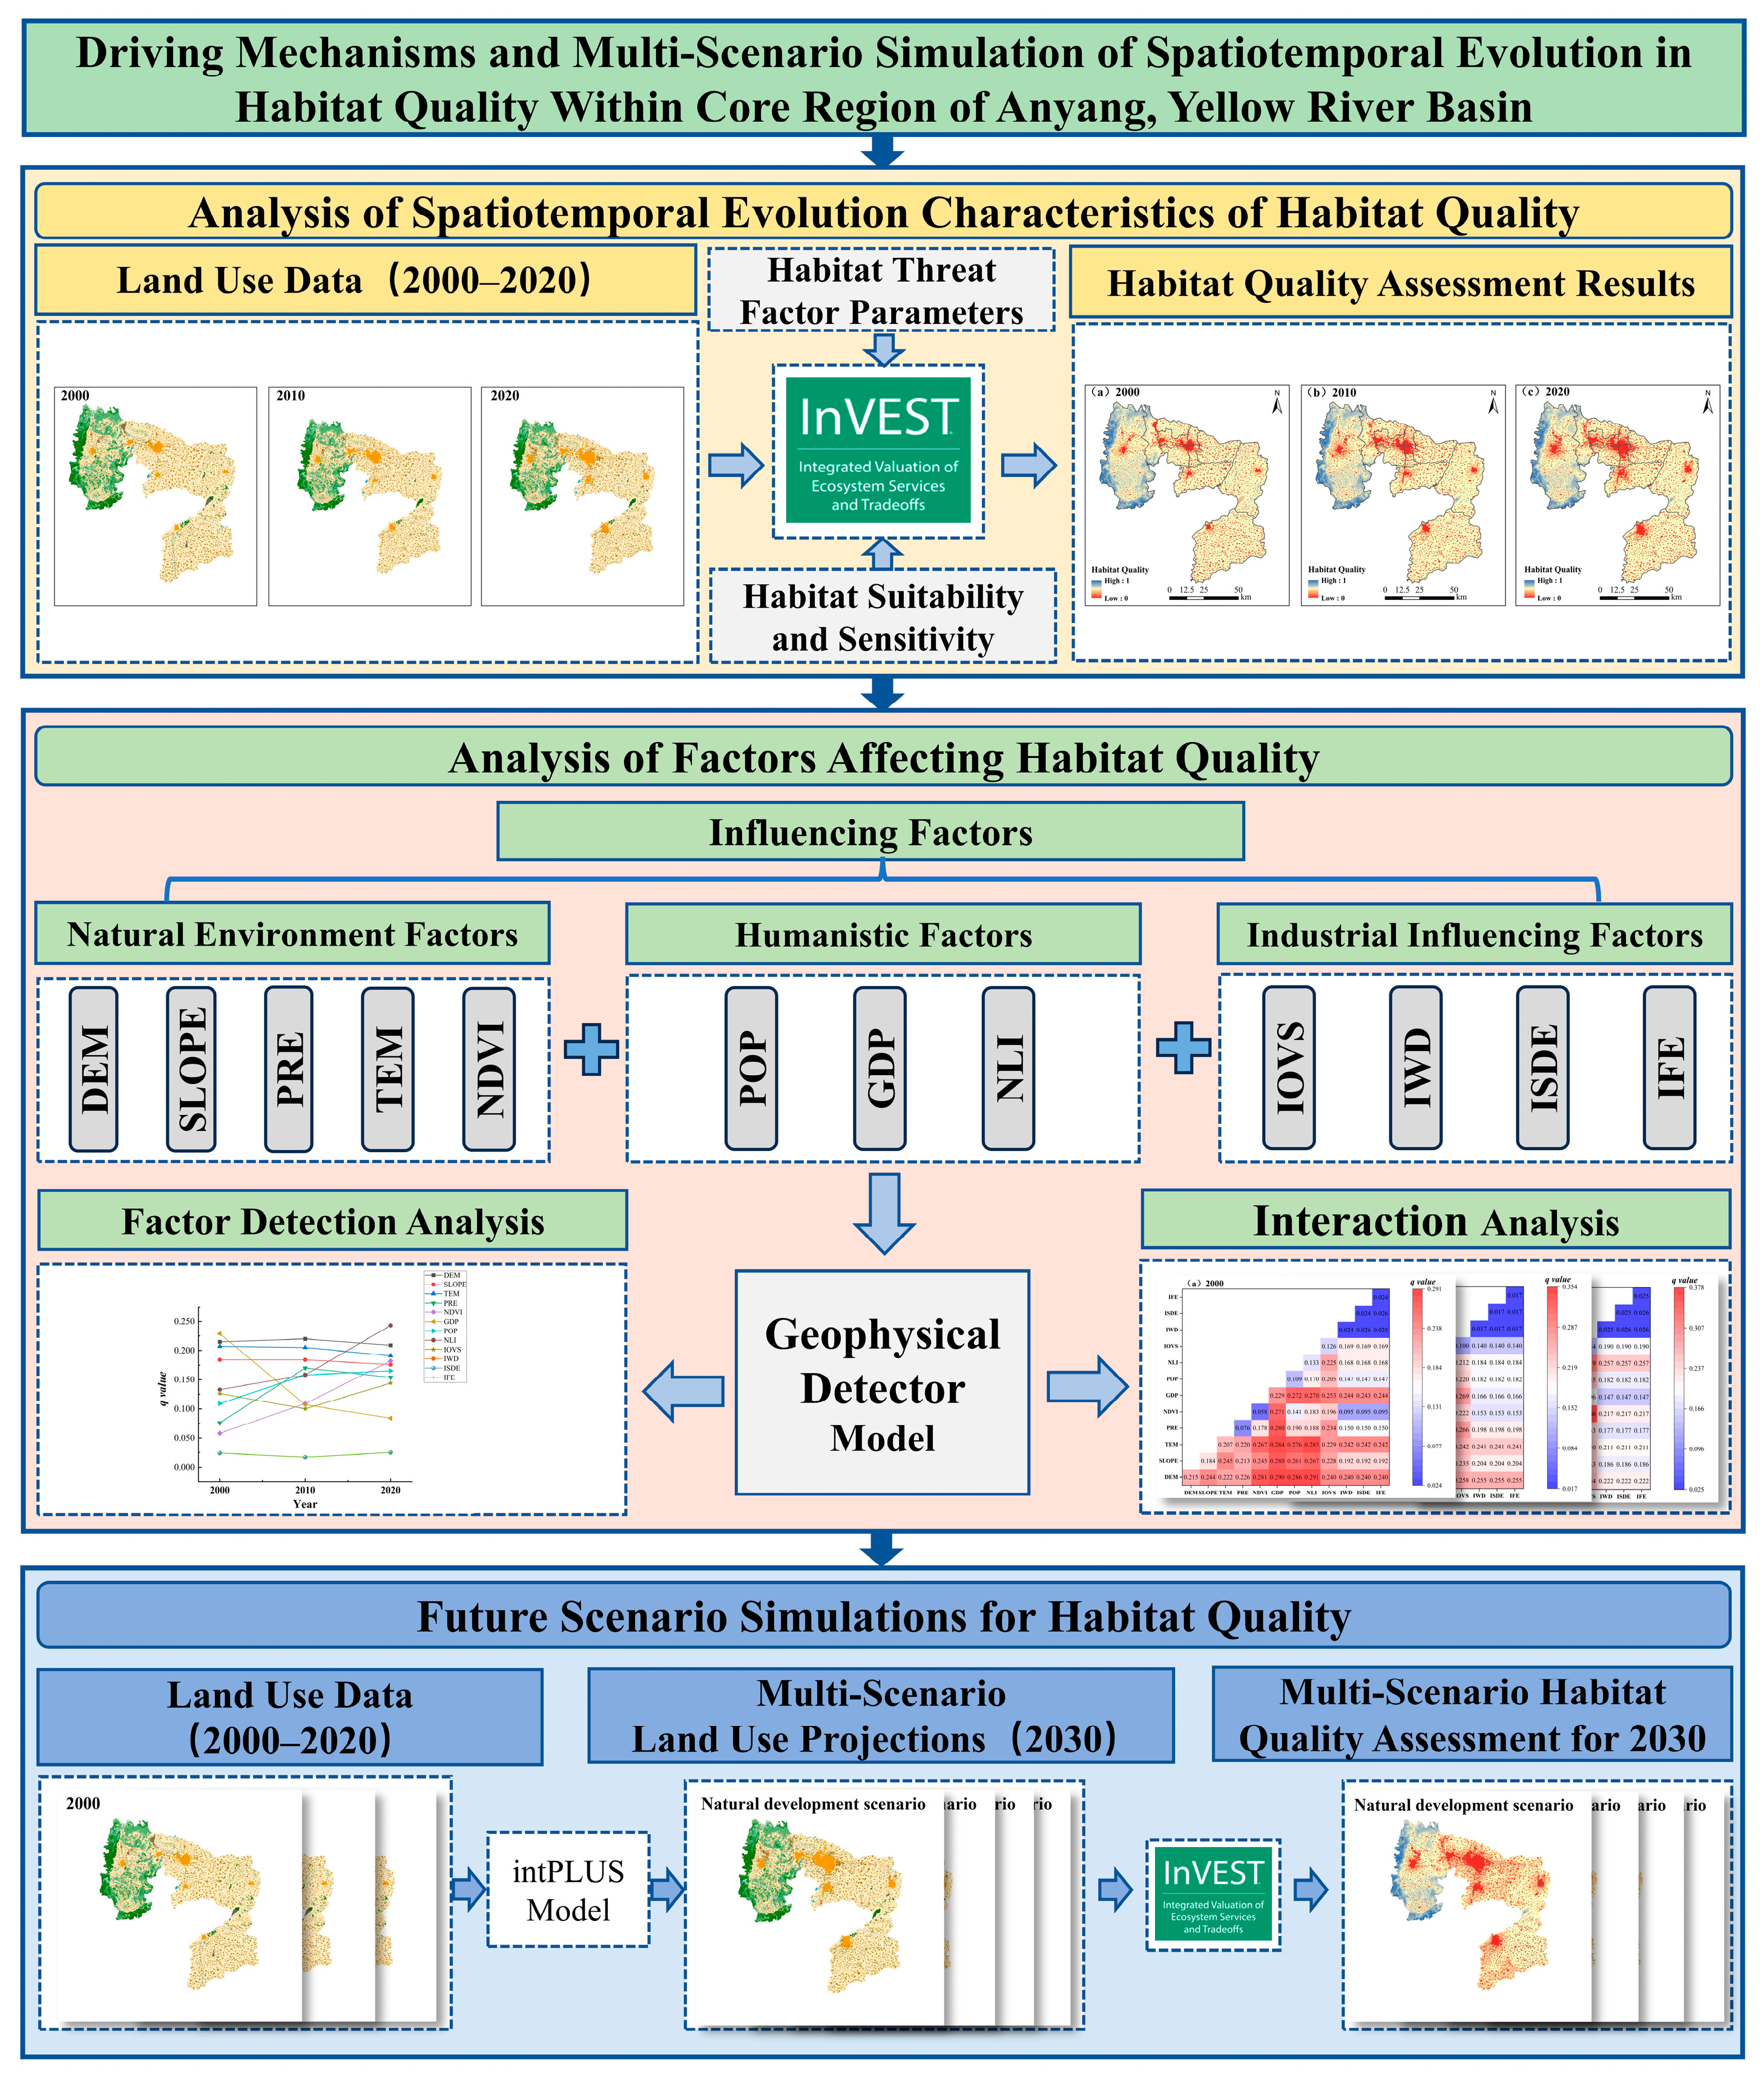
The analytical approach employed in this study was structured into three main phases. Firstly, the InVEST model was utilized for assessing the spatiotemporal evolution of habitat quality in Anyang over 2000–2020. Secondly, the GeoDetector technique was applied to determine the key influencing factors contributing to variations in habitat quality throughout the same timeframe. Thirdly, a coupling of the intPLUS and InVEST models was implemented to conduct scenario-driven simulations and forecasts of future habitat conditions. The complete research framework and workflow are presented in Figure 2.
Figure 2.
Conceptual framework and analytical workflow.
3. Results
3.1. Spatiotemporal Characteristics of Habitat Quality in Anyang
3.1.1. Chronological Trends of Habitat Quality
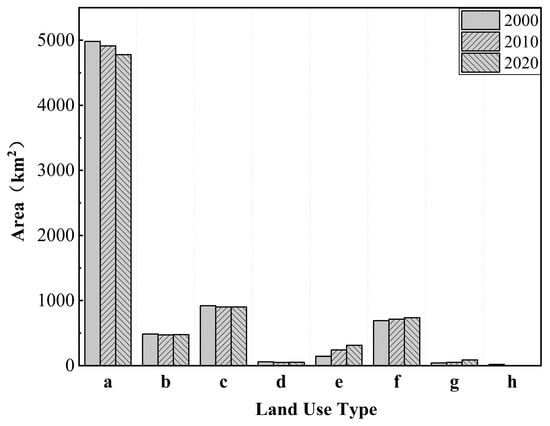
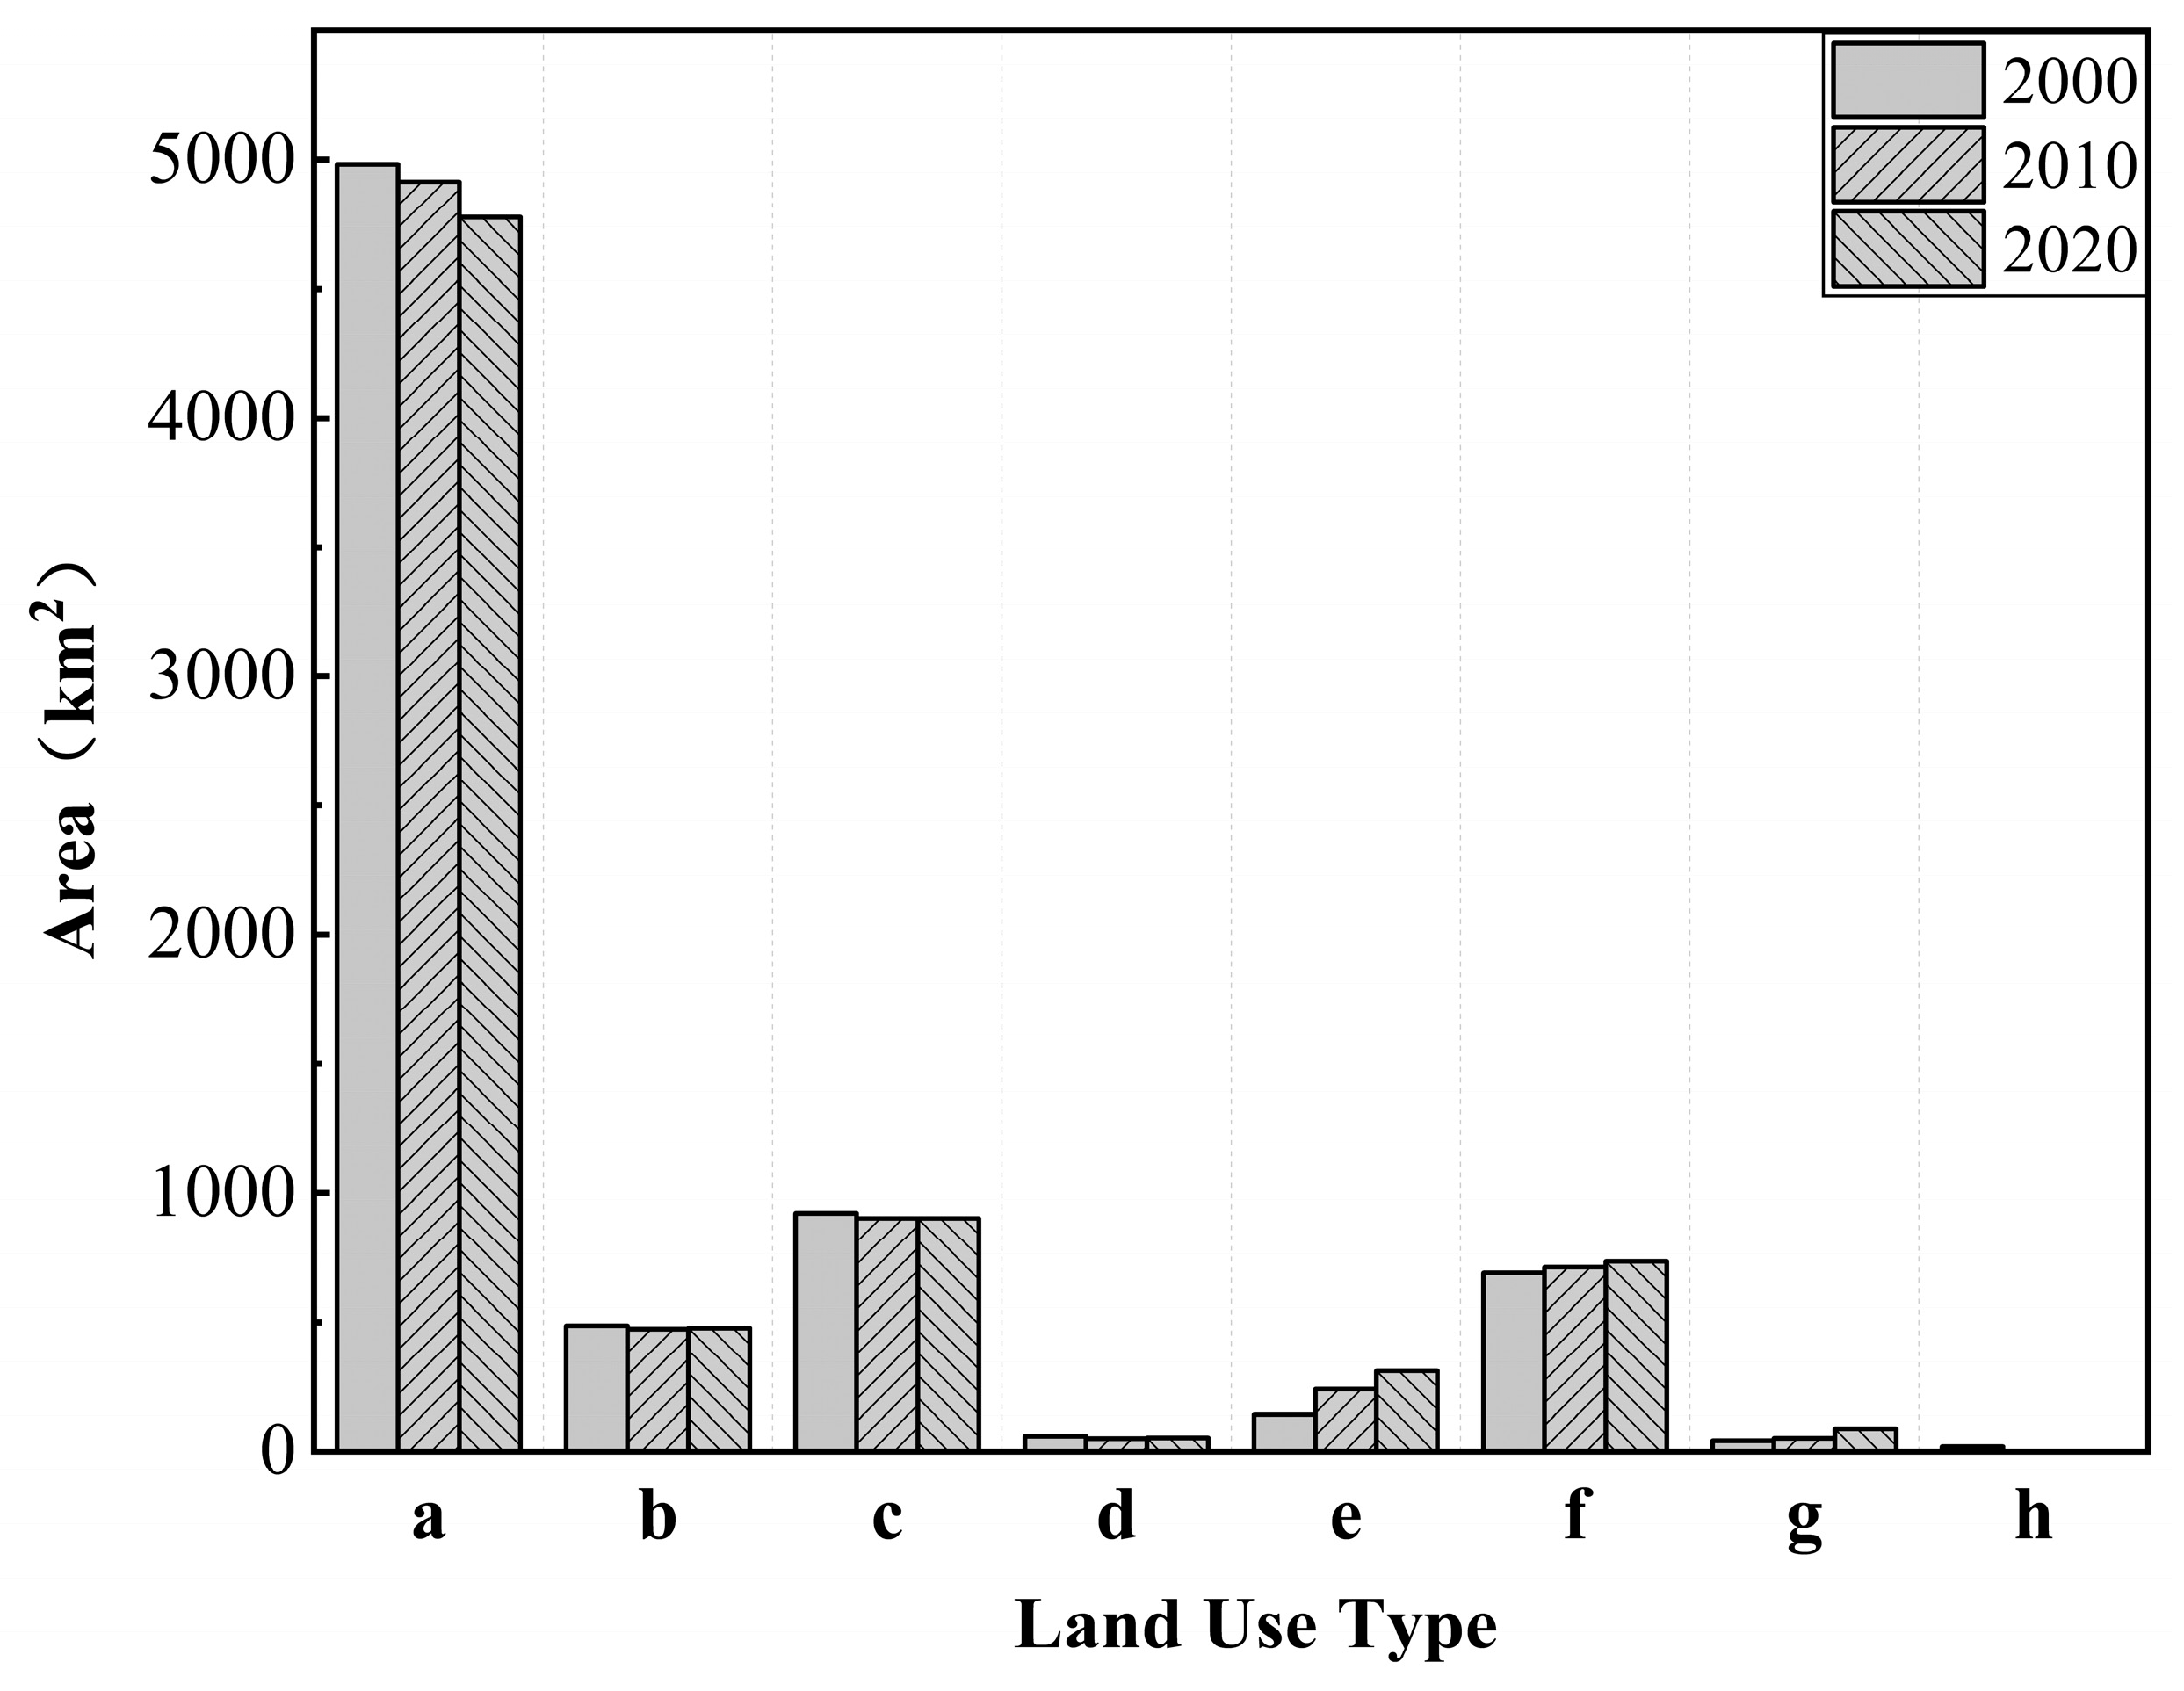
Average habitat quality index for Anyang was 0.451 in 2000, 0.440 in 2010, and 0.426 in 2020, with rates of change of 2.44% (2000–2010) and 5.54% (2010–2020). Overall, habitat quality in Anyang displayed a consistent reduction during the 20-year analysis window. The analysis of land-use distributions across the three time points (Figure 3) shows that built-up land—including urban, rural residential, and industrial and mining areas—expanded by 129.38 km2 in 2010 and by 260.60 km2 in 2020 relative to the 2000 baseline of 875.54 km2, reflecting sustained and rapid anthropogenic land-use expansion. The scale and pace of built-up land growth are considered critical drivers of habitat degradation in the region.
Figure 3.
Variations in land-use area by type in Anyang (2000–2020). Note: a–h denote land-use types as follows: a = cultivated land, b = forest land, c = grass land, d = waterbodies, e = urban land, f = rural residential land, g = industrial and mining land, and h = unutilized land.
To further quantify spatial and temporal changes in habitat quality, the habitat quality index was classified into five tiers according to widely adopted thresholds: low-quality [0–0.2], relatively low-quality (0.2–0.4], medium-quality (0.4–0.6], relatively high-quality (0.6–0.8], and high-quality zones (0.8–1] [41,42,43,44,45]. The analysis of variations in the area and the fraction of each tier (Table 8) shows that from 2000 to 2020, the combined share of low- and relatively low-quality habitats in Anyang increased markedly from 16.84% to 22.75%. In particular, the fraction of low-quality zones rose from 11.96% to 15.53%, representing a net increase of approximately 262 km2. This trend underscores the continuing pressure exerted on habitats by rapid urban and industrial expansion. Medium-quality habitats remained dominant throughout the period, despite their share declining from 71.23% in 2000 to 66.13% in 2020, while the decreasing trend has become less pronounced in the previous decade. The fraction of relatively high-quality zones remained stable at around 8%, showing a slight rebound in 2010. Land-use data (Figure 3) indicate that this recovery coincided with an increase in ecological land covers (e.g., forest land, grass land, and waterbodies), likely driven by regional conservation and restoration initiatives. Examples include the “Clear Water Project” launched in 2010 and the initiation of the Anyang Environmental Protection Development Plan for the Eleventh Five-Year Plan, which helped mitigate ecological degradation and support functional recovery. High-quality zones accounted for the smallest proportion, fluctuating at around 3%, reflecting both the scarcity and inherent stability of top-tier habitat types.
Table 8.
Temporal variation in habitat quality area and proportion levels in Anyang (2000–2020).
3.1.2. Spatial Changes in Habitat Quality
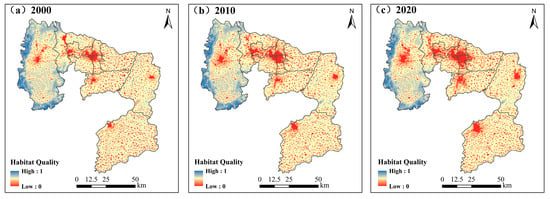
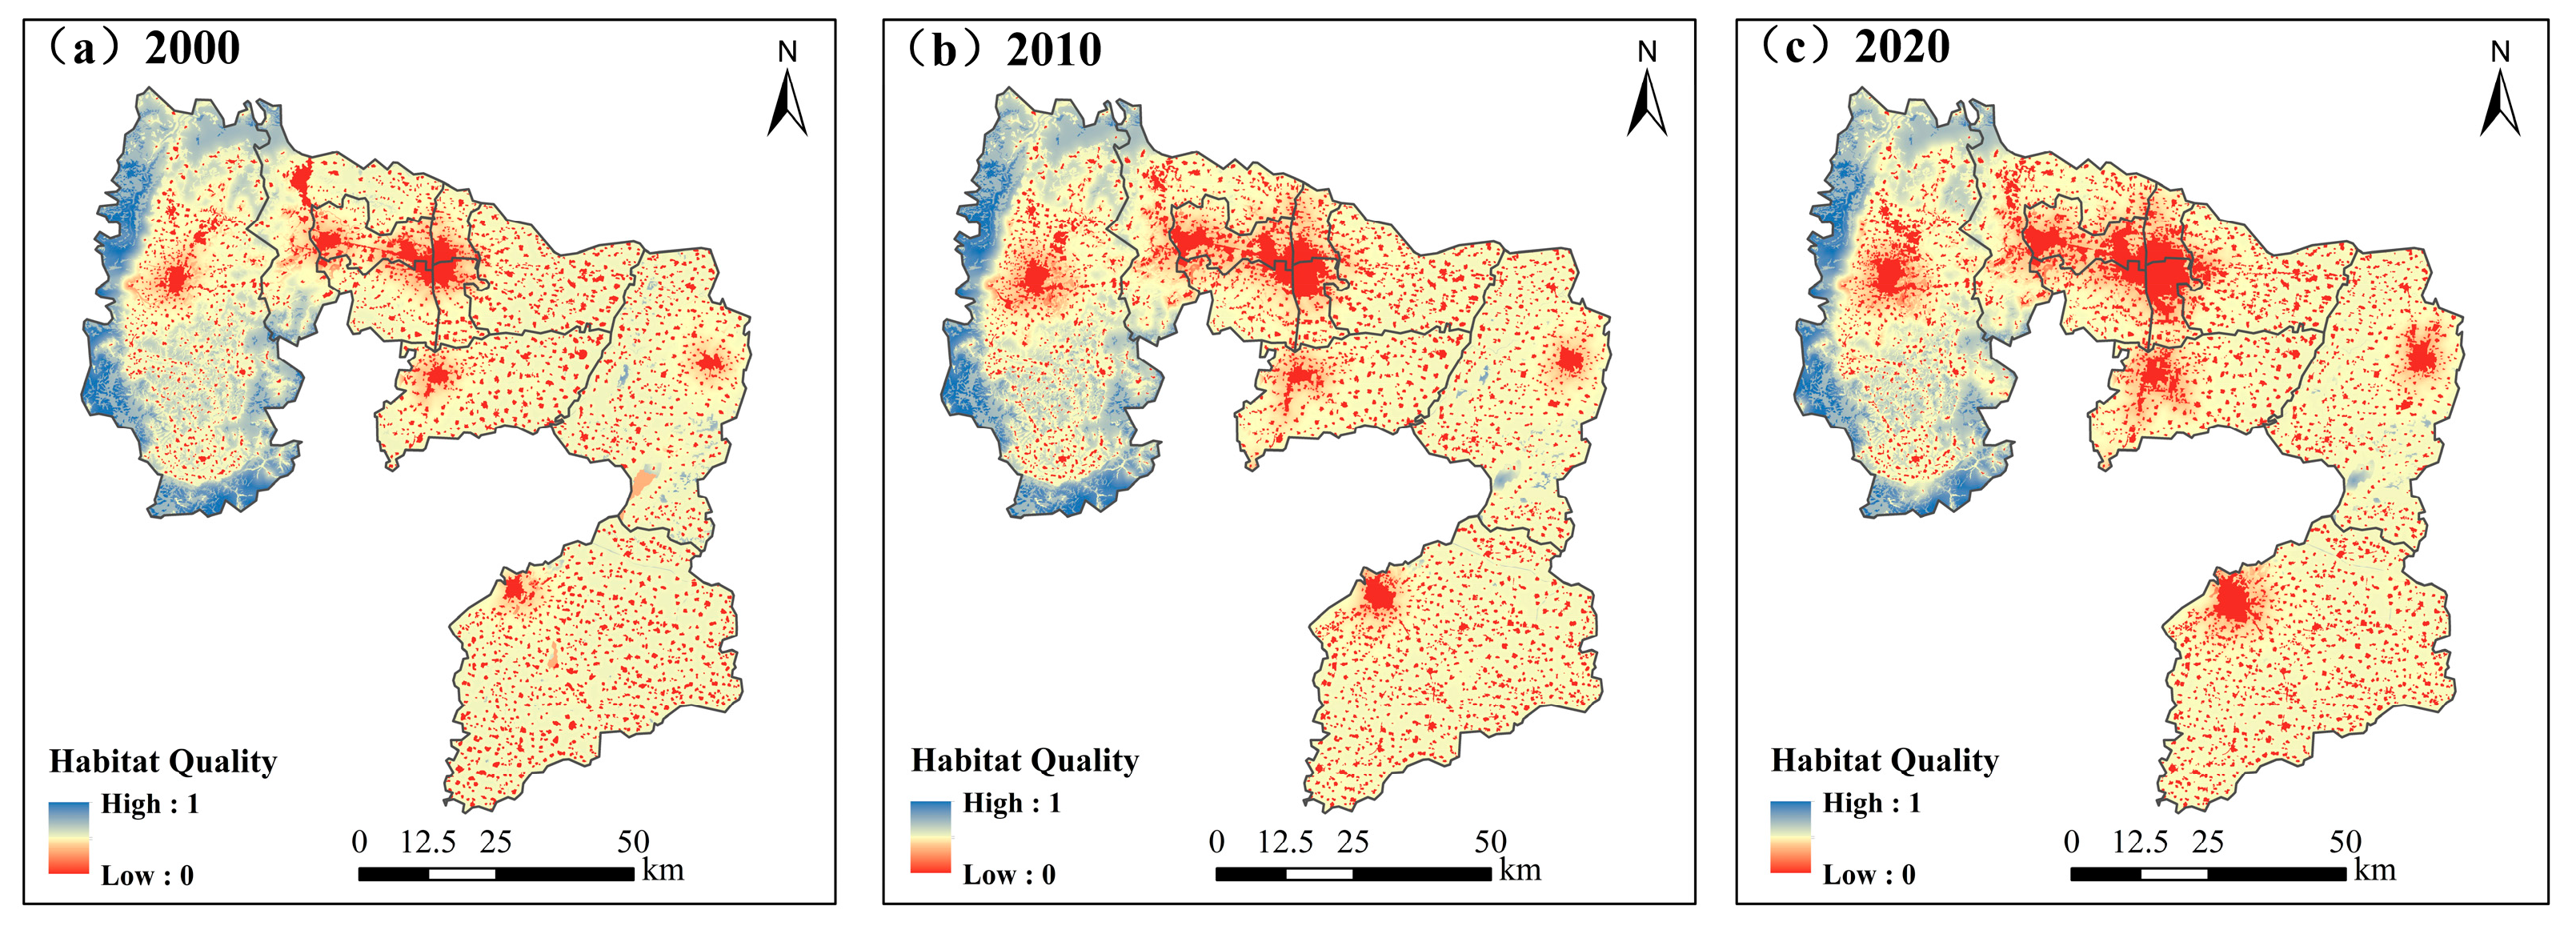
Habitat quality in Anyang displays substantial spatial heterogeneity, following a recognizable characteristic of “higher quality in the west, lower in the east, with mountainous areas superior to plains” (Figure 4). High-quality zones are primarily distributed in the northern, western, and southern areas of Linzhou, where an elevated topography, limited anthropogenic disturbance, well-preserved vegetation communities, and high vegetation coverage collectively contribute to enhanced habitat conditions. These peripheral high-value areas often form continuous, belt-like spatial patterns, while the central urban and lowland regions exhibit a more fragmented and interlaced configuration of medium- and low-value patches. Notably, substantial clusters of mid-to-high habitat quality are found along the Xi River, Qi River, and their confluence, closely corresponding to the boundaries of the Henan Linzhou Qi-Xi River National Wetland Park. The ongoing implementation of wetland conservation and ecological restoration projects in this area has significantly improved habitat integrity, reinforcing the spatial aggregation of high-quality ecological zones.
Figure 4.
Geographic pattern of habitat quality in Anyang (2000–2020).
Areas with lower habitat quality in Anyang are widely distributed in fragmented patches across Anyang County, Long’an District, Beiguan District, Wenfeng District, Yindu District, Tangyin County, Neihuang County, and Hua County. These low-value zones are densely embedded in a dotted spatial pattern, primarily dominated by the land-use types of cultivated land and construction land. Larger contiguous areas of low habitat quality are distributed in urban cores of these administrative regions, along with a continuous trend of spatial expansion. This deterioration is closely associated with the city’s urban development trajectory. Since 2003, Anyang has explicitly aimed to transform itself into a “regional center city in northern Henan”, promoting urban expansion through the strategic concentration of population, industry, and capital. This objective has catalyzed substantial land development, particularly in and around core urban areas. The 2016 introduction of the “One Return, Six Major Initiatives” further entrenched economic growth as a central policy priority. As a result, a surge in industrial projects, coupled with the construction of economic development zones and industrial clusters, has placed increasing pressure on land resources. This accelerated growth of urban and industrial land has directly induced habitat disruption and degradation, posing serious challenges to the ecological resilience within the area.
3.2. Influencing Factors of Habitat Quality
3.2.1. Factor Detection Analysis
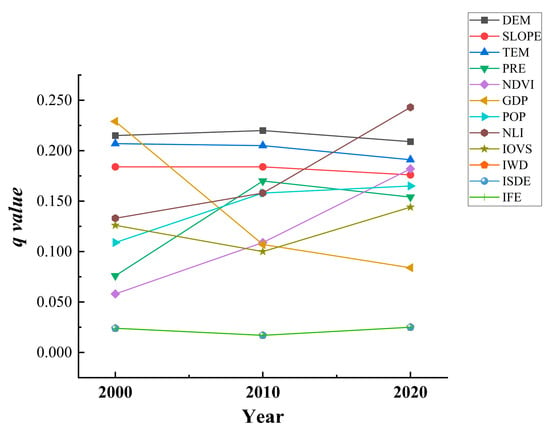
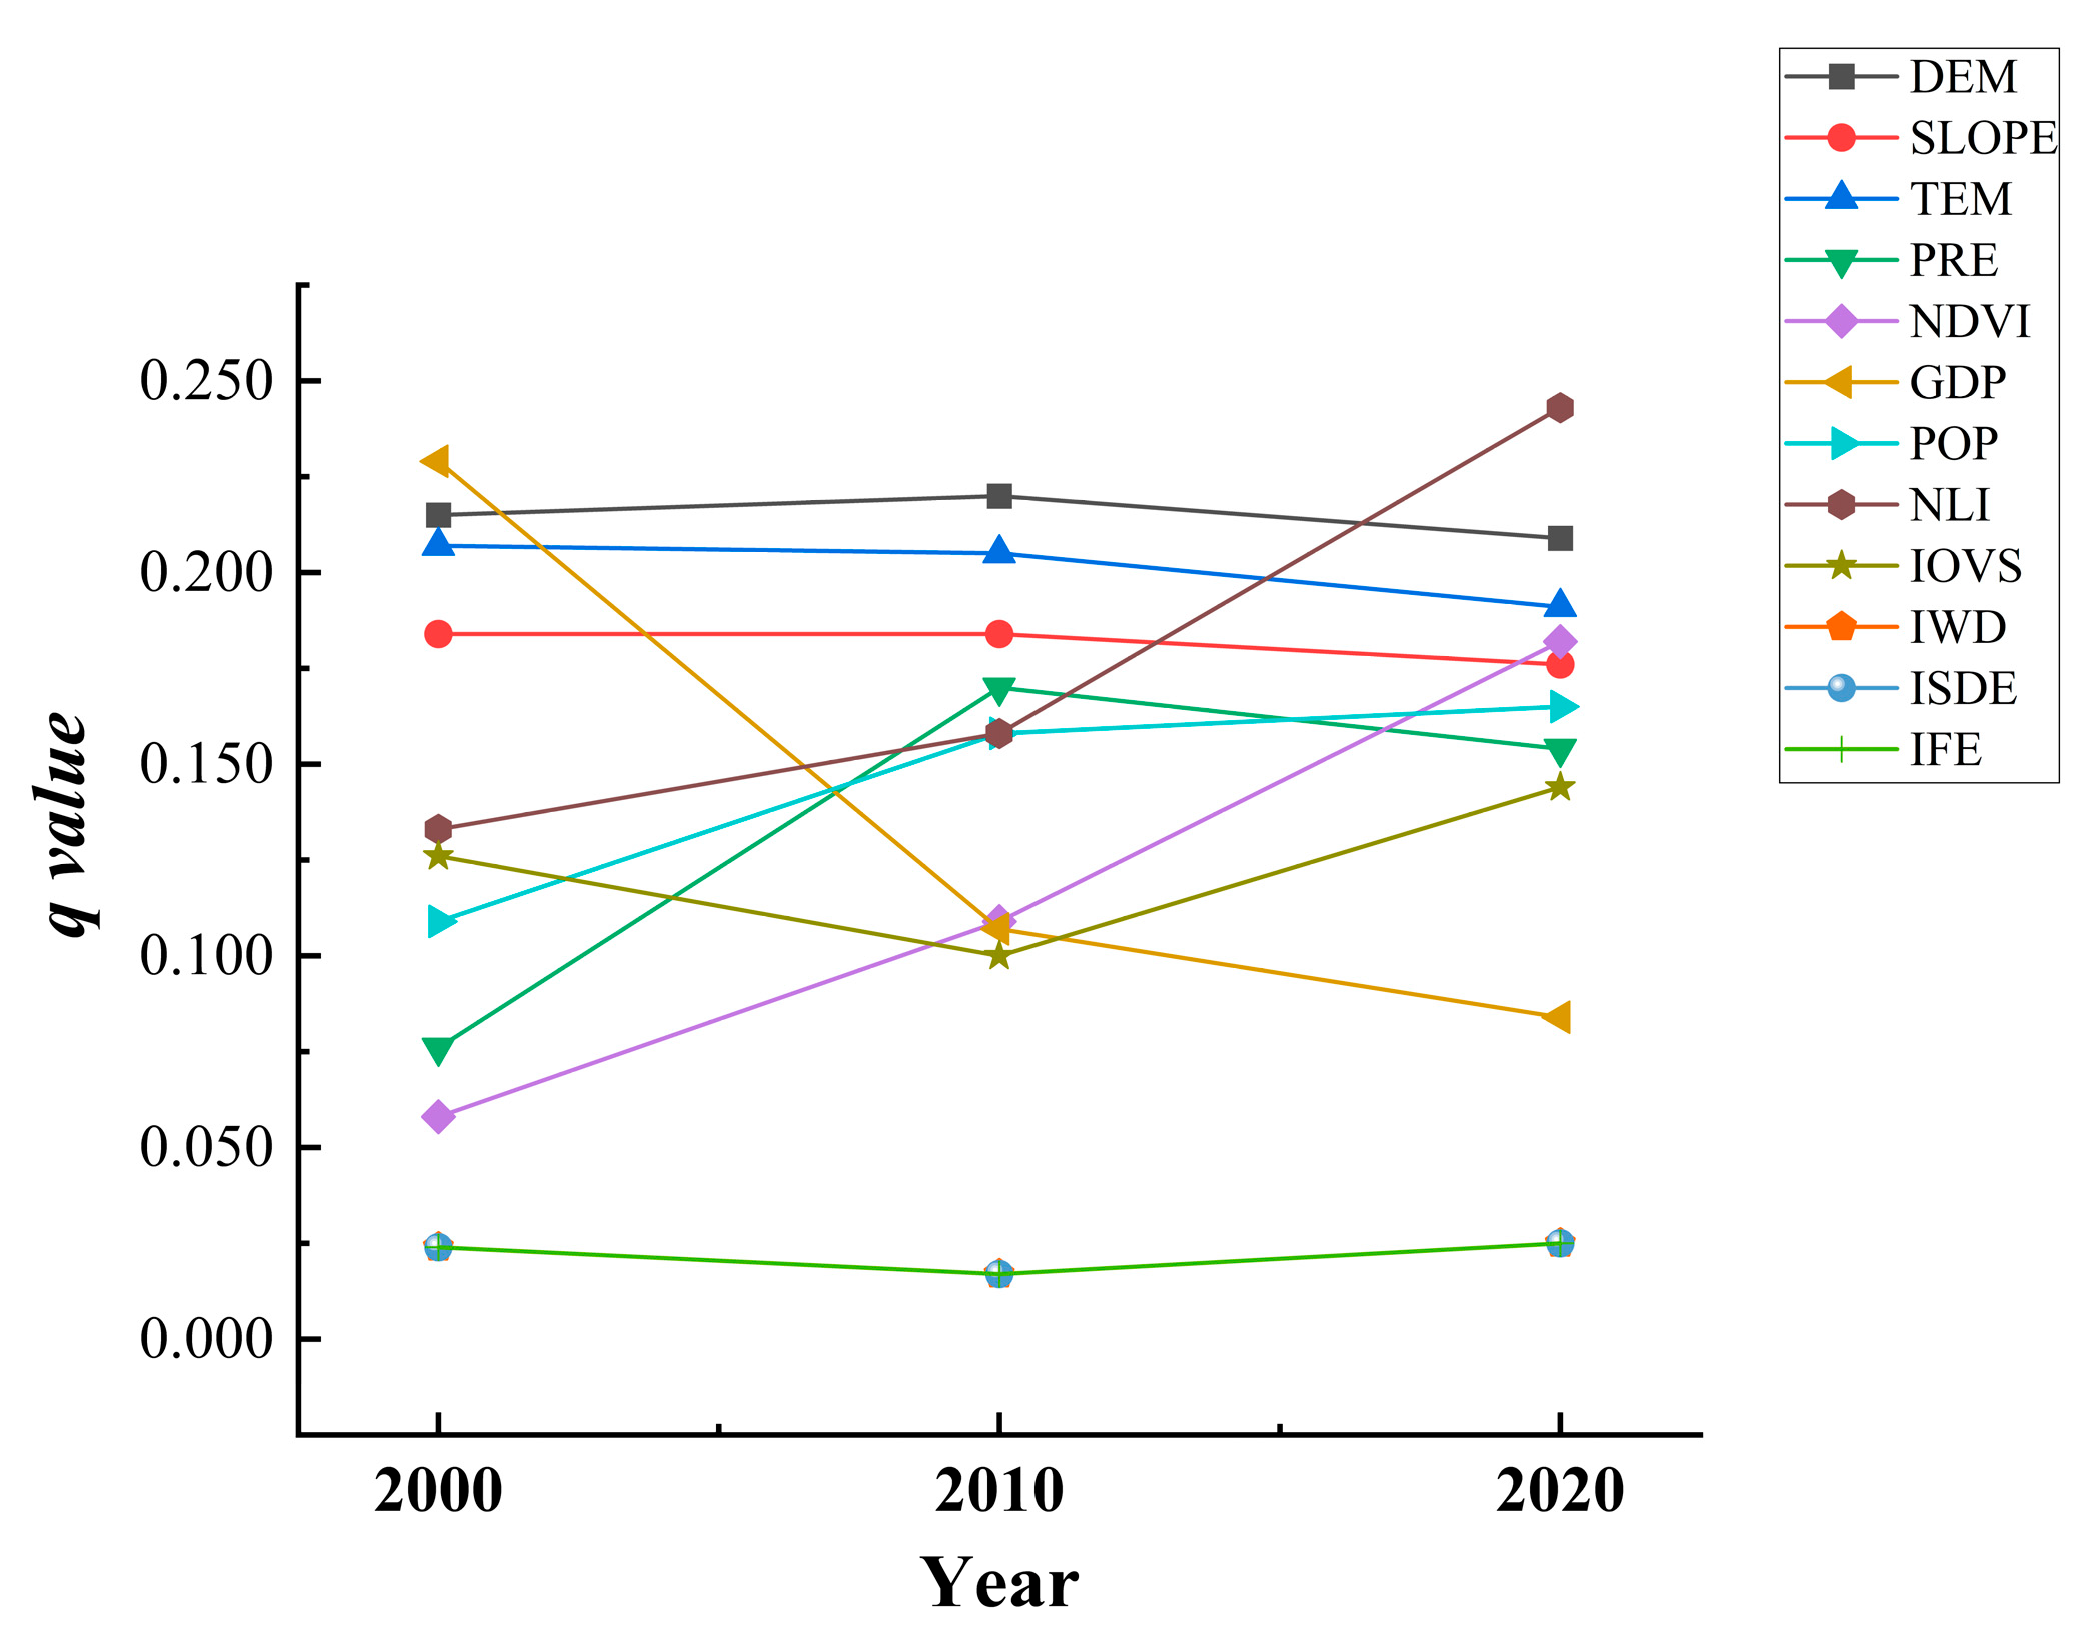
Between 2000 and 2020, spatiotemporal alterations in habitat quality across Anyang were markedly evident, driven by the intertwined effects of environmental factors, anthropogenic pressures, and the process of industrialization. Analysis using the Geodetector model (Figure 5) confirmed that all selected drivers were statistically significant (p = 0.01) across the observation window. The explanatory power (q-values) of elevation and slope remained consistently high with minimal interannual variation, reflecting the role of terrain in establishing the fundamental spatial structure of habitat quality by mediating both human accessibility and local hydrothermal conditions. TEM also maintained high and stable explanatory power (q ≈ 0.207~0.191), while the influence of PRE increased steadily from 0.076 to 0.154. Together, these findings underscore the persistent and growing modulating influence of hydrothermal gradients as foundational natural drivers of habitat quality.
Figure 5.
Influencing factors of habitat quality in Anyang (2000–2020).
The q-value for NDVI rose nearly threefold from 0.058 to 0.182. This pronounced increase aligned temporally with systematic ecological restoration initiatives implemented in Anyang after 2010, indicating that sustained afforestation and ecological rehabilitation have enhanced the role of vegetation cover in explaining spatial variations in habitat quality.
In 2000, GDP emerged as the strongest single explanatory factor (q = 0.229), highlighting a close spatial coupling between economic development and habitat degradation during that period. Its influence, however, declined markedly in subsequent years (q = 0.107 in 2010 and 0.084 in 2020), suggesting a shift in the ecological pressure exerted by economic growth, from early, localized hotspots of encroachment toward a more diffuse and spatially homogeneous pattern. In contrast, both POP and NLI—human activity indicators—showed consistently increasing explanatory power. By 2020, NLI reached the highest q-value among all factors (0.243), signaling that physical urban expansion and the distribution of human settlements have superseded aggregate economic output as the primary anthropogenic drivers of habitat degradation.
Meanwhile, the explanatory power of industrial output share rose steadily (0.126~0.144), whereas that of industrial “three wastes” emissions remained very low (~0.02). This contrast suggests that industrial impacts on habitats are currently tied more to spatial land occupancy and structural footprint than to end-of-pipe emission intensity, reflecting partial success in pollution control while underscoring that industrial land expansion remains a persistent source of pressure.
In summary, spatial differentiation in habitat quality across Anyang has resulted from the coordination of stable biophysical systems and fluctuating socioeconomic factors. The dominant driver has evolved from an early “economic growth-led” model to a new regime jointly shaped by urban spatial expansion and ecological restoration initiatives. These insights provide a critical scientific foundation for formulating differentiated spatial governance policies in the future.
3.2.2. Interaction Analysis
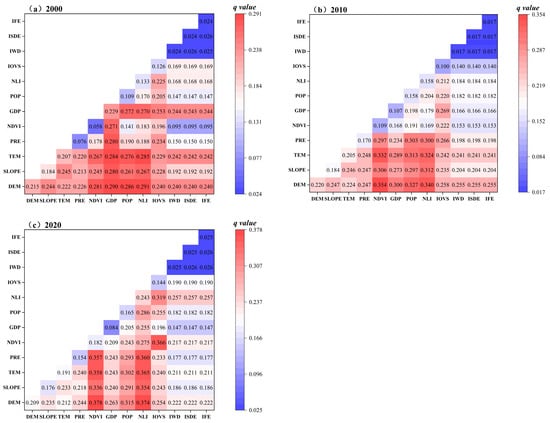
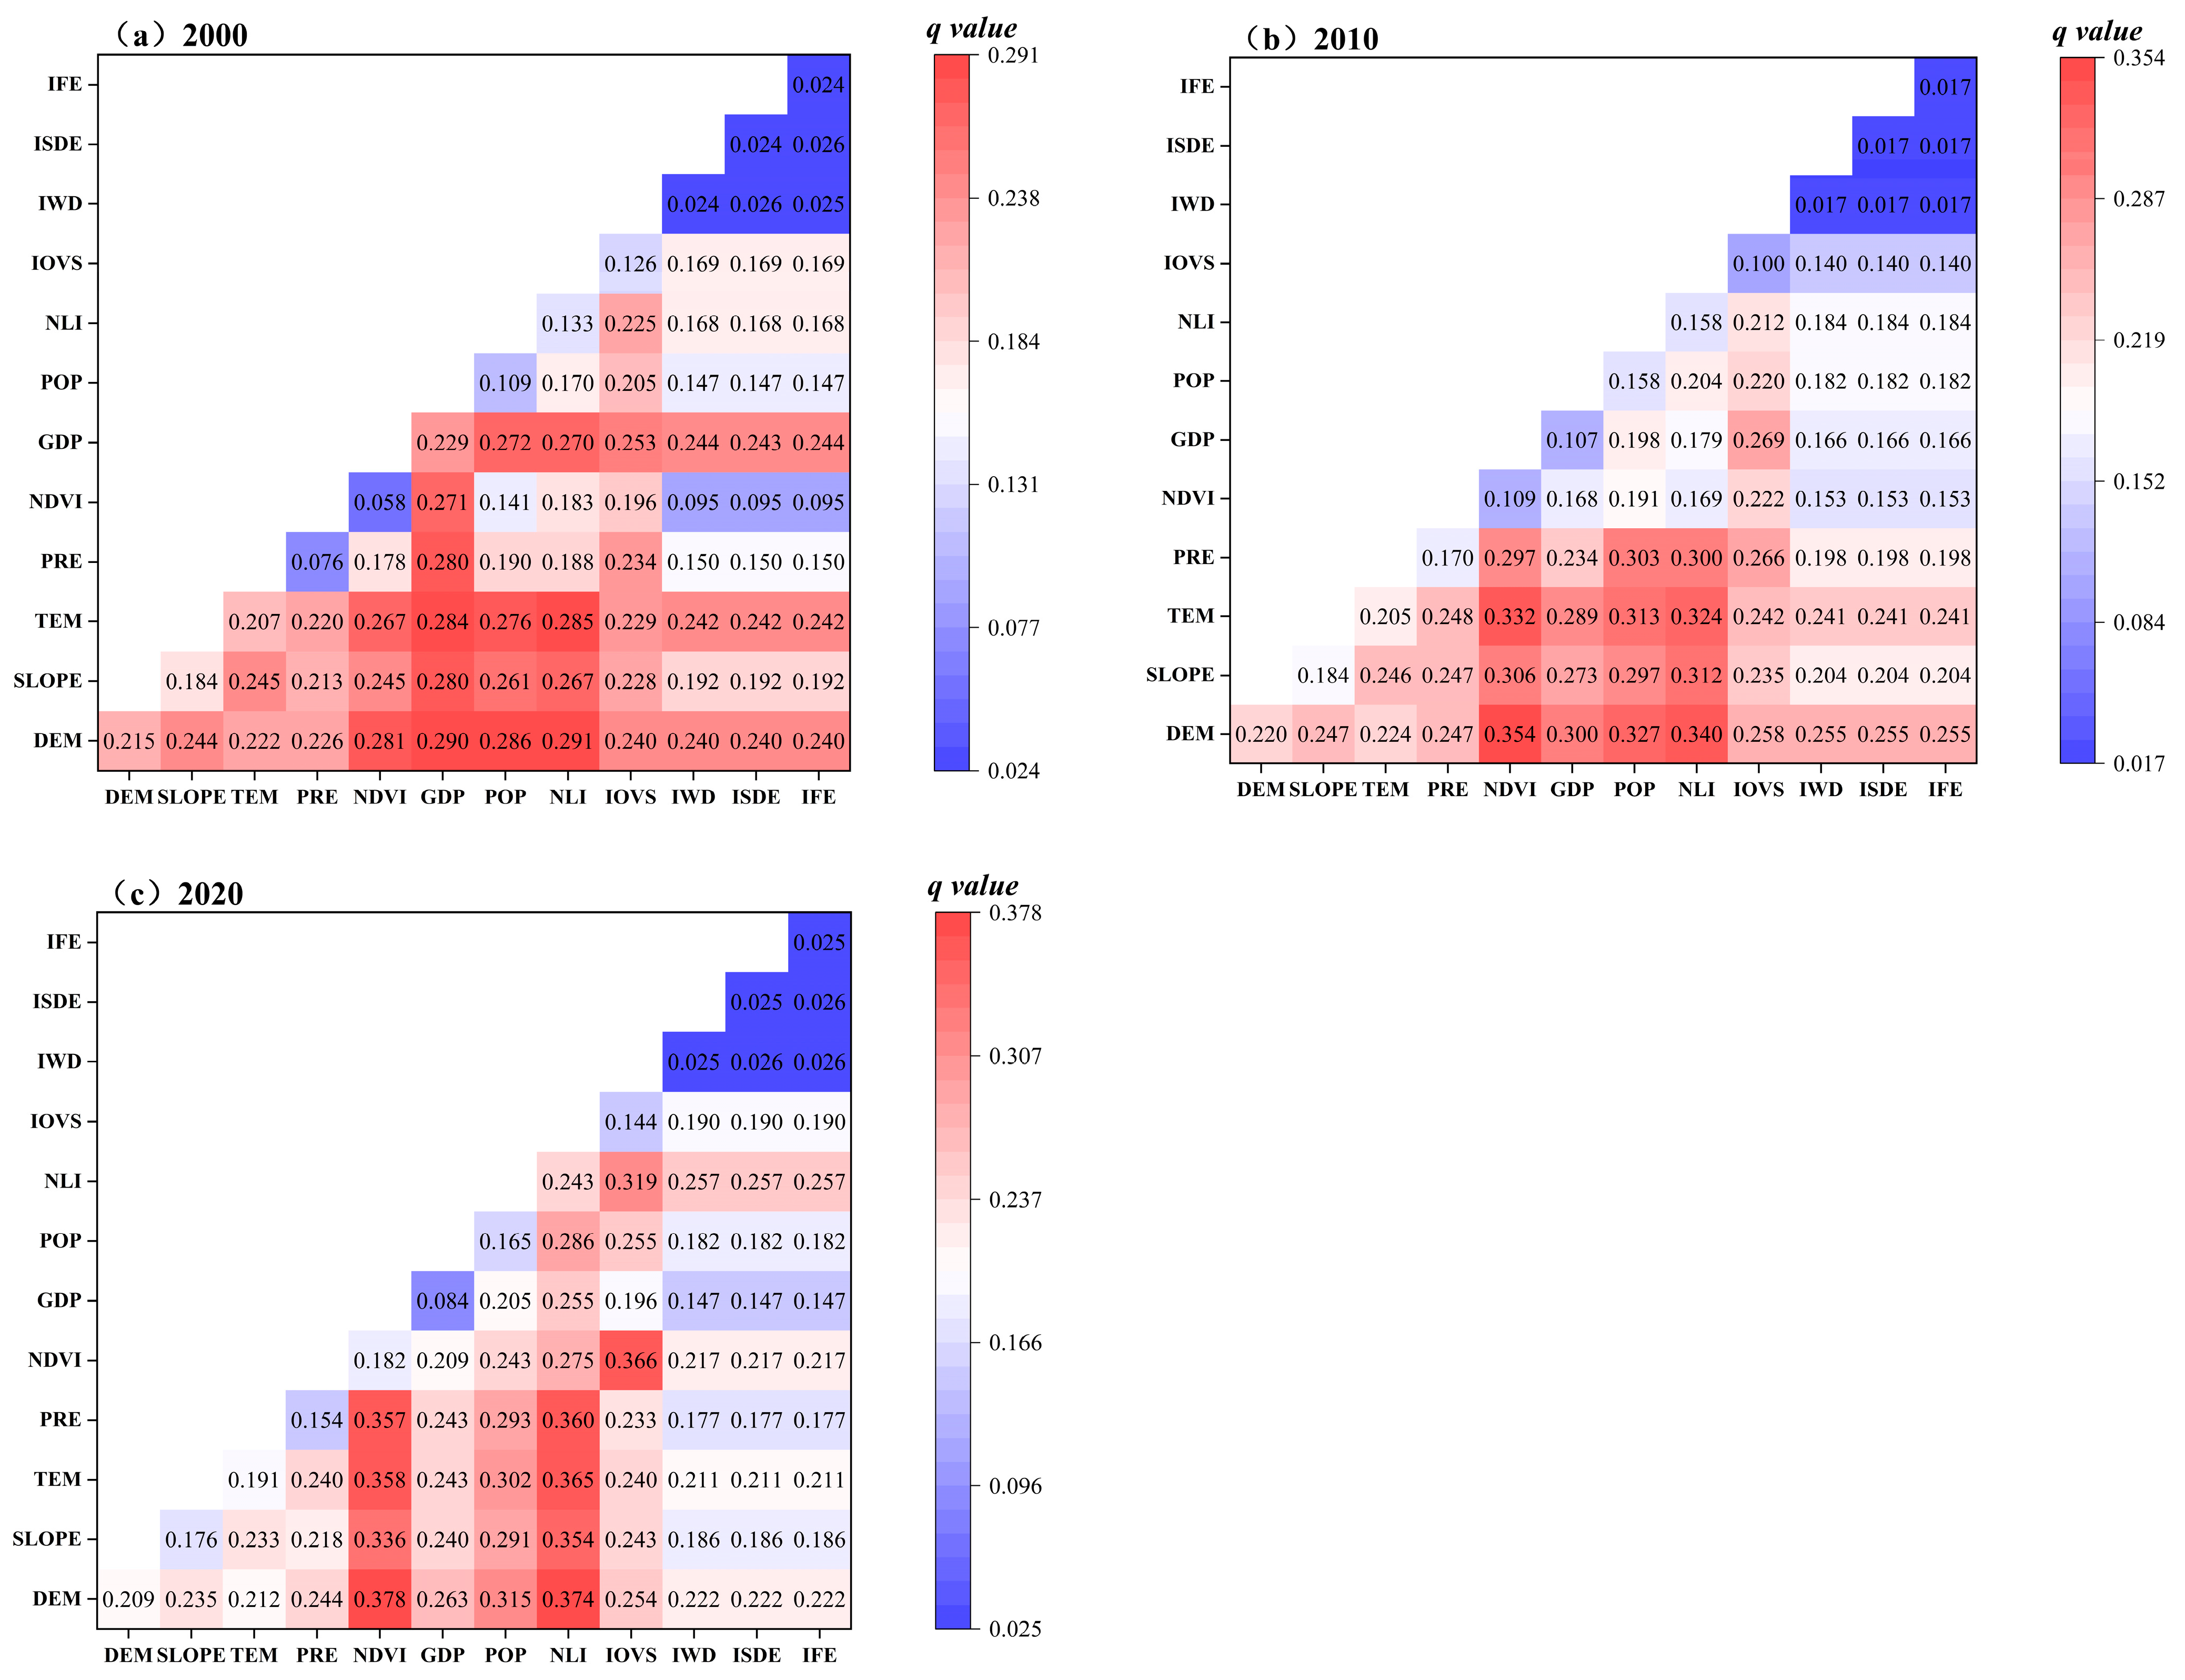
The interaction analysis of habitat quality in Anyang (Figure 6) shows that 12 influencing factors display combined intensification or nonlinear response patterns when pairwise interactions are examined, indicating that their combined explanatory power exceeds that of any single factor. In 2000, the coupling between altitude and NLI intensity showed the highest explanatory power (0.291), followed closely by elevation and GDP (0.290), highlighting the dominant role of terrain and human-induced factors in shaping spatial habitat differentiation during this period. By 2010, the overall interaction strength increased. The elevation–NDVI interaction emerged as the strongest (0.354), while elevation–nighttime light remained highly influential (0.340), reflecting the growing importance of vegetation status in habitat quality formation. By 2020, elevation–NDVI continued to lead (0.378), followed by elevation–nighttime light (0.374), underscoring the increasing relevance of vegetation distribution to ecological conditions in recent years.
Figure 6.
Interaction effects of habitat quality interactions in Anyang (2000–2020).
In summary, elevation and NDVI establish the baseline for spatial heterogeneity in habitat quality, whereas economic development reshapes habitat patterns through its influence on the spatial intensity of human activities. These nonlinear interactions among natural, anthropogenic, and industrial factors reveal the complexity of ecosystem responses to multiple stressors and offer key insights for building regional ecological security patterns.
3.3. Multi-Scenario Simulation and Prediction of Habitat Quality in Anyang
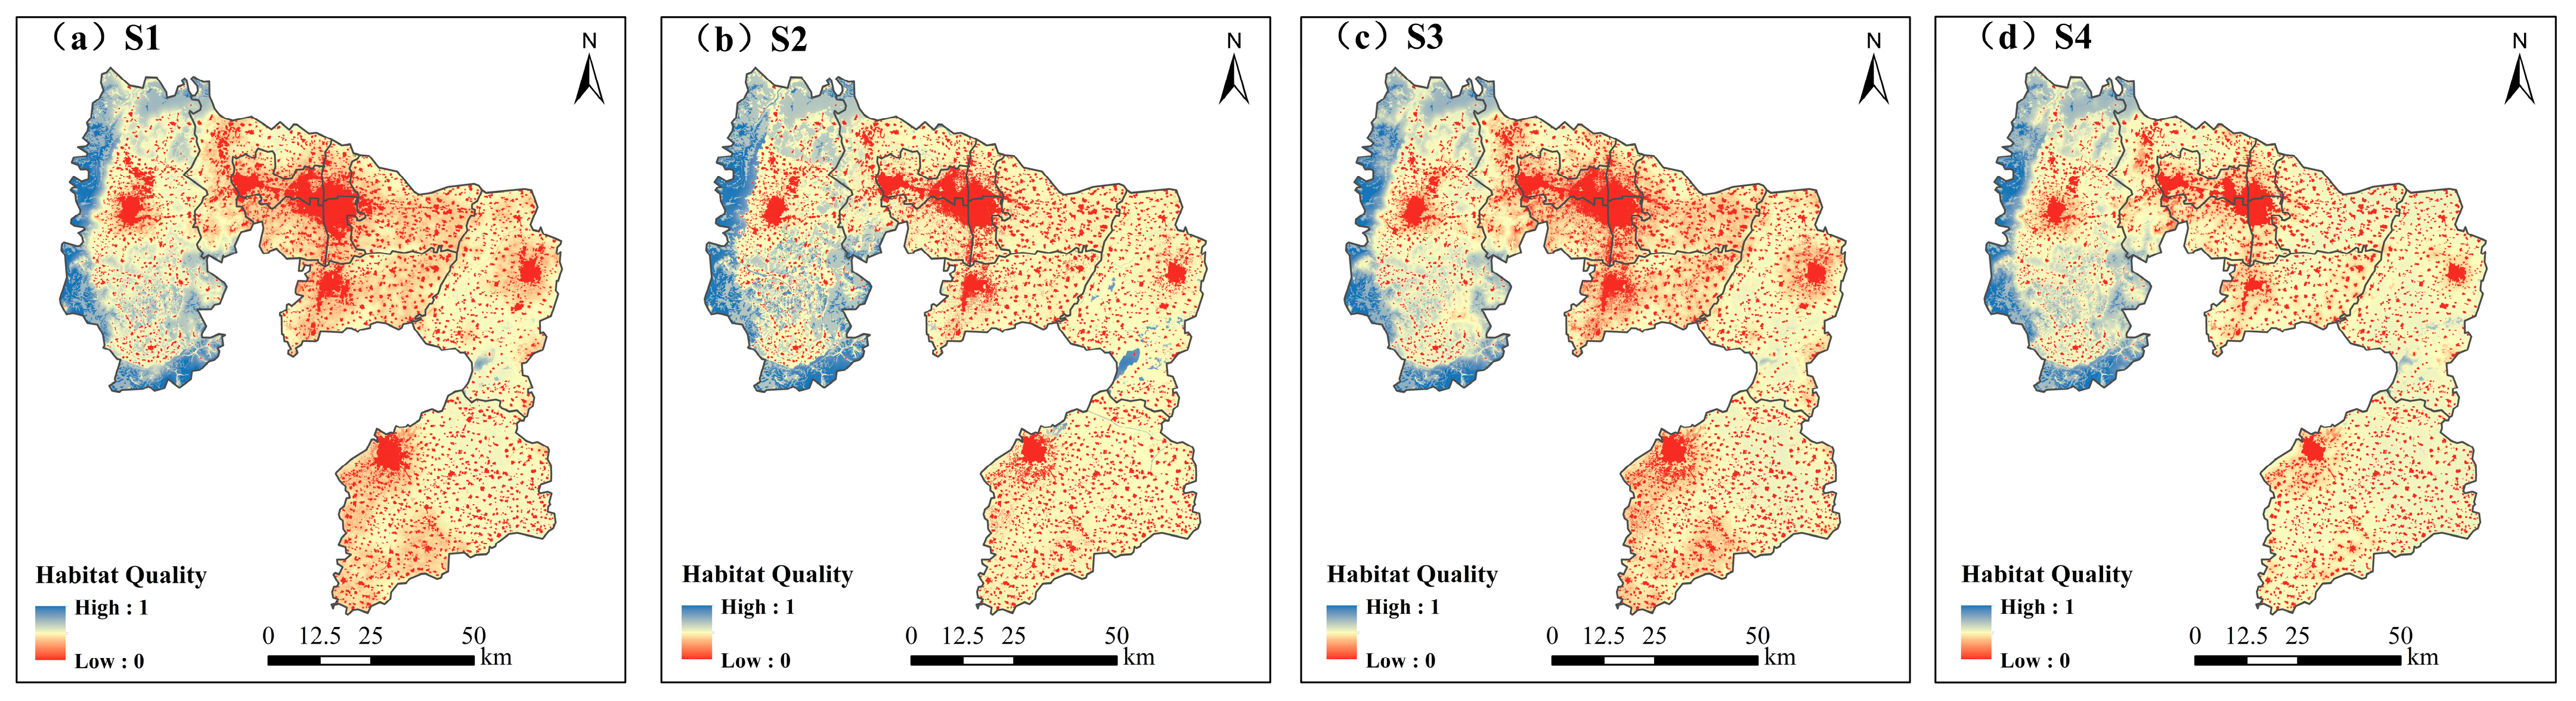
This work simulated habitat quality in Anyang in 2030 with four scenarios—natural development, ecological conservation, urban construction, and industrial green transformation + ecological restoration—by coupling land-use projections from the intPLUS model with habitat quality evaluation via the InVEST model. The outcomes reveal that the geographic pattern of habitat quality remained generally stable across all scenarios, consistently reflecting the 2020 spatial structure as “higher quality in the west, lower in the east, and better conditions in mountainous areas than in plains” (Figure 7). Significant differences were observed in average habitat quality indices among scenarios: the ecological conservation scenario reached 0.454, exceeding the 2020 baseline of 0.426, indicating that stringent conservation policies can effectively curb and reverse habitat degradation. The industrial green transformation + ecological restoration scenario achieved a mean of 0.429, showing slight improvement over 2020 and demonstrating that ecological restoration combined with economic development can support gradual recovery. In contrast, the natural development and urban construction scenarios recorded means of 0.388 and 0.376, respectively, both below the 2020 level, indicating continued habitat decline in the absence of targeted interventions. Overall, ecological conservation represents the most effective pathway for enhancing regional habitat quality, while the integrated model of industrial green transformation and ecological restoration offers a viable approach to balancing economic growth with ecological conservation.
Figure 7.
Projected geographic pattern of habitat quality in Anyang with four development scenarios by 2030.
The geographic alterations analysis of habitat quality classes (Table 9) reveals clear differences across scenarios. Only the ecological conservation scenario reduced the extent of lower-quality habitats (i.e., by 7.22% compared with 2020). This reduction was accompanied by a marked expansion of higher-quality and high-quality habitats, which surged by 4.16% and 3.46%, resulting in the greatest overall improvement among all scenarios. Under the industrial green transformation scenario, habitat structure remained relatively stable, with only minor shifts between classes, yielding a habitat quality level slightly above that of 2020. This suggests that ecological restoration implemented alongside economic development can arrest habitat degradation and promote modest recovery.
Table 9.
Variations in area and fraction of habitat quality levels with four development scenarios.
These simulations indicate that an ecological conservation-oriented strategy is the most effective means of elevating regional habitat quality, directly promoting the conversion of low-quality habitats to higher classes. The combined industrial green transformation and ecological restoration pathway offers a balanced approach, supporting economic development needs while providing a practical and sustainable trajectory for traditional industrial cities. In contrast, natural development and urban-focused growth would lead to continued habitat decline. Therefore, future spatial planning should prioritize ecological conservation while adopting industrial green transformation coupled with ecological restoration as a core implementation strategy. Such an integrated approach can link economic growth with ecological stewardship, supporting long-term regional sustainable advancement.
4. Discussion
4.1. Spatiotemporal Dynamics of Habitat Quality in Anyang
A persistent reduction in the average habitat quality index of Anyang was observed over 2000–2020, a trend consistent with observations in many rapidly urbanizing regions across China [54,55,56]. This decrease showed a substantial relationship with notable urban land development, underscoring the extensive impact of urban and industrial sprawl on natural habitats. It is worth noting that accelerated construction land growth between 2010 and 2020 coincided with a noticeable fall in habitat quality during the same period, aligning with research that identifies construction land expansion as a core driver of habitat deterioration [57,58,59,60].
Spatially, the pattern of “higher quality in the west, lower in the east; better in mountainous areas, weaker in plains” reflects the fundamental role of topography in structuring habitat quality. High-quality habitats in western Linzhou are associated with complex terrain, greater vegetation cover, and lower human accessibility, factors widely recognized as buffers against anthropogenic disturbance [61,62]. The concentrated distribution of medium- to high-value habitat patches along the Qi and Xi Rivers corresponds closely with the boundaries of the Linzhou Qi-Xi River National Wetland Park in Henan Province, demonstrating the measurable benefits of targeted conservation and restoration policies. This supports existing research indicating that wetland conservation and ecological restoration can effectively enhance local habitat connectivity and quality [63,64,65].
In contrast, widespread low-quality habitats in eastern plain counties are linked to intensive agriculture and urban expansion, highlighting the tension between economic development and ecological conservation in flat, accessible areas. The persistent clustering of very low-value zones within urban centers reflects a growth pattern driven by regional development strategies, such as the initiative to “build a regional hub city in northern Henan”. Therefore, future efforts to improve habitat quality in Anyang must prioritize the optimization of urban spatial layout. This will require strictly limiting the spread of construction land on ecological spaces (e.g., cultivated land, forest land, and grass land), while promoting land conservation and intensive use. Such measures would help alleviate urban sprawl pressure and stimulate endogenous drivers of regional economic development.
4.2. Evaluation of Influencing Factors on Habitat Quality
Geodetector results offer critical insights into the evolving mechanisms behind habitat quality differentiation. The persistently high interpretation strength of elevation and slope reaffirms the enduring role of natural landscape heterogeneity as a fundamental constraint on habitat patterns [66,67]. The increasing influence of PRE and NDVI, particularly after 2010, likely reflects both climatic variability and the positive outcomes of large-scale ecological restoration initiatives such as the “Clear Water Project”. These interventions appear to have enhanced vegetation’s moderating effect on habitat quality, suggesting that policy-driven greening can partially offset environmental pressures.
A notable shift occurred in the relative importance of socioeconomic drivers. In 2000, GDP was the dominant factor, indicating that early-stage economic development was spatially closely coupled with habitat degradation. Its influence, however, weakened considerably in subsequent decades. Meanwhile, the association strength of POP and NLI increased consistently, with the latter emerging as the strongest single factor by 2020. This transition signals that the physical expansion of urban settlements and infrastructure—rather than aggregate economic output per se—has become the most direct and influential anthropogenic driver of habitat loss and fragmentation. Similar shifts have been observed in other Chinese urban agglomerations, marking a move from an “economy intensity-driven” to a “spatial sprawl-driven” paradigm of habitat impact [68,69].
The stable, moderate influence of industrial output share contrasts sharply with the minimal explanatory power of industrial “three wastes” (wastewater, waste gas, and solid waste) emission factors. This suggests that industrial impacts on habitats are currently more closely tied to land occupation and landscape transformation than to end-of-pipe emissions—pointing to some success in pollution control, while underscoring that industrial land expansion remains a significant source of pressure.
4.3. Implications and Development Recommendations from Multi-Scenario Predictions of Habitat Quality
The modeling outcomes for 2030 clearly delineate the trade-offs inherent in different development pathways. The ecological conservation scenario produced the highest habitat quality, confirming that strictly nature-focused land-use management can effectively reverse degradation trends. This scenario primarily enabled the conversion of low-quality habitats into higher classes, demonstrating the potential of proactive restoration to rebuild ecological functionality [70,71].
The industrial green transition + ecological restoration scenario represents a pragmatic, balanced approach. It achieves modest gains relative to the 2020 baseline while accommodating developmental needs, illustrating that coupling industrial upgrading with ecological measures can partially decouple economic growth from environmental decline. This pathway is particularly pertinent for traditional industrial cities such as Anyang, which must simultaneously address economic transformation and ecological rehabilitation. Conversely, both Natural Development and Urbanization scenarios project continued deterioration in habitat quality, serving as a stark reminder of the ecological costs of unmanaged urban and industrial expansion.
These findings advocate for spatially differentiated management policies. In the eastern plains, stringent containment of urban sprawl and optimized agricultural landscape management are urgently required to curb habitat fragmentation. In the western mountainous areas, priorities should include consolidating the gains from afforestation and wetland conservation, along with enhancing ecological connectivity between high-quality habitat patches. At the citywide scale, combining green infrastructure into urban planning and promoting compact urban form with diverse land uses is able to help mitigate habitat impacts of necessary urban growth.
To support the sustained improvement of habitat quality in Anyang, the following policy measures are suggested according to the city’s ecological conditions, land-use trends, and simulation results: (1) Strengthen ecological conservation and systematic restoration. Targeted ecological rehabilitation initiatives should be given precedence in the central and eastern areas of Anyang—including Anyang County, Long’an District, Beiguan District, Wenfeng District, Yindu District, Tangyin County, and Neihuang County—where habitat quality is relatively low. Strategies such as increasing vegetation cover, rehabilitating wetland systems, and improving fragmented landscapes should be actively pursued. Additionally, ecological protection redlines and nature reserve boundaries must be clearly delineated and strictly enforced. Development intensity should be carefully managed in densely populated zones, with ecological resources such as forests, wetlands, and water sources designated as priority protection areas to safeguard regional ecological security. (2) Rationally regulate urban expansion and land-use intensity. Urban growth should be guided by scientifically informed spatial planning to control the direction, scale, and pace of development. It is essential to prevent unchecked sprawl from encroaching on ecologically sensitive and agriculturally important zones. Land-use regulation should focus on preserving existing green spaces, optimizing spatial land allocation, and sustaining an equilibrium within built-up areas and natural ecosystems. (3) Enhance ecological monitoring and governance capacity. A comprehensive, dynamic monitoring system should be established, integrating multi-dimensional indicators such as climatic conditions, POP, land-use patterns, and the NLI to enable real-time assessment of factors influencing habitat quality. Concurrently, the legal and institutional frameworks for ecological conservation must be improved. This includes refining relevant policies, strengthening enforcement mechanisms, and developing robust evaluation systems to ensure long-term ecological resilience and accountability in habitat quality governance.
4.4. Limitations and Future Research
Although this paper employed the intPLUS-InVEST modeling framework to adopt a structured evaluation of habitat quality in Anyang, several limitations should be noted. The land-use dataset gridded at a 30 m resolution is suitable for identifying patterns at the municipal level [72]. However, its precision remains improvable. Future research should consider incorporating finer-resolution remote-sensing imagery and establishing permanent field-monitoring sites to minimize inconsistencies between classified land-use outputs and actual land surface conditions.
5. Conclusions
This research applied the InVEST model for evaluating the spatiotemporal evolution of habitat quality in Anyang using land-use data between 2000 and 2020. Through factor analysis via the Geodetector and coupled intPLUS-InVEST multi-scenario simulations, the following key findings were derived:
- (1)
- Within 2000–2020, the average habitat quality index in Anyang registered a steady drop from 0.451 to 0.426, indicating a total reduction in ecological conditions. Spatially, habitat quality exhibited a persistent “west-high, east-low” distribution, with superior quality in mountainous areas compared with plains. High-value regions were largely situated in the western mountainous areas of Linzhou, as well as around Qixi River Wetland Park, regions benefiting from favorable natural settings and active conservation efforts. In contrast, low-value zones were extensively distributed across the eastern plains, overlapping with urban and agricultural land, and their expansion closely followed urban growth and industrial land development.
- (2)
- The dominant driver of habitat quality evolution has shifted from an earlier “economic growth-led” mode to a regime “jointly shaped by urban spatial expansion and ecological restoration”. Specifically, the primary explanatory factor changed from GDP in 2000 to the NLI in 2020, reflecting a transition in direct habitat degradation pressure from aggregate economic output to physical urban sprawl and population concentration. At the same time, the marked rise in the explanatory power of the NDVI corroborates the positive effects of ecological restoration initiatives. Industrial impacts were found to be linked more to spatial land occupancy than to end-of-pipe emissions, whose influence has relatively diminished. Interaction detection further revealed that any two interacting factors had greater explanatory power than either factor alone, underscoring that habitat quality arises from the complex interplay of natural constraints, human activity intensity, and industrial development, highlighting the multifaceted nature of ecosystem responses.
- (3)
- Multi-scenario simulations clarify the divergent ecological outcomes under different development pathways, offering clear evidence for policy design. Projections for 2030 show that development strategies lead to sharply contrasting habitat quality trajectories. Only the ecological conservation scenario substantially improved overall habitat quality and promoted conversion for lower-grade habitats to higher grades. The industrial green transition + ecological restoration scenario achieved gradual improvement and basic stabilization, representing a viable compromise between development and conservation. Conversely, both the natural development scenario—extending current trends—and the urban development scenario—prioritizing economic growth—would result in further degradation of habitat quality.
Author Contributions
Conceptualization, J.Z. and Y.S.; methodology, J.Z. and Y.S.; data curation, Y.S.; visualization, Y.S.; writing—original draft, Y.S.; writing—review and editing, J.Z. and Y.S.; supervision, J.Z.; funding Acquisition, J.Z. All authors have read and agreed to the published version of this manuscript.
Funding
This work was supported by Research on the Pathways for Personalized Development of Undergraduates in Local Universities Based on Generative AI, the Henan Provincial Department of Education Science Planning Project, grant number 2025YB0083, and Research on the Practice Model and Optimization Path of “Digital Governance” in Henan’s Digital Rural Areas, the Annual Research Project of Henan Provincial Federation of Social Sciences, grant number SKL-2025-185, and Research on the Ecological Protection and High-Quality Development Status of the Yellow River Basin in Henan Province, the Henan Science and Technology Think Tank Research Project, grant number HNKJZK-2025-12A.
Institutional Review Board Statement
Not applicable.
Informed Consent Statement
Not applicable.
Data Availability Statement
All original findings and data generated in this study are presented within this article. For additional information, please contact the corresponding author.
Acknowledgments
This research was supported by the Field Observation Station for Eco-Hydrological Processes in the Lower Yellow River Floodplain, the Ministry of Water Resources. We sincerely appreciate their provision of data and access to research facilities. We also extend our thanks to the editor and anonymous reviewers for their insightful and constructive feedback.
Conflicts of Interest
We declare no conflicts of interest.
Abbreviations
The abbreviations listed below were used in this paper:
| InVEST | Integrated valuation of ecosystem services and tradeoffs |
| intPLUS | Interaction network patch-generating land-use simulation |
| LUCC | Land use/land cover |
| DEM | Elevation |
| SLOPE | Slope |
| PRE | Annual precipitation |
| TEM | Annual mean temperature |
| POP | Population density |
| NLI | Nighttime lighting index |
| IOVS | Industrial output value share |
| IWD | Industrial wastewater discharge |
| ISDE | Industrial sulfur dioxide emissions |
| IFE | Industrial dust emissions |
References
- Wang, Y.; Wang, X.; Zhang, W.; Man, W.; Liu, M.; Jiao, L. Spatiotemporal evolution of landscape ecological risk and its driving factors of the Beijing–Tianjin–Hebei major mineral belt, 1985–2022. Sci. Rep. 2025, 15, 2425. [Google Scholar] [CrossRef] [Scilit]
- Chen, P.; Duan, J.; Wang, Y. Spatio-temporal evolution and driving forces of urban gravity centers and ecological security risk gravity centers in China. Ecol. Indic. 2025, 170, 113025. [Google Scholar] [CrossRef] [Scilit]
- Liu, Y.; Li, X.; Su, S.; Guo, Y. Ecological industrialization and rural revitalization for global sustainable development. Geogr. Sustain. 2025, 6, 100307. [Google Scholar] [CrossRef] [Scilit]
- Wang, K.; Wang, W.; Zhang, N.; Fan, Y.; Qian, C.; Zhang, Y.; Ma, J.; Zhu, R. Spatially Heterogeneity Response of Critical Ecosystem Service Capacity to Address Regional Development Risks to Rapid Urbanization: The Case of Beijing-Tianjin-Hebei Urban Agglomeration in China. Sustainability 2022, 14, 7198. [Google Scholar] [CrossRef] [Scilit]
- Liu, N.; Liu, Z.; Wu, Y. Direct and Indirect Impacts of Urbanization on Biodiversity Across the World’s Cities. Remote Sens. 2025, 17, 956. [Google Scholar] [CrossRef] [Scilit]
- Ma, J.; Fu, X.; Song, C.; Li, Z.; Chen, L.; Zhou, M.; Huang, X. Landscape fragmentation exacerbates social-ecological system degradation in the Qinling Mountains by weakening ecosystem services. Ecol. Indic. 2025, 178, 114130. [Google Scholar] [CrossRef] [Scilit]
- Huo, A.; Liu, Q.; Zhao, Z.; Elbeltagi, A.; Abuarab, M.E.S.; Ganjidoust, H. Habitat Quality Assessment and Driving Factor Analysis of Xiangyu in Feng River Basin Based on InVEST Model. Water 2023, 15, 4046. [Google Scholar] [CrossRef] [Scilit]
- Wang, X.; Bu, X.; Wang, J.; Du, L.; Hong, Z.; Shi, G.; Baqiatullah. Study on the coordination and factors affecting the coupling of resource and environmental carrying capacity and regional economy in ecologically fragile areas. Ecol. Indic. 2024, 167, 112656. [Google Scholar] [CrossRef] [Scilit]
- Qu, J.; Dong, B.; Liu, X.; Xu, Z. Study on Habitat Quality of Chongming Dongtan Based on InVEST Model in Shanghai, China. J. Indian Soc. Remote Sens. 2025, 53, 3237–3250. [Google Scholar] [CrossRef] [Scilit]
- Zhao, Z.; Zhang, H.; Fu, J.; Wang, Y.; Liu, K. Evaluation of Social Values for Ecosystem Services in Urban Riverfront Space Based on the SolVES Model: A Case Study of the Fenghe River, Xi’an, China. Int. J. Environ. Res. Public Health 2021, 18, 2765. [Google Scholar] [CrossRef] [Scilit]
- Zhang, J.; Li, X.; Li, S.; Yang, Q.; Li, Y.; Xiang, Y.; Yao, B. MaxEnt Modeling of Future Habitat Shifts of Itea yunnanensis in China Under Climate Change Scenarios. Biology 2025, 14, 899. [Google Scholar] [CrossRef] [Scilit] [PubMed]
- Ma, Q.; Li, M.; Ren, C.; Wang, Z.; Tang, Y. Dynamic assessment of habitat quality in eastern Jilin Province based on HSI model. Remote Sens. Nat. Resour. 2019, 31, 140–147. [Google Scholar]
- Wang, R.; Zhuang, H.; Cheng, M.; Yang, H.; Wang, W.; Ci, H.; Yan, Z. Spatial and Temporal Variations of Habitat Quality and Influencing Factors in Urban Agglomerations on the North Slope of Tianshan Mountains, China. Land 2025, 14, 539. [Google Scholar] [CrossRef] [Scilit]
- Niu, L.; Pan, M. Research on dynamic simulation of land use change based on geographical weighted CLUE-S model. Int. J. Environ. Technol. Manag. 2021, 24, 49–61. [Google Scholar] [CrossRef] [Scilit]
- Hou, X.; Song, B.; Zhang, X.; Wang, X.; Li, D. Multi-scenario Simulation and Spatial-temporal Analysis of LUCC in China’s Coastal Zone Based on Coupled SD-FLUS Model. Chin. Geogr. Sci. 2024, 34, 579–598. [Google Scholar] [CrossRef] [Scilit]
- Wang, Q.; Hussain, S.; Qaisrani, S.A.; Mubeen, M.; Tahir, M.; Javeed, H.M.R. Assessing past and future prediction of land use land cover changes using CA-Markov chain model. Environ. Earth Sci. 2025, 84, 352. [Google Scholar] [CrossRef] [Scilit]
- Ma, X.Y.; Xu, Y.F.; Sun, Q.; Liu, W.J.; Qi, W. Contributing to Carbon Neutrality Targets: A Scenario Simulation and Pattern Optimization of Land Use in Shandong Province Based on the PLUS Model. Sustainability 2024, 16, 5180. [Google Scholar] [CrossRef] [Scilit]
- Zhang, Z.; Li, X.; Du, S.; Liu, C.; Shi, Z.; Yan, C. Spatial-Temporal Evolution Analysis of Multi-Scenario Land Use and Ecosystem Services Based on the PLUS–InVEST Model: A Case Study in the Beijing–Tianjin–Hebei Region, China. Sustain. Futures 2025, 10, 101154. [Google Scholar] [CrossRef] [Scilit]
- Hou, Y.; Wu, J. Land-Use and Habitat Quality Prediction in the Fen River Basin Based on the PLUS and InVEST Models. Front. Environ. Sci. 2024, 12, 1386549. [Google Scholar] [CrossRef] [Scilit]
- Wang, Y.; Sheng, Z.; Wang, H.; Xue, X.; Hu, J.; Yang, Y. Characterization and Multi-Scenario Prediction of Habitat Quality Evolution in the Bosten Lake Watershed Based on the InVEST and PLUS Models. Sustainability 2024, 16, 4202. [Google Scholar] [CrossRef] [Scilit]
- Pan, C.; Wen, J.; Ma, J. Temporal and Spatial Variation in Habitat Quality in Guangxi Based on PLUS-InVEST Model. Land 2024, 13, 2250. [Google Scholar] [CrossRef] [Scilit]
- Liang, X.; Huang, J.L.; Guan, Q. Unveiling Land Competition through Interaction Networks: A Consistency-Based Mining and Simulation Model That Integrates Inhibiting Effects of Land Uses. Landsc. Urban Plan. 2025, 263, 105458. [Google Scholar] [CrossRef] [Scilit]
- Qi, Z.; Cai, Y.; Ye, Y.; Yang, H.; Cai, S.; Tan, Q.; Yang, Z. Integrating Landscape “Source–Transport–Sink” Mechanisms into GeoAI to Enhance Surrogate Modeling of Watershed Nutrient Loads. Water Res. 2025, 291, 125263. [Google Scholar] [CrossRef] [Scilit] [PubMed]
- Xiao, X.; Liu, H.; Wang, M.; Song, J.; Gong, X.; Wang, M. Pollution Characteristics and Health Risk Assessment of Heavy Metals in Soil of Large Industrial Areas and Surrounding Communities in Anyang City. Earth Environ. 2021, 49, 551–560. [Google Scholar]
- Anyang Municipal People’s Government. Notice of the People’s Government of Anyang City on Issuing the Outline of the 14th Five-Year Plan for National Economic and Social Development of Anyang City and the Long-Range Objectives Through 2035. Available online: https://www.anyang.gov.cn/2021/11-19/2286398.html (accessed on 12 March 2025).
- GB/T 21010-2017; Current Land Use Classification. Standards Press of China: Beijing, China, 2017.
- Li, L.; Li, G.; Ji, G.; Li, Q.; Zhang, Z.; Chen, W. Multi-scenario simulation and eco-environmental effect analysis of “Production–Living–Ecological space” based on PLUS model: A case study of Anyang City. Open Geosci. 2025, 17, 20220753. [Google Scholar] [CrossRef] [Scilit]
- Zhang, X.; Li, X.; Zhao, H.; Li, J.; Zhao, Z.; Wu, J.; Zhao, W. Spatiotemporal variation, multi-scenario simulation, and driving factors analysis of habitat quality based on FLUS-InVEST and Geodetector models for Beijing-Tianjin-Hebei, China. Sci. Rep. 2025, 15, 30075. [Google Scholar] [CrossRef] [Scilit]
- Zhao, X.; Li, W.; Wang, P.; Liu, M.; Jiang, C.; Yu, N. Spatial–temporal differentiation law of habitat quality and its driving mechanism in the typical plateau areas of the Loess Plateau in the recent years. Open Geosci. 2025, 17, 20250909. [Google Scholar] [CrossRef] [Scilit]
- Jin, R.; He, L.; He, Z.; Zhao, Y.; Luo, F.; Li, D.; Huang, Y. Projection of Land Use and Habitat Quality Under Climate Scenarios: A Case Study of Arid Oasis Urban Agglomerations. Agronomy 2025, 15, 2704. [Google Scholar] [CrossRef] [Scilit]
- Zhang, X.; Liao, L.; Xu, Z.; Zhang, J.; Chi, M.; Lan, S.; Gan, Q. Interactive effects on habitat quality using InVEST and GeoDetector models in Wenzhou, China. Land 2022, 11, 630. [Google Scholar] [CrossRef] [Scilit]
- Wu, J.; Luo, J.; Zhang, H.; Qin, S.; Yu, M. Projections of land use change and habitat quality assessment by coupling climate change and development patterns. Sci. Total Environ. 2022, 847, 157491. [Google Scholar] [CrossRef] [Scilit]
- Sun, J.; Han, M.; Kong, F.; Wei, F.; Kong, X. Spatiotemporal analysis of the coupling relationship between habitat quality and urbanization in the Lower Yellow River. Int. J. Environ. Res. Public Health 2023, 20, 4734. [Google Scholar] [CrossRef] [Scilit]
- Luo, L.; Yin, C.; Liu, X. Habitat Quality and Degradation in the West Qinling Mountains, China: From Spatiotemporal Assessment to Sustainable Management (1990–2020). Sustainability 2025, 17, 9700. [Google Scholar] [CrossRef] [Scilit]
- Li, Y.; Duo, L.; Zhang, M.; Yang, J.; Guo, X. Habitat quality assessment of mining cities based on InVEST model—A case study of Yanshan County, Jiangxi Province. Int. J. Coal Sci. Technol. 2022, 9, 28. [Google Scholar] [CrossRef] [Scilit]
- Zhang, L.; Li, J. Identifying priority areas for biodiversity conservation based on Marxan and InVEST model. Landsc. Ecol. 2022, 37, 3043–3058. [Google Scholar] [CrossRef] [Scilit]
- Mukhopadhyay, A.; Hati, J.P.; Acharyya, R.; Pal, I.; Tuladhar, N.; Habel, M.J.E. Global trends in using the InVEST model suite and related research: A systematic review. Ecohydrol. Hydrobiol. 2025, 25, 389–405. [Google Scholar] [CrossRef] [Scilit]
- Baixue, W.; Weiming, C. Effects of Land Use/Cover on Regional Habitat Quality under Different Geomorphic Types Based on InVEST Model. Remote Sens. 2022, 14, 1279. [Google Scholar] [CrossRef] [Scilit]
- Sharp, R.; Chaplin-Kramer, R.; Wood, S. InVEST 3.2.0 User’s Guide; The Natural Capital Project: Stanford, CA, USA, 2015; Available online: https://naturalcapitalproject.stanford.edu/invest/ (accessed on 15 May 2025).
- Hou, Y.; Wu, J.; Guo, Y. Spatial-temporal evolution and prediction of habitat quality in the Yellow River Basin. Front. Environ. Sci. 2025, 13, 1650777. [Google Scholar] [CrossRef] [Scilit]
- Chen, Y.; He, Z.; Yue, T.; Mu, W.; Qin, F. Spatiotemporal evolution and multi-scenario prediction of habitat quality in the Yellow River Basin. Front. Ecol. Evol. 2023, 11, 1163209. [Google Scholar] [CrossRef] [Scilit]
- Xie, Z.X.; Zhang, B.; Shi, Y.T.; Zhang, X.Y.; Sun, Z.X. Changes and protections of urban habitat quality in Shanghai of China. Sci. Rep. 2023, 13, 10976. [Google Scholar] [CrossRef] [Scilit] [PubMed]
- Fan, X.; Gu, X.; Yu, H.; Long, A.; Tiando, D.S.; Ou, S.; Huang, C. The spatial and temporal evolution and drivers of habitat quality in the Hung River Valley. Land 2021, 10, 1369. [Google Scholar] [CrossRef] [Scilit]
- Tang, F.; Fu, M.; Wang, L.; Zhang, P. Land-use change in Changli County, China: Predicting its spatio-temporal evolution in habitat quality. Ecol. Indic. 2020, 117, 106719. [Google Scholar] [CrossRef] [Scilit]
- Sun, X.; Jiang, Z.; Liu, F.; Zhang, D. Monitoring spatio-temporal dynamics of habitat quality in Nansihu Lake basin, eastern China, from 1980 to 2015. Ecol. Indic. 2019, 102, 716–723. [Google Scholar] [CrossRef] [Scilit]
- Wang, J.; Xu, C. Geodetector: Principle and prospective. Acta Geogr. Sin. 2017, 72, 116–134. [Google Scholar] [CrossRef]
- Gao, W.M.; Dong, X.; Liu, J.P. Land Use Prediction and Habitat Quality Study in the Northern Foothills of the Qinling Mountains in Xi’an City Based on the SD–intPLUS–InVEST Model. Environ. Sci. 2025, 46, 1–21. [Google Scholar] [CrossRef]
- Miao, T.; Zhang, C.; Wang, Z.; Yang, R. Simulation and Prediction of the East Dongting Lake Wetland Landscape Based on the PLUS Model. Appl. Sci. 2025, 15, 9699. [Google Scholar] [CrossRef] [Scilit]
- Fu, H.; Liang, Y.; Chen, J.; Zhu, L.; Fu, G. A New Framework of Land Use Simulation for Land Use Benefit Optimization Based on GMOP-PLUS Model—A Case Study of Haikou. Land 2024, 13, 1257. [Google Scholar] [CrossRef] [Scilit]
- McHugh, M.L. Interrater reliability: The kappa statistic. Biochem. Med. 2012, 22, 276–282. [Google Scholar] [CrossRef] [Scilit]
- Ma, G.; Li, Q.; Zhao, J.; Zhang, L.; Cai, H.; Jiang, Z.; Sun, G. Simulation and Analysis of Land-Use Change Based on the PLUS Model in the Fuxian Lake Basin (Yunnan–Guizhou Plateau, China). Land 2022, 12, 120. [Google Scholar] [CrossRef] [Scilit]
- Wang, X.; Liu, B.; Chen, J.; Arash, M.; Zhang, B.; Chang, Q.; You, W. Assessing the Impact of Land Use Change on Habitat Quality in Zhongwei through Multiscenario Simulation Using the PLUS and InVEST Models. Sci. Rep. 2025, 15, 12355. [Google Scholar] [CrossRef] [Scilit] [PubMed]
- Xiang, L.; Zhaoshun, L.; Shujie, L.; Yingxue, L. Multi-Scenario Simulation Analysis of Land Use Impacts on Habitat Quality in Tianjin Based on the PLUS Model Coupled with the InVEST Model. Sustainability 2022, 14, 6923. [Google Scholar] [CrossRef] [Scilit]
- Zhang, H.; Chen, Z.; Ge, Y.; Zhang, H.; Xu, M. Spatiotemporal Evolution Characteristics and Driving Mechanisms of Habitat Quality in the Jiangsu Coastal Zone. Front. Mar. Sci. 2025, 12, 1730861. [Google Scholar] [CrossRef] [Scilit]
- Zheng, H.; Li, H. Spatial–temporal evolution characteristics of land use and habitat quality in Shandong Province, China. Sci. Rep. 2022, 12, 15422. [Google Scholar] [CrossRef] [Scilit] [PubMed]
- Ma, C.; Yang, H.; Yan, Z. Spatio-temporal evolution of habitat quality and its influencing factors in karst areas based on the InVEST model. PLoS ONE 2025, 20, e0314161. [Google Scholar] [CrossRef] [Scilit]
- Gu, L.; Yan, J.; Li, Y.; Gong, Z. Spatial–temporal evolution and correlation analysis between habitat quality and landscape patterns based on land use change in Shaanxi Province, China. Ecol. Evol. 2023, 13, e10657. [Google Scholar] [CrossRef] [Scilit]
- Li, Z.; Sun, M.; Wang, X.; Li, X.; Chen, X.; Zhang, P. Spatial–Temporal Evolution and Prediction of Habitat Quality in Beijing–Tianjin–Hebei Region Based on Land Use Change. Land 2023, 12, 667. [Google Scholar] [CrossRef] [Scilit]
- Li, Y.; Ding, L.; Zhang, M.; Wang, Z.; Guo, Y. Assessment and Estimation of the Spatial and Temporal Evolution of Landscape Patterns and Their Impact on Habitat Quality in Nanchang, China. Land 2021, 10, 1073. [Google Scholar] [CrossRef] [Scilit]
- Li, Z.; Ma, Z.; Zhang, G. Impact of land use change on habitat quality and regional biodiversity capacity: Temporal and spatial evolution and prediction analysis. Front. Environ. Sci. 2022, 10, 989710. [Google Scholar] [CrossRef] [Scilit]
- Yohannes, H.; Soromessa, T.; Argaw, M.; Dewan, A. Spatio-temporal changes in habitat quality and linkage with landscape characteristics in the Beressa watershed, Blue Nile basin of Ethiopian highlands. J. Environ. Manag. 2021, 281, 111885. [Google Scholar] [CrossRef] [Scilit]
- Tang, J.; Zhou, L.; Dang, X.; Hu, F.; Yuan, B.; Yuan, Z.; Wei, L. Impacts and predictions of urban expansion on habitat quality in the densely populated areas: A case study of the Yellow River Basin, China. Ecol. Indic. 2023, 151, 110320. [Google Scholar] [CrossRef] [Scilit]
- Wang, C.; Ding, X.; Lian, H.; Ma, X.; Li, C.; Li, Z.; Chen, R. Wetland habitat quality assessment and improvement from a perspective of spatiotemporal heterogeneity. Wetlands 2025, 45, 94. [Google Scholar] [CrossRef] [Scilit]
- Zhang, S.; Zhang, P.; Pan, B.; Zou, Y.; Xie, Y.; Zhu, F.; Yang, S. Wetland restoration in the East Dongting Lake effectively increased waterbird diversity by improving habitat quality. Glob. Ecol. Conserv. 2021, 27, e01535. [Google Scholar] [CrossRef] [Scilit]
- Khatun, R.; Das, S. Analysing sensitivity of conditioning factors for wetland habitat quality modelling. Ecohydrol. Hydrobiol. 2025, 25, 259–276. [Google Scholar] [CrossRef] [Scilit]
- Zhang, G.; Roslan, S.N.A.; Quan, L.; Yuan, P. Simulation of spatiotemporal patterns of habitat quality and driving mechanism in Anhui province, China. Front. Environ. Sci. 2023, 11, 1145626. [Google Scholar] [CrossRef] [Scilit]
- Xu, Z.; Li, C.; Fan, X.; Bi, R.; Xu, L.; Xu, C.; Sun, B.; Li, T.; Jia, C. Spatiotemporal Variation and Influence Factors of Habitat Quality in Loess Hilly and Gully Area of Yellow River Basin: A Case Study of Liulin County, China. Land 2022, 11, 127. [Google Scholar] [CrossRef] [Scilit]
- Yue, Z.; Xiao, C.; Feng, Z.; Wang, Y.; Yan, H. Accelerating decline of habitat quality in Chinese border areas. Resour. Conserv. Recycl. 2024, 206, 107665. [Google Scholar] [CrossRef] [Scilit]
- Xu, J.; Ling, Y.; Sun, Y.; Jiang, Y.; Shen, R.; Wang, Y. How do different processes of habitat fragmentation affect habitat quality?—Evidence from China. Ecol. Indic. 2024, 160, 111880. [Google Scholar] [CrossRef] [Scilit]
- Wang, J.; Wang, Y.; Guo, A. Habitat quality evolution characteristics and multi-scenario prediction in Shenzhen based on PLUS and InVEST models. Front. Environ. Sci. 2023, 11, 1152069. [Google Scholar] [CrossRef] [Scilit]
- Wang, Q.; Abudureheman, M.; Halik, Ü.; Yao, K.; Yao, L.; Tang, H.; Tuohetituerxun, B. Temporal and spatial variation analysis of habitat quality on the PLUS-InVEST model for Ebinur Lake Basin, China. Ecol. Indic. 2022, 145, 109673. [Google Scholar] [CrossRef] [Scilit]
- Bai, L.; Xiu, C.; Feng, X.; Liu, D. Influence of urbanization on regional habitat quality: A case study of Changchun City. Habitat Int. 2019, 93, 102042. [Google Scholar] [CrossRef] [Scilit]

Disclaimer/Publisher’s Note: The statements, opinions and data contained in all publications are solely those of the individual author(s) and contributor(s) and not of MDPI and/or the editor(s). MDPI and/or the editor(s) disclaim responsibility for any injury to people or property resulting from any ideas, methods, instructions or products referred to in the content. |
© 2026 by the authors. Licensee MDPI, Basel, Switzerland. This article is an open access article distributed under the terms and conditions of the Creative Commons Attribution (CC BY) license.