


Abstract
Under multiple stresses such as an arid climate, water scarcity, and desertification, inland river basins in arid regions represent a typically fragile ecosystem worldwide, and their ecological security faces increasingly complex and severe challenges. To address the limitations of traditional assessment methods characterized by single-perspective approaches, difficulties in quantifying indicators, and lack of a systematic framework for arid basins, this study constructed an innovative Health–Service–Risk–Sensitivity (HSRS) framework. Taking the Tarim River Basin (TRB) as a case study, the validity and necessity of this framework were validated through the Remote Sensing Ecological Index (RSEI) and correlation analysis. Furthermore, the XGBoost–SHAP model was further integrated to identify key threshold responses of multidimensional driving factors within the basin. The findings indicate that the ecological security of the TRB progressively improved, with approximately 11.64% of the area showing significant enhancement. The four most influential driving factors were land use, NDVI, human activity intensity, and soil moisture. Notably, the study identified critical environmental thresholds: when DEM ranged from 1500 to 3000 m and slope from 2° to 30°, constraining effects on the Comprehensive Ecological Security Index (CESI) increased. When annual precipitation exceeded 150 mm, NDVI was greater than 0.35, and soil moisture content exceeded 0.14 m3/m3, the constraint effect was further strengthened. Overall, the integration of the HSRS framework and the XGBoost-SHAP model offers a novel and effective approach for ecological security assessment in arid inland basins. Moreover, this approach has substantial practical implications for achieving precise coordination between regional ecological protection and sustainable development.
1. Introduction
Watersheds represent fundamental spatial units supporting regional sustainable development. The coupled interactions between natural and human systems within watersheds constitute the primary driving forces of social-economic growth and ecological security [1,2,3]. However, watershed ecosystems are increasingly experiencing significant stress due to prolonged climate change and intensified human activities [3,4,5,6]. Under fragile ecological conditions in arid regions, such pressure leads to concurrent degradation of ecosystem health and service functions, posing severe challenges to regional sustainability [7,8]. Against this backdrop, ecological security has gradually become an important evaluation framework, providing a systematic approach to comprehensively address the complex ecological and environmental issues within river basins. At its core, this framework evaluates the comprehensive capacity of ecosystems to maintain ecological health, sustain ecosystem service provision, and support social development. Leveraging these characteristics, ecological security assessments have been widely employed across multiple spatial scales, thereby becoming essential tools for diagnosing and mitigating basin-wide ecological risks [8,9]. Nevertheless, current research still has significant gaps, particularly the lack of a comprehensive assessment framework capable of effectively integrating multidimensional attributes to systematically characterize the overall ecological security status of arid inland river basins.
Ecological security assessment research has extensively employed models, including the Pressure-State-Response (PSR) [10], Driver-Pressure-State-Impact-Response (DPSIR) [11], Ecological Footprint [12], and Landscape Ecology [13], yielding substantial findings. For example, Li et al. [11] developed a DPSIR-based indicator system comprising 30 indicators to evaluate water security in Northwest China, while Zhang et al. [12] established an ecological footprint framework accounting for the Tarim River Basin (TRB) and assessed regional sustainability using landscape ecological risk indices. Despite these advances, most existing methods continue to exhibit notable limitations. Most models depend on weighted summation for integrating indicators, which tends to oversimplify the heterogeneity among them and reduce interpretability [14]. Likewise, ecological footprints and landscape-based models often fail to capture critical ecological processes, resulting in systematic assessment biases and limited applicability due to inadequate standardization and weak scalability [8]. More fundamentally, most existing models emphasize interactions between socio-economic driving factors and ecosystems without achieving a holistic understanding of the intrinsic nature of ecological security.
Currently, ecological security evaluation systems for arid basin ecosystems face several key challenges. First, indicator selection often inadequately emphasizes “water” as the core limiting factor, resulting in limited capacity to quantify critical processes such as soil salinization and wind-sand dynamics. Second, many indicators fail to adequately capture regionally representative ecological conditions, including oasis stability and the health of desert poplar forests. While some studies focus on ecosystem structure using landscape patterns and diversity indices [15,16], others emphasize ecosystem functions as proxies for ecological security [17,18,19]. Third, traditional assessment frameworks such as DPSIR often prioritize either “ecological Risk” or “sensitivity,” whereas their “Pressure” and “State” indicators struggle to distinguish whether ecological degradation stems from excessive external stress or inherent systemic vulnerability. In contrast, a truly secure ecosystem in arid inland river basins must simultaneously maintain structural and functional health, sustain critical ecosystem services, and exhibit resilience to external risks under severe water constraints and natural disturbances [20]. Assessing ecosystems from a single perspective severely constrains the ability to accurately diagnose the comprehensive ecological condition of arid river basins.
The scientific formulation of effective ecological security improvement strategies fundamentally depends on accurately identifying key driving factors and quantifying their impacts, making driving factor evaluation an important research focus [20,21]. However, comprehensively analyzing multiple drivers from a holistic perspective remains challenging, particularly in arid inland river basins characterized by highly complex driving mechanisms. Influencing factors commonly exhibit nonlinear relationships, threshold effects, and complex interactions, which are difficult for traditional linear regression or spatial detection methods such as GeoDetector to capture effectively [21]. To address these challenges, numerous studies have employed increasingly advanced statistical and machine learning models, including random forest models [22,23], geographically weighted regression [24], GeoDetector [25], and XGBoost models [26]. Among these, XGBoost, an efficient, flexible, and powerful machine learning algorithm, is suitable for high-dimensional datasets and excels at capturing complex nonlinear relationships. When coupled with SHAP (Shapley Additive exPlanations), this framework not only retains strong predictive performance but also enables quantitative interpretation of driving factor contributions [27]. Accordingly, this research adopts a coupled framework of XGBoost–SHAP to quantitatively analyze the complex mechanisms underlying ecological security formation in arid inland river basins.
To fill these research gaps, this study selects the strategically important inland arid TRB as a representative case. This basin exhibits a unique “mountain-oasis-desert” composite structure, faces severe water resource conflicts, and demonstrates high ecological vulnerability under global climate change. It constitutes a complex human-environment system that necessitates systematic analysis from the multidimensional perspective of “State-Supply-Threat-Vulnerability.” Considering the distinctiveness and vulnerability of the TRB ecosystem, there is an urgent need for a comprehensive exploration of its ecological security status. Therefore, this study establishes, for the first time, a multidimensional ecological security assessment framework that integrates ecological health, ecosystem services, ecological risk, and ecological sensitivity. By combining multidimensional quantitative analysis with interpretable machine learning model, it systematically reveals the spatiotemporal evolution patterns of watershed ecological security and its driving factors. The purposes of the study are to (1) to construct an ecological security assessment framework integrating health, services, risk, and sensitivity, thereby providing a systematic, comprehensive, and rational assessment system for arid inland river basins; (2) to examine the applicability of integrating health, services, risk, and sensitivity in ecological security assessment; and (3) to elucidate the relative significance of natural and human factors and identify the nonlinear response thresholds of key driving factors. The findings of this research offer a novel framework for assessing ecological security in arid inland river basins, offering scientific support for regional planning and sustainable development.
2. Study Area and Data
2.1. Study Area
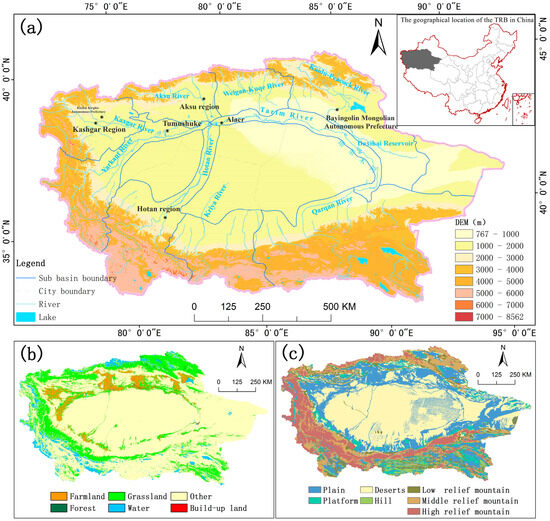
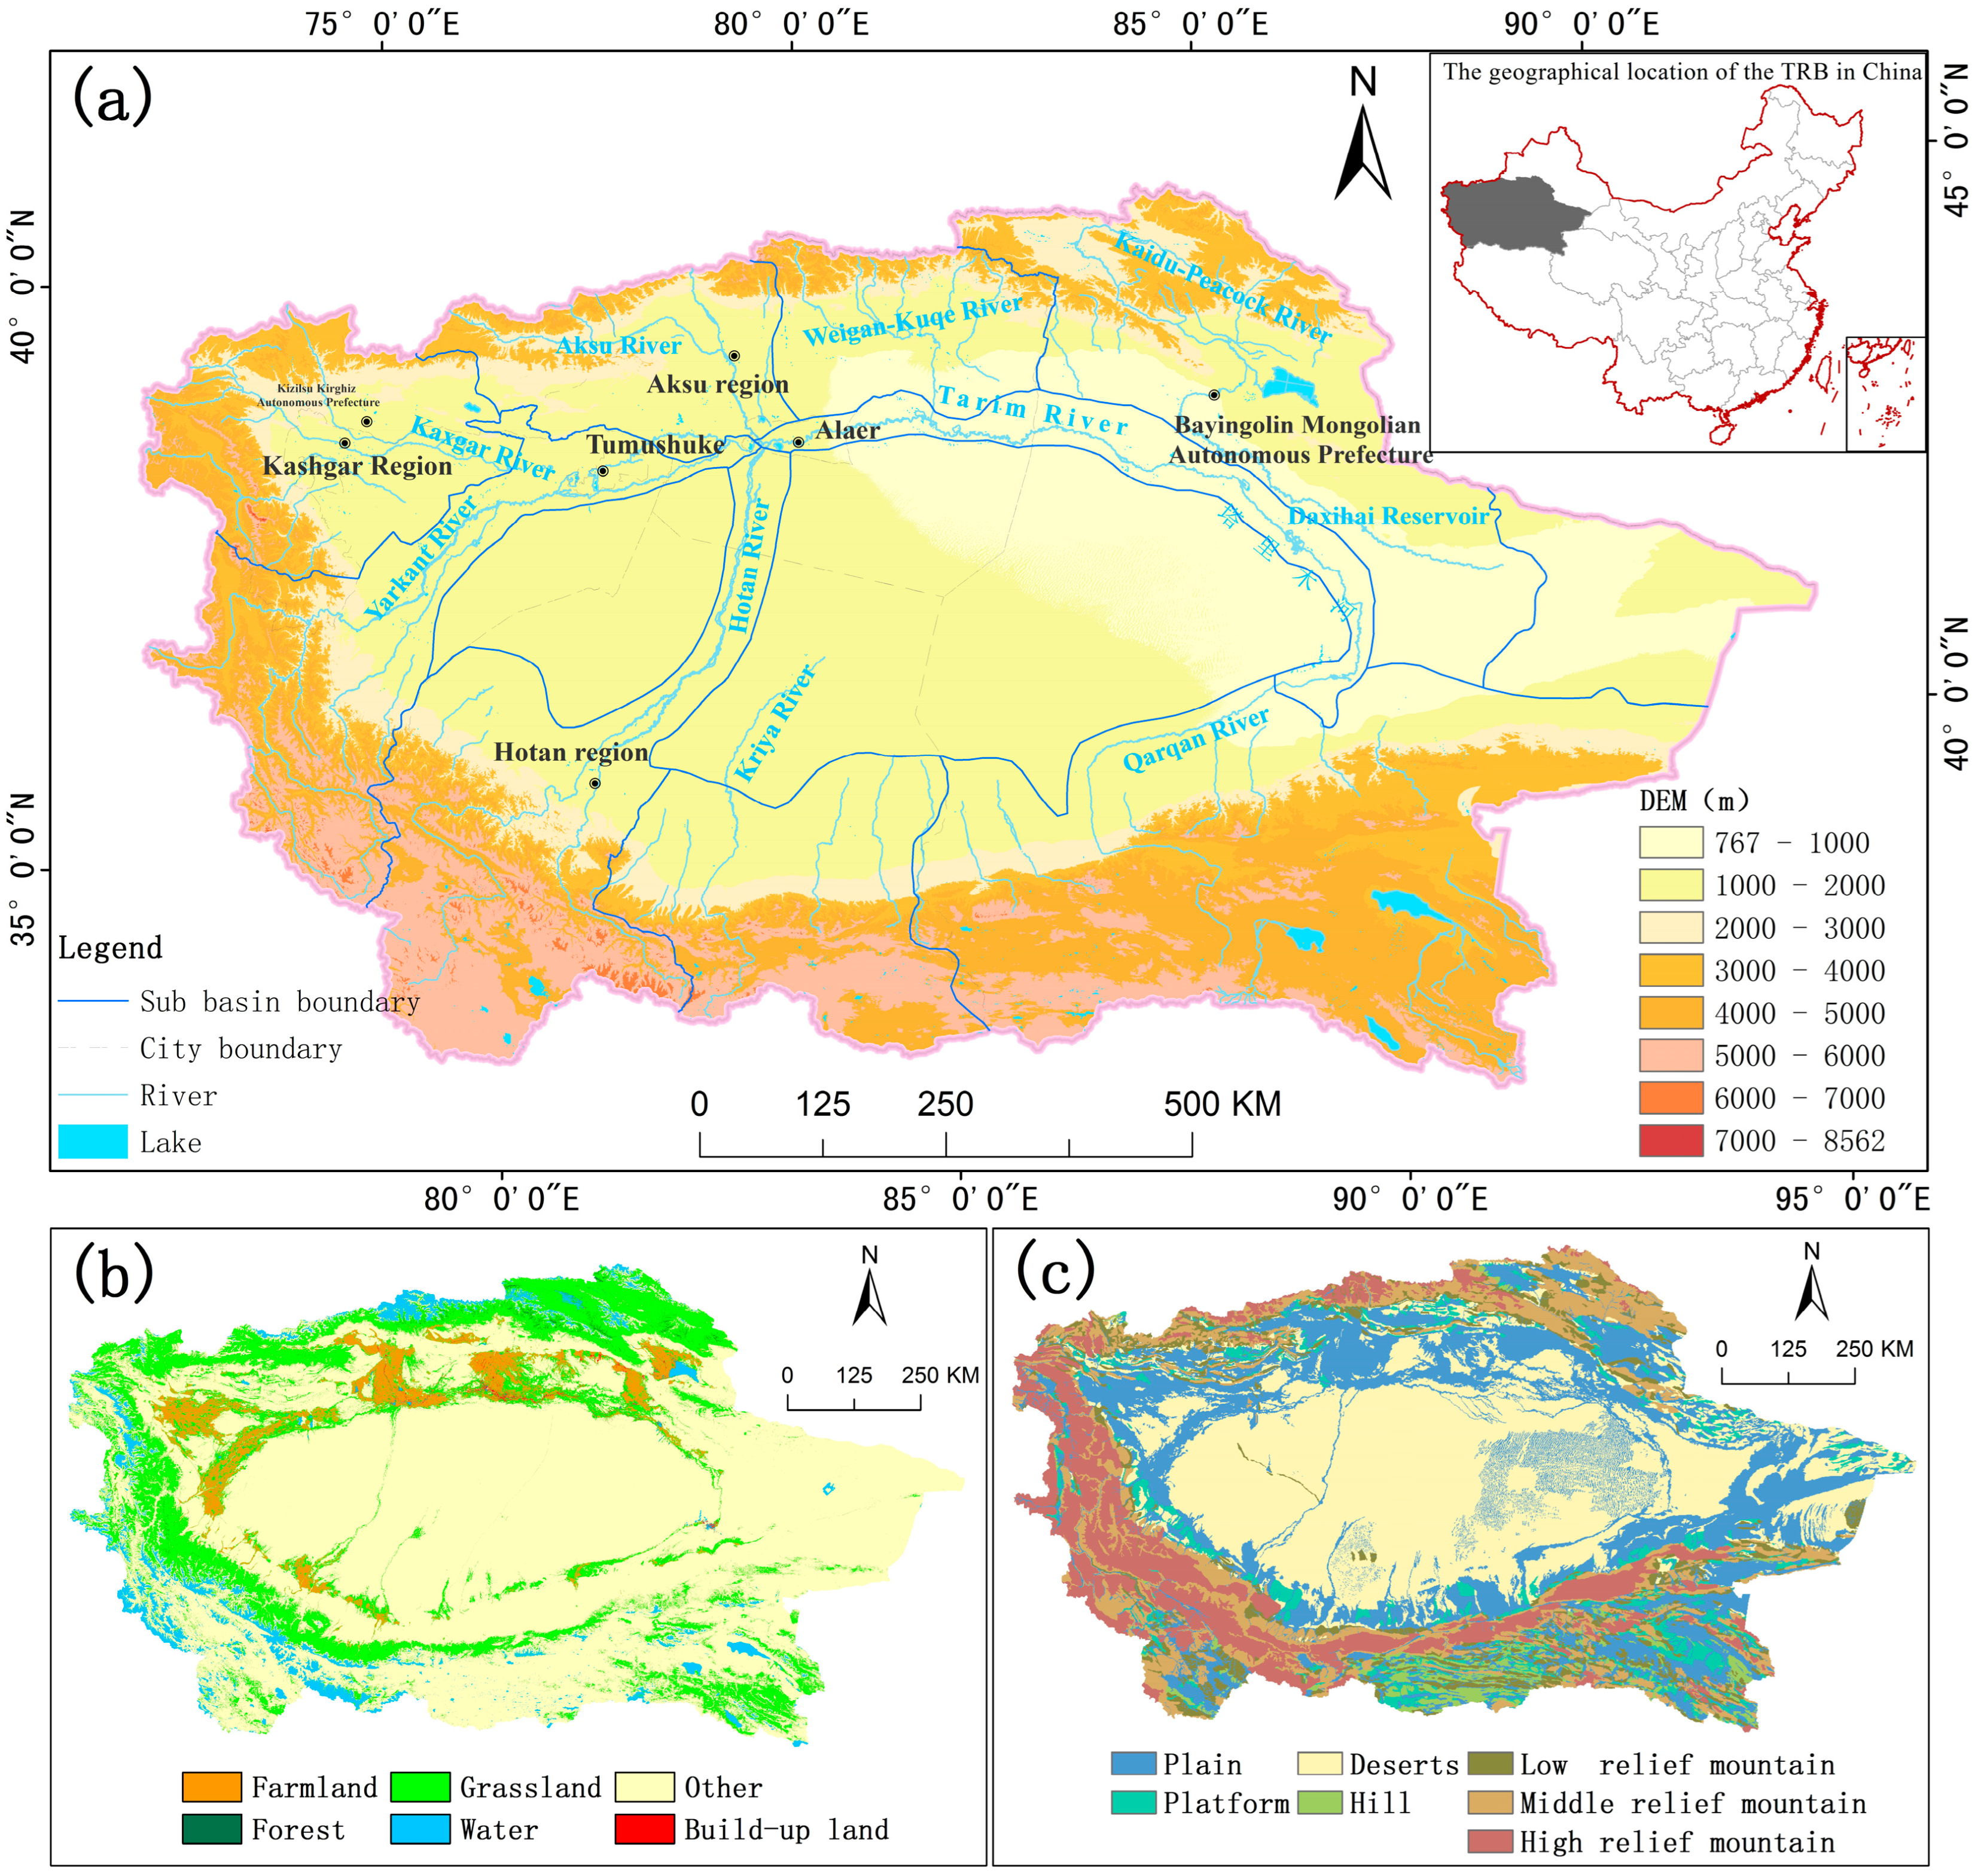
As illustrated in Figure 1a, the TRB is located in northwestern China between 71°39′–93°45′ E and 34°20′–43°39′ N, covering approximately 1.03 × 10⁶ km2 [28,29]. It represents China’s largest inland river basin and ranks among the most arid regions in Central Asia. Historically, the basin has served as a critical corridor along the ancient Silk Road, conferring significant geographical and cultural significance. The TRB is characterized by a distinctive annular landform (Figure 1c), in which the outer mountainous zone functions as the primary runoff formation area. Within this zone, glacial, meadow, and forest ecosystems are crucial for sustaining the ecological foundation of the basin and providing essential water conservation services. The oasis area of the Inner Ring Plain represents the primary concentration of human activities, where alluvial fans, river valleys, and farmland constitute critical zones for the maintenance of biodiversity, while also forming the most ecologically sensitive zone. The core desert area is characterized by extreme aridity. The expansion dynamics and aeolian sand activities directly indicate the potential ecological risks of land degradation. Regional connectivity largely relies on the main stem of the Tarim River, which extends approximately 2486 km [30,31] and represents a singular and fragile hydrological link, underscoring the high ecological sensitivity of the watershed. Concurrently, the combined effects of intense arid stress, intensive human activities, and topographic enclosure have subjected the TRB to persistent ecological risks. In summary, as a representative example of arid inland river basins worldwide, the TRB exerts environmental influences that extend across both China and Central Asia.
Figure 1.
Study area geography and features: (a) Altitudes and watershed boundaries; (b) Land use; (c) Geomorphic classification distribution.
2.2. Data
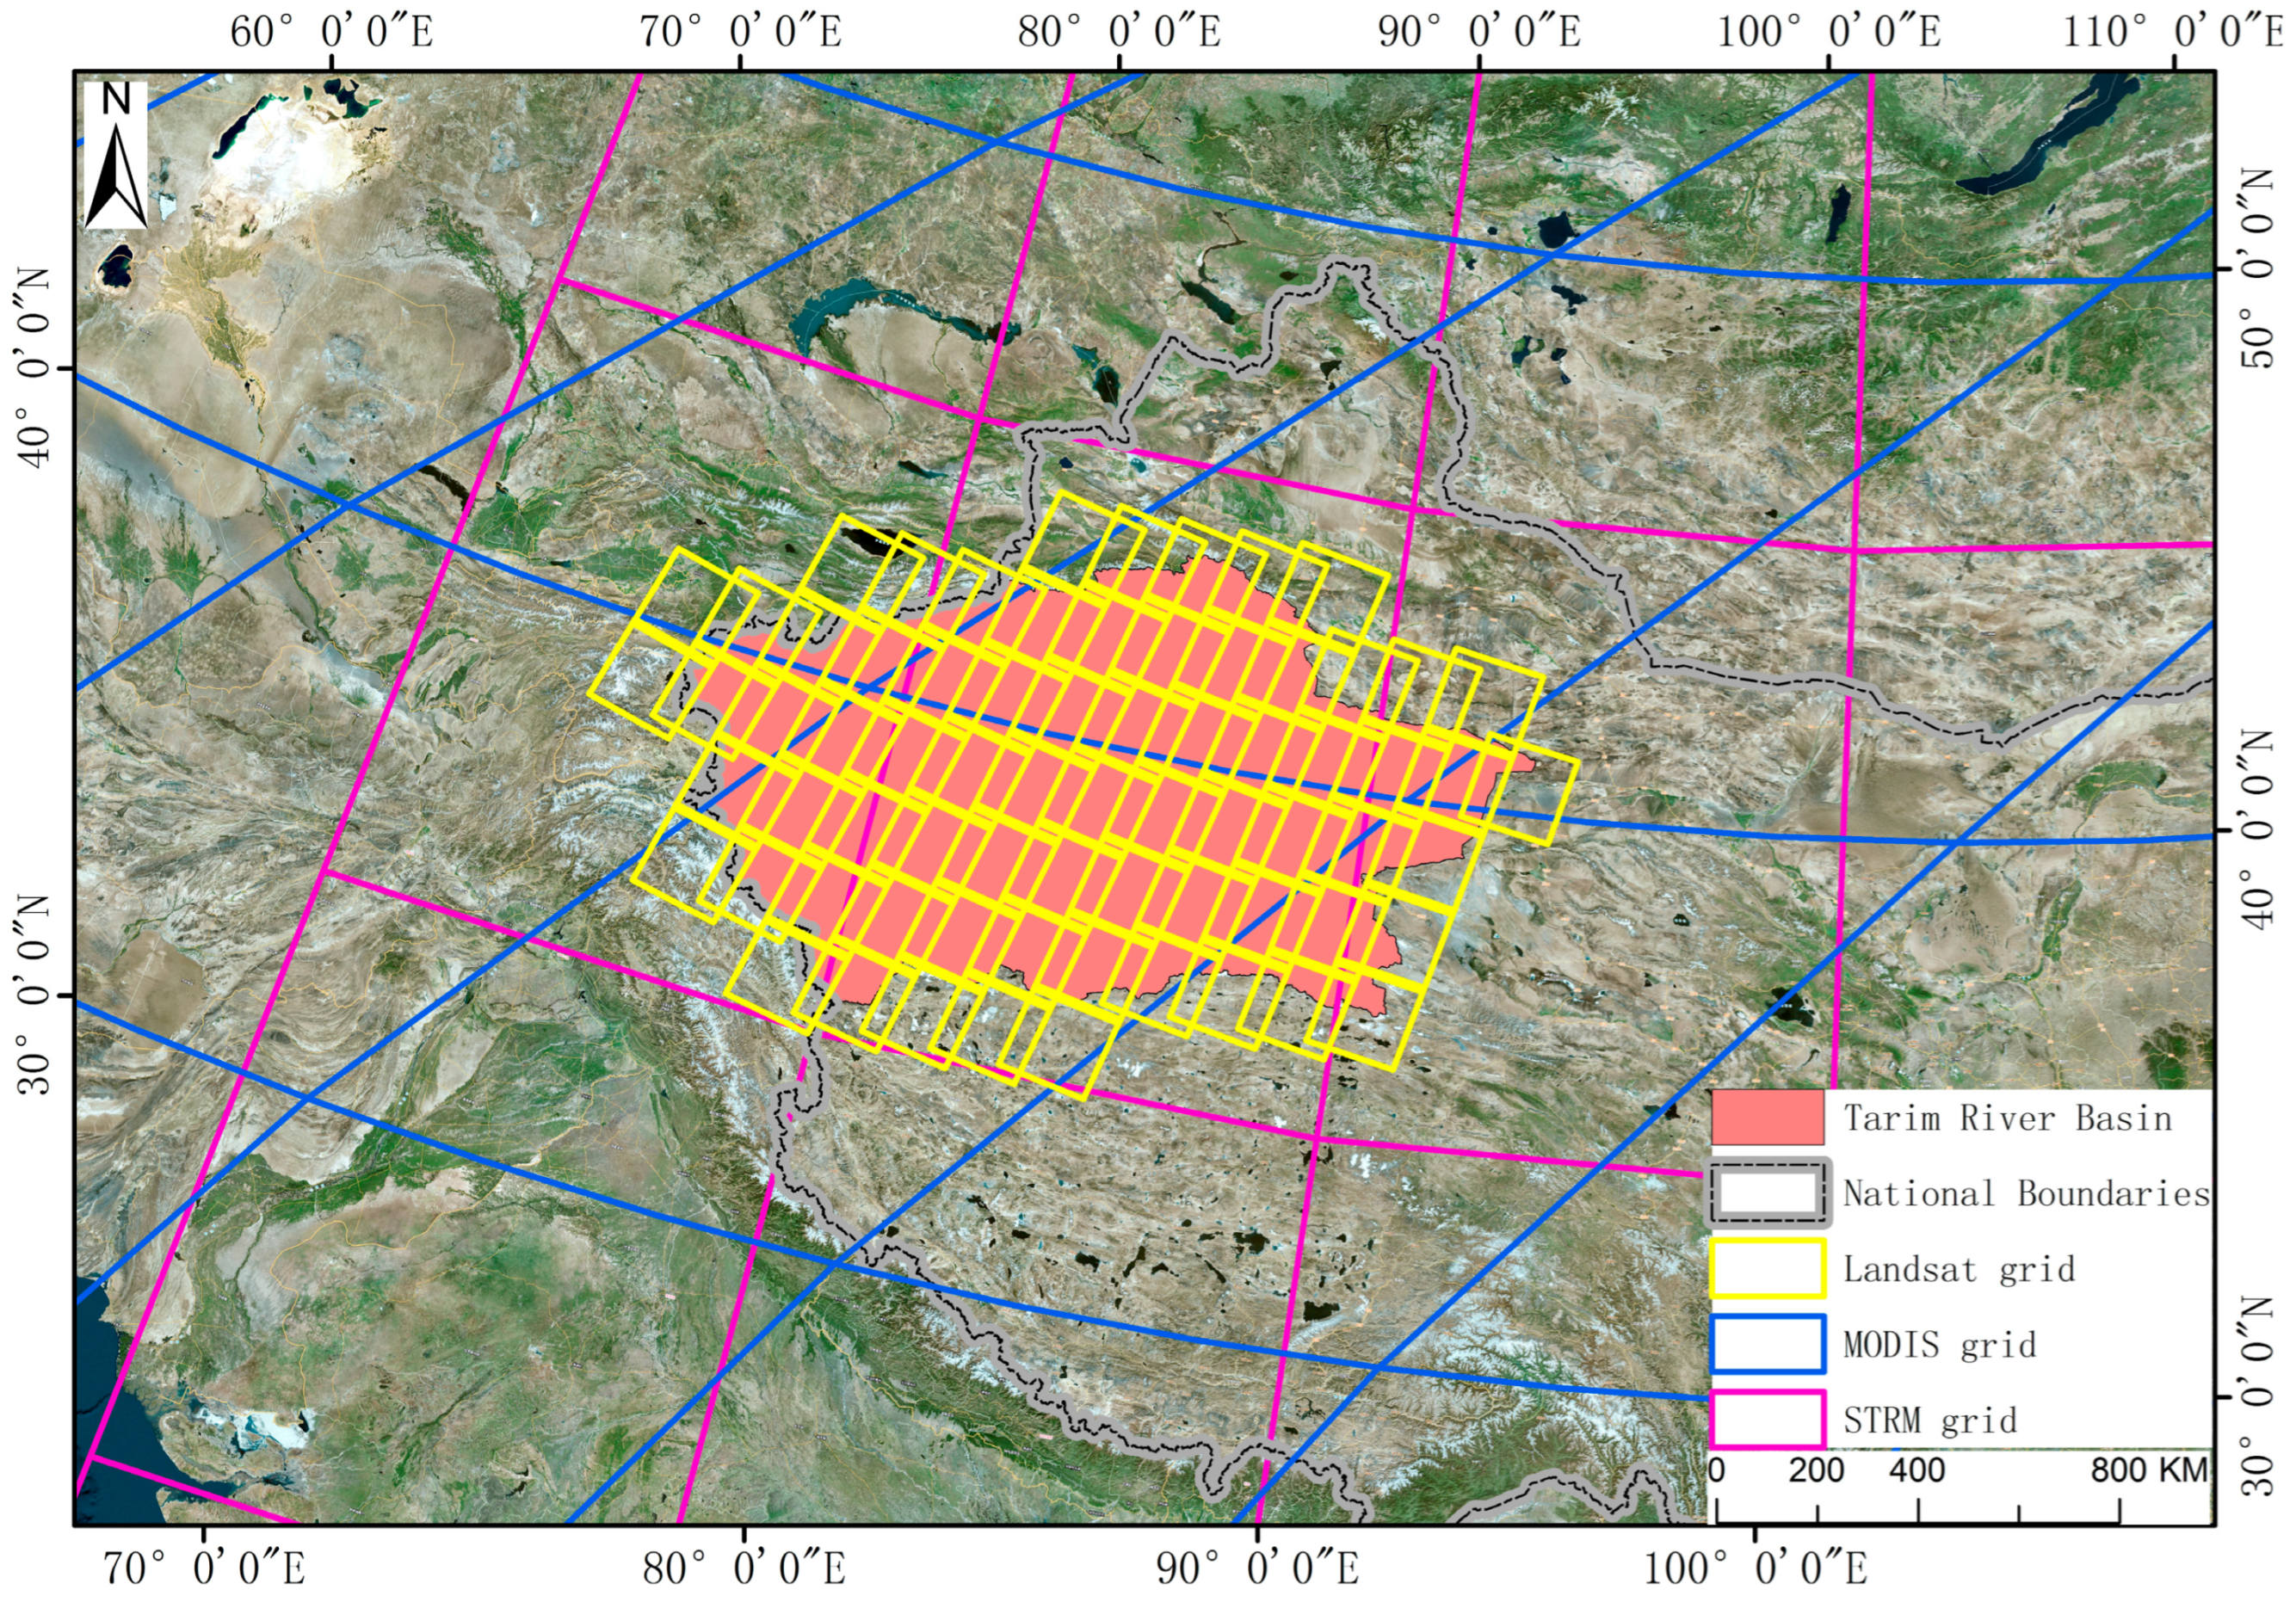
This study utilized multisource datasets (Figure 2 and Table 1), encompassing five categories: ecological, remote sensing, meteorological, socioeconomic, and fundamental geographic information. Three time points (2000, 2010, and 2020) were selected to capture the long-term ecological evolution trends in the TRB. The datasets included ecological data (Land use, Normalized Difference Vegetation Index (NDVI), Net Primary Productivity (NPP), Digital Elevation Model (DEM), and soil properties), remote sensing data (Landsat 8), meteorological data (temperature, precipitation, and potential evapotranspiration), population activity data (Nighttime light, Population density, Gross Domestic Product (GDP)), and feature attribute data (watershed boundaries, rivers, and roads). To ensure spatial resolution consistency across all datasets, all data were resampled to 1 km resolution and uniformly projected onto the WGS_1984_Albers coordinate system.
Figure 2.
Distribution of data of the study region.
Table 1.
Date types, sources, and description.
3. Methods
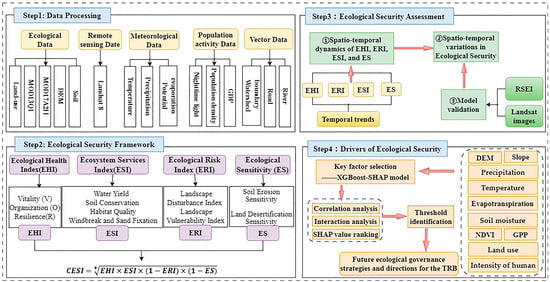
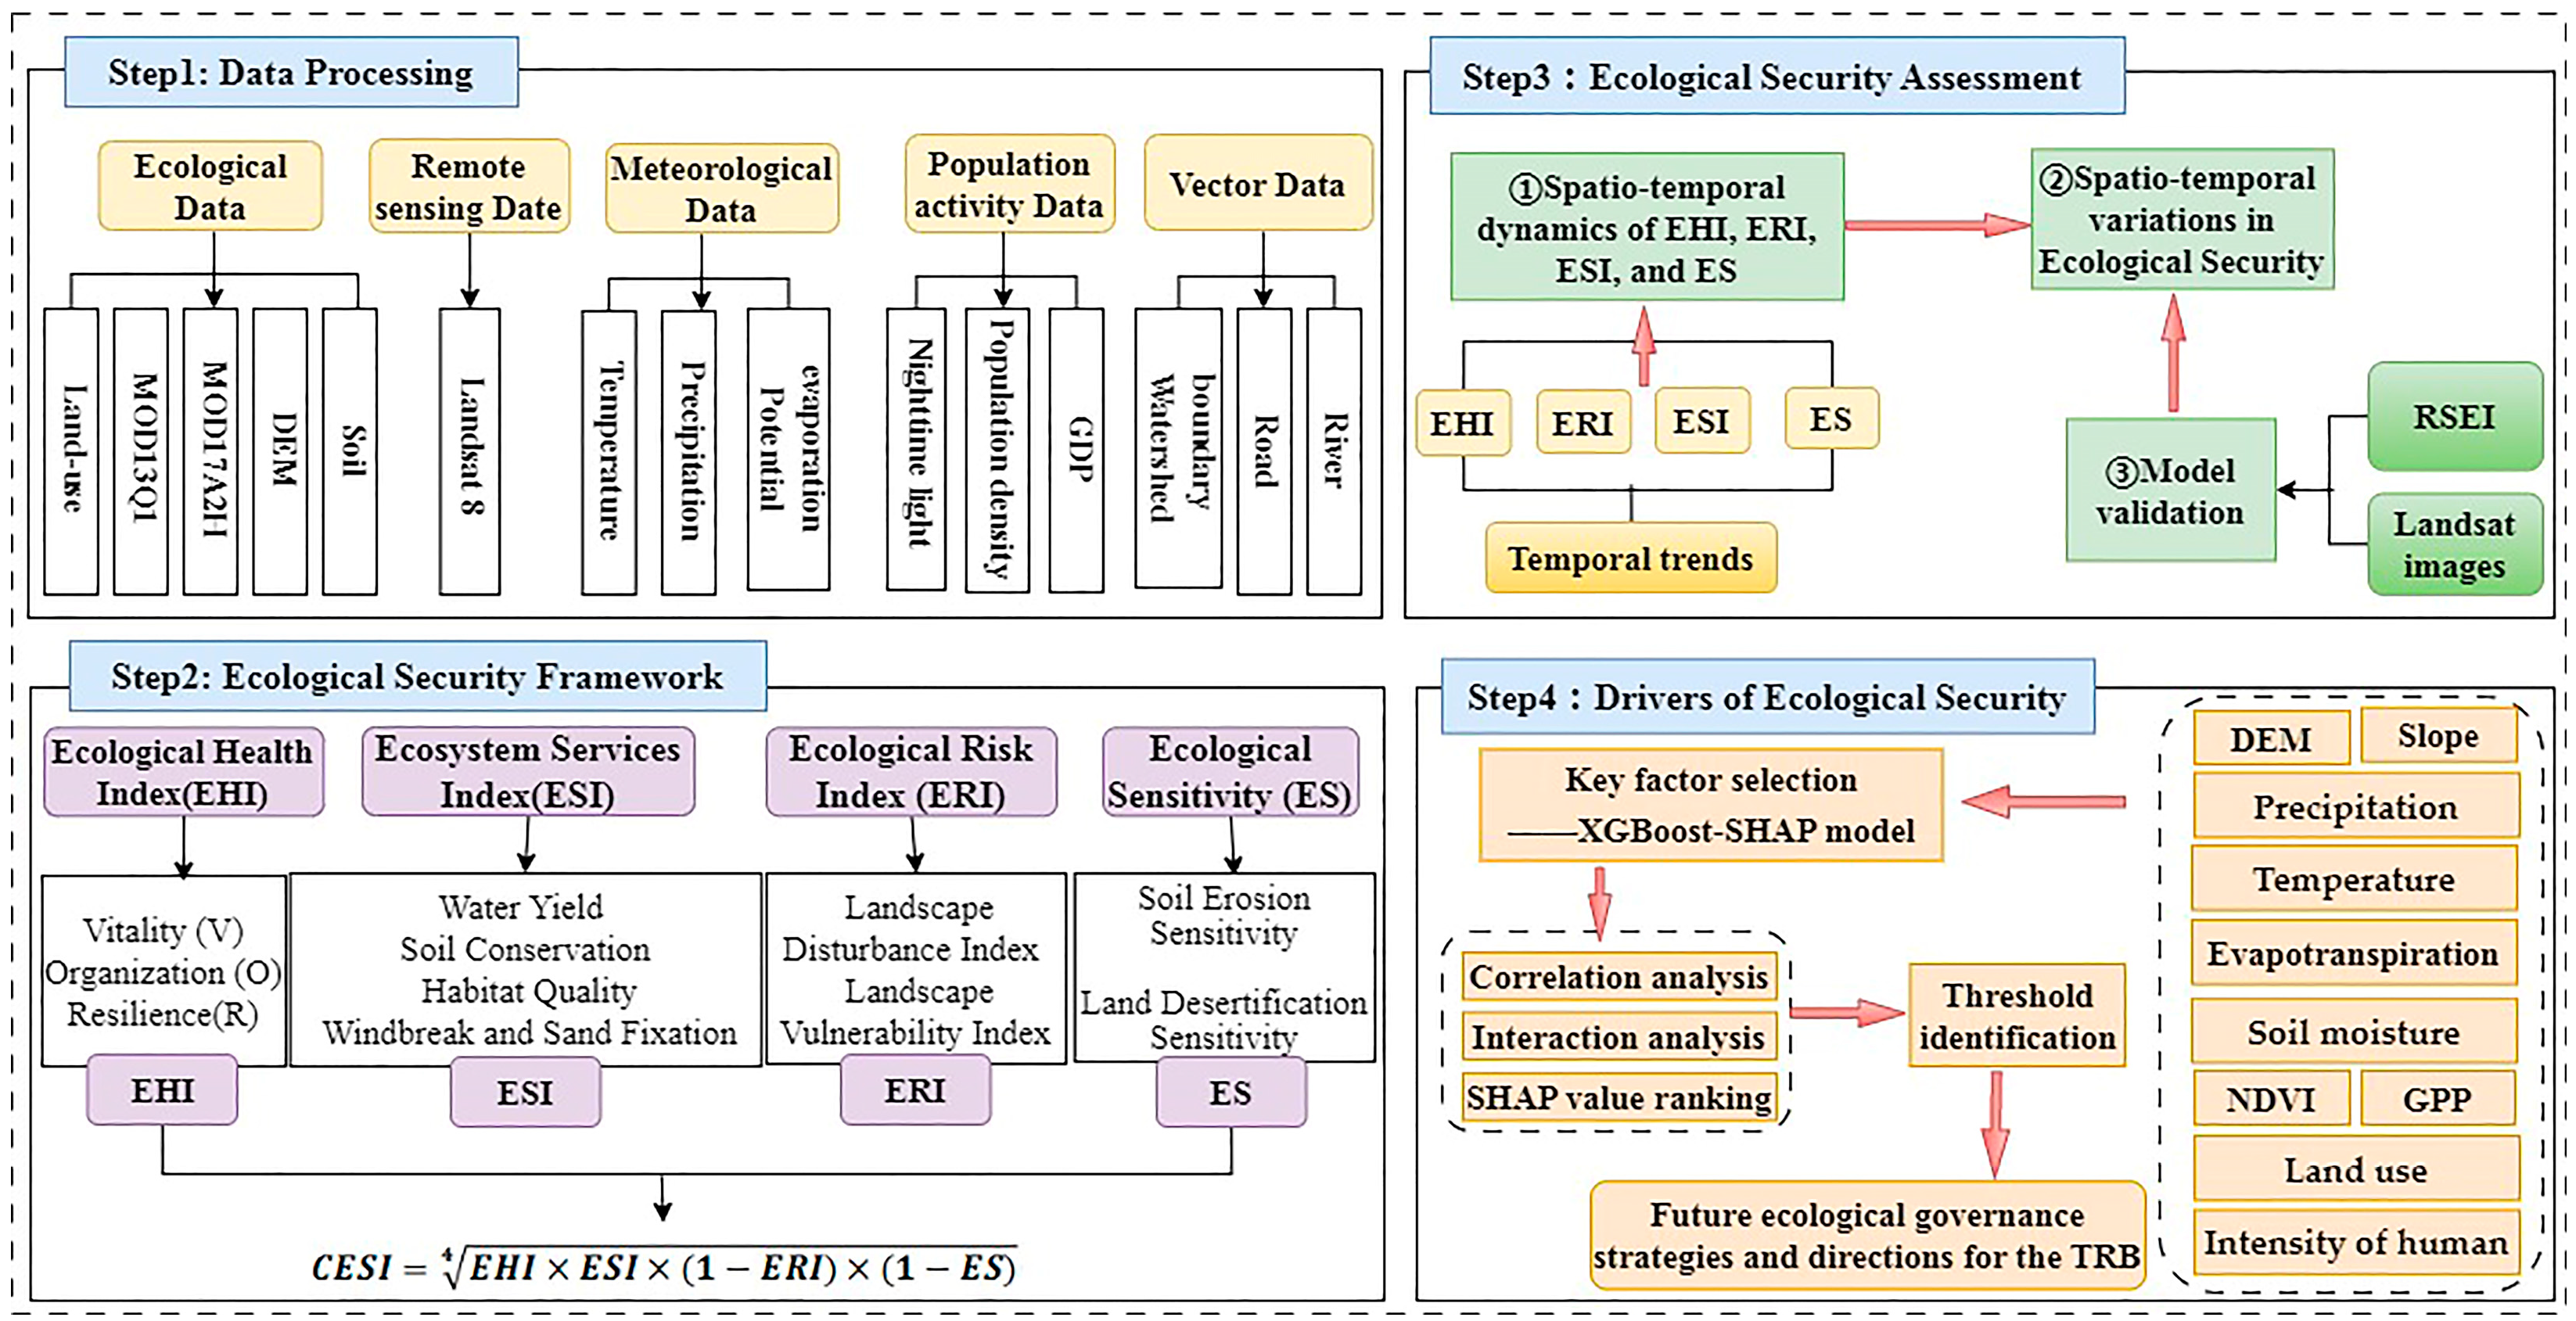
This study employs quantitative analysis and interpretable machine learning models to reveal the spatiotemporal evolution patterns and driving mechanisms of ecological security in arid inland river basins. Figure 3 presents the conceptual framework of this research, which is composed of four principal components. Step 1 involves data collection and preprocessing. Step 2 constructs an integrated assessment framework by combining the Ecological Health Index (EHI), Ecological Risk Index (ERI), Ecosystem Service Index (ESI), and Ecological Sensitivity (ES) to systematically evaluate the ecological security status of the watershed and analyze its spatial differentiation. In this step, the EHI was assessed using the Vigor-Organization-Resilience (VOR) model. The ERI was evaluated through the Landscape Disturbance Index and the Landscape Vulnerability Index. The ESI was assessed via the InVEST model, incorporating indicators of Water Yield, Soil Conservation, Habitat Quality, and Windbreak and Sand Fixation. The ES was evaluated based on indicators of Land Desertification and Soil Erosion (Section 3.1). Step 3 introduces the Remote Sensing Ecological Index (RSEI) and Landsat imagery to validate the reliability of the evaluation results (Section 3.2). Step 4 identifies key factors influencing ecological security using the XGBoost–SHAP model (Section 3.3).
Figure 3.
Workflow of this study.
3.1. Construction of the Health–Service–Risk–Sensitivity (HSRS) Ecological Security Framework
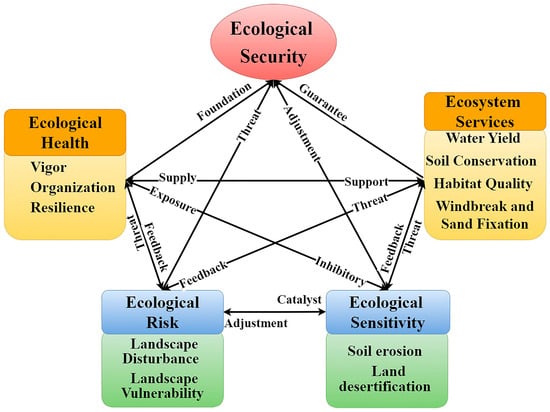
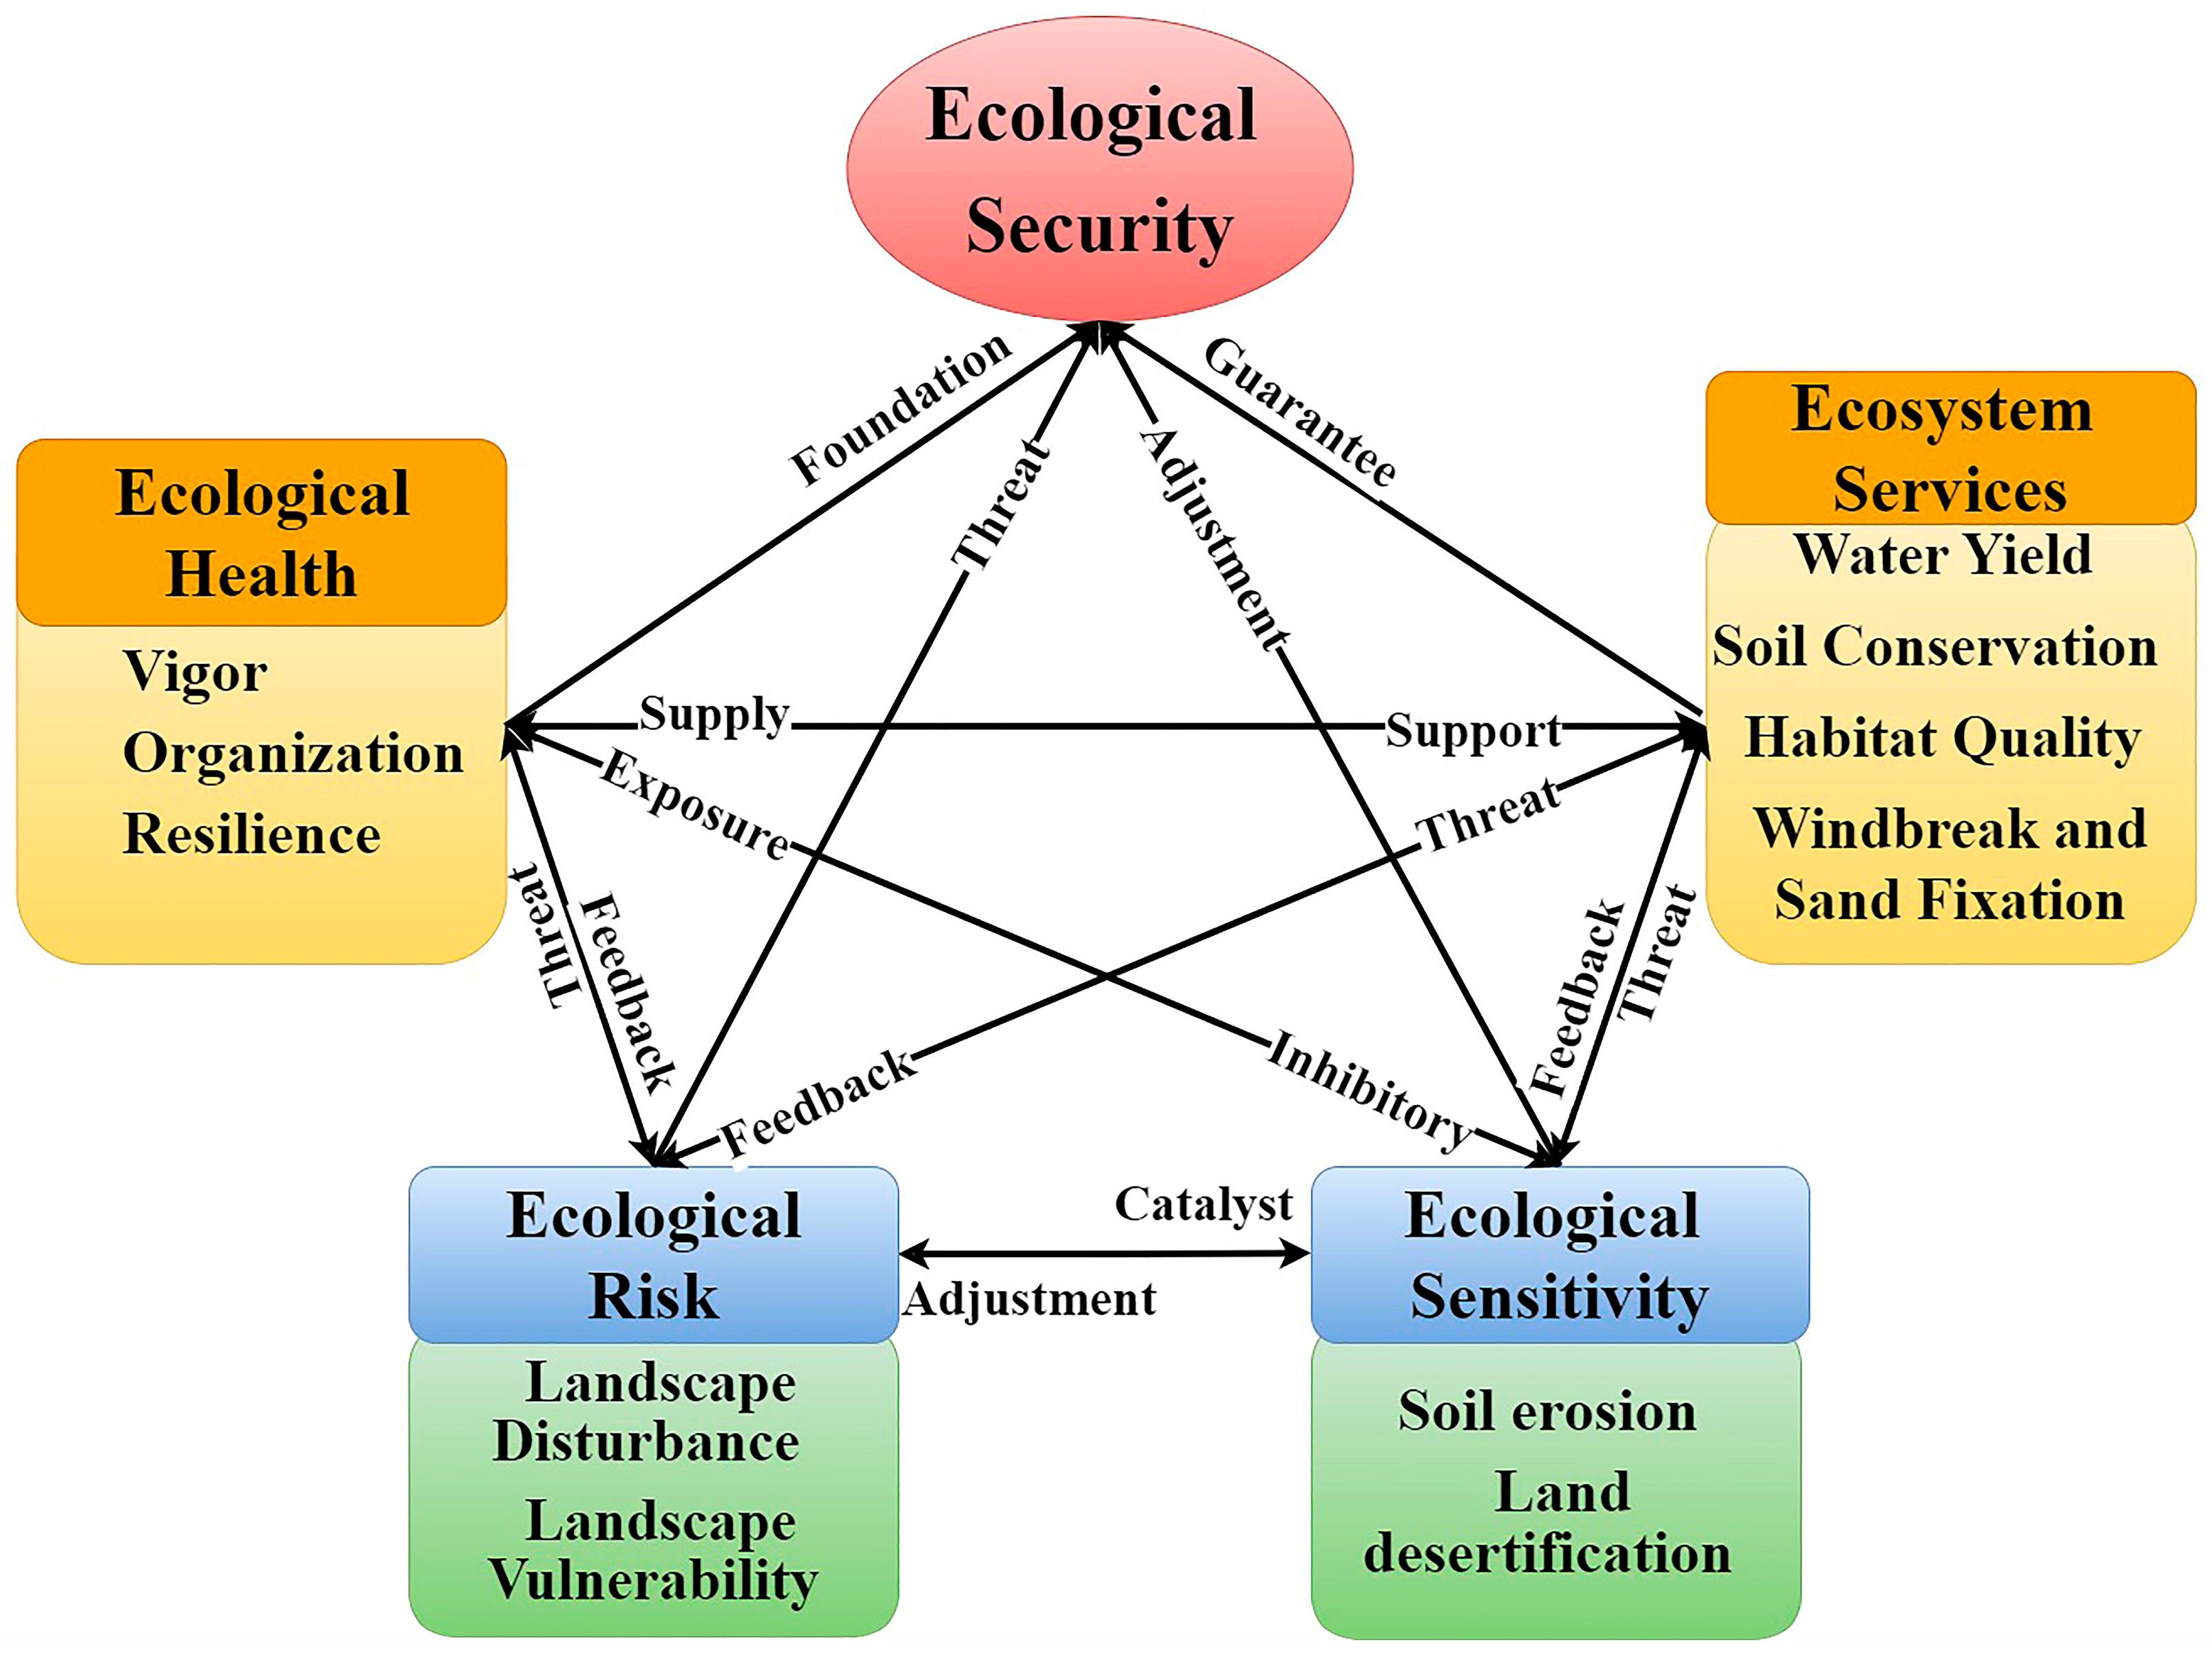
This study develops a framework for assessing ecological security, focusing on the dynamic and ongoing feedback mechanisms between human activities and environmental conditions [32]. Ecological health indicates the structural and functional condition of ecosystems, including vitality, organization, and resilience, which form the fundamental basis for regional ecological security. Ecological services are directly vulnerable to external disturbances and act as an intermediate moderator in the transformation of risk into actual impacts. On the one hand, higher sensitivity implies greater susceptibility to structural and functional degradation under equivalent risk conditions. On the other hand, healthy ecosystems typically exhibit lower sensitivity, thereby enabling them to better sustain service provision. Accordingly, ecological health, ecosystem services, ecological risk, and ecological sensitivity collectively form a complete causal chain of “State-Supply-Threat-Vulnerability” (Figure 4). The core objectives of this framework are to maintain ecosystem health, reduce ecological risks and sensitivities, and enhance ecosystem services. Drawing on previous studies of multidimensional indicator evaluation systems [33,34,35], the Comprehensive Ecological Security Index (CESI) is calculated using the min-max normalized values of the EHI, ESI, ERI, and ES. The CESI quantitatively evaluates the dynamic changes and spatial patterns in regional ecological security levels, offering data support for analyzing their evolutionary trends. The CESI is defined as follows:
where EHI refers to the Ecological Health Index, ERI represents the Ecological Risk Index, ESI refers to the Ecosystem Services Index, and ES stands for the Ecological Sensitivity Index.
Figure 4.
Health, Service, Risk, and Sensitivity relationship diagram under the HSRS framework.
3.1.1. Ecological Health Index (EHI)
Ecosystem Health is fundamental to ecological security and underpins its long-term stability [3,36]. This study was implemented using ArcGIS 10.8 software and the R 4.3.2 software, in which the EHI was constructed based on the VOR framework [37]. It is summarized in Table 2.
Table 2.
Ecosystem health evaluation index system.
This article refers to previous research results [8,20,36] and the land use and ecological quality situation in the TRB, and sets resilience and resistance coefficients for different land use types, as shown in Table 3.
Table 3.
Resilience and resistance coefficients of different land use types.
3.1.2. Ecosystem Services Index (ESI)
This study utilized a method that integrates multi-source data and model coupling to measure ecosystem services. The InVEST model was employed to quantify and map four critical ecosystem services, covering Water Yield [38], Soil Conservation [39], Habitat Quality [33,36], and Windbreak and Sand Fixation [34]. A higher ESI represents a stronger capacity of the ecosystem to deliver these essential services [8]. Previous studies indicate that these four ecosystem services are interrelated and non-substitutable [20,40]. However, existing research on the TRB has not yet clarified the relative importance of these services in supporting sustainable development in arid regions. Therefore, an equal-weighting scheme was adopted, assigning a weight of 0.25 to each ecosystem service. The mathematical formulation is defined as follows:
where ESi represents the normalized value of the i-th ecosystem service function, and wi denotes its corresponding weight.
3.1.3. Ecological Risk Index (ERI)
The ERI evaluates potential risks from the perspective of landscape pattern. It integrates multiple landscape metrics, including fragmentation, isolation, dominance, and vulnerability, to quantify risks associated with alterations in land use structure [41]. This approach indirectly elucidates the threats posed by landscape pattern changes resulting from human activities. Spatial analysis and landscape metric calculations were performed using Fragstats 4.2 software. Ecological Risk for each grid cell was quantified using two key indicators: the Landscape Disturbance Index (LDIi) and the Landscape Vulnerability Index (LVIi). The spatial distribution of ERI was further examined by interpolating values across different periods using the Kriging method [42]. The detailed calculation procedure for ERI is provided in Table 4.
Table 4.
Calculation method for Landscape Ecological Risk Index.
3.1.4. Ecological Sensitivity (ES)
Unlike the ERI, ES primarily reflects an ecosystem’s vulnerability to adverse changes induced by stress factors, with a greater focus on its inherent characteristics and intrinsic vulnerability [43]. The greater the sensitivity exhibited by an ecosystem, the more susceptible it becomes to external disruptions. ES constitutes a pivotal metric for evaluating regional ecological stability [44]. In this study, sensitivity analysis was conducted for two key factors prone to triggering ecological crises: soil erosion sensitivity and land desertification sensitivity. ArcGIS 10.8 software was employed to evaluate and map ecological sensitivity. Given their equal importance within arid inland watersheds, these factors were spatially integrated using an equal-weight overlay approach [45]. The formula is expressed as:
where ES represents the Composite Ecological Sensitivity Index, Pi denotes the standardized value of the i-th ecological sensitivity factor, and wi indicates the corresponding weight assigned to that factor.
- Soil Erosion Sensitivity
To evaluate sensitivity to soil erosion, the following indicators were selected: rainfall erosivity, soil erodibility, slope length, and vegetation cover. The sensitivity was calculated by multiplying the normalized values of each individual factor, reflecting their combined influence on soil erosion vulnerability. The formula is expressed as:
where Si denotes the soil erosion sensitivity index at the pixel level; Ri represents rainfall erosivity, Ki refers to soil erodibility, LSi indicates slope length, and Ci corresponds to the vegetation cover.
- 2.
- Land Desertification Sensitivity
To assess sensitivity to land desertification, the following indicators were selected: aridity index, number of sandstorm days, soil texture, and vegetation cover. The sensitivity maps of individual factors were overlaid through multiplicative operations to generate a comprehensive land desertification sensitivity distribution map for the study area [46].
In this context, Di signifies the composite sensitivity index related to soil erosion and desertification for pixel i; Ii refers to the aridity index; Wi represents the count of days affected by wind erosion (sandstorms); Ki denotes the type of soil texture; and Ci pertains to the level of vegetation cover.
3.2. Validation of the HSRS Ecological Security Framework
Considering the vast area of the TRB and the challenges associated with field sampling, this research utilizes the RSEI to verify the precision of the CESI. Using Landsat imagery, a time-series-based RSEI was generated using Principal Component Analysis via the Google Earth Engine (GEE) platform. The RSEI is an indicator specifically designed for efficiently monitoring and evaluating ecological conditions using remote sensing technology [13,47]. It integrates four key indicators representing distinct ecological properties: greenness (NDVI), wetness (WET), Dryness (the normalized difference built-up and soil index (NDBSI), derived from bare-soil and built-up indices), and Heat (land surface temperature, LST) [48]. Based on its ecological relevance, the first principal component (PC1) was extracted to construct the preliminary RSEI (RSEI0) [13,49]. The RSEI is calculated as follows [34]:
It is important to note that selecting RSEI for model validation in this study essentially involves an independent comparison between the constructed multidimensional ecological security assessment result (CESI) and RSEI, which focuses on the natural surface environment. A high correlation between the two will enhance the credibility of the CESI results. Furthermore, through in-depth analysis of the areas where discrepancies exist between them, we can further strengthen the rigor of the model validation.
3.3. Driving Factor Analysis
This study employed an analytical framework that combined the XGBoost model with the SHAP method within a Python 3.8 environment to quantitatively assess the magnitude and direction of the influences of topography, climate, vegetation, soil, and human activities on the TRB composite ecological security index [34]. The SHAP method determines the importance of each feature to a model’s predictions by systematically evaluating the contribution of each feature across all feature combinations [50]. The formula is expressed as:
where xpq represents the q-th feature value of the p-th feature; y represents the composite ecosystem security function value; ψ0 is the mean value of the composite CESI function; and SHAP (xpq) quantifies the contribution of the q-th feature variable to y. The larger the absolute value, the greater the impact of the feature variable on the comprehensive CESI function. When SHAP (xpq) > 0, an increase in the feature value enhances the composite CESI; conversely, when SHAP (xpq) < 0, an increase in the feature value diminishes the composite CESI. This study constructs a dataset using CESI results from 2000, 2010, and 2020 as dependent variables, with driving factors serving as independent variables. The XGBoost model was implemented in Python 3.8 environment, with the dataset split into training and testing subsets at a 7:3 ratio to support model training and validation. Hyperparameter optimization using GridSearch CV showed superior predictive performance on both training and testing datasets, with parameters set as max_depth = 31, learning_rate = 0.02, n_estimators = 500, and colsample_bytree = 0.5 [21,27,50].
The spatial distribution of TRB ecological security results from the intricate interplay among its influencing factors. This study focuses on the spatial heterogeneity of natural and socio-economic factors and explores their impacts. The data is displayed in Table 5.
Table 5.
Driving factors of ecological security.
4. Results
4.1. Ecological Security Assessment
4.1.1. Spatio-Temporal Dynamics of EHI, ERI, ESI, and ES
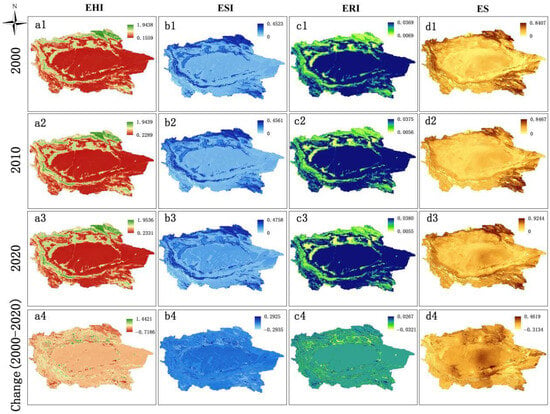
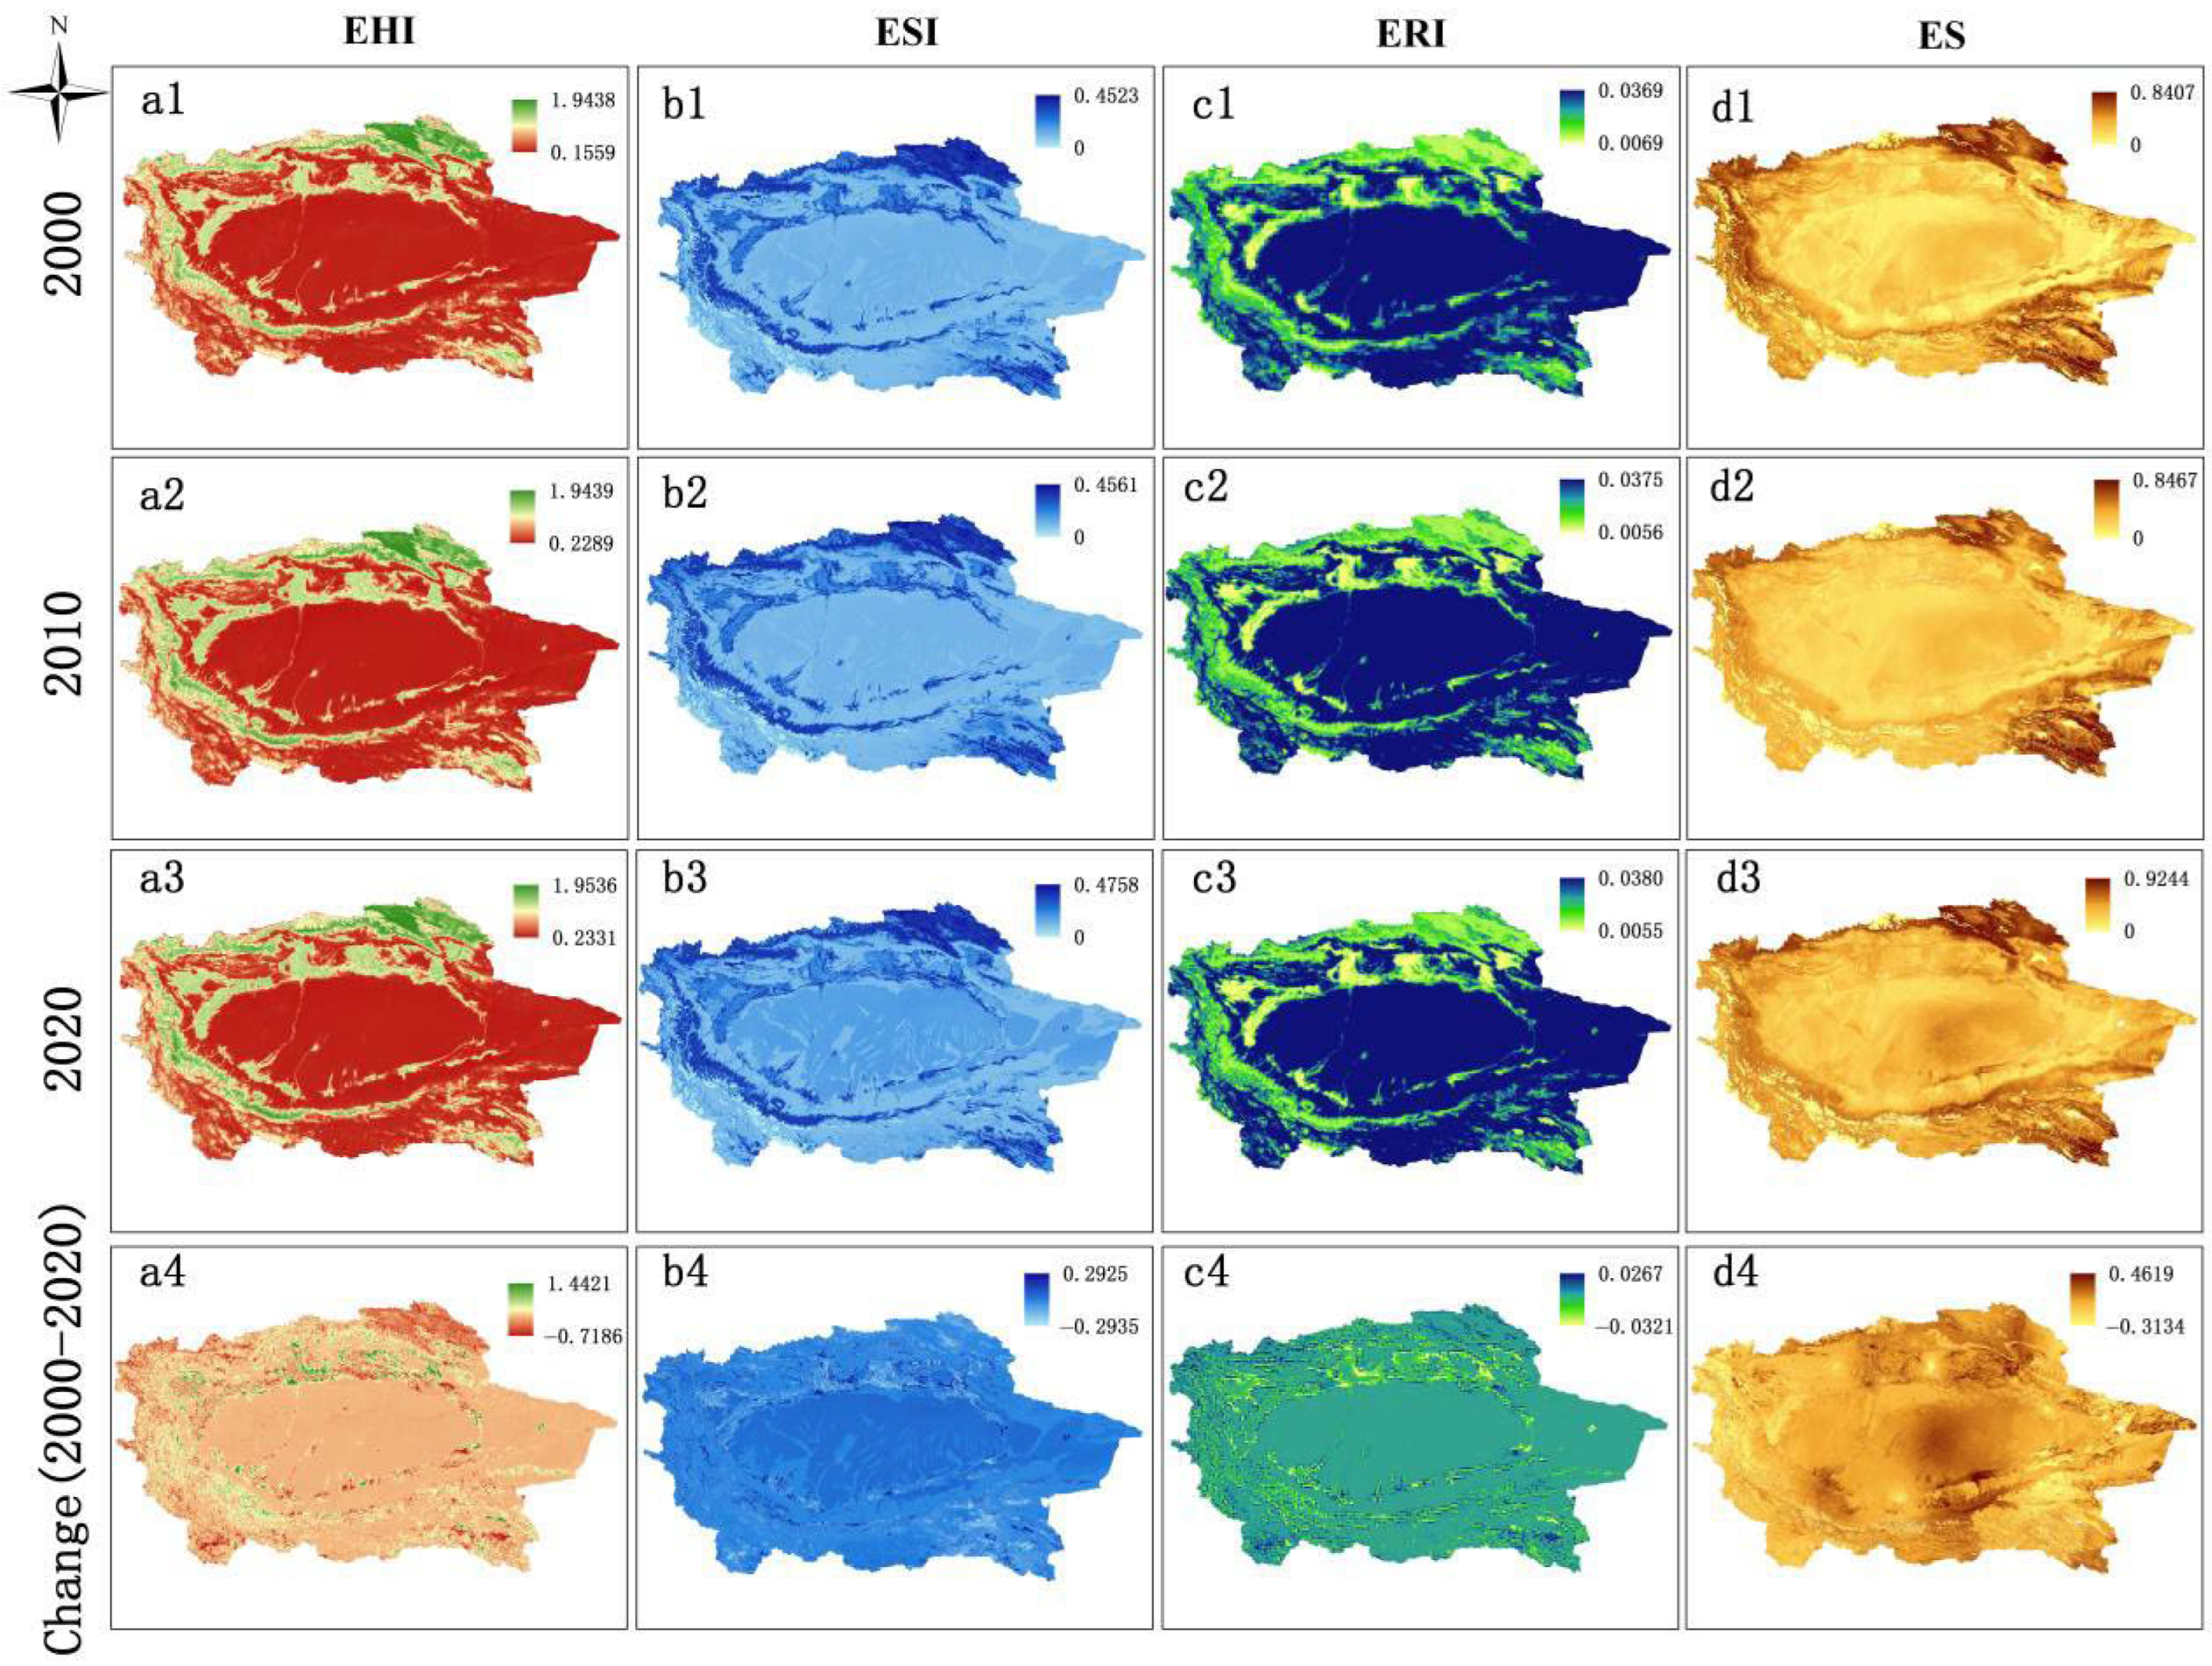
Figure 5 shows significant spatial heterogeneity in the EHI, ESI, ERI, and ES across the TRB. Over the 2000–2020 period, the average EHI showed a steady rise, increasing from 0.6466 to 0.7212. In general, the EHI exhibits a ring-shaped distribution, with higher values in the surrounding mountainous areas and lower values in the central desert region. Areas with higher EHI display pronounced spatial clustering, primarily surrounding the mountainous regions of the watershed and extending into the central oasis zone (Figure 5(a1–a4)). Conversely, areas with low EHI values are primarily situated in ecologically fragile zones, including the central-eastern deserts, the piedmont Gobi, and the southern foothills of the Altun Mountains.
Figure 5.
Spatio-temporal evolution of (a1–a4) EHI, (b1–b4) ESI, (c1–c4) ERI, and (d1–d4) ES in the TRB, 2000–2020.
The spatial differentiation of ESI closely aligns with that of EHI, with both indices gradually decreasing from the watershed edges toward the central region. The average ESI increased from 0.1148 in 2000 to 0.1231 in 2020, indicating an upward trend. Areas with high ESI values are mainly located across forested and grassland regions within the mountainous zones surrounding the river basin (Figure 5(b1–b4)). The TRB showed a continuous decrease in overall ecological risk, as average ERI values of 0.0321, 0.0309, and 0.0307 for 2000, 2010, and 2020 (Figure 5(c1–c4)). Regarding ES, regions with high fragility are mainly distributed across the central-eastern desert band, the pre-mountain oasis transition zone, and the Yarkant River basin oasis (Figure 5(d1–d4)).
4.1.2. Spatio-Temporal Variations in Ecological Security
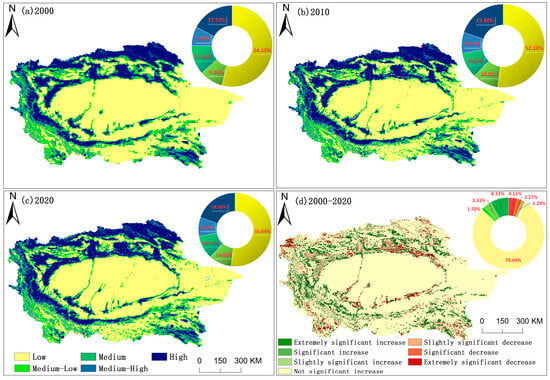
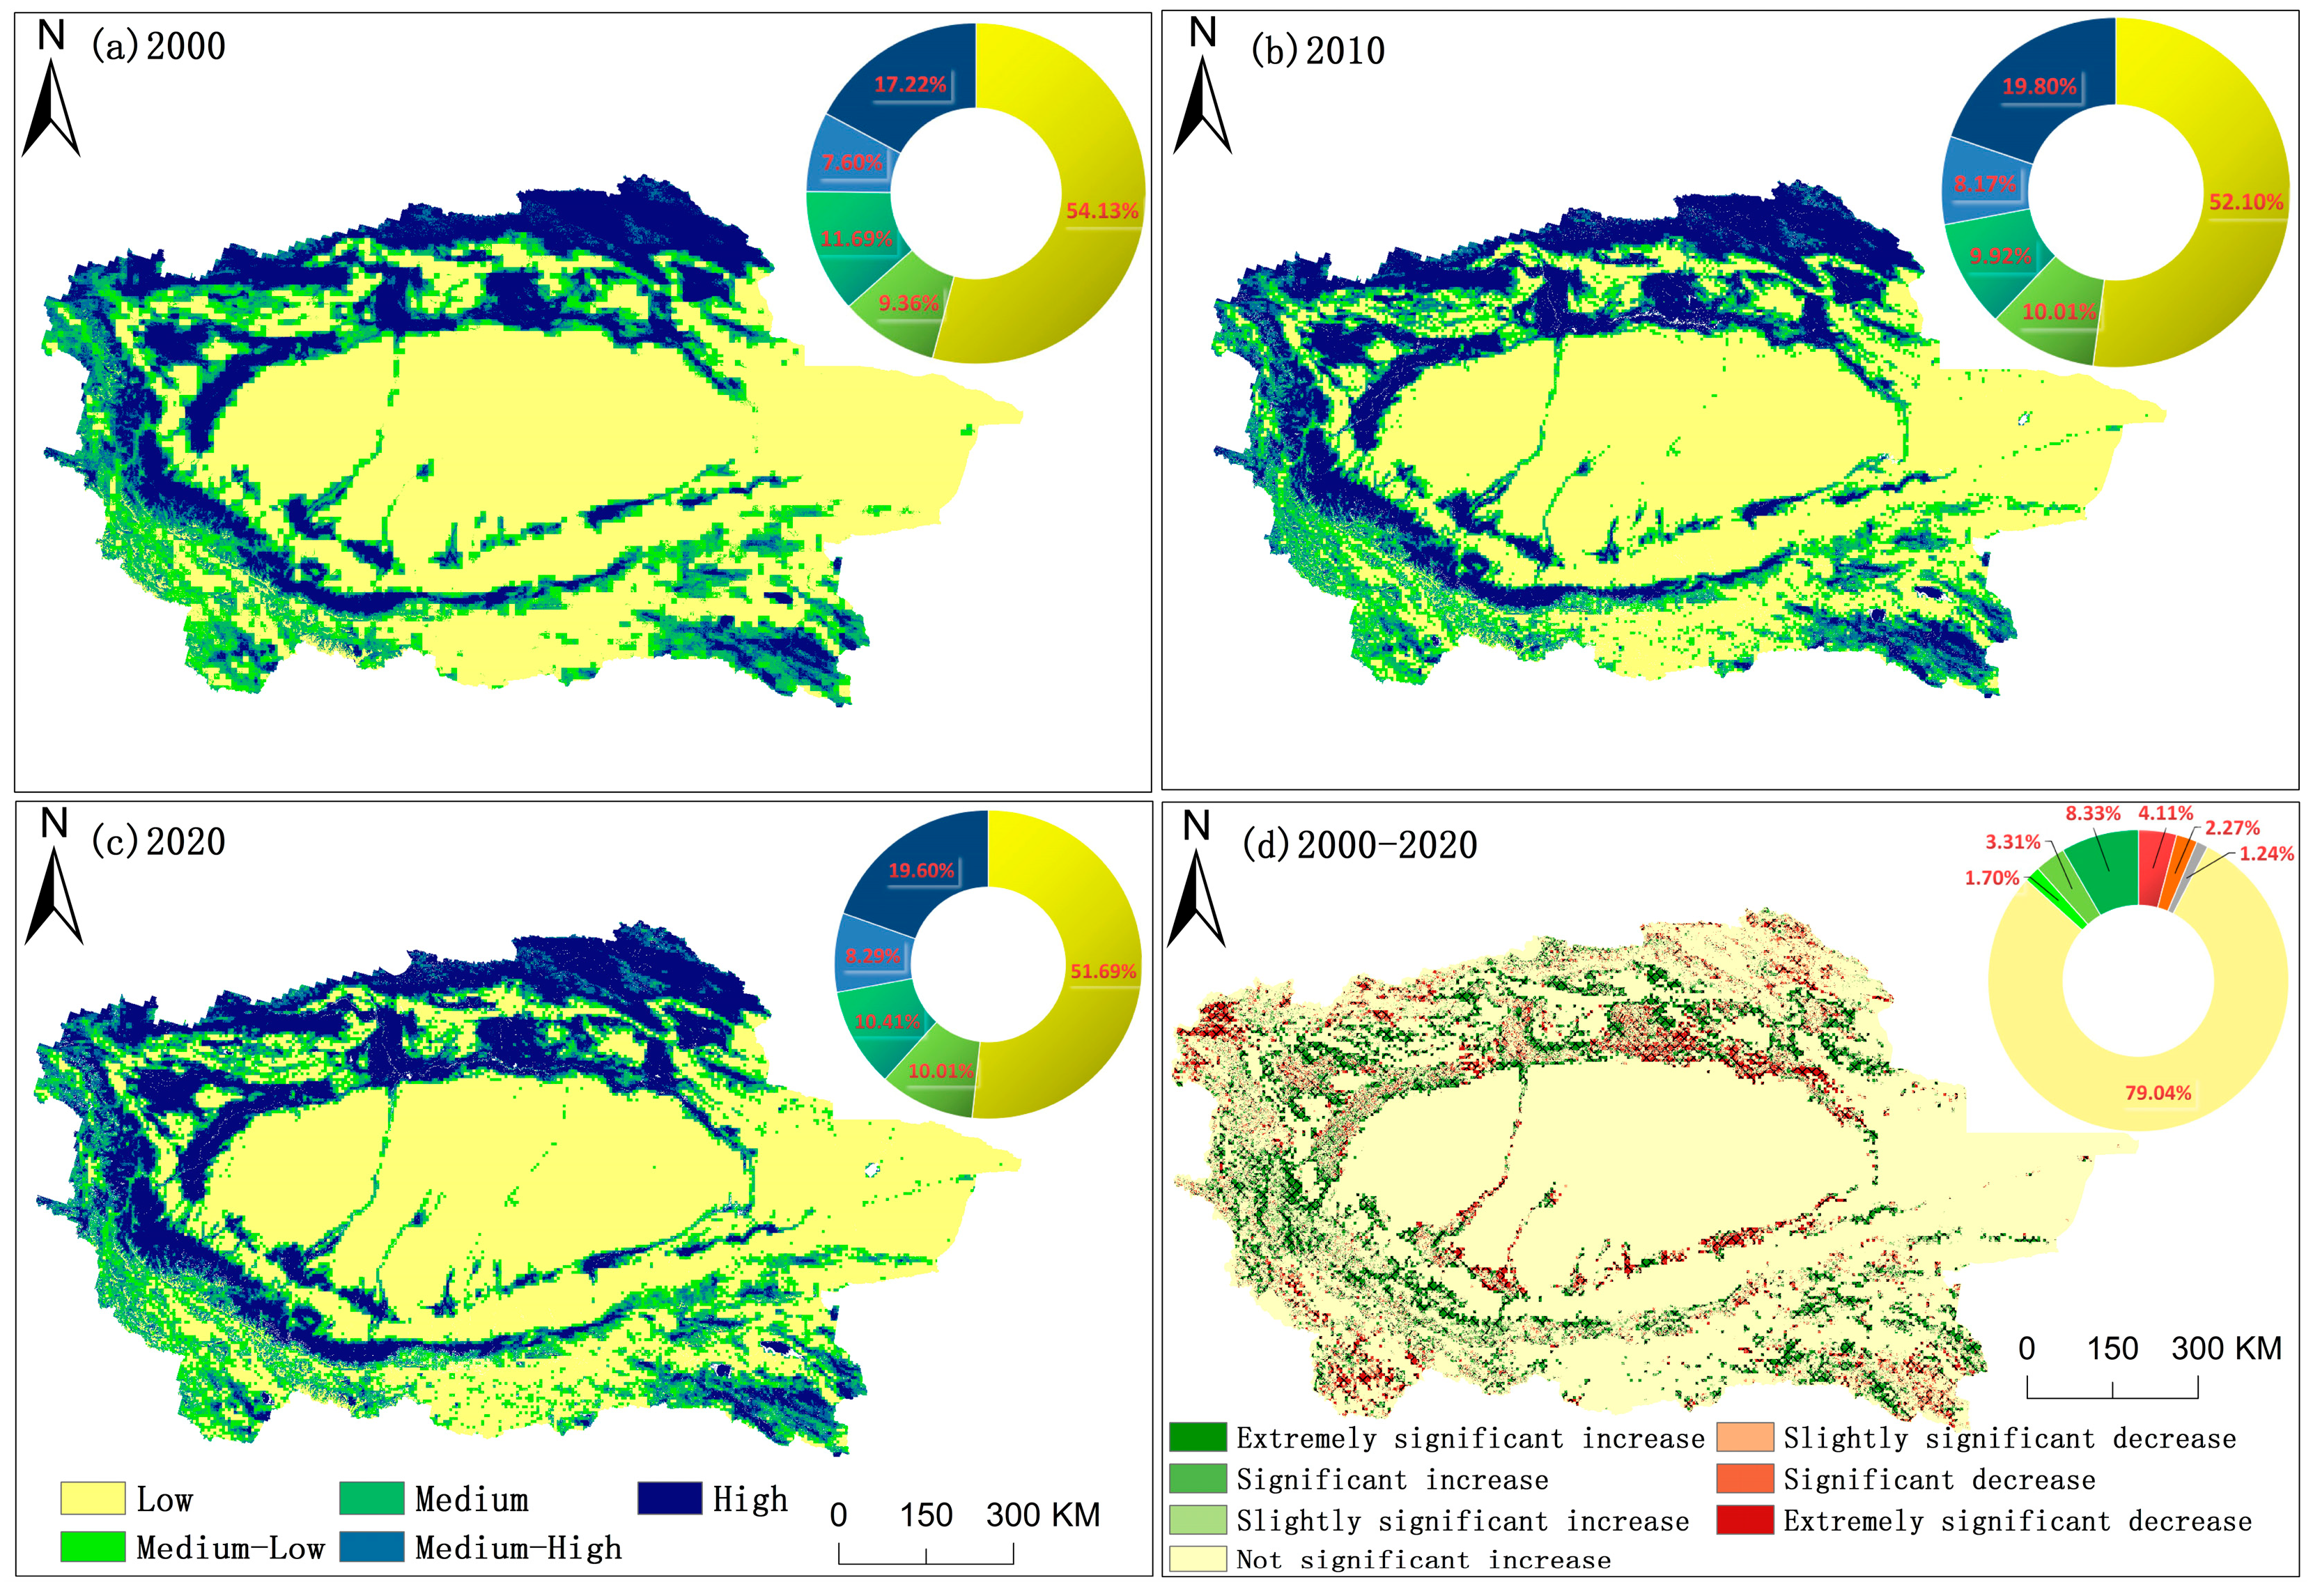
Based on previous studies [40,49], the ecological security assessment results were divided into five categories through the application of the natural breaks method: Low security (CESI > 0.81), Medium-Low security (0.76 ≤ CESI < 0.81), Medium security (0.54 ≤ CESI < 0.76), Medium-High security (0.32 ≤ CESI < 0.54), and High security (CESI < 0.32). Figure 6 illustrates the spatial differentiation of ecological security in the TRB from 2000 to 2020, revealing a general pattern of high CESI values at the periphery and low values in the central region. Low-security zones dominate this landscape, accounting for more than 51.63% of the basin, while Medium-High security zones occupy the smallest proportion, not exceeding 8.30%. Areas corresponding to High, Medium, and Medium-Low security levels exhibit relatively minor differences in spatial extent.
Figure 6.
Spatial distribution and trend of CESI in TRB during 2000–2020.
Between 2000 and 2020, the Low-security zones fluctuated but overall declined by 2.44%. Medium-Low security zones exhibited an initial increase followed by a subsequent decrease. The Medium security zones shrank by 1.27%. Both Medium-High and High security zones displayed an initial rise followed by a slight decline, yet their net changes remained positive, increasing by 0.69% and 2.38%, respectively. Spatially, the security grades exhibited distinct agglomeration patterns. Low and Medium-Low security zones were primarily located within the ecologically fragile areas, including the central and eastern deserts, the Gobi Desert transition zone, and the southern bare-rock areas. Conversely, High and Medium-High security zones were concentrated in the northern foothills of the Tianshan Mountains, the western edge of the Pamir Plateau, the southern slope of the Kunlun Mountains, and the interior of core oasis regions with favorable hydrothermal conditions. Medium security zones were scattered along the edge of oasis and the low-coverage grassland belts in front of the mountains, forming transitional areas between high and low security levels.
Figure 5d shows the 20-year trend of ecological security in the TRB. Areas with stable conditions accounted for the largest proportion (79.03%), whereas approximately 11.64% of the basin exhibited an upward trend. These expanding regions show a trend of the CESI rising from the central oasis toward the adjacent mountains, concentrated at the periphery of the oasis and piedmont zones. In contrast, areas showing decreased CESI were relatively limited, covering 6.39% of the basin, and were almost entirely concentrated along the streams of the Tarim, Aksu, and Hotan River, as well as the oasis regions of the Qarqan River Basin. Intense human activities in these regions have exacerbated ecological risks, leaving the ecological security status severe.
4.2. Driving Factors of Ecological Security and Its Contributions
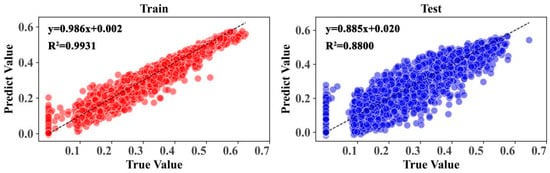
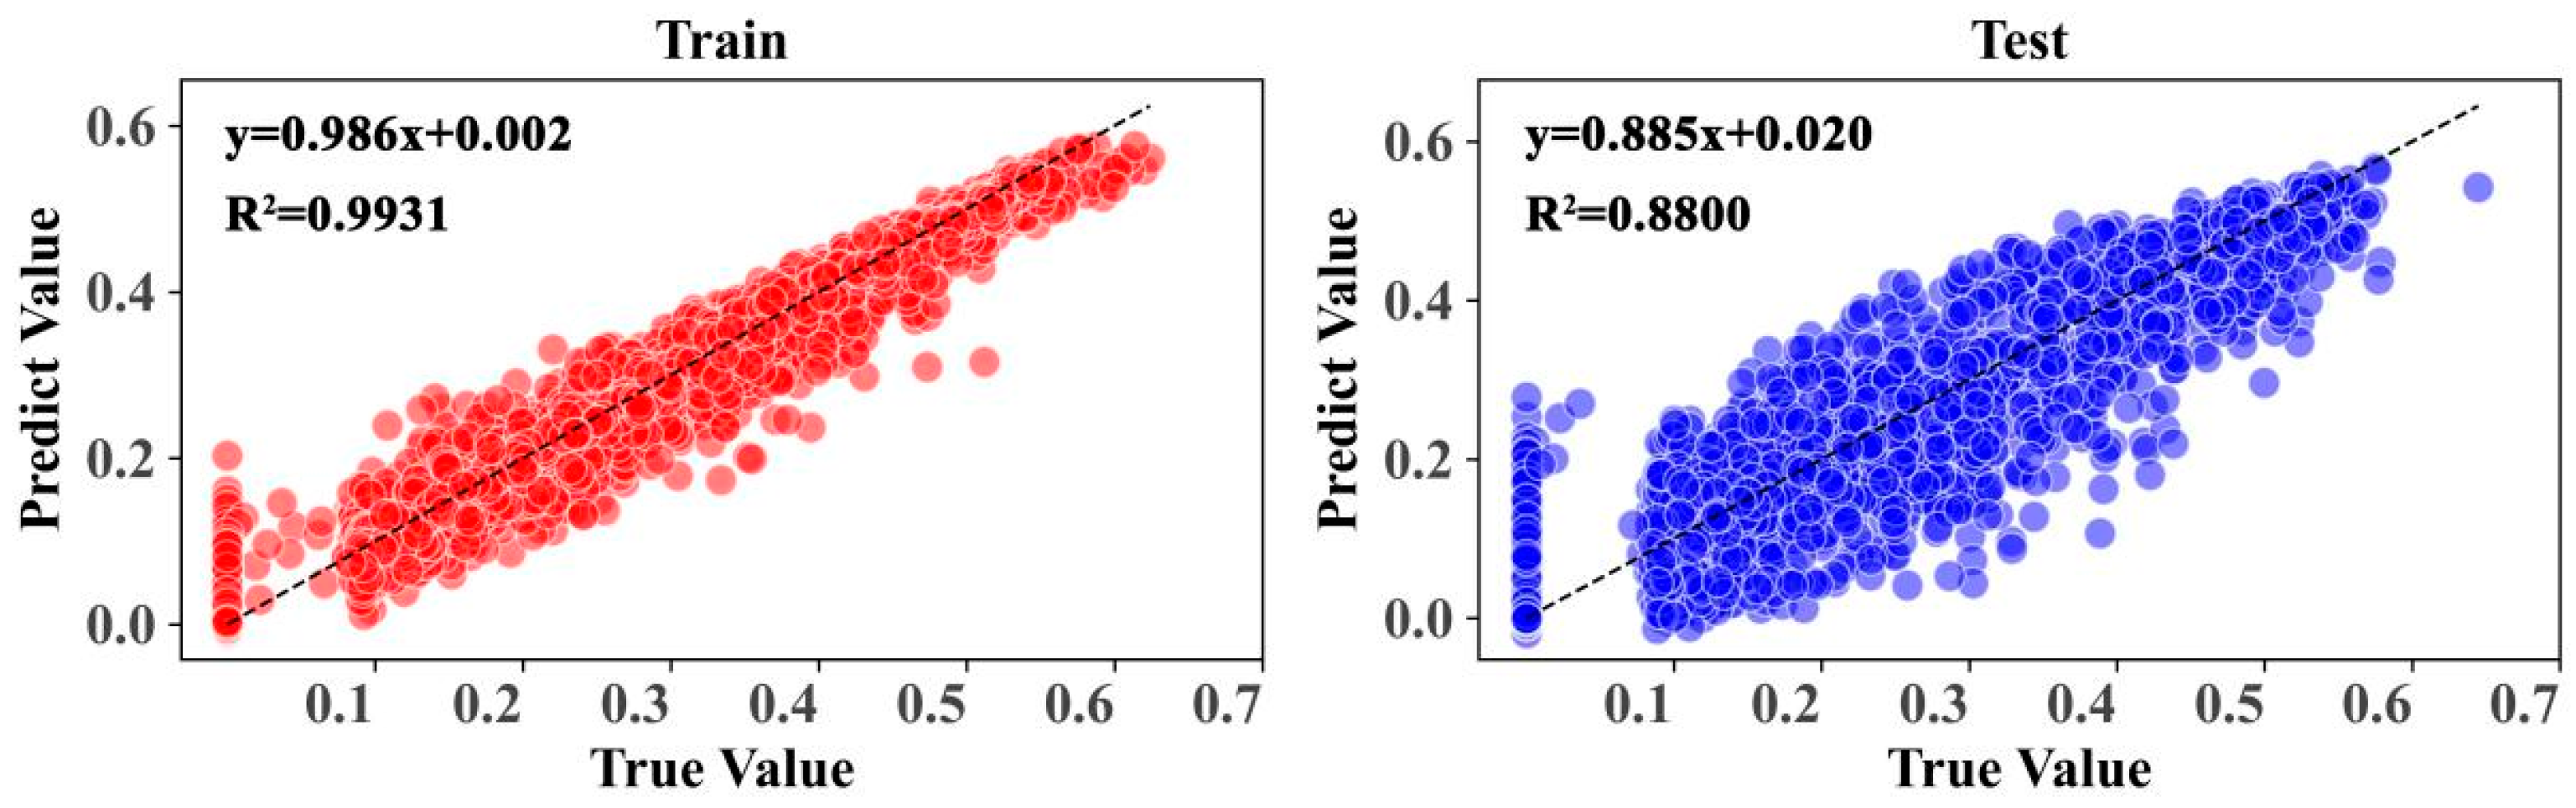
Building on the XGBoost-SHAP model described in Section 3.3, this study analyzed the relationships between ecological security and its key influencing factors within the TRB. Ten natural and anthropogenic drivers were selected for the analysis: DEM (X1), slope (X2), precipitation (X3), temperature (X4), evapotranspiration (X5), NDVI (X6), NPP (X7), soil moisture (X8), land use (X9), and human disturbance intensity (X10). The ecological security change dataset spanning 2000–2020 was partitioned into training and testing subsets, with a proportional split of 70% for training and 30% for testing. The XGBoost model demonstrated robust predictive performance, achieving R2 = 0.9931, RMSE = 0.0152, and MAE = 0.0086 for the training set, and R2 = 0.8800, RMSE = 0.0624, and MAE = 0.0415 for the testing set (Figure 7). These results highlight the model’s exceptional ability to simulate ecological security patterns accurately while providing reliable interpretability of the contributions of each driving factor.
Figure 7.
XGBoost model prediction accuracy.
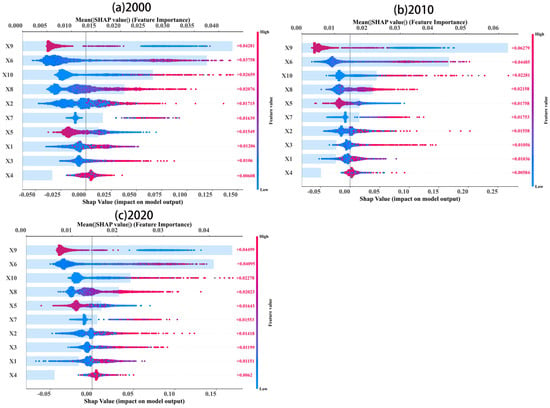
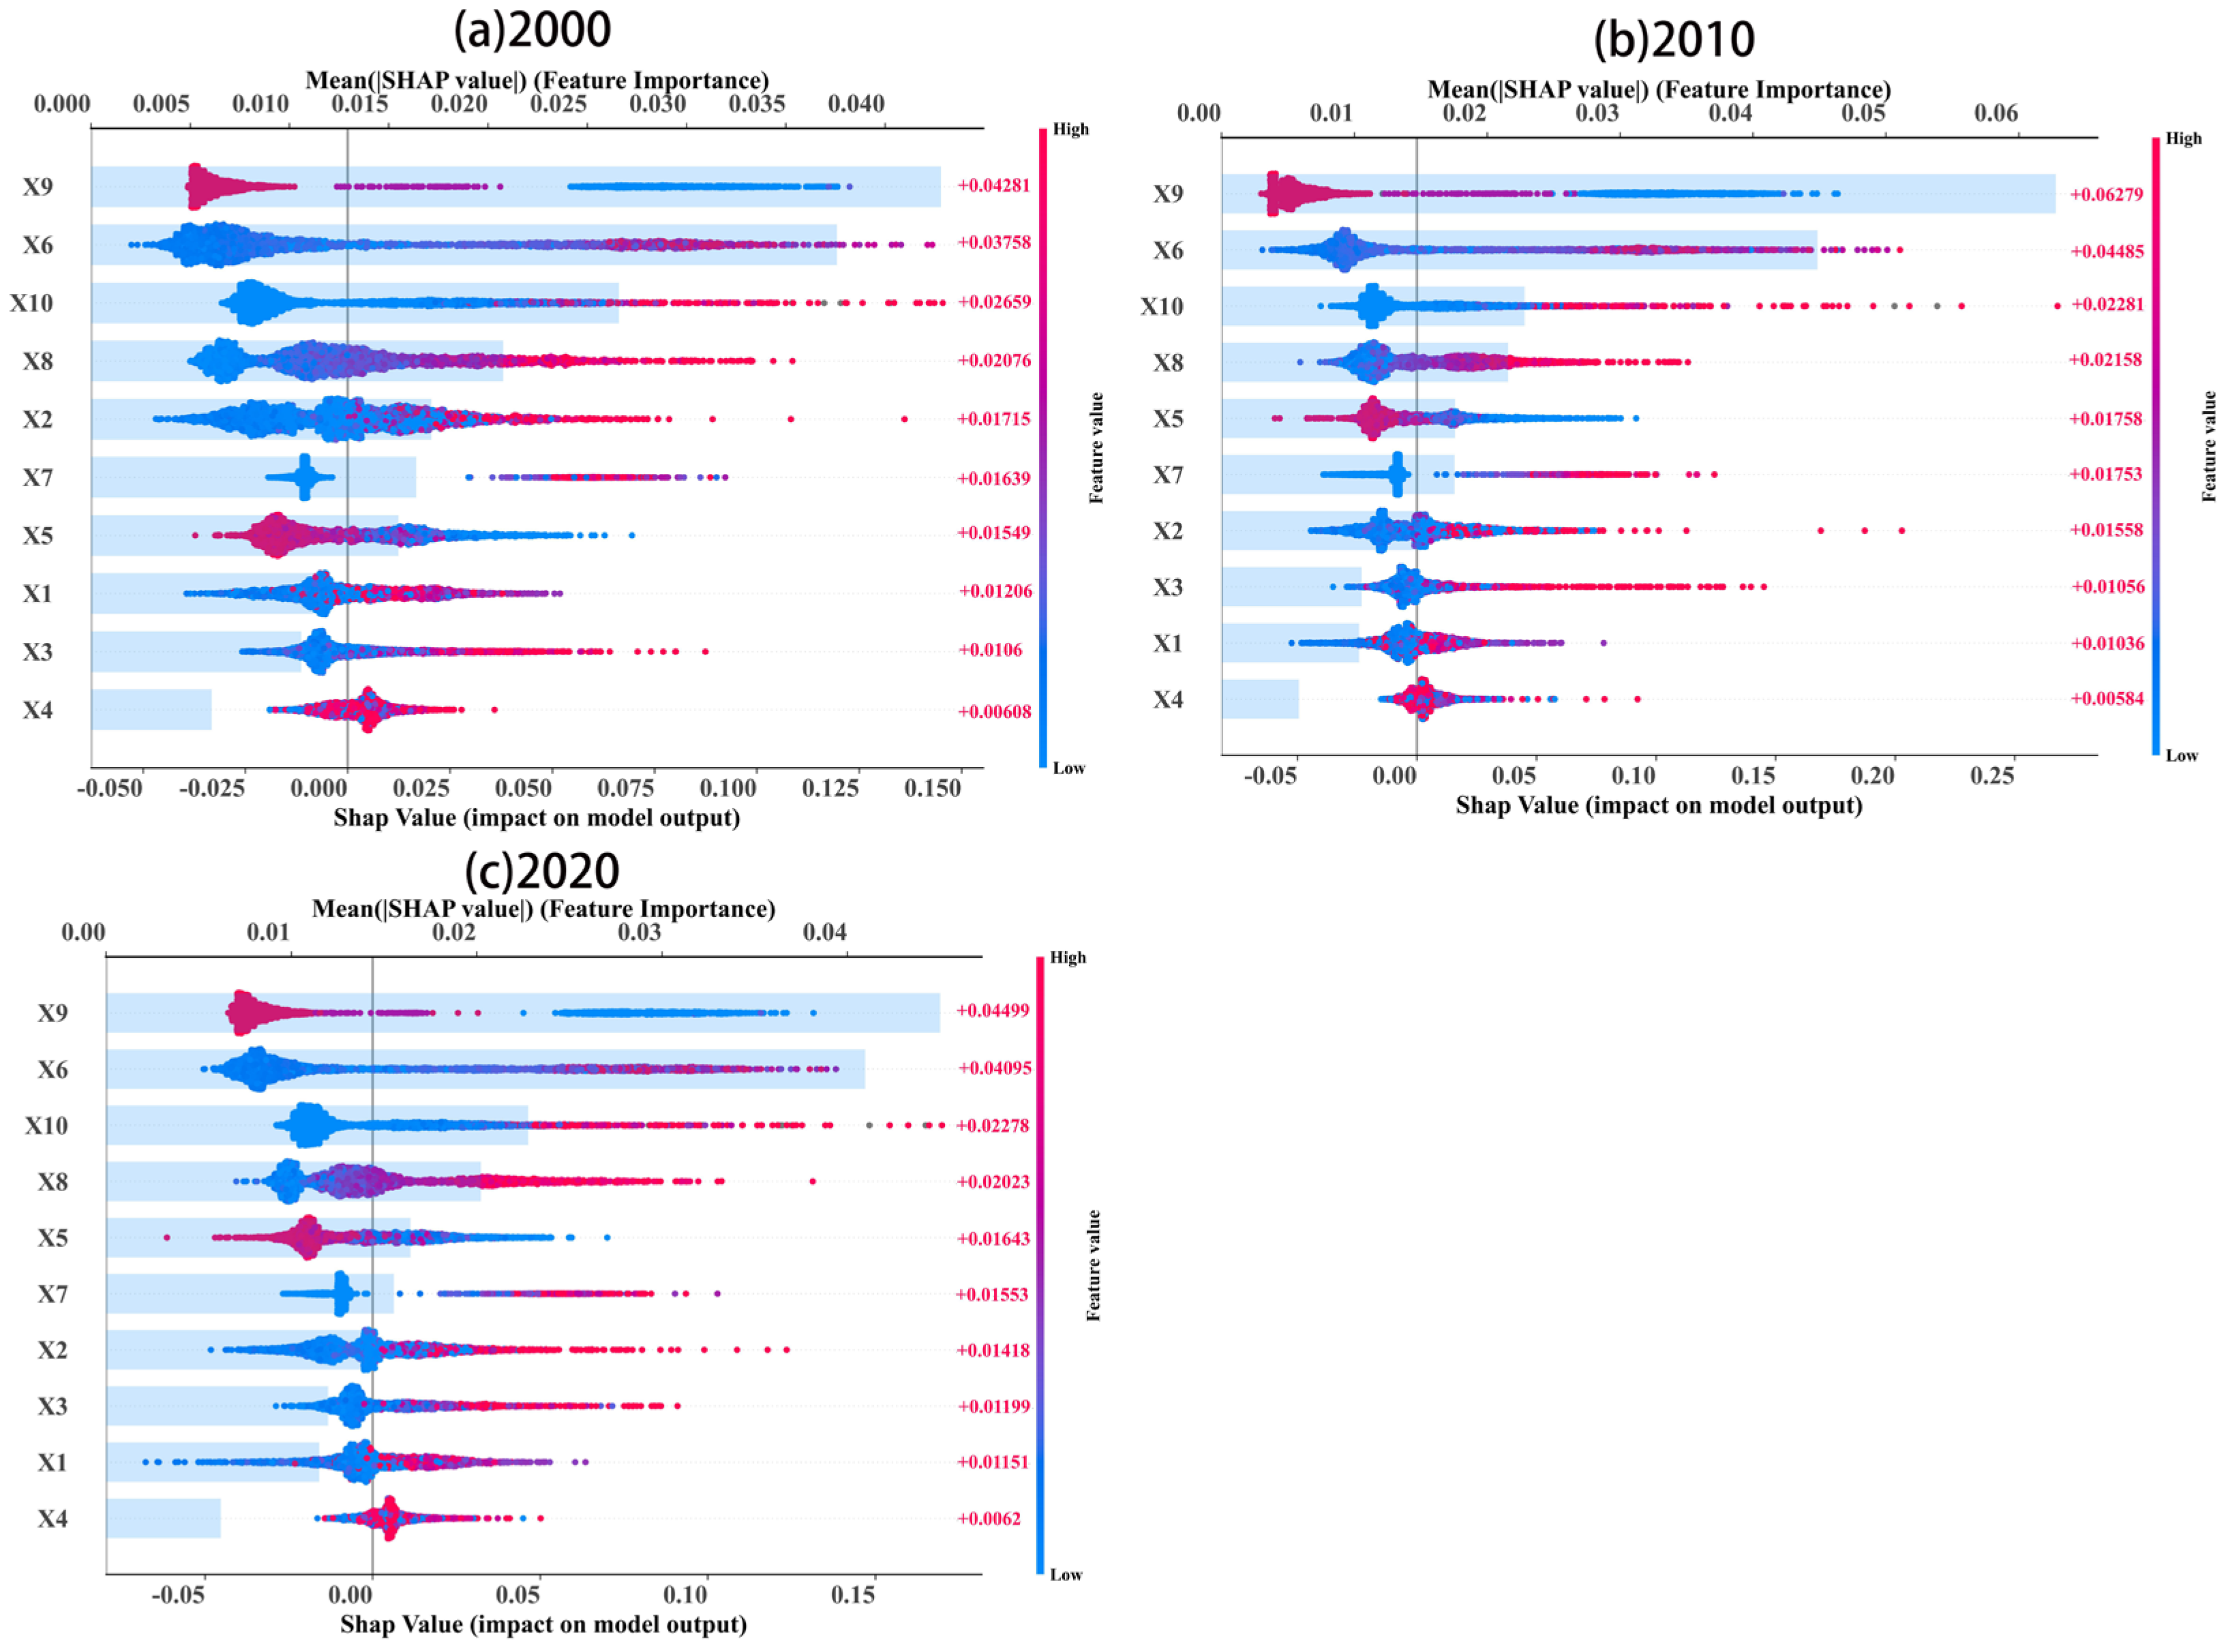
According to the SHAP model, all driving factors from 2000 to 2020 were ranked in accordance with their relative importance. Figure 8 shows that land use, NDVI, human activity intensity, and soil moisture are the four most significant factors, collectively accounting for 62.97% of the total contribution. These were followed by slope and evapotranspiration, while the contributions of DEM, precipitation, and temperature were comparatively minor. By 2010, the influence of evapotranspiration rose to fifth in the ranking, highlighting its growing impact, whereas the importance of slope declined, and the ecological effect of precipitation increased. By 2020, topographic and climatic factors exerted a more pronounced influence on overall ecological security.
Figure 8.
Evaluation of factor significance and impact mechanisms through the XGBoost-SHAP Model.
Among individual drivers, land use had the largest impact on SHAP values, predominantly with negative contributions, indicating that land use changes suppressed ecological security. NDVI and NPP exhibited a “blue-left, red-right” pattern, indicating a strong positive influence and underscoring the essential function of vegetation cover in sustaining watershed ecological security. Soil moisture exhibited mainly positive SHAP values, indicating a beneficial effect on ecological security. Conversely, the increase in evapotranspiration was predominantly linked to negative SHAP values, indicating that higher evapotranspiration exacerbates water scarcity, restricts ecosystem health, and imposes adverse effects on ecological security. Elevated evapotranspiration intensifies water shortages and soil salinization, thereby threatening regional ecological stability. Consequently, it is recommended to prioritize vegetation restoration, optimize land use, and establish an ecological early-warning system for key driving factors in the TRB.
5. Discussion
5.1. Reliability and Consistency Validation of the HSRS Ecological Security Framework
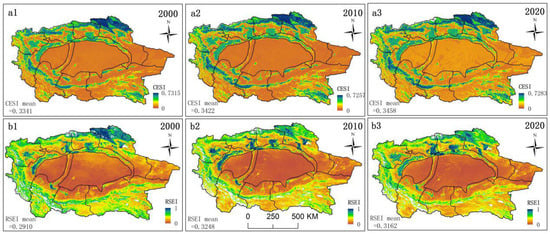
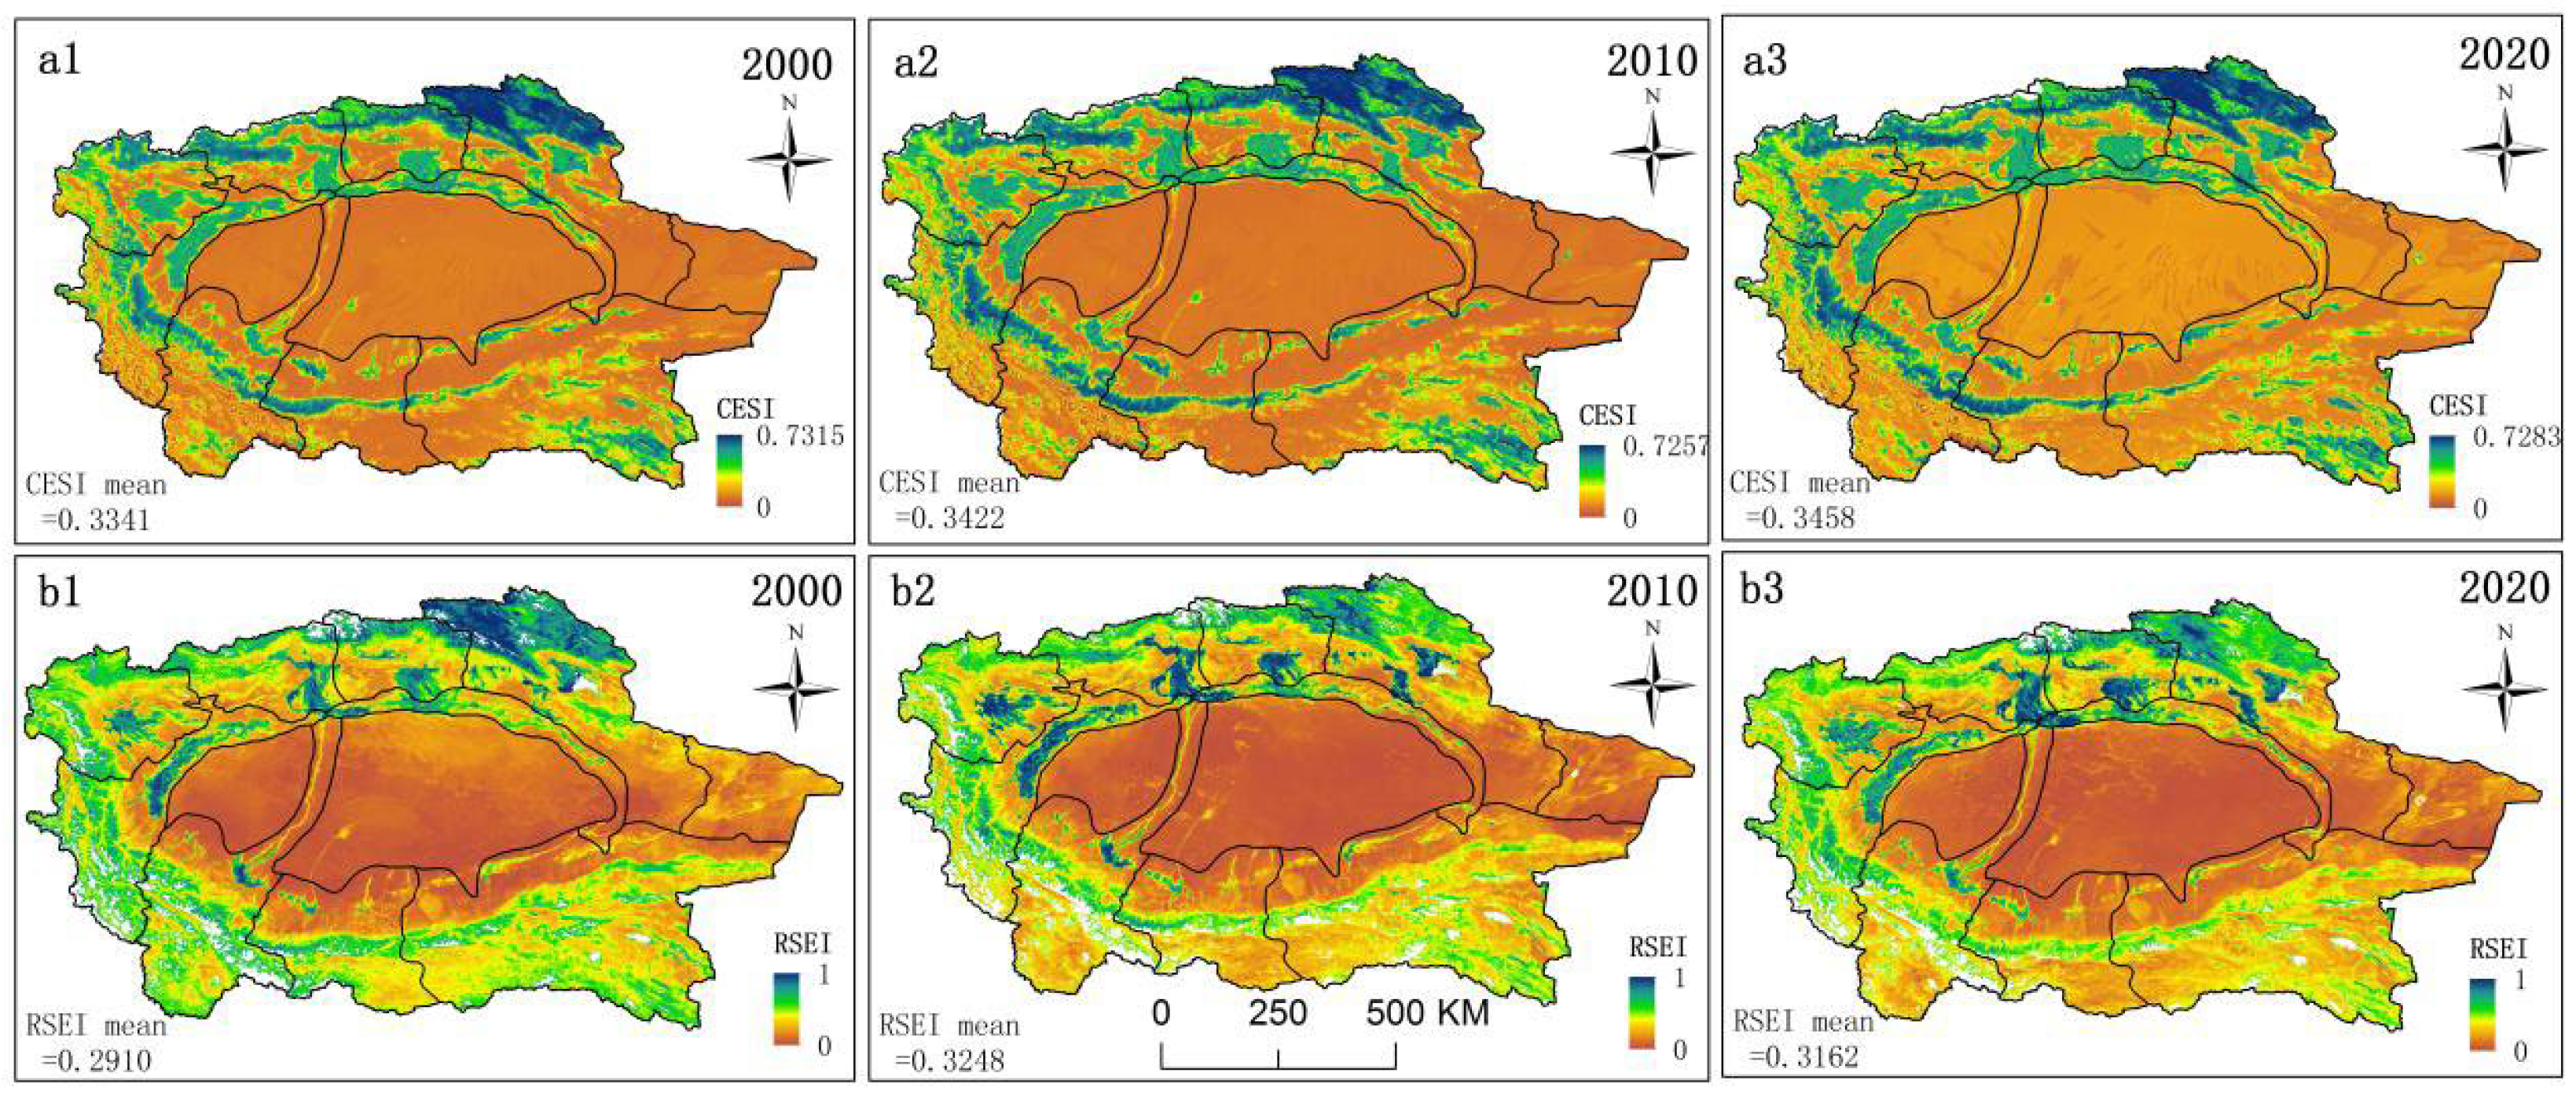
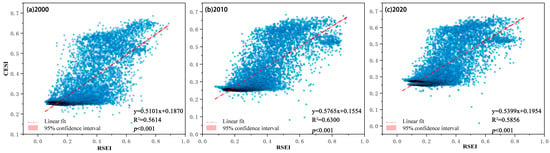
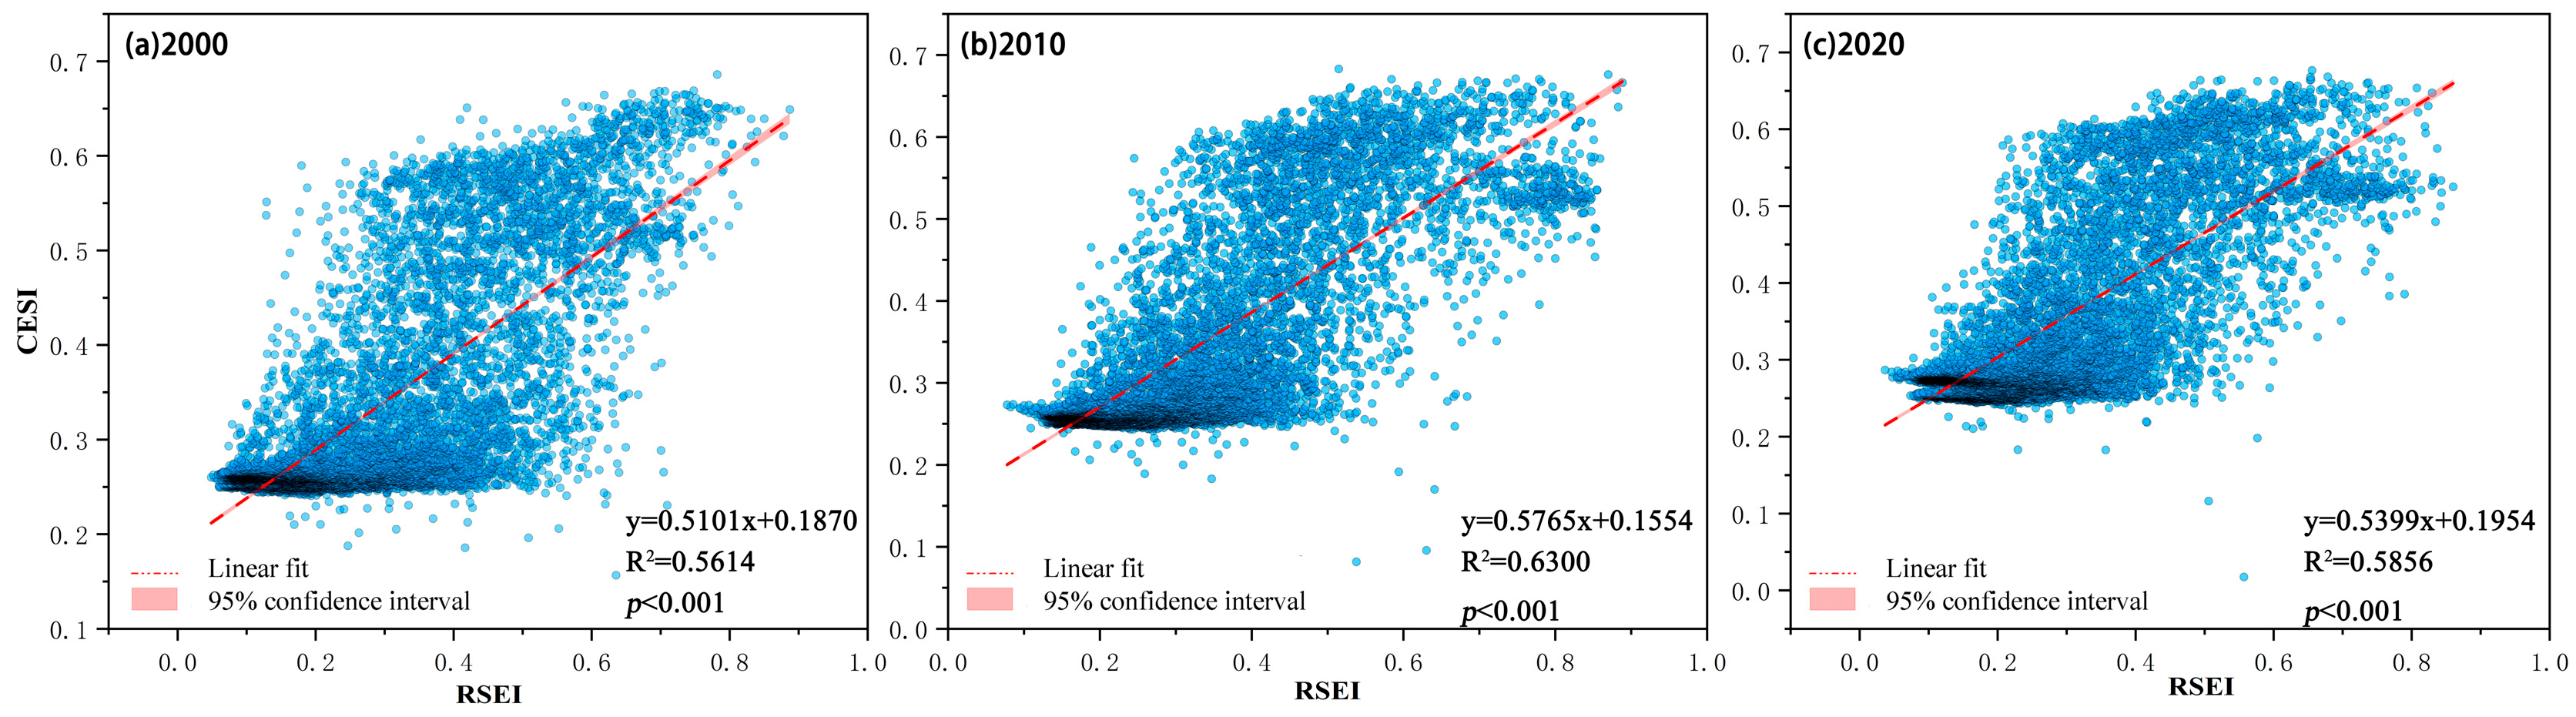
This research utilized the RSEI to validate the constructed CESI. As illustrated in Figure 9, during the period from 2000 to 2020, the mean CESI value exhibited an upward trend, rising from 0.3341 to 0.3458. Similarly, the mean RSEI value rose from 0.2910 in 2000 to 0.3162 in 2020. Both indices exhibit a gradual upward trend, reflecting an overall enhancement of the ecological environment in the TRB. Furthermore, the spatial distribution of CESI and RSEI demonstrates high consistency. Regions characterized by high ecological security are predominantly aggregated in the Tianshan Mountains, Pamir Plateau, Kunlun-Altun Mountains, and central oasis regions. As illustrated in Figure 10, a notable positive correlation between CESI and RSEI was observed from 2000 to 2020, with the coefficient of determination (R2) varying between 0.561 and 0.630. This finding further demonstrates that CESI effectively characterizes the regional ecological security status, thereby lending credibility to the assessment results. These results are consistent with previous research on the TRB, further corroborating the reliability of ecological security assessments. For instance, Yang et al. [20] evaluated the ecological carrying capacity of the TRB between 2000 and 2020, and reported a gradual improvement in the basin’s overall ecological condition, which was most pronounced in the mountainous areas. Qian et al. [29] found that all TRB ecological service functions had improved following the implementation of the ecological water transfer project. Zhang et al. [51] systematically analyzed the ecological security of the TRB oasis region over the past 20 years by estimating Net Primary Productivity and the RSEI. Their results indicated a significant expansion of oasis area, coupled with a general upward trend in the ecological conditions of the TRB. In conclusion, the HSRS framework is applicable for ecological security assessments in other regions.
Figure 9.
Comparative verification of ecological security evaluation results based on RSEI.
Figure 10.
Examination of the correlation between CESI and RSEI.
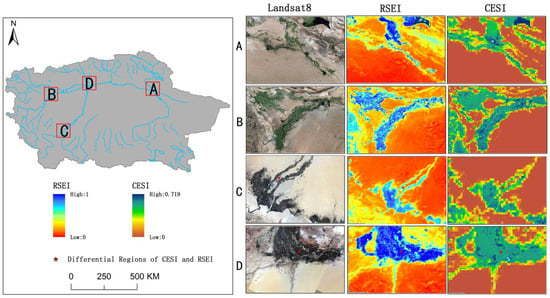
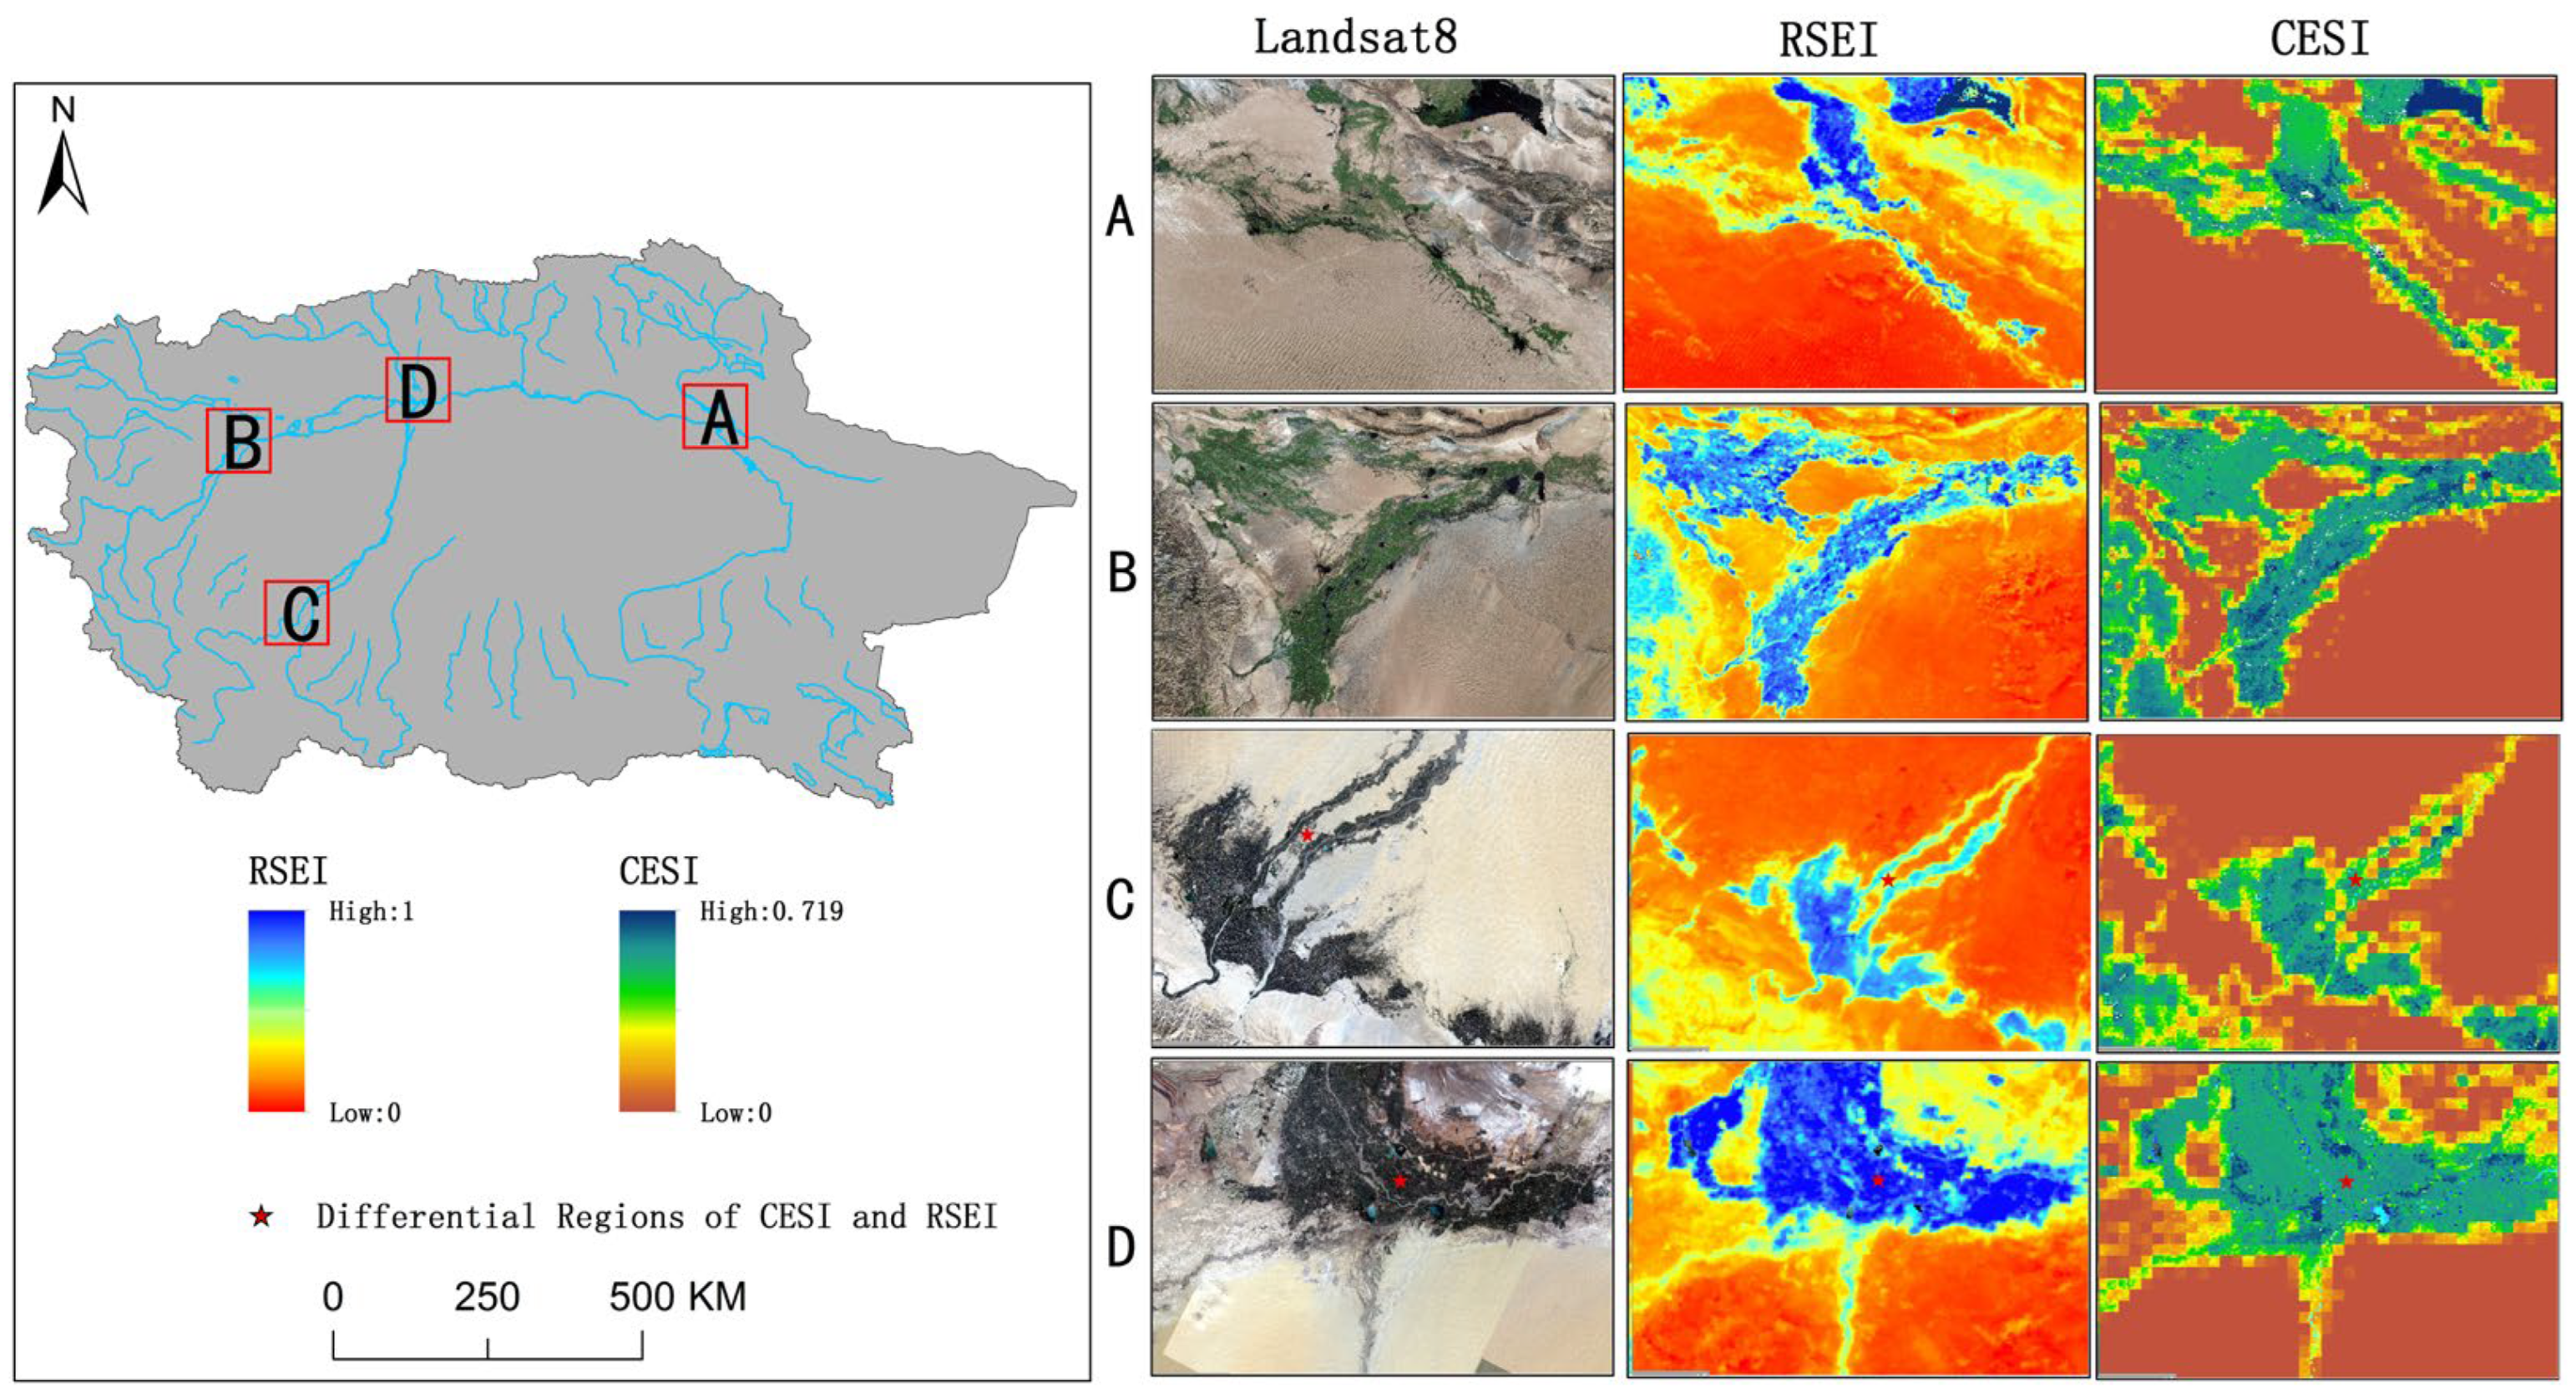
To further validate the reliability of ecological security assessment outcomes in the TRB, spatial comparisons of CESI, RSEI, and Landsat imagery were performed for four representative regions in 2020 (Figure 11). Specifically, in regions A and B, the CESI assessment results closely aligned with the observed ecological conditions. In contrast, Region C exhibited a pattern characterized by “high CESI but relatively low RSEI”. This region is located within a desert riparian forest with relatively stable water sources. Although the RSEI value is moderate, the CESI assessment assigns a higher security level due to the region’s critical ecosystem service functions and relatively low ecological risks. This emphasizes the complementary role of CESI in capturing the continuity and resilience of ecosystem functions. Conversely, Region D shows the opposite pattern of “high RSEI but relatively low CESI.” These areas are primarily distributed along the margins of oases, where human activities are intensive. While RSEI reflects relatively favorable vegetation conditions, CESI incorporates additional dimensions, including ecological sensitivity (high desertification susceptibility) and ecological risk (high land development pressure and substantial water resource stress), thereby revealing the inherent fragility and potential pressure on the ecosystem. This distinction underscores the advantage of the HSRS framework in transcending simple remote sensing–based state monitoring to achieve a more comprehensive analysis of ecological security. In summary, the consistency between CESI and RSEI in both temporal trends and spatial patterns confirms the fundamental reliability of the proposed evaluation framework. Furthermore, comparative analysis of these divergent regions further highlights the distinctive value of the HSRS framework. By systematically integrating ecological health, ecosystem services, ecological sensitivity, and ecological risk, the HSRS framework uncovers complexities in ecological security that cannot be captured solely through remote sensing-based indicators. Consequently, it provides more comprehensive and forward-looking decision-support information for ecosystem management and risk mitigation in arid inland river basins.
Figure 11.
Reliability validation of ecological security evaluation in the TRB in 2020.
5.2. Analysis of Driving Mechanisms: Threshold Effects and Management Implications
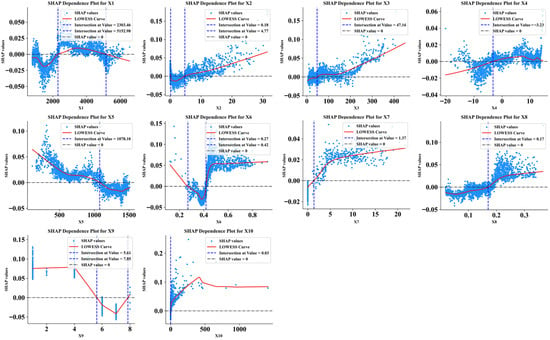
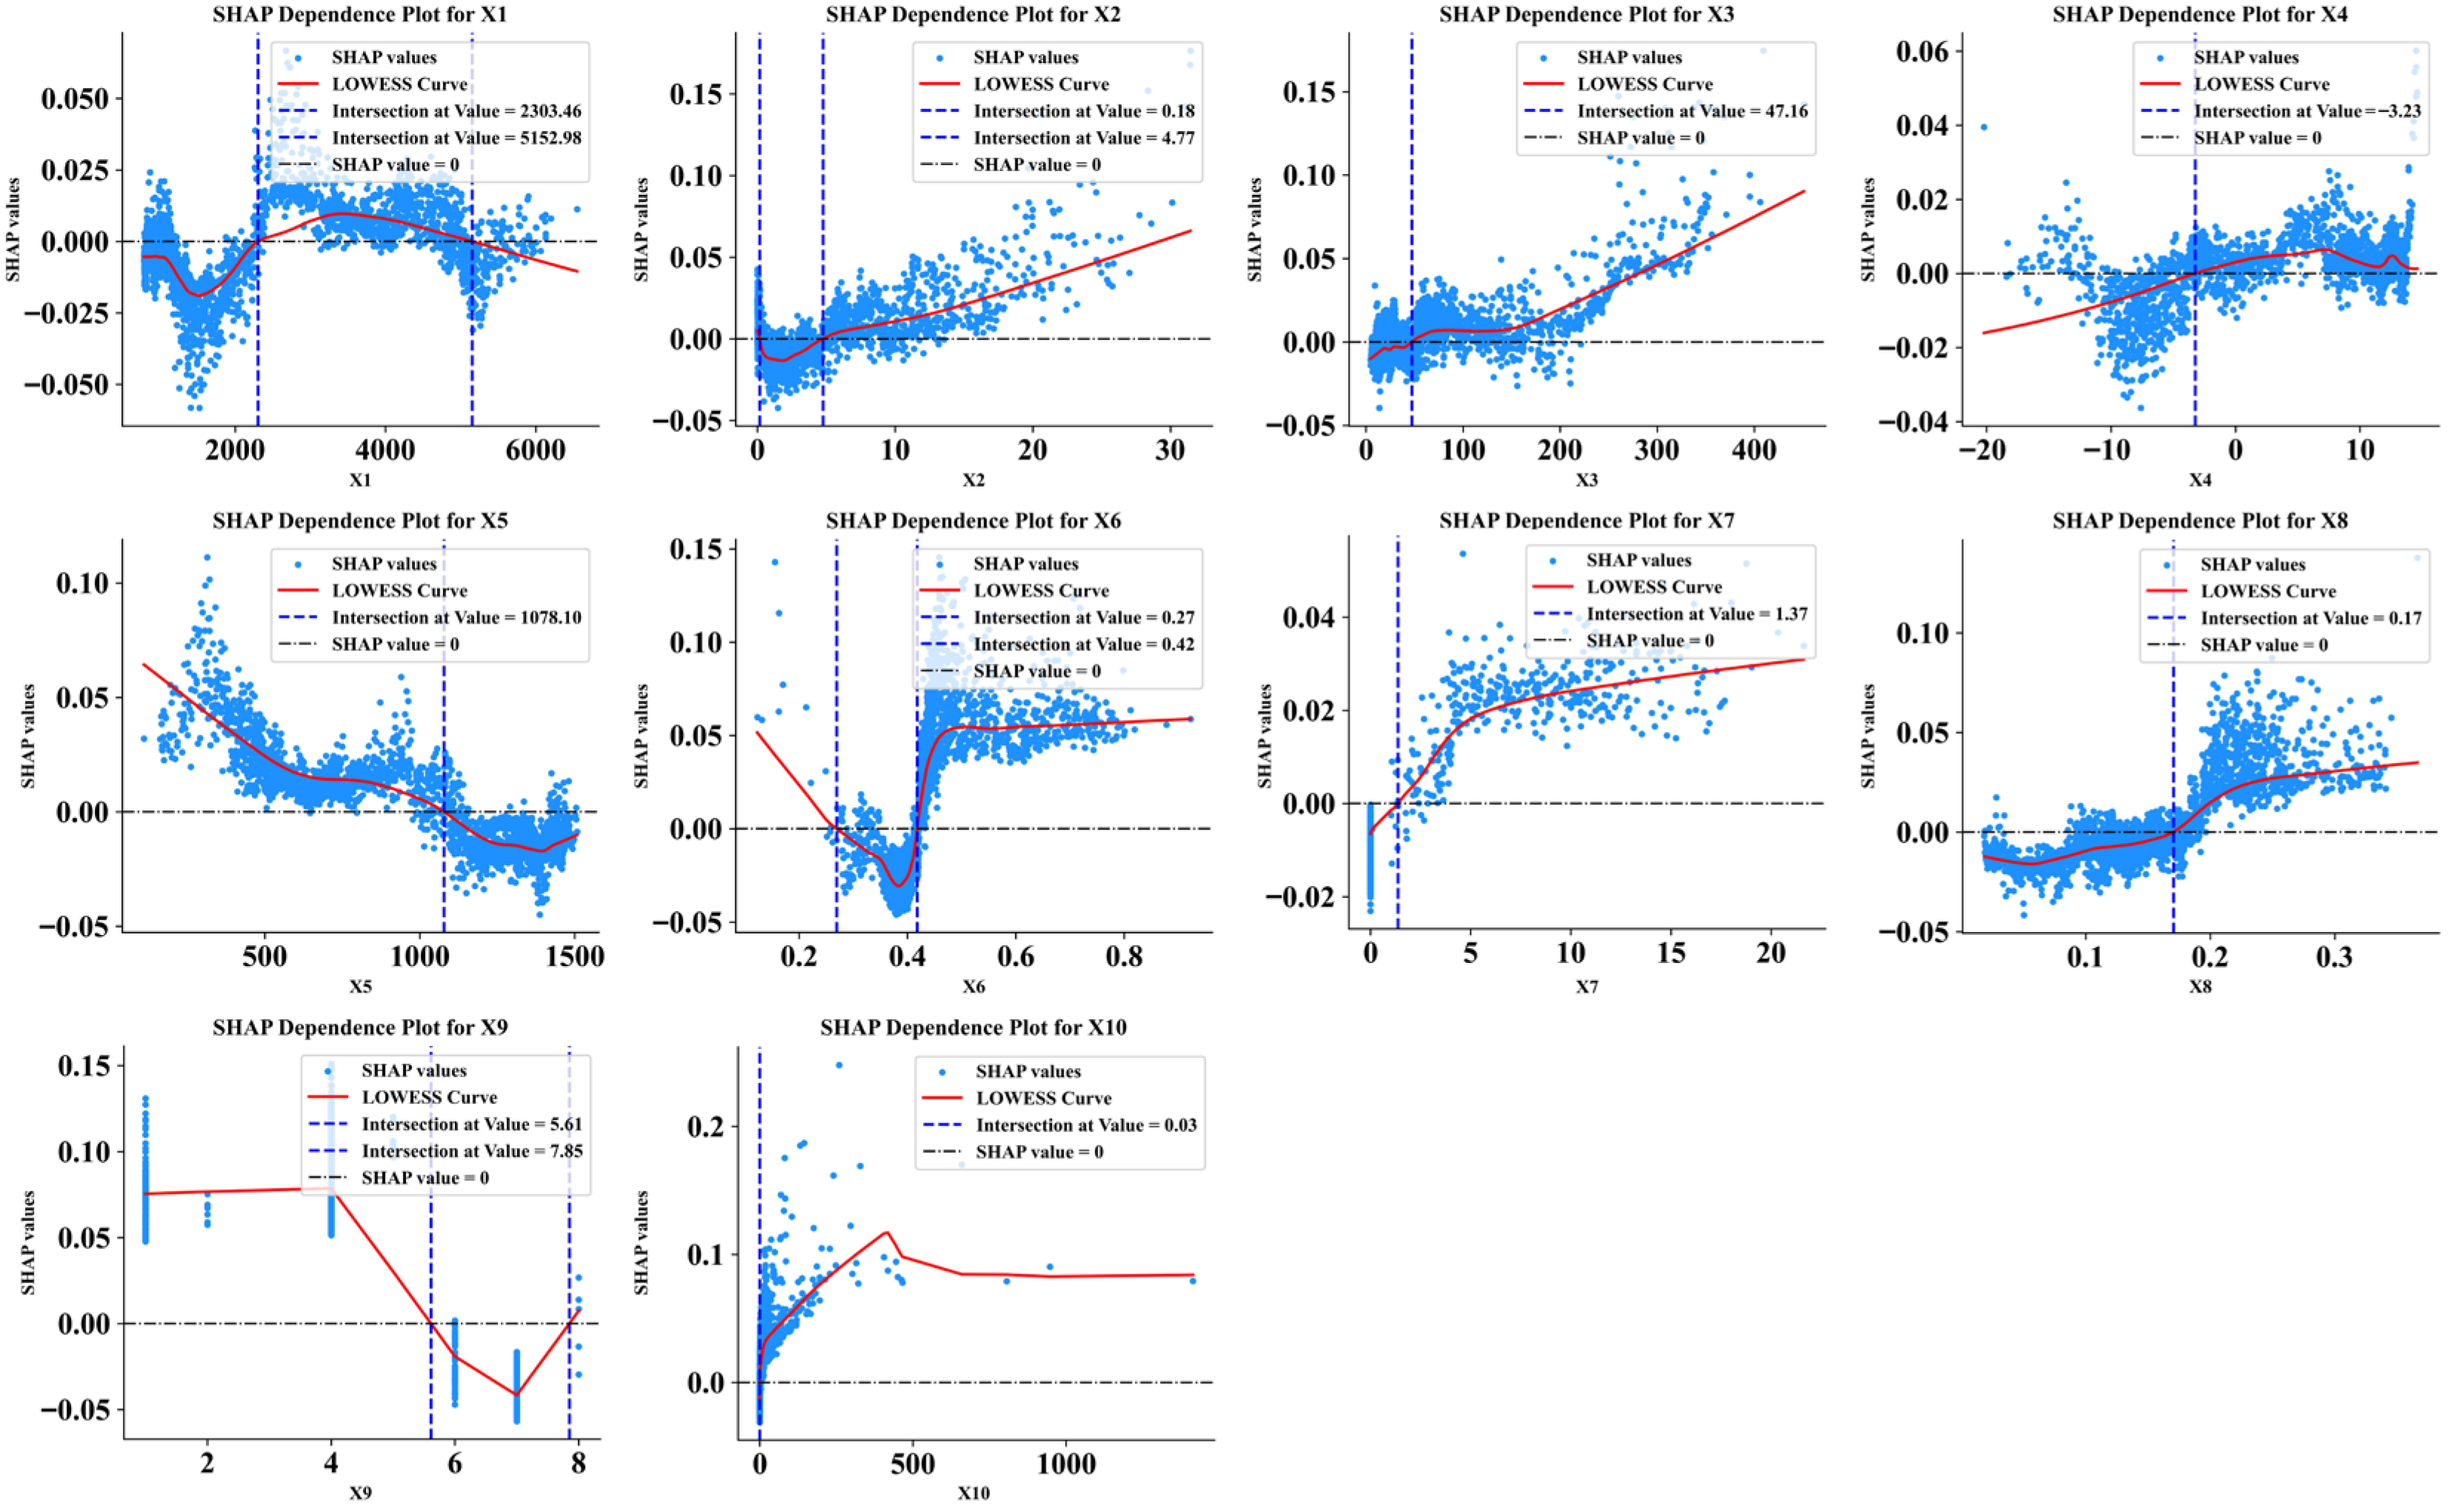
As illustrated in Figure 12, the DEM exerts a nonlinear “first positive, then negative” effect on ecological security: when DEM ranges between 1500 and 3500 m, ecological security levels are enhanced, but gradually decline once DEM exceeds 3500 m. As slope increases, SHAP values correspondingly rise, indicating that steeper terrain positively influences ecological security. Precipitation demonstrates a near-linear relationship, with values exceeding 150 mm promoting ecological security. In contrast, temperature exhibits an “inverted U-shaped” effect. When temperature ranges between −5 °C and 15 °C, SHAP values are positive and ecological security levels increase; when the temperature falls below −5 °C or exceeds 15 °C, SHAP values become negative, leading to a decline in ecological security. Evapotranspiration follows a similar inverted U-shaped nonlinear pattern, with values between 0 and 650 mm being most favorable for maintaining ecological security. NDVI exhibits distinct stepwise nonlinear growth characteristics: When NDVI > 0.35, its positive contribution to ecological security increases exponentially. In particular, recent ecological restoration initiatives, particularly the implementation of the “Grain for Green” and “Ecological Water Transfer” projects in oasis areas, have increased NDVI values in marginal zones to the range of 0.5–0.7 [28]. As soil moisture increases, SHAP values steadily increase, indicating a consistently positive impact on ecological security. In contrast, land use SHAP values are negative between 6 and 8, indicating the inhibitory effect of construction land, bare land, and sandy land on ecological security. Notably, the construction land demonstrated the highest SHAP contribution, underscoring its dominant influence on ecological security patterns. This trend is closely tied to urbanization processes accelerated by the “Belt and Road” policy [30,31].
Figure 12.
Relationship between driving factors and CESI.
According to the above analysis, this research identified the ecological security threshold of driving factors in the TRB (Table 6). Utilizing these threshold results, targeted ecological management strategies can be developed to achieve more adaptive and precise ecosystem management. The findings confirm that the sustainable development of the TRB relies on effectively regulating the complex nonlinear responses of natural-human driving factors. In particular, critical thresholds associated with construction land encroachment and excessive human disturbance should be strictly controlled.
Table 6.
Threshold of driving factors and ecological strategy analysis in TRB.
5.3. Applicability of the HSRS Framework to Ecological Security Assessments
The HSRS assessment framework proposed in this study was developed through a systematic analysis of the interrelated yet distinct dimensions of EHI, ESI, ERI, and ES. This framework emphasizes the conceptual independence of the four dimensions: ecological health focuses on structural and functional stability within ecosystems [3]; ecosystem services emphasize the provision of benefits to human well-being [8]; ecological risk centers on the likelihood of negative ecological effects from external pressures [9]; and ecological sensitivity addresses vulnerability to external disturbances [45]. During the construction and quantification of specific indicators, independent and non-overlapping indicator systems were selected for each dimension. Ecological health was assessed using a framework evaluating vitality, organization, and resilience; ecosystem services were quantified through four key services—habitat quality, soil conservation, water conservation, and windbreak and sand fixation; ecological risk was evaluated using landscape disturbance and vulnerability indices; and sensitivity was assessed through two representative processes: soil erosion and desertification, thereby ensuring the independence of each dimension’s evaluation.
To date, this framework has been applied across diverse regional types, including urban clusters [9,34], plateau regions [8,52], mining areas [53], and river basins [3,20], demonstrating robust applicability and scalability. However, there is an absence of research employing this framework to examine inland river basins within arid regions, thus leaving its applicability in such contexts yet to be confirmed. Compared with existing research, this study specifically addresses the prominent ecological challenges faced by arid regions. Emphasis was placed on reflecting these regional characteristics when selecting evaluation indicators for each dimension. This ensures that indicators, while maintaining independent quantification, align more closely with actual ecological conditions, thus improving the relevance and applicability of the assessment results.
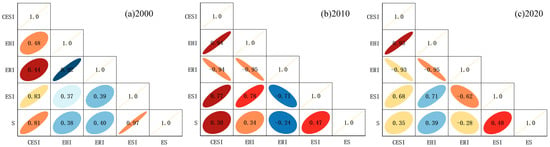
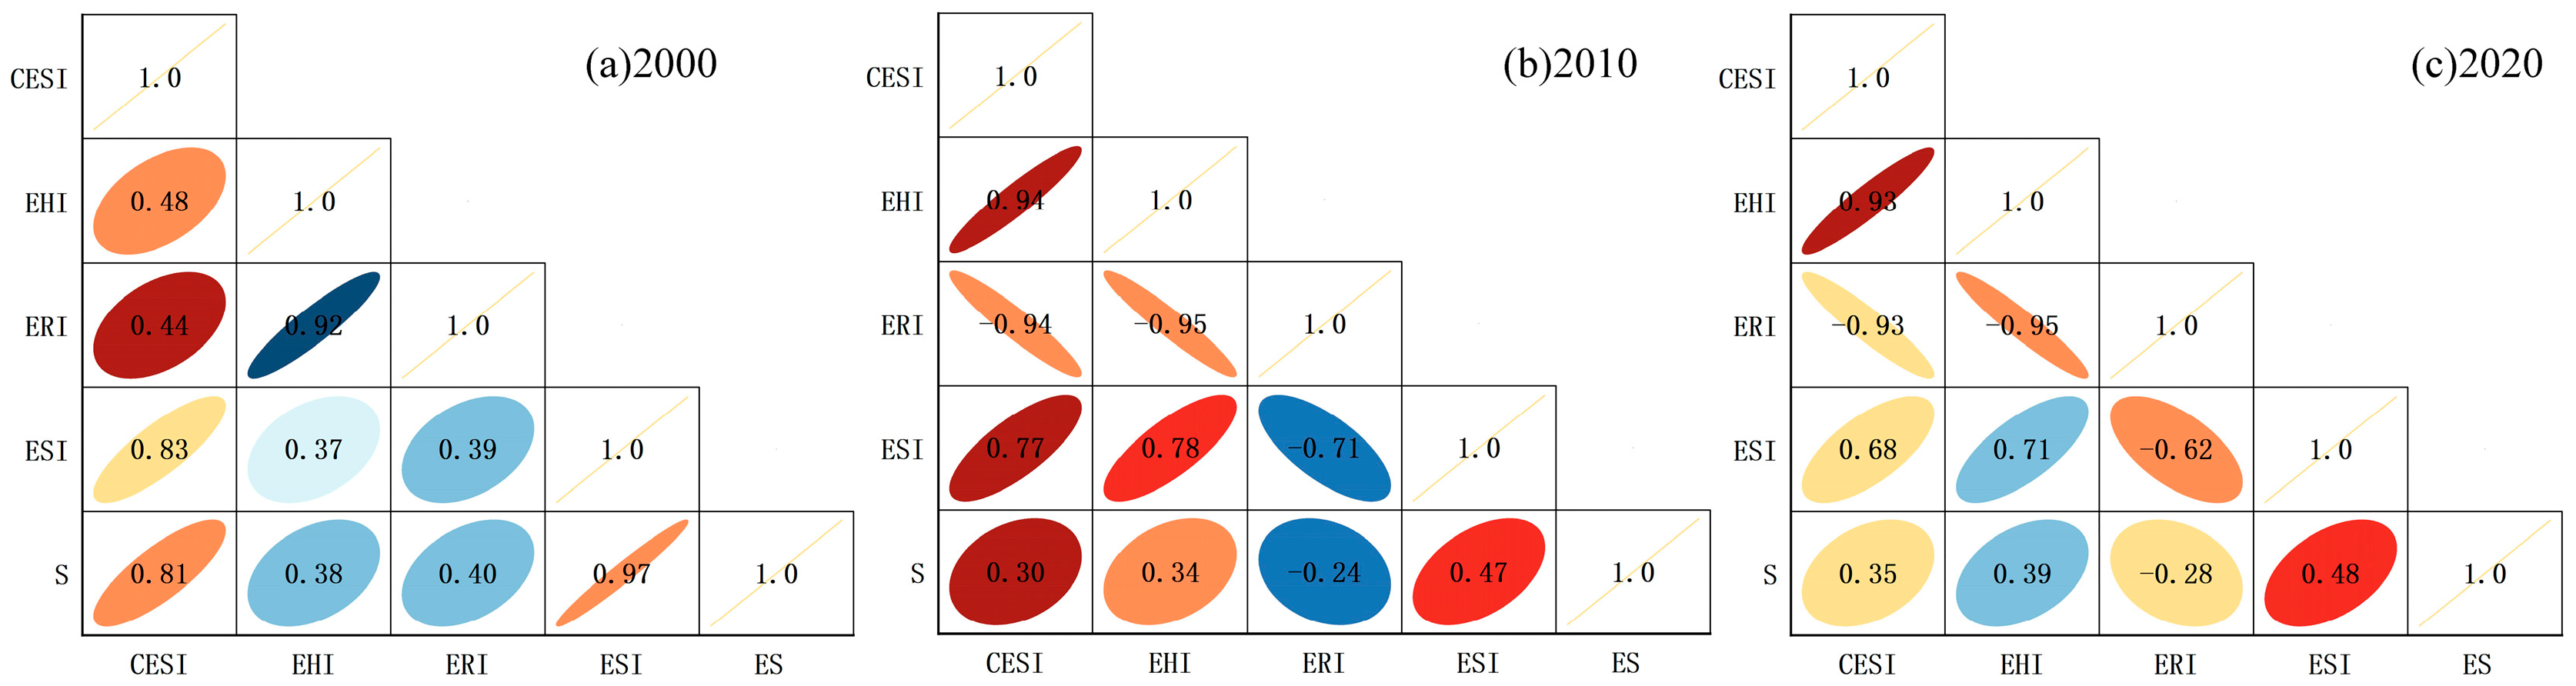
The results indicate that health, services, and ecological security all exhibit significant positive spatial correlations during 2000–2020 (Figure 13), consistent with previous research [20,29]. However, ecological risk and ecological security exhibit a stable and significant negative correlation, with correlation coefficients consistently below −0.93 from 2010 to 2020. Ecological risk further shows an overall negative relationship with health, services, and sensitivity. These statistical correlations do not arise from indicator duplication but reveal genuine ecological coupling relationships and interactive mechanisms among these independent dimensions. The gradually strengthening positive correlation between health and services reflects the increasing synergistic effects of ecological functions and service provision in the TRB. Meanwhile, the stable negative correlation between risk and security clearly demonstrates the inhibitory effect of external stressors on the overall system state. This result can be ascribed to the generally low level of ecological security in the desert regions of the TRB, which is limited by insufficient ecological resources, simple system structures, and intense external disturbances. Although mountainous regions exhibit higher health and service levels, their ecological security remains relatively low. However, the combination of soil erosion processes and high ecological sensitivity significantly elevates the potential ecological risks in these areas. This demonstrates the amplifying effect of ecological sensitivity on system instability. In oasis areas, while cropland expansion has a limited direct impact on health and services in the short term, it substantially elevates ecological risks by altering landscape patterns and intensifying human activity, thereby suppressing ecological security levels. This process may also activate the ecosystem’s sensitivity to external disturbances, further amplifying the adverse impacts of risks. The findings clearly demonstrate that relying solely on single-dimensional assessments overestimates ecological security levels. In comprehensive evaluations, it is crucial to incorporate ecological risks with the intrinsic ecological sensitivity of the system. Therefore, constructing and applying an HSRS assessment framework can help more comprehensively identify vulnerability and risk mechanisms within arid inland river basins. This approach clarifies the unique contributions of each dimension, establishing a scientific foundation for differentiated ecological governance.
Figure 13.
Correlation coefficients between ecological security and ecosystem health, ecological risk, ecosystem services, and ecological sensitivity from 2000 to 2020.
5.4. Limitations and Prospects
The ecological security assessment framework developed in this study comprehensively considers the multidimensional interactions among multidimensional factors; however, several limitations remain in its practical application. First, data acquisition accuracy remains constrained. The characterization of human activities is relatively indirect, relying primarily on proxies such as nighttime light intensity and land use patterns. The absence of more precise driving factors, such as irrigation intensity and the effectiveness of ecological engineering projects, somewhat constrains the precision of the evaluation outcomes. Second, the HSRS assessment framework primarily relies on macro-spatial data for analysis, which inadequately reveals specific variations at the local scale. For instance, discrepancies between risk and health indicators require further validation using finer-scale field observation data on soil, vegetation, and hydrology to improve the interpretability and regional applicability of the evaluation outcomes. Third, although the study identified the four most influential driving factors using the XGBoost-SHAP model, the examination of intricate interactions and nonlinear feedback mechanisms among these factors is still inadequate. Consequently, future research needs to concentrate on improving data sources, methodological approaches, and indicator systems by incorporating higher-resolution datasets and more advanced analytical techniques, thereby enhancing the practicality and generalizability of the proposed ecological security assessment framework.
6. Conclusions
This research developed an innovative ecological security assessment framework integrating ecological health, ecosystem services, ecological risk, and ecological sensitivity, which was applied to the TRB, a representative ecologically fragile region. The findings reveal that, during the period from 2000 to 2020, the overall CESI of the TRB demonstrated a fluctuating yet upward trajectory. Areas with high CESI values gradually expanded from oasis regions toward the surrounding mountains. Furthermore, XGBoost-SHAP analysis indicates that land use, NDVI, human activity intensity, and soil moisture are the most influential driving factors shaping ecological security patterns. Comparison with RSEI and Landsat 8 data demonstrates that the spatial distributions of CESI, RSEI, and imagery were largely consistent, further confirming the reliability of the proposed assessment framework. This study further quantifies the constraint thresholds of driving factors, including terrain, climate, vegetation, and human activities. It not only provides a quantitative basis, grounded in driving mechanisms and thresholds, for delineating ecological protection red lines and spatial control boundaries in the TRB, but also proposes a differentiated ecological management pathway characterized by “Driver Factor Identification-Threshold Regulation-Zoning Governance”. The proposed framework and findings are also applicable to inland watersheds with similarly fragile ecosystems and provide valuable insights for strengthening global ecological security assessment systems and optimizing ecological protection practices.
Author Contributions
Conceptualization, Y.M. and X.Z.; methodology, Y.M. and J.L.; validation, Y.M.; formal analysis, J.L.; investigation, Y.M.; data curation, X.Z.; writing—original draft preparation, Y.M.; writing—review and editing, X.Z. and J.L. All authors have read and agreed to the published version of the manuscript.
Funding
This study was funded by the Special Training Program of the Natural Science Foundation of Xinjiang Uygur Autonomous Region, grant number 2022D03032, and Research on Remote sensing monitoring of ecological environment elements and construction of ecological security pattern in the Tarim River Basin, and the National Natural Science Foundation of China, grant number 42401357.
Institutional Review Board Statement
Not applicable.
Informed Consent Statement
Not applicable.
Data Availability Statement
Data is contained within the article.
Conflicts of Interest
The authors declare no conflicts of interest.
References
- Pan, Z.Z.; Gao, G.Y.; Fu, B.J. Spatiotemporal changes and driving forces of ecosystem vulnerability in the Yangtze River Basin, China: Quantification using habitat-structure-function framework. Sci. Total Environ. 2022, 835, 155494. [Google Scholar] [CrossRef] [Scilit] [PubMed]
- Varis, O.; Taka, M.; Kummu, M. The planet’s stressed river basins: Too much pressure or too little adaptive capacity? Earth’s Future 2019, 7, 1118–1135. [Google Scholar] [CrossRef] [Scilit]
- Zhu, Q.; Cai, Y.L. Integrating ecological risk, ecosystem health, and ecosystem services for assessing regional ecological security and its driving factors: Insights from a large river basin in China. Ecol. Indic. 2023, 155, 110954. [Google Scholar] [CrossRef] [Scilit]
- Grimm, N.B.; Foster, D.; Groffman, P.; Grove, J.M.; Hopkinson, C.S.; Nadelhoffer, K.J.; Pataki, D.E.; Peters, D.P. The changing landscape: Ecosystem responses to urbanization and pollution across climatic and societal gradients. Front. Ecol. Environ. 2008, 6, 264–272. [Google Scholar] [CrossRef] [Scilit]
- He, J.H.; Pan, Z.Z.; Liu, D.F.; Guo, X.N. Exploring the regional differences of ecosystem health and its driving factors in China. Sci. Total Environ. 2019, 673, 553–564. [Google Scholar] [CrossRef] [Scilit]
- Sang, S.; Wu, T.X.; Wang, S.D.; Yang, Y.Y.; Liu, Y.Y.; Li, M.Y.; Zhao, Y.T. Ecological safety assessment and analysis of regional Spatiotemporal differences based on earth observation satellite data in support of SDGs: The case of the Huaihe River Basin. Remote Sens. 2021, 13, 3942. [Google Scholar] [CrossRef] [Scilit]
- Pecl, G.T.; Araújo, M.B.; Bell, J.D.; Blanchard, J.; Bonebrake, T.C.; Chen, I.-C.; Clark, T.D.; Colwell, R.K.; Danielsen, F.; Evengård, B.; et al. Biodiversity redistribution under climate change: Impacts on ecosystems and human well-being. Science 2017, 355, 9214. [Google Scholar] [CrossRef] [Scilit]
- Hui, L.; Wang, H.; Liu, J.M.; Tang, B.T.; Li, Z.S.; Zhang, L.W.; Jiao, L. Assessing the Spatiotemporal changes and drivers of ecological security by integrating ecosystem health and ecosystem services in Loess Plateau, China. J. Geogr. Sci. 2025, 35, 459–482. [Google Scholar] [CrossRef] [Scilit]
- Kang, P.; Chen, W.; Hou, Y.; Li, Y.Z. Linking ecosystem services and ecosystem health to ecological risk assessment: A case study of the Beijing-Tianjin-Hebei urban agglomeration. Sci. Total Environ. 2018, 636, 1442–1454. [Google Scholar] [CrossRef] [Scilit]
- Tian, S.; Zhang, Y.; Xu, Y.; Wang, Q.S.; Yuan, X.L.; Ma, Q.; Chen, L.P.; Ma, H.C.; Xu, Y.; Yang, S.; et al. Urban ecological security assessment and path regulation for ecological protection: A case study of Shenzhen, China. Ecol. Indic. 2022, 145, 109717. [Google Scholar] [CrossRef] [Scilit]
- Li, J.Q.; He, W.J.; Jiang, E.H.; Yuan, L.; Qu, B.; Degefu, D.M.; Ramsey, T.S. Evaluation and prediction of water security levels in Northwest China based on the DPSIR model. Ecol. Indic. 2024, 163, 112045. [Google Scholar] [CrossRef] [Scilit]
- Zhang, J.J.; Hao, X.M.; Li, X.W.; Fan, X.; Zhang, S. Evaluation and regulation strategy for ecological security in the Tarim River Basin based on the ecological footprint. J. Clean. Prod. 2024, 435, 140488. [Google Scholar] [CrossRef] [Scilit]
- Zhang, W.W.; Liu, Z.X.; Qin, K.; Dai, S.Q.; Lu, H.Y.; Lu, M.; Ji, J.W.; Yang, Z.H.; Chen, C.; Jia, P. Long-Term Dynamic Monitoring and Driving Force Analysis of Eco-Environmental Quality in China. Remote Sens. 2024, 16, 1028. [Google Scholar] [CrossRef] [Scilit]
- Yu, S.; Yang, L.L.; Song, Z.J.; Li, W.B.; Ye, Y.M.; Liu, B. Measurement of land ecological security in the middle and lower reaches of the Yangtze River based on the PSR model. Sustainability 2023, 15, 14098. [Google Scholar] [CrossRef] [Scilit]
- Wei, S.M.; Pan, J.H.; Liu, X. Landscape ecological safety assessment and landscape pattern optimization in arid inland river basin: Take Ganzhou District as an example. Hum. Ecol. Risk Assess. 2020, 26, 782–806. [Google Scholar] [CrossRef] [Scilit]
- Wang, Y.; Zhang, F.; Li, X.; Johnson, V.C.; Tan, M.L.; Kung, H.T.; Shi, J.; Bahtebay, J.; He, X. Methodology for Mapping the Ecological Security Pattern and Ecological Network in the Arid Region of Xinjiang, China. Remote Sens. 2023, 15, 2836. [Google Scholar] [CrossRef] [Scilit]
- Chen, W.D.; Liu, X.H.; Li, H.Y.; Sun, X.L.; Wang, Y.G.; Liu, X.J.; Xing, L.Y.; Wang, R.; Luo, X.P.; Wang, C.; et al. Ecosystem service function and security pattern of Tianshan Mountains in Xinjiang from 1990 to 2050. Geol. China 2024, 51, 1644–1663. [Google Scholar] [CrossRef]
- Tian, H.Z.; Wang, H.; Lyu, X.; Li, X.B.; Yang, Y.L.; Zhang, Y.; Liu, J.H.; Lu, Y.T.; Zhao, X.L.; Qu, T.F.; et al. Construction and optimization of ecological security patterns in Dryland watersheds considering ecosystem services flows. Ecol. Indic. 2024, 159, 111664. [Google Scholar] [CrossRef] [Scilit]
- Yang, J.; Zheng, J.H.; Lu, B.B.; Han, C.Q.; Li, C.R.; Wu, J.L.; Han, L.Z.; Harris, P. Critical phase transitions and early-warning frameworks for ecological networks in typical arid regions. J. Clean. Prod. 2025, 526, 146888. [Google Scholar] [CrossRef] [Scilit]
- Yang, R.Q.; Mu, Z.X.; Li, Z.L.; Qiu, X.Y.; Liu, J. A health-service-risk framework for evaluating ecological carrying capacity in arid inland river basins: A case study of the Tarim River Basin. Ecol. Indic. 2025, 173, 113427. [Google Scholar] [CrossRef] [Scilit]
- Yu, D.; Zhou, Z.C.; Chen, M.Y.; Liu, J.; Wang, N.; Zhu, B.B.; Cao, Y.X. Identifying the driving mechanisms of ecosystem health in a typical ecologically fragile region: A study based on the XGBoost–SHAP model. Ecol. Indic. 2025, 181, 114472. [Google Scholar] [CrossRef] [Scilit]
- Wilkerson, M.L.; Mitchell, M.G.E.; Shanahan, D.; Wilson, K.A.; Ives, C.D.; Lovelock, C.E.; Rhodes, J.R. The role of socio-economic factors in planning and managing urban ecosystem services. Ecosyst. Serv. 2018, 31, 102–110. [Google Scholar] [CrossRef] [Scilit]
- Sannigrahi, S.; Zhang, Q.; Pilla, F.; Joshi, P.K.; Basu, B.; Keesstra, S.; Roy, P.S.; Wang, Y.; Sutton, P.C.; Chakraborti, S. Responses of ecosystem services to natural and anthropogenic forcings: A spatial regression based assessment in the world’s largest mangrove ecosystem. Sci. Total Environ. 2020, 715, 137004. [Google Scholar] [CrossRef] [Scilit]
- Adkins, J.; Hammill, E.; Abdulwahab, U.A.; Draper, J.P.; Wolf, J.M.; McClure, C.M.; Ortiz, A.A.G.; Chavez, E.A.; Atwood, T.B. Environmental variables drive spatial patterns of trophic diversity in mammals. Ecol. Lett. 2023, 26, 1940–1950. [Google Scholar] [CrossRef] [Scilit]
- Gao, J.; Zuo, L. Revealing ecosystem services relationships and their driving factors for five basins of Beijing. J. Geogr. Sci. 2021, 31, 111–129. [Google Scholar] [CrossRef] [Scilit]
- Shi, S.F.; Peng, S.Y.; Lin, Z.Q.; Zhu, Z.Y.; Ma, D.L.; Yin, Y.Y.; Lu, X.M.; Li, T.; Gong, L.P. Analysis of ecological environment quality heterogeneity across different landform types in Myanmar and its driving forces. Ecol. Indic. 2024, 168, 112755. [Google Scholar] [CrossRef] [Scilit]
- Belmiro, C.; Neto, R.D.M.S.; Barros, A.; Ospina, R. Understanding the land use intensity of residential buildings in Brazil: An ensemble machine learning approach. Habitat Int. 2023, 139, 102896. [Google Scholar] [CrossRef] [Scilit]
- Li, K.; Zhao, J.S.; Li, Y.P.; Lin, Y.L. Identifying trade-offs and synergies among land use functions using an XGBoost-SHAP model: A case study of Kunming, China. Ecol. Indic. 2025, 172, 113330. [Google Scholar] [CrossRef] [Scilit]
- Qian, K.X.; Ma, X.F.; Yan, W.; Li, J.X.; Xu, S.X.; Liu, Y.; Luo, C.; Yu, W.; Yu, X.T.; Wang, Y.H.; et al. Trade-offs and synergies among ecosystem services in Inland River Basins under the influence of ecological water transfer project: A case study on the Tarim River basin. Sci. Total Environ. 2024, 908, 168248. [Google Scholar] [CrossRef] [Scilit] [PubMed]
- Xue, L.Q.; Wang, J.; Zhang, L.C.; Wei, G.H.; Zhu, B.L. Spatiotemporal analysis of ecological vulnerability and management in the Tarim River Basin, China. Sci. Total Environ. 2019, 649, 876–888. [Google Scholar] [CrossRef] [Scilit]
- Hou, Y.F.; Chen, Y.N.; Ding, J.L.; Li, Z.; Li, Y.P.; Sun, F. Ecological Impacts of Land Use Change in the Arid Tarim River Basin of China. Remote Sens. 2022, 14, 1894. [Google Scholar] [CrossRef] [Scilit]
- Wang, Y.; Xia, T.T.; Shataer, R.; Zhang, S.; Li, Z. Analysis of Characteristics and Driving Factors of Land-Use Changes in the Tarim River Basin from 1990 to 2018. Sustainability 2021, 13, 10263. [Google Scholar] [CrossRef] [Scilit]
- Pan, Z.Z.; He, J.H.; Liu, D.F.; Wang, J.W.; Guo, X.N. Ecosystem health assessment based on ecological integrity and ecosystem services demand in the Middle Reaches of the Yangtze River Economic Belt, China. Sci. Total Environ. 2021, 774, 144837. [Google Scholar] [CrossRef] [Scilit]
- Li, W.J.; Kang, J.W.; Wang, Y. Spatiotemporal changes and driving forces of ecological security in the Chengdu-Chongqing urban agglomeration, China: Quantification using health-services-risk framework. J. Clean. Prod. 2023, 389, 136135. [Google Scholar] [CrossRef] [Scilit]
- Liu, Z.J.; Si, J.H.; Jia, B.; He, X.H.; Zhou, D.M.; Wang, C.L.; Zhu, X.L.; Qin, J.; Ndayambaza, B.; Bai, X. The dominant influencing factors of desertification and ecological risk changes in Qinghai Area of Qilian Mountains National Park: Climate change or human activity? J. Environ. Manag. 2024, 362, 121335. [Google Scholar] [CrossRef] [Scilit]
- Yang, X.W.; Wei, G.Y.; Liang, C.Z.; Yang, Z.; Fang, H.Y.; Zhang, S.M. Construction of ecological security pattern based on ecosystem service evaluation and minimal cumulative resistance model: A case study of Hefei City, China. Environ. Dev. Sustain. 2024, 26, 10681–10700. [Google Scholar] [CrossRef] [Scilit]
- Hai, W.Y.; Zheng, J.H.; Li, W.; Han, C.Q.; Yan, Y.; Zhang, F.F. Exploration of multi-scale ecological regulation pathways in the arid northwest region of China from the perspective of ecosystem health. Ecol. Indic. 2025, 177, 113778. [Google Scholar] [CrossRef] [Scilit]
- Sharp, R.; Douglass, J.; Wolny, S.; Arkema, K.; Bernhardt, J.; Bierbower, W.; Chaumont, N.; Denu, D.; Fisher, D.; Glowinski, K.; et al. InVEST 3.9.1.post1+ug.G48b9aa8 User’s Guide; The Natural Capital Project; Stanford University, University of Minnesota, The Nature Conservancy, and World Wildlife Fund: Stanford, CA, USA, 2020. [Google Scholar]
- Redhead, J.W.; Stratford, C.; Shar, K.; Jones, L.; Ziv, G.; Clarke, D.; Oliver, T.H.; Bullock, J.M. Empirical validation of the InVEST water yield ecosystem service model at a national scale. Sci. Total Environ. 2016, 569, 1418–1426. [Google Scholar] [CrossRef] [Scilit] [PubMed]
- Eekhout, J.P.C.; Vente, J.D. Global impact of climate change on soil erosion and potential for adaptation through soil conservation. Earth-Sci. Rev. 2022, 226, 103921. [Google Scholar] [CrossRef] [Scilit]
- Chen, J.; Wang, S.S.; Zou, Y.T. Construction of an ecological security pattern based on ecosystem sensitivity and the importance of ecological services: A case study of the Guanzhong Plain urban agglomeration, China. Ecol. Indic. 2022, 136, 108688. [Google Scholar] [CrossRef] [Scilit]
- Yang, J.; Zheng, J.H.; Lu, B.B.; Han, C.Q.; Li, C.R.; Wu, J.L.; Han, L.Z.; Harris, P. How to quantify the impact of urban expansion on ecological security in Northwest China. J. Clean. Prod. 2025, 526, 146622. [Google Scholar] [CrossRef] [Scilit]
- Li, W.J.; Kang, J.W.; Wang, Y. Integrating ecosystem services supply-demand balance into landscape ecological risk and its driving forces assessment in Southwest China. J. Clean. Prod. 2024, 475, 143671. [Google Scholar] [CrossRef] [Scilit]
- Liu, X.Y.; Su, Y.; Li, Z.G.; Zhang, S. Constructing ecological security patterns based on ecosystem services trade-offs and ecological sensitivity: A case study of Shenzhen metropolitan area, China. Ecol. Indic. 2023, 154, 110626. [Google Scholar] [CrossRef] [Scilit]
- Jin, X.X.; Wei, L.Y.; Wang, Y.; Liu, Y.Q. Construction of ecological security pattern based on the importance of ecosystem service functions and ecological sensitivity assessment: A case study in Fengxian County of Jiangsu Province, China. Environ. Dev. Sustain. 2021, 23, 563–590. [Google Scholar] [CrossRef] [Scilit]
- Chen, X.Y.; Zhu, B.C.; Li, T.S.; Li, J.L.; Zhu, X.Q.; Xu, B. Ecologically sensitive networks: Construction of an ecological structural model of negative effects. Geogr. Sci. 2024, 44, 1619–1629. [Google Scholar] [CrossRef]
- Xu, L.L.; Yan, H.; Qian, S. Spatio-temporal change of land desertification sensitivity in Northern China from 2000 to 2018 based on MODIS-NDVI. J. Nat. Res. 2020, 35, 925–936. [Google Scholar] [CrossRef] [Scilit]
- Xu, H.Q.; Wang, M.Y.; Shi, T.T.; Guan, H.D.; Fang, C.Y.; Lin, Z.L. Prediction of ecological effects of potential population and impervious surface increases using a remote sensing based ecological index (RSEI). Ecol. Indic. 2018, 93, 730–740. [Google Scholar] [CrossRef] [Scilit]
- Ji, J.W.; Tang, Z.Z.; Jiang, L.L.; Sheng, T.; Zhao, F.; Zhang, R.; Shifaw, E.; Liu, W.L.; Li, H.; Liu, X.H.; et al. Study on Regional Eco-Environmental Quality Evaluation Considering Land Surface and Season Differences: A Case Study of Zhaotong City. Remote Sens. 2023, 15, 657. [Google Scholar] [CrossRef] [Scilit]
- Wu, N.N.; Zhou, Y.J.; Yin, S.G.; Gong, H.B.; Zhang, C.G. Revealing the nonlinear impact of environmental regulation on ecological resilience using the XGBoost-SHAP model: Evidence from the Yangtze River Delta region, China. J. Clean. Prod. 2025, 514, 145700. [Google Scholar] [CrossRef] [Scilit]
- Zhang, Q.F.; Chen, Y.N.; Sun, C.J.; Xiang, Y.Y.; Hao, H.C. Changes in terrestrial water storage and evaluation of oasis ecological security in the Tarim River Basin. Arid Land Geogr. 2024, 47, 1–14. [Google Scholar] [CrossRef]
- Liu, C.L.; Li, W.L.; Xu, J.; Zhou, H.K.; Wang, W.Y.; Wang, H. Temporal and spatial variations of ecological security on the northeastern Tibetan Plateau integrating ecosystem health-risk-services framework. Ecol. Indic. 2024, 158, 111365. [Google Scholar] [CrossRef] [Scilit]
- Jin, W.J.; Bian, Z.X.; Dong, Z.C.; Chen, D.Q.; Zhang, X.F.; Wei, Z.Y. Diagnosis of ecological security and the spatial heterogeneity of its driving factors in the mining-impacted watershed, based on ecosystem health-risk-services framework. Ecol. Indic. 2024, 167, 112683. [Google Scholar] [CrossRef] [Scilit]

Disclaimer/Publisher’s Note: The statements, opinions and data contained in all publications are solely those of the individual author(s) and contributor(s) and not of MDPI and/or the editor(s). MDPI and/or the editor(s) disclaim responsibility for any injury to people or property resulting from any ideas, methods, instructions or products referred to in the content. |
© 2026 by the authors. Licensee MDPI, Basel, Switzerland. This article is an open access article distributed under the terms and conditions of the Creative Commons Attribution (CC BY) license.