


Abstract
This study examines the association between the formal (de jure) adoption of renewable energy source (RES) support instruments and observed RES deployment outcomes across 36 European countries. We assess whether broader legislative adoption—measured by a transparent breadth/coverage index (SIC/OIL) based on binary coding and equal sector weights—correlates with higher RES shares. The empirical design comprises three complementary steps: (i) hierarchical clustering (Ward’s method; Euclidean distance on standardised indicators) to classify countries by legislative adoption profiles; (ii) parallel clustering of countries by RES utilisation profiles using 10 z-score-standardised outcome indicators (total and sectoral RES shares and per capita RES use by source); and (iii) an integrated comparison of both typologies, followed by a cross-sectional regression test of the OIL–RES association. Legislative and utilisation clusters do not systematically coincide, and the baseline regression shows a weak, statistically insignificant association with very low explanatory power (R2 = ≈ 0.015), supporting heterogeneity (H1) rather than a universal positive average relationship (H2). Interpretation is conservative because SIC/OIL captures policy-mix coverage (not budgets, enforcement, or design stringency) and because some low/zero policy entries may reflect limited source coverage. Overall, the findings suggest that observed RES performance is primarily shaped by country-specific structural conditions (resource endowments, economic capacity, and sustained long-term investment), implying that context-sensitive instruments and stronger implementation capacities should complement formal policy adoption.
1. Introduction
The expansion of renewable energy sources (RESs) is a fundamental pillar of the European energy transition, driven in the European Union by a strategy to achieve climate neutrality, strengthen energy security, and reduce dependence on fossil fuels [1]. Over the past two decades, the EU has introduced a wide set of directives (Energy Performance of Buildings Directive (EPBD) [2], Renewable Energy Directives (RED I, II, III, ETS), etc.), market regulations, and financial instruments intended to harmonise support schemes and accelerate the energy transition across Member States. Despite this common legislative framework, significant disparities persist in the share of RESs achieved at the national level, revealing uneven progress in meeting EU climate and energy targets [3,4].
Existing research has extensively examined the drivers of renewable energy deployment, focusing on factors such as economic development, financial mechanisms, technological advancement, and energy productivity [5,6,7,8,9]. Comparative studies also show that Member States follow different energy pathways due to variations in natural resource availability, infrastructure maturity, and market conditions [10,11]. However, while the EU increasingly relies on regulatory harmonisation, fewer studies have directly tested whether the degree of policy implementation itself translates into higher renewable energy outcomes. Most empirical literature assesses RES deployment through macroeconomic or technological lenses [12,13]. Still, these studies do not examine whether countries that adopt and operationalise a larger share of EU-designed support mechanisms achieve stronger RES penetration.
This gap highlights a critical unresolved question: does formal implementation (de jure adoption) of EU policy instruments materially influence the performance of national energy systems, or are other national characteristics more decisive? In principle, broader, stronger legislative adoption should provide clearer investment signals, reduced regulatory uncertainty, and more predictable market conditions for renewable deployment. At the same time, structural conditions, such as natural resource endowment, grid flexibility, administrative capacity, financing availability, and institutional governance, may outweigh policy alignment and ultimately determine the success of energy transitions, as noted in the bibliography [14,15,16,17,18].
Against this background, the present study investigates the relationship between the formal adoption of renewable support mechanisms and the real-scale deployment of renewable energy across European countries. The analysis includes both EU and non-EU states, allowing for a comparison between countries operating within EU regulatory frameworks and those following independent policy trajectories, thereby strengthening the robustness of cross-country insights. Specifically, it seeks to answer two research questions:
- *
- RQ1: How heterogeneous is the implementation of renewable support policies among European states?
- *
- RQ2: Does a higher degree of legislative adoption correlate with higher renewable energy shares in national energy mixes?
Conceptually, we distinguish two complementary layers: RQ2 addresses the average association between policy adoption coverage (OIL) and outcomes (RES deployment), whereas RQ1 motivates the hypothesis that this relationship may be systematically heterogeneous (conditional) across national contexts.
To address these questions, a composite legislative support index was constructed to quantify the degree of implementation of primary renewable policy instruments. This index was compared with actual RES deployment using clustering and regression methods across various European countries. By directly linking policy-mix adoption coverage to observed outcomes, this study provides empirical evidence for an unresolved policy debate: whether formal compliance with renewable energy policy frameworks is sufficient to drive energy transitions, or whether structural national factors play a stronger role in shaping performance. This high-level approach focuses on the overall breadth/coverage of the policy mix (de jure adoption) rather than the effectiveness of individual measures, which represents a limitation that future research could explore in greater depth.
2. Methods
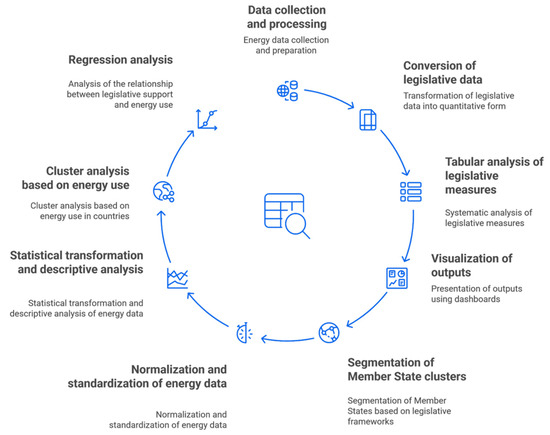
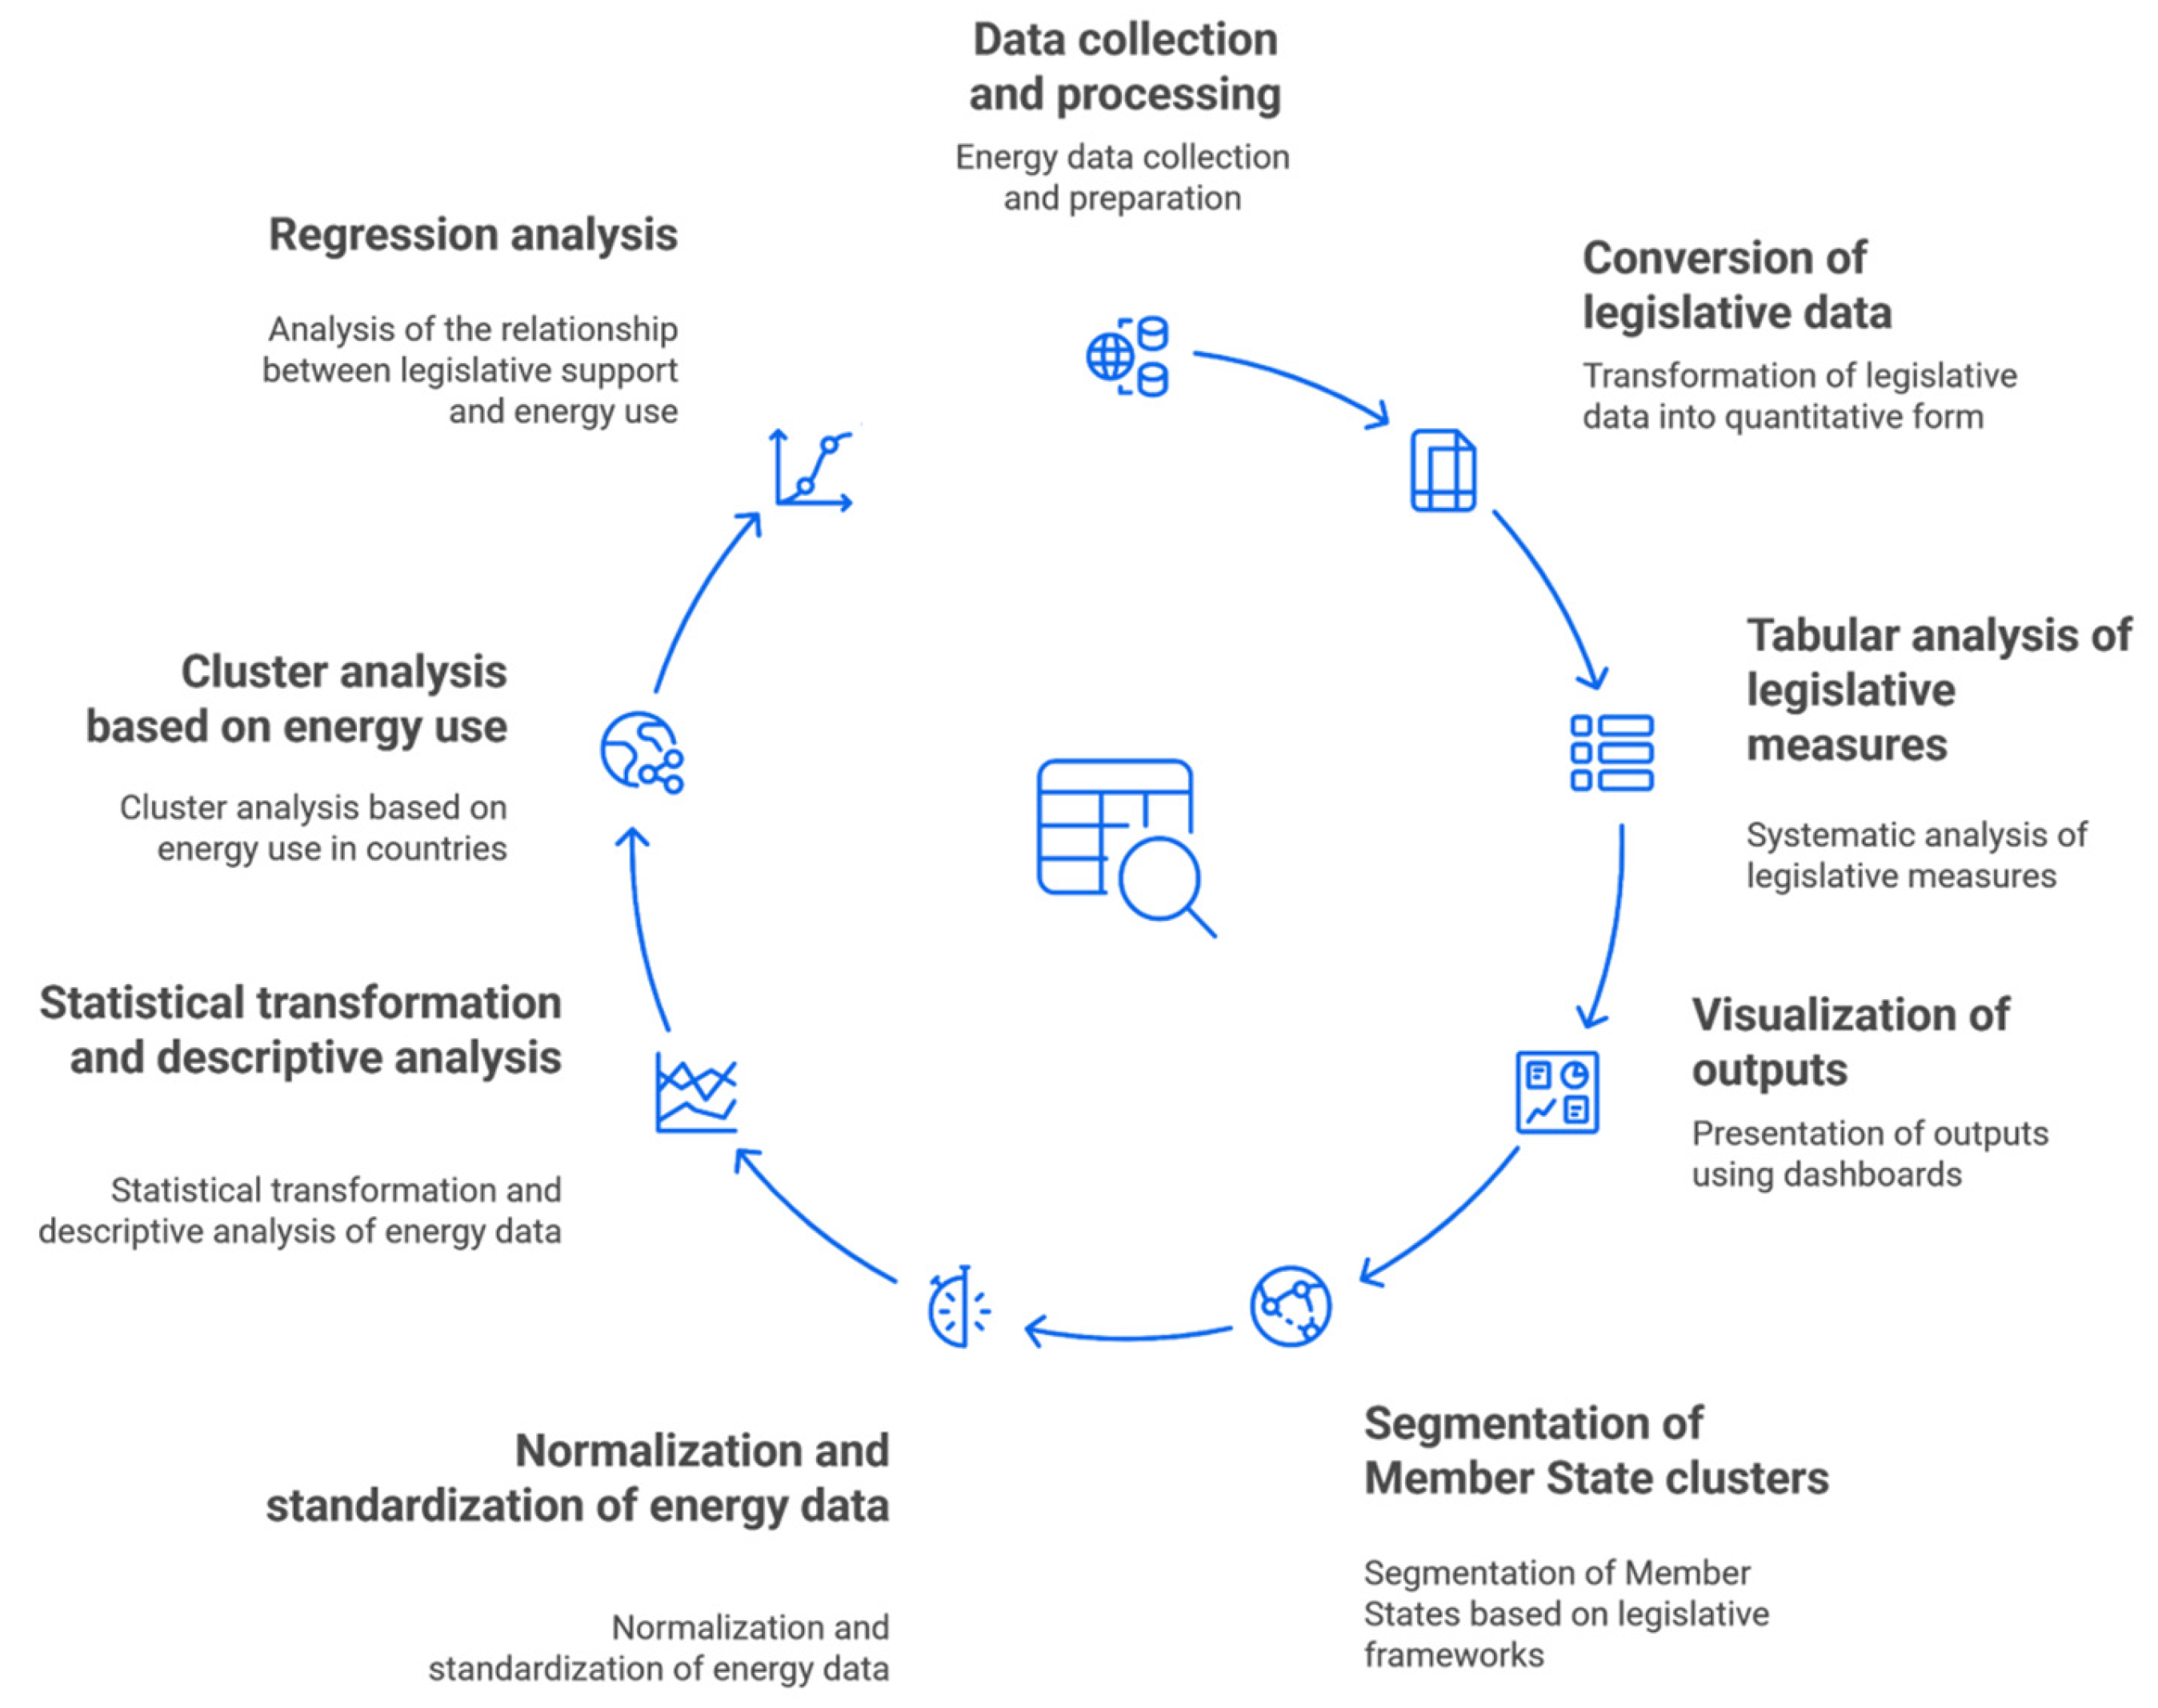
The study aims to analyse the dynamics and structural characteristics of renewable energy source (RES) development in EU and non-EU countries for the period 2013–2022. It relies on harmonised Eurostat statistics, data from national energy agencies, and information on legislative support instruments from the RES-Legal Europe database. The approach combines descriptive and ex ante analysis along two analytical strands: (i) an extensive cross-country comparison of the levels of legislative support across three sectors (electricity, heating and cooling, transport) and (ii) quantitative evaluation of the effectiveness of these frameworks on actual RES utilisation through panel models. The time frame up to 2022 provides a consistent basis for inter-country comparisons; to assess the impacts of events after 2022, including the Ukraine conflict, updating the data in subsequent research is recommended. This study does not model the effect of the Ukraine war on RES development in Europe (Figure 1 and Box 1).
Figure 1.
Data analysis process. Source: own processing.
Box 1. Construction of the legislative adoption indices: SIC and OIL (see Figure 1).
- (A)
- Unit of observation, coverage, and sources. SIC and OIL are constructed at the country level based on formal (de jure) adoption of selected RES support instruments across three sectors: electricity (E), heating & cooling (H&C), and transport (T). The study covers 36 European countries (EU and non-EU). Outcome variables (total RES share and sectoral RES shares) are primarily drawn from Eurostat for 2013–2022. The policy adoption indices are used as a cross-sectional measure aligned with the 2022 outcome cross-section. Policy instrument information is compiled from RES-Legal Europe (and related legislative sources).
- (B)
- Binary coding. For each country , sector , and instrument , we define a formal implementation indicator : if the instrument is implemented de jure, otherwise, . SIC/OIL are therefore interpreted as breadth/coverage indicators of de jure policy-mix adoption, not as measures of policy “strength”, budgets, enforcement, or design stringency.
- (C)
- Sector Implementation Coefficient (SIC). Sectoral implementation is measured as the share of implemented instruments in the sector:where denotes the number of tracked instruments in sector .
- (D)
- Overall Implementation Level (OIL). Overall implementation is computed as the simple average of sectoral SIC values (equal sector weights):
- (E)
- Binary instrument checklist by sector (yes/no).
Electricity (E), : (E1) Financial subsidies and grants; (E2) Green certificates; (E3) Feed-in tariffs; (E4) Feed-in premiums; (E5) Tax breaks and incentives; (E6) Tenders and auctions; (E7) Research & Development.
Heating & Cooling (H&C), : (H1) Financial subsidies and grants; (H2) Feed-in tariffs (heat/cold); (H3) Feed-in premiums (heat/cold); (H4) Tax breaks and incentives; (H5) Tenders and auctions; (H6) Research & Development; (H7) Heat pump support; (H8) Support for solar thermal systems; (H9) Biomass support.
Transport (T), : (T1) Financial subsidies and grants; (T2) Tax breaks and incentives; (T3) Tenders and auctions; (T4) Research & Development; (T5) Support for biofuels; (T6) Support for electric vehicles; (T7) Support for hydrogen fuel cells.
- (F)
- Weights and interpretive scope. The baseline specification applies equal weights within sectors and across sectors to capture policy-portfolio breadth. A weighted version would require harmonised, comparable information on instrument stringency, budgets, coverage, or enforcement, which is not consistently available in the underlying policy source; therefore, weighted variants are discussed only as a methodological extension for future research.
- (G)
- Worked example (country and year). Worked example for Austria (AT; 2022 cross-section):Electricity ;H&C ;Transport ;Overall .
- (H)
- Ambiguity of “0%” entries. For some countries—particularly observations with zero aggregate scores—the policy source does not allow for an unambiguous distinction between true non-implementation (“no policy”) and lack of information (“no data”). This ambiguity is therefore treated as a methodological limitation: results are interpreted conservatively, and measurement uncertainty is explicitly noted as a potential source of attenuation in estimated associations. Future work should address this by using source triangulation and sensitivity scenarios to interpret zero entries.
Qualitative legislative information is operationalised in four steps: (1) identification of sector-specific instruments, (2) compilation of a yes/no implementation list, (3) binary coding, and (4) computation of SIC and OIL (Box 1). This enables transparent cross-country comparison of policy-portfolio coverage and supports typological classification.
Hypothesis H1.
The OIL–RES relationship is heterogeneous across countries and conditional on country characteristics (e.g., endowments, macroeconomic status, institutional capacity).
Hypothesis H2.
On average (unconditional), higher OIL is positively associated with a higher total RES share.
The analysis combines descriptive profiling, clustering, and regression-based association tests. Descriptive evidence uses Eurostat outcomes for 2013–2022. Clustering is performed using hierarchical Ward’s method with Euclidean distances; all clustering inputs are z-score standardised, so distances represent dissimilarities in standardised multi-indicator profiles. Policy–outcome associations are evaluated using cross-sectional OLS models aligned with the 2022 outcome cross-section (consistent with the cross-sectional nature of OIL). Controlled specifications include available structural controls (GDP per capita (GDPpp) and energy intensity of GDP in PPS); robustness uses an alternative dependent variable (e.g., RES share in electricity). Regression tables report coefficients, heteroskedasticity-robust standard errors, N, and fit statistics.
Outcome indicators include total RES share and sectoral RES shares (electricity, H&C, transport) from Eurostat. Sectoral operationalisation follows the instrument checklist in Box 1. Controls for regressions are GDPpp (optionally log-transformed) and energy intensity, which are aligned to the 2022 cross-section; sample size varies with data availability and is reported in the regression table.
Key limitations are: (i) binary coding and equal weighting imply SIC/OIL capture policy-mix breadth rather than policy strength/enforcement; (ii) potential ambiguity of some “0%” policy entries (no policy vs. no data), treated as measurement uncertainty; and (iii) uneven availability of control variables (especially outside the EU), which affects N. The study does not model post-2022 shocks.
Future research should extend the dataset beyond 2022, triangulate policy coding with additional sources, test sensitivity scenarios for ambiguous zero entries, and construct weighted/time-varying indices once comparable information on instrument strength (budgets, stringency, enforcement, coverage) becomes available, enabling richer longitudinal/panel causal designs.
3. Results
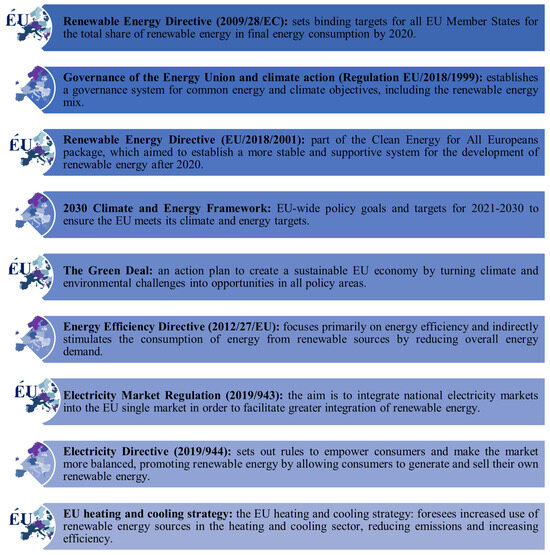
We provide a brief and selective overview of the EU policy framework only to the extent needed to interpret the instrument categories and to construct our legislative adoption index. EU energy policy is anchored in Article 194 TFEU, combining common objectives with substantial Member State discretion regarding the energy mix and domestic resource use.
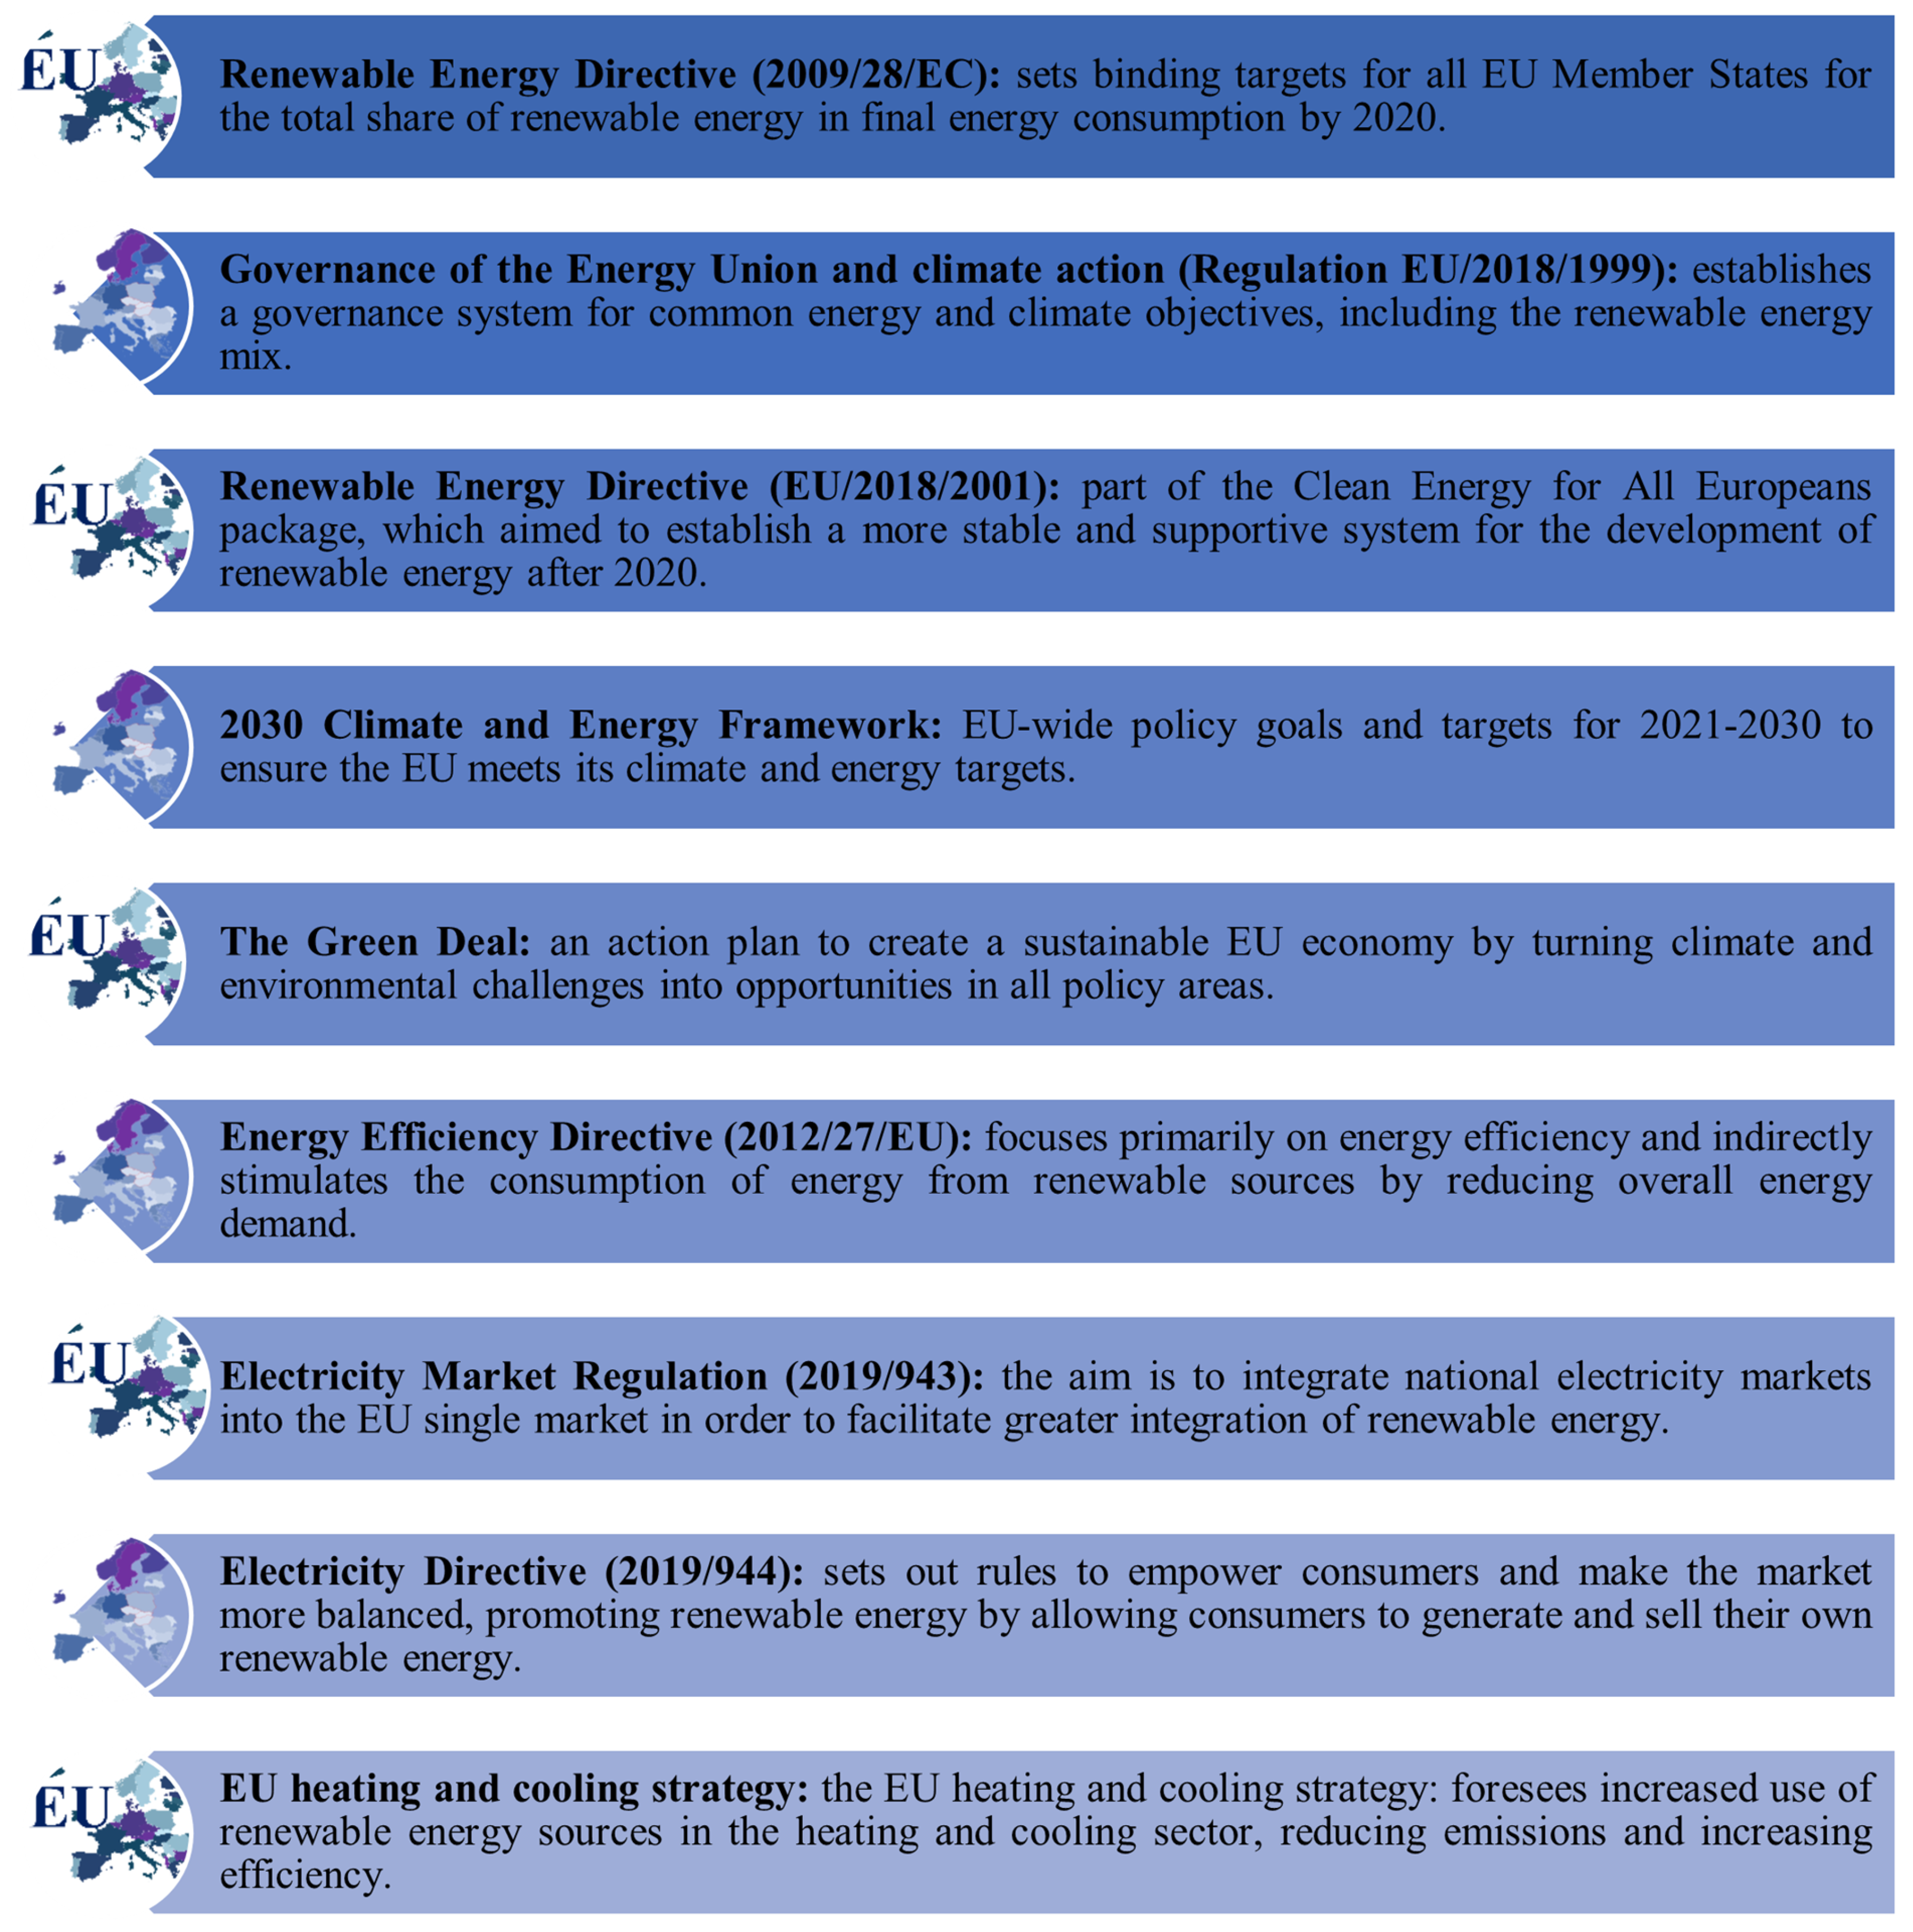
From the perspective of renewables, the core backbone is the Renewable Energy Directive (notably EU/2009/28 and subsequent revisions) and the Governance Regulation (EU/2018/1999) [19], which requires Integrated National Energy and Climate Plans (NECPs). Together, these acts define targets and key principles relevant to the support instrument categories captured in our index (e.g., guarantees of origin, principles for support schemes, and planning requirements). Complementary legislation, including the Energy Efficiency Directive (EU/2012/27) [20] and EU R&I programmes (Horizon 2020/Horizon Europe), supports deployment through efficiency improvements and innovation capacity. Figure 2 summarises the key EU-level acts; additional descriptive detail is consolidated outside the main text to maintain focus on the empirical analysis.
Figure 2.
Basic EU legislative frameworks for renewable energy. Source: Own elaboration based on [19,20,21,22,23,24,25,26,27].
3.1. Support for Renewable Energy in the Electricity Sector
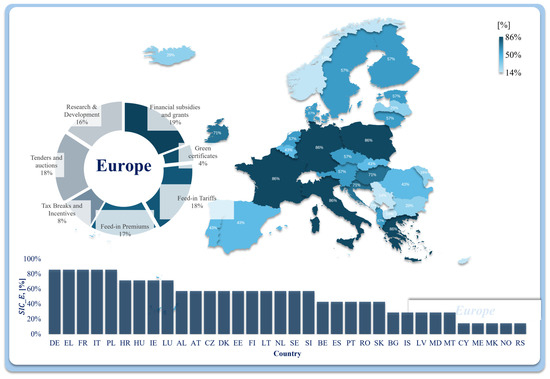
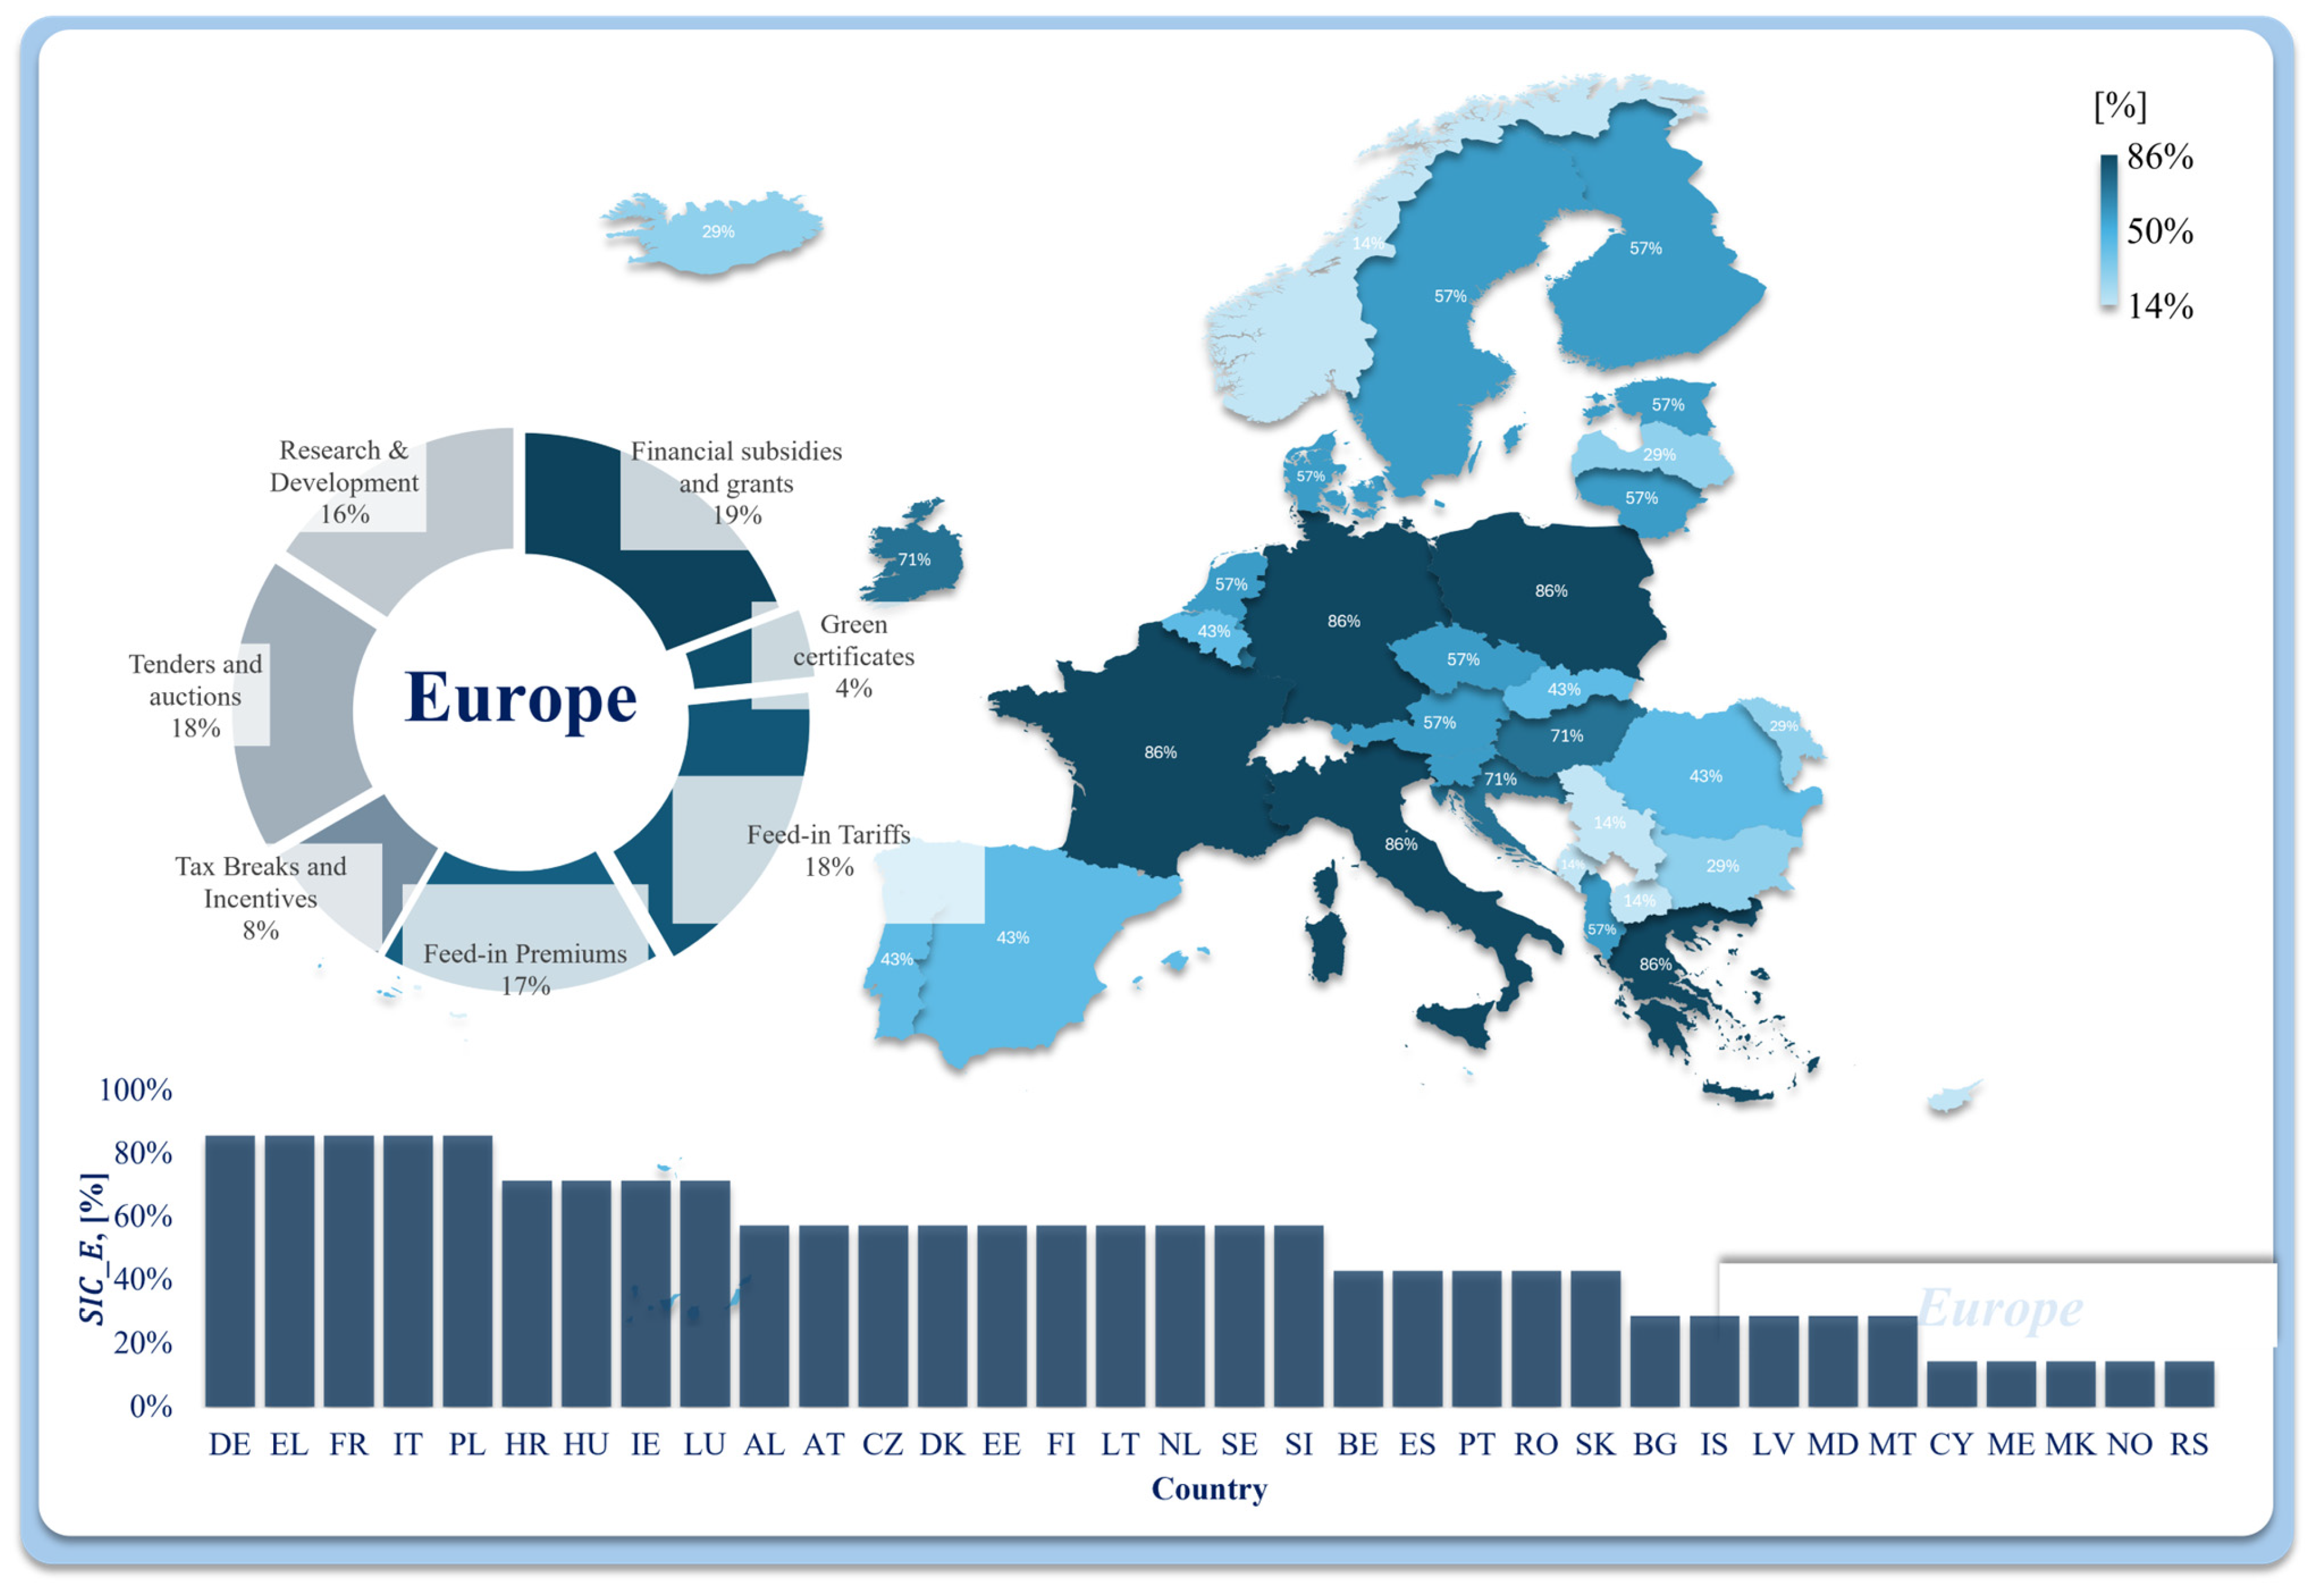
Energy support mechanisms for renewable energy sources (RESs) in the electricity sector are included in this study as components of the electricity-policy portfolio used to compute the Sector Implementation Coefficient (SIC sub cap E) (Section 2 Box 1). Importantly, the reported shares reflect the relative prevalence of instruments in national policy mixes under the binary coding scheme (adopted vs. not adopted) rather than their budgetary magnitude, enforcement, or design stringency.
Among the analysed European countries, financial subsidies and grants are the most prevalent electricity-sector instruments (19%). Feed-in tariffs account for 18% and feed-in premiums for 17%, indicating that price-based revenue-stabilisation schemes remain widely adopted. Tenders and auctions also comprise 18% of the measured instruments, consistent with the broader shift towards competitive allocation mechanisms. Support for research and development represents 16%, signalling continued emphasis on innovation and cost reductions, while tax incentives and exemptions account for 8%. Green certificates are the least prevalent instrument (4%). Taken together, this distribution characterises the composition of de jure electricity-sector policy portfolios that feed into /OIL and provides context for subsequent analyses assessing whether broader formal adoption coverage is associated with observed RES outcomes across countries (Figure 3).
Figure 3.
Analysis of RES support in the electricity generation sector in Europe. Source: Own elaboration according to LEG RES [28].
3.2. Comparative Analysis of Support Implementation at the National Level
A comparative analysis of electricity support mechanisms revealed that countries such as Germany, Greece, France, Italy, and Poland achieved the highest implementation rates, reaching up to 85.71%. These countries adopted broad policy portfolios (e.g., subsidies/grants, tenders, R&D support, and tax incentives), indicating extensive de jure coverage of support instruments. This breadth of adoption is consistent with their observed expansion of RES capacity.
Conversely, countries including Cyprus, Montenegro, North Macedonia, Norway, and Serbia recorded the lowest levels of implementation, with only 14.29%. Lower adoption breadth may reflect economic, institutional, or technological constraints that limit the formal rollout of support instruments.
A broader context provided a deeper understanding of these findings. Countries with sustained R&D support signal a longer-term orientation toward innovation-driven energy transition and technology diffusion.
It was also observed that countries with a high level of implemented support measures frequently ranked among the leaders in renewable energy adoption. For example, Germany’s high adoption breadth aligns with its strong RES deployment, particularly in wind and solar, supported by stable policy commitments and investment continuity. However, this alignment should be interpreted as associative rather than causal within the present framework.
In contrast, countries with low implementation rates often face infrastructure and financial challenges, limiting their ability to fully leverage the potential of renewable energy sources. Improvement in lower-adoption countries is likely to require strengthened implementation capacity and investment conditions, alongside clearer regulatory frameworks and access to finance.
3.3. Support of Renewable Energy Sources in the Heating and Cooling Sector
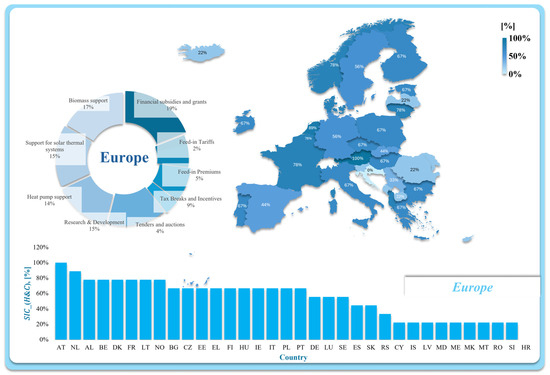
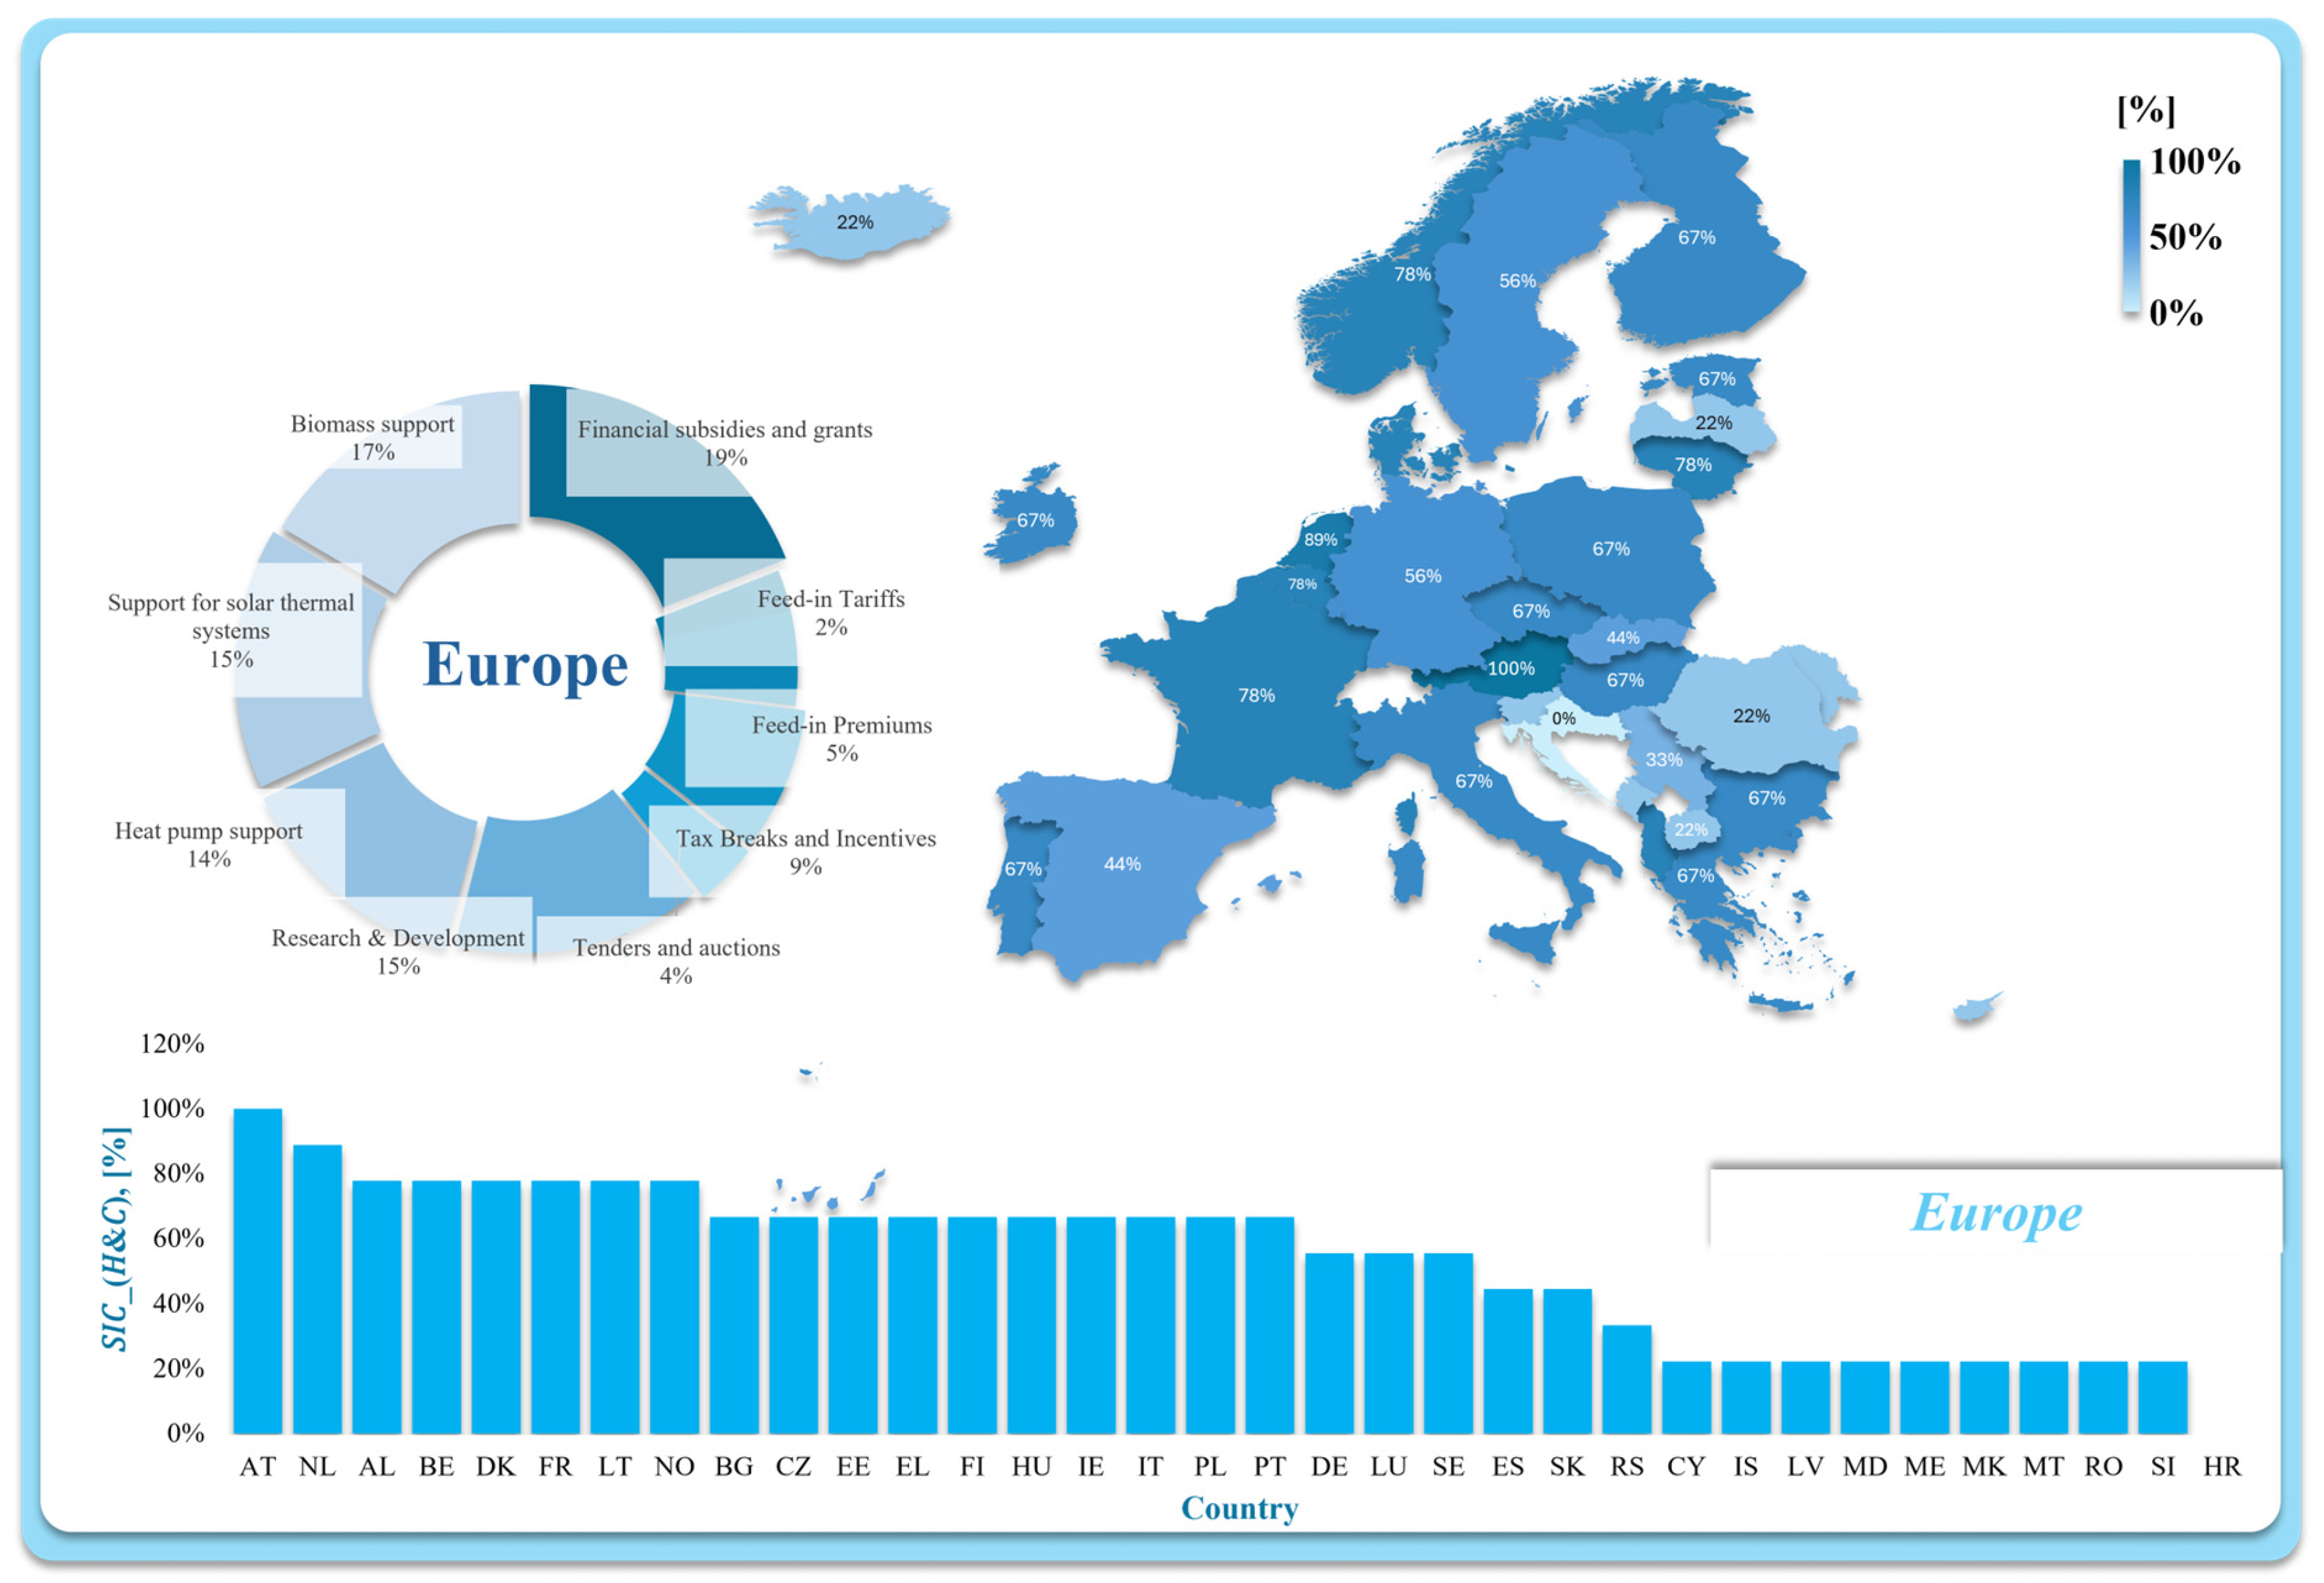
The heating and cooling (H&C) sector is a major component of final energy demand in Europe and is therefore central to RES deployment beyond the electricity system. In this study, H&C support is operationalised as part of the policy-mix breadth index () using a binary checklist of nine instrument categories (Section 2 Box 1): financial subsidies and grants; feed-in tariffs (heat/cold); feed-in premiums (heat/cold); tax incentives; tenders and auctions; heat pump support; solar thermal support; biomass support; and R&D. The reported instrument shares represent the relative prevalence of these measures in national policy portfolios under the adopted yes/no coding rather than their budgetary scale, enforcement, or design stringency.
Across the analysed countries, financial subsidies and grants are the most prevalent H&C instrument (19.02%). Technology-oriented measures also feature prominently, including biomass support (16.56%), solar thermal support (15.34%), and heat pump support (14.11%), alongside R&D (14.72%). By contrast, market-allocation or price-based instruments are less frequently observed in H&C policy mixes: tax incentives account for 8.59%, feed-in premiums for heat/cold for 5.52%, tenders and auctions for 3.68%, and feed-in tariffs for heat/cold for 2.45%. Overall, this distribution characterises the composition of formally adopted H&C policy portfolios, ending in SIC sub and H&C end subscript, and provides context for the subsequent analyses linking policy-mix coverage to observed RES outcomes across countries (Figure 4).
Figure 4.
Evaluation of RES support in the heat and cold production sector in Europe. Source: Own elaboration according to LEG RES [28].
3.4. Comparative Analysis of Support Implementation at the National Level
In the area of renewable energy support implementation within the heating and cooling sector, several European countries stood out. Austria demonstrated exemplary performance, achieving a 100% implementation rate of support mechanisms. This full adoption indicates comprehensive de jure coverage of the assessed instrument set and reflects a strong policy commitment to renewable heating and cooling. Innovation support and program breadth are likely contributing factors.
The Netherlands also reached a high level of implementation, with 88.89%. Dutch policy similarly shows broad adoption coverage, consistent with long-term programmes supporting energy efficiency and RES integration in heating and cooling.
Conversely, countries such as Cyprus, Latvia, Moldova, Montenegro, North Macedonia, Malta, Iceland, Romania, and Slovenia were identified with notably lower rates of support implementation, all registering at or below 22.22%. These low adoption scores suggest limited policy-mix coverage, potentially linked to economic, institutional, or governance constraints in the sector [28].
Slovakia was observed to hold considerable potential in this area, yet its use of renewables for heating and cooling remained relatively limited. According to the Slovak Association for Sustainable Energy (SAPI), a universal gas-subsidy scheme reduced the relative competitiveness of renewable heating technologies by extending payback periods (e.g., for heat pumps). Heat pumps’ high efficiency (typically 3–4 kWh of heat per 1 kWh of electricity) contrasts with the lower conversion efficiency of conventional gas boilers (≈1.05 kWh of heat per 1 kWh of gas), highlighting the technical rationale for electrification and RES-based heat.
Since 2022, previous support for gas investment had discouraged new investments in renewables. However, SAPI expected that introducing targeted energy assistance could stimulate greater interest in green heating and cooling, particularly as gas prices were projected to rise in the coming year. SAPI therefore emphasised more targeted support for household programmes (e.g., “Green for Households” and “Renovate Your Home”) that co-finance RES installations. For instance, the “Green for Households” program was projected to exhaust its originally allocated budget of €107.7 million for 2025 well ahead of the original 2029 timeline, indicating strong household demand for grant-based access to renewable technologies [29].
In summary, the implementation of renewable energy support in the heating and cooling sector varied considerably across European countries. Overall, cross-country differences in point to uneven policy-mix coverage, which should be interpreted alongside national market conditions and implementation capacity [28].
3.5. Supporting Renewable Energy in the Transport Sector
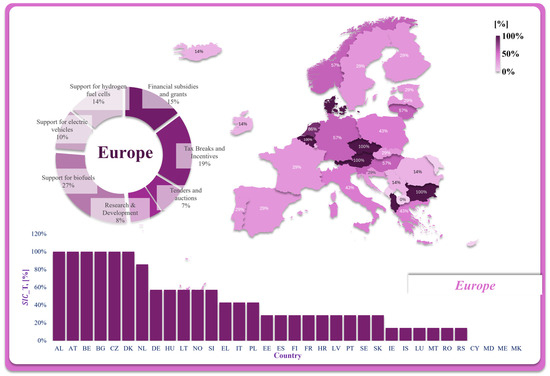
The transport sector is central to decarbonisation strategies and is therefore included in this study as the third component of the legislative adoption index () (Section 2 Box 1). Transport-sector support is operationalised through a binary checklist of seven instrument categories: biofuels; tax relief and incentives; financial subsidies and grants; electric vehicles; hydrogen fuel cells; research and development; and tenders and auctions. As with the other analyses in this study, the reported instrument shares quantify the relative prevalence of these measures in national policy portfolios under the adopted yes/no coding rather than their budgetary scale, enforcement, or design stringency. These policy portfolios are implemented within the broader EU decarbonisation pathway and long-term climate objectives, including the 2050 climate-neutrality target.
Within the analysed countries, support for biofuels is the most prevalent transport instrument (27.72%), followed by tax relief and incentives (18.81%) and financial subsidies and grants (14.85%). Support for hydrogen fuel cells represents 13.86%, indicating increasing formal attention to low-carbon fuels and related infrastructure, while support for electric vehicles accounts for 9.90%. Research and development represents 7.92%, and tenders and auctions represent 6.93%. When interpreting transport-sector results, an additional data-quality caveat applies: for a subset of countries, low/zero entries in transport-related support may reflect limited source coverage rather than verified non-implementation. Overall, these distributions characterise the composition of de jure transport policy portfolios feeding into /OIL and provide context for the subsequent analyses assessing whether broader formal adoption coverage is systematically associated with observed RES outcomes across countries (Figure 5).
Figure 5.
Evaluation of support for renewable energy in the transport sector. Source: own elaboration based on LEG RES [28].
3.6. Comparative Analysis of Support Implementation at the National Level
In the field of renewable energy support within the transport sector, several countries achieved outstanding outcomes. Albania, Austria, Belgium, Bulgaria, the Czech Republic, and Denmark emerged as frontrunners, each earning a 100% implementation rate of the support mechanism. These countries exhibit full de jure coverage of the assessed transport-policy instrument set, reflecting broad adoption portfolios (e.g., subsidies/grants, tax incentives, tenders, R&D, and biofuels support). Such breadth is consistent with an integrated approach to decarbonising transport and reducing emissions. Across these cases, R&D and tax-based incentives appear particularly relevant for enabling technology diffusion and uptake of cleaner options.
On the one hand, some countries report data on the implementation of support mechanisms. Although the levels are low—for example, in Romania, Ireland, Iceland, Luxembourg, Malta, and Serbia, which all show very low percentages—they have at least introduced some mechanisms. On the other hand, countries such as Cyprus, Moldova, Montenegro, and North Macedonia report a 0% level of implementation. In these cases, “0%” should be interpreted cautiously as it may indicate missing or uncertain source coverage rather than verified non-implementation of transport support instruments.
The lack of support mechanism implementation in these countries often resulted from a combination of inadequate infrastructure, underdeveloped markets, and insufficient political will. Lower measured adoption (or limited reporting) is plausibly associated with constraints in infrastructure, market maturity, and administrative capacity, as well as weaker transparency and public awareness [28].
Overall, it became clear that countries with ambitious, integrated approaches to supporting renewables, such as Austria and Denmark, were better equipped to address the challenges of modernising and decarbonising their transport systems. Overall, cross-country differences in SICT indicate uneven policy-mix coverage in transport; closing these gaps likely requires coordinated infrastructure investment, stable financing, and stronger implementation capacity rather than isolated single instruments.
3.7. Summary of the Analysis of RES Support Implementation
By examining the extent of renewable energy support across the electricity, heating, cooling, and transport sectors, it is possible to identify which areas receive the most significant focus from European member states. Here, sectoral comparisons are based on the breadth/coverage of formally adopted instruments (SIC by sector), rather than budgets or enforcement intensity.
In the electricity sector, Germany stood out as a leader, making the most significant investments in renewable technologies, such as photovoltaic systems and wind farms. In the electricity sector, Germany shows high de jure adoption coverage of support instruments (SICE), consistent with its strong deployment of wind and solar. Luxembourg and Romania have similarly concentrated on developing their electricity sectors, investing in projects that further the use of renewables. Luxembourg and Romania also exhibit relatively strong electricity-sector adoption profiles, although sector outcomes may still differ due to structural factors.
In the heating and cooling sector, Cyprus has been particularly active, strongly supporting solar and biomass technologies. Montenegro has also prioritised this sector by investing in both traditional and modern heat production technologies. Other countries, such as France and Estonia, contribute through the implementation of efficient heating and cooling systems, although not to the same degree as Cyprus or Montenegro. In heating and cooling, observed adoption patterns emphasise technology-oriented measures (e.g., solar thermal and biomass), but cross-country comparability should be interpreted cautiously where source coverage is limited.
Examining the transport sector, Belgium and Bulgaria have placed a strong emphasis on promoting biofuels and electric vehicles. Their measures focus squarely on environmentally friendly solutions that significantly reduce transportation emissions. In contrast, Cyprus has shown minimal investment in this sector, highlighting the significant obstacles it faces in adopting renewables in transport. In transport, Belgium and Bulgaria display broader policy-mix coverage (SICT). At the same time, low/zero values for some countries may partly reflect missing or uncertain reporting rather than the verified absence of instruments.
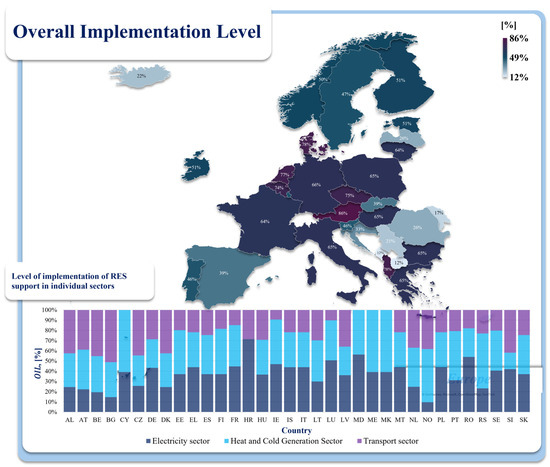
Overall, the emphasis on different sectors varies considerably across countries. Some member states have prioritised support for heating and cooling, while others have focused on electricity or transportation. Overall, sectoral heterogeneity in SIC scores indicates diverse policy-mix configurations across Europe, providing the basis for the clustering results in Figure 6 and subsequent comparisons with RES outcome profiles [28] (Figure 6).
Figure 6.
Analysis of the overall support for RES in individual European countries. Source: Own elaboration according to LEG RES [28].
3.8. Comparison of Overall RES Support Levels Between Countries
The previous analyses provide an overview of the levels of renewable energy support implementation. These levels vary between member states, reflecting differences in policy frameworks and economic conditions. In this study, “implementation level” refers to the breadth/coverage of formally adopted instruments (OIL), not to policy budgets, enforcement, or design stringency.
Among the countries with the highest levels of renewable energy support implementation are Austria, with an 86% rate, and the Netherlands, with a 77% rate. Austria’s high OIL reflects broad adoption across sectoral instrument sets, including solar- and biomass-related measures. Significant government subsidies for solar panel installations and biomass power plant development have encouraged energy companies to invest in renewable energy sources. Austria also combines financial support with regulatory elements (e.g., quota-type provisions), indicating a comparatively comprehensive policy mix.
The Netherlands has focused its efforts on developing wind farms, particularly offshore projects. The Netherlands’ high OIL similarly reflects a broad policy portfolio aligned with large-scale wind deployment, including R&D and investment-support components. Investments in infrastructure and government support for research and development of new renewable energy technologies have been key priorities. Public awareness campaigns have complemented these initiatives, helping to raise understanding of the advantages of renewables among the broader population. Overall, these features characterise a coherent policy portfolio, although the present index captures adoption breadth rather than implementation intensity.
Conversely, countries such as Cyprus, Montenegro, and North Macedonia are among those with the lowest levels of RES support implementation, reaching only about 12%. Cyprus, for instance, faces substantial challenges related to its limited financial resources and insufficient infrastructure, both of which hinder the growth of renewable energy. Montenegro and North Macedonia face similar challenges, including low levels of technological development and limited public awareness of the benefits of renewables, which hinder their progress. Low OIL values may therefore reflect constraints in institutional capacity, financing, and infrastructure; in addition, for some non-EU cases, very low/zero entries may partly reflect limited source coverage rather than verified non-adoption. To improve upon these circumstances, investments in new infrastructure and support for innovative technologies are essential. More broadly, strengthening implementation capacity and access to finance is likely to be more decisive than adopting isolated instruments.
3.9. Cluster Analysis of Similarities Among Countries in RES Support
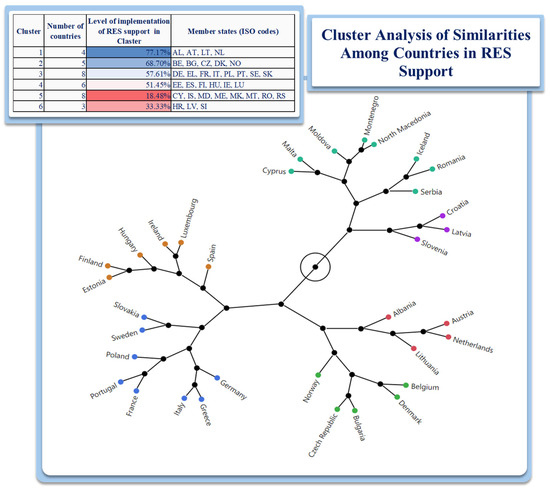
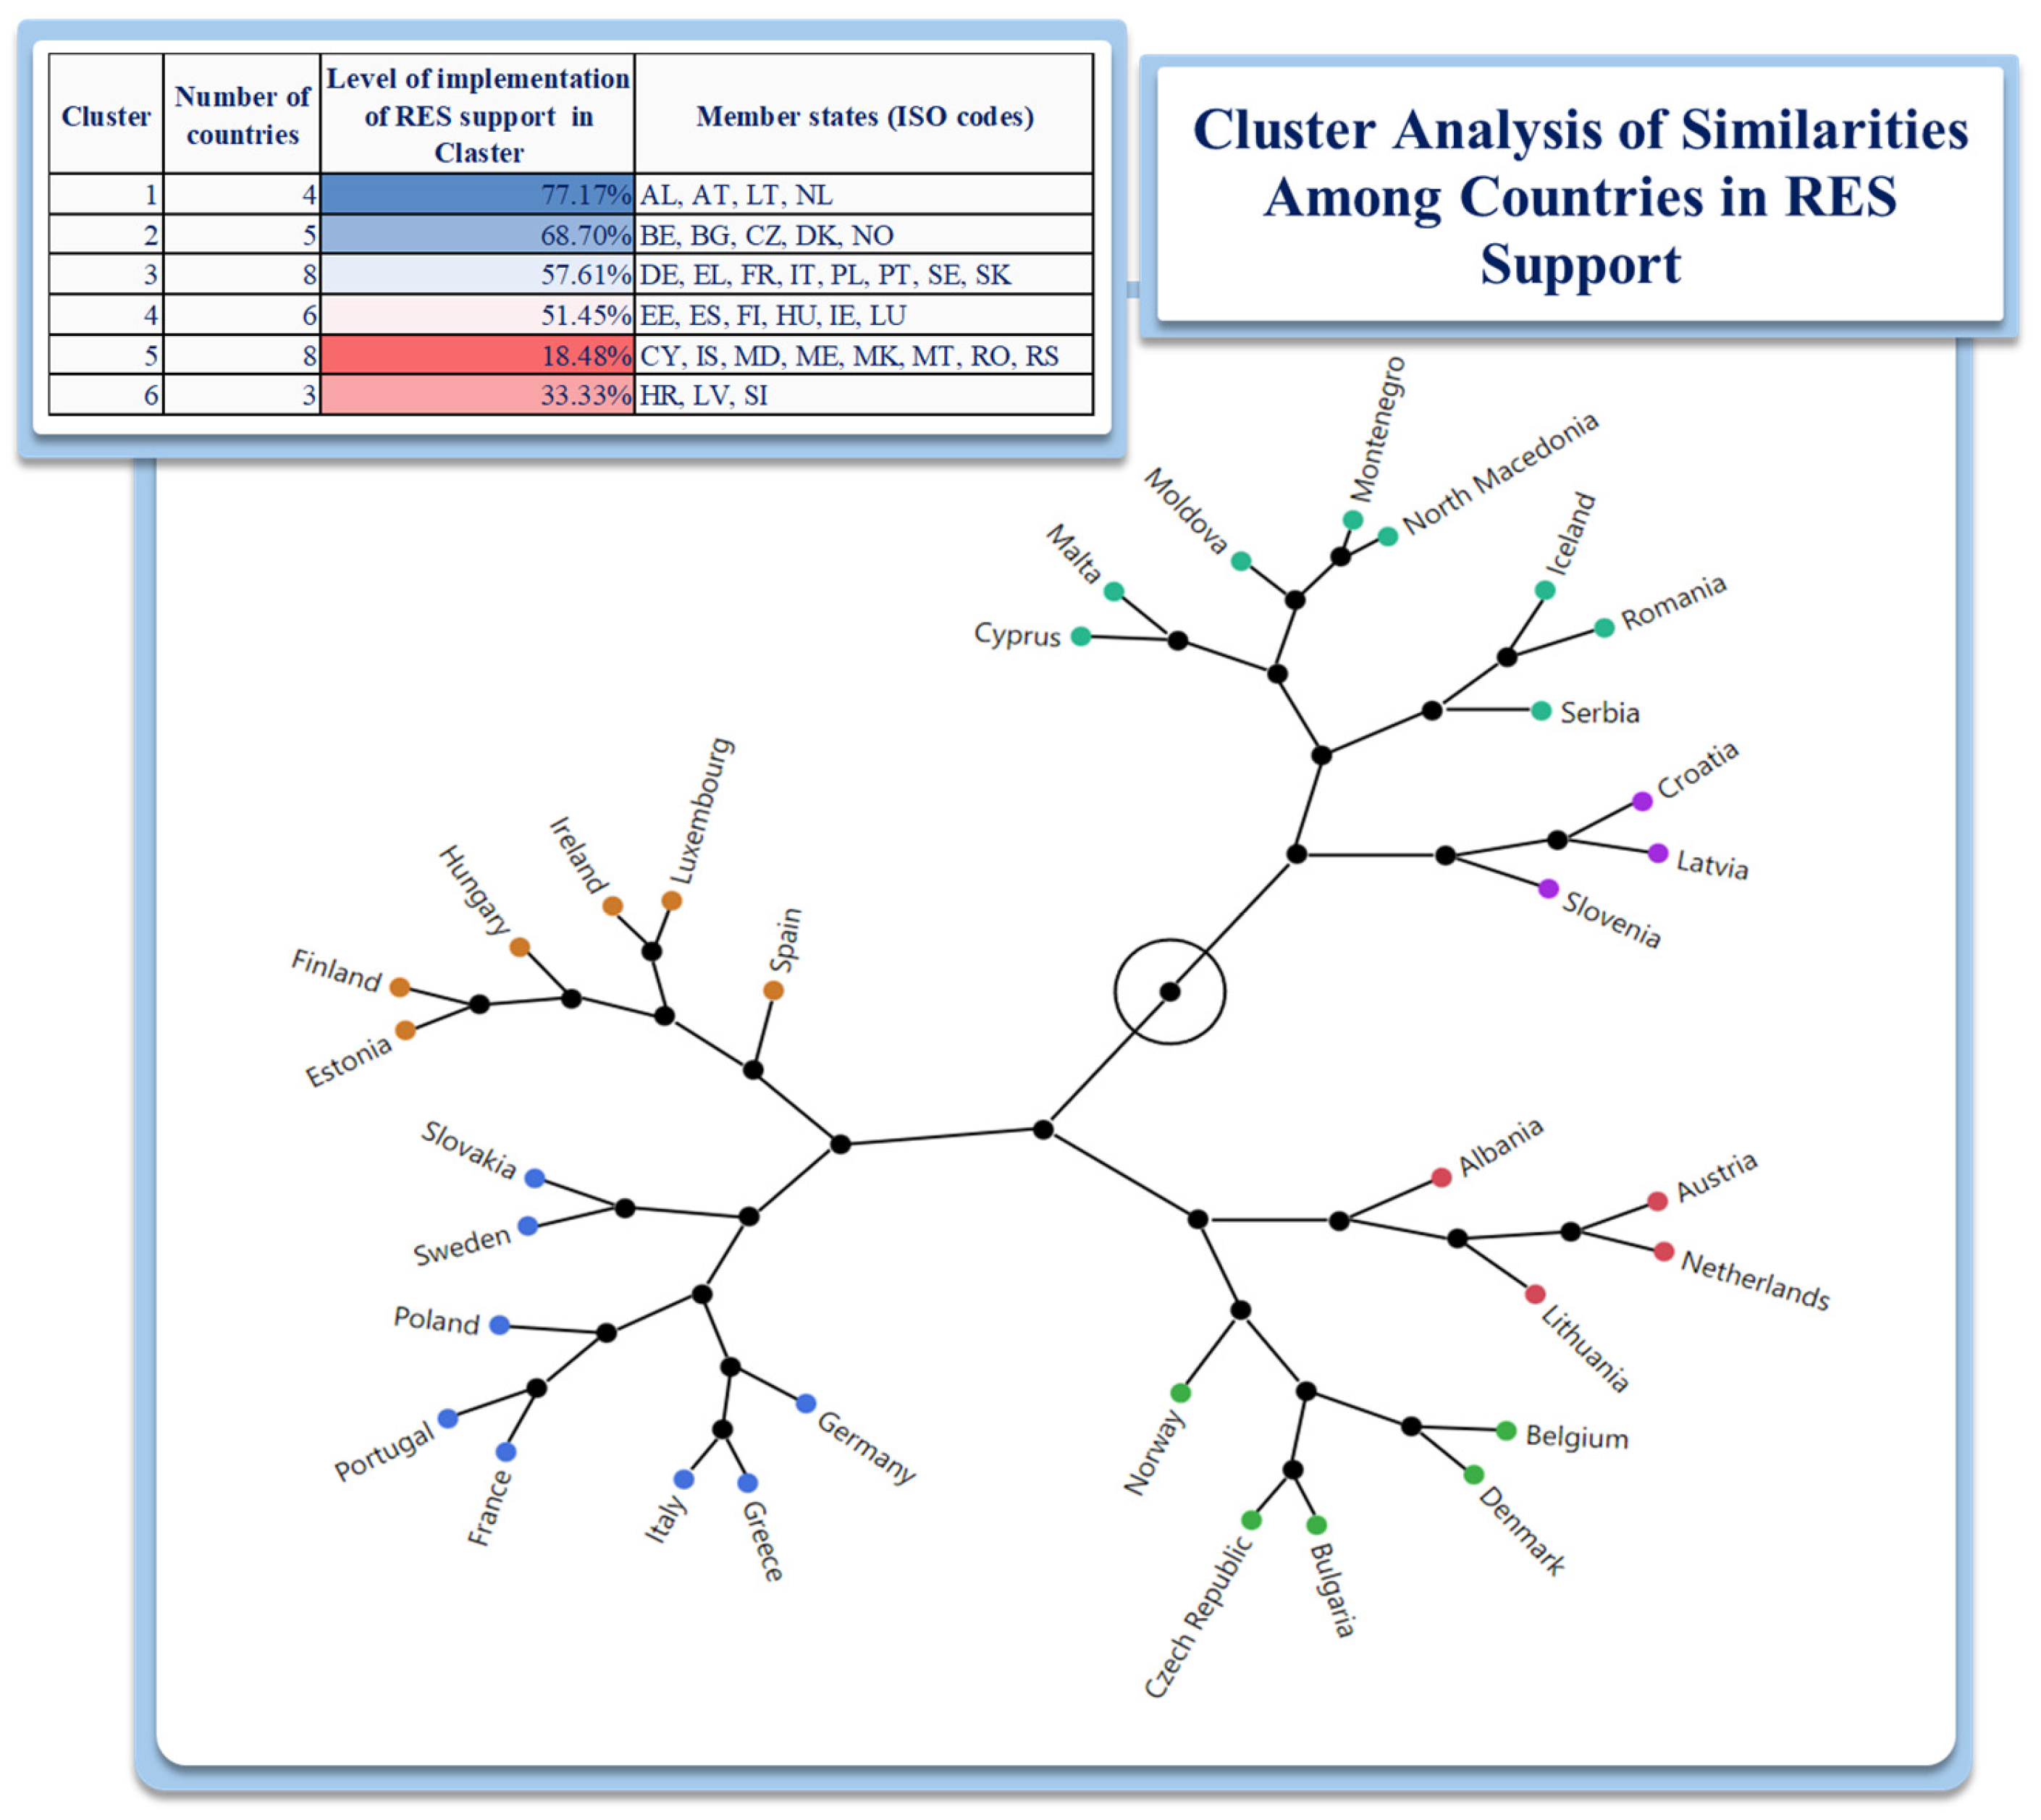
To better understand the patterns and similarities in the implementation of support for renewable energy sources (RESs) across European countries, a cluster analysis was conducted. This approach groups countries by similarity in the breadth/coverage of formally adopted support instruments.
The analysis resulted in six distinct clusters, each characterised by its average rate of RES support implementation and shared characteristics. Figure 7 reports the Ward hierarchical clustering (Euclidean distance) on z-score-standardised binary instrument profiles; K = 6 is selected by cutting the dendrogram at the main break in agglomeration distance.
Figure 7.
Cluster Analysis of Similarities Among Countries in RES Support. Source: Own elaboration according to LEG RES [28] in JMP 18.
The first cluster consisted of four countries, including Albania and Lithuania, which show the highest average implementation level of 77.17%. Cluster 1 represents the highest adoption coverage of the assessed policy mix.
The second cluster includes five countries, including Norway and Belgium, which show an average rate of 68.70%. Cluster 2 shows high adoption coverage, albeit below the top group.
The third cluster comprises eight countries, including Slovakia and Germany, which show an average implementation level of 57.61%. Cluster 3 reflects intermediate adoption coverage with heterogeneous sectoral profiles.
The fourth cluster encompasses six countries, including Spain and Estonia, which show an average value of 51.45%. Cluster 4 indicates moderate adoption coverage.
The fifth cluster comprises eight countries, including Cyprus and Serbia, which show a significantly lower average implementation rate of only 18.48%. Cluster 5 captures the lowest adoption coverage; interpretation is cautious as low values may reflect reporting limitations rather than verified non-adoption.
The sixth cluster comprises three countries: Croatia, Latvia, and Slovenia, which show an average support level of 33.33%. Cluster 6 (33.33%) represents a low-to-intermediate adoption profile (Figure 7).
The clustering highlights cross-country heterogeneity in the breadth and composition of RES support portfolios. While several countries exhibit comprehensive policy-mix adoption, others show limited coverage, implying a potential role for targeted capacity-building and knowledge transfer to strengthen implementation and accelerate convergence toward long-term decarbonisation objectives across Europe.
3.10. Analysis of Renewable Energy Deployment in the European Countries
The transition to renewable energy sources (RES) is currently a core objective of the European Union. This aim is centred on reducing greenhouse gas emissions, ensuring energy security, and promoting the economic development of its member states. The EU’s target is clear: to increase the share of renewable energy in final energy consumption to 42.5% by 2030, with a parallel emphasis on improving energy efficiency and promoting renewable energy sources (RESs) in the transport sector to a minimum share of 14% [27].
3.11. Comparison at the European National Level
3.11.1. Evolution of the Use of Renewable Energy Sources over Time
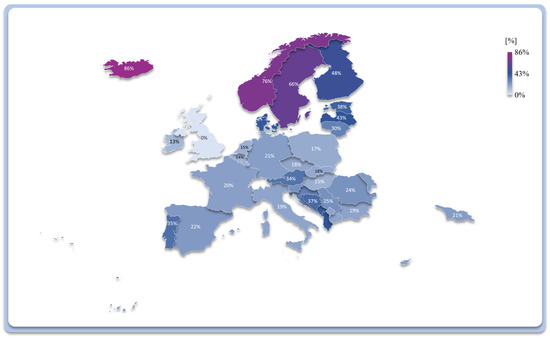
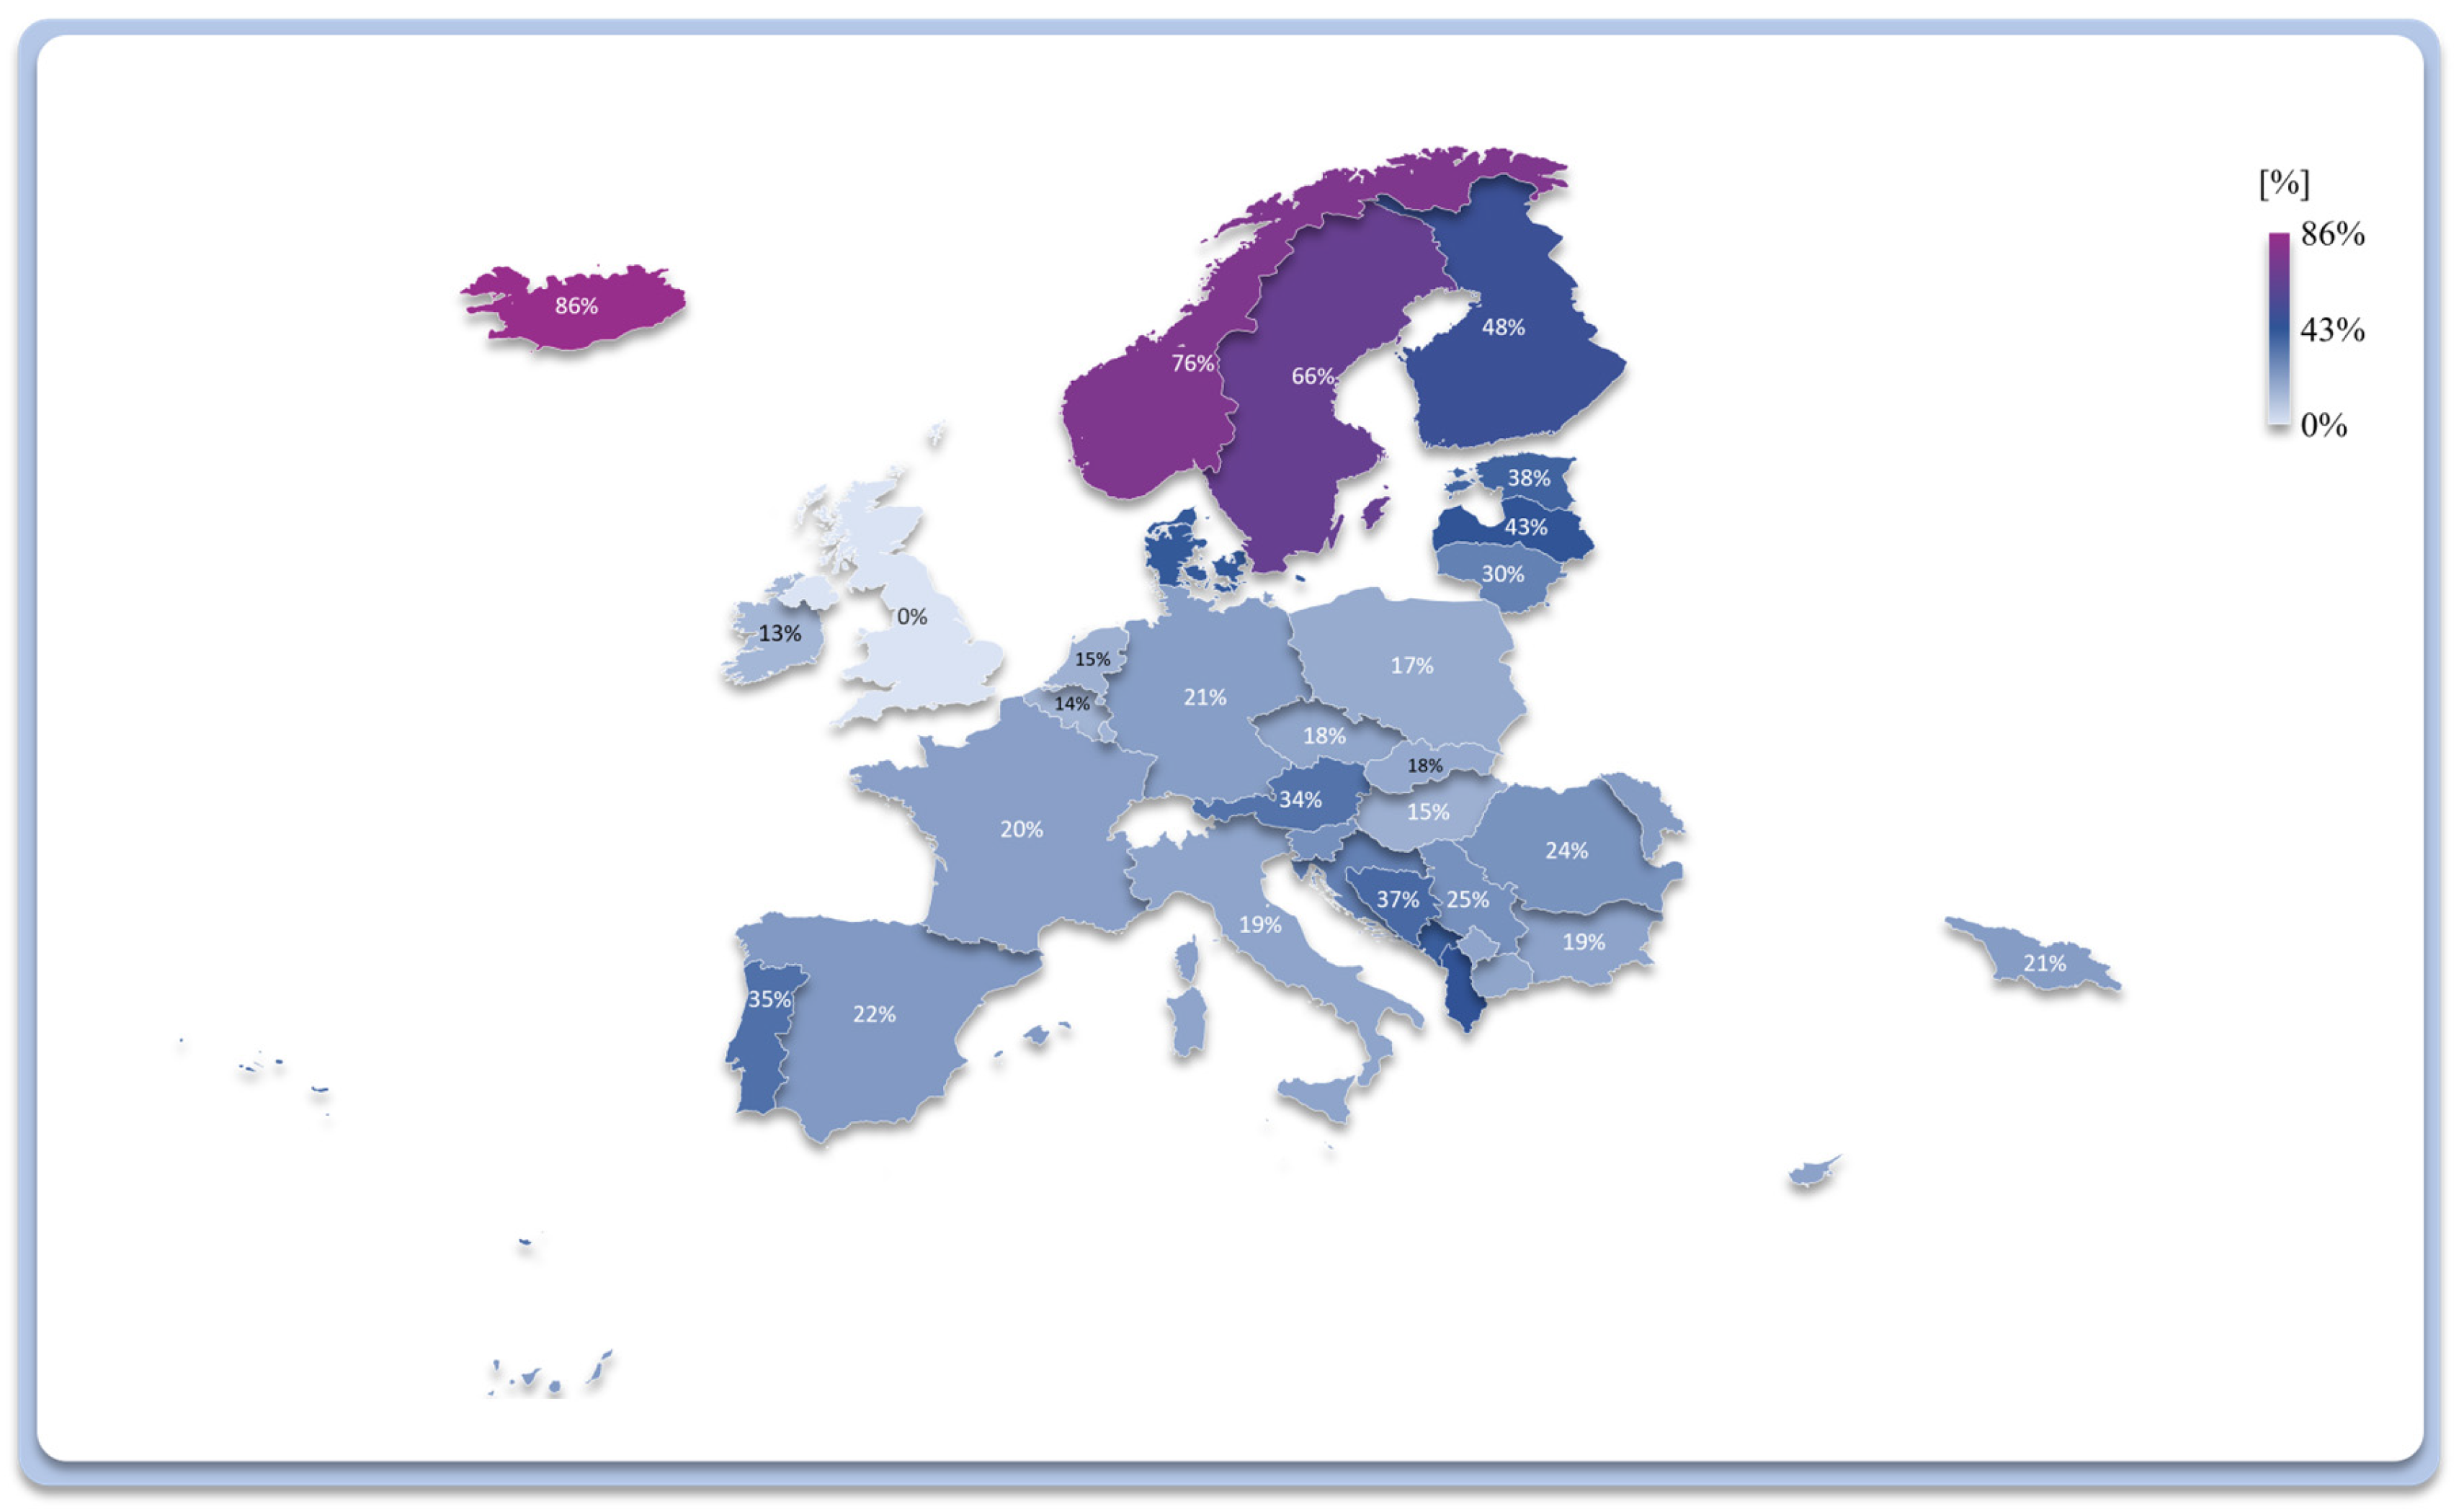
An analysis of the contribution of renewable energy sources (RESs) to total energy production in the European Union from 2004 to 2022 showed that most member states recorded significant increases in their use of RES. For example, Denmark increased its RES share from 14.8% (2004) to 41.6% (2022), and Sweden increased its share from 38.4% to 66.0%, illustrating sustained long-term growth in leading countries.
Other nations, such as Finland, achieved an RES share of 47.9%. Finland reached 47.9%, reflecting favourable structural conditions (notably biomass and hydro endowments). In contrast, countries like Luxembourg and Malta, which initially had very low RES shares of 0.9% and 0.1%, respectively, increased them to 14.4% and 13.4%, respectively, over the period. Luxembourg (0.9% → 14.4%) and Malta (0.1% → 13.4%) demonstrate that substantial increases are possible even from low baselines.
Conversely, some countries, including Germany and France, saw their RES shares rise from 6.2% and 9.3% in 2004 to 20.8% and 20.3% in 2022. Germany (6.2% → 20.8%) and France (9.3% → 20.3%) increased their RES shares, although they remain below the highest-performing group. The developments in Eastern and Southern European countries were also noteworthy. For example, Bulgaria increased its RES share from 9.2% to 19.1%, while Greece increased its share from 7.2% to 22.7%. Bulgaria (9.2% → 19.1%) and Greece (7.2% → 22.7%) also show marked growth, consistent with wider diffusion of wind/solar deployment (Figure 8).
Figure 8.
Total share of renewable energy in Europe in 2022 (%). Source: Own elaboration according to Eurostat [30].
Overall, it can be concluded that European member states have demonstrated a proactive approach to renewable energy, with some already achieving significant progress through a combination of technological advancements, policy initiatives, and investment. Overall, RES shares increased across Europe between 2004 and 2022, but the magnitude of change varied widely between countries.
3.11.2. Share of Individual Types of RES in Total Gross Final RES Energy Consumption
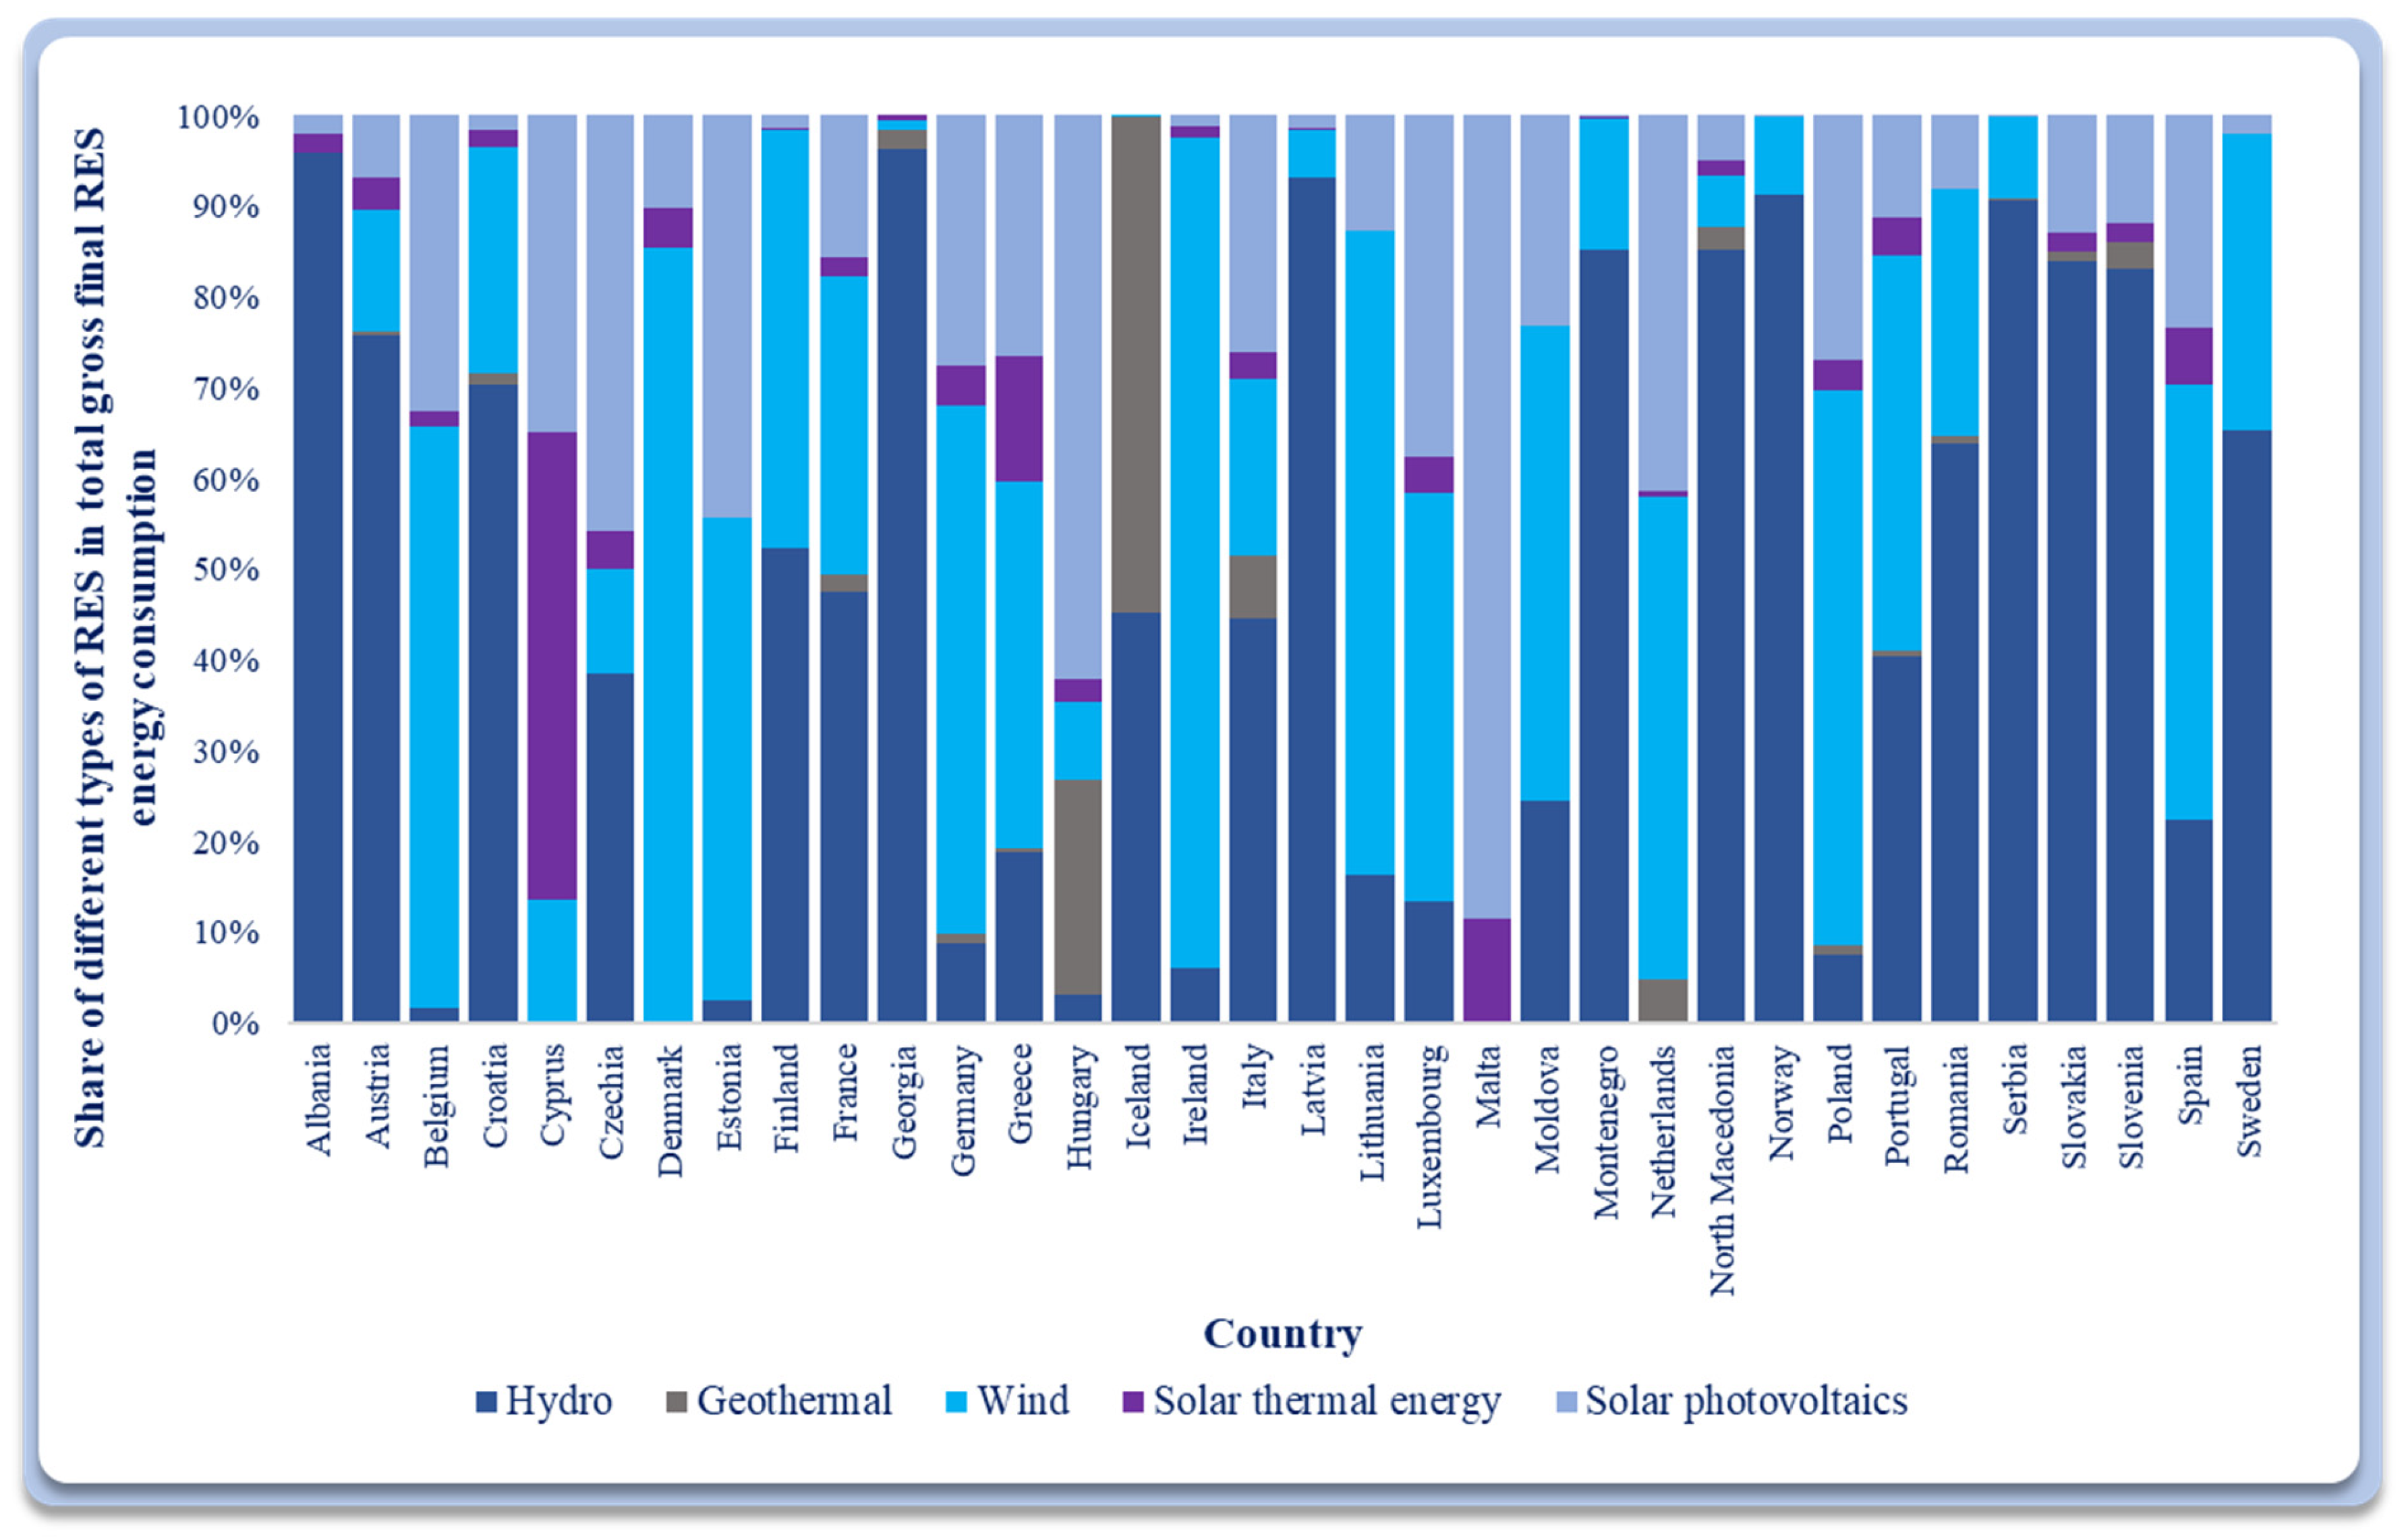
An examination of the composition of various renewable energy sources (RESs) in gross final energy consumption reveals significant differences among countries. These differences primarily reflect resource endowments and technology pathways, which condition cross-country RES outcomes (Figure 9).
Figure 9.
Share of different types of RES in total gross final RES energy consumption, 2022. Source: Own elaboration according to Eurostat [31].
In several countries, such as Norway (91.25%), Georgia (96.36%), and Albania (95.99%), hydropower plays a dominant role. These nations leverage their abundant water resources for electricity generation, with Serbia (90.74%) and Latvia (93.17%) also being major players in the hydropower sector. Regarding wind energy, countries like Ireland (91.33%), Denmark (85.31%), and Lithuania (70.92%) were notable leaders. These states have invested heavily in wind farms and the supporting infrastructure for wind power. Belgium, where wind turbines account for 64.09% of renewable energy (RES) generation, also makes a significant contribution in this area. Wind-intensive profiles are observed in Ireland (91.33%), Denmark (85.31%), Lithuania (70.92%), and Belgium (64.09%).
In the field of solar energy, Malta (88.56%) and Hungary (62.18%) stood out for their effective use of solar panels for electricity production. Cyprus utilised photovoltaics (34.79%) and solar thermal energy (51.68%) in a balanced manner, enabling flexible use of its solar resources. Solar plays a major role in Malta (88.56%) and Hungary (62.18%); in Cyprus, photovoltaics (34.79%) and solar thermal (51.68%) are combined. Geothermal energy was utilised significantly in Iceland (54.70%) and Hungary (23.69%), whereas in other European countries, its application was very low or non-existent. Geothermal is substantial in Iceland (54.70%) and Hungary (23.69%), but remains marginal in most other countries.
Overall, these findings confirm that European countries are pursuing diverse strategies to harness their available resources and reduce their dependence on fossil fuels. Overall, Figure 9 illustrates pronounced heterogeneity in RES composition, reinforcing the role of structural endowments in shaping national energy profiles and observed RES outcomes.
3.11.3. Analysis of RES Use in Selected Sectors
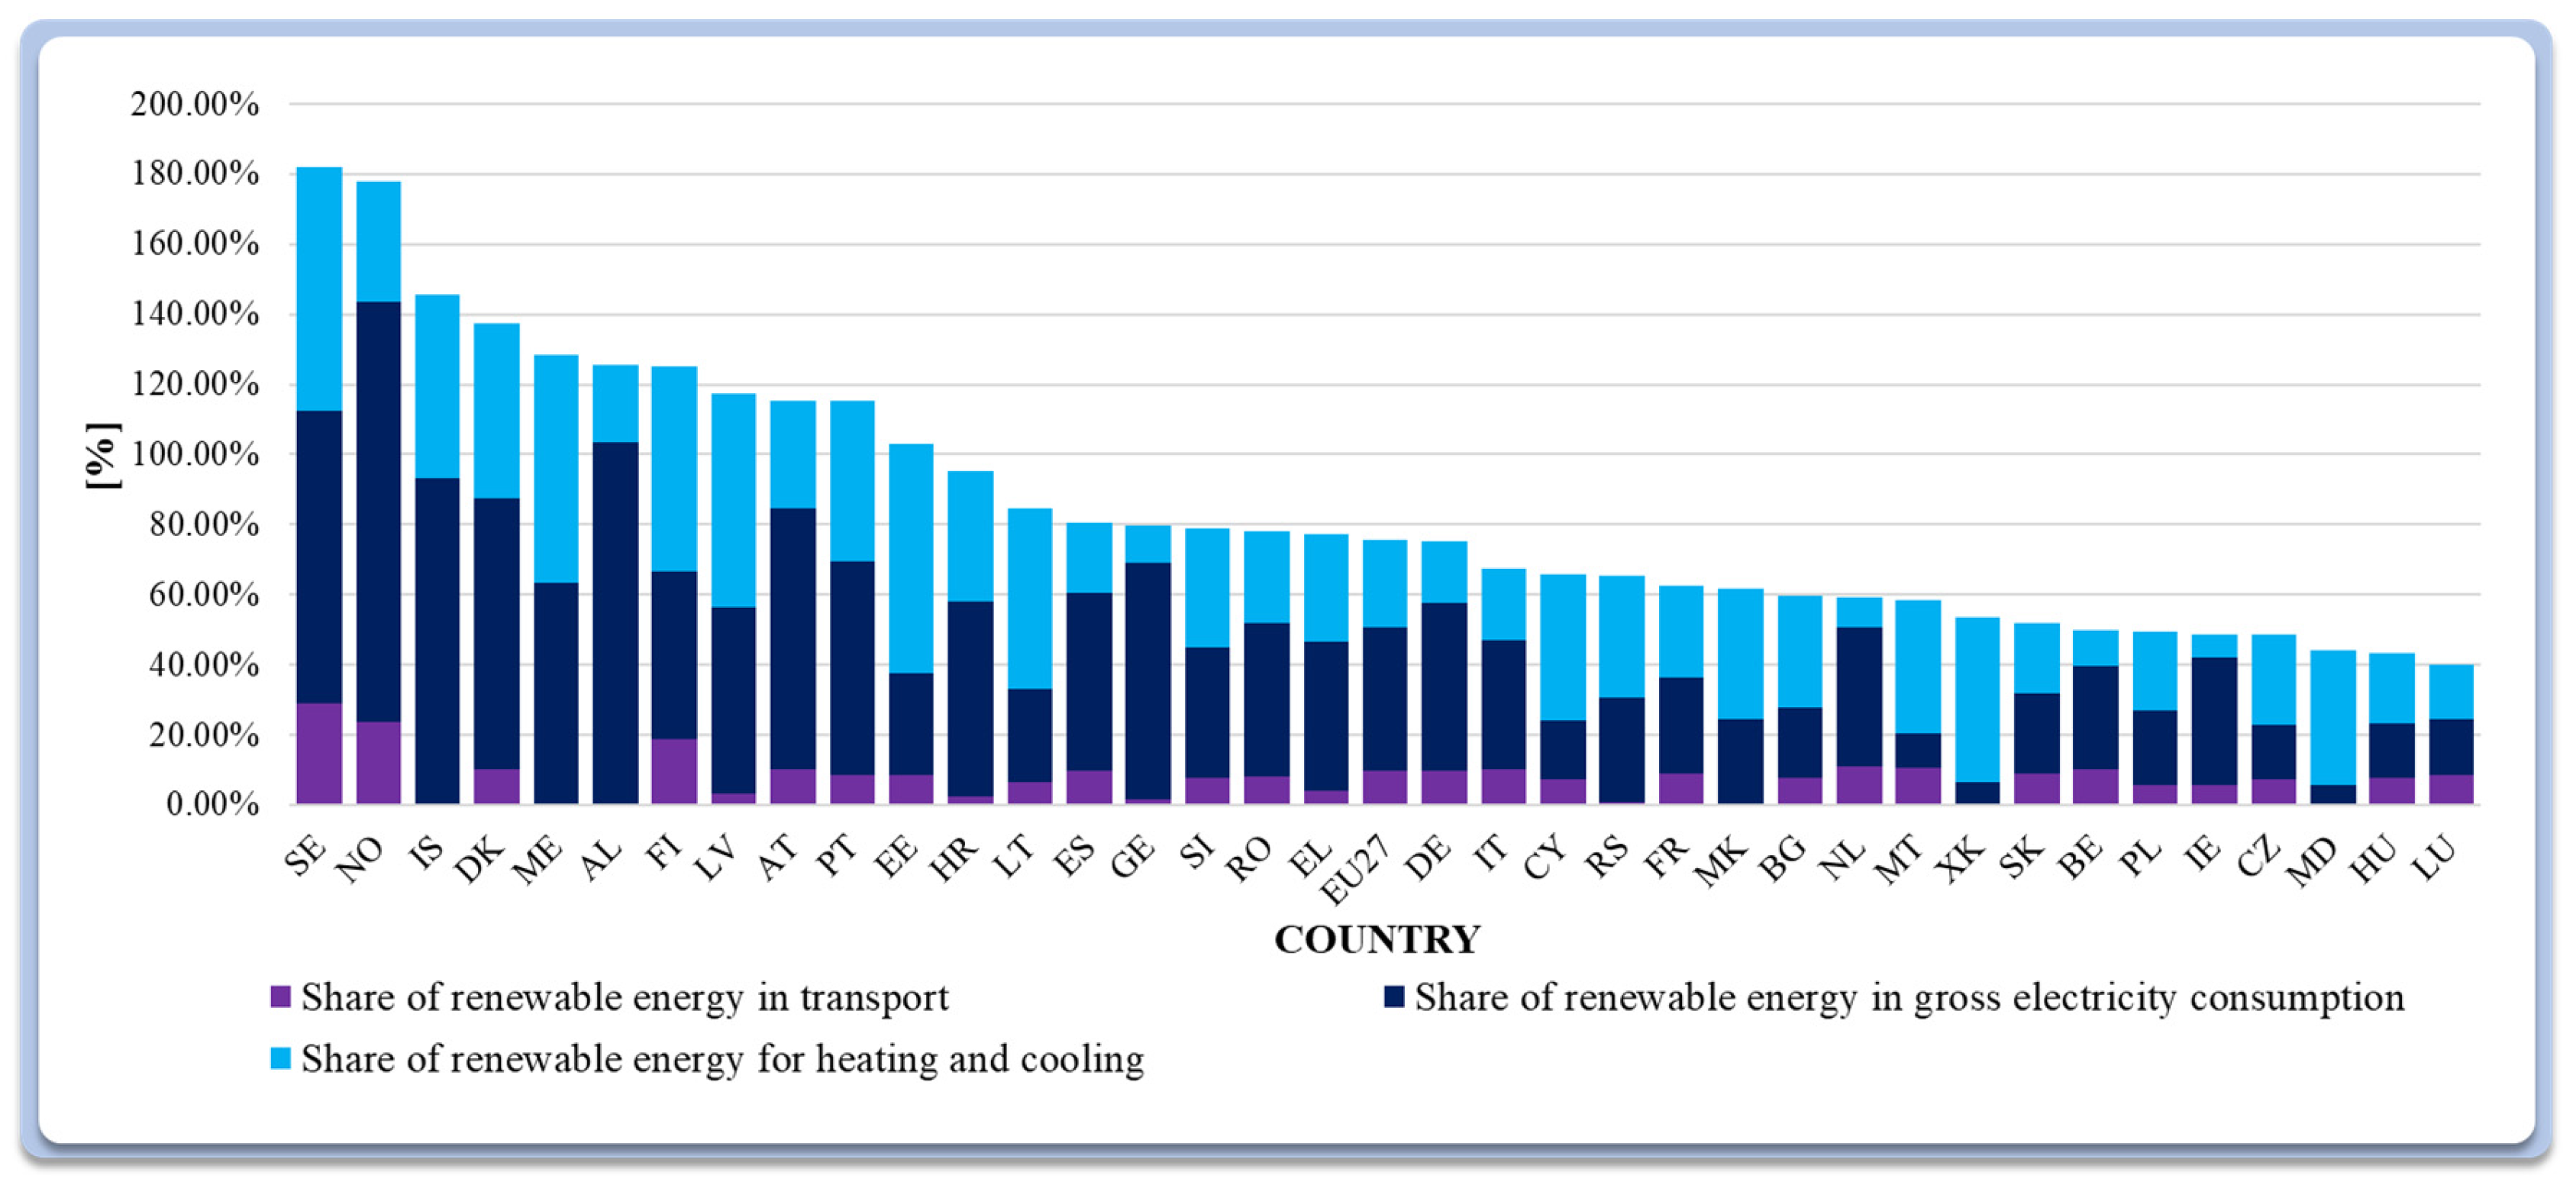
The share of renewable energy used in the transport sector across European countries was analysed for the period 2004–2022. Transport RES shares generally increased over 2004–2022, but levels and growth rates remain highly heterogeneous across countries. For instance, Belgium (BE) showed a significant increase, rising from 0.6% in 2004 to 10.4% in 2022. Similarly, Sweden (SE) increased its share from 6.3% to 29.2%, marking one of the most significant gains. Conversely, for the United Kingdom (UK), Iceland (IS), and Kosovo (XK), the data registered 0.0% for both years, which may reflect negligible RES use or missing/limited reporting in the underlying dataset. Overall, the observed trends are consistent with the gradual diffusion of renewable transport fuels and electrification. However, they vary across countries and are subject to national starting points and policy/market conditions.
The electricity generation sector saw a substantial increase in the use of renewable energy sources (RESs) across many countries between 2004 and 2022. In electricity, several countries reached very high RES shares in 2022, including Iceland (IS) (93.1%) and Norway (NO) (>100%, likely reflecting net exports/accounting effects). Albania (AL) also reported a share exceeding 100% in 2022, probably indicating significant hydropower use. Denmark (DK) demonstrated an impressive increase from 23.8% to 77.2%. Germany (DE) and Spain (ES) also posted significant growth, reaching 47.6% and 50.9%, respectively. Belgium (BE) similarly recorded a notable increase from 1.7% to 29.1%. These changes indicate substantial expansion of RES-based electricity, with cross-country differences shaped by endowments, system structure, and investment trajectories.
The heating and cooling sector, much like the previously analysed areas, underwent significant changes in its RES share. Heating and cooling RES shares also increased in many countries, with high-end point values in Estonia (EE) (65.4%) and sustained high levels in Latvia (LV) and Lithuania (LT) (>50% in 2022). Denmark (DK) saw its share grow from 20.5% to 50.1%, while Bulgaria (BG) saw its share rise from 14.1% to 31.7%. Latvia (LV) and Lithuania (LT) maintained high renewable energy share (RES) levels in 2022, both exceeding 50%. Germany (DE) registered a more moderate increase from 7.2% to 17.5%, and Belgium (BE) improved its share from 2.9% in 2004 to 10.4% in 2022. In contrast, Albania (AL) was an outlier, showing a decrease from 33.1% to 22.1%. Kosovo (XK) also reported a slight decline from 51.9% to 47.0%. Overall, Figure 10 confirms sector-specific heterogeneity, with heating and cooling outcomes strongly conditioned by national fuel mixes and structural endowments.
Figure 10.
Composition of Renewable Energy Use (%) Across Transport, Electricity, and Heating & Cooling Sectors in Europe, 2022. Source: Own elaboration according to Eurostat [30,32,33].
3.11.4. Per Capita Utilisation of Renewable Energy by Sector
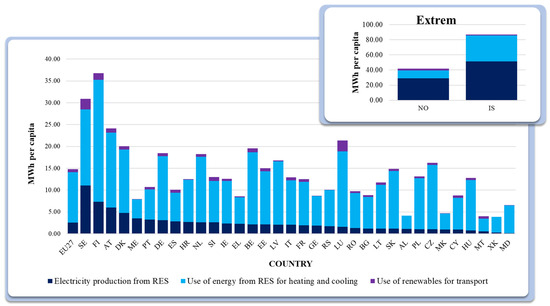
A comparison of per capita utilisation of renewable energy sources (RESs) by sector provides a more detailed perspective on the varying levels achieved in 2022 across countries and industries. For instance, Iceland and Norway led in RES electricity generation with values of 51.47 MWh and 29.08 MWh per capita, respectively. These two nations are endowed with abundant natural resources that facilitate high levels of renewable energy production. At the opposite end of the spectrum were Moldova and Kosovo, which recorded extremely low values, likely reflecting limited resources and infrastructure.
In the heating and cooling sector, Iceland was the frontrunner with 34.08 MWh per capita, followed by Finland at 27.95 MWh and Sweden at 17.41 MWh per capita. These countries utilise various technologies, including heat pumps and biomass, to optimise the utilisation of renewable energy. In contrast, nations like Malta and Albania registered lower values, which is probably a consequence of less advanced technologies and lower investment in this area.
The transport sector exhibited the lowest overall RES utilisation. Luxembourg was the leader with 2.48 MWh per capita, followed by Sweden with 2.39 MWh and Norway with 2.16 MWh per capita. These countries have invested in building infrastructure for alternative fuels and electric vehicles. Conversely, countries such as Albania, Kosovo, and Moldova had minimal or no use of RESs in transport, likely due to economic and political factors (Figure 11).
Figure 11.
Per Capita Renewable Energy Consumption by Sector in European Countries, 2022. Source: Own elaboration according to Eurostat [34,35,36].
Leading the overall ranking for RES utilisation across all sectors were Iceland (86.96 MWh per capita) and Norway (41.69 MWh per capita), highlighting their significant contributions to increasing the share of renewable energy sources. In contrast, other countries, including Kosovo (3.90 MWh per capita) and Albania (4.12 MWh per capita), remained at the bottom of the rankings, indicating a need for greater investment and technological advancement. The heating and cooling sector experienced stable growth, with Finland (36.75 MWh per capita) and Sweden (30.87 MWh per capita) leading the way.
3.12. Analysis of the Use of RESs in the EU
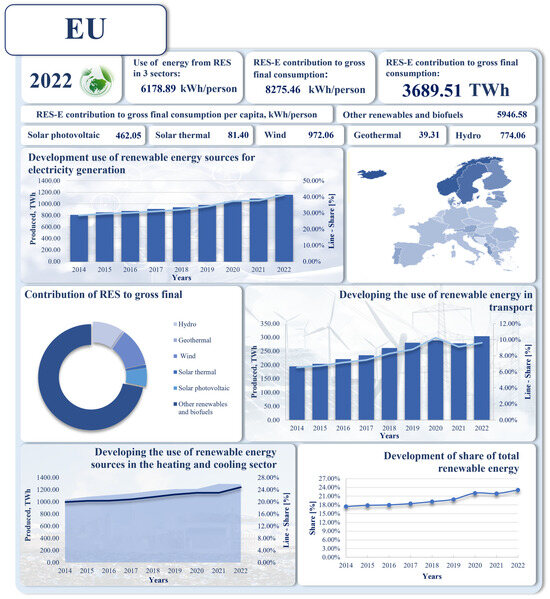
In 2022, the European Union made significant progress in the renewable energy sector, with the share of renewable energy sources (RESs) in total electricity generation reaching 41.17%. In 2022, RESs accounted for 41.17% of total EU electricity generation, largely reflecting expansion in wind and solar.
An examination of the development of individual renewable energy sources used for electricity generation from 2004 to 2022 reveals that wind energy experienced the most substantial growth, consistently increasing its share of the renewable energy mix. Solar energy also demonstrated a strong upward trend, particularly after 2010, driven by falling solar panel costs and technological advancements. Hydropower, while still comprising a significant portion of the renewable energy source (RES) portfolio, has grown more slowly than other sources, likely due to limitations on new hydroelectric projects in Europe. The contribution of solid biofuels also increased, though their relative impact was less significant than that of other sources. During 2004–2022, wind shows the strongest growth and solar accelerates after 2010, while hydropower expands more slowly and biofuels increase more moderately, consistent with technology and siting constraints.
From a sectoral perspective, electricity generation accounted for 54% of RES consumption, heating and cooling for 33%, and transport for only 13%. By sector, electricity accounts for 54% of RES consumption, heating and cooling accounts for 33%, and transport accounts for 13%, indicating that transport remains the lagging sector in RES integration. Further examination revealed considerable variability among member states. Countries such as Finland and Sweden stand out for their high RES shares, demonstrating their potential and their adoption of innovative solutions. In contrast, some nations in southeastern Europe exhibit lower figures, indicating the need for tailored policies that account for regional resources and requirements. Member-state outcomes remain heterogeneous, with higher RES shares in Nordic countries and lower values in parts of southeastern Europe, suggesting strong conditioning by structural endowments and system characteristics.
The increase in the utilisation of renewable energy sources (RESs) between 2014 and 2022 represents a fundamental step in transforming the region’s energy mix, reinforcing the conclusion that the EU is moving toward a more sustainable energy future. The total contribution of renewable energy sources (RESs) to gross final energy consumption reached 1038.30 TWh in 2022. Total RES contribution to gross final energy consumption reached 1038.30 TWh in 2022, confirming the continued scaling of renewables in the EU energy mix.
In the transport sector, RES consumption increased from 194.60 TWh in 2014 to 304.47 TWh in 2022, representing a rise of 109.87 TWh. The corresponding percentage share rose from 6.55% to 9.62%. In transport, RES consumption increased from 194.60 TWh (6.55%) in 2014 to 304.47 TWh (9.62%) in 2022.
In the electricity sector, total renewable energy consumption increased from 808.78 TWh to 1155.70 TWh, boosting the RES share from 28.60% to 41.17%. This 12.57 percentage point increase underscores the decisive contribution of wind and solar energy. In electricity, RES consumption rose from 808.78 TWh (28.60%) to 1155.70 TWh (41.17%), i.e., +12.57 percentage points.
In the heating and cooling sector, a significant rise was also recorded, with total RES consumption growing from 1036.63 TWh to 1294.61 TWh. The RES share in this sector increased from 19.93% to 24.81%. In heating and cooling, RES consumption increased from 1036.63 TWh (19.93%) to 1294.61 TWh (24.81%) (Figure 12).
Figure 12.
Detailed analysis of the dynamics of RES use in the EU in selected sectors and per capita consumption. Source: Eurostat own elaboration in Excel [30,31,32,33,34,35,36,37,38,39,40].
Regarding specific renewable energy sources (RESs), wind energy was the dominant contributor, with 433.38 TWh (972.06 kWh per capita), followed by hydropower at 345.11 TWh (774.06 kWh per capita) and solar energy at 206.00 TWh (462.05 kWh per capita). Geothermal and solar thermal energy were also notable contributors. Overall, per capita consumption of energy from renewable sources (across three sectors) reached 6178.89 kWh, clearly demonstrating the growing importance of renewable energy sources (RESs) within the European energy mix. In 2022, wind contributed 433.38 TWh (972.06 kWh per capita), hydropower 345.11 TWh (774.06 kWh per capita), and solar 206.00 TWh (462.05 kWh per capita), with geothermal and solar thermal also contributing; total RES consumption across the three sectors reached 6178.89 kWh per capita.
3.13. Cluster Analysis of RES Use in European Countries
To identify groups of countries with similar renewable energy profiles, we conducted a cluster analysis. This analysis used 10 previously discussed indicators, including per capita renewable energy (RES) consumption, the share of renewables in electricity, heating, cooling, and transportation, and per capita use of specific sources such as solar, wind, and hydro power. We employed Ward’s method, a hierarchical clustering technique that minimises variance within groups, to ensure the resulting clusters were as homogeneous as possible. All inputs were z-score standardised (mean = 0; SD = 1) to ensure equal weighting across indicators.
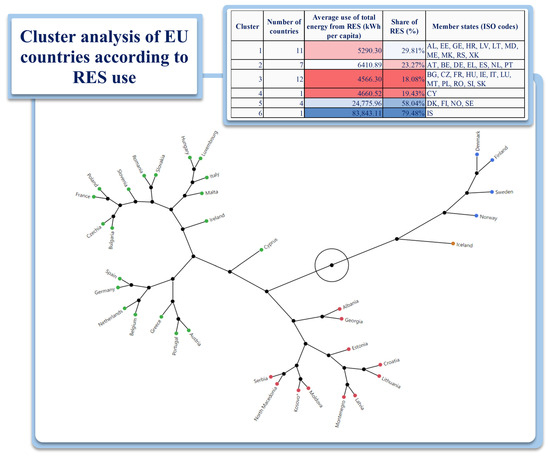
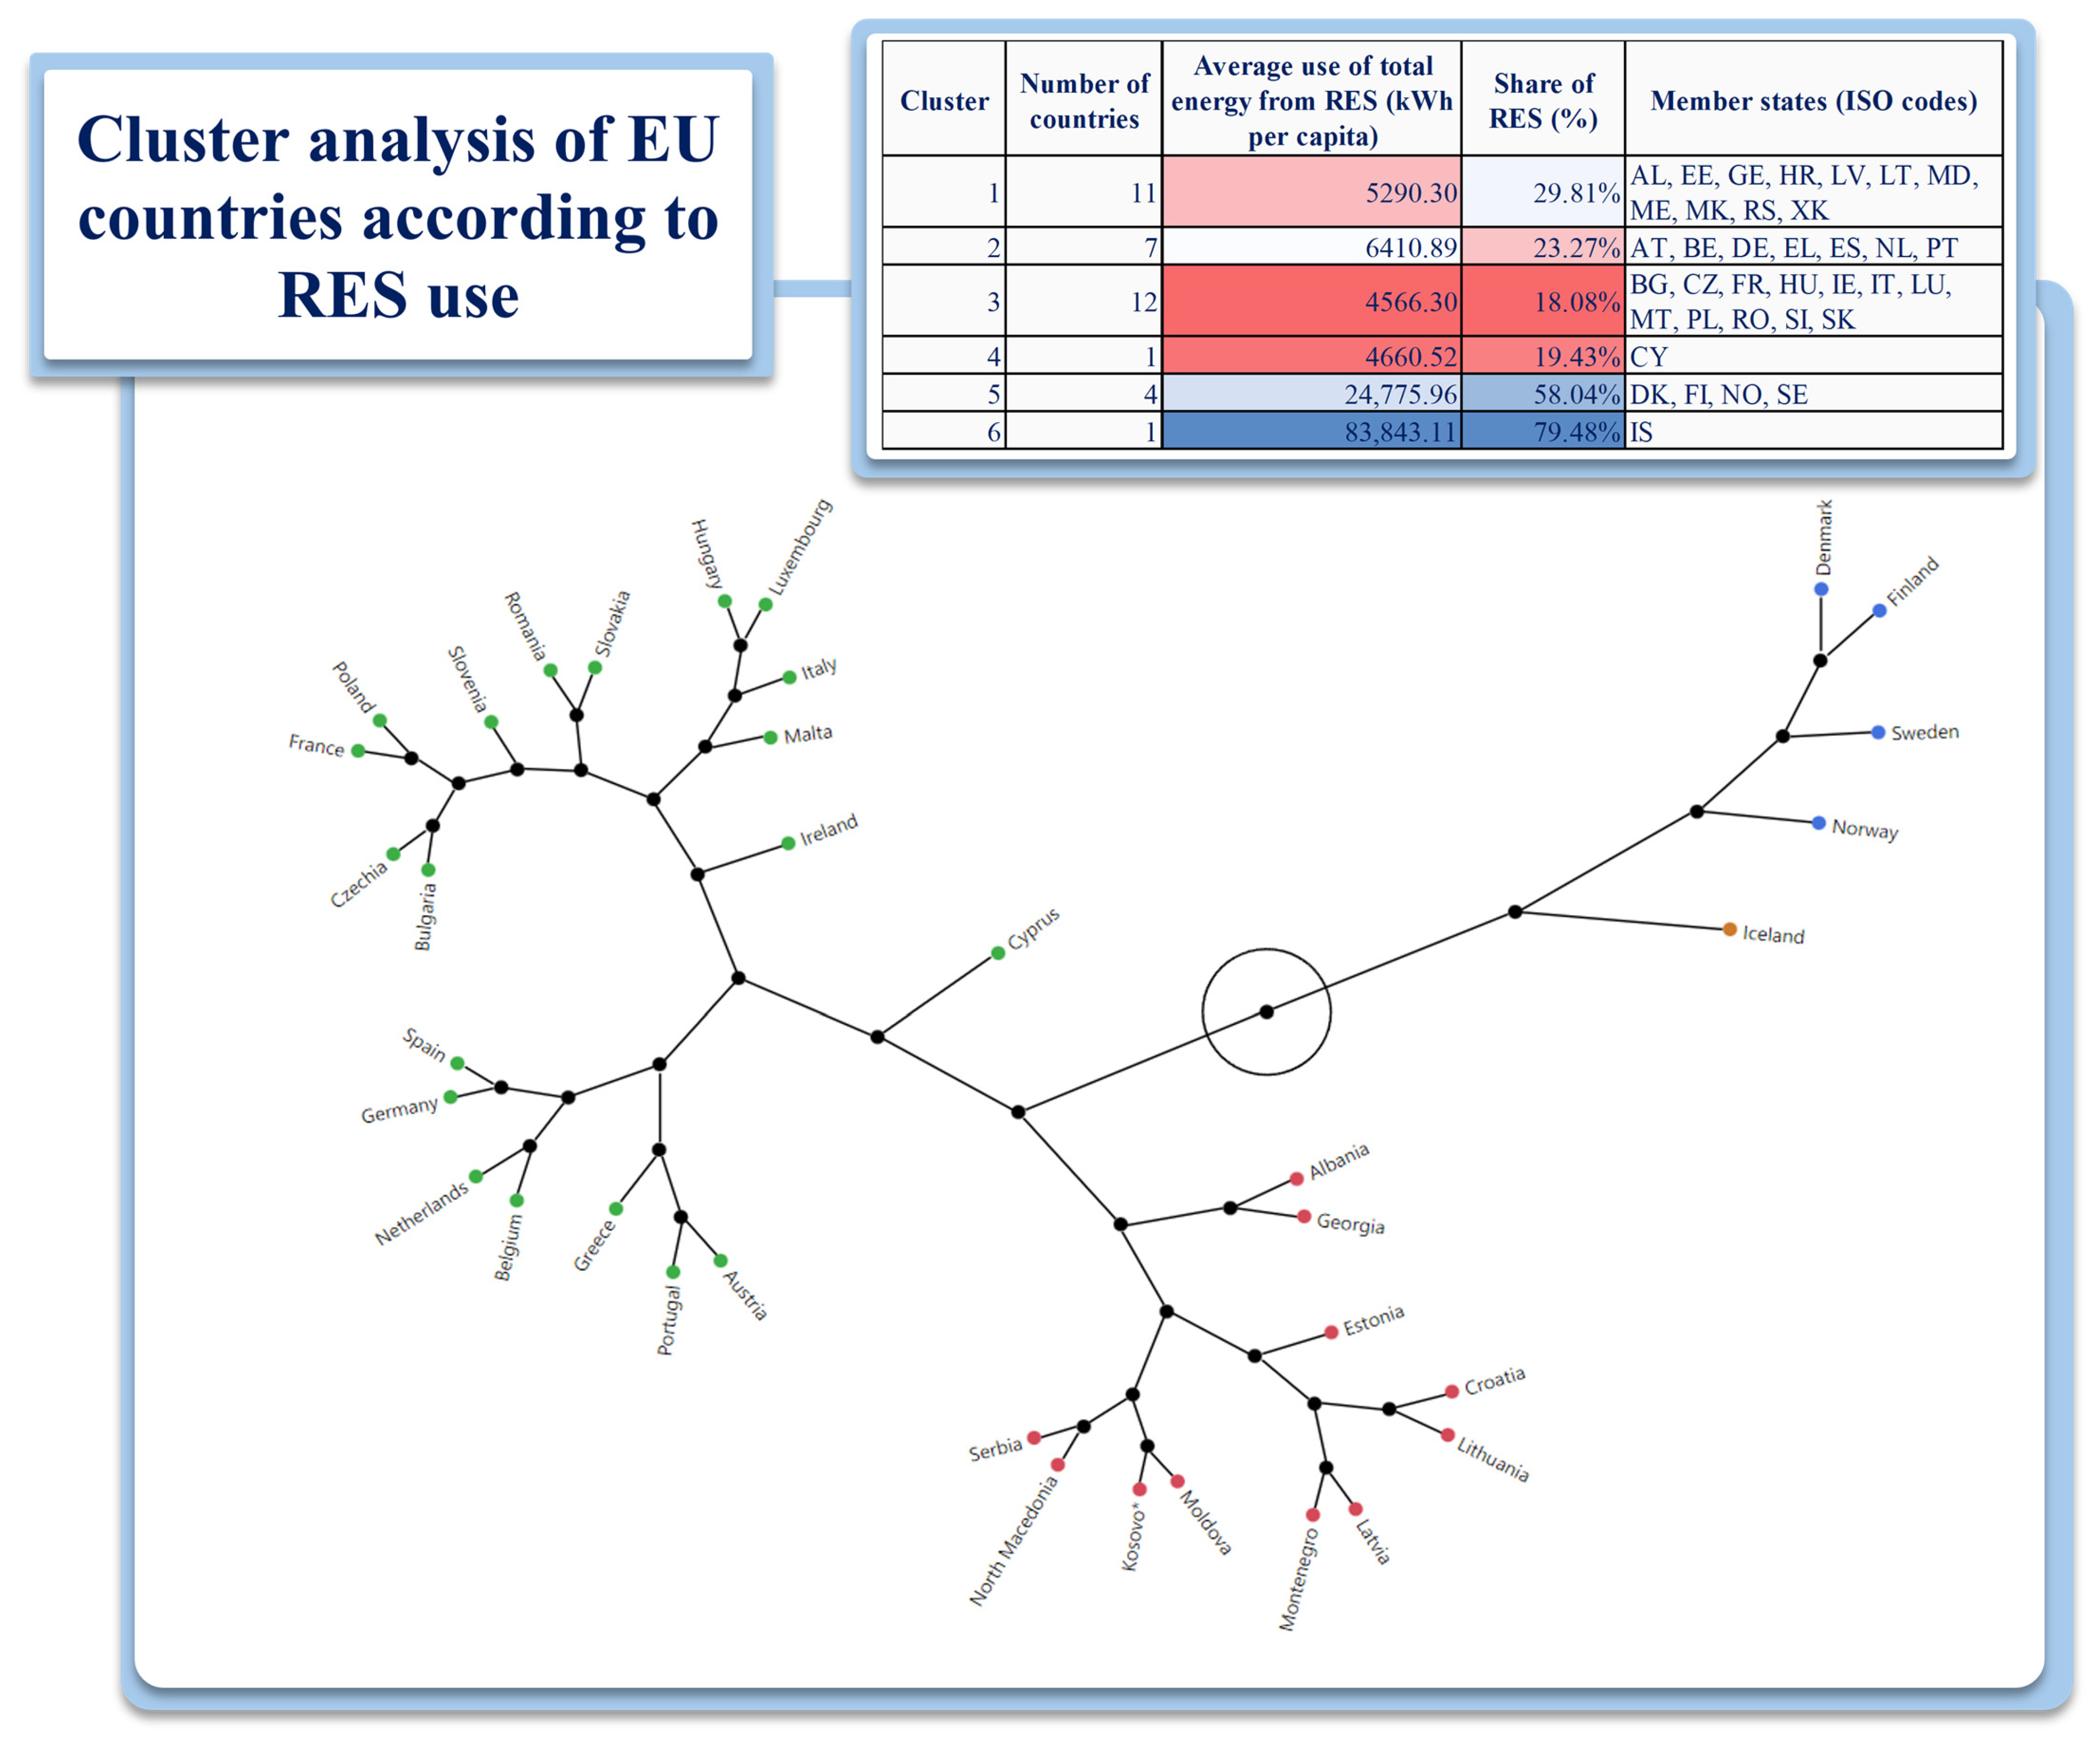
Figure 13 presents the hierarchical dendrogram (Ward’s method) and the resulting country partition. The number of clusters () is selected by cutting the dendrogram at the main break in linkage (agglomeration) distance, which also isolates two single-country outliers (Clusters 4 and 6).
Figure 13.
Cluster analysis of European countries according to RES use (Ward’s method; Euclidean distance). Source: own elaboration in JMP 18 according to Eurostat [30,31,34,35,36,37,38,39,40]. Note: Distances and clustering are computed from z-score-standardised indicators. In a subset of non-EU economies with limited statistical coverage, some near-zero/zero entries in selected source- or sector-specific indicators may reflect data unavailability rather than verified true zeros; therefore, the results in these cases are interpreted conservatively.
The analysis partitioned the 36 European countries into six distinct clusters. The partition yielded three multi-country groups (low, medium, and higher RES utilisation) and three outlier clusters (one four-country high-performance cluster and two single-country clusters) (Figure 13).
The process of grouping countries also provides an interpretable measure of similarity via the hierarchical dendrogram shown in Figure 13. Euclidean distances are computed in the 10-dimensional space of z-score-standardised indicators and interpreted as multivariate dissimilarity in standardised units:
i.e., multivariate dissimilarity measured in standardised units across all indicators. The analysis of Euclidean distances showed that Moldova and Kosovo (distance: 0.352) have the most similar RES profiles. Other closely related pairs include North Macedonia and Serbia (0.368) and Bulgaria and the Czech Republic (0.379). Conversely, the most striking difference was observed between Albania and Denmark (11.055), indicating highly dissimilar RES indicator profiles across the 10 variables rather than direct evidence of fundamentally different national “strategies”. For transparency, Figure 13 is complemented by a compact membership table listing ISO country codes for each cluster, enabling quick cross-checking.
5. Discussion
Our results on the increasing RES shares in electricity, heating/cooling, and transport are consistent with Tausova et al. [41], who emphasise energy efficiency and energy savings as key conditions for long-term sustainability and emission reductions. In our data, several countries (e.g., France, Ireland, the United Kingdom, and Belgium) also show measurable improvements in electricity-sector efficiency, and—despite persistent cross-country differences—the overall trajectory of RES utilisation is positive.
This interpretation aligns with Demir and Bas [42], who argue that Europe increasingly relies on RESs for energy security. However, RESs still do not dominate the energy mix relative to fossil fuels. Consistent with Frodyma [43], we observe continued improvement over 2013–2022, with wind and solar exhibiting the most pronounced growth, reflecting technology progress and targeted investment.
In the context of support mechanisms, Andoková [44] compares the two most common instruments in Europe, feed-in tariffs (FITs) and Renewable Portfolio Standards (RPSs), in terms of their effectiveness in reducing CO2 emissions. Her findings confirm the broad use of FITs, particularly in supporting RES-based electricity generation, which aligns with the prevalence of revenue-stabilisation instruments observed in several countries. Similarly, Stec and Grzebyk [13] document an upward trend in RESs across Europe, and our results also highlight outliers, such as Iceland, which has achieved near-complete decarbonisation of the energy sector.
Alongside these positive trends, the analysis also identified significant barriers that hinder the faster development of renewable energy sources (RESs) in certain countries. Regulatory instability and frequent rule changes increase uncertainty and may delay projects (e.g., Slovakia), while limited financial support constrains investment incentives (e.g., Montenegro and North Macedonia). Administrative delays—particularly lengthy permitting—remain relevant in some cases (e.g., Serbia and Cyprus), and political instability further weakens predictability for long-term investment. Addressing these constraints requires more stable regulatory frameworks, streamlined permitting, adequate and predictable financing, and infrastructure improvements to support deployment at scale.
In the context of policy implementation theory, our findings indicate that de jure adoption coverage alone is insufficient for achieving high RES outcomes when implementation capacity and national context are binding constraints. Observed barriers (regulatory instability, administrative burdens, limited financing, and political uncertainty) plausibly weaken implementation by reducing clarity, limiting resources, and disrupting coordination, thereby lowering investor confidence and slowing deployment. Accordingly, RES policy design should be context-sensitive and paired with measures that strengthen implementation capacity and reduce the identified bottlenecks.
6. Conclusions
THis study provides a multidimensional perspective on renewable energy sources (RES) in Europe by jointly assessing (i) the breadth/coverage of formal (de jure) policy adoption and (ii) empirically observed deployment outcomes. Using harmonised Eurostat indicators for 2013–2022 and a cross-sectional legislative adoption index (SIC/OIL) compiled from RES-Legal Europe and legislative sources, the analysis first documents substantial heterogeneity in policy portfolios across 36 European countries. Hierarchical clustering of legislative support (Ward’s method; Euclidean distance on standardised indicators) identifies six typologies, confirming that RES support portfolios differ markedly across countries. For a subset of observations, low/zero entries may reflect limited source coverage rather than verified non-implementation; interpretations are therefore conservative.
RES utilisation profiles display similarly pronounced cross-country variability. Clustering based on 10 z-score standardised RES indicators—including total and sectoral RES shares (electricity, heating and cooling, transport) and per capita RES use by source—also resulted in six clusters. The choice of follows a cut at the main break in agglomeration distance; Euclidean distances capture multivariate dissimilarity in standardised units rather than evidence of distinct national “strategies”. Compact ISO membership tables are provided to facilitate cross-checking of cluster assignments. Importantly, the utilisation typologies do not systematically coincide with the legislative typologies, suggesting that broader formal adoption of support instruments is not a consistent cross-country correlate of higher RES deployment.
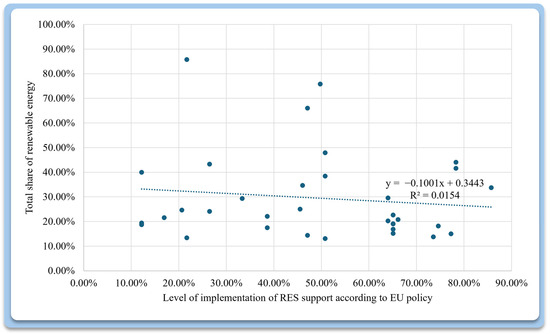
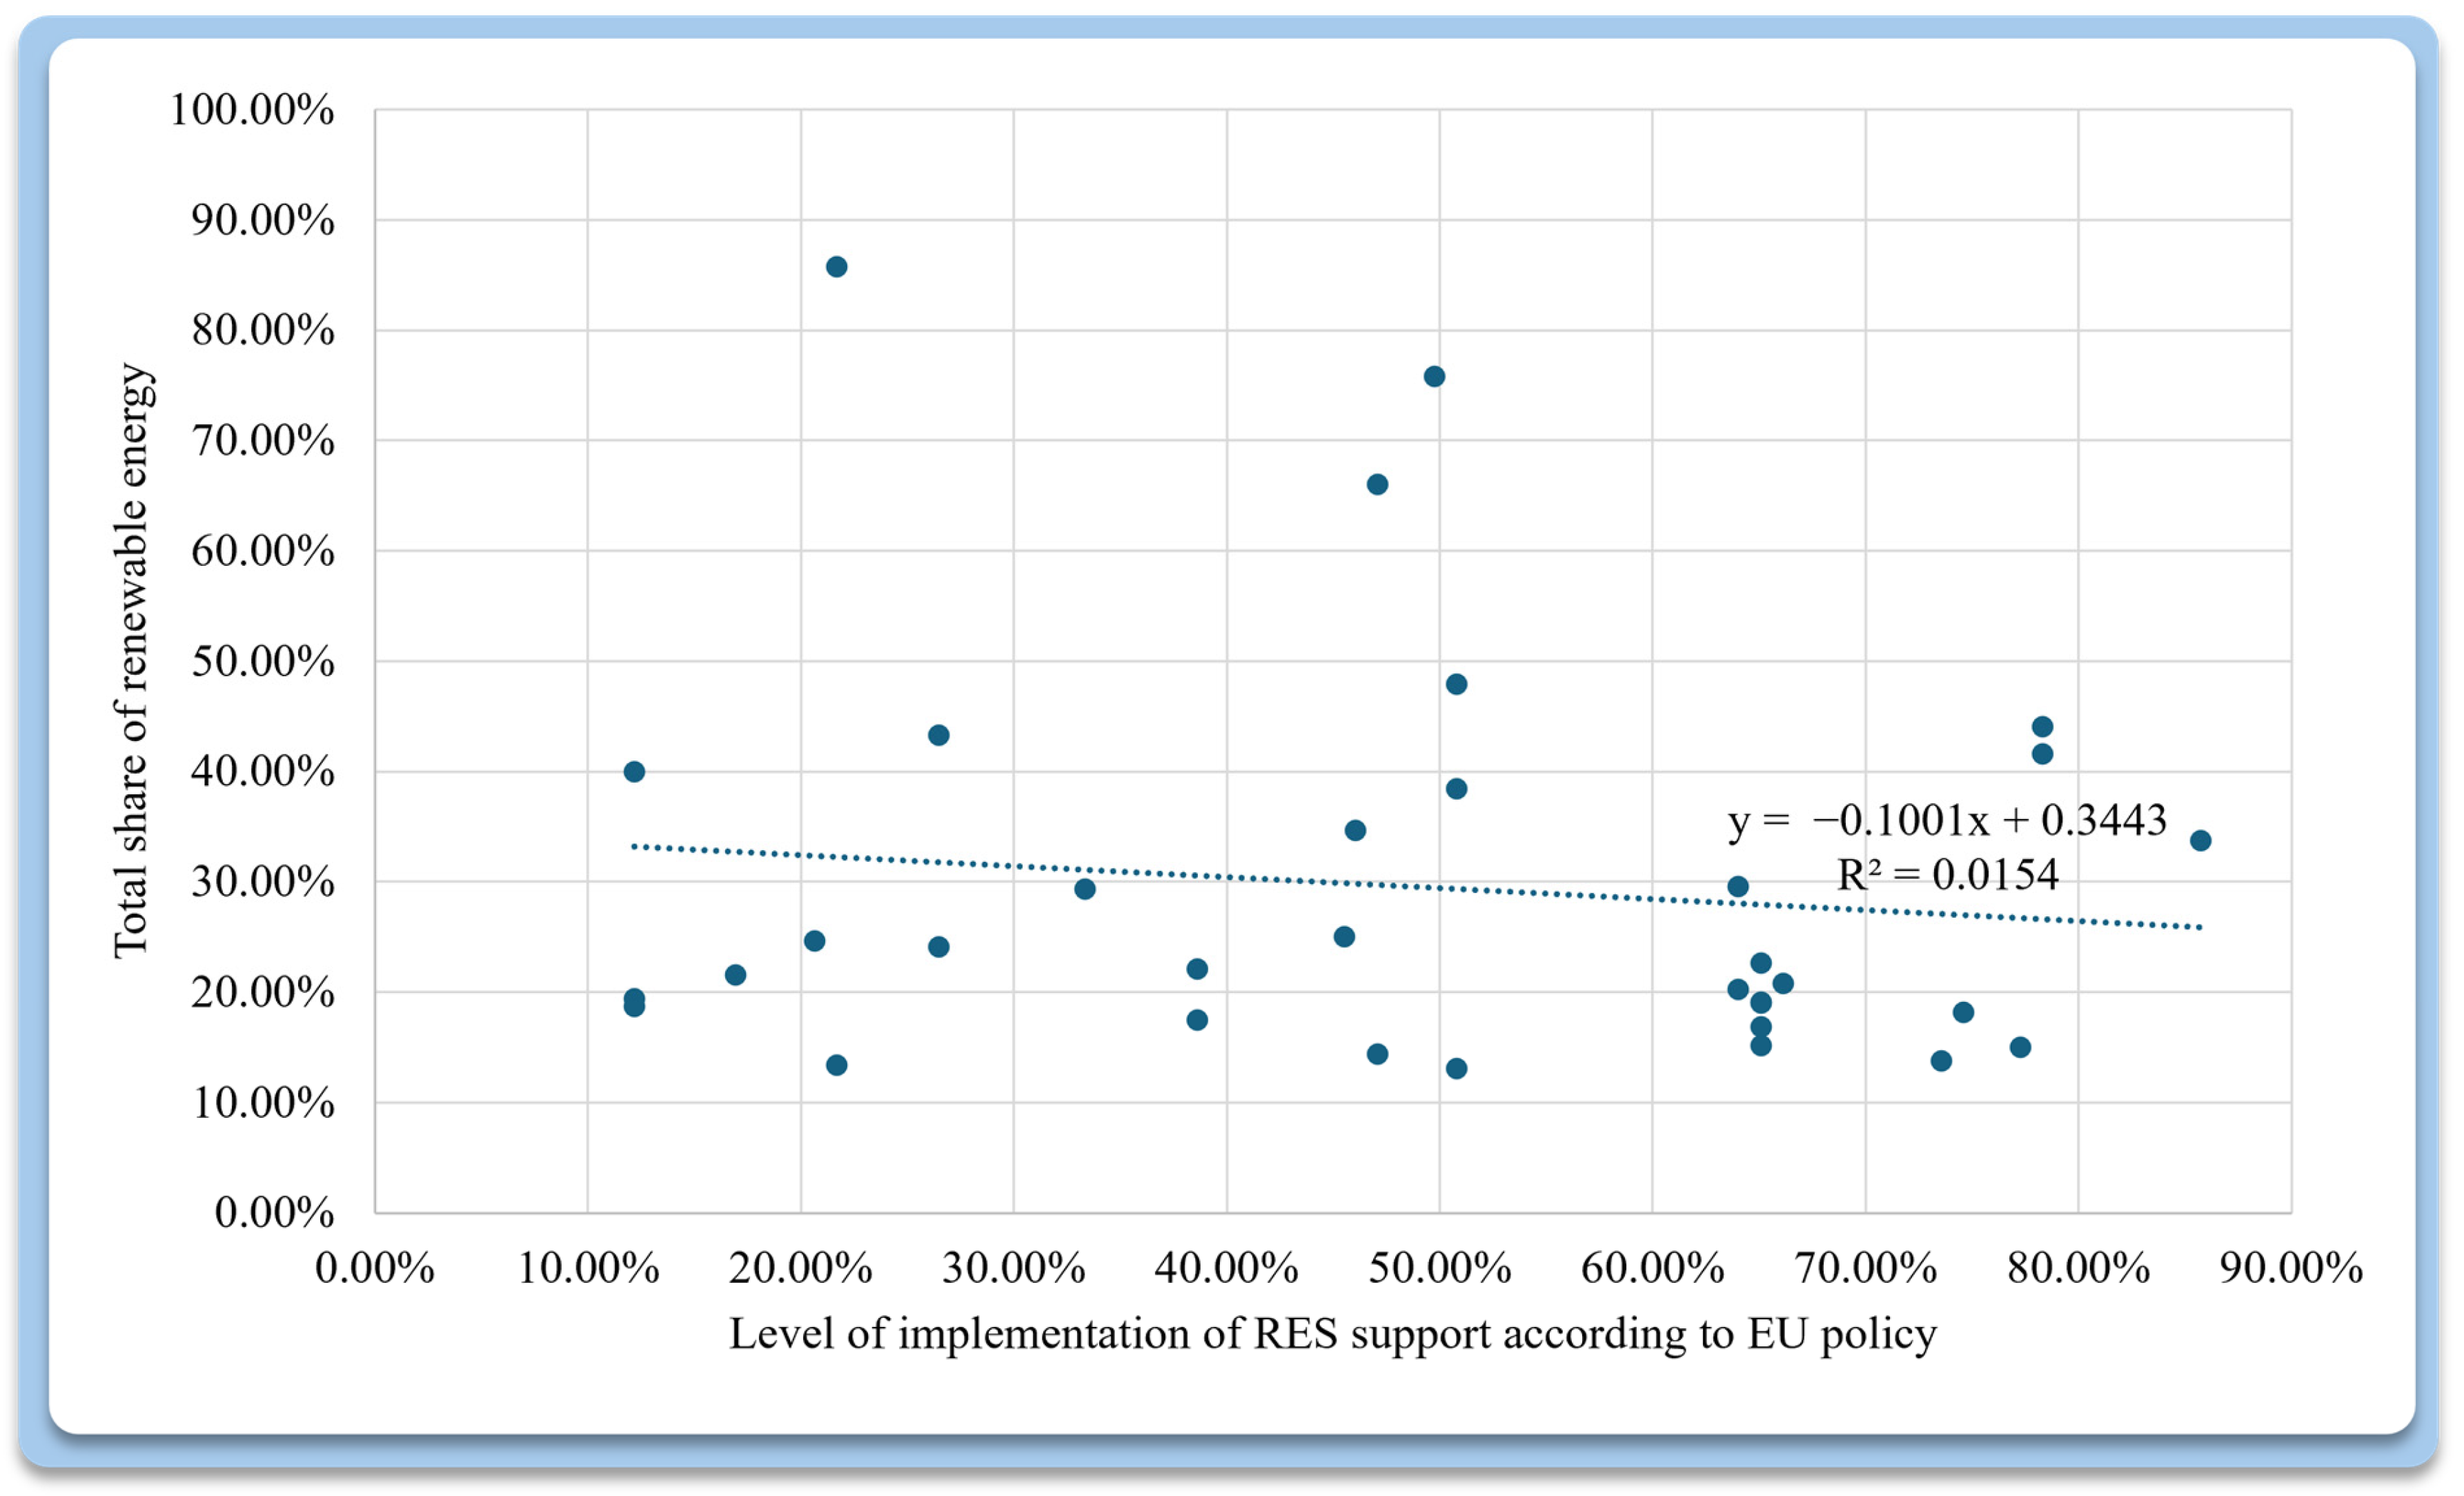
An associative test of hypothesis H2 using cross-sectional regression is consistent with this pattern: the baseline bivariate model yields a negative, but statistically insignificant, coefficient and very low explanatory power (R2 ≈ 0.015). This finding is compatible with hypothesis H1, which posits that the OIL–RES relationship is heterogeneous and conditional on country-specific structural characteristics. Interpretation should reflect index construction: OIL captures binary, equal-weight policy-mix coverage and does not measure budgets, enforcement, or design stringency, which may attenuate estimated associations. Overall, the results indicate that policy coverage alone is an insufficient correlate of observed RES outcomes, and that structural determinants and more granular measures of policy strength are likely decisive in explaining Europe’s heterogeneity. Future research should extend the dataset beyond 2022 and develop time-varying (potentially weighted) measures of policy strength to enable lagged and fixed-effects/panel designs when comparable information becomes available.
Author Contributions
Conceptualization, J.P.C. and M.M.; methodology, D.P.; software, M.M. and M.T.; validation, J.P.C., I.A. and P.T.; formal analysis, J.P.C. and D.P.; investigation, J.P.C. and M.M.; resources, D.P. and I.A.; data curation, M.T.; writing—original draft preparation, J.P.C.; writing—review and editing, M.M.; visualisation, D.P.; supervision, M.T. and P.T.; project administration, I.A.; funding acquisition, J.P.C. and M.M. All authors have read and agreed to the published version of the manuscript.
Funding
This research received no external funding.
Institutional Review Board Statement
Not applicable.
Informed Consent Statement
Not applicable.
Data Availability Statement
The original contributions presented in this study are included in the article. Further inquiries can be directed to the corresponding author.
Conflicts of Interest
The authors declare no conflicts of interest.
References
- Soava, G.; Mehedintu, A.; Sterpu, M.; Raduteanu, M. Impact of Renewable Energy Consumption on Economic Growth: Evidence from European Union Countries. Technol. Econ. Dev. Econ. 2018, 24, 914–932. [Google Scholar] [CrossRef] [Scilit]
- Kumar, S.; Chatterjee, U.; Raj, A.D. Theoretical Framework and Approaches of Susceptibility and Sustainability: Issues and Drivers. In Water, Land, and Forest Susceptibility and Sustainability; Geospatial Approaches and Modeling; Elsevier: Amsterdam, The Netherlands, 2022; pp. 3–25. [Google Scholar] [CrossRef] [Scilit]
- Wang, Q.; Dong, Z. Does Financial Development Promote Renewable Energy? Evidence of G20 Economies. Environ. Sci. Pollut. Res. 2021, 28, 64461–64474. [Google Scholar] [CrossRef] [Scilit] [PubMed]
- Belloumi, M.; Aljazea, A. Impact of Economic Growth and Financial Development on Renewable Energy Use in Selected Oil-Exporting Countries. Asian J. Econ. Model. 2024, 12, 108–123. [Google Scholar] [CrossRef] [Scilit]
- Grzebyk, M.; Stec, M. The Level of Renewable Energy Used in Eu Member States–A Multidimensional Comparative Analysis. Econ. Environ. 2023, 86, 244–264. [Google Scholar] [CrossRef] [Scilit]
- Parobek, J.; Paluš, H.; Kalamárová, M.; Loucanová, E.; Šupín, M.; Križanová, A.; Štofková, K.R. Energy Utilisation of Renewable Resources in the European Union? Cluster Analysis Approach. BioResources 2016, 11, 984–995. [Google Scholar] [CrossRef] [Scilit]
- Piekut, M.; Rodrigues Gaspar, A. The Consumption of Renewable Energy Sources (RES) by the European Union Households between 2004 and 2019. Energies 2021, 14, 5560. [Google Scholar] [CrossRef] [Scilit]
- Sun, P.; Nie, P.Y. A Comparative Study of Feed-in Tariff and Renewable Portfolio Standard Policy in the Renewable Energy Industry. Renew. Energy 2015, 74, 255–262. [Google Scholar] [CrossRef] [Scilit]
- Rasoulinezhad, E.; Taghizadeh-Hesary, F. Role of Green Finance in Improving Energy Efficiency and Renewable Energy Development. Energy Effic. 2022, 15, 14. [Google Scholar] [CrossRef] [Scilit] [PubMed]
- Zhindon-Almeida, R.G.; Ruiz-Carrillo, J.A. Factors Influencing the Adoption of Renewable Energies in Developing Countries. Sustain. Dev. 2025, 33, 7222–7244. [Google Scholar] [CrossRef] [Scilit]
- Ahmadov, A.; van der Borg, C. Do Natural Resources Impede Renewable Energy Production in the EU? A Mixed-Methods Analysis. Energy Policy 2019, 126, 361–369. [Google Scholar] [CrossRef] [Scilit]
- Puertas, R.; Marti, L. Renewable Energy Production Capacity and Consumption in Europe. Sci. Total Environ. 2022, 853, 158592. [Google Scholar] [CrossRef] [Scilit] [PubMed]
- Stec, M.; Grzebyk, M. Statistical Analysis of the Level of Development of Renewable Energy Sources in the Countries of the European Union. Energies 2022, 15, 8278. [Google Scholar] [CrossRef] [Scilit]
- Fatima, N.; Li, Y.; Ahmad, M.; Jabeen, G.; Li, X. Factors Influencing Renewable Energy Generation Development: A Way to Environmental Sustainability. Environ. Sci. Pollut. Res. 2021, 28, 51714–51732. [Google Scholar] [CrossRef] [Scilit] [PubMed]
- Marra, A.; Colantonio, E. The Institutional and Socio-Technical Determinants of Renewable Energy Production in the EU: Implications for Policy. J. Ind. Bus. Econ. 2022, 49, 267–299. [Google Scholar] [CrossRef] [Scilit]
- Liu, W.; Shen, Y.; Razzaq, A. How Renewable Energy Investment, Environmental Regulations, and Financial Development Derive Renewable Energy Transition: Evidence from G7 Countries. Renew. Energy 2023, 206, 1188–1197. [Google Scholar] [CrossRef] [Scilit]
- Neetzow, P. The Effects of Power System Flexibility on the Efficient Transition to Renewable Generation. Appl. Energy 2021, 283, 116278. [Google Scholar] [CrossRef] [Scilit]
- Nchofoung, T.N.; Ojong, N. Natural Resources, Renewable Energy, and Governance: A Path towards Sustainable Development. Sustain. Dev. 2023, 31, 1553–1569. [Google Scholar] [CrossRef] [Scilit]
- Regulation-2018/1999-EN-EUR-Lex. Available online: https://eur-lex.europa.eu/eli/reg/2018/1999/oj/eng (accessed on 27 November 2025).
- Directive-2012/27-EN-EUR-Lex. Available online: https://eur-lex.europa.eu/eli/dir/2012/27/oj/eng (accessed on 27 November 2025).
- Heating and Cooling. Available online: https://energy.ec.europa.eu/topics/energy-efficiency/heating-and-cooling_en?prefLang=es (accessed on 27 November 2025).
- Directive-2019/944-EN-EUR-Lex. Available online: https://eur-lex.europa.eu/eli/dir/2019/944/oj (accessed on 27 November 2025).
- The European Green Deal-European Commission. Available online: https://commission.europa.eu/strategy-and-policy/priorities-2019-2024/european-green-deal_en (accessed on 27 November 2025).
- 2030 Climate Targets-Climate Action-European Commission. Available online: https://climate.ec.europa.eu/eu-action/climate-strategies-targets/2030-climate-targets_en (accessed on 27 November 2025).
- Directive-2018/2001-EN-EUR-Lex. Available online: https://eur-lex.europa.eu/eli/dir/2018/2001/oj/eng (accessed on 27 November 2025).
- Directive-2009/28-EN-Renewable Energy Directive-EUR-Lex. Available online: https://eur-lex.europa.eu/eli/dir/2009/28/oj/eng (accessed on 27 November 2025).
- Energy Efficiency|Fact Sheets on the European Union|European Parliament. Available online: https://www.europarl.europa.eu/factsheets/en/sheet/69/energy-policy-general-principles (accessed on 27 November 2025).
- Renewable Energy Policy Database and Support: Compare Support Schemes. Available online: http://www.res-legal.eu/compare-support-schemes/ (accessed on 27 November 2025).
- Slovakia Has Large Reserves in the Use of Renewable Energy for Heating and Cooling|SAPI.Sk|Slovak Association of Sustainable Energy. Available online: https://www-sapi-sk.translate.goog/clanok/slovensko-ma-velke-rezervy-vo-vyuzivani-oze-na-kurenie-a-chladenie?_x_tr_sl=sk&_x_tr_tl=en&_x_tr_hl=es (accessed on 27 November 2025).
- Statistics|Eurostat. Available online: https://ec.europa.eu/eurostat/databrowser/explore/all/all_themes (accessed on 27 November 2025).
- Exports of Electricity and Derived Heat by Partner Country. Available online: https://ec.europa.eu/eurostat/databrowser/view/nrg_te_eh/default/table?lang=en (accessed on 27 November 2025).
- Use of Renewable Energy Sources in Transport, Review Articles, Columns. Available online: https://www.atpjournal.sk/rubriky/prehladove-clanky/vyuzitie-obnovitelnych-zdrojov-energie-v-doprave.html?page_id=40349 (accessed on 27 November 2025).
- Revised Guidelines on Renewable Energy-RED III-Co2news.Sk. Available online: https://www.co2news.sk/en/2024/10/21/revised-guidelines-on-renewable-energy-red-iii/ (accessed on 27 November 2025).
- Use of Renewables for Heating and Cooling-Details. Available online: https://ec.europa.eu/eurostat/databrowser/view/nrg_ind_urhcd/default/table?lang=en (accessed on 27 November 2025).
- Use of Renewables for Transport-Details. Available online: https://ec.europa.eu/eurostat/databrowser/view/nrg_ind_urtd/default/table?lang=en (accessed on 27 November 2025).
- Use of Renewables for Electricity-Details. Available online: https://ec.europa.eu/eurostat/databrowser/view/nrg_ind_ured/default/table?lang=en (accessed on 27 November 2025).
- Contribution of Renewable Fuels to Gross Final Consumption of Energy. Available online: https://ec.europa.eu/eurostat/databrowser/view/nrg_ind_rfce/default/table?lang=en (accessed on 27 November 2025).
- Imports of Biofuels by Partner Country. Available online: https://ec.europa.eu/eurostat/databrowser/view/nrg_ti_bio/default/table?lang=en (accessed on 27 November 2025).
- Exports of Biofuels by Partner Country. Available online: https://ec.europa.eu/eurostat/databrowser/view/nrg_te_bio/default/table?lang=en (accessed on 27 November 2025).
- Imports of Electricity and Derived Heat by Partner Country. Available online: https://ec.europa.eu/eurostat/databrowser/view/nrg_ti_eh/default/table?lang=en (accessed on 27 November 2025).
- Taušová, M.; Mykhei, M.; Čulkova, K.; Tauš, P.; Petráš, D.; Kaňuch, P. Development of the Implementation of Renewable Sources in EU Countries in Heating and Cooling, Transport, and Electricity. Sustainability 2025, 17, 766. [Google Scholar] [CrossRef] [Scilit]
- Demir, N.; Baş, P. AVRUPA BİRLİĞİ’NİN ENERJİ SORUNSALINDA YENİLENEBİLİR ENERJİ KAYNAKLARININ YERİ VE GELECEĞİ. J. Mehmet Akif Ersoy Univ. Econ. Adm. Sci. Fac. 2020, 7, 806–831. [Google Scholar] [CrossRef] [Scilit]
- Frodyma, K. The Analysis of Changes in the Distribution of Renewable Energy Consumption in the EU Countries. In The 11th Professor Aleksander Zelias International Conference on Modelling and Forecasting of Socio-Economic Phenomena; Foundation of the Cracow University of Economics: Krakow, Poland, 2017. [Google Scholar]
- Iliopoulos, T.G. Support Schemes for Renewable Energy Sources in the EU. Ph.D. Thesis, Hasselt University, Diepenbeek, Belgium, 2021. [Google Scholar]

Disclaimer/Publisher’s Note: The statements, opinions and data contained in all publications are solely those of the individual author(s) and contributor(s) and not of MDPI and/or the editor(s). MDPI and/or the editor(s) disclaim responsibility for any injury to people or property resulting from any ideas, methods, instructions or products referred to in the content. |
© 2026 by the authors. Licensee MDPI, Basel, Switzerland. This article is an open access article distributed under the terms and conditions of the Creative Commons Attribution (CC BY) license.