


Abstract
The security and stability of energy are vital to the national economy and people’s well-being. At present, the global energy industry is undergoing a profound historical transformation. Exploring effective strategies to bolster the resilience of the energy industry supply chain and ensure its sustainable development represents a pivotal approach to achieving energy security and stability. Based on panel data from 30 provinces in China from 2013 to 2023, this study constructs an indicator system for new quality productivity forces and the resilience of the energy industry supply chain, applies the entropy weight method for indicator weighting, and employs an improved E–G index algorithm to measure the industrial agglomeration index. The influence of new quality productivity forces on the resilience of the energy industry supply chain is examined through a two-way fixed-effects model. The research findings demonstrate that new quality productivity significantly enhances the resilience of the energy industry supply chain. The level of energy supply exhibits a moderating effect, positively facilitating the enhancement of supply chain resilience through new quality productivity. The levels of urbanization, development, and industrial collaborative agglomeration demonstrate a threshold effect, leading to a nonlinear impact of new quality productivity on the resilience of the energy industry supply chain. Our heterogeneity tests reveal that in central r–ions and regions with higher levels of informatization, the promoting effect of new quality productivity on the resilience of the energy industry supply chain is more pronounced. This study further clarifies the mechanism through which new quality productivity influences the resilience of the energy industry supply chain, enriches and expands the understanding of the role of new quality productivity in the energy industry, and provides crucial support for governments and enterprises in making decisions aimed at enhancing the resilience of the energy industry supply chain.
1. Introduction
Energy is the food of industry and the lifeblood of the national economy. The resilience of the energy industry supply chain is a core element related to energy security and stability, which concerns the national economy and people’s livelihoods. A report from the 20th National Congress of the Communist Party of China clearly stated that “we should focus on enhancing the resilience and security level of industrial and sup-ply chains” [1]. With the reorganization of the global industrial supply chain and the most accelerated evolution of unprecedented changes in a century, China’s energy industry supply chain is facing uncertainties in the external environment. In “bottleneck” areas, there are serious threats of “chain breakage” and “chain blockage” to China’s energy industry supply chain, which leads to energy price increases, energy supply crises, the relocation of large-scale enterprises from China, and the global industrial supply chain layout gradually becoming localized and decentralized [2,3,4]. Therefore, exploring how to strengthen the resilience of the energy industry supply chain is a key path to achieving the sustainable development of the energy industry, smoothing the circulation of the national economy, and ensuring national energy security.
In September 2023, General Secretary Xi Jinping first proposed “accelerating the formation of new quality productivity and enhancing new drivers of development”. On 31 January 2024, when presiding over the eleventh collective study session of the Political Bureau of the CPC Central Committee, General Secretary Xi Jinping pointed out that high-quality development requires a new quality productivity theory for guidance, and new quality productivity has already formed in practice and demonstrated strong driving and supporting forces for this development. It is necessary to theoretically summarize and generalize these forces to guide new development practices [3,5]. We should take new quality productivity as the starting point, actively develop and lay out the industrial chain, and continuously enhance the safety and stability of the industrial resilience of the supply chain [6]. New quality productivity is grounded in the core of productivity itself, and its unique “newness” essentially comes from technological innovation and the expansion of new fields. The “quality” of new quality productivity not only means a higher quality of development but also represents a better and superior quality of life. New quality productivity is the “new” upgrading of the three traditional elements of laborers, labor objectives, and labor materials, undergoing a qualitative change in energy level; by matching new quality productivity with laborers, labor objects, and labor materials, it thus forms new production factors. The existing research has explored new quality productivity from multiple dimensions, responding to the emergence of new productive elements through qualitative changes in energy levels. First, agricultural new quality productivity is specifically manifested in the birth of new production elements, the provision of new production materials, and the expansion of new labor objectives [7]. The second dimension involves new quality productivity at the enterprise level, which is theoretically grounded in the two-factor theory of productivity and uses it as the basis for measurement. This dimension quantifies two core aspects: the labor force and production tools. Specifically, it comprises two major components: new laborers and new labor materials tools within enterprises [8]. Thirdly, local new quality productivity is comprehensively measured from the perspective of tangible elements [9], focusing on the three elements of new quality productivity.
As evident from the above discussion, current research on new quality productivity primarily centers on agriculture, enterprises, and local governments, with a notable lack of studies on the application of these forces within the energy sector. Furthermore, energy possesses distinct strategic attributes that set it apart from other domains. Energy issues rank as a top priority for national security across nations, and gaining control over energy equates to seizing the linchpin of national development and security strategies. Throughout global development, the energy revolution, the industrial revolution, and the technological revolution have been intertwined and mutually propelling, collectively driving the advancement of productive forces and the progress of human civilization [10]. Building upon this foundation, this study endeavors to broaden the scope of new quality productivity theory, emphasizing green development objectives and innovative energy concepts from the unique perspective of energy development. It aims to construct elements of new quality productivity in the energy sector, encompassing new quality energy workers, labor objectives, and labor resources.
New quality productivity represents an advanced and dynamic state, serving as a new driving force for economic development and the driving force behind chain supple-mentation and strengthening [11,12]. In this new state, developing new technologies, allocating new production factors, and deepening the transformation of strategic industries are important paths toward to enhance the resilience of industrial structure [13,14,15]. However, can new quality productivity have an impact on the resilience of the energy industry supply chain? At present, the academic research on new quality productivity and industrial supply chain resilience primarily unfolds along two core dimensions. First, it centers on the enterprise development level, exploring in depth how new quality productivity can empower enterprises during their continuous development and evolution, thereby enhancing the resilience of industrial supply chains. This line of research resonates with the core connotations and the constituent elements of new quality productivity discussed earlier, with a particular focus on uncovering the pathways through which new quality productivity forces at the enterprise level bolster the resilience of the industrial supply chain. Zhang and Zhang (2025) [16] concluded from panel data of listed companies that new quality productivity can enhance industrial supply chain resilience. Akhtar et al. (2022) [17] and Zhao et al. (2023) [18], using enterprise panel data, found that supply chain digitization has a significant positive impact on supply chain resilience and performance. The second dimension focuses on industrial development, thoroughly examining key industrial sectors such as agriculture, digital technology, and education. The primary objective is to explore the enabling value and supportive role of new quality productivity in promoting sustainable industrial development and enhancing the resilience of the supply chain, among other areas. Lin et al. (2024) [5], using provincial panel data, explored the correlation between new quality productivity and high-quality agricultural development, focusing on “how new quality productive affect high-quality agricultural development” as well as heterogeneity and nonlinear characteristics. The empirical analysis showed that new quality productivity significantly promotes high-quality agricultural development. Chen and Ye (2025) [19], with the sports industry as the focal point of their research, utilized panel data from 11 provinces and municipalities in China to conduct an empirical analysis. Their findings reveal that new quality productivity significantly and positively drives the quality and the efficiency transformation of the sports industry, with this impact demonstrating notable regional heterogeneity.
Upon reviewing the aforementioned studies, it becomes evident that the majority of the scholars’ research has primarily focused on the impact of new quality productivity on the resilience of industrial supply chains [20,21], with a particular emphasis on enterprise development and industrial development [22,23]. However, when examining the role of new quality productivity on the resilience of the industrial supply chain, most of the studies tend to utilize enterprise panel data, with provincial panel data being less commonly used and the corresponding research results being scarce. Moreover, there is a marked scarcity of studies focused on the energy industry—a sector of pivotal strategic importance—particularly those that examine how new quality productivity shapes the supply chain resilience of the energy sector. In light of this, the aim of this study is to expand the scope of the new quality productivity theory and further elucidate the characteristics of its role in the energy industry. In light of the distinctive traits of the energy industry, this paper draws on provincial panel data to explore the mechanism through which new quality productivity acts on supply chain resilience in the energy sector, with various influencing factors taken into consideration.
To sum up, building on the findings of previous studies, this research centers on two critical aspects: the resilience of supply chains in the energy industry and new quality productivity. Below are the possible contributions this study may bring: On the one hand, based on the theory of new quality productivity, this study constructs an indicator system for new quality productivity in energy and an indicator system for the resilience of energy industry supply chains from the perspective of the specificity of energy development, thereby expanding the scope of application of the theory of new quality productivity. On the other hand, based on provincial panel data from China and considering the specificity of the energy industry, this study deeply explores the impact mechanism of new quality productivity on the resilience of energy industry supply chains. Starting from the aspects of industrial collaborative agglomeration and the development level of urbanization, this research examines the nonlinear impact features that new quality productivity exerts on the supply chain resilience of the energy industry, providing new insights for the decisions made by enterprises and governments.
2. Theoretical Analysis and Research Hypotheses
2.1. The Impact of New Quality Productivity on the Resilience of the Energy Industry Supply Chain
New quality productivity represents a novel qualitative state capable of achieving energy level transitions. Achieving sustainable development in the energy industry can enhance its resilience to a certain extent. How does new quality productivity affect the relationship between sustainable development and energy industry resilience? According to the existing research findings, new quality productivity is a key factor in enhancing the resilience of industrial supply chains. The resilience of industrial supply chains generally manifests as resistance and recovery capabilities, with resistance being represented by human capital and innovation output and input, and recovery being represented by industrial benefits and digitalization level [24,25]. Firstly, new quality productivity helps improve the literacy of workers, thereby enhancing resistance [26]. To meet the demands of the new situation, new quality productivity can cultivate professionals who meet the needs of the energy industry on the one hand and attract high-quality, high-tech new quality labor on the other. Secondly, new quality productivity helps to enhance the advancement of labor materials in the energy industry from the supply side, thereby improving recovery capabilities [27]. New quality productivity continuously updates and iterates new technologies and products in areas such as digital–physical integration and artificial intelligence, enhancing the advancement of labor materials in the energy industry, breaking through technological barriers, and ensuring supply chain stability. New quality productivity is capable of bringing together workers, labor materials and labor objectives, innovating and optimizing the allocation structure of production factors, boosting resistance and recovery capacities, and facilitating the improvement of supply resilience within the energy industry. Therefore, the following hypothesis is proposed:
Hypothesis 1.
New quality productivity can promote the resilience of the energy industry supply chain.
2.2. The Moderating Effect of New Quality Productivity on the Resilience of the Energy Industry Supply Chain
With the global industrial restructuring, from the perspective of the toughness of the energy industry supply chain, the import diversification of China’s energy system is gradually improving. However, in addition to coal, there is still a large gap in the self-production and consumption of China’s oil and natural gas. At the same time, the import scale has increased slowly in recent years, which is still a great challenge to the toughness of the energy industry’s supply chain. In 2022, China’s external dependence on oil was 71.2%, and it has maintained at about 70% for the past five years. In 2022, China’s external dependence on natural gas was at its lowest in the past five years, but it still reached 41.66%. The high external demand shows that there is still a large gap in China’s energy market, which is not conducive to the stable development of the energy industry’s supply chain. Therefore, the fundamental idea to improve the resilience of the energy industry supply chain is to solve the problem of energy supply. The core way to boost the resilience of supply chains in the energy industry is to tackle problems related to energy supply. Raising the standard of the energy supply, extending the distribution of the energy sector, and accomplishing chain complementation, reinforcement, coordination, and regulation can effectively strengthen the resilience of such supply chains. A higher standard of energy supply can trigger a synergistic effect among new production factors, allowing new quality productivity to have a positive influence on boosting supply chain resilience in the energy industry and safeguarding the safety and stability of this sector [28,29]. With the geopolitical impacts of the Russia–Ukraine conflict and the Palestine–Israel conflict, the global energy supply and demand pattern has undergone significant fluctuations. The improvement of the energy supply level can achieve an innovative allocation and an optimal combination of production factors, thereby facilitating the enhancement of energy industry supply chain resilience through new states such as technological revolution, management innovation, and product upgrading. Based on this, the following hypothesis is proposed:
Hypothesis 2.
The level of energy supply can enhance the role of new quality productivity in promoting the resilience of the energy industry supply chain.
2.3. The Threshold Effect of New Quality Productivity on the Resilience of the Energy Industry Supply Chain
Industrial collaborative agglomeration of varying degrees leads to the different effects that new quality productivity has on the supply chain resilience of the energy industry [30]. At a high degree, it can facilitate the flow of production factors beyond regional constraints, enhance the quality of labor matching, enable information and technology sharing, and broaden the overall layout of the industrial chain. When industrial collaborative agglomeration is at a low level, the development potential inherent in new quality productivity fails to be fully tapped, which in turn weakens its role in promoting supply chain resilience within the energy industry.
The degree of urbanization development in different regions has varying degrees of impact on the role of new quality productivity in the energy industry supply chain [31]. The level of regional urbanization development can stimulate the vitality of new productive factors to a certain extent, thereby providing source momentum for new quality productivity. When the level of urban development is low, there is a greater demand for new quality productivity, and the development of the energy industry shows a gradual improvement, which, in turn, gives birth to new labor materials, new laborers, and new labor objectives in the energy industry, accelerating the development of new quality productivity and promoting the improvement of the resilience of the regional energy industry supply chain. When urban development reaches a high level, new productive factors are likely to become stable, and the influence of new quality productivity on both the sustainable development of the energy industry and the enhancement of its supply chain resilience might be less noticeable. Based on this, the following hypothesis is proposed:
Hypothesis 3.
The degree of industrial collaborative agglomeration and the level of urbanization cause new quality productivity to have a nonlinear impact on the resilience of the energy industry supply chain.
3. Research Design
3.1. Research Methods
To scientifically assess new quality productivity and the supply chain resilience level of the energy industry, this research used the entropy weight method to carry out an objective weighting analysis on different indicators, so as to guarantee objectivity.
Prior to applying the entropy weight method, it is essential to standardize the data to ensure that the indicator data is dimensionless and has consistent directionality. This study utilizes panel data covering 30 Chinese provinces over the period from 2013 to 2023, and a time variable is introduced for measurement during the indicator analysis. The specific standardization formula is as follows:
where in the formula represents the province and city (); represents each indicator (); represents the year (); represents the dimensionless data of indicators in province and city in year after standardization; represents the maximum value of the indicator in each province and city; and represents the minimum value of the indicator in the province and city. If the indicator positively affects the entropy value, Formula (1) is used to calculate it; if the indicator negatively affects the entropy value, Formula (2) is used to calculate it.
Considering the occurrence of zero values during the calculation using the data range dimension method, a slight translation is applied to the normalized indicator values here. The specific translation calculation is as shown in Formula (3).
In the Formula, is the translation amount. To ensure that the translation has little impact on the actual indicator data, the value of here is 0.0001.
To calculate the proportion of each indicator in the new quality productivity and energy industry supply chain resilience indicators, Formula (4) is used.
To calculate the information entropy value of the indicator , Formula (5) is used.
In the Formula, .
To calculate the weight of each indicator , Formula (6) is used.
In the Formula, is the difference coefficient of each indicator . The greater the difference coefficient, the more important the indicator is in the comprehensive evaluation index system.
To calculate the linear weighted comprehensive index , Formula (7) is used.
3.2. Model Settings
3.2.1. Baseline Regression Model
In order to test Hypothesis 1, the following benchmark regression model is constructed:
where and represent the region and year, respectively; is the core explained variable, indicating the energy industry supply chain resilience of the region in the period; and is the core explanatory variable, indicating the new quality productivity of the region in the period. The control variable represents the population density, represents the situation of foreign trade in the region—that is, the degree of openness to the outside world; represents the production industry structure; , , and represent the region fixed effects, the time fixed effects, and the random disturbance terms, respectively; is the intercept term; and , , , and are all the coefficients to be estimated.
3.2.2. Moderating Effect Model
To delve deeper into the impact of new quality productivity on the resilience of the energy industry supply chain and validate Hypothesis 2, it is necessary to consider the potential mutual influence between relevant indicators and the level of energy supply when constructing the resilience indicators of the energy industry supply chain. To tackle possible endogeneity problems, we first decentralize both the energy supply level and the supply chain resilience of the energy industry, and then we include the interaction terms in the regression model. The constructed moderating effect model is as follows:
where is the regulating variable, representing the energy supply level; and represents the interaction term between decentralized new quality productivity and the resilience of the energy industry supply chain. The meanings of the remaining variables are the same as in Equation (8).
3.2.3. Threshold Effect Model
In order to test Hypothesis 3 and explore the nonlinear characteristics of new quality productivity on the resilience of the energy industry supply chain, the following threshold effect model was constructed:
where and are the intercept terms; represents the degree of industrial collaborative agglomeration; represents the level of urbanization; serves as an indicator function that equals 1 if the condition inside the function brackets is satisfied, and 0 if it is not; and stands for the relevant threshold value. All the other variables carry the same meanings as those in Equation (8).
3.3. Variable Definition and Description
3.3.1. Explained Variable
The explained variable of this research is the supply chain resilience of the energy industry, denoted by ). This refers to the capacity of the energy industry to prevent chain disruptions and achieve rapid recovery after suffering an impact. Given the particular nature of the energy industry, this research draws on related studies [32,33,34,35] and establishes an index system for energy industry supply chain resilience from dimensions including resistance, recovery, reorganization, and innovation capacities (see Table 1). We use the entropy weight method to compute the weights of this index system.
Table 1.
Energy industry supply chain resilience index system.
3.3.2. Core Explanatory Variables
New quality productivity () serves as the core explanatory variable in this study. Based on the fundamental connotation of and the unique characteristics of China’s energy industry, the construction of the indicator system is primarily considered from the following three aspects: promoting the high-quality development of the energy industry by achieving breakthroughs in key links or fields through scientific and technological innovation activities, driving the steady development of the energy industry, and forming development advantages in key strategic fields [36]; leveraging the vitality of micro-organizations to form a modern industrial system centered around energy industrial enterprises, thereby enabling a more flexible and efficient adjustment of their strategies to achieve higher operational efficiency and sustainable development [37]; and achieving green and low-carbon development by deeply coordinating energy industry transformation, energy system transformation, and business model innovation, realizing efficient and clean energy storage trading industry extension and comprehensive transformation towards zero-carbon development [38,39]. Therefore, referring to the existing research [9,40,41], an indicator system is constructed for new quality productivity in energy from three dimensions: new quality energy workers, new quality energy labor objectives, and new quality energy labor materials (see Table 2). The entropy weight method is used to compute the weights of this indicator system.
Table 2.
New quality productivity index system.
3.3.3. Regulated Variable
This study uses the energy supply level () as the adjusting variable. According to Gu et al. (2023) [42], the energy supply level is characterized by the length of transportation routes in different regions.
3.3.4. Threshold Variable
This study uses the industrial synergy agglomeration index () and the urban development level ( as threshold variables. Referring to the existing research [43,44,45], an improved E–G index is used to calculate the industrial synergy agglomeration index. The calculations are as follows:
where is the industrial synergy agglomeration index; and represent the production service industry and manufacturing, respectively; and are the number of employees in the production service industry and the manufacturing industry in the region, respectively; and are the total number of employees in the production service industry and the manufacturing industry in the country; is the total employment in the country; and and represent the region and the year, respectively.
The transportation capacity of a city reflects the progress of urbanization to some extent. Referring to the previous literature [46,47], this study characterizes the level of urban development by the number of public transportation vehicles per 10,000 people in the region.
3.3.5. Control Variables
In order to more accurately reflect the relationship between new quality productivity and the resilience of the energy industry supply chain, this study further introduces control variables: population density ), expressed as the ratio of a region’s year-end population to its area; degree of openness to the outside world (), represented by the ratio of import and export trade volume to the regional GDP; and industry structure (), characterized by the ratio of the gross production value of the secondary and tertiary industries to the gross regional product.
3.4. Data Source
To accurately measure the new quality productivity of energy and the resilience of China’s energy industry, panel data from 30 provinces in China from 2013 to 2023 (excluding Tibet, Hong Kong, Macao, and Taiwan due to lack of data completeness and availability) were selected as research samples, referring to the selection rules for panel data in prior studies [48,49,50]. The data primarily comes from databases published on China’s official websites, including the China Statistical Yearbook, the China Science and Technology Statistical Yearbook, the China Education Statistical Yearbook, the China High-tech Industry Statistical Yearbook, the China Basic Unit Yearbook, the China Environment Yearbook, the China Electric Power Yearbook, the China Natural Resources Statistical Yearbook, the China Trade and Foreign Economic Statistical Yearbook, the China Economic and Trade Yearbook, the China Commerce Yearbook, the China Population and Employment Statistical Yearbook, the China Energy Statistical Yearbook, and the China Industrial Statistical Yearbook, as well as the CSMAR database. Considering that various provinces in China may have less missing data due to factors such as special policies, referring to the common practices in the previous research on panel data, linear interpolation was used to fill in the missing data, which does not affect the annual data development trend of each province and thus maximizes its validity.
Considering that this paper has clearly described the construction process of the two core variables of new quality productivity and the energy industry supply chain, and according to the index description, we can find the one-to-one correspondence between the characterization index and the data source. Therefore, this study continues to give a clear description of other variables (see Appendix A for details: source and interpretation of index selection) and shows the relationship between variables and data sources, so as to verify the authenticity and validity of the data.
4. Empirical Analysis
4.1. Descriptive Statistical Analysis
To provide a clearer depiction of the variables selected for this study, a descriptive statistical analysis was conducted on the data samples. Table 3 reports the descriptive statistics of the main variables in this study. It can be observed that the values of each variable are all 330, covering the panel data of 30 provinces in China from 2013 to 2023, which is a continuous 11-year period. The missing values have been supplemented, fully ensuring the validity of the research results. The standard error values for both the dependent variable—energy industry supply chain resilience—and the independent variable—new quality productivity—are 0.089, indicating that the variables deviate from the sample mean to a small extent. This fully demonstrates the representativeness and reliability of the sample selection from a statistical perspective. Meanwhile, the obvious gap between the minimum and the maximum values of energy industry supply chain resilience shows that there is substantial heterogeneity in the supply chain resilience of the energy industry among the different provinces. In the same way, the notable difference between the maximum and the minimum values of the independent variable, new quality productivity, indicates that this variable possesses strong explanatory capacity and can greatly strengthen the robustness of the indicators. The differences in the mean and extreme values of the control variables reflect detailed variations; this shows that the choice of the control variables is relatively scientific and reasonable, which effectively reduces the impact of the control factors on this research.
Table 3.
Descriptive statistics of main variables.
Table 4 reports the multicollinearity among the variables in this study. To demonstrate the validity of the variables selected in this study, a basic regression analysis was conducted on the model, followed by a multicollinearity test on the relevant variables. The results showed a variance inflation factor (VIF) , indicating that there was no multicollinearity among the variables. This confirms that all the variables chosen in this research study are independent and valid, satisfying the requirements for the subsequent data analysis.
Table 4.
Multicollinearity analysis.
4.2. Benchmark Regression Results Analysis
In order to preliminarily judge the action relationship between the main variables, the benchmark regression of the sample is completed according to Formula (8). The benchmark regression results are presented in Table 5, with a total sample size of 330. It primarily reports the impact of new quality productivity on the resilience of the energy industry supply chain. Column (1) shows the regression results obtained by only adding the explanatory variable of new quality productivity and fixing the effects of time and province. The regression coefficient is 0.463, which passes the significance test at the 1% level, indicating that new quality productivity has a significant positive effect on the resilience of the energy industry supply chain. Columns (2) and (3) present the regression results after introducing control variables such as openness, population density, and industrial structure. The regression results in column (2) show that, after adding the control variables, new quality productivity still has a significant positive impact on the resilience of the energy industry supply chain; the regression results in column (3), without fixing the effects of time and province, are still significant. This indicates that new quality productivity has a significant promoting effect on enhancing the resilience of the energy industry supply chain. Therefore, Hypothesis 1 is verified.
Table 5.
Baseline regression results.
4.3. Endogeneity Test
4.3.1. Instrumental Variable Method
Considering the existence of a certain endogenous causality between new quality productivity and the energy industry supply chain, and the potential issue of omitted variables in the constructed model, further instrumental variables are introduced in this study and are estimated using the two-stage least squares method (2SLS). The instrumental variable selected is the lagged term of new quality productivity (). As shown in column (2) of Table 6, the selected instrumental variable passes the tests for unidentifiability and weak instrumental variables, proving its effectiveness. The regression outcomes in column (1) show that the coefficient of the instrumental variable is significant at the 1% level, which suggests a positive correlation between the instrumental variable and new quality productivity. According to the regression results in column (2) of Table 6, new quality productivity can positively promote the improvement of resilience in the energy industry supply chain, verifying the robustness of the benchmark regression results.
Table 6.
Endogeneity test results.
4.3.2. Differential and System GMM Estimation Method
Considering that the resilience of the energy industry supply chain may be related to the sequence, this study further introduces the lag term for regional energy industry supply chain resilience in the model in order to separate unobservable factors and reduce the bias of the model estimation. The model is estimated and tested using the GMM system differential method. According to column (3) of Table 6, AR (1) is significant at the 10% level, while AR (2) is not significant. If there is first-order autocorrelation in the residuals and no second-order autocorrelation, then there is no significant sequence correlation in the error term of the original model. By conducting the Hansen over-identification constraint test, we can find that the p-value of the test result is higher than 0.1, which suggests that the null hypothesis holds and the over-identification constraint of the instrumental variables is valid. The regression outcomes in column (3) show that after handling endogeneity issues, new quality productivity exerts a significant promoting impact on the supply chain resilience of the energy industry, further verifying Hypothesis 1.
4.4. Robustness Check
In order to verify the reliability of the empirical results, we conducted a robustness test on the regression results by replacing models, eliminating abnormal samples, replacing core explanatory variables, and replacing explained variables.
- (1)
- Replace the model. As the range of resilience values in the energy industry supply chain are between 0 and 1, which meets the condition of limited dependent variables, the Tobit model was chosen for the re-estimation. The regression results after adding the control variables and fixing the provinces and the year, as shown in column (1) of Table 5, show that new quality productivity significantly positively affects the resilience of the energy industry supply chain, which is consistent with the baseline regression results.
- (2)
- Remove abnormal samples. Due to the impact of COVID-19 in 2020, the consumption demand changed. Therefore, the regression estimation was conducted again after removing the data for the epidemic year. The regression results in column (2) of Table 7 show that these values remain significant.Table 7. Mechanism inspection results.
- (3)
- Replace the dependent variable and the core explanatory variable separately. Using principal component analysis, the weights of new quality productivity and energy industry supply chain resilience were re-estimated, and the entropy weight method was used to obtain the replacement new quality productivity weight and the energy industry supply chain resilience weight c.Re. We re-estimated the regression model, and the results—presented in columns (3) and (4) of Table 7—proved to be significant. On this basis, the conclusion that new quality productivity boosts the supply chain resilience of the energy industry is fairly robust.
4.5. Mechanism Test
4.5.1. Moderating Effect
In order to judge the regulating effect of the energy supply level, a regression analysis was carried out according to Equation (9). The regression results of taking the energy supply level as the regulation effect are shown in column (5) of Table 7. It can be seen from the regression results that the regression coefficient of the interaction term between energy supply level and new quality productivity is 0.162, which is significant at the 1% level. This shows that the level of energy supply can effectively enhance the positive enabling effect of new quality productivity on the resilience of the regional energy industry supply chain. Therefore, Hypothesis 2 is confirmed.
4.5.2. Threshold Effect
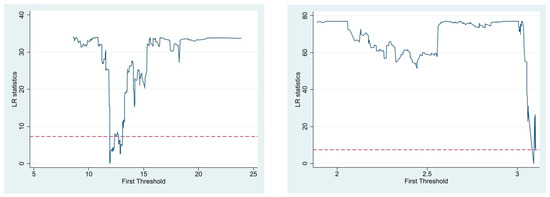
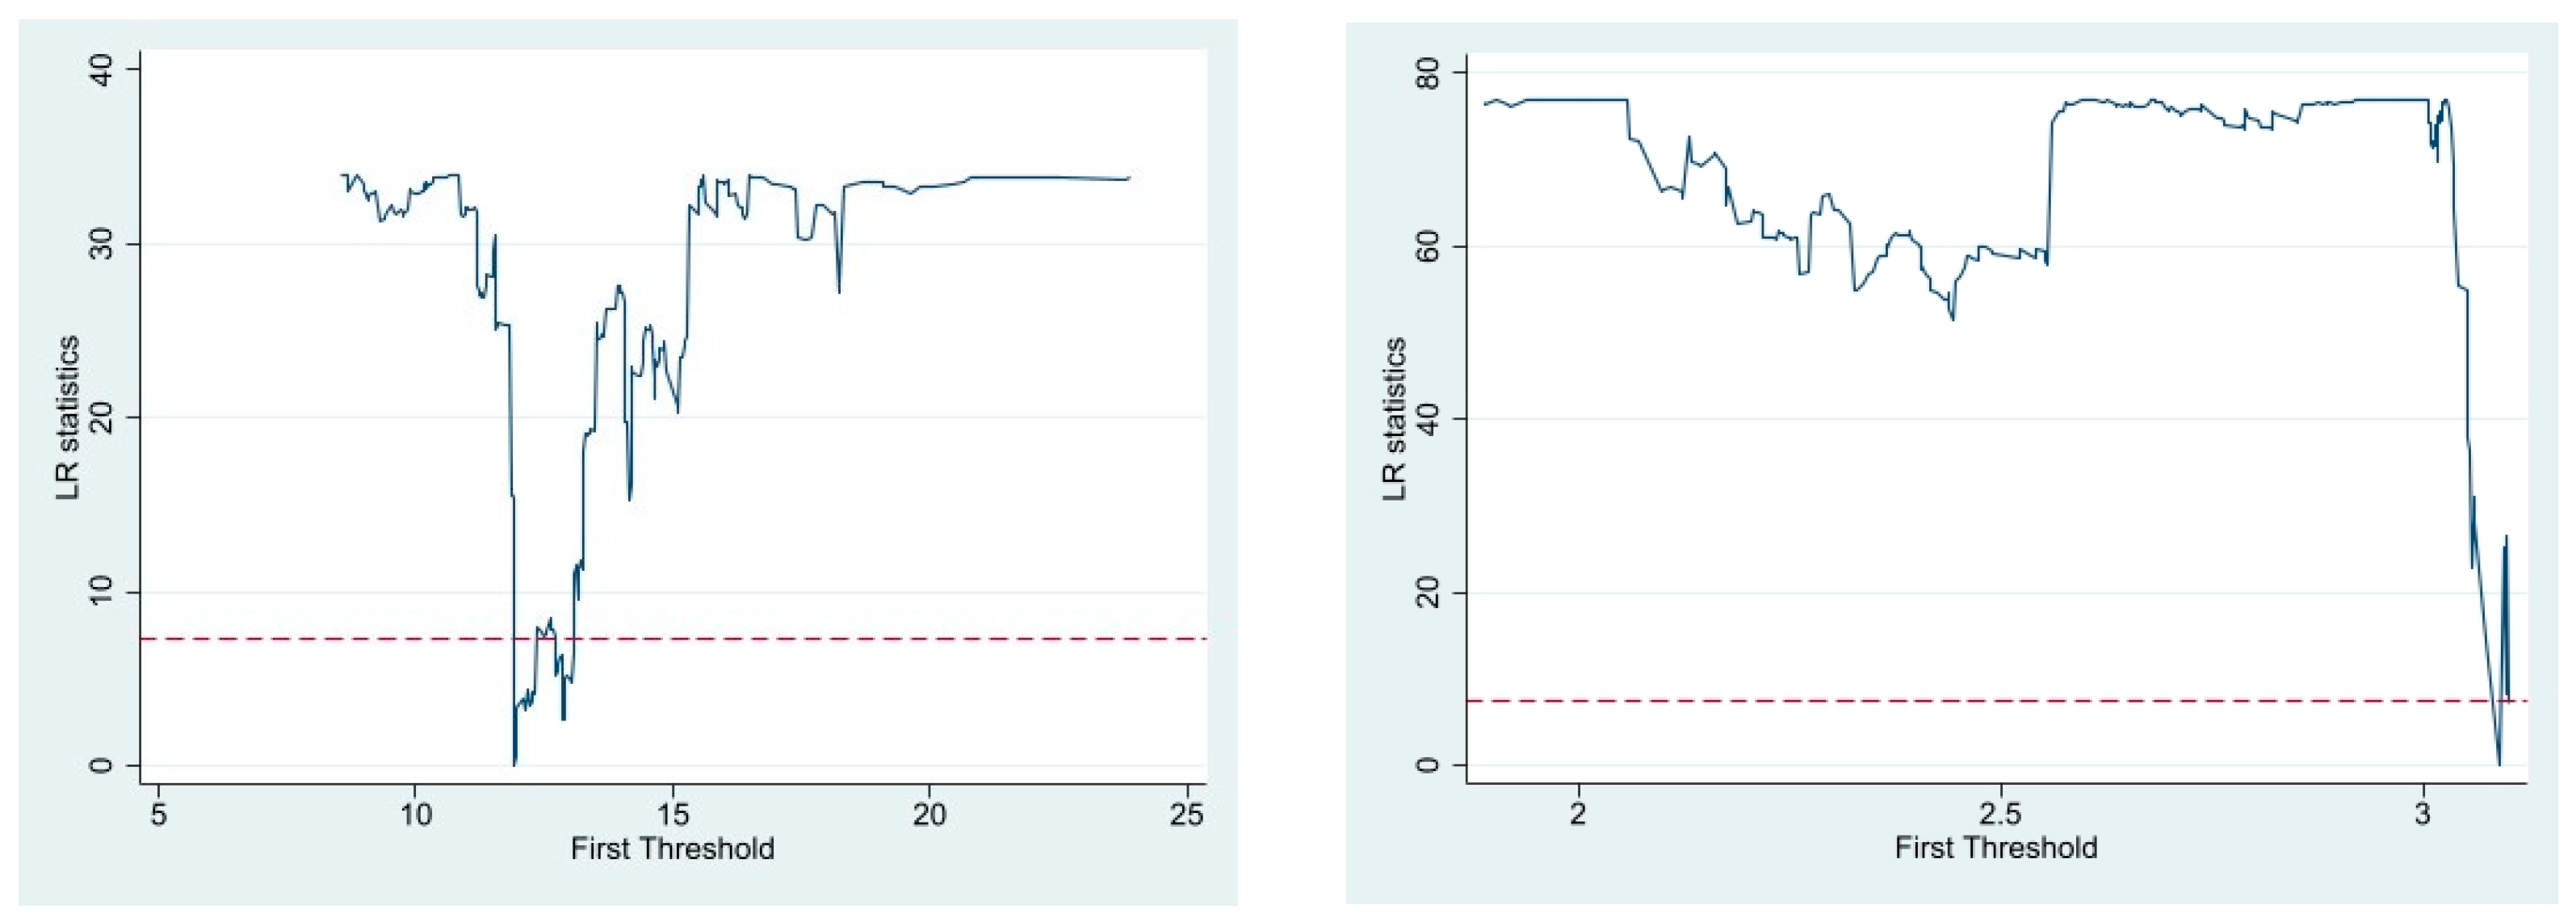
According to Equations (10) and (11), the urban development level and the degree of industrial collaborative agglomeration were used as the threshold variables for the threshold effect testing. The test results, as shown in Figure 1, indicate that both the urbanization level and the degree of industrial collaborative agglomeration passed the single threshold test. According to the results in Table 8, the urbanization level and the degree of industrial collaborative agglomeration showed no significance in the double threshold test. Therefore, when using the urban development level and the degree of industrial collaborative agglomeration as the threshold variables, the impact of new quality productivity on the energy industry supply chain exhibits nonlinear characteristics.
Figure 1.
Threshold variable likelihood ratio function graphs. Note: The red dash line represents a critical value of 5%, the two panels respectively represent the threshold regression LR diagram corresponding to the urbanization development level and the degree of industrial collaborative agglomeration.
Table 8.
Threshold effect test.
According to column (1) in Table 9, the first threshold value for the urbanization level is 11.93. Among the threshold values for each stage of urbanization, the independent variable, new quality productivity, is significant at the 1% level. However, its coefficient varies across the different stages. As the level of urban development continues to improve, new quality productivity factors will rapidly upgrade, making new quality productivity more dependent on new quality productivity factors and weakening the positive promoting effect of the urban development level. According to column (2) in Table 9, the degree of industrial collaborative agglomeration is significant at the 1% level within different threshold ranges, with a first threshold value of 3.098. When the degree of industrial collaborative agglomeration is less than the threshold value of 3.098, the regression coefficient of new quality productivity is 0.286; when it is greater than the threshold value, the regression coefficient of new quality productivity is 0.529. This indicates that as industrial collaborative agglomeration continues to grow, the promoting effect of new quality productivity on enhancing the resilience of the energy industry supply chain also continues to increase.
Table 9.
Threshold effect test results.
Overall, under different levels of urban development and degrees of industrial collaborative agglomeration, new quality productivity exhibits nonlinear characteristics in the energy industry supply chain. Moreover, it demonstrates a significant promoting effect within different threshold ranges. Therefore, Hypothesis 3 is confirmed.
4.6. Heterogeneity Analysis
The mechanism test confirmed the presence of both moderating and threshold effects among the influencing factors on the resilience of the energy industry supply chain. To further investigate the impact of other factors, this study conducted a heterogeneity analysis on the selected variable samples. Based on geographical differences and varying degrees of regional informatization, we examined the different impacts that new quality productivity has on the supply chain resilience of the energy industry. Based on the existing related studies, this research measures the level of informatization by the ratio of a region’s total postal and telecommunications business volume to its year-end population, denoted by (); in line with the geographical classification issued by the National Bureau of Statistics of China, the research samples are split into East–West regions and Central regions to conduct separate regression analyses.
- (1)
- Heterogeneity in informatization level: Using the median of the informatization level ratio as a reference, areas are categorized into high- and low-informatization regions. As shown in columns (1) and (2) of Table 10, the coefficient of new quality productivity in high-informatization regions is 0.511, while that in low-informatization regions is 0.203, and both are significant at the 1% level. The result of the between-group coefficient difference test is significant at the 10% level, which suggests that regions with high informatization see a more noticeable impact of new quality productivity on boosting the supply chain resilience of the energy industry, and the level of sustainable energy development is more stable.Table 10. Heterogeneity test results.
- (2)
- Regional heterogeneity: As shown in columns (3) and (4) of Table 10, the coefficient of new quality productivity in Eastern and Western regions is 0.306, while that in the Central region is 0.711, and both are significant at the 1% level; the between-group coefficient difference test result is significant at the 5% level. The Eastern region of China, with its rapid economic development, experiences a smaller impact from new quality productivity compared to other regions. On the other hand, the Western region of China, being a resource-rich area, exhibits better resilience in the energy industry supply chain, and the impact of new quality productivity on its resilience is relatively small compared to the other regions. Therefore, the Central region is more susceptible to the influence of new quality productivity, thereby enhancing the resilience of the energy industry supply chain compared to the Eastern and Western regions.
5. Discussion and Recommendations
This research used panel data covering 30 Chinese provinces over the period from 2013 to 2023 as its research sample. We adopted a two-way fixed effects model, a moderating variable model, and a threshold effect model to explore the impact of new quality productivity on the supply chain resilience of the energy industry. The following conclusions can be drawn from the empirical research.
- (1)
- New quality productivity has a positive impact on enhancing the resilience of the energy industry supply chain; it represents an advanced state of quality and serves as the driving force for economic development. New quality productivity factors not only exhibit significant characteristics in agriculture, enterprises, local governments, and other areas, but can also be further extended to the energy industry and its supply chain, providing theoretical support for subsequent research on sustainable development in the energy industry.
- (2)
- Regarding the impact of new quality productivity on the supply chain resilience of the energy industry, both the urbanization level and the degree of industrial collaborative agglomeration demonstrate a single threshold effect, showing nonlinear traits. The impact of new quality productivity on the supply chain resilience of the energy industry differs across various provinces and cities. Studies show that with the continuous improvement of the urbanization level, new quality productivity becomes more and more active, which raises the sustainable development level of the energy industry and exerts a more noticeable positive influence on supply chain resilience. Furthermore, as the level of urbanization further increases, the development of the energy industry will also improve and new quality productivity factors will rapidly upgrade, making new quality productivity more reliant on production factors and thus reducing its dependence on the level of urban development. When the degree of industrial agglomeration is below the threshold value of 3.0918, production factors cannot fully play their role, leading to the insufficient impact of new quality productivity on the resilience of the energy industry supply chain. However, as the degree of industrial agglomeration increases, its positive promoting effect gradually strengthens.
- (3)
- Energy supply levels can strengthen the positive impact of new quality productivity on the supply chain resilience of the energy industry. The sustainable development of the energy industry is inseparable from the level of regional energy supply; thus, an improvement in energy supply levels can result in a more effective allocation among energy production factors. The research indicates that the energy supply level has a moderating effect: as it rises, the role of new quality productivity in the energy industry becomes more noticeable, thus boosting the supply chain resilience.
- (4)
- The promoting impact of new quality productivity on the supply chain resilience of the energy industry is more noticeable in regions with high informatization levels and in the Central region. The development of the energy industry shows distinct characteristics among the different provinces in China, as well as across the various time periods. Our empirical results indicate that in regions with faster economic development, the influence of new quality productivity tends to be weaker; in resource-rich regions where supply levels are higher, the impact of new quality productivity on the sustainable development capacity of the energy industry is also less significant. In the Eastern and Western regions of China, which do not fall under the aforementioned categories, new quality productivity significantly enhances the resilience of the energy industry supply chain. In terms of informatization, regions with high informatization levels have closer links between new quality productivity factors and more dynamic new quality productivity. These factors exert a more noticeable positive influence on the sustainable development of the energy industry and the supply chain resilience, while regions with low informatization levels see less obvious impacts.
5.1. Limitations of This Study
In this study, we scientifically and effectively verified three hypotheses through an empirical analysis, achieving the research objectives. However, during the research analysis process, some shortcomings were identified, which we hope to further improve in subsequent research. The main limitations are as follows.
- (1)
- Limitations of data sources. This study adopted an empirical research approach based on panel data from 30 Chinese provinces, all of which were obtained from official Chinese government websites, thus ensuring the authenticity and reliability of the data. If we extend the research paradigm for examining how new quality productivity affects the supply chain resilience of the energy industry to different countries and regions across the globe, is there a corresponding department in other regions capable of collecting and organizing such comprehensive basic data to ensure the integrity of the research? The promotion of this research paradigm requires accurate data sources as support; thus, there are certain limitations in terms of data sources. Subsequent research studies can collect first-hand data through questionnaires or other forms to avoid this issue.
- (2)
- Limitations in indicator selection. Based on an extensive theoretical analysis and literature review, this study involved the construction of an indicator system for new quality productivity in the energy sector and energy industry supply chain resilience. However, during the indicator selection process, it was primarily filtered based on China’s national conditions and economic development needs. Currently, it is impossible to verify whether the indicator system can be adapted to other countries and regions. Therefore, there are certain limitations in the indicator selection. In subsequent research, the indicators can be adjusted differentially according to the actual situation in various regions, or the measurement methods of the indicators can be changed, making them more suitable for research needs.
5.2. Policy Recommendations
Based on the aforementioned conclusions, the following recommendations are proposed for the sustainable development of regional energy.
- (1)
- New quality productivity in the energy sector can effectively strengthen the supply chain resilience of the energy industry. Regional governments and enterprises should fully take into account the basic concepts of new quality productivity in the energy sector construction and continuously expand its application scope based on its component elements. This is mainly manifested in the following ways. It is necessary to improve the salary and welfare benefits of workers in the energy industry and to increase the number of jobs available in this sector. In terms of technological innovation, technology enterprises should be supported and encouraged to establish incubators to continuously improve the quality of new energy workers. From the perspective of new energy labor objectives, it is suggested to further expand the application of clean energy, enhance the capacity to control industrial environmental pollution, support and encourage the development and upgrading of enterprises in the energy industry, and steadily raise the level of new energy labor objectives. From the perspective of new energy labor resources, it is necessary to enhance the urban gas supply capacity, ensure optimal regional power supply levels, strengthen the digitalization and informatization of enterprises, increase research and development funding, significantly improve the level of information digitization, and continuously enhance the competitiveness of new energy labor resources through the continuous updating of key technologies and products. The effective development of new quality productivity in the energy sector can provide continuous momentum for strengthening and supplementing the supply chain, thereby stabilizing it and ensuring the sustainable development of the energy industry.
- (2)
- The impact of new quality productivity on the resilience of the energy industry supply chain varies significantly across regions with different levels of urbanization and degrees of industrial agglomeration. The level of energy supply can moderate the influence of new quality productivity on the resilience of the energy industry supply chain. From the perspective of urbanization, regional governments or enterprises should focus on developing the energy industry according to the different developmental stages of urbanization in their respective regions in order to enhance the resilience of the energy industry supply chain. From the perspective of industrial agglomeration, it is necessary to further promote regional energy marketization reforms, focus on collaborative industrial agglomeration, increase investment, optimize resource allocation, and enhance the elasticity of the regional energy industry supply chain, thereby achieving sustainable development. In terms of energy statistics, it is necessary to further improve the layout of regional energy supply networks, enhance energy supply levels, coordinate the layout of energy industry gradients, strengthen infrastructure, and optimize industrial upgrading. Based on the new quality productivity factors, we should construct a digital and intelligent development path for the energy industry supply network to enhance the resilience of the supply chain.
- (3)
- The impact of new quality productivity in the energy sector on the resilience of the energy industry supply chain varies significantly across regions with different geographical locations and levels of informatization. From the perspective of geographical location, it is necessary to consider the level of regional economic development and leverage the unique strategic attributes of energy development to help support micro-organizations. Targeted adjustments should be made to the development goals of the energy industry to ensure its safety and stability. Moreover, further development of informatization is required, and institutional reforms in the informatization of energy enterprises and education should be actively promoted. Considerable efforts should be made to develop advantageous industries; support the development of high-tech industrial enterprises such as artificial intelligence, big data, cloud computing, and new energy; improve labor productivity; continuously empower new quality productivity in the energy sector; and enhance the resilience of the industrial supply chain.
Author Contributions
Y.X.: propose research ideas, design research plans, and write the initial draft of the paper; Y.X.: participate in data collection and analysis, optimize research methods, and assist in revising papers; Y.X.: provide theoretical support and empirical analysis suggestions, participate in paper revision and review; X.L.: coordinate the research process, guide the writing of papers, review and finalize them, and be responsible for the completeness and academic standardization of the research content. All authors have read and agreed to the published version of the manuscript.
Funding
This research was funded by the National Social Science Foundation of China (24&ZD106) and by the Open Fund of Sichuan Oil and Gas Development Research Center (2025SY018).
Institutional Review Board Statement
Not applicable.
Informed Consent Statement
Not applicable.
Data Availability Statement
Data will be made available on request.
Conflicts of Interest
The authors declare no conflicts of interest. The funders had no role in the design of this study; in the collection, analyses, or interpretation of the data; in the writing of the manuscript; or in the decision to publish the results.
Appendix A. Source and Interpretation of Index Selection
| Variable Name | Variable Symbol | Variable Source | Variable Meaning | Variable Calculation Method |
| Energy Supply Level | China Energy Statistical Yearbook; CSMAR database | Reflect the energy transportation supply of each province. | Directly obtained according to the statistical yearbook. Selected the length of transport routes in each province as the characterization index. | |
| Agglomeration Index | China Statistical Yearbook; China Population and Employment Statistical Yearbook; China Economic and Trade Yearbook | Reflect the concentration of industrial clusters in each province. | According to the statistical yearbook, the employment index of production service industry and manufacturing industry was selected, which is characterized by Formulas (12)–(14). | |
| Urbanization Development Level | China Statistical Yearbook; China Industrial Statistical Yearbook; CSMAR database | Reflect the degree of urban modernization development in each province. | Obtained directly from the statistical yearbook. Selected the number of public transport vehicles per 10,000 people in each province to characterize the index. | |
| Population Density | China Statistical Yearbook; China Population and Employment Statistical Yearbook | Reflect the population distribution of each province. | According to the statistical yearbook, the ratio of the population at the end of the year to the area of the region was used to characterize the variables. | |
| Degree of Openness to the Outside World | China Trade and Foreign Economic Statistical Yearbook; China Economic and Trade Yearbook | Reflect the proportion of foreign trade in each province. | According to the statistical yearbook, the ratio of the import and export trade volume of each province to the regional GDP was used to characterize the variables. | |
| Industry Structure | China Statistical Yearbook; China Science and Technology Statistical Yearbook; CSMAR database | Reflect the distribution of industrial structure in each province. | According to the statistical yearbook, calculated the sum of the secondary industry and the tertiary industry of each province, and characterized the variable by the ratio of the total output value of the region where they were located. | |
| Informatization Levels | China High-tech Industry Statistical Yearbook; China Statistical Yearbook; China Population and Employment Statistical Yearbook | Reflect the development level of informatization in each province. | According to the statistical yearbook, the ratio of the total amount of post and telecommunications business in each province to the population at the end of the year in the region was used to characterize the variable. |
References
- Xi, J. Holds high the great banner of socialism with Chinese characteristics and unites to strive for the comprehensive construction of a modern socialist country: Report at the 20th National Congress of the Communist Party of China. People’s Daily, 16 October 2022; p. 1. [CrossRef]
- Zheng, J.; Peng, X. Does an Ecological Industry Chain Improve the Eco-Efficiency of an Industrial Cluster? Based on Empirical Study of an Energy-Intensive Industrial Cluster in China. Sustainability 2019, 11, 1651. [Google Scholar] [CrossRef] [Scilit]
- Tanaka, K.; Managi, S. Industrial Agglomeration Effect for Energy Efficiency in Japanese Production Plants. Energy Policy 2021, 156, 112442. [Google Scholar] [CrossRef] [Scilit]
- Zuoza, A.; Pilinkiene, V. Energy Efficiency and Carbon Emission Impact on Competitiveness in the European Energy Intensive Industries. Energies 2021, 14, 4700. [Google Scholar] [CrossRef] [Scilit]
- Lin, L.; Gu, T.; Shi, Y. The Influence of New quality productive on High-Quality Agricultural Development in China: Mechanisms and Empirical Testing. Agriculture 2024, 14, 1022. [Google Scholar] [CrossRef] [Scilit]
- Li, Y. Improve the resilience and security level of my country’s industrial and supply chains while accelerating the construction of a new development pattern. Econ. Perspect. 2023, 11, 51–58. [Google Scholar] [CrossRef]
- Liu, H.; Li, X. How Digital Technology Can Improve New quality productive?—Perspective of Total Factor Agricultural Carbon Productivity. J. Asian Econ. 2025, 98, 101921. [Google Scholar] [CrossRef] [Scilit]
- Xu, T.; Yang, G.; Chen, T. The Role of Green Finance and Digital Inclusive Finance in Promoting Economic Sustainable Development: A Perspective from New Quality Productivity. J. Environ. Manag. 2024, 370, 122892. [Google Scholar] [CrossRef] [Scilit]
- Liu, Y.; He, Z. Synergistic Industrial Agglomeration, New quality productive and High-Quality Development of the Manufacturing Industry. Int. Rev. Econ. Financ. 2024, 94, 103373. [Google Scholar] [CrossRef] [Scilit]
- Dogaru, L. The Main Goals of the Fourth Industrial Revolution. Renewable Energy Perspectives. In Proceedings of the 13TH International Conference Interdisciplinarity in Engineering (INTER-ENG 2019), Targu Mures, Romania, 3–4 October 2029; Moldovan, L., Gligor, A., Eds.; Elsevier Science: Amsterdam, The Netherlands, 2020; Volume 46, pp. 397–401. [Google Scholar] [CrossRef] [Scilit]
- Hong, Y.; Wang, K. Research on the resilience and security of industrial chain and supply chain from the perspective of new quality productivity. Econ. Res. 2024, 59, 4–14. [Google Scholar]
- Chu, H.; Niu, X.; Li, M.; Wei, L. Research on the Impact of New Quality Productivity on Enterprise ESG Performance. Int. Rev. Econ. Financ. 2025, 99, 104009. [Google Scholar] [CrossRef] [Scilit]
- Cao, X.; Lei, J.; Shi, D.; Yu, W.; Tao, T.; Zhang, X.; Wang, A. New Quality Productivity of Agriculture and Rural Areas at the Provincial Scale in China: Indicator Construction and Spatiotemporal Evolution. ISPRS Int. J. Geo-Inf. 2025, 14, 104. [Google Scholar] [CrossRef] [Scilit]
- Ye, L.; Fang, Z. The Impact of New-Quality Productivity on Environmental Pollution: Empirical Evidence from China. Sustainability 2025, 17, 3230. [Google Scholar] [CrossRef] [Scilit]
- Bowen, A.; Peiyuan, X.; Haihe, L.; Chuanlin, S. Statistical measurement and regional coordination characteristics analysis of China’s new energy productivity. Stat. Decis. Mak. 2025, 41, 29–34. [Google Scholar] [CrossRef]
- Zhang, J.; Zhang, Y. Research on Collaborative Performance of Green Supply Chain Enabled by New Quality Productivity. Sustainability 2025, 17, 3793. [Google Scholar] [CrossRef] [Scilit]
- Akhtar, P.; Ghouri, A.M.; Saha, M.; Khan, M.R.; Shamim, S.; Nallaluthan, K. Industrial Digitization, the Use of Real-Time Information, and Operational Agility: Digital and Information Perspectives for Supply Chain Resilience. IEEE Trans. Eng. Manag. 2024, 71, 10387–10397. [Google Scholar] [CrossRef] [Scilit]
- Zhao, N.; Hong, J.; Lau, K.H. Impact of Supply Chain Digitalization on Supply Chain Resilience and Performance: A Multi-Mediation Model. Int. J. Prod. Econ. 2023, 259, 108817. [Google Scholar] [CrossRef] [Scilit]
- Chen, X.; Ye, S. Influence of New Qualitative Productivity Forces on Quality-Effective Change in China’s Yangtze River Economic Belt Sports Industry: The Mediating Effect of Industry-University-Research Cooperation. PLoS ONE 2025, 20, e0319366. [Google Scholar] [CrossRef] [Scilit] [PubMed]
- Hussain, G.; Nazir, M.S.; Rashid, M.A.; Sattar, M.A. From Supply Chain Resilience to Supply Chain Disruption Orientation: The Moderating Role of Supply Chain Complexity. J. Enterp. Inf. Manag. 2023, 36, 70–90. [Google Scholar] [CrossRef] [Scilit]
- Hsieh, C.-C.; Chen, S.-L.; Huang, C.-C. Investigating the Role of Supply Chain Environmental Risk in Shaping the Nexus of Supply Chain Agility, Resilience, and Performance. Sustainability 2023, 15, 15003. [Google Scholar] [CrossRef] [Scilit]
- Bag, S.; Rahman, M.S.; Chan, H.-L.; Sharma, J. Effect of Supply Chain Flexibility and Supply Chain Endurance on Supply Chain Resilience in Extreme Weather Events: An Empirical Study. IEEE Trans. Eng. Manag. 2025, 72, 2150–2164. [Google Scholar] [CrossRef] [Scilit]
- Pu, G.; Qiao, W.; Feng, Z. Antecedents and Outcomes of Supply Chain Resilience: Integrating Dynamic Capabilities and Relational Perspective. J. Contingencies Crisis Manag. 2023, 31, 706–726. [Google Scholar] [CrossRef] [Scilit]
- Liu, Q.; Chen, R.; Yu, Q. Improving Sustainable Performance of China’s New Energy Industry through Collaborative Innovation Network Resilience. Renew. Sustain. Energy Rev. 2024, 201, 114625. [Google Scholar] [CrossRef] [Scilit]
- Zhao, R.; Li, X.; Wang, Y.; Xu, Z.; Xiong, M.; Jia, Q.; Li, F. Assessing Resilience of Sustainability to Climate Change in China’s Cities. Sci. Total Environ. 2023, 898, 165568. [Google Scholar] [CrossRef] [Scilit]
- Zhao, H.; Li, C.; Yang, Z.; Zhang, Z.; Jin, C.; Guo, S. How Can New Quality Productivity Decrease Carbon Emission Intensity? Evidence from 30 Provincial Regions in China. Energy 2025, 327, 136487. [Google Scholar] [CrossRef] [Scilit]
- Liu, Y.; Wang, J.; Ma, D.; Ding, J.; Peng, T. New Quality Productivity, Labor Quality and Corporate High-Quality Green Development. J. Environ. Manag. 2025, 395, 128018. [Google Scholar] [CrossRef] [Scilit] [PubMed]
- Zhang, L.; Fu, S.; Tian, J.; Peng, J. A Review of Energy Industry Chain and Energy Supply Chain. Energies 2022, 15, 9246. [Google Scholar] [CrossRef] [Scilit]
- Chen, Y.; Jiang, C.; Peng, L.; Zhao, S.; Chen, C. Digital Infrastructure Construction and Urban Industrial Chain Resilience: Evidence from the “Broadband China” Strategy. Sustain. Cities Soc. 2025, 121, 106228. [Google Scholar] [CrossRef] [Scilit]
- Qin, Q.; Yu, Y.; Liu, Y.; Zhou, J.; Chen, X. Industrial Agglomeration and Energy Efficiency: A New Perspective from Market Integration. Energy Policy 2023, 183, 113793. [Google Scholar] [CrossRef] [Scilit]
- Pan, K.; Liu, R.; Chen, X.; Huang, Y. How Does Industrial Agglomeration Affect Exports? Evidence from Chinese Province-Industry Panel Data. Sustainability 2023, 15, 9902. [Google Scholar] [CrossRef] [Scilit]
- Zhang, S.; Gu, C. Supply chain digitalization and supply chain resilience. Financ. Res. 2024, 50, 21–34. [Google Scholar] [CrossRef]
- Zhu, Y.; Zhang, W.; Wang, D.; Dou, S.; Xu, D. Evaluation of supply chain resilience of China’s copper resource industry chain. Resour. Sci. 2023, 45, 1761–1777. [Google Scholar]
- Huang, K.; Wang, K.; Lee, P.K.C.; Yeung, A.C.L. The Impact of Industry 4.0 on Supply Chain Capability and Supply Chain Resilience: A Dynamic Resource-Based View. Int. J. Prod. Econ. 2023, 262, 108913. [Google Scholar] [CrossRef] [Scilit]
- Laguir, I.; Modgil, S.; Gupta, S.; Kumar, S.; Stekelorum, R. Supply Chain Dynamism and Ambidexterity for Sustainable Performance. Prod. Plan. Control 2025, 36, 771–788. [Google Scholar] [CrossRef] [Scilit]
- Nickelsburg, J. Employment Dynamics in Local Labor Markets: Evidence from US Post Cold War Base Closures. Def. Peace Econ. 2020, 31, 990–1005. [Google Scholar] [CrossRef] [Scilit]
- Hotte, K.; Tarannum, T.; Verendel, V.; Bennett, L. Measuring Artificial Intelligence: A Systematic Assessment and Implications for Governance. Ind. Corp. Change 2025, 00, dtaf047. [Google Scholar] [CrossRef] [Scilit]
- Ma, C.; Ding, L. Empirical Research on Influential Factors of Air Pollution in Chinese Provincial Capital Cities. In Proceedings of the International Workshop on Green Energy, Environment and Sustainable Development; IoP Publishing Ltd.: Weihai, China, 2020; Volume 601. [Google Scholar] [CrossRef] [Scilit]
- Cosgrove, J.; Duarte, M.-J.R.; Littlewood, J.; Wilgeroth, P. An Energy Mapping Methodology to Reduce Energy Consumption in Manufacturing Operations. Proc. Inst. Mech. Eng. Part B-J. Eng. Manuf. 2018, 232, 1731–1740. [Google Scholar] [CrossRef] [Scilit]
- Li, L.; Jia, Y. The impact and mechanism of new productivity on supply chain resilience. Stat. Decis. Mak. 2025, 41, 104–108. [Google Scholar] [CrossRef]
- Li, X. New High-Quality Productivity Promotes the Improvement of Resilience in Logistics Industry: Role Mechanism and Empirical Analysis of Psychological Behavior. Psychol. Rep. 2025, 128, 97–99. [Google Scholar]
- Gu, Y.; Liu, W.; Wang, B.; Tian, B.; Yang, X.; Pan, C. Analysis and Prediction of Energy, Environmental and Economic Potentials in the Iron and Steel Industry of China. Processes 2023, 11, 3258. [Google Scholar] [CrossRef] [Scilit]
- Yuan, F.; Zhang, K.; Qiu, A. The impact mechanism of digital economy on the resilience of intelligent manufacturing industry chain—An empirical test based on China’s provincial panel data. Sci. Technol. Manag. Res. 2025, 45, 107–116. [Google Scholar]
- Liu, X.; Zuo, L.; Hu, L.; Wang, C.; Sheng, S. Industrial Agglomeration, Environmental Regulation, and Carbon Emissions Reduction under the Carbon Neutrality Goal: Threshold Effects Based on Stages of Industrialization in China. J. Clean. Prod. 2024, 434, 140064. [Google Scholar] [CrossRef] [Scilit]
- Zhou, N.; Shi, Q.; Ye, J. Industrial Co-Agglomeration, Human Capital Upgrading, and Supply Chain Efficiency. Financ. Res. Lett. 2025, 86, 108833. [Google Scholar] [CrossRef] [Scilit]
- Jin, T.; Dang, C. Research on the mechanism of digital economy improving regional energy efficiency-based on the perspective of new productivity development. Soc. Sci. Front. 2025, 5, 244–252. [Google Scholar]
- Zhong, Z.; Chen, Z. Urbanization, Green Development and Residents’ Happiness: The Moderating Role of Environmental Regulation. Environ. Impact Assess. Rev. 2022, 97, 106900. [Google Scholar] [CrossRef] [Scilit]
- Hu, J.; Chen, H.; Zhang, J. The Impact of Artificial Intelligence on Chinese Provincial Innovation Resilience: The Moderating Roles of Big Data Development and Scientific and Technical Human Capital. Appl. Econ. Lett. 2025, 32, 1060–1067. [Google Scholar] [CrossRef] [Scilit]
- Huang, T.; Yang, L.; Liu, Y.; Liu, H. Dutch Disease Revisited: China’s Provincial Data Perspective with the Role of Green Finance and Technology Peak. Resour. Policy 2023, 83, 103748. [Google Scholar] [CrossRef] [Scilit]
- Jiang, Q.; Zhang, X.; Lin, Q.; Chen, G.; Zhang, R.; Liu, S. Internet Penetration and Regional Financial Development in China: Empirical Evidence Based on Chinese Provincial Panel Data. Sci. Program. 2020, 2020, 1–14. [Google Scholar] [CrossRef] [Scilit]

Disclaimer/Publisher’s Note: The statements, opinions and data contained in all publications are solely those of the individual author(s) and contributor(s) and not of MDPI and/or the editor(s). MDPI and/or the editor(s) disclaim responsibility for any injury to people or property resulting from any ideas, methods, instructions or products referred to in the content. |
© 2026 by the authors. Licensee MDPI, Basel, Switzerland. This article is an open access article distributed under the terms and conditions of the Creative Commons Attribution (CC BY) license.