


Abstract
The ecological benefits of urban green spaces depend on their structure and ecological service function. Evaluation systems used to monitor these characteristics show distinct regional variations. This study analyzed China’s urban green spaces, developed a quantitative ecological benefit evaluation system, and comprehensively evaluated the ecological benefits of green spaces in Xi’an city. Suitable evaluation indexes for Xi’an were selected based on field survey data with large-scale samples and high-resolution remote sensing image data. The results showed that the ecological service function of urban green spaces in Xi’an has been substantially improved by ecological planning. Therefore, it is important to evaluate this function as part of the urban planning and design process. Furthermore, increasing the 3D Green Quantity through urban forests can effectively improve the ecological service function.
1. Introduction
With the rapid acceleration of global urbanization and the intensification of land development, urban spatial patterns and environmental quality have undergone profound changes. Rapid population agglomeration, increasing building density, and rising energy consumption have collectively contributed to a widespread decline in urban ecosystem services [1,2]. As a vital component of urban ecosystems, Urban Green Space (UGS) is widely recognized as a key pathway for mitigating these environmental challenges, enhancing residents’ quality of life, and promoting urban livability [3,4]. A substantial body of research has demonstrated that well-configured UGS can not only improve the local urban microclimate and alleviate the Urban Heat Island (UHI) effect but also deliver multiple ecosystem services, including carbon sequestration, oxygen release, particulate matter retention, noise reduction, hydrological regulation, and the promotion of physical and mental health [5,6,7,8]. Consequently, the scientific and objective assessment of UGS ecological benefits has become a central topic in urban ecology and sustainable urban planning.
Current evaluations of UGS ecological benefits predominantly rely on two-dimensional (2D) indicator systems, such as green coverage rate, per capita green space area, service radius of public green space, and forest coverage rate [9,10,11]. Although these indicators are useful for characterizing the scale and spatial distribution of green spaces, they often fail to capture the complexity of internal structural characteristics and variations in vegetation biomass. As a result, they provide only a partial representation of the actual contributions of green spaces to the urban ecological environment. In recent years, with advances in 3S technologies (Remote Sensing, Geographic Information Systems, and Global Positioning Systems), along with the increasing availability of high-resolution remote sensing imagery and LiDAR data, researchers have sought to overcome the limitations of traditional 2D metrics. By incorporating the three-dimensional (3D) structure of green spaces into evaluation frameworks, scholars aim to more accurately and comprehensively characterize urban ecological functions [12,13,14]. Three-dimensional Green Volume (3DGV) offers an intuitive representation of vegetation canopy stratification, volumetric structure, and biomass. It is closely associated with carbon sequestration and oxygen release and is also directly linked to UHI mitigation, air purification, and biodiversity conservation [15].
In recent years, an increasing number of studies have advanced the assessment of carbon sequestration, structure–function relationships, and ecosystem service values by integrating methods such as the Analytic Hierarchy Process (AHP), Polygon Synthetic Indicator methods, the Full Permutation Polygon Synthetic Indicator (FPPSI), Principal Component Analysis (PCA), the i-Tree Eco model, and Green City Models [16,17,18,19,20,21,22]. Among these methods, the Analytic Hierarchy Process (AHP) is widely used due to its clear hierarchical structure [23]; however, it relies heavily on expert judgment for weight assignment, which may introduce subjectivity and inconsistency, especially when applied to multi-indicator ecological assessments across different periods. In contrast, the Full Permutation Polygon Synthetic Indicator (FPPSI) method does not require predefined indicator weights. Instead, it evaluates the comprehensive performance of multiple indicators based on geometric synthesis and standardized reference values, thereby reducing subjectivity and enhancing comparability among indicators and time stages [24]. This methodological advantage makes FPPSI particularly suitable for long-term and multi-dimensional evaluation of urban green space ecological benefits. Moreover, a growing body of comparative studies in urban ecological and sustainability assessment has explicitly contrasted FPPSI with conventional methods such as AHP and PCA. These studies consistently demonstrate that FPPSI outperforms weight-dependent or dimension-reduction approaches in terms of result stability, inter-temporal comparability, and sensitivity to limiting indicators, particularly in complex multi-indicator evaluation systems. By avoiding expert-driven weighting and preserving the physical interpretability of individual indicators, FPPSI has been shown to provide more robust and diagnostically meaningful assessment outcomes in urban environmental and green space evaluations [25,26]. Parallel to these methodological optimizations, the focus of urban ecological research has increasingly shifted towards quantifying the “3D Green Quantity” and vegetation structure to capture the actual ecological capacity more accurately. For instance, Intasen et al. [27] applied the i-Tree Eco software in 2017 to evaluate the structure, function, and value of Bangkok’s urban forest, revealing that its 48 dominant tree species sequester approximately 16,271 metric tons of CO2 annually and play a significant role in improving local environmental quality. Similarly, Song et al. [28], in a study of cities in Central China, compared the ecosystem service performance of park, street, and residential green spaces, demonstrating that differences in spatial configuration among green space types directly determine variations in carbon storage and pollutant removal efficiency, thereby compensating for the limitations of single aggregated assessments. Subsequently, related research has expanded across cities of different scales and climatic contexts, increasingly linking internal green space structural characteristics and plant configuration patterns to ecological functions. Taking urban parks in Beijing as an example, studies have shown that plant species diversity, vegetation density, and spatial arrangement significantly influence carbon sequestration potential, highlighting the importance of structural optimization in enhancing ecological benefits [29]. In terms of data acquisition, advances in remote sensing and LiDAR technologies have enabled more accurate estimation of 3DGV, effectively addressing the limitations of traditional 2D indicators in representing vertical canopy structure [30]. Meanwhile, carbon storage estimation has become increasingly refined with respect to spatial resolution and scale selection. Recent studies indicate that the choice of spatial scale can substantially affect estimation accuracy and uncertainty [31]. At the level of comprehensive evaluation systems, attempts have also been made to integrate ecological structure, ecological function, and socio-economic indicators. For instance, a case study focusing on cities in Northern China proposed a new integrated evaluation framework and conducted empirical validation [32]. Furthermore, particularly in the post-2023 era, the integration of Artificial Intelligence (AI) and multi-source data fusion has emerged as a research frontier. Recent studies have successfully employed machine learning algorithms to extract vegetation vertical structure from street-view imagery, significantly improving the granularity of micro-scale analysis [33]. However, while these AI-driven methods offer high precision for current state assessment, they are often constrained by the lack of historical training data, making them difficult to apply to long-term retrospective studies spanning decades. Nevertheless, despite these advances in incorporating 3D information, notable challenges remain in methodological systems, indicator integration, and applicability verification. In particular, many existing comprehensive evaluation approaches rely heavily on expert-based weighting schemes, which may introduce subjective bias. In addition, the lack of multi-temporal datasets in some studies limits the ability to reveal the dynamic evolution of UGS ecological benefits.
As a key central city in Northwest China, Xi’an has experienced rapid urbanization and spatial expansion in recent decades. Population growth and the continuous expansion of construction land have placed increasing pressure on green space resources, posing significant challenges to urban ecosystem service provision. In this context, several studies have explored the ecological functions and spatial characteristics of urban green spaces in Xi’an from different perspectives. Li et al. [34] analyzed the spatiotemporal changes in ecosystem services along an urban–rural–natural gradient, emphasizing the influence of land-use transitions on ecosystem service supply. Peng et al. [35] further examined the spatiotemporal patterns and equity of ecosystem services provided by urban green spaces in the Xi’an metropolitan area, focusing on differences across urban–rural gradients. Kong et al. [36] investigated the impact of blue–green space landscape pattern evolution on the cooling effect in Xi’an’s central urban area, highlighting the role of landscape configuration in mitigating urban heat. Pang et al. [37] assessed the optimal scale of urban green space in Xi’an by analyzing area-based indicators and their relationships with ecological performance.
To address these gaps, this study constructs a comprehensive evaluation framework for UGS ecological benefits that integrates both 2D and 3D indicators, drawing on insights from existing domestic and international research. Methodologically, high-resolution remote sensing imagery is combined with field-based LiDAR point cloud data, and the Full Permutation Polygon Synthetic Indicator (FPPSI) method is employed to quantitatively evaluate UGS ecological benefits. This approach avoids the subjectivity associated with weight assignment in traditional AHP-based methods and, by incorporating the 3DGV indicator, enables a more comprehensive representation of green space ecosystem service functions. Using UGS data from Xi’an between 2005 and 2020 as a case study, this research systematically evaluates the temporal evolution of ecological benefits and further explores the added value of 3DGV in revealing ecosystem services. The results provide a scientific basis for urban ecological planning and green space management in Xi’an and offer a transferable methodological reference for assessing UGS ecological benefits in other rapidly urbanizing regions.
At the level of policy practice, the local policy framework issued by Xi’an in recent years has increasingly prioritized ecological restoration and green infrastructure enhancement, aligning closely with the environmental objectives of this study. Specifically, the “Xi’an Land Space Ecological Protection and Restoration Planning (2021–2035)”, jointly released by the Xi’an Municipal Bureau of Natural Resources and Planning and other departments, clarifies the overarching goals for citywide ecological protection [38]. The plan calls for the integrated conservation of “mountains, rivers, forests, farmlands, lakes, grasslands, and sands” and the construction of a multi-corridor, multi-patch ecological network to enhance ecosystem services and landscape connectivity. Furthermore, it sets specific targets for improving forest quality and coverage, strengthening wetland protection, and advancing urban-rural ecological restoration projects. With clearly defined phased quantitative indicators for 2025 and 2035, this planning framework directly supports initiatives to strengthen the urban internal green space structure and ecological service capacity. This policy context reflects Xi’an’s commitment to improving ecological quality and provides a realistic basis for assessing the long-term evolution of urban 3D Green Quantity and related ecosystem services.
To strictly guide the data analysis and validate the quantitative relationship between vegetation structure and ecological service capacity, this study proposes the following core research hypothesis: Hypothesis 1 (H1): There is a significant positive correlation between the per capita 3D Green Quantity and the comprehensive ecological benefit score. This hypothesis implies that 3D Green Quantity, as a volumetric indicator, serves as a determinant factor for the overall ecological performance of urban green spaces.
2. Methodology
2.1. Study Area
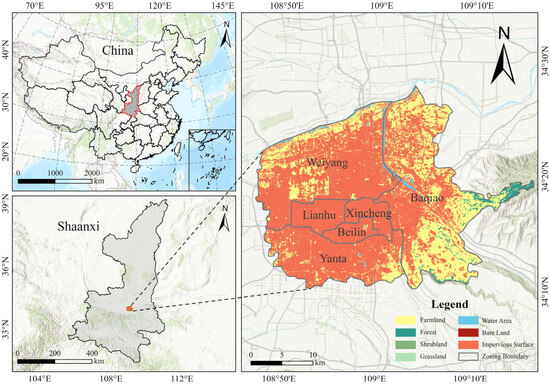
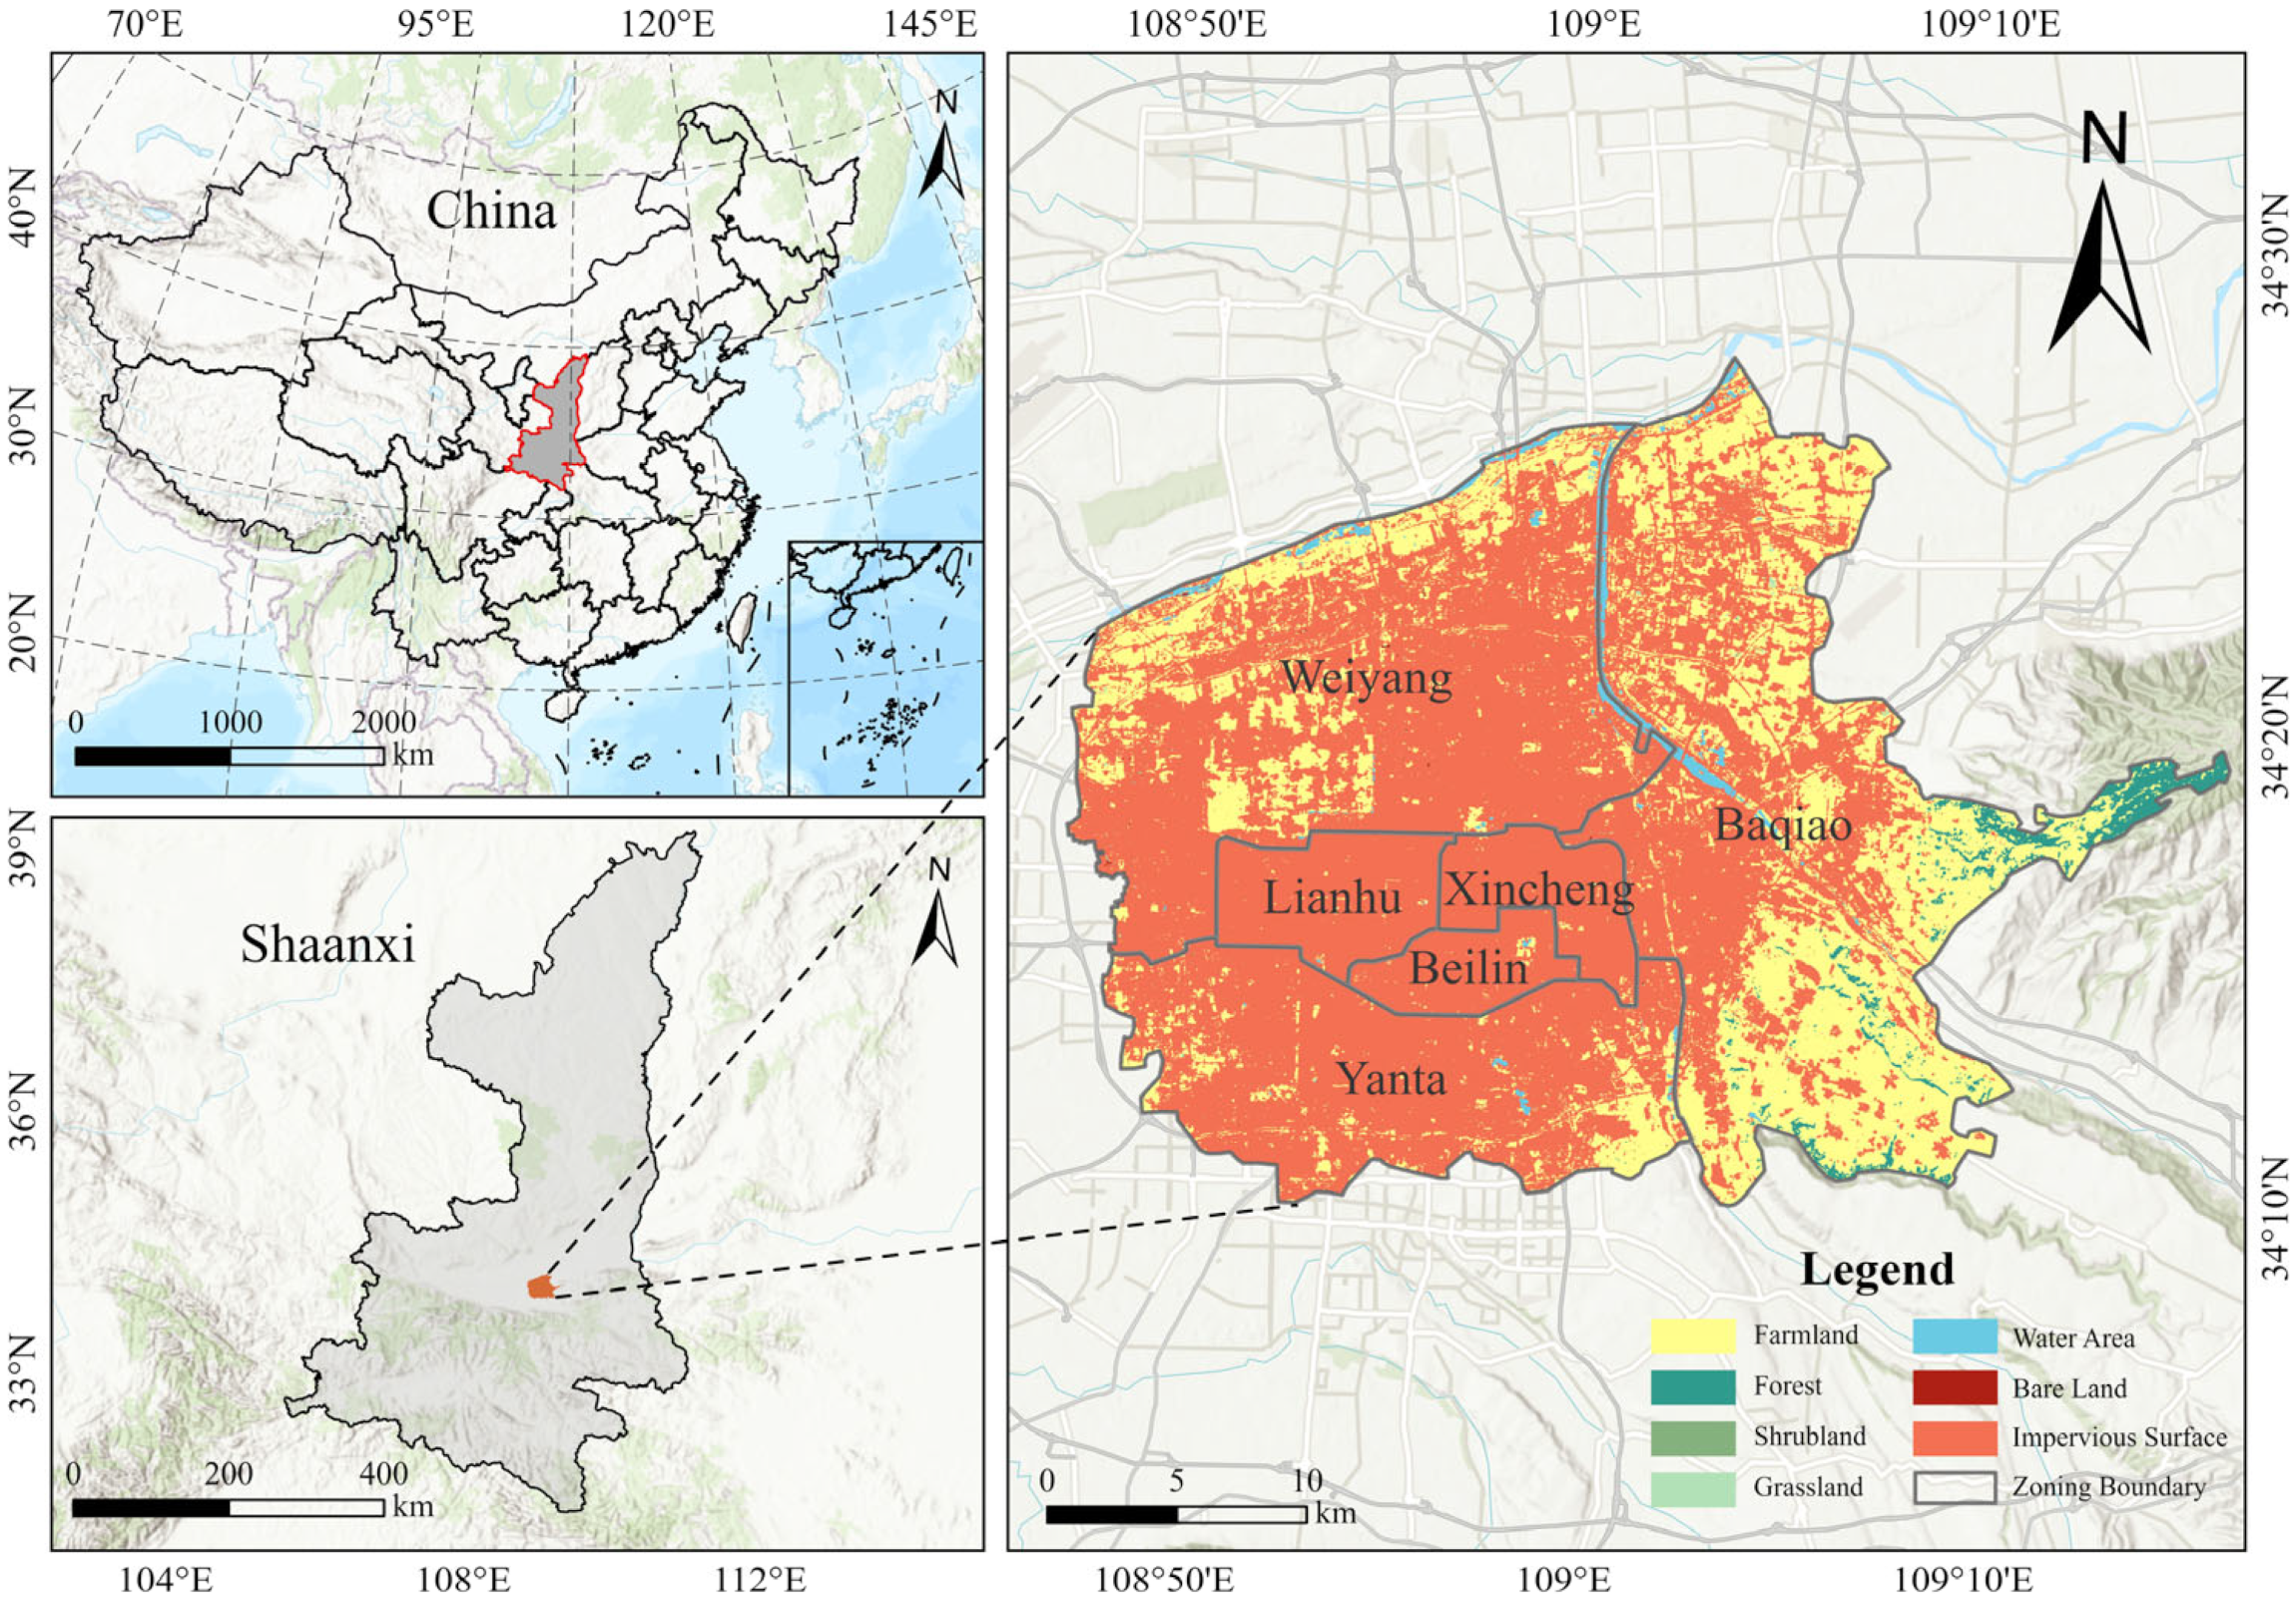
Xi’an (33°42′–34°45′ N, 107°40′–109°49′ E) is located in the hinterland of the Guanzhong Plain in Northwest China. The region experiences a warm temperate semi-humid continental monsoon climate characterized by distinct seasons. The average elevation is approximately 424 m, with an annual mean temperature of 13.3 °C, annual precipitation of 604.2 mm, and relative humidity of 69.6%. The local vegetation is diverse, featuring a mix of relict species and long-standing cultivated flora, exhibiting distinct vertical zonation in the mountainous regions. Administratively, Xi’an covers a total area of 10,108 km2, comprising 11 districts and 2 counties. This study focuses specifically on the central urban core, consisting of six districts: Beilin, Yanta, Xincheng, Weiyang, Lianhu, and Baqiao (Figure 1), which span a combined area of 822.28 km2. As of 2018, the total population of Xi’an reached approximately 9.23 million, with an urban population of 7.26 million. This rapid population agglomeration has exerted significant anthropogenic pressure on the local resources and urban ecosystems.
Figure 1.
Geographic delineation and location of study area.
2.2. Methods
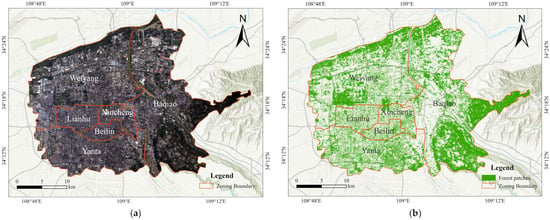
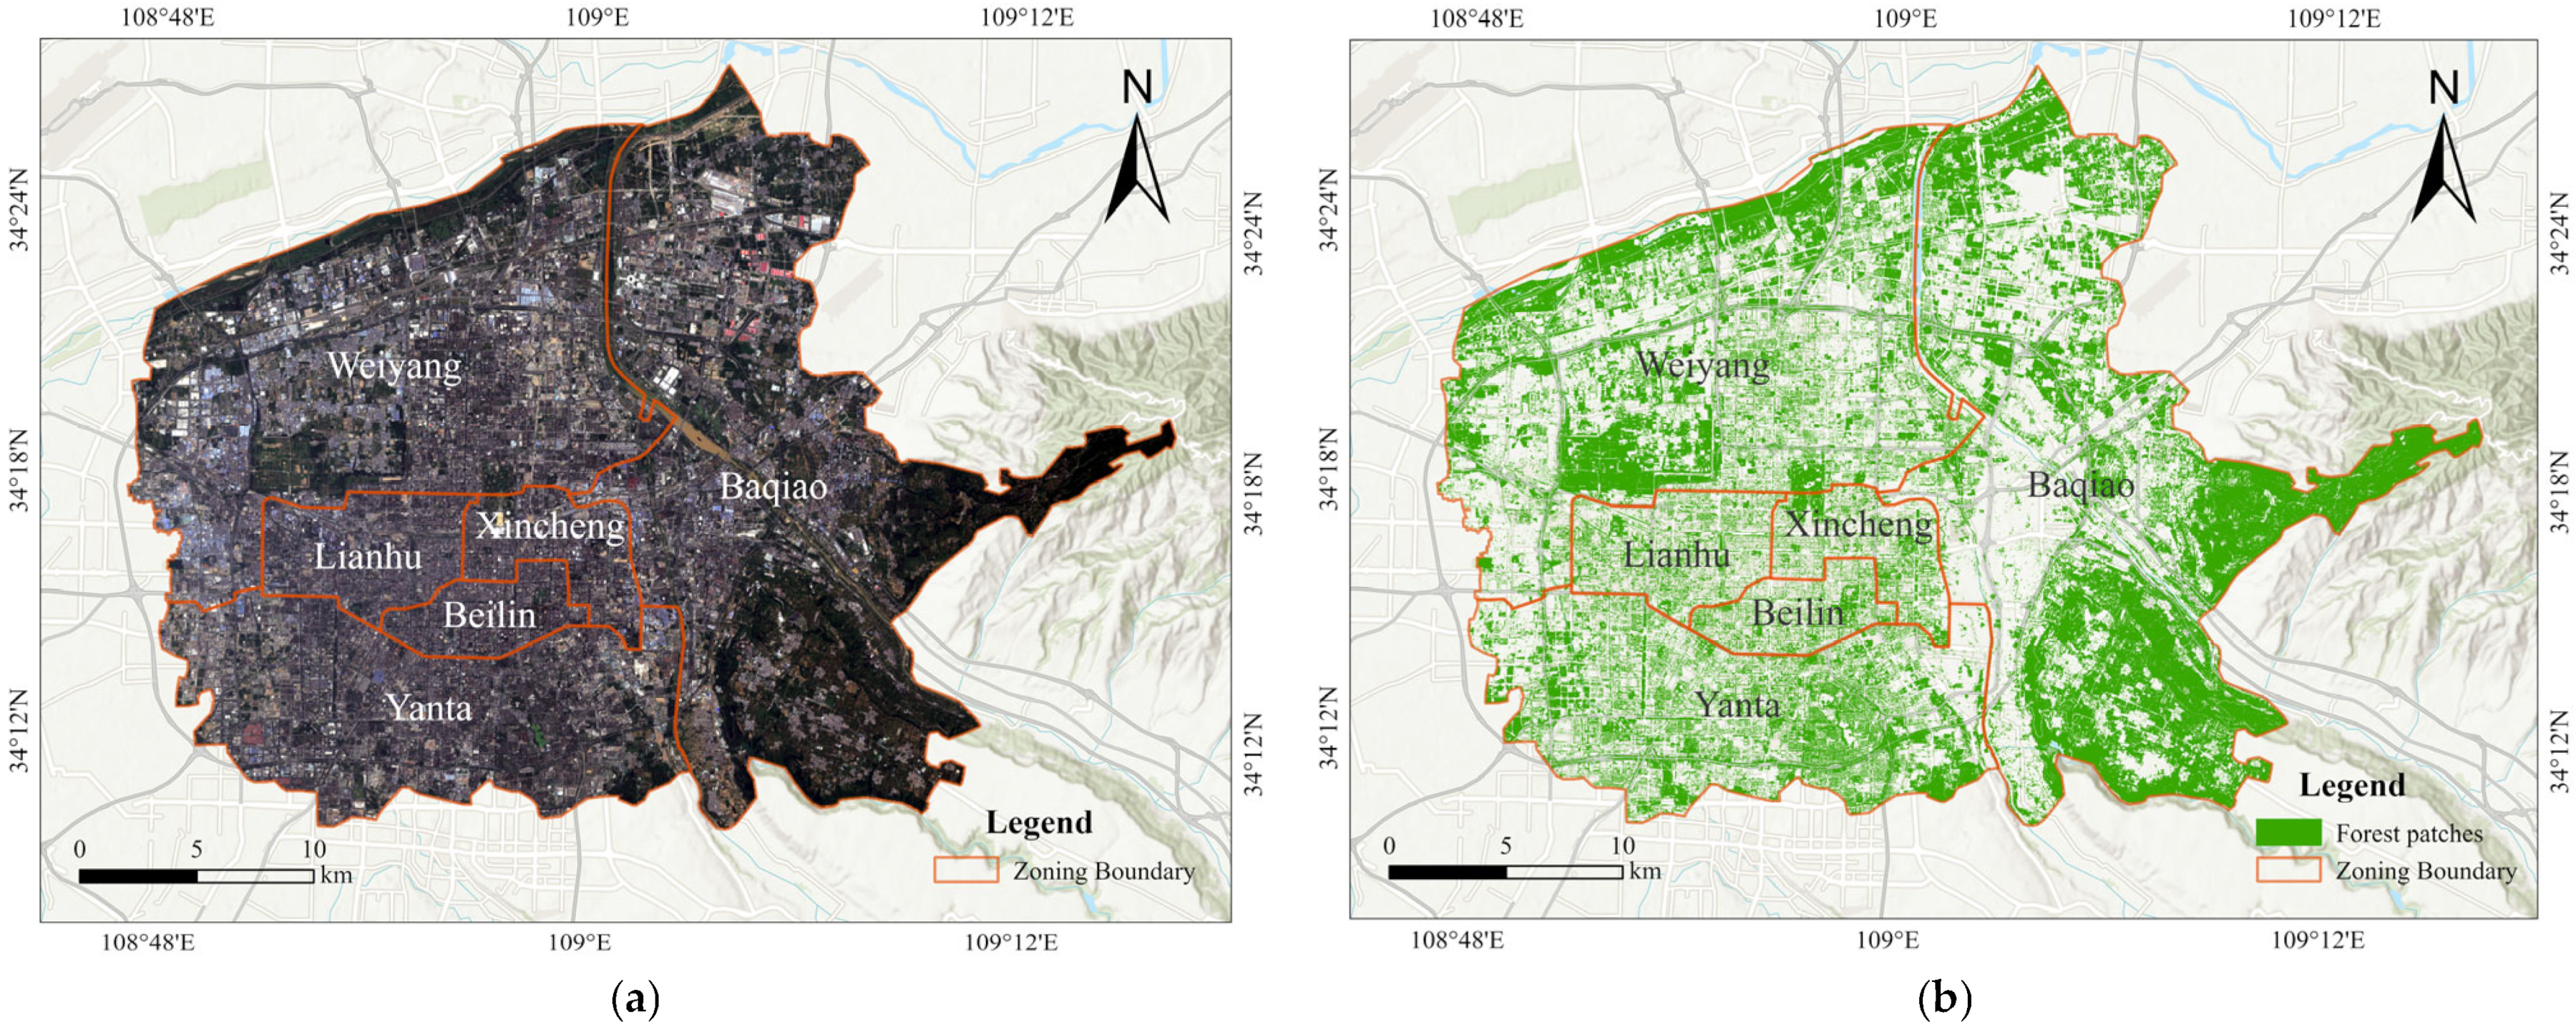
In this study, Xi’an, in China, was selected as a real-world example with reference to relevant Chinese and international studies, the theory of social–economic–natural complex ecosystems, and ecological planning principles [39]. A comprehensive evaluation index system for the ecological benefits of urban green spaces in Xi’an was constructed across three levels (I–III), and the ecological benefits were evaluated. Data regarding the green coverage were extracted from high-resolution RS images, and multi-scale segmentation was performed on an image showing the main urban area of Xi’an (Figure 2) using the RS software eCognition 8.9. Subsequently, data on the green spaces in the city were extracted and classified. Figure 2 shows the distribution of forests in the main urban area of Xi’an. High-accuracy sample land data were measured using a 3D laser scanner (Leica C10, Heerbrugg, Switzerland), and 3S technologies (GIS, RS, and global positioning system) were combined to quantitatively analyze the ecological evaluation index.
Figure 2.
Remote sensing imagery and forest distribution in the main urban area of Xi’an. (a) Remote-sensing image of the main urban area of Xi’an, China; (b) forest distribution in the urban area of Xi’an.
In addition, 3D laser-scanned point cloud data were used to build an estimation model via a differential method to estimate the green quantity of a single tree. The 3D green quantity per unit area was calculated based on the 3D green quantity and area of the sample plots. By computing the stereo quantity with stereo data, all 3D green quantities were calculated for the main urban area of Xi’an, its traffic routes, scenic sites, residential areas, cultural and educational areas, and industrial areas. Based on the 3D green quantity of urban forest vegetation, the quantitative research methods of Zhou et al. [40] and Zhou Y. and Zhou J. [41] were used to estimate the environmental benefits of green spaces in the main urban area of Xi’an.
2.3. Field Data Collection and Laboratory Data Processing
Due to the lack of direct three-dimensional vegetation measurements (e.g., LiDAR) in earlier years, the 3D Green Quantity for 2005 and 2010 was estimated using a regression-based inversion approach. This method relies on the well-established allometric correlation between spectral vegetation indices (derived from Landsat) and vegetation structural parameters (e.g., volume and biomass), a technique widely validated in long-term ecological monitoring [42,43]. Specifically, vegetation structural parameters derived from Landsat 5 and Landsat 7 imagery—including NDVI, canopy coverage, and land-use information—served as proxies to approximate vegetation volume at the spatial unit level. Field survey data collected in 2015 were utilized to calibrate key structural coefficients related to tree height and crown extent for dominant vegetation types. These calibrated regression models were then consistently applied to the multi-temporal remote sensing data for 2005, 2010, and 2020. This unified framework ensures methodological consistency and enables valid temporal comparison of 3D Green Quantity and per capita 3D Green Quantity, mitigating the impact of disparate data sources. Based on the above calculation framework, 3D Green Quantity was first obtained for different types of urban green spaces at the spatial unit level. To further reflect the availability of three-dimensional vegetation resources from a population perspective, the per capita 3D Green Quantity was subsequently calculated. The calculation formula is expressed as follows:
where D is the per capita 3D Green Quantity, Gi is the 3D Green Quantity of each type of urban green space, and P is the total urban population.
The field survey was conducted during the peak vegetation growing season, from June to September 2015, to minimize seasonal bias. The investigation was carried out by a research team of six trained professionals, divided into three groups. To ensure inter-rater reliability and data consistency, all surveyors underwent unified training prior to fieldwork. Furthermore, a blind re-measurement protocol was implemented for quality control, in which 5% of the sample plots were randomly selected for re-investigation by a supervisor group. Measurement errors for key parameters, including tree height and crown width, were strictly controlled within 5%, confirming a high level of consistency among different surveyors. These rigorously validated field measurements served as ground truth data to calibrate the 3D Green Quantity calculations and to validate the effectiveness of the vegetation extraction and non-vegetation masking procedures (e.g., exclusion of buildings and debris), thereby ensuring the overall reliability of the dataset.
The locations of the field investigation sites and the number of quadrats were determined through a stratified random sampling strategy based on the spatial distribution and functional types of urban green spaces in Xi’an. First, urban green spaces were classified into parks, roads, residential areas, cultural and educational areas, and industrial areas according to land-use data and field reconnaissance. Within each category, candidate sampling locations were generated using a GIS-based random point generator and subsequently screened to ensure accessibility and safety for field measurements, while avoiding edge effects and highly disturbed sites.
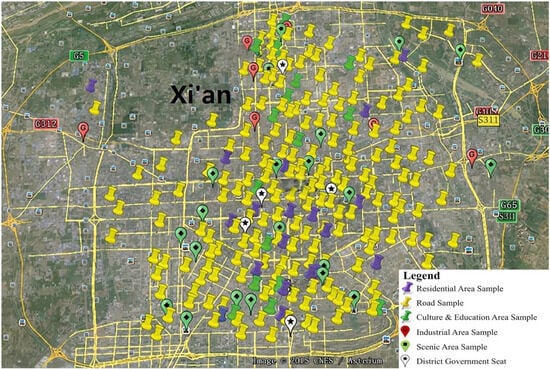
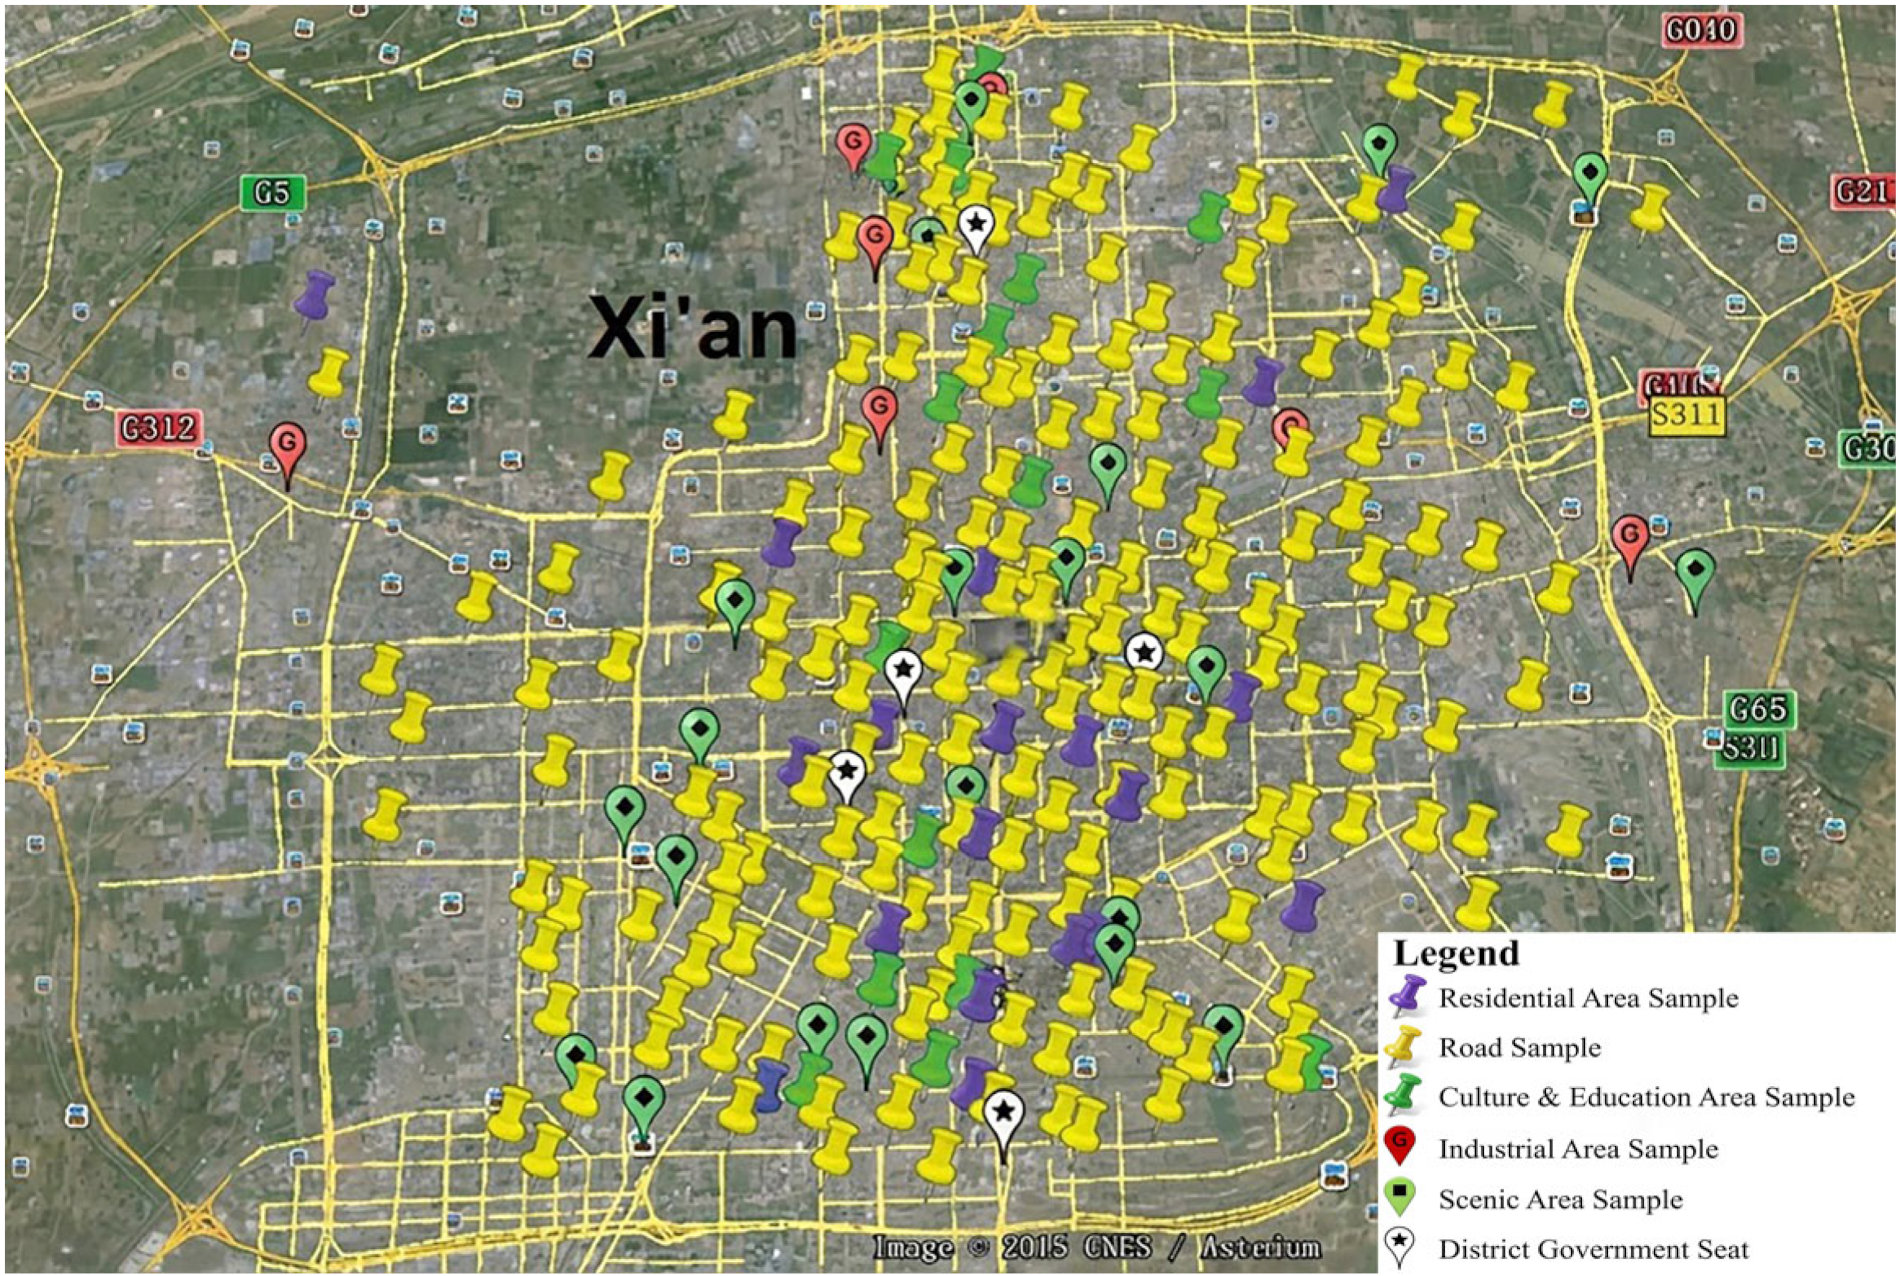
Park quadrats were defined as 20 × 20 m plots, with a minimum distance of 150 m between adjacent quadrats to reduce spatial autocorrelation. A total of 40 quadrats from 20 representative parks were surveyed, covering major park types and size classes in the main urban area. The relatively larger number of road quadrats (140 quadrats from 113 roads, each 100 × 10 m) was adopted to capture the high spatial heterogeneity and linear continuity of roadside vegetation, which exhibits greater variability in planting structure and management intensity compared to other green space types. Residential quadrats included a residential building and its surrounding street trees and green belts; quadrat areas were determined according to in situ conditions, resulting in 23 quadrats across 23 residential areas. School quadrats were defined using the same criteria as park quadrats, with 31 quadrats surveyed across 18 schools. Industrial quadrats were defined as 20 × 20 m plots, and six quadrats from six industrial areas were investigated. The sample sizes for different green space types were determined by balancing statistical representativeness, spatial coverage, and fieldwork feasibility, and are comparable to or exceed those used in similar urban green space structural surveys. Crucially, this sampling strategy ensured comprehensive coverage across all six administrative districts of Xi’an’s main urban area and typologically encompassed all core green space categories. By capturing diverse vegetation compositions and planting densities, these sample plots truly reflect the overall structural characteristics of Xi’an’s urban vegetation. Therefore, this highly representative in situ dataset provides a reliable basis for the calibration of long-term 3D Green Quantity. Field-derived parameters were subsequently integrated with spatial data to extrapolate Three-dimensional Green Quantity to the entire study area through spatial aggregation within corresponding land-use units. The spatial distribution of all sampling points is shown in Figure 3.
Figure 3.
Sample layout map.
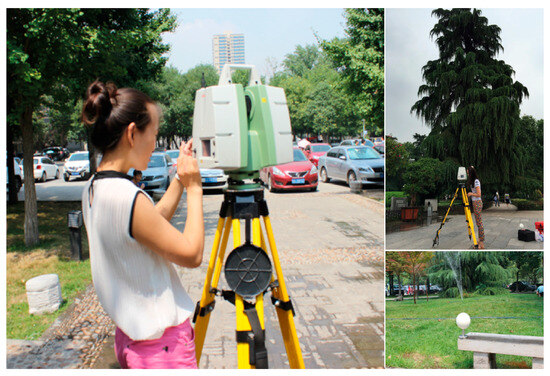
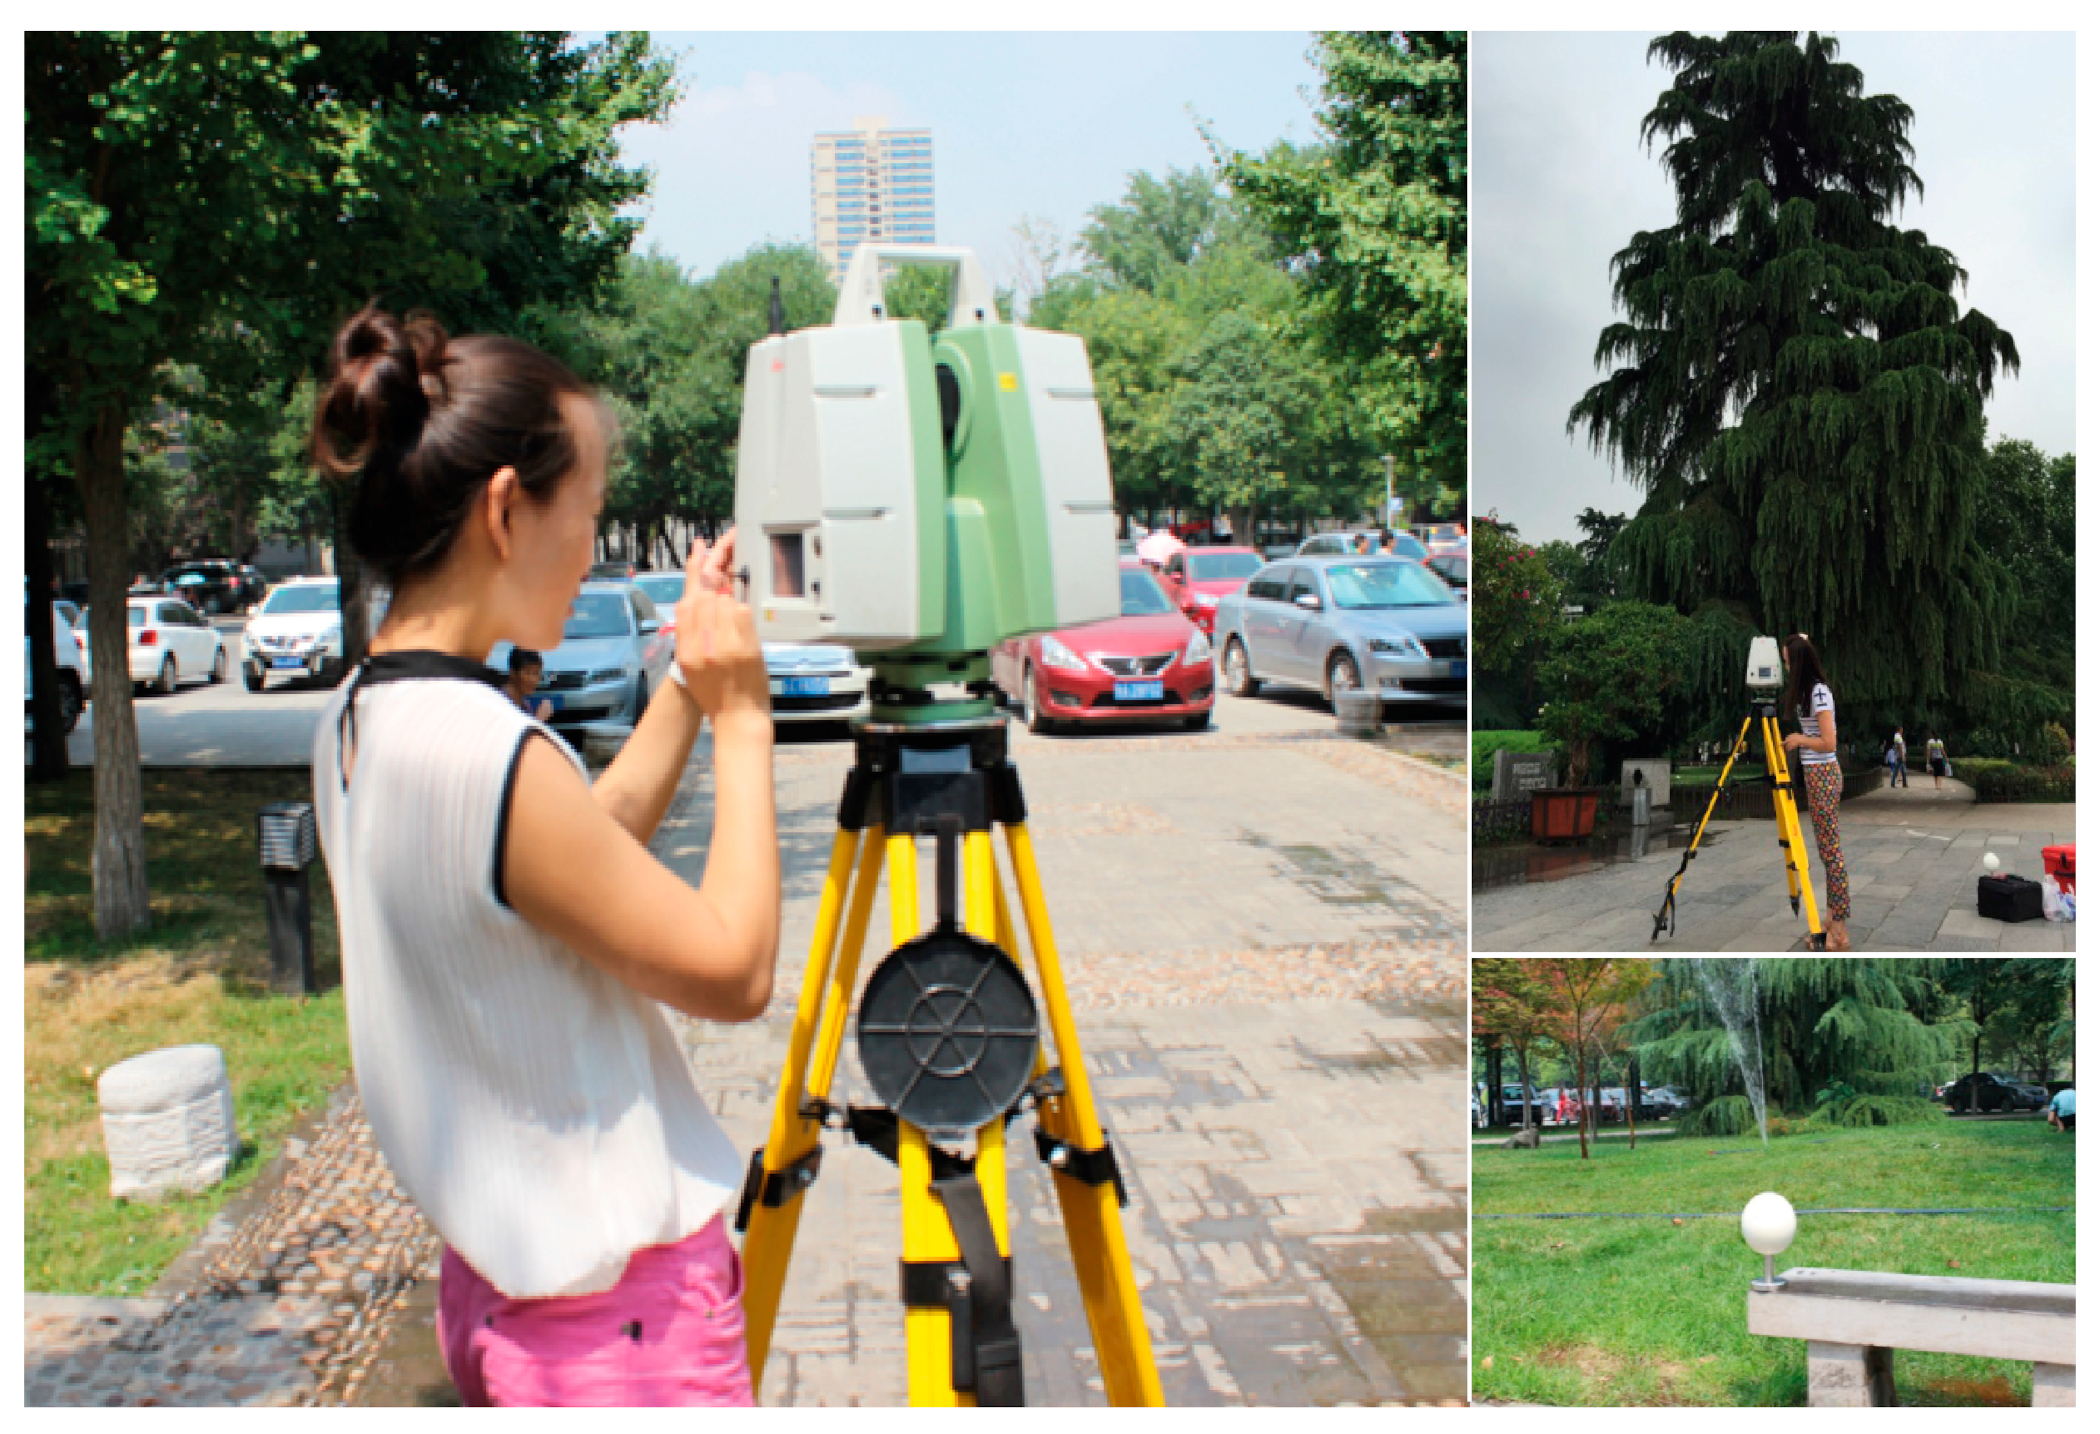
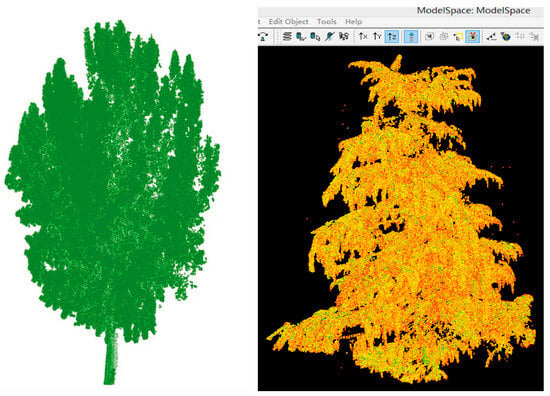
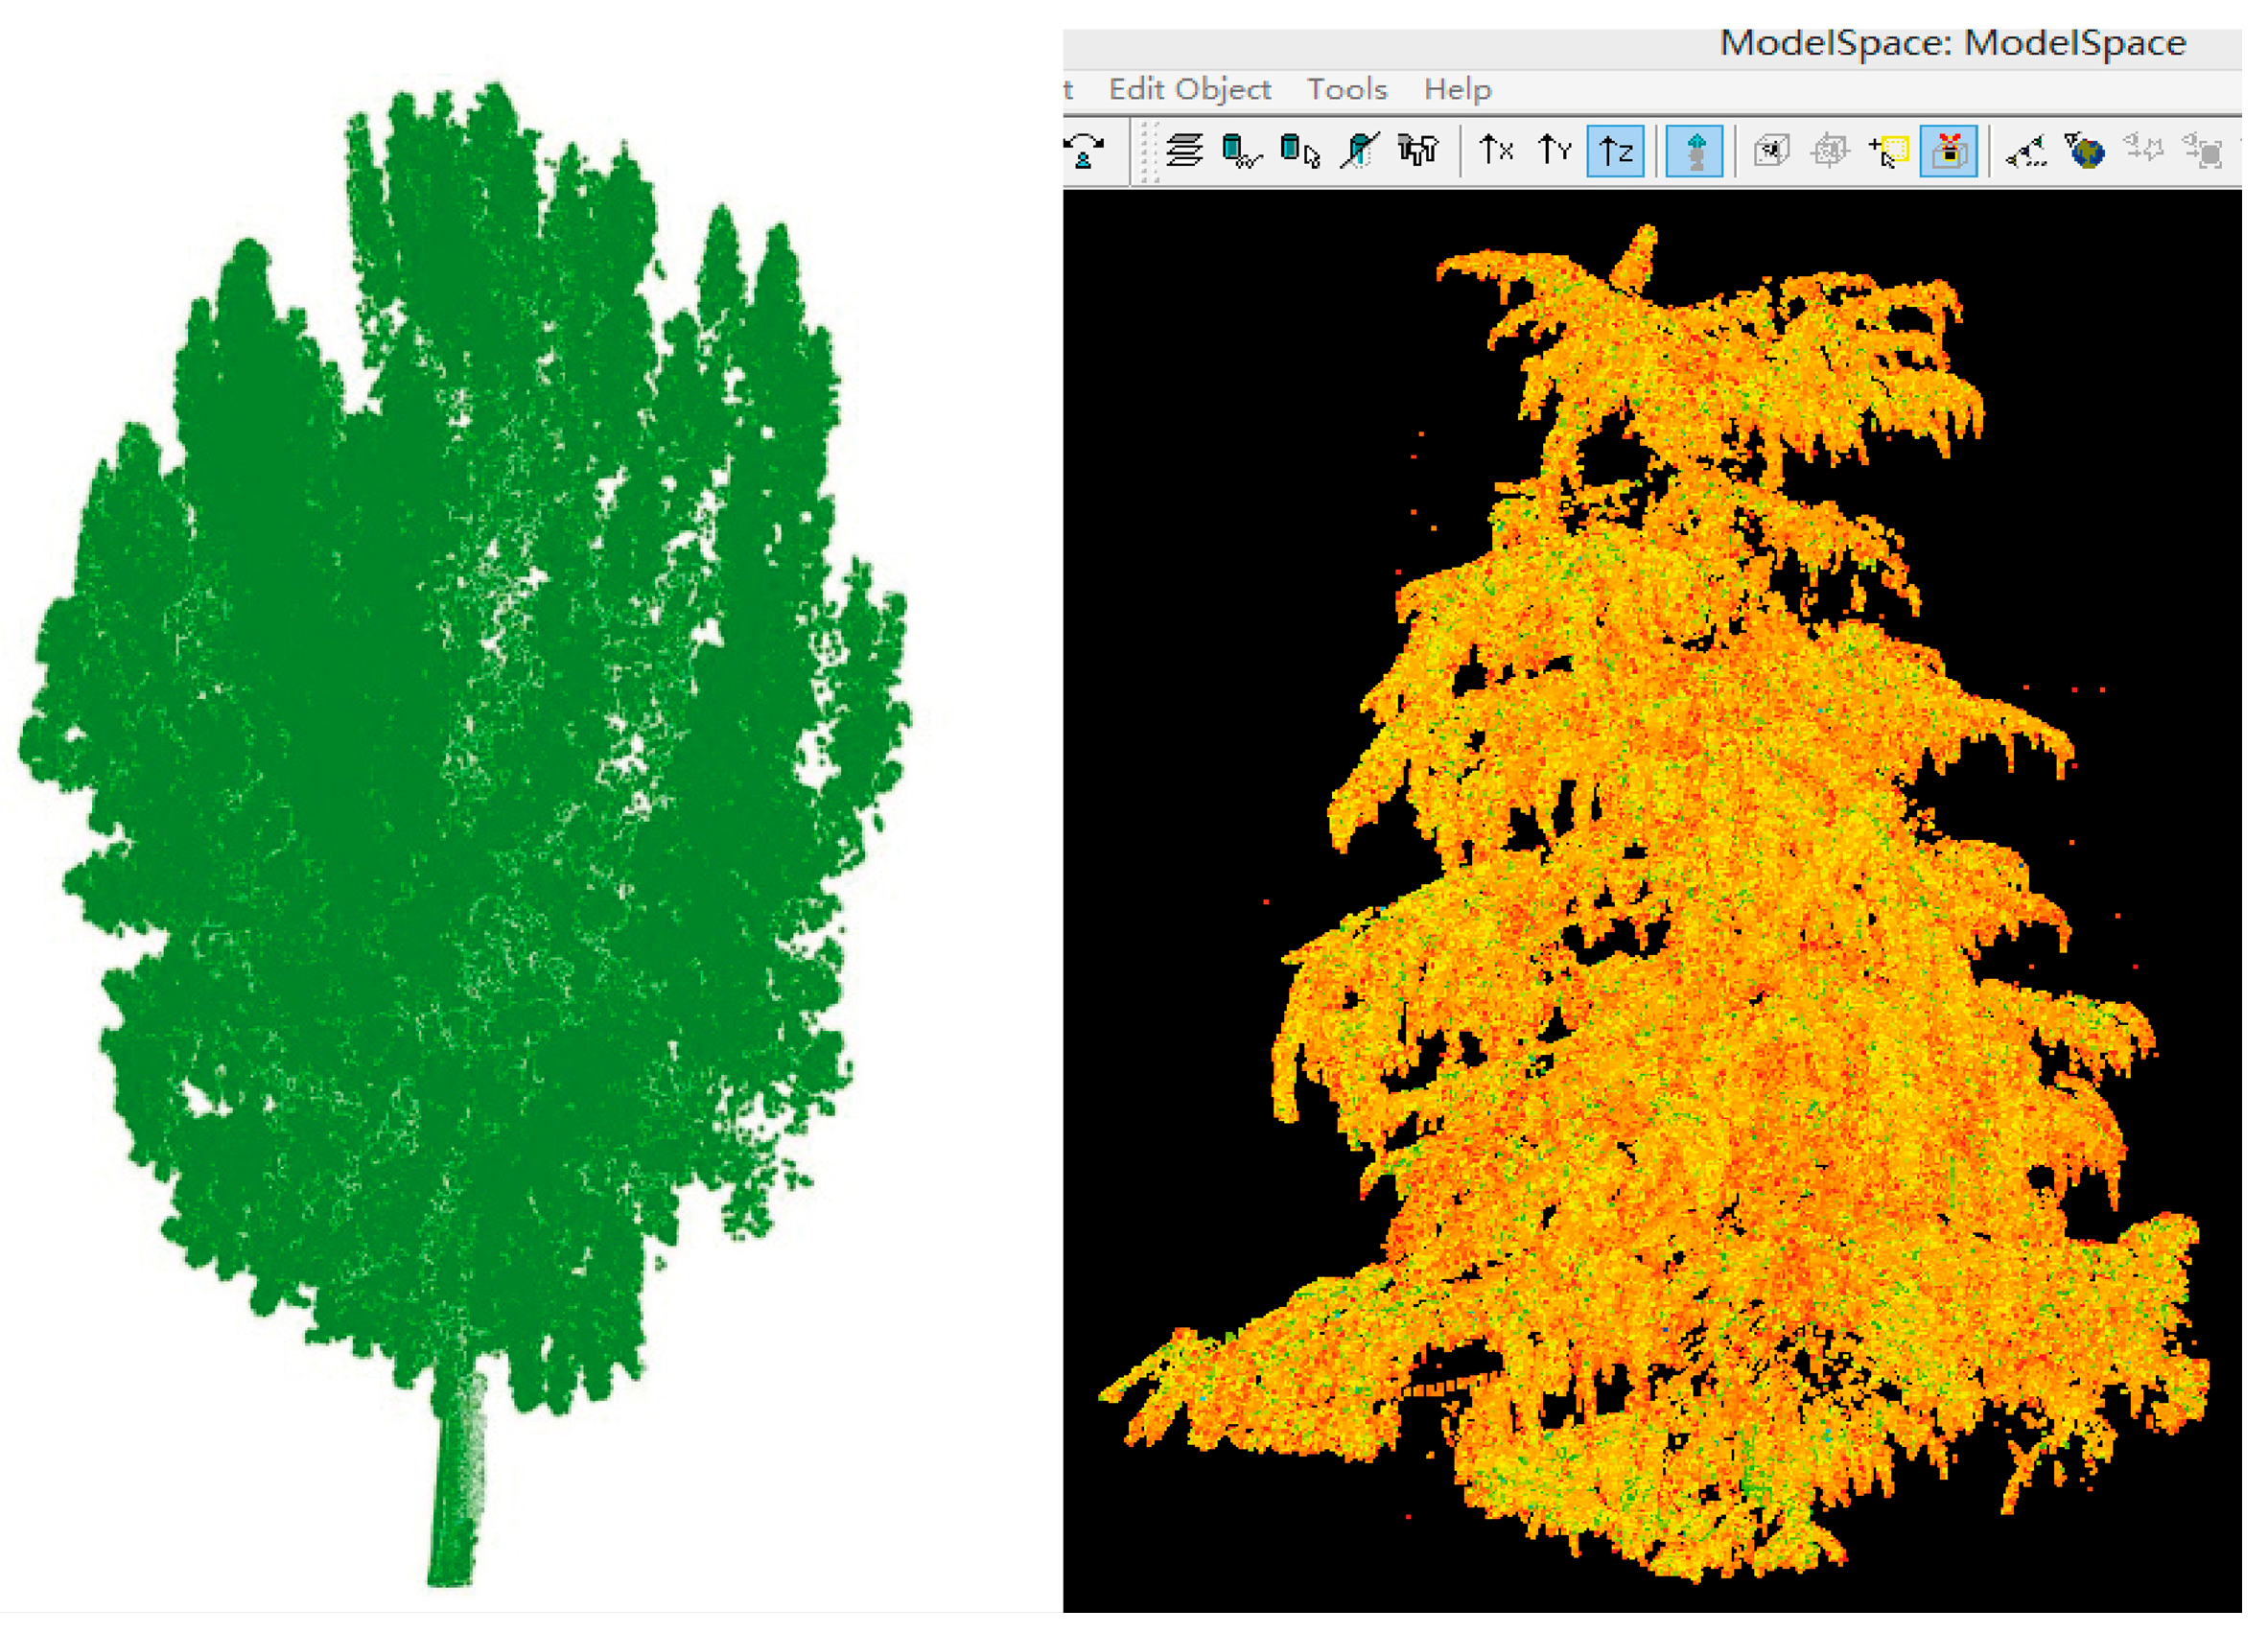
A Leica C10 3D laser scanner was used for the field measurements at the sample plots (Figure 4), and Leica Cyclone 8.0 software was used to splice the 3D laser point cloud data. Two 3D models of sample trees are shown in Figure 5. The 3D green quantity of forest vegetation in the main urban area of Xi’an was estimated based on the 3D green quantity estimation model for a single tree. Accurate calculations of the single-tree 3D green quantity are instrumental in computing the 3D green quantity of urban forest vegetation. In this study, the differential method was used to compute the 3D green quantity of individual trees:
where G is the single-tree 3D green quantity. The three-dimensional space occupied by each tree is discretized into a set of regular cubic cells (voxels), which are defined as the effective spatial units. N is the total number of effective spatial units within the smallest circumscribed cuboid of an individual tree. An effective spatial unit is a voxel that contains LiDAR point returns classified as tree canopy, indicating that the voxel is occupied by vegetation. L, W, and H are the length, width, and height of the smallest circumscribed cuboid enclosing the tree canopy, respectively. d is the edge length of a differential cell (i.e., the spatial resolution of the voxel), and d3 is the volume of a single differential cell. Vbox is the volume of the smallest circumscribed cuboid of a spatial unit, which is used to normalize the spatial distribution of vegetation within the three-dimensional space. This method can be automated for data processing and has high measurement efficiency, making it applicable to real situations and substantially improving the measurement accuracy of single-tree 3D green quantity.
Figure 4.
Field data collection-Surveying the three-dimensional green quantities of trees.
Figure 5.
Three-dimensional models of tree samples.
2.4. Evaluation Methods and Data Processing
The polygon synthesis index method is a useful means of evaluation, as it does not require expert weights and only requires determining the reference (ideal) value of the index to perform the standardized calculation. Geometrically, this method can be interpreted as a multidimensional synthesis index that calculates the ratio of a constructed polygon’s area. This approach differs fundamentally from weighted average methods (such as AHP), as it compresses multidimensional indicator data into a unified one-dimensional index without relying on subjective weight assignment. Consequently, this mechanism effectively avoids the subjectivity and inconsistency often introduced by expert-based weighting, ensuring that the evaluation results are objective and comparable across different time periods. Furthermore, the polygon synthesis index method fully reflects the comprehensive effect of various service functions of the evaluation object. The polygon synthesis index method of standardizing the evaluation index is as follows:
where Iij is the index of indicator i in stage j, Xij is the value of indicator I in stage j, and Ri is the reference value of indicator i.
The polygon synthesis index method was used to analyze the corresponding planning results. First, indicator i was regarded as the i axis. Then, the standardized index values of different indicators were marked at different stages on each axis after finishing the regular polygon (with i sides) based on an axial length of 1. Finally, corresponding points of the same stage were connected to form a new i-sided shape (a total of I j-edge shapes) that was used to represent the ecological benefits of an urban green space in j stages. Thus, area j for i-sided shapes as divided by the area of the positive i-sided shapes with radius 1 was a comprehensive index of the urban green space ecological benefits at each stage. This comprehensive index ranges from 0 to 1, with larger values indicating a stronger ecological service function of green space. The index can be calculated as follows:
where Ipj is the value of the comprehensive index during stage j, Sj is the polygon area in stage j, and St is the positive i-sided area with a radius of 1.
3. Results
3.1. Spatial Distribution and Structural Composition of 3D Green Quantity
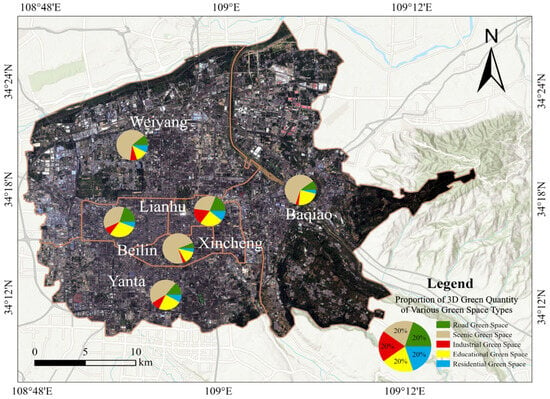
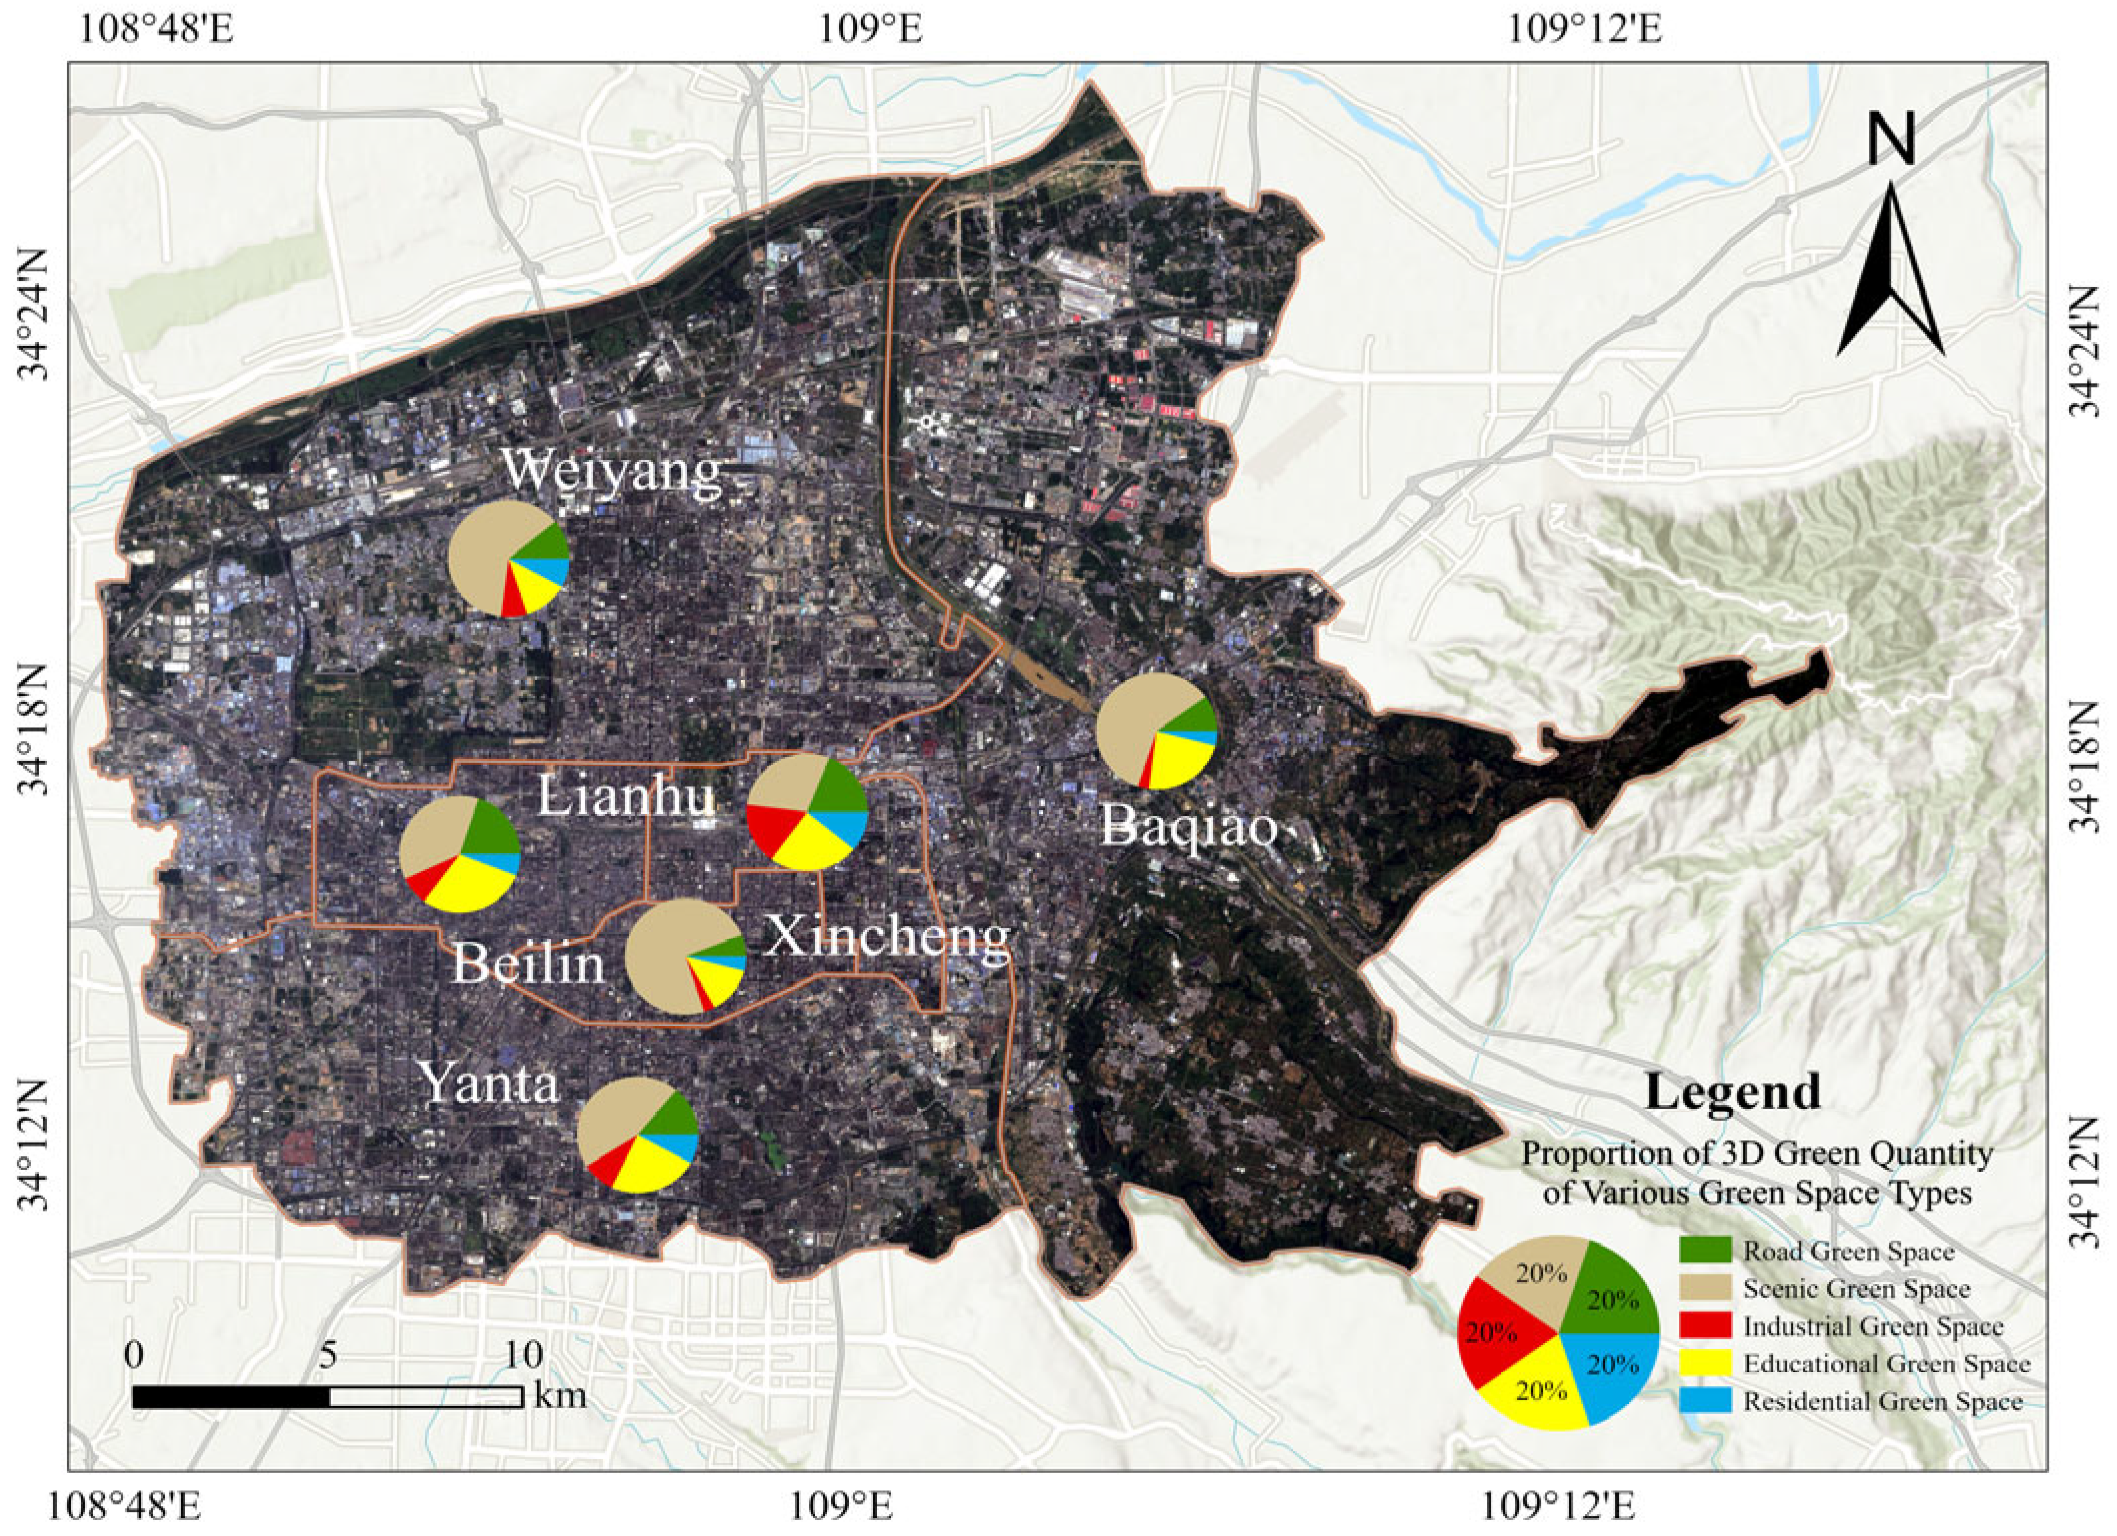
By integrating discrete field survey data with regional spatial analysis, the spatial distribution map of 3D Green Quantity in the main urban area of Xi’an was generated, as shown in Figure 6 and Table 1.
Figure 6.
Three-dimensional Green Quantity of various types of green space in each administrative region.
Table 1.
Estimation of 3D Green Quantity of forest vegetation and arbor forest in main urban area of Xi’an.
According to the results, the total 3D Green Quantity in the main urban area is 3747.5 × 104 m3. Among all categories, Scenic Green Space has the largest volume of 2045.5 × 104 m3, which accounts for 54.6% of the total. Its volumetric density is the highest, reaching 0.719 m3/m2. Overall, the structural hierarchy follows the order: Scenic > Educational > Road > Residential > Industrial. Specifically, the dominance of Scenic Green Space is primarily attributed to large-scale urban parks with high forest coverage, such as Xingqing Palace Park, Daming Palace National Heritage Park, and the Xi’an Botanical Garden. Educational Green Space ranks second; its density is 0.497 m3/m2 and the total volume amounts to 736.4 × 10⁴ m3. This is primarily supported by the cluster of universities in the southern region, such as Xi’an Jiaotong University and Chang’an University, serving as significant “green highlights” that contribute substantial biomass to the urban ecosystem.
In comparison, the 3D Green Quantity of road, residential, and industrial green spaces is relatively lower. Road Green Space contributes 587.8 × 10⁴ m3, representing 15.7% of the total, and its density is 0.376 m3/m2. This reflects Xi’an’s characteristic multi-layered road greening along the Second and Third Ring Roads, typically dominated by ancient Platanus orientalis and Sophora japonica. However, Residential and Industrial Green Spaces exhibit the lowest densities, which are 0.241 m3/m2 and 0.178 m3/m2, respectively. These figures reflect structural deficiencies in greening at the community scale.
Further analysis of the six administrative districts indicates distinct regional differences in structural composition. Both Beilin and Yanta Districts present a “Scenic + Educational” dual-drive pattern: Beilin District has the highest proportion of Scenic Green Space, while Yanta District benefits significantly from its educational functional zones. Conversely, Weiyang and Lianhu Districts show structural imbalances where the proportion of Residential Green Space is extremely low, consistent with the low-value spatial pattern observed in the northern region. This distribution poses a challenge to urban ecological equity, particularly in the context of high population density—for instance, the population density in Beilin District reaches 26,701 people/km2. Rapid population growth and urbanization in these core areas have intensified surface impermeability, further compressing the per capita 3D Green Quantity. This necessitates targeted planning interventions to improve residential greening levels in these high-density zones.
3.2. Comprehensive Evaluation System for Ecological Benefits of Urban Green Spaces
According to the social-economic-natural complex ecosystem theory and with reference to relevant domestic and international indicators, and the operability and availability of data, a three-level evaluation index system for the ecological benefits of urban green spaces (that could adapt to the real-world situation in Xi’an) was constructed and is shown in Table 2. It can be seen from Table 2 that the evaluation index of a comprehensive evaluation system was selected based on two aspects: structure and function. The level I index is a comprehensive index for the ecological benefit evaluation. The level II indexes include urban green space structure and ecological service function. The level III indexes include 3D green quantity per capita, forest coverage rate, green space uniformity, green coverage rate, green space in parks per capita, and comprehensive ecological value (e.g., carbon sequestration, oxygen release, dust retention, and SO2 absorption).
Table 2.
Ecological benefit evaluation system for urban green spaces.
In summary, the ecological benefits of urban green spaces depend on structure and service functions, and a quantitative evaluation system was developed and applied using these aspects. Nine indicators were selected for this comprehensive evaluation system, the comprehensive evaluation index system of urban green spaces ecological benefit accords with the local characteristics of Xi’an; it includes not only two-dimensional index, three-dimensional index, but also comprehensive index, which has certain scientific significance.
3.3. Comprehensive Evaluation of Ecological Benefits of Urban Green Spaces
Based on the constructed ecological benefit evaluation system, this study used the polygon comprehensive index method to comprehensively evaluate the ecological service function of urban green spaces in Xi’an. Referencing domestic and international composite index classification methods, a grading standard was designed to evaluate the urban vegetation ecological service functions (Table 3). The indexes of the green space ecological service function for the main urban area of Xi’an are shown in Table 4. First, the indicators in Table 4 were standardized. Then, the evaluation index was calculated for each indicator at each stage. Finally, the polygon synthesis index method was used to compare and analyze the data.
Table 3.
Grading standard for the comprehensive index of urban green space ecosystem service function.
Table 4.
Planning index system for Xi’an urban green space ecosystem service function.
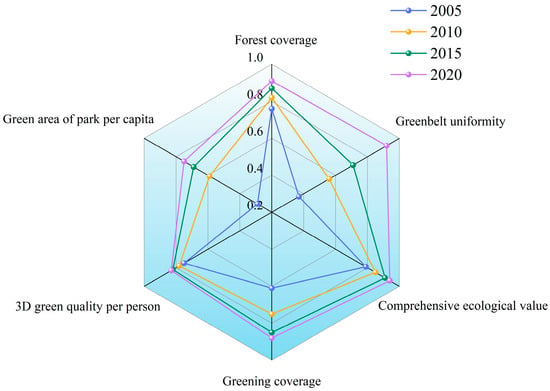
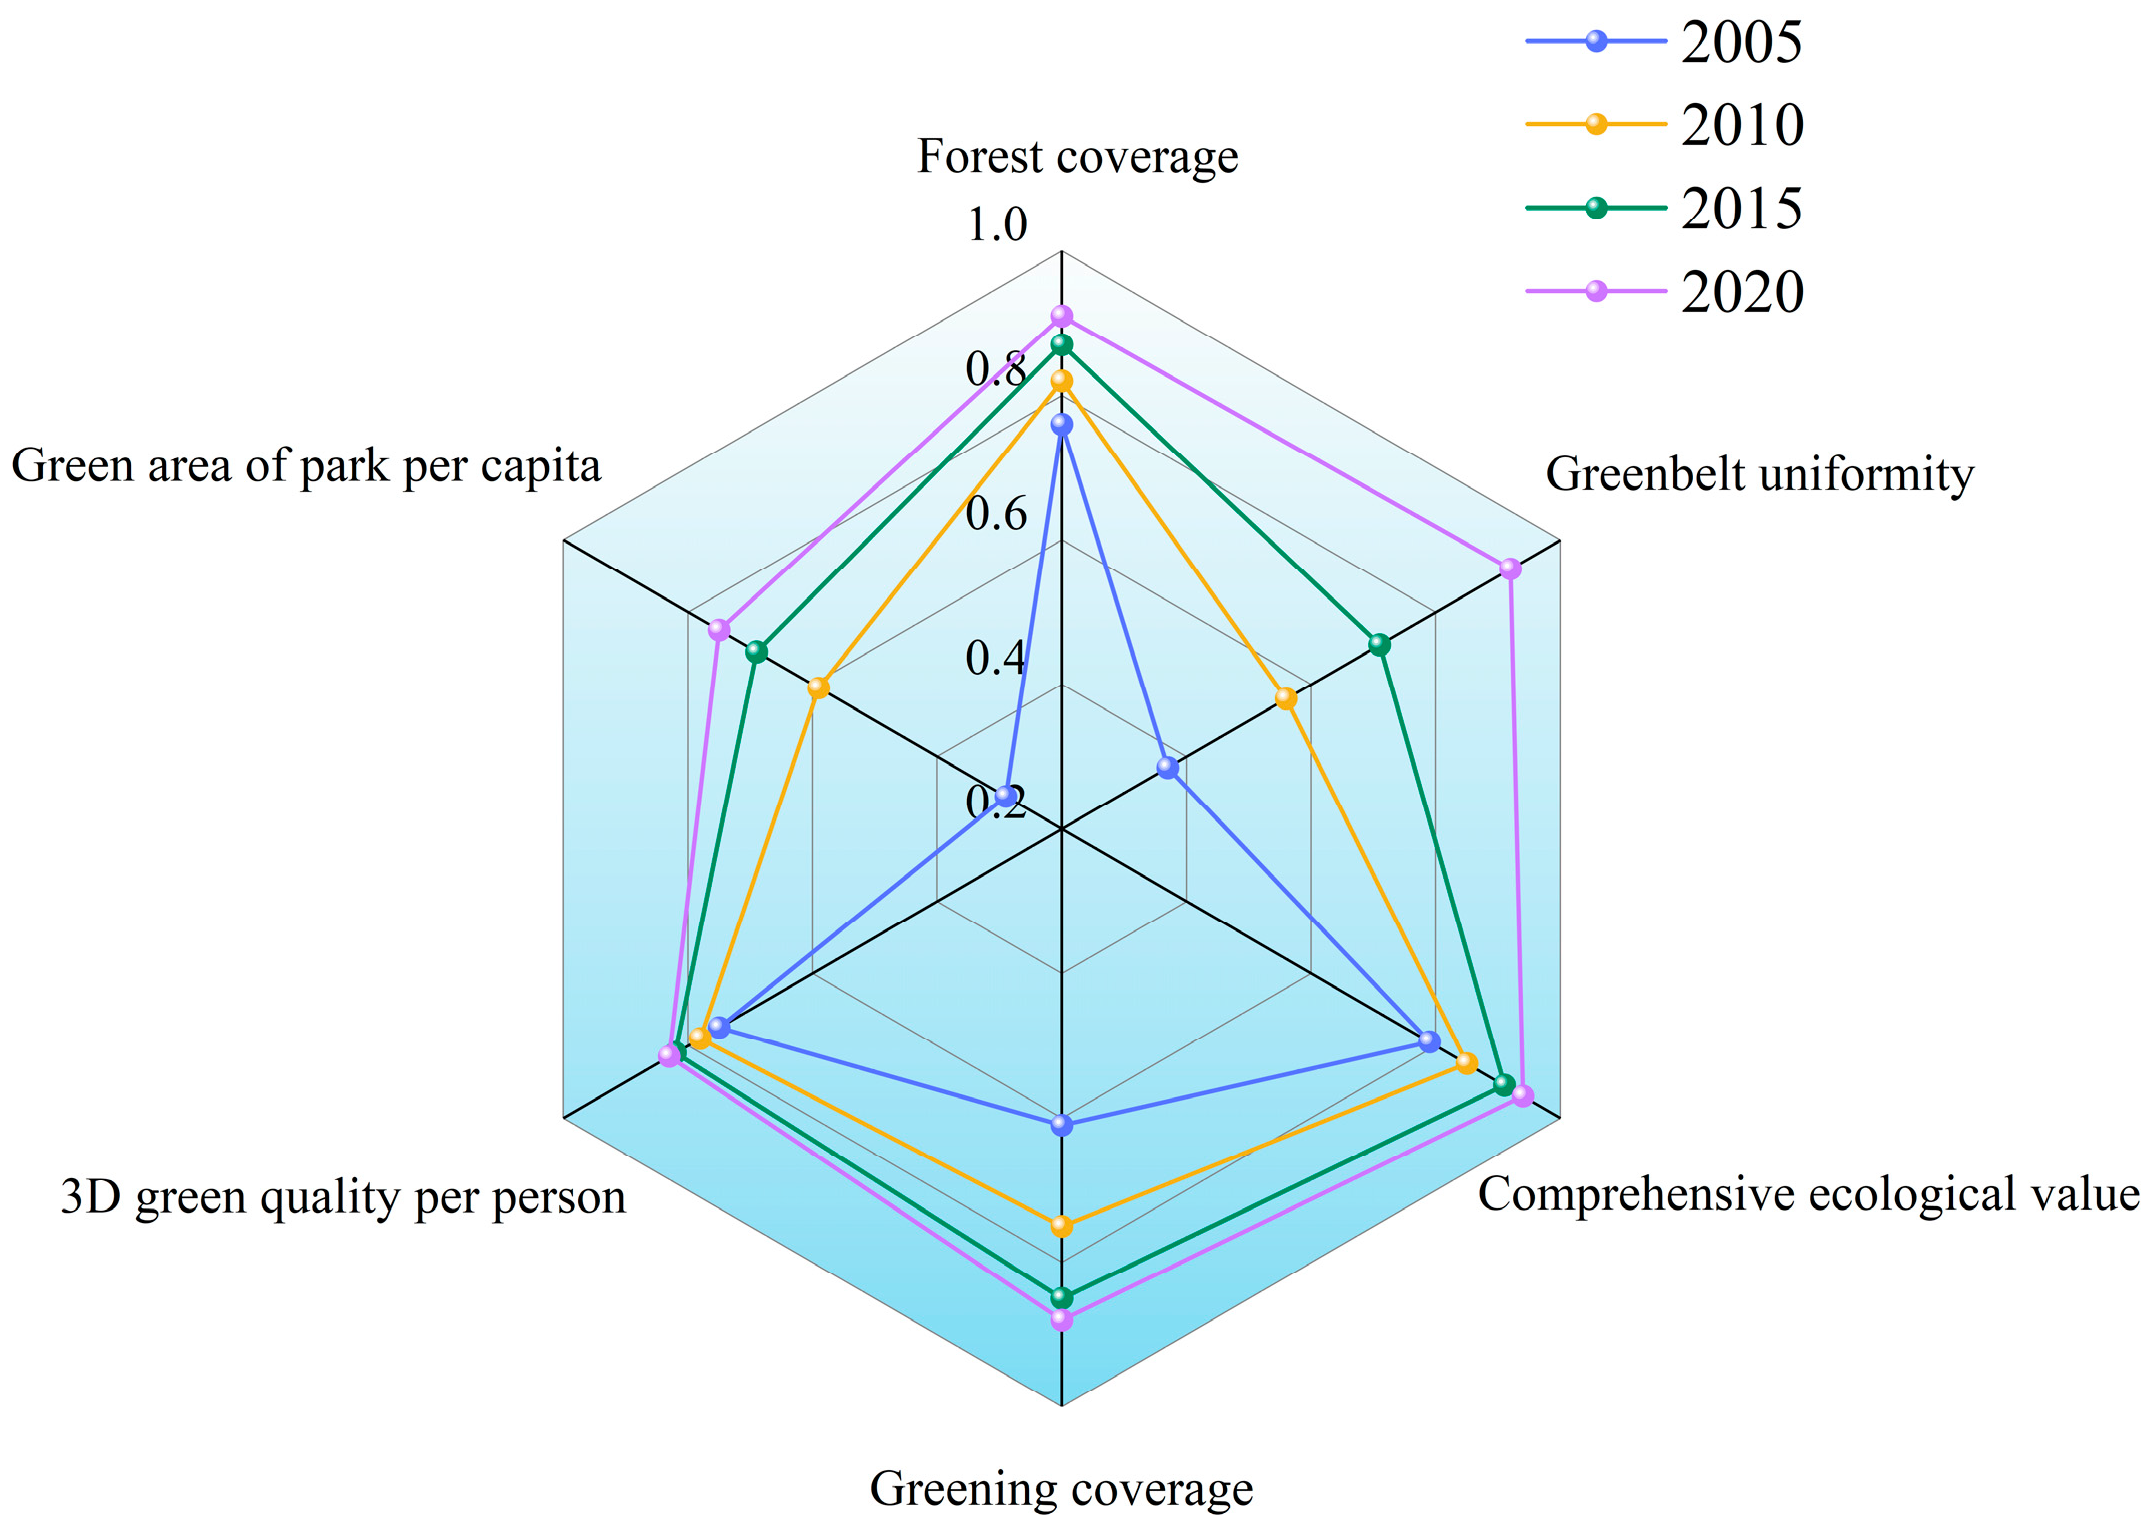
The evaluation results in Figure 7 and Table 5 show that, from 2005 to 2020, the comprehensive index of the ecological service function of urban green space in Xi’an became larger and the function of ecological service of green space became stronger. Green space uniformity and park green space area per capita in the main urban area of Xi’an were low in 2005. The composite index of ecological service function was 0.33 in 2005 and, thus, was level III, with an average ecological service function. Thus, there is a substantial gap between the ecological service function of Xi’an and that of other developed cities. In 2005, the problem of urban green space in Xi’an was primarily due to its uneven distribution, which reflected the characteristics of high southern and low northern suburbs. Green space in the cultural and educational area and residential area is mostly distributed in the Beilin district in the southern suburb, whereas limited green space is available in the Weiyang district in the northern suburb. There are several gaps between the indicators of industrial green space, road green space, and residential green space and the national eco-city standard. Moreover, the urban greening tree species are relatively limited, the landscape is monotonous, and there is no network of green space system combining point, line, surface, and wedge. In 2010 and 2015, the ecological service function was good, with composite indexes of 0.52 and 0.65, respectively, belonging to level II. From 2005 to 2015, to build an ecological city and create a suitable living environment for residents, Xi’an Forestry Bureau carried out scientific and reasonable planning, implementation, supervision, and management of urban green space in Xi’an, and achieved remarkable results. The comprehensive index of the green space ecological service function was 0.76 in 2020 and belonged to level I, with an excellent ecological service function. The substantial increase in the comprehensive evaluation index from 0.65 in 2015 to 0.76 in 2020 can be plausibly attributed to a series of urban greening and ecological restoration policies implemented in Xi’an during this period [44]. In particular, the city advanced large-scale urban afforestation and park system development through initiatives such as the National Forest City program and urban ecological restoration actions, which placed strong emphasis on increasing tree planting intensity, enhancing canopy continuity, and improving vertical vegetation structure. Meanwhile, targeted projects including street tree upgrading, park green space renovation, and river corridor greening further promoted the expansion and structural optimization of tree-dominated urban green infrastructure. These interventions focused not only on enlarging green space area but, more importantly, on strengthening vegetation structure and biomass, which directly contributes to the enhancement of 3D Green Quantity.
Figure 7.
Change chart for comprehensive indexes of urban green space ecosystem service function in Xi’an.
Table 5.
Evaluation results for ecological service function of urban green spaces in Xi’an.
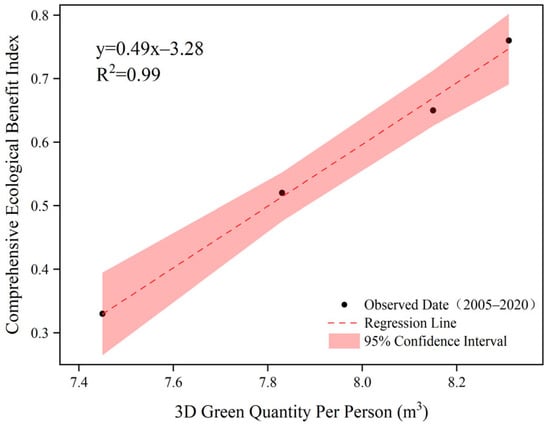
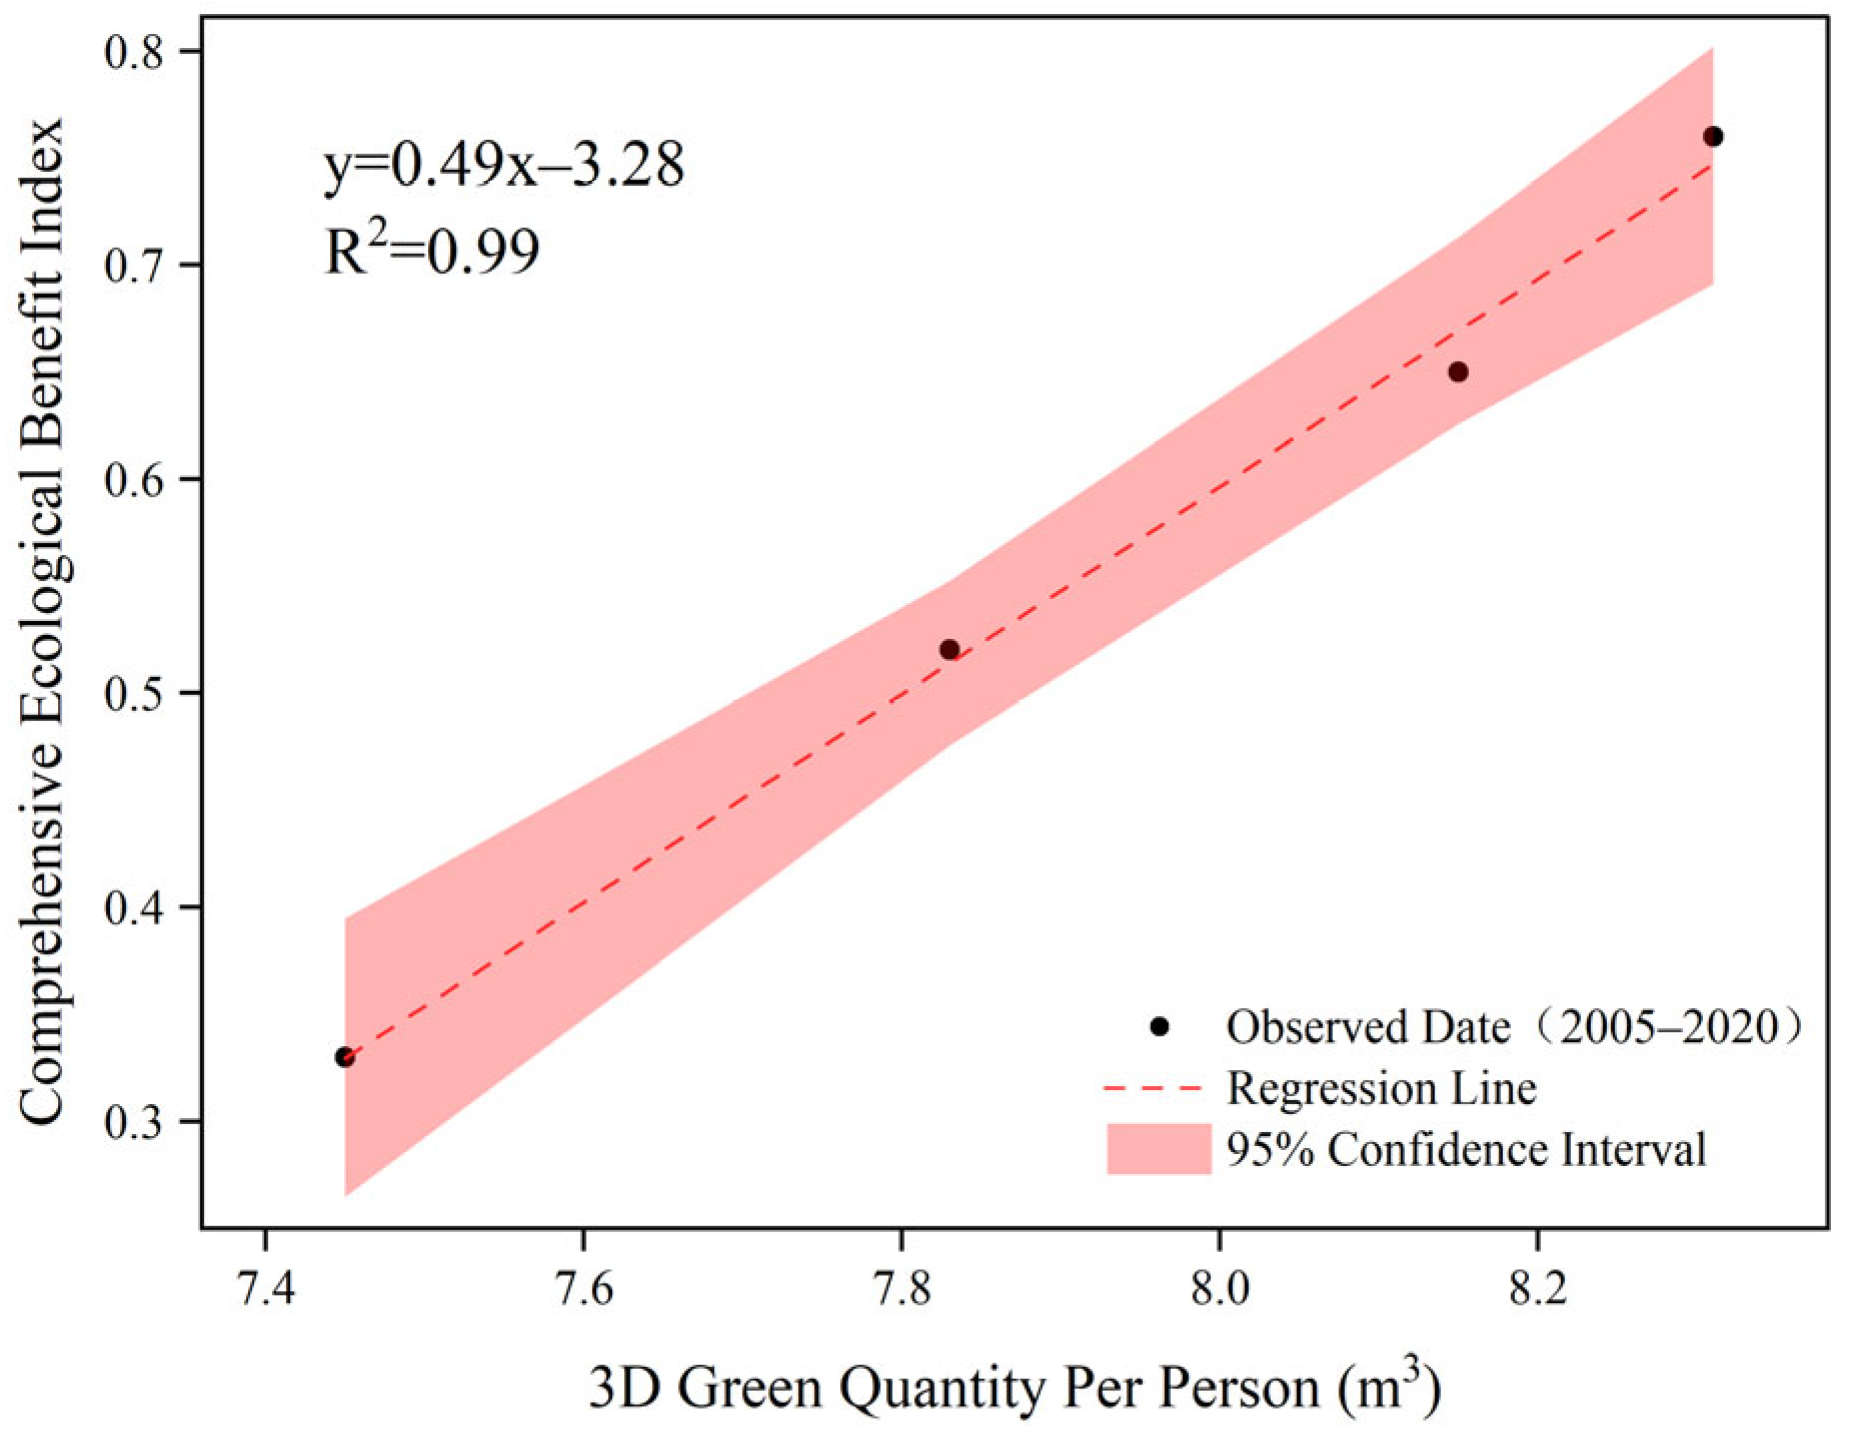
To empirically verify the core research claim (Hypothesis H1), a linear regression analysis was performed taking per capita 3D Green Quantity as the independent variable and the comprehensive ecological benefit index as the dependent variable. The results, as presented in Figure 8, reveal a robust positive linear relationship between the two variables, with a coefficient of determination (R2) reaching 0.99. This significant correlation indicates that 3D Green Quantity is a dominant predictor of urban ecological performance, explaining nearly all the variance in the ecological benefit index during the study period. While other factors such as green space uniformity and coverage also contribute to ecological functions, the extremely high R2 value suggests that the “green volume” acts as the primary limiting factor. Therefore, the improvement in ecological benefits observed from 2005 to 2020 can be fundamentally attributed to the consistent growth in 3D Green Quantity, validating the independent and critical contribution of volumetric greening to urban ecological resilience.
Figure 8.
Correlation analysis between per capita 3D Green Quantity and comprehensive ecological benefit index.
Hence, it can be seen that the ecological service function of the urban green spaces in Xi’an has been significantly improved because of ecological planning. In 2020, Xi’an achieved a green space ecosystem with reasonable structure, balanced green space distribution, comfortable green spaces, and healthy and permanent development.
To corroborate this observation and further validate the authenticity of the terminal data in the absence of simultaneous fieldwork, we cross-referenced our inversion results with official data from the Xi’an Statistical Yearbook. The analysis indicates that the temporal growth trend of the estimated 3D Green Quantity is consistent with the official records of urban greening development. Specifically, according to the statistical bulletins, both the total urban green space area and the per capita green space area in Xi’an exhibit a continuous increasing trend. This macro-level consistency strongly corroborates that our inverted data accurately reflects the actual ‘incremental’ ecological improvement and the realistic status of vegetation in Xi’an during the study period.
Through reasonable urban green space planning, the park green space area per capita and the green space uniformity in Xi’an can be further increased and the comprehensive ecological service function can be improved. Therefore, evaluating urban green space ecological service functions is crucial to the planning and design of urban green space systems. Moreover, quantitative analyses of the green space ecological service function can provide a scientific theoretical basis for green space ecosystem planning.
4. Discussion
Currently, the indexes used to evaluate the ecological benefits of green spaces are unsystematic. There is no unified standard, and further research into the selection of evaluation indexes is required. Traditional green space indicators are generally expressed in terms of the greening coverage rate, green land rate, green space area per capita, and public green space area per capita. However, these only reflect the area of urban green spaces to a limited extent. In reality, the ecological benefits of green spaces are also related to their volume, biomass, structure, uniformity, and local species dominance [45]. Three-dimensional evaluation indexes for comprehensive evaluation index systems to assess the ecological benefits of urban green spaces, such as 3D green quantity and 3D green quantity per capita, are lacking. The commonly used green space indexes do not accurately reflect the structures of green spaces, nor do they truly represent their ecological benefits. The introduction of the 3D green quantity addresses these shortcomings [46].
On the one hand, the ecological service function of urban green spaces depends on the rationality of ecological planning, including the structure, quantity, and distribution of green spaces. On the other hand, it depends on the suitability of the ecological management, including management methods, systems, and means. Therefore, to achieve the planning goals, Xi’an must take legal, economic, and administrative measures to strengthen supervision and implement ecological countermeasures that can transition from 2D to 3D, local to regional, and monotonous to diverse. More recreational green spaces should be built in urban areas to meet the recreational needs of citizens. Furthermore, the 3D green quantity, the quality of urban green spaces in built-up areas, the coverage rate of tree crowns in parking lots, and the “heat island effect” should also be considered. Using this method, the construction of urban forest ecological spaces based on forests, forest water integration, and the integration of urban and rural areas can be achieved. Finally, the greening main frame of “one screen, three axes, five rings, ten blocks, one hundred corridors, and one thousand points” should be constructed to lay a solid ecological foundation for Xi’an to build an international metropolis.
This study has certain limitations regarding the granularity of vegetation structural data. Due to the resolution constraints of the remote sensing imagery and the top-down scanning angle of the available LiDAR data, the calculation of 3D Green Quantity in this study primarily focused on the arbor layer (trees), without explicitly quantifying the contribution of the shrub and herb layers. While arbors typically constitute the vast majority of the total vertical green volume in urban ecosystems due to their significant biomass dominance, the exclusion of the understory layer inevitably leads to a systematic underestimation of the total 3D Green Quantity. This underestimation is likely spatially heterogeneous; for instance, in Residential Green Spaces and Road Green Belts, where multi-layered planting (arbor-shrub-grass) is a common landscaping practice, the actual ecological benefits may be higher than reported in this study. In contrast, in mature Scenic Forests dominated by tall canopy trees with sparse undergrowth, the estimation error is relatively minor. Therefore, the results presented here should be interpreted as a conservative baseline of Xi’an’s urban ecological capacity. Future research should aim to bridge this gap by integrating multi-source remote sensing data to achieve “full-profile” vegetation measurement. Specifically, the combination of UAV-LiDAR (Unmanned Aerial Vehicle LiDAR) and TLS (Terrestrial Laser Scanning) is recommended. UAV-LiDAR can effectively capture canopy metrics, while TLS can penetrate the canopy gaps to accurately reconstruct the 3D structure of the understory shrub and grass layers. By fusing these technologies, future evaluation systems can move beyond “canopy volume” to a more holistic “ecosystem volume,” thereby providing a more precise basis for micro-scale urban greening management, such as optimizing plant community configurations in high-density residential zones.
Many indexes are used to evaluate the ecological benefits of urban green space. Because some data were not available, the evaluation system of ecological benefits of the urban green space in Xi’an were quantitatively evaluated and analyzed from a certain angle, but the environmental benefits and ecological service function of green space in Xi’an were not comprehensively reflected. Future research should further improve the ecological benefit evaluation index system of urban green spaces as well as provide guidelines and reference values for urban greening in Xi’an to achieve the sustainable development goals of the city. Finally, further studies are required to develop a systematic urban green space ecological benefit evaluation system, address the confusion surrounding evaluation indexes, develop a 3D evaluation index, and unify and perfect different research systems and paradigms.
The spatial heterogeneity of 3D Green Quantity in Xi’an is fundamentally driven by the city’s specific functional zoning and historical urban planning strategies, rather than a simple geographical gradient. The structural differences among administrative districts directly reflect their distinct urban functions. For instance, the high proportion of Educational Green Space in Yanta District is a direct result of the “Cultural and Educational Zone” policy established in the 1950s, which concentrated large-scale university campuses (e.g., Xi’an Jiaotong University) in this region, effectively creating a high-biomass ecological core. Similarly, Beilin District benefits from the preservation of large-scale historical heritage sites (e.g., Xingqing Palace Park), resulting in a dominant share of Scenic Green Space. In contrast, districts such as Weiyang and Lianhu exhibit structural deficits in residential greening, which can be attributed to the high density of old residential communities and the historical priority on industrial land use in these expansion zones. This “function-driven” disparity implies that future urban management should shift from a uniform planting approach to differentiated strategies: strictly protecting the existing ecological stock in the educational and scenic functional zones, while prioritizing “vertical greening” retrofits in the space-constrained residential and industrial districts to bridge the ecological gap.
5. Conclusions
In this study, nine indexes were selected from structural and functional aspects, including 3D Green Quantity per capita, forest coverage, green space uniformity, greening coverage rate, park green space per capita, and comprehensive ecological value (carbon sequestration, oxygen release, dust retention, and SO2 absorption). These indexes were used to construct an advanced and reasonable three-level rating index system for the ecological benefit of urban green spaces in accordance with the local characteristics of Xi’an. This system was based on high-resolution RS image data supported by 3S (GIS, global positioning system, and RS) technology, and environmental science, geographical information science, RS science, and landscape ecology were used as the theoretical frameworks.
Each evaluation index was quantitatively analyzed via field investigations and surveys using high-precision 3D laser point cloud data to study the 3D green quantity and ecological benefit of forest vegetation in the main urban area of Xi’an. In addition, the ecological services function of urban green spaces in Xi’an was comprehensively evaluated using the polygon comprehensive index method. The results show that in Xi’an, this function was substantially improved through ecological planning. By 2020, Xi’an has developed a green space ecosystem with a balanced distribution structure, local characteristic green spaces, and a stable development. The current ecological service function of urban green spaces in Xi’an is evaluated as “Excellent” (Level I), with a comprehensive index reaching 0.76 in 2020. To verify the objectivity of this rating, we compared our results with external national standards and regional peer cities. This performance aligns with the stringent indicators of the “National Forest City” standards, a designation Xi’an officially achieved in 2016, confirming that its green quantity and coverage metrics meet national-level benchmarks [47,48]. Moreover, in comparison with other major cities in Northwest China such as Lanzhou and Yinchuan, Xi’an exhibits a comparative advantage in 3D Green Quantity per capita and vegetation structural complexity, despite facing similar semi-arid climatic constraints [49]. While these cities have also made significant strides in greening, Xi’an’s higher aggregate biomass and optimized park distribution provide a stronger buffer against urban heat islands and particulate pollution. Thus, the “Excellent” rating is not merely a result of the internal scoring system but reflects Xi’an’s leading status in regional ecological construction. Based on the comprehensive evaluation results, this study proposes a transition from traditional “area-based” metrics to a differentiated “3D Quantity Control” strategy for Xi’an’s future green space system planning. Specifically, for high-density core districts where land resources are scarce, planning policies should mandate the inclusion of “Vertical Green Volume” as a key index in urban renewal projects and land auctions, encouraging roof and vertical greening to compensate for the lack of ground space. For expanding development zones, priority should be given to establishing wide-width ecological corridors that connect with the Qinling Mountains. We further recommend integrating this FPPSI-based evaluation system into Xi’an’s annual “City Physical Examination” (City Health Check) mechanism to dynamically monitor the functional effectiveness of these interventions. Beyond the specific context of Xi’an, the methodological framework proposed here holds significant potential for generalization to other rapidly urbanizing regions. Unlike traditional methods that rely on expensive LiDAR data or subjective expert scoring, our approach—based on public Landsat archives and the objective FPPSI algorithm—offers a cost-effective and standardized protocol. This makes it particularly suitable for comparative ecological assessments across cities in the “Belt and Road” initiative or the Guanzhong Plain Urban Agglomeration, providing a transferable tool for regional environmental governance.
To rigorously validate the reliability and authenticity of the inversion model, an accuracy assessment was conducted by comparing the field-measured data from the 2015 survey against the model-predicted values. The results demonstrated a robust fit, yielding a coefficient of determination (R2) of 0.81 and an average prediction accuracy of 88.07%. These statistical metrics confirm that the calibrated model possesses sufficient robustness to effectively capture the structural characteristics of the urban vegetation.
Furthermore, applying this 2015-calibrated model across the entire 2005–2020 study period is justified by the temporal stability of the study area’s vegetation characteristics. During this period, green space development in Xi’an’s main urban area was characterized primarily by ‘incremental expansion’ rather than the replacement of existing green spaces, with no significant large-scale vegetation clearance observed. Consequently, when combined with the biological stability inherent in allometric growth relationships, this high-precision model serves as a scientifically valid baseline for the consistent extrapolation of 3D Green Quantity across the examined time series.
Finally, it should be noted that the findings of this study are most applicable to urban green infrastructure dominated by arbor communities. While the exclusion of shrubs and herbs was necessary due to data resolution constraints, future assessments should aim to integrate multi-layer vegetation data to capture the full spectrum of urban ecosystem services.
Author Contributions
Conceptualization, F.L.; Methodology, F.L.; Software, C.W.; Validation, F.L. and C.W.; Formal analysis, C.W. and M.L.; Resources, X.F.; Data curation, F.L.; Writing—original draft, F.L. and C.W.; Writing—review & editing, F.L.; Visualization, C.W.; Supervision, C.W.; Project administration, X.F.; Funding acquisition, F.L. All authors have read and agreed to the published version of the manuscript.
Funding
This research was funded by Young Scientists Fund of the National Natural Science Foundation of China (51608419) and General Program of the Natural Science Foundation of Shaanxi Province (2025JC-YBMS-316).
Institutional Review Board Statement
Not applicable.
Informed Consent Statement
Not applicable.
Data Availability Statement
The original contributions presented in this study are included in the article. Further inquiries can be directed to the corresponding author.
Conflicts of Interest
The authors declare no conflict of interest.
Abbreviations
The following abbreviations are used in this manuscript:
| AHP | Analytic Hierarchy Process |
| ARCGIS | Arc Geographic Information System |
| FPPSI | Full Permutation Polygon Synthetic Indicator |
| GIS | Geographic Information Systems |
| GPS | Global Positioning System |
| LiDAR | Light Detection and Ranging |
| PCA | Principal Component Analysis |
| RS | Remote Sensing |
| UGS | Urban Green Space |
| UHI | Urban Heat Island |
| 3D | Three-Dimensional |
| 2D | Two-Dimensional |
| 3DGV | Three-Dimensional Green Volume |
References
- Wang, J.; Han, P. The impact of industrial agglomeration on urban green land use efficiency in the Yangtze River Economic Belt. Sci. Rep. 2023, 13, 974–987. [Google Scholar] [CrossRef] [Scilit] [PubMed]
- Sutton, P.C.; Anderson, S.J.; Costanza, R.; Kubiszewski, I. The ecological economics of land degradation: Impacts on ecosystem service values. Ecol. Econ. 2016, 28, 182–192. [Google Scholar] [CrossRef] [Scilit]
- Xu, Z.Y.; Zhao, S.Q. Scale dependence of urban green space cooling efficiency: A case study in Beijing metropolitan area. Sci. Total Environ. 2023, 898, 165563. [Google Scholar] [CrossRef] [Scilit] [PubMed]
- Xie, H.L.; Wang, X.K.; Hu, X.T.; Shi, Z.Y.; Lin, H.; Xie, X.Q.; Chen, L.X.; Dai, H.X.; Zhang, J.; Xu, M.J.; et al. Exploring urban green space optimization of the urban walking life circle in Fuzhou, China. Int. J. Environ. Res. Public Health 2023, 20, 1180. [Google Scholar] [CrossRef] [Scilit]
- Ferenc, M.; Sedlacek, O.; Fuchs, R. How to improve urban greenspace for woodland birds: Site and local-scale determinants of bird species richness. Urban Ecosyst. 2014, 17, 625–640. [Google Scholar] [CrossRef] [Scilit]
- Chen, R.; You, X. Reduction of urban heat island and associated greenhouse gas emissions. Mitig. Adapt. Strateg. Glob. Change 2020, 25, 689–711. [Google Scholar] [CrossRef] [Scilit]
- Li, L.Y.; Uyttenhove, P.; Van Eetvelde, V. Planning green infrastructure to mitigate urban surface water flooding risk-A methodology to identify priority areas applied in the city of Ghent. Landsc. Urban Plan. 2020, 194, 103703. [Google Scholar] [CrossRef] [Scilit]
- Nasrabadi, M.T.; Morassafar, S.; Pourzakarya, M.; Aghlmand, S. Investigating the impacts of green spaces planning on social sustainability improvement in Tehran, Iran: A SWOT-AHP analysis. Local Environ. 2023, 28, 681–697. [Google Scholar] [CrossRef] [Scilit]
- Hassan, Y.N.; Jombach, S. Urban Green Space per Capita for Sustainable and Equitable Urban Planning: A Systematic Review and Bibliometric Analysis. Land 2026, 15, 29. [Google Scholar] [CrossRef] [Scilit]
- Pouya, S.; Aghlmand, M. Evaluation of urban green space per capita with new remote sensing and geographic information system techniques and the importance of urban green space during the COVID-19 pandemic. Environ. Monit. Assess. 2022, 194, 633. [Google Scholar] [CrossRef] [Scilit]
- Kumakoshi, Y.; Chan, S.Y.; Koizumi, H.; Li, X.; Yoshimura, Y. Standardized Green View Index and Quantification of Different Metrics of Urban Green Vegetation. Sustainability 2020, 12, 7434. [Google Scholar] [CrossRef] [Scilit]
- Hu, H.; Huang, S.; Han, J.; Lin, Q.; Zhang, S.; Wang, X. Comparing 2D and 3D green quantity and spatial patterns in Built-Up areas of 292 Chinese cities. Ecol. Indic. 2025, 179, 114103. [Google Scholar] [CrossRef] [Scilit]
- Zhou, L.; Li, X.; Zhang, B.; Xuan, J.; Gong, Y.; Tan, C.; Huang, H.; Du, H. Estimating 3D Green Volume and Aboveground Biomass of Urban Forest Trees by UAV-Lidar. Remote Sens. 2022, 14, 5211. [Google Scholar] [CrossRef] [Scilit]
- Li, H.; Li, S.; Zhang, F.; Shang, Y.; Qiu, Y.; Xun, B.; Wang, J.; Wang, S. Analysis of Three-Dimensional Green Volume and Ecological Benefits of Different Green Space Types in Xi’an City. Res. Environ. Sci. 2025, 38, 59–67. [Google Scholar]
- Zhang, F.; Tian, D.; Jiang, L. Calculation Method of the Crown Projection Area of Larix olgensis. J. Northeast For. Univ. 2025, 53, 69–74. [Google Scholar]
- Barron, W.F.; Ng, G.T.L. An assessment methodology for environmental policy instruments: An illustrative application to solid wastes in Hong Kong. J. Environ. Manag. 1996, 48, 283–298. [Google Scholar] [CrossRef] [Scilit]
- Huang, W.; Luukkanen, O.; Johanson, S.; Kaarakka, V.; Räisänen, S.; Vihemäki, H. Agroforestry for biodiversity conservation of nature reserves: Functional group identification and analysis. Agrofor. Syst. 2002, 55, 65–72. [Google Scholar] [CrossRef] [Scilit]
- McGranahan, G.; Satterthwaite, D. Urban centers: An assessment of sustain-ability. Annu. Rev. Environ. Resour. 2003, 28, 243–274. [Google Scholar] [CrossRef] [Scilit]
- Nowak, D.J. Assessing Urban Forest Effects and Values; USDA Forest Service: New York, NY, USA, 2006. [Google Scholar]
- Yang, W.; Li, F.; Wang, R.; Hu, D. Ecological benefits assessment and spatial modeling of urban ecosystem for controlling urban sprawl in Eastern Beijing, China. Ecol. Complex. 2011, 8, 153–160. [Google Scholar] [CrossRef] [Scilit]
- Farrugia, S.; Hudson, M.D.; McCulloch, L. An evaluation of flood control and urban cooling ecosystem services delivered by urban green infrastructure. Int. J. Biodivers. Sci. Ecosyst. Serv. Manag. 2013, 9, 136–145. [Google Scholar] [CrossRef] [Scilit]
- Lai, X.; Liu, Z.; Li, H.; Zheng, X. Ecological Performance Evaluation of Arbor Communities Based on LiDAR 3D Point Cloud Data. Chin. Landsc. Archit. 2022, 38, 122–127. [Google Scholar]
- Stofkova, J.; Krejnus, M.; Stofkova, K.R.; Malega, P.; Binasova, V. Use of the Analytic Hierarchy Process and Selected Methods in the Managerial Decision-Making Process in the Context of Sustainable Development. Sustainability 2022, 14, 11546. [Google Scholar] [CrossRef] [Scilit]
- Xu, X.; Gao, J.; Zhang, Z.; Fu, J. An Assessment of Chinese Pathways to Implement the UN Sustainable Development Goal-11 (SDG-11)—A Case Study of the Yangtze River Delta Urban Agglomeration. Int. J. Environ. Res. Public Health 2019, 16, 2288. [Google Scholar] [CrossRef] [Scilit] [PubMed]
- Truong, V.C.; Le, N.H.; Tran, T.A. A Full Permutation Polygon Synthetic Indicator (FPPSI) Approach for Measuring and Evaluating City Prosperity: A Case Study of Da Nang City, Vietnam. Bull. Geogr. Socio-Econ. Ser. 2023, 59, 167–180. [Google Scholar] [CrossRef] [Scilit]
- Xu, C.; Wang, S.; Zhou, Y.; Wang, L.; Liu, W. A Comprehensive Quantitative Evaluation of New Sustainable Urbanization Level in 20 Chinese Urban Agglomerations. Sustainability 2016, 8, 91. [Google Scholar] [CrossRef] [Scilit]
- Intasen, M.; Huaer, R.J.; Werner, L.P.; Larsen, E. Urban forest assessment in Bangkok, Thailand. J. Sustain. For. 2017, 36, 148–163. [Google Scholar] [CrossRef] [Scilit]
- Song, P.; Kim, G.; Mayer, A.; He, R.; Tian, G. Assessing the Ecosystem Services of Various Types of Urban Green Spaces Based on i-Tree Eco. Sustainability 2020, 12, 1630. [Google Scholar] [CrossRef] [Scilit]
- Wang, Y.; Chang, Q.; Li, X. Promoting sustainable carbon sequestration of plants in urban greenspace by planting design: A case study in parks of Beijing. Urban For. Urban Green. 2021, 64, 127291. [Google Scholar] [CrossRef] [Scilit]
- Hong, Z.; Xu, W.; Liu, Y.; Wang, L.; Ou, G.; Lu, N.; Dai, Q. Retrieval of Three-Dimensional Green Volume in Urban Green Space from Multi-Source Remote Sensing Data. Remote Sens. 2023, 15, 5364. [Google Scholar] [CrossRef] [Scilit]
- Li, N.; Deng, L.; Yan, G.; Cao, M.; Cui, Y. Estimation for Refined Carbon Storage of Urban Green Space and Minimum Spatial Mapping Scale in a Plain City of China. Remote Sens. 2024, 16, 217. [Google Scholar] [CrossRef] [Scilit]
- Duan, L.; Niu, X.; Wang, B. Construction and Application of Urban Green Space Ecosystem Service Assessment Indicator System and Assessment Method: A Case Study of Chifeng Central Urban Area, China. Forests 2025, 16, 129. [Google Scholar] [CrossRef] [Scilit]
- Zhang, T.; Wang, L.; Hu, Y.; Zhang, W.; Liu, Y. Measuring Urban Green Space Exposure Based on Street View Images and Machine Learning. Forests 2024, 15, 655. [Google Scholar] [CrossRef] [Scilit]
- Li, X.; Zhang, H.; Zhang, Z.; Feng, J.; Liu, K.; Hua, Y.; Pang, Q. Spatiotemporal Changes in Ecosystem Services along a Urban-Rural-Natural Gradient: A Case Study of Xi’an, China. Sustainability 2020, 12, 1133. [Google Scholar] [CrossRef] [Scilit]
- Peng, L.; Zhang, L.; Li, X.; Wang, P.; Zhao, W.; Wang, Z.; Jiao, L.; Wang, H. Spatio-Temporal Patterns of Ecosystem Services Provided by Urban Green Spaces and Their Equity along Urban–Rural Gradients in the Xi’an Metropolitan Area, China. Remote Sens. 2022, 14, 4299. [Google Scholar] [CrossRef] [Scilit]
- Kong, W.; Liu, Y.; Dong, S.; Hu, Y. Research on the Influence of Evolution of Landscape Patterns of Blue-Green Space on the Cooling Effect in the Central Urban Area of Xi’an. Landsc. Archit. 2025, 32, 78–85. [Google Scholar] [CrossRef] [Scilit]
- Pang, B.; Zhao, J.; Zhang, J.; Yang, L. Calculating optimal scale of urban green space in Xi’an, China. Ecol. Indic. 2023, 147, 110003. [Google Scholar] [CrossRef] [Scilit]
- Xi’an Natural Resources and Planning Bureau; Xi’an Development and Reform Commission. Xi’an Territorial Spatial Ecological Protection and Restoration Plan (2021–2035); Xi’an Municipal Government: Xi’an, China, 2024. [Google Scholar]
- Wang, J.; Song, P.; Zhang, B.; Liu, W.; Zhang, J. Ecological niche evaluation model of socio-economic-natural complex ecosystem–A case study of Sichuan province. Acta Ecol. Sin. 2016, 36, 6628–6635. [Google Scholar]
- Zhou, J. Study on green quantity group of urban living environment (5)—Three-dimensional greening quantity and its application. Chin. Landsc. Archit. 1998, 14, 61–63. [Google Scholar]
- Zhou, Y.; Zhou, J. Evaluation system of urban ecological environment based on three-dimensional greening. Chin. Landsc. Archit. 2001, 5, 78–80. [Google Scholar]
- Hall, R.J.; Skakun, R.S.; Arsenault, E.J.; Case, B.S. Modeling forest stand structure attributes using Landsat ETM+ data: Application to mapping of aboveground biomass and stand volume. For. Ecol. Manag. 2006, 225, 378–390. [Google Scholar] [CrossRef] [Scilit]
- Zhu, X.; Liu, D. Improving forest aboveground biomass estimation using seasonal Landsat NDVI time-series. ISPRS J. Photogramm. Remote Sens. 2015, 102, 222–231. [Google Scholar] [CrossRef] [Scilit]
- Shi, S.; Kuang, W.; Dong, S. Spatiotemporal Pattern of Urban-rural Gradient Land Cover Changes and Their Impact on Urban Heat Island in Xi’an City Since the 21st Century. Remote Sens. Technol. Appl. 2020, 35, 537–547. [Google Scholar]
- Li, F.; Wang, R.S. Evaluation, planning and prediction of ecosystem services of urban green space: A case study of Yangzhou City. Acta Ecol. Sin. 2003, 23, 1929–1936. [Google Scholar]
- Zhang, L.; Zou, B.; Huang, B. A new perspective for the study of ecological function comprehensive evaluation system of urban green space. China Popul. Resour. Environ. 2012, 22, 67–71. [Google Scholar]
- Zhang, Y.; Zhang, H.; Ye, H. Designating National Forest Cities in China: Does the policy improve the urban living environment? For. Policy Econ. 2021, 125, 102400. [Google Scholar] [CrossRef] [Scilit]
- Wang, Y.; Zou, F.; Guo, W.; Lu, W.; Deng, Y. Impact of Forest City Selection on Green Total Factor Productivity in China under the Background of Sustainable Development. Forests 2024, 15, 1064. [Google Scholar] [CrossRef] [Scilit]
- Dang, H.; Li, J.; Zhang, Y.; Zhou, Z. Evaluation of the Equity and Regional Management of Some Urban Green Space Ecosystem Services: A Case Study of Main Urban Area of Xi’an City. Forests 2021, 12, 813. [Google Scholar] [CrossRef] [Scilit]

Disclaimer/Publisher’s Note: The statements, opinions and data contained in all publications are solely those of the individual author(s) and contributor(s) and not of MDPI and/or the editor(s). MDPI and/or the editor(s) disclaim responsibility for any injury to people or property resulting from any ideas, methods, instructions or products referred to in the content. |
© 2026 by the authors. Licensee MDPI, Basel, Switzerland. This article is an open access article distributed under the terms and conditions of the Creative Commons Attribution (CC BY) license.