


Abstract
Supply chain sustainability in the mining industry depends not only on operational efficiency and economic performance but also on the ability of organizations to anticipate, assess, and manage interconnected risks that may disrupt the continuity and resilience of supply chain activities. However, the identification and prioritization of individual risks alone may not adequately represent their interdependencies or relative exposure across broader risk categories. This study develops and applies an integrated framework for assessing supply chain risks in the iron ore industry, with particular attention to the implications of risk management for sustainable industrial operations. The framework combines the Delphi technique, probability–impact assessment, the Decision-Making Trial and Evaluation Laboratory (DEMATEL) method, a weighted Risk Exposure Index (REI), an illustrative proportional variation assessment, and examination of organizational risk registers as complementary evidence. The framework was applied to the Gohar-Zamin Mining and Industrial Complex in Iran. A nine-member expert panel contributed to risk identification and DEMATEL assessment, while 64 employees and managers of the organization evaluated the identified risks. Twelve critical risks were identified and classified into four dimensions: supply, planning, process, and demand. Probability–impact assessment ranked equipment failure (21.1), demand underestimation (20.2), and dependency on a single supplier (19.4) as the three highest-priority risks. DEMATEL analysis identified dependency on a single supplier (D − R = 2.09), supplier reliability issues (1.32), and supplier quality deficiencies (0.53) as the principal positive net-influence risks, indicating their perceived driving roles within the assessed network. The weighted REI analysis showed that demand risks had the highest category-level exposure (17.04), followed by process (15.76), supply (15.50), and planning risks (14.68). An illustrative ±10% proportional variation assessment was conducted to demonstrate the numerical effects of uniform changes in the composite scores of the three highest-priority risks; it was not intended to establish ranking robustness. Overall, the findings provide an integrated perspective on individual risk priorities, category-level exposure, and expert-perceived interdependencies. The proposed framework can support more informed risk governance, operational continuity, and economic sustainability in iron ore supply chains by helping decision-makers identify vulnerabilities and coordinate risk management priorities across organizational functions.
1. Introduction
Supply chains are exposed to disruptions arising from market volatility, technological complexity, environmental uncertainty, and geopolitical instability [1,2,3]. Although globalization, global sourcing, lean operations, and interconnected logistics networks have improved operational efficiency, they have also increased the interdependence of supply chain activities and the potential for disruptions to generate operational, financial, and strategic consequences [4,5]. Supply Chain Risk Management (SCRM) therefore focuses on identifying, assessing, mitigating, and monitoring risks across interconnected supply chain activities rather than considering individual risks in isolation [6].
The importance of an integrated SCRM approach has become increasingly evident following major disruptive events, including the COVID-19 pandemic, geopolitical conflicts, trade restrictions, energy market instability, transportation bottlenecks, and commodity price fluctuations [7,8,9,10]. Such events illustrate how a disruption originating in one supply chain activity may affect other activities through operational and organizational dependencies. Accordingly, effective risk assessment requires attention not only to the probability and potential impact of individual risks but also to the relationships through which their effects may extend across the supply chain [11].
Mining supply chains provide a particularly relevant context for this type of assessment. Their risk exposure is shaped by high capital intensity, long project lifecycles, extensive infrastructure requirements, geological uncertainty, dependence on specialized equipment, and fluctuations in commodity markets [12,13]. These characteristics create vulnerabilities across procurement, planning, production, transportation, inventory management, and sales activities, with potential consequences for operational continuity, productivity, profitability, and long-term competitiveness [14]. Within this context, the iron ore industry has strategic importance because iron ore is a primary raw material for steel production [15]. Disruptions in iron ore supply chains may consequently affect downstream activities in construction, manufacturing, infrastructure development, transportation, and energy systems [16]. These supply chains also involve multiple interconnected stakeholders, including mining companies, equipment suppliers, logistics providers, transportation contractors, processing facilities, distributors, and industrial customers. Dependencies among these stakeholders provide pathways through which disruptions in one part of the chain may influence other parts [17].
From a sustainability perspective, the continuity and reliability of mining supply chains are important for maintaining the long-term viability of industrial production and supporting the economic sustainability of resource-dependent sectors. Disruptions in the supply of critical materials, equipment failures, weaknesses in production planning, and fluctuations in customer demand may increase operational uncertainty, reduce production efficiency, and undermine the effective utilization of industrial resources. In large-scale iron ore operations, these vulnerabilities may also affect the reliability of raw material supply to downstream steel production. Accordingly, systematic identification and prioritization of supply chain risks can contribute to more informed industrial decision-making by supporting operational continuity, improving organizational preparedness, and strengthening supply chain resilience. Within this context, an integrated risk assessment framework provides a practical analytical basis for aligning risk management priorities with the broader objectives of sustainable industrial development.
For the purpose of this study, supply chain risks are examined through four related dimensions: supply, planning, process, and demand. Supply risks concern the availability, continuity, and reliability of materials, equipment, and suppliers. Planning risks relate to forecasting, production planning, and the coordination of supply chain requirements. Process risks arise during the execution of operational activities, including production and quality control. Demand risks concern uncertainty in customer requirements and market demand, including the consequences of inaccurate demand estimation. These dimensions are analytically distinguished but are not independent. For example, inaccurate demand forecasts may affect production plans and procurement requirements; supply disruptions may constrain production; and process or equipment failures may affect the organization’s ability to meet customer requirements. Thus, risk exposure may develop through interactions among these dimensions rather than remaining confined to the organizational function in which a risk initially occurs. For example, a disruption in the supply of critical spare parts may delay equipment maintenance and increase the likelihood of equipment failure. Such a disruption may reduce production capacity, complicate production planning, and ultimately affect the organization’s ability to meet customer demand. Similarly, inaccurate demand forecasts may result in inappropriate production plans and procurement decisions, leading to inventory imbalances or shortages. These examples illustrate how supply, planning, process, and demand risks may interact across different stages of the iron ore supply chain.
Recent research has increasingly addressed supply chain resilience [18,19], disruption propagation [20], systemic vulnerability [21,22], and digital risk monitoring [23,24]. In mining and mineral supply chains, research attention has also been directed toward resource dependency [25], geopolitical uncertainty [26], critical mineral shortages [27], energy-transition pressures, and commodity market volatility [28]. Despite these developments, important gaps remain in the assessment of interdependent risks in large-scale iron ore supply chains.
First, although resilience optimization, network design, technological solutions, and strategic sourcing have received considerable attention, there remains a need for integrated risk assessment approaches that bring together risk identification, prioritization, and analysis within a common framework [20,24]. Second, while disruption propagation and interconnected vulnerabilities are recognized in the literature, empirical examination of the relationships among individual risks in mining supply chains remains limited [22,28]. Third, evidence comparing the relative exposure associated with supply, planning, process, and demand risks in large-scale iron ore supply chains, particularly in developing economies, is still limited [25,29]. Fourth, studies that rely primarily on expert judgment or quantitative modelling do not necessarily incorporate organizational risk documentation as a complementary source of evidence. The integration of expert assessments with organizational risk registers and documented risk management practices therefore represents another relevant area for investigation [30,31]. Table 1 summarizes these research gaps and the corresponding contributions addressed in the present study.
Table 1.
Research gaps identified in recent supply chain risk management literature and contributions of the present study.
To address these gaps, this study develops and applies an integrated framework for assessing supply chain risks and supporting sustainable industrial operations in the Gohar-Zamin Mining and Industrial Complex, one of the major iron ore producers in Iran. The framework combines Delphi-based risk identification, probability–impact assessment, DEMATEL-based analysis of perceived interrelationships among risks, a Risk Exposure Index (REI), sensitivity analysis, and examination of organizational risk registers. By combining these components, the study considers three complementary aspects of supply chain risk: the criticality of individual risks, the influence relationships perceived among risks, and the distribution of risk exposure across major supply chain dimensions. In this way, the framework extends beyond ranking risks solely according to their probability and impact and provides an integrated assessment of risk exposure in the case organization.
The contributions of this study are fourfold. First, it develops and applies an integrated, industry-specific framework for assessing supply chain risks in a large-scale iron ore operation. Second, it uses DEMATEL to examine the perceived influence relationships among identified risks and distinguish risks assessed as influential from those assessed as predominantly influenced by others. Third, it applies a Risk Exposure Index (REI) to compare risk exposure across the four supply chain dimensions considered in the study. Fourth, it examines organizational risk registers alongside expert-based assessments to provide an additional organizational perspective on the identified risks.
Accordingly, the objectives of this study are to: (1) identify and classify the major supply chain risks affecting the case organization; (2) assess and prioritize these risks based on their probability and impact; (3) examine the perceived influence relationships among the identified risks using DEMATEL; (4) compare risk exposure across supply, planning, process, and demand dimensions using the REI; and (5) examine the consistency of the assessment findings with the organization’s documented risk registers. The Gohar-Zamin Mining and Industrial Complex provides the empirical setting for this investigation because of its important position in Iran’s mining sector and its contribution to the national steel value chain.
2. Case Study Description
2.1. Background of the Gohar-Zamin Mining and Industrial Complex
The Gohar-Zamin Mining and Industrial Complex, located in Sirjan, Kerman Province, is one of Iran’s major iron ore production centers and an important supplier of raw materials to the country’s steel industry. Its activities encompass the extraction and processing of iron ore and the production and distribution of iron ore products, including concentrate and pellets, which serve as inputs for downstream steel manufacturing. The organization operates through an extensive network involving suppliers of equipment and consumables, service providers, transportation contractors, internal processing facilities, and industrial customers [32].
The complex was selected as the case study because of its strategic position in the Iranian iron ore sector, the scale and functional diversity of its operations, and the interconnected nature of its supply chain activities. These characteristics provide a relevant industrial setting for examining supply chain risks across procurement, internal operations, transportation, and market-related activities. Furthermore, the availability of professional assessments and departmental risk records within the organization provides an opportunity to examine supply chain risks using both expert-based evaluations and organizational documentation.
2.2. Supply Chain Structure of the Case Organization
The supply chain of the Gohar-Zamin Mining and Industrial Complex comprises four interconnected stages: upstream supply, internal operations, downstream distribution, and market interface. The upstream stage involves the procurement of mining equipment, spare parts, consumables, energy resources, and technical services. Internal operations cover extraction, crushing, concentration, pelletizing, maintenance, quality control, and inventory management. The downstream stage includes the transportation, distribution, and delivery of iron ore products to steel manufacturers and other industrial customers. Finally, the market interface involves demand forecasting, customer relationship management, and the coordination of production with market requirements. These stages are functionally distinct but operationally interdependent. For example, delays in equipment or consumable procurement may constrain production activities, while transportation disruptions may affect product delivery and customer service. Similarly, inaccurate demand forecasts may lead to mismatches between production plans, inventory levels, and market requirements. Consequently, the assessment of supply chain risks in the case organization requires consideration of both the individual functions and the potential interactions among them. The main entities and material flows within the organization’s supply chain are illustrated in Figure 1 [33].
Figure 1.
Supply chain structure of the Gohar-Zamin Mining and Industrial Complex.
3. Research Methodology
3.1. Research Design
This study adopts a sequential, multi-stage research design integrating qualitative expert-based risk identification, quantitative risk assessment, interdependency analysis, and organizational risk documentation. The design was developed to identify and classify supply chain risks, evaluate their probability and impact, examine the influence relationships perceived among them, and compare the assessment findings with risks documented in the case organization’s departmental risk registers. The research methodology consists of four consecutive phases:
- Phase I: Supply chain risk identification. Potential supply chain risks affecting the Gohar-Zamin Mining and Industrial Complex were identified through a Delphi process involving nine experts with relevant professional experience. This phase generated the initial set of risks considered in the subsequent analyses.
- Phase II: Risk classification and development of the Risk Breakdown Structure (RBS). The identified risks were organized into a hierarchical structure and classified into four analytical dimensions: supply, planning, process, and demand. This classification provided a consistent basis for the subsequent assessment and comparison of risk categories.
- Phase III: Quantitative risk assessment and interdependency analysis. Sixty-four professionals, managers, and supply chain specialists evaluated the identified risks in terms of probability of occurrence and impact severity using a five-point scale. The resulting assessments were used to calculate risk scores and prioritize individual risks. DEMATEL analysis was subsequently employed to examine the influence relationships perceived among the identified risks, while the Risk Exposure Index (REI) was used to compare exposure across the four risk dimensions.
- Phase IV: Organizational comparison and contextual examination. The findings from the expert-based assessment were compared with documented risk registers obtained from the procurement and supply management, warehouse management, transportation and logistics, and sales and marketing departments. This comparison provided an additional organizational perspective on the identified risks and supported the interpretation of the assessment findings.
It is important to distinguish between the four analytical risk dimensions and the organizational departments from which risk documentation was obtained. The former represent the classification framework used for risk assessment, whereas the latter represent the functional units whose documented risk records were examined. All primary data collection activities were conducted during spring 2026. These activities included the iterative Delphi consultation, the questionnaire survey of organizational employees and managers, and the DEMATEL assessments completed by the expert panel. The overall research procedure and the relationships among its methodological phases are presented in Figure 2. During the preparation of this manuscript, the authors used ChatGPT 4.0 for the purposes of visual and quality enhancement of figures.
Figure 2.
Integrated supply chain risk assessment framework adopted in this study, showing the complementary roles of risk prioritization, expert-perceived interdependency analysis, proportional variation assessment, and organizational risk-register comparison.
3.2. Phase I: Supply Chain Risk Identification
The first phase of the research focused on identifying and consolidating the supply chain risks relevant to the Gohar-Zamin Mining and Industrial Complex. To achieve this, a Delphi panel comprising nine experts was established. The panel members were selected based on their professional experience and familiarity with activities relevant to mining supply chains. The panel comprised nine experts selected purposively based on their professional experience and familiarity with the supply chain activities of the mining industry. Their areas of expertise covered mining operations, procurement management, logistics, inventory control, production planning, and industrial supply chain management. This selection was intended to ensure that the risk identification process incorporated professional perspectives from different functions relevant to the case organization. Their areas of expertise covered mining operations, procurement management, logistics, inventory control, production planning, and industrial supply chain management. This combination of expertise was intended to incorporate perspectives from different functional areas of the organization and to avoid restricting risk identification to a single operational or managerial perspective.
The Delphi consultation was conducted through four iterative rounds involving the nine-member expert panel. During the initial round, experts reviewed the preliminary list of potential supply chain risk factors and provided comments on their relevance to the case organization. In subsequent rounds, the consolidated feedback was returned to the panel for further review and refinement. The process focused on clarifying risk descriptions, identifying overlapping items, and consolidating conceptually similar risks. Following these iterative assessments, the experts collectively retained twelve risk factors for the subsequent quantitative analysis. The final selection was based on the panel’s collective professional judgment, considering the relevance of each factor to the organization’s supply chain activities, its conceptual distinctiveness, and its suitability for separate probability–impact assessment. No predefined numerical consensus threshold was imposed; instead, the final set reflected the collective agreement reached through the iterative consultation process. The Delphi experts were purposively selected based on their professional experience and direct familiarity with activities relevant to the organization’s supply chain. The selection aimed to cover complementary areas of expertise, including mining operations, procurement, logistics, inventory control, production planning, and industrial supply chain management. Similarly, the questionnaire respondents were selected from employees and managers affiliated with the case organization who had professional involvement in, or sufficient familiarity with, the relevant supply chain activities. This approach was intended to obtain informed internal assessments rather than a statistically representative sample of all employees.
3.3. Phase II: Risk Classification and Development of Risk Breakdown Structure
Following the identification phase, the consolidated risk factors were organized into a hierarchical Risk Breakdown Structure (RBS) to provide a consistent basis for quantitative assessment and subsequent analysis. The classification was developed around four analytical dimensions: Supply Risks, Planning Risks, Process Risks, and Demand Risks. These dimensions represent the principal sources of supply chain risk considered in this study and were used consistently in the subsequent probability–impact assessment and calculation of the Risk Exposure Index (REI).
The classification distinguishes between the analytical dimensions of risk and the organizational functions involved in supply chain activities. Accordingly, procurement and supplier management, warehousing, transportation and logistics, and sales and marketing are treated as organizational functions through which risks may arise or become evident; they are not considered additional analytical risk dimensions. This distinction avoids overlap between the functional structure of the case organization and the risk classification used for quantitative analysis. Based on the consolidated risk factors, twelve risks were retained for detailed assessment. The initial risk factors identified through the Delphi consultation were reviewed to remove overlapping descriptions and consolidate conceptually similar items. The final selection retained risks that were considered directly relevant to the organization’s supply chain activities and sufficiently distinct for separate probability–impact assessment. This screening and consolidation process resulted in twelve risk factors, which were subsequently assigned to the four analytical dimensions according to their principal characteristics. These risks were assigned to the four analytical dimensions according to their principal characteristics and the supply chain activities they represent. The resulting RBS provided a structured basis for comparing risk exposure across the four dimensions and for examining the interrelationships among the selected risks using the DEMATEL method. The classification adopted in this study is presented in Table 2.
Table 2.
Risk Breakdown Structure (RBS) of the identified supply chain risks in the Gohar-Zamin Mining and Industrial Complex.
3.4. Phase III: Quantitative Risk Assessment
Following risk identification and classification, the twelve selected risk factors were evaluated through a structured questionnaire administered to 64 purposively selected employees and managers of the Gohar-Zamin Mining and Industrial Complex. The respondents assessed each risk separately in terms of two dimensions: probability of occurrence (P) and impact severity (I). Both dimensions were measured using a five-point Likert scale ranging from 1 (Very Low) to 5 (Very High). Higher probability ratings indicate a greater perceived likelihood of risk occurrence, whereas higher impact ratings indicate more severe potential consequences for the organization’s supply chain activities. The use of these two dimensions provided a consistent basis for evaluating the relative severity of the identified risks [34]. The probability and impact values reported for the twelve risk factors are presented in Section 4.2 and were used as inputs to the risk-scoring procedure described in Section 3.5. The probability and impact ratings were aggregated across the 64 respondents using the arithmetic mean for each risk factor and assessment dimension. Thus, the values reported in Section 4.2 represent the mean probability and mean impact scores calculated from the corresponding responses and were used in the subsequent risk-scoring procedure. Although the aggregate values were retained, the respondent-level dataset and detailed aggregation files were not available for independent reconstruction at the time of the present revision.
3.5. Risk Scoring Model
For each identified risk factor, the probability (Pi) and impact (Ii) values reported in Section 4.2 were used as the respective inputs to the risk-scoring procedure. The risk score (RSi) was calculated as the product of these two values, as expressed in Equation (1) [35]:
RSi = Pi∙Ii
Accordingly, the reported risk scores represent the products of the corresponding probability and impact values presented in Section 4.2. The calculated scores were rounded to one decimal place for presentation. For example, the risk score for equipment failure was calculated as 4.8 × 4.4 = 21.12, which was reported as 21.1. The probability–impact scores were used to rank the twelve identified risks according to their relative severity. This ranking provides a basis for prioritizing managerial attention and identifying risks that require more immediate consideration. The resulting scores and their corresponding priority levels are presented in Section 4.2. For interpretation, the calculated risk scores were classified into five levels using continuous, non-overlapping intervals, as presented in Table 3: Low (1 ≤ RS ≤ 5), Moderate (5 < RS ≤ 10), Significant (10 < RS ≤ 15), High (15 < RS ≤ 20), and Critical (20 < RS ≤ 25). This classification accommodates decimal-valued risk scores without leaving gaps or creating overlaps between adjacent risk levels.
Table 3.
Classification of supply chain risk scores based on the probability–impact assessment.
3.6. DEMATEL-Based Risk Interdependency Analysis
Traditional probability–impact risk assessment methods effectively prioritize risks according to their assessed severity but do not explicitly characterize the interdependencies among them. In supply chains, however, risks may be interconnected, and the occurrence or intensification of one risk may be associated with changes in other risks. To examine these perceived interdependencies, the Decision-Making Trial and Evaluation Laboratory (DEMATEL) method was incorporated into the proposed framework. In this study, DEMATEL was employed to examine the relative influence relationships among the identified risks and to distinguish risks with predominantly outgoing influence from those that are predominantly influenced by other risks. The resulting cause–effect classification represents expert-assessed relationships rather than empirically verified causal mechanisms. The degree of influence of each risk on every other risk was assessed using a five-point scale ranging from 0 (No Influence) to 4 (Very High Influence). Based on these assessments, the initial direct-relation matrix, , was constructed, where xij represents the direct influence of risk (i) on risk (j). The complete initial direct-relation matrix obtained from expert evaluations is provided in Appendix A (Table A1).
The DEMATEL assessments were completed by the same nine experts who participated in the Delphi consultation. Each expert independently evaluated the direct influence of every identified risk on the other risks using the five-point influence scale. The nine individual direct-relation matrices were then aggregated by calculating the arithmetic mean of the corresponding matrix elements. The resulting aggregated initial direct-relation matrix is reported in Appendix A (Table A1) and was used as the input for all subsequent DEMATEL calculations. To ensure reproducibility, the calculations reported in this study were performed directly using the matrix values presented in Table A1. The aggregated initial direct-relation matrix was normalized according to the procedure described in [36]. The normalization factor was determined as the maximum sum of the elements across all rows of the initial direct-relation matrix:
Accordingly, the normalized direct-relation matrix was obtained as:
where n is the number of identified risk factors (12), xij denotes the element in row i and column j of the initial direct-relation matrix, and dij represents the corresponding normalized direct influence. The normalization factor of 15 was obtained from the maximum row sum of the matrix presented in Appendix A (Table A1).
The total-relation matrix, , was subsequently calculated using the normalized direct-relation matrix as follows [36]:
where I is the identity matrix of order n. The total-relation matrix represents both direct and indirect influence relationships among the identified risk factors.
T = D(I − D)−1
For each risk factor i, two indicators were calculated from the total-relation matrix. The first represents the total influence dispatched by risk i to the other risks, whereas the second represents the total influence received by risk i from the remaining risks. These indicators are calculated as:
where Di denotes the total outgoing influence of risk i, and Ri denotes its total incoming influence.
The overall prominence of each risk in the interdependency network was determined by combining its dispatched and received influences:
Pi = Di + Ri
A higher prominence value indicates that the corresponding risk is more strongly involved in the overall influence network, either through the influence it exerts on other risks or through the influence it receives from them. The net influence of each risk was determined by subtracting its received influence from its dispatched influence:
Ni = Di − Ri
A positive value of Ni indicates that the risk has greater net outgoing than incoming influence and is therefore assigned to the cause group. Conversely, a negative value indicates that the risk receives greater influence than it dispatches and is assigned to the effect group. A value close to zero indicates a relatively balanced relationship between outgoing and incoming influence.
The cause–effect classification provides a relative interpretation of the influence structure represented by the expert-assessed total-relation matrix. The DEMATEL results are therefore interpreted as an expert-based representation of perceived risk interdependencies and should not be regarded as proof of actual causal relationships or as confirmation that a particular risk necessarily produces another risk in practice. All calculations were performed using the matrix values reported in Appendix A (Table A1), with the normalization factor fixed at 15. Intermediate calculations were retained at full numerical precision, and rounding was applied only when presenting the final results. The DEMATEL findings are presented through the prominence Di + Ri and net influence Di − Ri indicators for the twelve risk factors. These indicators provide the basis for examining the relative importance of each risk and its position within the perceived cause–effect structure.
3.7. Risk Exposure Index
To compare the relative risk exposure across the four supply chain risk dimensions, a weighted Risk Exposure Index (REI) was calculated [37]. The index aggregates the risk scores of individual risk factors while assigning a relative weight to each risk according to its probability of occurrence. This approach allows the comparison of risk exposure across categories while accounting for differences in the occurrence probabilities of the identified risks. The REI for supply chain category (j) is calculated as follows:
where REIj represents the Risk Exposure Index of category j, RSi is the probability–impact risk score of risk factor i, and Wij is the normalized probability weight assigned to that risk within category j. The normalized probability weight is determined as:
where Pi is the assessed probability of occurrence of risk factor i, and the denominator represents the sum of the probability scores of all risk factors assigned to category j. Consequently, the weights within each category sum to unity [38,39].
For clarity, the REI is calculated as the sum of the probability-weighted risk scores within each category. Because the probability weights are normalized to sum to one within each category, the resulting index is a weighted average and does not require an additional division by the number of risk factors. As defined in Equation (9), this formulation preserves the original 1–25 scale of the individual risk scores and facilitates direct comparison among categories containing different numbers of risk factors. A higher REI indicates a greater level of probability-weighted comparative risk exposure in the corresponding supply chain dimension [40].
For example, the REI for the demand risk category was calculated using the three associated risk factors: demand underestimation, demand overestimation, and inadequate customer analysis. Their probability scores were 4.6, 4.3, and 4.0, respectively, while their corresponding risk scores were 20.2, 17.6, and 12.8. Accordingly, the category-level index was calculated as
The same procedure was applied to the supply, planning, and process categories. Because the individual risk score already incorporates the probability of occurrence, the probability-based weighting scheme gives additional relative weight to risks with higher assessed probabilities. Therefore, the REI should be interpreted as a probability-weighted comparative index of risk severity within each category, rather than as an independent measure of risk severity or as an indicator of inter-risk influence. The latter is examined separately through the DEMATEL analysis. The additional probability weighting was adopted to give greater relative importance to risks assessed as more likely to occur when comparing risk exposure within each category. This weighting reflects the practical consideration that, for managerial prioritization, risks with similar probability–impact scores may warrant different levels of attention when their assessed probabilities differ. By incorporating probability into both the individual risk score and the category-level weighting coefficient, the REI intentionally places additional emphasis on risks with higher assessed occurrence probabilities. This feature is a deliberate, study-specific weighting choice rather than a mathematically neutral aggregation procedure. Consequently, the REI should be interpreted as a probability-weighted comparative indicator designed for prioritization within the four categories considered in this case study, not as a universal or independently validated measure of supply chain risk exposure.
3.8. Organizational Risk-Register Comparison as Complementary Evidence
The identified risks were examined alongside the departmental risk registers available from the Gohar-Zamin Mining and Industrial Complex, including records from procurement and supply management, warehouse management, transportation and logistics, and sales and marketing. These records were used as complementary organizational evidence to provide context for the expert-based risk assessment. The purpose of this comparison was not to establish a one-to-one correspondence between all documented risks and the twelve factors selected for quantitative assessment, but to examine how the identified risks relate to the broader range of risks recognized within the organization. Accordingly, the organizational records were treated as a supplementary source of evidence rather than as an independent empirical validation of the probability–impact or DEMATEL results.
3.9. Validity and Reliability
The methodological rigor of the study was supported by complementary procedures addressing content validity and the consistency of the assessment instrument. Content validity was addressed through the Delphi consultation, in which nine industry experts reviewed and refined the identified risk factors. The participation of 64 employees and managers familiar with the organization’s supply chain activities provided an organizational basis for the subsequent probability–impact assessment. The questionnaire applied a standardized five-point scale to assess the probability and impact of each identified risk. An overall Cronbach’s alpha coefficient of 0.87 was reported based on the available questionnaire data, comprising all 24 assessment items associated with the probability and impact ratings of the twelve risk factors [41]. However, because these items cover multiple distinct risk factors and two analytically different assessment dimensions, the resulting coefficient should be interpreted cautiously. In particular, a single overall alpha coefficient does not establish that all items measure one underlying construct, nor does it independently demonstrate the reliability of each individual risk assessment or the equivalence of measurement reliability across the different risk factors. Accordingly, the coefficient is reported as a descriptive indication of the interrelatedness of the combined assessment items rather than as conclusive evidence of the overall measurement reliability of the questionnaire. Furthermore, although the aggregated probability and impact values used in the analysis were retained, respondent-level records and detailed aggregation files were unavailable for independent reconstruction. This limitation restricts the extent to which the reported reliability coefficient and the underlying questionnaire-based assessments can be independently verified.
4. Results and Discussion
4.1. Supply Chain Risk Architecture of the Gohar-Zamin Mining and Industrial Complex
The integration of the Delphi findings, expert assessments, and organizational risk registers provided the basis for developing a structured representation of supply chain risks in the Gohar-Zamin Mining and Industrial Complex. The identified risks covered several organizational functions, including procurement and supply management, production and inventory management, transportation and logistics, and sales and marketing. To organize these risks systematically, a hierarchical Risk Breakdown Structure (RBS) was developed, as presented in Table 4. The hierarchical representation of the identified risk areas and their associated risk factors is illustrated in Figure 3.
Table 4.
Risk Breakdown Structure (RBS) of the Gohar-Zamin Mining and Industrial Complex, showing organizational functions and representative supply chain risks.
Figure 3.
Organizational Risk Breakdown Structure (RBS) of the Gohar-Zamin Mining and Industrial Complex, showing the main organizational functions and representative supply chain risks, alongside the four analytical dimensions used for quantitative risk assessment.
The organizational functions presented in the RBS represent the operational areas in which supply chain risks may arise, whereas the four analytical dimensions adopted in the subsequent quantitative assessment are Supply, Planning, Process, and Demand. These dimensions provide a consistent basis for risk prioritization, interdependency analysis, and cross-category comparison using the Risk Exposure Index (REI). The resulting architecture indicates that supply chain vulnerability in the case organization is distributed across multiple interconnected organizational functions rather than being confined to a single operational area. Risks may originate in upstream activities, arise within internal operations, or emerge at the interface with transportation, customers, and markets. This structure provides the organizational context for the subsequent quantitative assessment of the 12 selected critical supply chain risks. It should be noted that the risks listed in Table 4 represent a broader organizational risk structure derived from the functional areas and available departmental records. They are not intended to constitute the same set of twelve risk factors subjected to quantitative assessment. The twelve factors used in the probability–impact and DEMATEL analyses were the consolidated risks retained through the Delphi process and classified into the four analytical dimensions of supply, planning, process, and demand. Therefore, some risks appearing in the organizational RBS, such as export interruption and receivable default, provide additional organizational context but were not included in the twelve-factor quantitative assessment.
4.2. Prioritization of Critical Supply Chain Risks
The identified risks were evaluated using the probability–impact framework, and the prioritization results are summarized in Table 5. The distribution of the assessed risks in the probability–impact matrix is illustrated in Figure 4. The calculated risk scores ranged from 10.2 to 21.1, indicating considerable variation in the assessed levels of risk exposure.
Table 5.
Prioritization of critical supply chain risks based on probability, impact severity, and calculated risk scores.
Figure 4.
Probability–impact matrix showing the distribution of the 12 prioritized supply chain risks based on their assessed probability and impact scores. The risk scores are calculated as the product of probability and impact.
Equipment failure received the highest risk score (21.1), with a probability score of 4.8 and an impact score of 4.4. This result highlights the importance of equipment reliability in maintaining operational continuity in the case organization. Given the dependence of iron ore production and processing activities on industrial equipment, equipment-related disruptions represent a significant operational concern. At the other end of the ranking, inadequate process documentation received the lowest score (10.2), reflecting a comparatively lower assessed level of risk exposure among the 12 selected factors.
Demand underestimation ranked second, with a risk score of 20.2, followed by dependency on a single supplier, with a score of 19.4. The difference between the first- and second-ranked risks was only 0.9 points, indicating that demand-related uncertainty was assessed as a major concern alongside equipment-related risks. This result emphasizes the importance of considering both operational reliability and demand estimation when prioritizing supply chain risks in the case organization. The third-ranked risk, dependency on a single supplier, highlights the vulnerability associated with supplier concentration. Dependence on a limited source of supply may increase an organization’s exposure to procurement-related disruptions and reduce its flexibility in responding to supply uncertainties. Demand overestimation ranked fourth (17.6), further indicating the importance of demand assessment in supply chain risk management. The remaining risks had scores between 10.2 and 15.6. These included inaccurate production planning (15.6), weak forecasting methods (15.2), quality control problems (13.7), inadequate contingency planning (13.3), supplier reliability issues (13.3), supplier quality deficiencies (13.0), and inadequate customer analysis (12.8). Although their scores were lower than those of the four highest-ranked risks, they still represent relevant areas for managerial attention. Overall, the prioritization results show that critical supply chain risks in the case organization are distributed across supply, planning, process, and demand-related activities. The findings therefore suggest that risk mitigation should not focus exclusively on equipment reliability or procurement-related issues; demand assessment, forecasting, and production planning should also be considered in the prioritization of risk management actions. For the subsequent DEMATEL analysis, the 12 identified risks were coded as R1–R12, as presented in Table 6.
Table 6.
Coding scheme of critical supply chain risks used in the DEMATEL analysis.
4.3. DEMATEL-Based Analysis of Supply Chain Risk Interdependencies
The DEMATEL analysis was conducted to examine the perceived influence relationships among the twelve identified supply chain risks. The results, including the prominence and net influence indicators and the corresponding cause–effect classifications, are presented in Table 7. In terms of prominence (D + R), inaccurate production planning exhibited the highest value (5.04), followed by weak forecasting methods (4.95) and demand underestimation (4.47). These results indicate that planning-related and demand-related risks occupy prominent positions within the assessed network of perceived interdependencies. The prominence indicator reflects the overall involvement of each risk in the influence network, considering both the influence it exerts and the influence it receives.
Table 7.
DEMATEL results showing the prominence (D + R), net effect (D − R), and cause–effect classification of supply chain risks.
The net influence values (D − R) provide a complementary perspective by distinguishing risks with predominantly outgoing influence from those receiving greater influence from other risks. Five risk factors exhibited positive net influence values and were therefore classified within the cause group, whereas the remaining seven factors were classified within the effect group. Dependency on a single supplier showed the strongest positive net influence (D − R = 2.09), followed by supplier reliability issues (1.32), supplier quality deficiencies (0.53), weak forecasting methods (0.21), and inadequate process documentation (0.02). These results suggest that supplier-related risks, particularly dependency on a single supplier and supplier reliability, were perceived by the expert panel as the principal driving factors within the assessed network. In contrast, inaccurate production planning exhibited the most negative net influence value (D − R = −0.83), followed by inadequate customer analysis (−0.77), quality control problems (−0.72), and demand underestimation (−1.39). Equipment failure and demand overestimation also showed slightly negative net influence values (−0.11 for each), placing them within the effect group. These classifications indicate that, within the assessed influence network, these factors were perceived as receiving greater influence from other risks than they exerted.
An important distinction emerges between the prominence and net influence results. Although inaccurate production planning exhibited the highest prominence, its negative net influence indicates that it was perceived as relatively more influenced by other risks. Conversely, dependency on a single supplier had a lower prominence but the highest positive net influence, identifying it as the strongest net driving factor in the assessed network. Overall, the results highlight the importance of supplier-related vulnerabilities and planning-related interdependencies in the case organization. These findings represent expert-assessed perceptions of risk interdependencies and should not be interpreted as evidence of empirically verified causal mechanisms or actual disruption propagation.
The net influence values (D − R) distinguish between risks perceived by the expert panel as exerting predominantly outgoing influence and those perceived as receiving greater influence from other risks. Five risk factors exhibited positive D − R values and were therefore classified within the cause group, whereas the remaining seven factors were classified within the effect group. Dependency on a single supplier showed the strongest positive net influence (D − R = 2.09), followed by supplier reliability issues (1.32), supplier quality deficiencies (0.53), weak forecasting methods (0.21), and inadequate process documentation (0.02). These findings identify supplier-related vulnerabilities, particularly supplier dependency and reliability, as important perceived driving factors within the assessed network. In contrast, demand underestimation exhibited the most negative net influence (−1.39), followed by inaccurate production planning (−0.83), inadequate customer analysis (−0.77), quality control problems (−0.72), inadequate contingency planning (−0.25), equipment failure (−0.11), and demand overestimation (−0.11). These risks were classified within the effect group, indicating that their total incoming influence exceeded their outgoing influence in the expert-assessed network. The prominence and net influence distributions of the twelve risks are illustrated in Figure 5. Overall, the results highlight the importance of distinguishing between risks with high individual severity and those perceived as exerting greater influence on other risks. These classifications represent expert-perceived interdependencies and should not be interpreted as empirically verified causal relationships.
Figure 5.
DEMATEL prominence–net influence diagram showing the distribution of the 12 supply chain risks into cause and effect groups based on their recalculated D + R and D − R values.
Figure 6 presents a conceptual mapping of the main supply chain risks identified in the Gohar-Zamin Mining and Industrial Complex. The 12 risks assessed quantitatively are organized into four analytical dimensions: supply, planning, process, and demand. Additional risks documented in the organizational risk registers are presented separately to distinguish them from the risks included in the quantitative assessment. This figure provides an overview of the risk structure and its organizational context; it does not represent a direct reconstruction of the pairwise influence relationships obtained from the DEMATEL total relation matrix.
Figure 6.
Conceptual mapping of the 12 quantitatively assessed supply chain risks across four analytical dimensions, together with additional risks documented in the organizational risk registers and the principal positive net-influence risks identified through DEMATEL analysis.
4.4. Cross-Category Risk Exposure Analysis
To compare the relative risk exposure across the four analytical dimensions, a Risk Exposure Index (REI) was calculated for each category using the probability–impact risk scores and normalized probability weights defined in Section 3.7. The results are summarized in Table 8 and Figure 7, together with the corresponding unweighted arithmetic mean scores to illustrate the effect of the selected weighting scheme. Demand risks exhibited the highest REI (17.04), followed by process risks (15.76), supply risks (15.50), and planning risks (14.68). Comparison with the unweighted arithmetic means shows that the additional probability weighting produces relatively small changes in the category-level scores. The unweighted mean scores were 16.87 for demand risks, 15.00 for process risks, 15.23 for supply risks, and 14.70 for planning risks. The corresponding REI values were 17.04, 15.76, 15.50, and 14.68, respectively. The comparison indicates that probability weighting slightly increases the relative scores of demand, process, and supply risks, while producing a marginally lower value for planning risks. The largest difference occurs in the process category, where the REI exceeds the unweighted mean by 0.76 points, mainly reflecting the relatively high probability assigned to equipment failure, which also received the highest individual risk score. Importantly, both aggregation approaches identify demand risks as the category with the highest average risk score and planning risks as the category with the lowest score. Therefore, the overall category ordering remains unchanged, although the magnitude of the differences is affected by the additional probability weighting. This comparison illustrates the influence of the selected weighting scheme and supports the interpretation of the REI as a study-specific comparative indicator rather than a general measure of supply chain risk exposure. Overall, the results indicate that risk exposure in the Gohar-Zamin Mining and Industrial Complex is distributed across multiple supply chain dimensions. Coordinated attention to demand assessment, equipment reliability, supplier management, and production planning is therefore warranted.
Table 8.
Comparison of probability-weighted Risk Exposure Index (REI) and unweighted mean risk scores across the four supply chain risk categories.
Figure 7.
Comparative Risk Exposure Index (REI) values across the four supply chain risk categories.
4.5. Organizational Risk-Register Comparison and Contextual Interpretation
To complement the questionnaire-based risk assessment, the identified supply chain risks were examined against documented organizational risk registers obtained from the procurement and supply, warehouse management, transportation and logistics, and sales and marketing departments. The critical risks recorded in these registers are summarized in Table 9. The organizational records provide additional evidence of the types of vulnerabilities recognized within the company. Supplier dependency was identified in the procurement and supply register, while inventory discrepancy and transportation disruption were documented in the warehouse and transportation registers, respectively. The sales and marketing register also identified export interruption, accounts receivable default, and exchange rate volatility as critical concerns. Export interruption and accounts receivable default received scores of 25, while the other recorded risks received scores of 20.
Table 9.
Critical risks documented in the organizational risk registers of the Gohar-Zamin Mining and Industrial Complex.
An important distinction should be made between the 12 risk factors evaluated quantitatively through the questionnaire and the additional risks documented in the organizational registers. Although some risks correspond conceptually to the factors included in the quantitative assessment, others represent complementary organizational vulnerabilities that were not separately included in the 12-risk prioritization and DEMATEL analyses. For example, supplier dependency is conceptually consistent with the dependency on a single supplier identified in the questionnaire assessment, whereas inventory discrepancy, transportation disruption, export interruption, accounts receivable default, and exchange rate volatility provide additional perspectives on organizational risk exposure.
The risk scores reported in the organizational registers fall within the same 1–25 probability–impact scoring range used in this study. However, because the detailed scoring procedures used by the individual departments could not be independently verified, these scores are presented as recorded in the organizational documents and are not treated as directly equivalent to the questionnaire-based results. Consequently, the organizational registers should be interpreted as a complementary source of evidence rather than as a direct comparison with questionnaire-based results. Their inclusion broadens the organizational context of the assessment and illustrates that supply chain vulnerabilities extend beyond the specific risk factors selected for quantitative analysis.
4.6. Illustrative Assessment of Risk-Score Variation
An illustrative proportional variation assessment was performed to demonstrate the numerical effect of uniform ±10% changes in the composite risk scores of the three highest-priority risks. As shown in Table 10, the adjusted values were calculated by multiplying each baseline risk score by 0.90 and 1.10, respectively. The resulting values illustrate the magnitude of the score changes under these proportional adjustments. However, because the same positive multiplicative factor was applied to all three scores, their relative ordering necessarily remained unchanged. Therefore, the unchanged ranking should not be interpreted as independent evidence of ranking robustness or as a comprehensive sensitivity analysis. The exercise is limited to illustrating the numerical consequences of uniform proportional variation in the composite scores and does not assess the independent sensitivity of the underlying probability and impact components. A more comprehensive sensitivity analysis would require independent variation in these components, preferably using unrounded respondent-level data.
Table 10.
Illustrative effect of ±10% proportional variation in the composite scores of the three highest-priority supply chain risks.
4.7. Proposed Integrated Supply Chain Risk Assessment Framework
Based on the findings of the risk prioritization, DEMATEL analysis, and organizational risk-register review, an integrated conceptual framework for supply chain risk assessment in the iron ore industry is proposed. As summarized in Table 11, the framework organizes the 12 quantitatively assessed risk factors into four analytical dimensions: supply, planning, process, and demand. This classification provides a consistent structure for interpreting risk exposure and identifying areas requiring managerial attention. The supply dimension covers vulnerabilities associated with supplier concentration, supplier reliability, and supplier quality. The planning dimension addresses weaknesses in forecasting, production planning, and contingency planning. The process dimension includes equipment failure, quality control problems, and inadequate process documentation. Finally, the demand dimension comprises demand underestimation, demand overestimation, and inadequate customer analysis. Together, these dimensions provide an analytical view of the principal risk factors identified in the study.
Table 11.
Integrated conceptual framework for supply chain risk assessment in the iron ore industry.
The framework also recognizes that the 12 prioritized risk factors do not encompass every vulnerability recorded within the organization. Additional risks, including procurement delays, inventory discrepancies, transportation disruptions, export interruption, accounts receivable default, and exchange rate volatility, were identified in the departmental risk registers. These complementary risks should therefore be considered when translating the assessment results into organization-wide risk management actions. The prioritization results indicate that equipment failure, demand underestimation, and dependency on a single supplier deserve particular attention because they received the three highest risk scores. In addition, the DEMATEL results identify dependency on a single supplier, supplier reliability issues, and supplier quality deficiencies as the three risks with the highest positive net influence values. Weak forecasting methods and inadequate process documentation also belong to the cause group, although their net influence values are comparatively smaller. These findings suggest that risk management should address both high-exposure risks and factors perceived to exert influence on other risks. Accordingly, the proposed framework is intended to support coordinated risk identification, prioritization, and mitigation across organizational functions. It does not assume that the four analytical dimensions follow a fixed sequence of causal propagation. Rather, it provides a structured basis for examining potential interactions among supply chain vulnerabilities and for aligning risk management priorities with the operational and strategic objectives of the organization.
4.8. Present Implications and Future Perspective
4.8.1. Theoretical Implications
This study contributes to the supply chain risk management literature in several ways. First, it presents an integrated, case-based approach that combines risk identification, probability–impact assessment, analysis of perceived risk interdependencies, and comparison with organizational risk registers. By bringing these complementary sources of information together, the study provides a structured perspective on supply chain vulnerabilities in a large-scale iron ore operation. Second, the findings illustrate the value of distinguishing between risk severity and perceived influence within a network of interdependent risks. The probability–impact assessment identifies the risks with the highest individual scores, whereas the DEMATEL analysis distinguishes between factors perceived as exerting influence and those perceived as receiving influence. In this case, equipment failure, demand underestimation, and dependency on a single supplier received the highest probability–impact scores, whereas dependency on a single supplier (D − R = 2.09), supplier reliability issues (1.32), and supplier quality deficiencies (0.53) exhibited the highest positive net influence values. Weak forecasting methods (0.21) and inadequate process documentation (0.02) were also classified within the cause group. This distinction demonstrates why risk prioritization and interdependency analysis can provide complementary insights rather than interchangeable results. Third, the study contributes case-based evidence to the relatively limited research on supply chain risk management in the iron ore industry. The classification of the 12 assessed risks into supply, planning, process, and demand dimensions provides an analytical structure for examining vulnerabilities across different aspects of mining supply chains. The comparison with departmental risk registers further illustrates that organizationally documented vulnerabilities may extend beyond the risk factors selected for quantitative assessment. Generally, the study offers an integrated analytical perspective for examining risk severity, perceived interdependencies, and organizationally documented vulnerabilities. Its contribution lies in combining these perspectives within a single case-study framework rather than establishing universally applicable causal relationships among supply chain risks.
The findings are broadly aligned with previous research emphasizing the vulnerability of supply chains to supplier dependence, uncertainty in supply and demand, and the interdependence of operational risks [20,22,25,28,29]. In particular, the identified influence of dependency on a single supplier is consistent with previous research highlighting the vulnerability associated with concentrated sourcing and limited supplier alternatives. Similarly, the importance of weak forecasting methods and demand underestimation reinforces the role of forecasting and demand-related uncertainty in supply chain risk management. The present study extends these discussions by distinguishing between risks with high individual probability–impact scores and risks with strong perceived influence within the network. In the case organization, dependency on a single supplier emerged as the strongest perceived driving factor (D − R = 2.09), followed by supplier reliability issues (1.32) and supplier quality deficiencies (0.53). These findings should be interpreted in the context of the organizational and operational characteristics of the Gohar-Zamin Mining and Industrial Complex and should not be generalized as a universal ranking for all iron ore supply chains.
4.8.2. Managerial Implications
The findings of this study have several practical implications for managers responsible for supply chain risk management in iron ore operations. The results indicate that managerial priorities should consider both the severity of individual risks and their perceived positions within the network of risk interdependencies. First, equipment failure received the highest probability–impact score (21.1), highlighting the importance of equipment reliability for operational continuity. Managers may therefore prioritize preventive maintenance, condition monitoring, timely replacement of critical components, and the availability of essential spare parts. Equipment availability, unplanned downtime, and mean time between failures may serve as relevant performance indicators. Second, demand underestimation and demand overestimation received relatively high risk scores of 20.2 and 17.6, respectively. These findings support improvements in demand forecasting through the systematic integration of historical sales data, customer requirements, and market information into production planning. Forecast accuracy, forecast bias, and the frequency of production-plan revisions may be used to monitor progress.
Third, the recalculated DEMATEL results identified dependency on a single supplier and supplier reliability issues as the principal perceived driving risks. Procurement managers may therefore consider supplier diversification, qualification of alternative suppliers, systematic supplier performance evaluation, and monitoring of critical procurement items. The proportion of critical materials sourced from a single supplier, supplier on-time delivery, and the number of qualified alternative suppliers may provide useful monitoring indicators. Fourth, the high prominence of inaccurate production planning in the DEMATEL network suggests that production planning should be examined in conjunction with demand forecasting, procurement, and material availability. Closer coordination among these functions may help reduce mismatches between planned production and available resources. Deviations between planned and actual production, forecast deviations, and material availability may serve as relevant operational indicators.
Finally, the organizational risk registers identified additional vulnerabilities, including inventory discrepancy, transportation disruption, export interruption, accounts receivable default, and exchange rate volatility. These risks should be incorporated into departmental monitoring and organization-wide risk reviews, even though they were not separately included in the twelve-factor quantitative assessment. The proposed framework can support periodic risk reviews and help managers distinguish high-severity risks from factors perceived as driving other vulnerabilities. However, the recommendations presented above represent potential management responses to the assessment findings; their effectiveness, implementation costs, and operational outcomes were not evaluated in the present study. These aspects should therefore be examined through subsequent operational monitoring and performance-based evaluation.
4.8.3. Limitations and Future Research
Despite its methodological and practical contributions, this study has several limitations that should be considered when interpreting its findings. First, the research was conducted as a single-case study within the Gohar-Zamin Mining and Industrial Complex. Although the case provides an opportunity to examine supply chain risks in a large-scale iron ore operation, the findings may not be directly generalizable to other mining companies, commodities, or geographical contexts. Future research could apply the proposed assessment structure to multiple mining organizations and compare the resulting risk profiles across different supply chain configurations. Second, the identification and assessment of risks relied on expert knowledge and the judgments of employees and managers familiar with the case organization’s supply chain activities. Although these assessments provide valuable organizational insights, they may be influenced by individual experience, functional responsibilities, and subjective perceptions. In addition, the DEMATEL results represent perceived influence relationships rather than empirically verified causal mechanisms. Future studies could strengthen this analysis by incorporating historical disruption records, equipment performance data, procurement records, delivery performance, and other operational indicators. Third, the organizational risk registers provided complementary information on vulnerabilities documented by different departments. However, the detailed scoring procedures underlying these departmental records were not independently verified. Therefore, their reported scores should be interpreted in their organizational context rather than assumed to be directly equivalent to the questionnaire-based probability–impact scores. Future research could establish a standardized scoring protocol across departments to improve comparability.
Fourth, the variation assessment in this study was limited to applying uniform ±10% proportional adjustments to the composite risk scores of the three highest-priority risks. Because the same positive multiplicative factor was applied to all three values, the unchanged relative ranking was mathematically expected and should not be interpreted as evidence of ranking robustness. The assessment therefore illustrates only the numerical effect of proportional changes in the composite scores and does not constitute a comprehensive sensitivity analysis of the underlying probability and impact components. Future studies should conduct more detailed sensitivity analyses by independently varying probability and impact ratings, preferably using unrounded respondent-level data, to examine how changes in the underlying assessment components may affect risk scores and prioritization outcomes. Fifth, the proposed framework provides a static assessment of risk exposure and perceived interdependencies. Supply chain risks may change over time in response to market conditions, technological developments, supplier performance, and external disruptions. Future research could integrate the framework with dynamic approaches such as System Dynamics, Bayesian Networks, Agent-Based Modeling, or Monte Carlo simulation to investigate changes in risk exposure and interdependencies over time. Finally, the assessment does not explicitly quantify the cost, feasibility, or effectiveness of alternative mitigation strategies. Future research could extend the framework by incorporating mitigation costs, organizational resilience capabilities, and multi-criteria decision-making methods to support the selection and prioritization of risk-response strategies. The integration of digital technologies, predictive analytics, and real-time monitoring systems also offers opportunities to improve forecasting accuracy, supply chain visibility, and the early identification of emerging vulnerabilities.
5. Conclusions
This study developed and applied an integrated framework for identifying, prioritizing, and examining interdependencies among supply chain risks in the iron ore industry, using the Gohar-Zamin Mining and Industrial Complex in Iran as a case study. The framework combined Delphi-based risk identification, probability–impact assessment, DEMATEL, a weighted Risk Exposure Index (REI), sensitivity analysis, and examination of organizational risk registers as complementary evidence. Twelve critical risks were identified and classified into four dimensions: supply, planning, process, and demand.
The probability–impact assessment identified equipment failure (21.1), demand underestimation (20.2), and dependency on a single supplier (19.4) as the three highest-priority risks. These findings highlight the importance of equipment reliability, demand estimation, and supplier relationships in maintaining supply chain continuity. The DEMATEL analysis provided a complementary perspective on risk interdependencies. Five risks were classified in the cause group: dependency on a single supplier (D − R = 2.09), supplier reliability issues (1.32), supplier quality deficiencies (0.53), weak forecasting methods (0.21), and inadequate process documentation (0.02). These results indicate that supplier-related vulnerabilities are particularly influential within the expert-assessed risk network. However, the cause–effect classifications represent perceived influence relationships rather than empirically verified causal mechanisms. At the category level, demand risks recorded the highest REI (17.04), followed by process (15.76), supply (15.50), and planning risks (14.68). This finding demonstrates that the dimension with the highest overall exposure does not necessarily contain all the risks with the strongest perceived influence. An illustrative ±10% proportional variation assessment demonstrated the numerical effects of uniform changes in the composite scores of the three highest-priority risks. Because the same multiplicative adjustment was applied to all three scores, the unchanged ranking was mathematically expected and does not provide independent evidence of ranking robustness. Examination of organizational risk registers also provided complementary context by identifying additional concerns, including inventory discrepancies, transportation disruptions, export interruptions, accounts receivable defaults, and exchange rate volatility. These records were used for contextual comparison rather than independent quantitative validation.
From a managerial perspective, the findings support a differentiated approach to risk management. Equipment reliability, demand forecasting, and supplier dependency require attention because of their high individual risk scores, while supplier reliability, supplier quality, and process documentation deserve particular consideration because of their positions in the perceived influence network. Potential responses include strengthening preventive maintenance, improving coordination between sales and production planning, diversifying critical supply sources where feasible, monitoring supplier performance, and standardizing process documentation. Several limitations should be acknowledged. The study was conducted in a single mining complex, and the assessments relied primarily on expert and employee judgments rather than longitudinal operational data. Furthermore, respondent-level records and detailed aggregation documentation were unavailable for independently reconstructing the questionnaire-based scores. The underlying scoring procedures of departmental risk registers could also not be independently verified. Finally, the variation assessment was restricted to uniform proportional changes in the composite risk scores and did not examine the independent sensitivity of the underlying probability and impact components.
Future research should apply the framework across multiple mining organizations and incorporate longitudinal operational, procurement, equipment, and supplier-performance data. More comprehensive sensitivity analyses and dynamic modelling approaches, including System Dynamics and Bayesian Networks, could also improve understanding of how supply chain risks evolve and interact over time. Overall, the proposed framework offers a structured approach to distinguishing individual risk severity, category-level exposure, and expert-perceived interdependencies, thereby supporting more coordinated supply chain risk assessment and management. By helping decision-makers identify critical vulnerabilities, improve organizational preparedness, and prioritize actions aimed at maintaining operational continuity, the framework may contribute to strengthening supply chain resilience and supporting the economic sustainability of iron ore operations.
Author Contributions
Conceptualization, H.K., M.N.Z.-N. and V.N.-M.; methodology, H.K., M.N.Z.-N. and V.N.-M.; software, H.K.; validation, H.K., M.N.Z.-N., V.N.-M. and T.N.; formal analysis, M.N.Z.-N. and V.N.-M.; investigation, M.N.Z.-N. and V.N.-M.; resources, M.N.Z.-N. and V.N.-M.; data curation, H.K.; writing—original draft preparation, H.K., M.N.Z.-N. and V.N.-M.; writing—review and editing, T.N., A.S. and A.H.; visualization, H.K. and M.N.Z.-N.; supervision, H.K., T.N., A.S. and A.H.; project administration, H.K.; funding acquisition, H.K., M.N.Z.-N., V.N.-M. and T.N. All authors have read and agreed to the published version of the manuscript.
Funding
This research was funded by the Excellence Initiative—Research University (IDUB) programme and a scientific research subsidy of AGH University of Krakow no. 501.00-100302-10000.
Institutional Review Board Statement
This study was waived for ethical review as a technical and professional research study involving expert assessments and questionnaire-based evaluations of organizational supply chain risks, without clinical interventions or experimental procedures involving human participants, by the Institutional Committee of the Higher Education Complex of Zarand, Shahid Bahonar University of Kerman.
Informed Consent Statement
Verbal informed consent was obtained from all participants prior to their participation in the study. Verbal consent was obtained rather than written because the study involved professional assessments and questionnaire-based evaluations of organizational supply chain risks, and oral consent was considered acceptable under the applicable institutional requirements. No written consent forms were collected.
Data Availability Statement
The data presented in this study are available from the corresponding author upon reasonable request, subject to the necessary authorization from the case-study organization. Restrictions apply to the public availability of the underlying dataset due to organizational confidentiality and the protection of commercially sensitive information and participant-related data.
Acknowledgments
During the preparation of this manuscript, the authors used ChatGPT 4.0 for the purposes of visual and quality enhancement of figures.
Conflicts of Interest
Mohammad Naeim Zeidabadi-Nejhad is employed by the Risk Management Office of Gohar-Zamin Mining and Industrial Company. Ahmad Hassanzadeh is employed by Maelgwyn Mineral Services Limited and Behraz Energy Ashkan Ltd. These affiliations are disclosed for transparency. The research and conclusions presented in this manuscript represent the views of the authors and do not necessarily reflect those of their respective employers. The remaining authors declare no conflicts of interest.
Appendix A. Initial Direct-Relation Matrix Used for DEMATEL Analysis of Supply Chain Risks
Table A1.
Initial direct-relation matrix used in the DEMATEL analysis.
References
- Juttner, U.; Peck, H.; Christopher, M. Supply chain risk management: Outlining an agenda for future research. Int. J. Logist. Res. Appl. 2003, 6, 197–210. [Google Scholar] [CrossRef] [Scilit]
- Christopher, M.; Peck, H. Building the resilient supply chain. Int. J. Logist. Manag. 2004, 15, 1–14. [Google Scholar] [CrossRef] [Scilit]
- Kleindorfer, P.R.; Saad, G.H. Managing disruption risks in supply chains. Prod. Oper. Manag. 2005, 14, 53–68. [Google Scholar] [CrossRef] [Scilit]
- Gurtu, A.; Johny, J. Supply chain risk management: Literature review. Risks 2021, 9, 16. [Google Scholar] [CrossRef] [Scilit]
- Sharifi, M.S.; Naimzad, A. A systematic literature review on supply chain risk management. J. Soc. Sci. Humanit. 2026, 3, 235–259. [Google Scholar] [CrossRef] [Scilit]
- Tummala, R.; Schoenherr, T. Assessing and managing risks using the supply chain risk management process (SCRMP). Supply Chain Manag. 2011, 16, 474–483. [Google Scholar] [CrossRef] [Scilit]
- Ivanov, D. Predicting the impacts of epidemic outbreaks on global supply chains: A simulation-based analysis on the coronavirus outbreak (COVID-19/SARS-CoV-2) case. Transp. Res. Part E Logist. Transp. Rev. 2020, 136, 101922. [Google Scholar] [CrossRef] [Scilit] [PubMed]
- Dolgui, A.; Ivanov, D.; Sokolov, B. Reconfigurable supply chain: The X-network. Int. J. Prod. Res. 2020, 58, 4138–4163. [Google Scholar] [CrossRef] [Scilit]
- Madzik, P.; Falat, L.; Copus, L.; Carnogursky, K. Resilience in supply chain risk management in disruptive world: Rerouting research directions during and after pandemic. Ann. Oper. Res. 2024, 364, 11–43. [Google Scholar] [CrossRef] [Scilit]
- Guo, Y.; Liu, F.; Song, J.-S.; Wang, S. Supply chain resilience: A review from the inventory management perspective. Fundam. Res. 2025, 5, 450–463. [Google Scholar] [CrossRef] [Scilit] [PubMed]
- Heckmann, I.; Comes, T.; Nickel, S. A critical review on supply chain risk—Definition, measure and modeling. Omega 2015, 52, 119–132. [Google Scholar] [CrossRef] [Scilit]
- Ma, C.; Zhang, L.; You, L.; Tian, W. A review of supply chain resilience: A network modeling perspective. Appl. Sci. 2025, 15, 265. [Google Scholar] [CrossRef] [Scilit]
- Tubis, A.; Werbinska-Wojciechowska, S.; Wroblewski, A. Risk assessment methods in mining industry—A systematic review. Appl. Sci. 2020, 10, 5172. [Google Scholar] [CrossRef] [Scilit]
- Kamel, A.; Elwageeh, M.; Bondua, S.; Elkarmoty, M. Evaluation of mining projects subjected to economic uncertainties using the Monte Carlo simulation and the binomial tree method: Case study in a phosphate mine in Egypt. Resour. Policy 2022, 80, 103266. [Google Scholar] [CrossRef] [Scilit]
- Domingues, M.S.Q.; Baptista, A.L.F.; Diogo, M.T. Risk management in the mining sector through complex systems. In Proceedings of the 3rd International Symposium on Mine Safety Science and Engineering, Montreal, QC, Canada, 13–19 August 2016; Paper No. 259; McGill University: Montreal, QC, Canada, 2016. [Google Scholar]
- Humphreys, D. The Remaking of the Mining Industry; Palgrave Macmillan: New York, NY, USA, 2015. [Google Scholar]
- World Steel Association. Steel Statistical Yearbook; World Steel Association: Brussels, Belgium, 2025. [Google Scholar]
- Zeng, L.; Liu, S.Q.; Kozan, E.; Corry, P.; Masoud, M. A comprehensive interdisciplinary review of mine supply chain management. Resour. Policy 2021, 74, 102274. [Google Scholar] [CrossRef] [Scilit]
- Buchholz, P.; Schumacher, A.; Al Barazi, S. Big data analyses for real-time tracking of risks in the mineral raw material markets: Implications for improved supply chain risk management. Miner. Econ. 2022, 35, 701–744. [Google Scholar] [CrossRef] [Scilit]
- Hosseini Shekarabi, S.; Kiani Mavi, R.; Romero Macau, F. Supply chain resilience: A critical review of risk mitigation, robust optimisation, and technological solutions and future research directions. Glob. J. Flex. Syst. Manag. 2025, 26, 681–735. [Google Scholar] [CrossRef] [Scilit]
- Radebe, N.; Chipangamate, N. Mining industry risks, and future critical minerals and metals supply chain resilience in emerging markets. Resour. Policy 2024, 91, 104887. [Google Scholar] [CrossRef] [Scilit]
- Zhu, X.; Zhu, J.; Regan, D.; Wen, Z. Exploring cascading failures in supply chain risk management: A systematic review, 2013–2024. J. Saf. Sci. Resil. 2026, 7, 100234. [Google Scholar] [CrossRef] [Scilit]
- Paul, A.; Saha, S.C. A systematic literature review on flexible strategies and performance indicators for supply chain resilience. Glob. J. Flex. Syst. Manag. 2025, 26, 207–231. [Google Scholar] [CrossRef] [Scilit]
- Das, S.K.; Perona, M. Supply chain risk management automation: A literature review. Electron. Mark. 2025, 35, 104. [Google Scholar] [CrossRef] [Scilit]
- Canales-Bustos, L.; Barbosa-Póvoa, A.P. Sustainable mining supply chain: A path to net zero. SSRN eLibrary 2026, PrePrint. [Google Scholar] [CrossRef] [Scilit]
- Fathollahzadeh, K.; Saeedi, M.; Ghasempour Anaraki, M.; Rabiee, M. Sustainable cast iron supply chain network design: Robust multi-objective optimization with scenario reduction via genetic algorithm. Int. J. Prod. Econ. 2025, 289, 109730. [Google Scholar] [CrossRef] [Scilit]
- Baryannis, G.; Validi, S.; Dani, S.; Antoniou, G. Supply chain risk management and artificial intelligence: State of the art and future research directions. Int. J. Prod. Res. 2019, 57, 2179–2202. [Google Scholar] [CrossRef] [Scilit]
- Guo, X.; Yang, Z.; Sun, J.; Zhang, Y. Impact pathways of emerging ITs to mitigate supply chain vulnerability: A novel DEMATEL-ISM approach based on grounded theory. Expert Syst. Appl. 2024, 239, 122398. [Google Scholar] [CrossRef] [Scilit]
- Özdemir, L.; Vurur, N.S.; Ozen, E.; Swiecka, B.; Grima, S. Volatility modeling of the impact of geopolitical risk on commodity markets. Economies 2025, 13, 88. [Google Scholar] [CrossRef] [Scilit]
- Hallikas, J.; Karvonen, I.; Pulkkinen, U.; Virolainen, V.; Tuominen, M. Risk management processes in supplier networks. Int. J. Prod. Econ. 2004, 90, 47–58. [Google Scholar] [CrossRef]
- Hosseini, S.; Ivanov, D. Bayesian networks for supply chain risk, resilience and ripple effect analysis: A literature review. Expert Syst. Appl. 2020, 161, 113649. [Google Scholar] [CrossRef] [Scilit] [PubMed]
- Salehzadeh Gharaei, R.; Gholami, A.; Khoshdast, H.; Biglari, H. A multi-method machine learning framework for simulating power dynamics in an iron ore cone crusher plant. Miner. Process. Extr. Metall. Rev. 2025, 46, 783–798. [Google Scholar] [CrossRef] [Scilit]
- Khoshdast, H.; Soflaeian, A.; Shojaei, V. Coupled fuzzy logic and experimental design application for simulation of a coal classifier in an industrial environment. Physicochem. Probl. Miner. Process. 2019, 55, 504–515. [Google Scholar]
- Khoshdast, H.; Shojaei, V.; Khoshdast, H. Combined application of computational fluid dynamics (CFD) and design of experiments (DOE) to hydrodynamic simulation of a coal classifier. Int. J. Min. Geo-Eng. 2017, 51, 9–24. [Google Scholar] [CrossRef] [Scilit]
- Feng, X.; Ni, B.; Du, X. A DEMATEL-ISM combined approach for analyzing influencing factors of resilience in the prefabricated building supply chain. Eng. Constr. Archit. Manag. 2025, 1, 25. [Google Scholar] [CrossRef] [Scilit]
- Lu, J.; Wang, J.; Song, Y.; Yuan, C.; He, J.; Chen, Z. Influencing factors analysis of supply chain resilience of prefabricated buildings based on PF-DEMATEL-ISM. Buildings 2022, 12, 1595. [Google Scholar] [CrossRef] [Scilit]
- Jones, B.; Sharpe, P.; Iddon, C.; Hathway, E.A.; Noakes, C.J.; Fitzgerald, S. Modelling uncertainty in the relative risk of exposure to the SARS-CoV-2 virus by airborne aerosol transmission in well mixed indoor air. Build. Environ. 2021, 191, 107617. [Google Scholar] [CrossRef] [Scilit] [PubMed]
- Taber, K.S. The use of Cronbach’s alpha when developing and reporting research instruments in science education. Res. Sci. Educ. 2018, 48, 1273–1296. [Google Scholar] [CrossRef] [Scilit]
- Arabzadeh Jarkani, S.; Khoshdast, H.; Shariat, E.; Sam, A. Modeling the effects of mechanical parameters on the hydrodynamic behavior of vertical current classifiers. Int. J. Min. Sci. Technol. 2014, 24, 123–127. [Google Scholar] [CrossRef] [Scilit]
- Ávila, P.; Lima, D.; Moreira, D.; Pires, A.; Bastos, J. Design of a sales and operations planning (S&OP) process—Case study. Procedia CIRP 2019, 81, 1382–1387. [Google Scholar] [CrossRef] [Scilit]
- Niedoba, T.; Surowiak, A.; Hassanzadeh, A.; Khoshdast, H. Evaluation of the effects of coal jigging by means of Kruskal-Wallis and Friedman tests. Energies 2023, 16, 1600. [Google Scholar] [CrossRef] [Scilit]
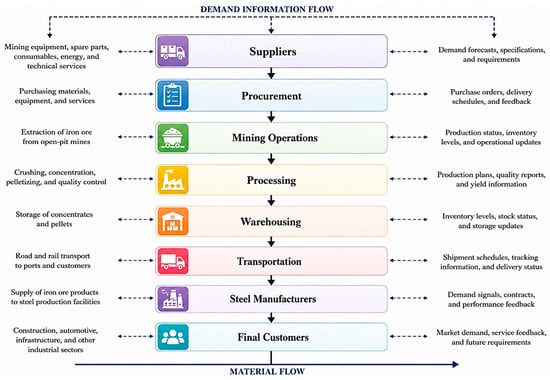
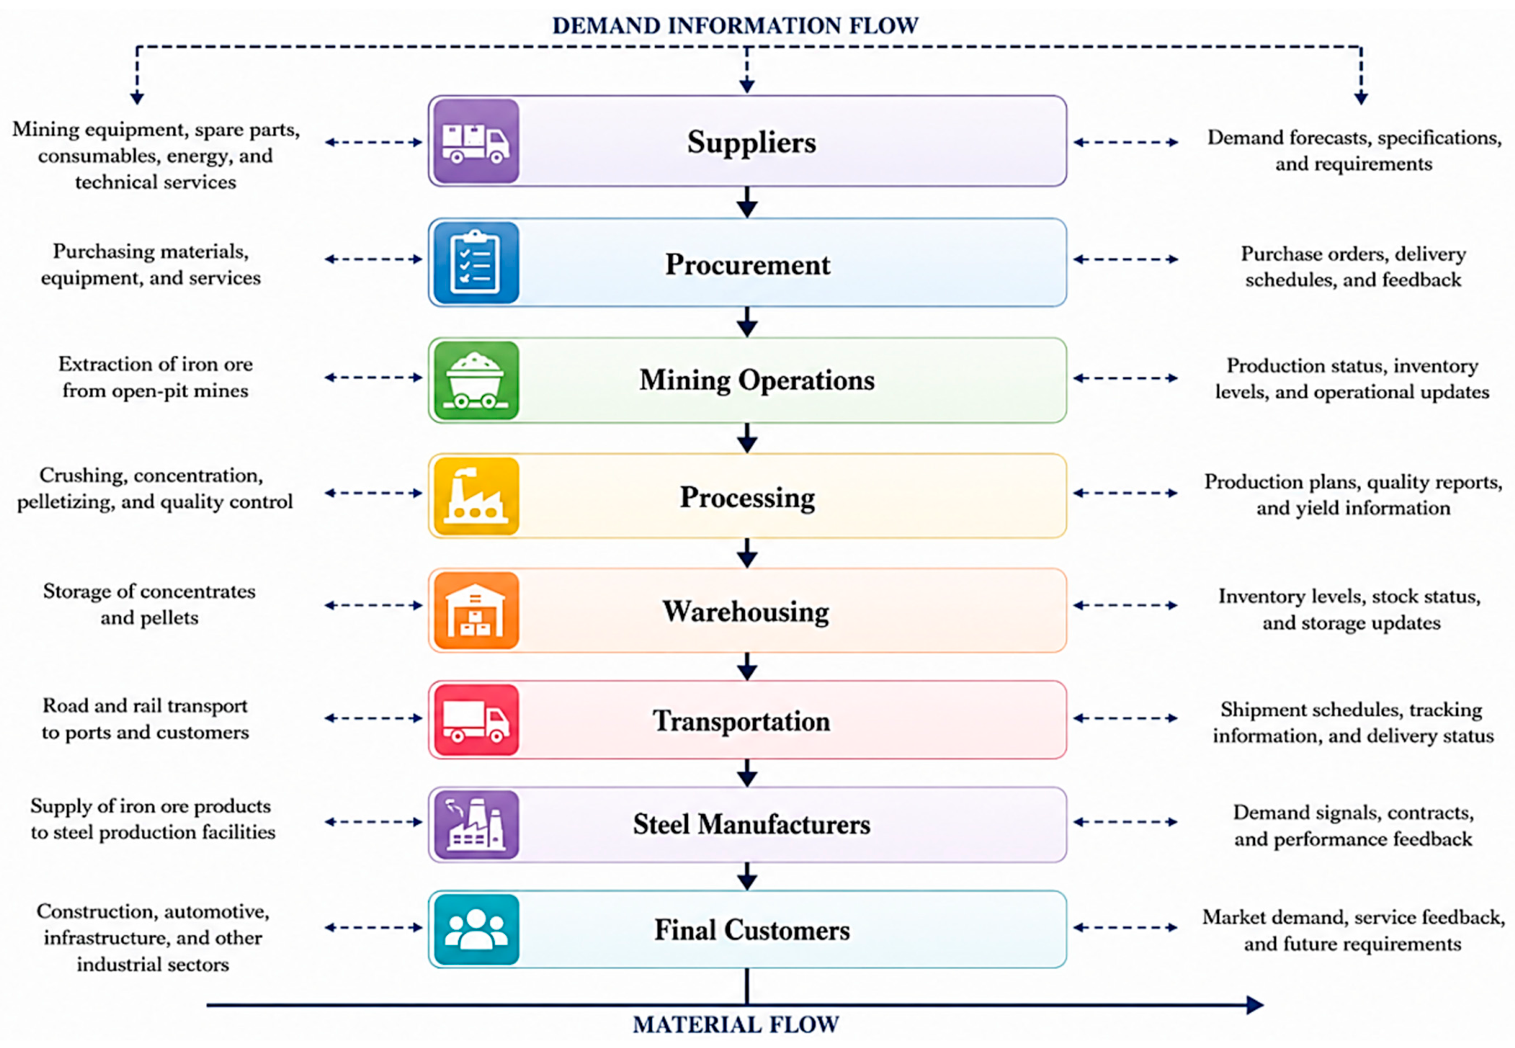
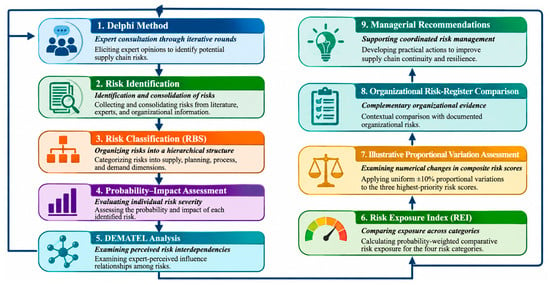
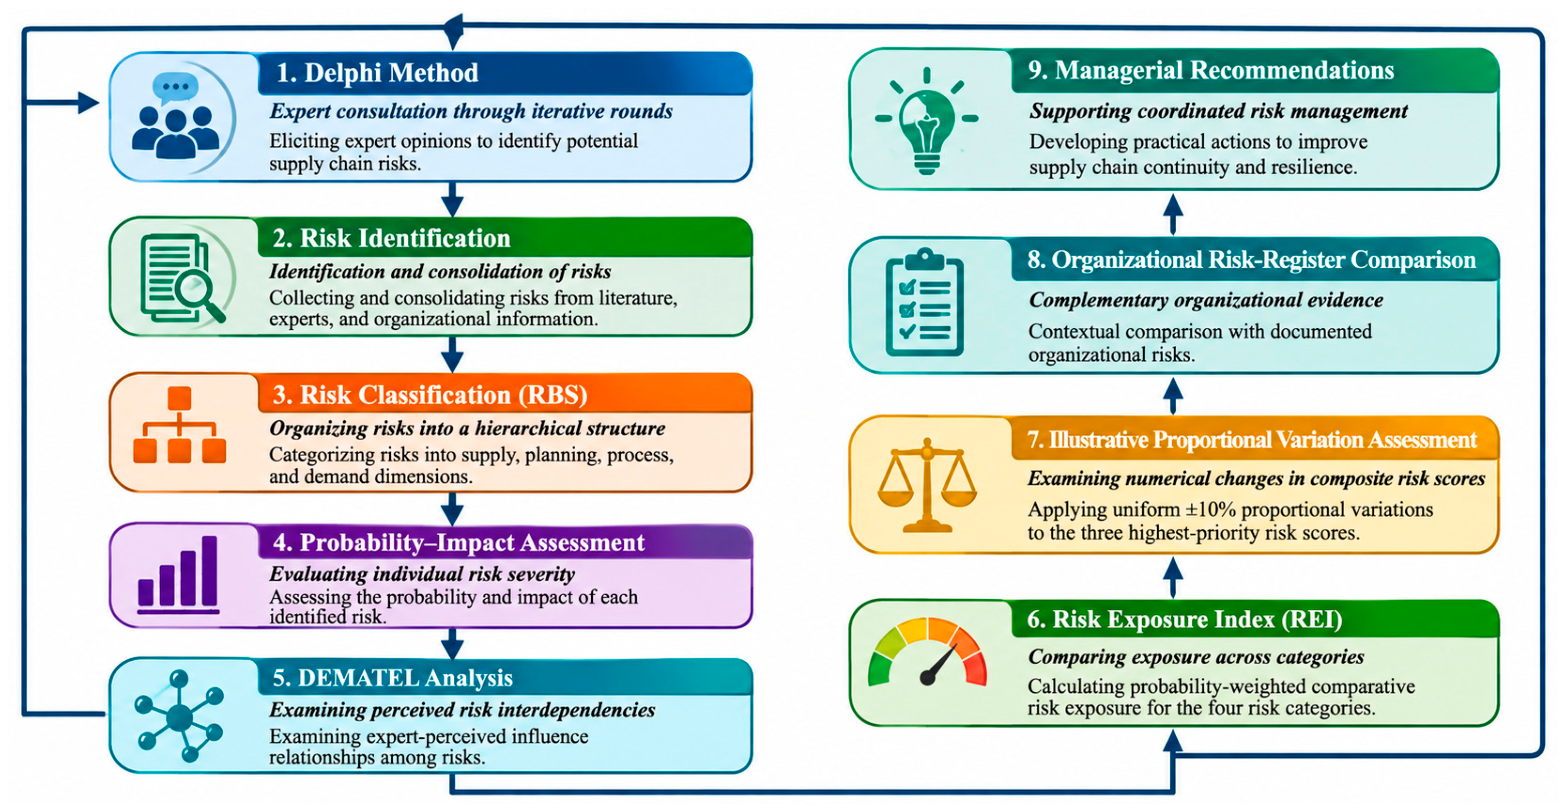
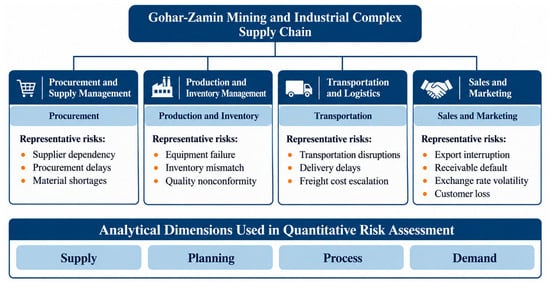
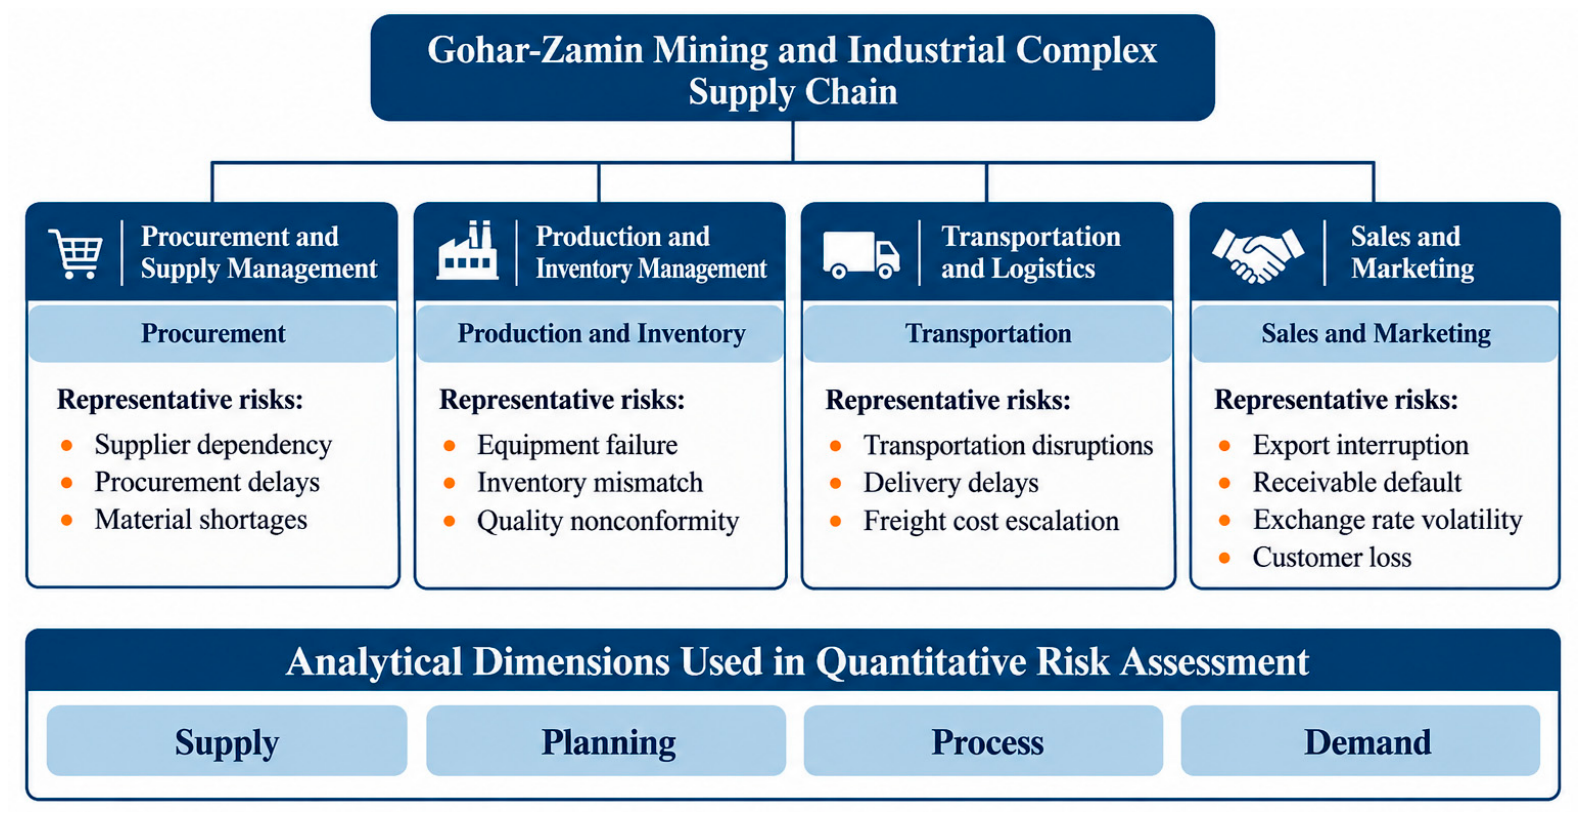
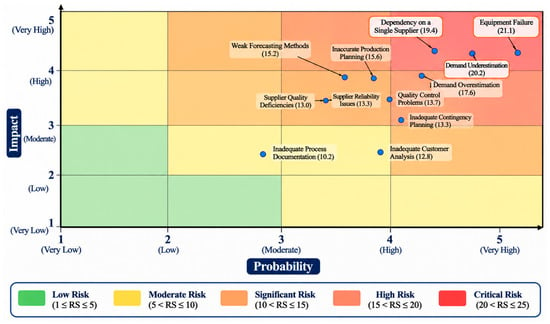
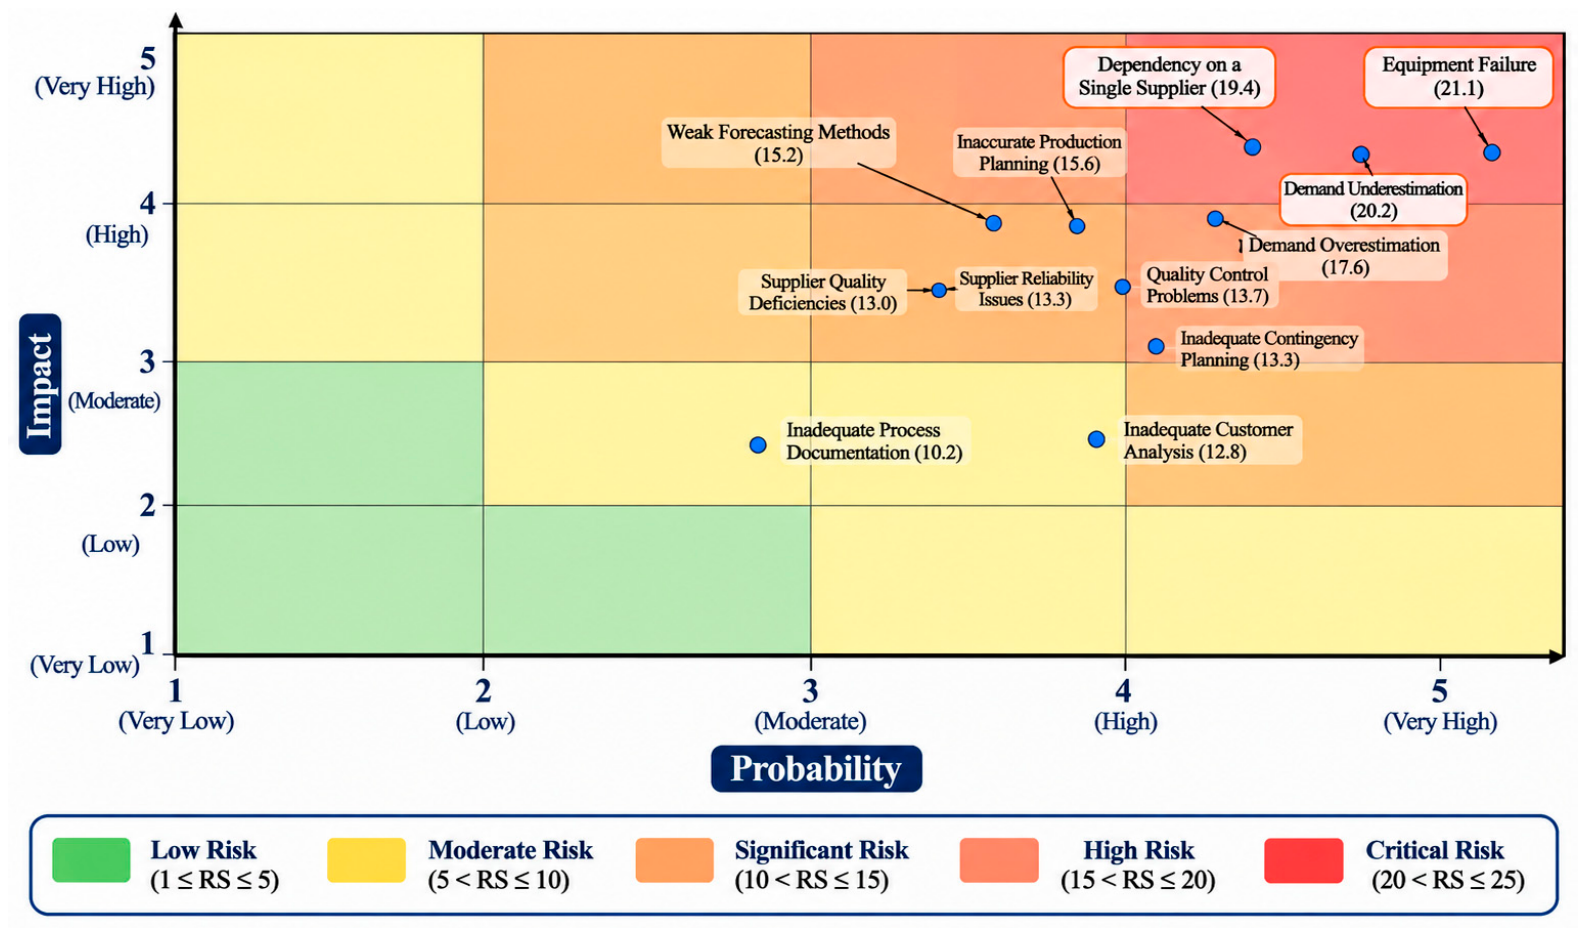
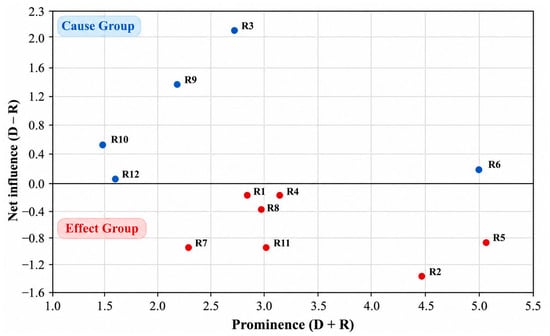
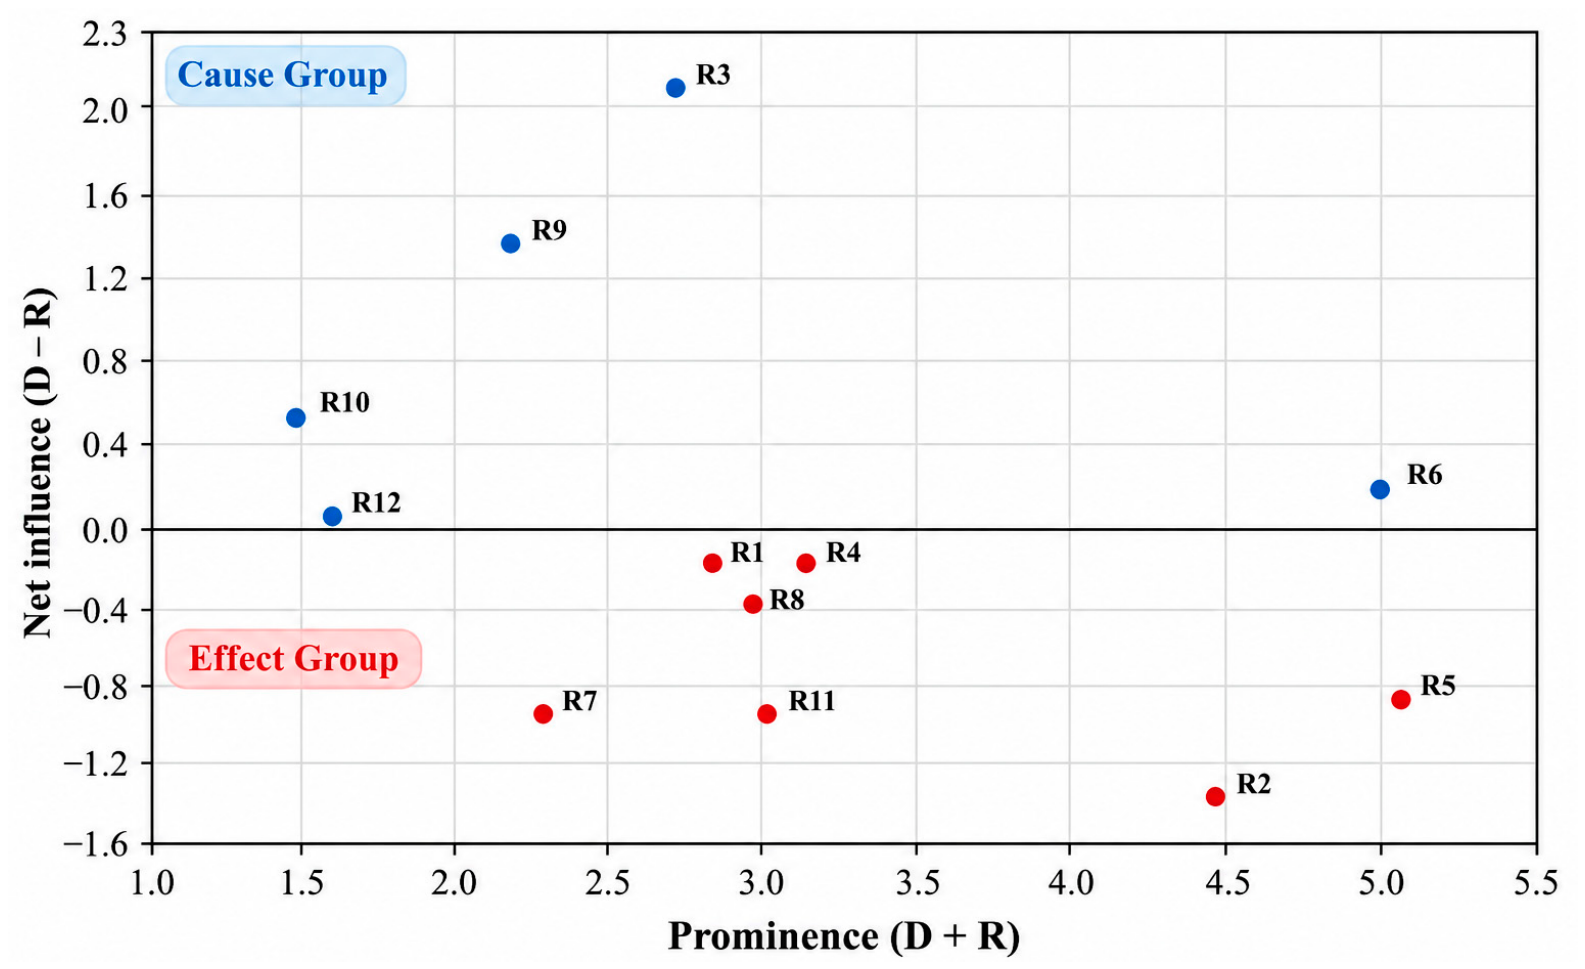
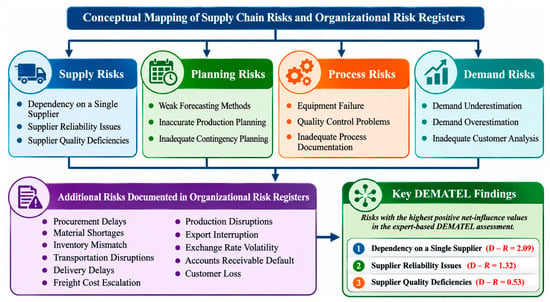
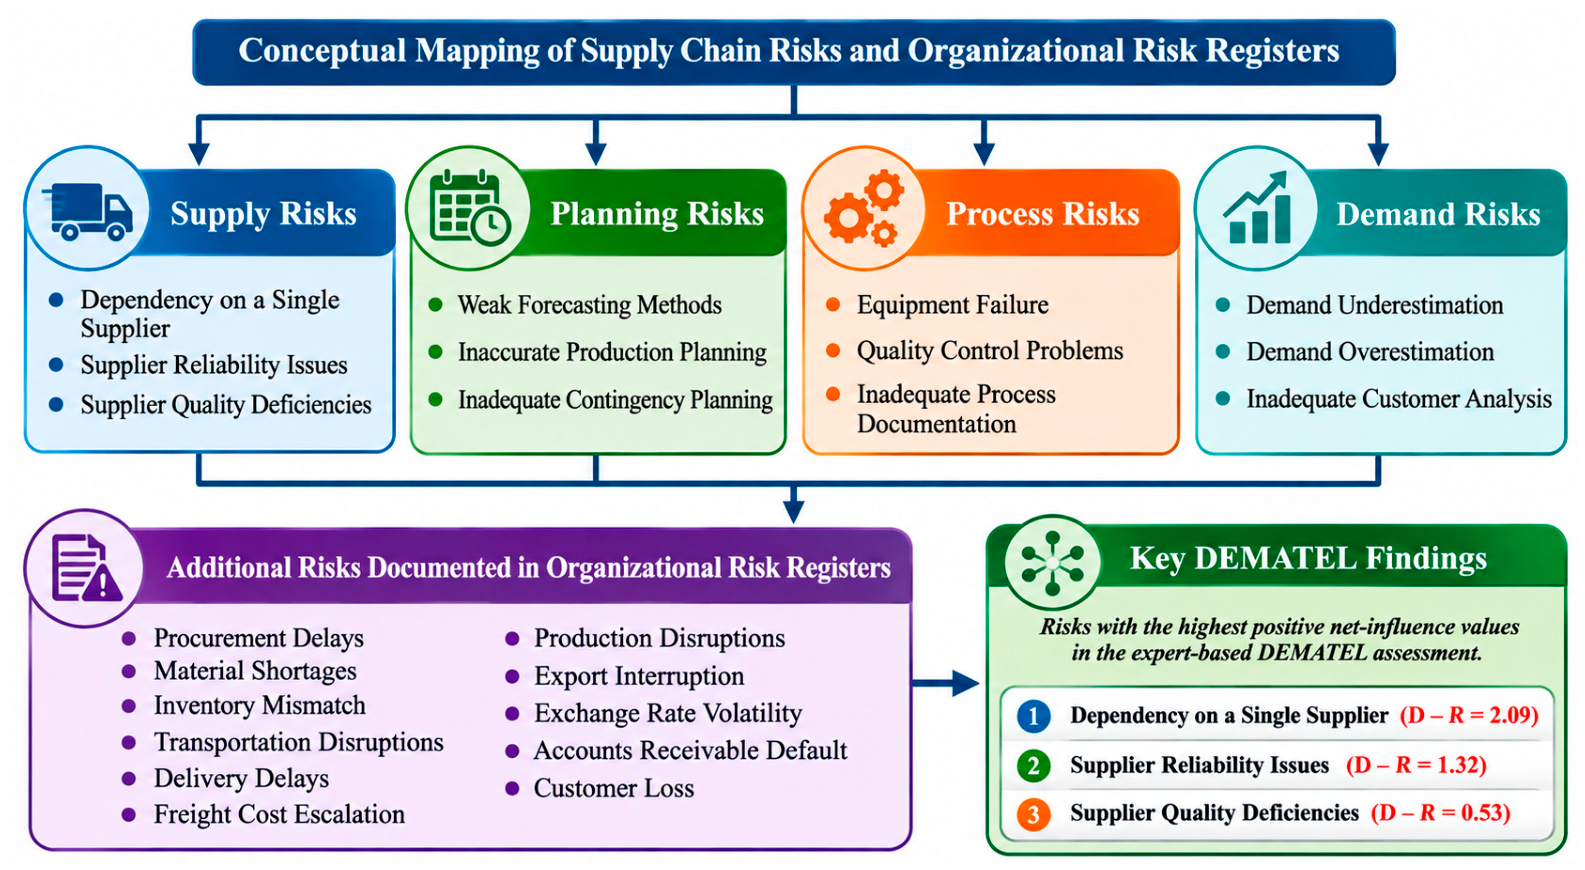
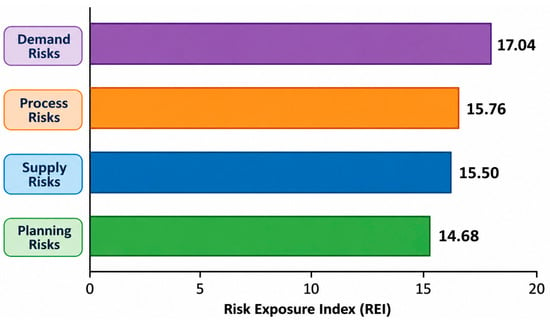
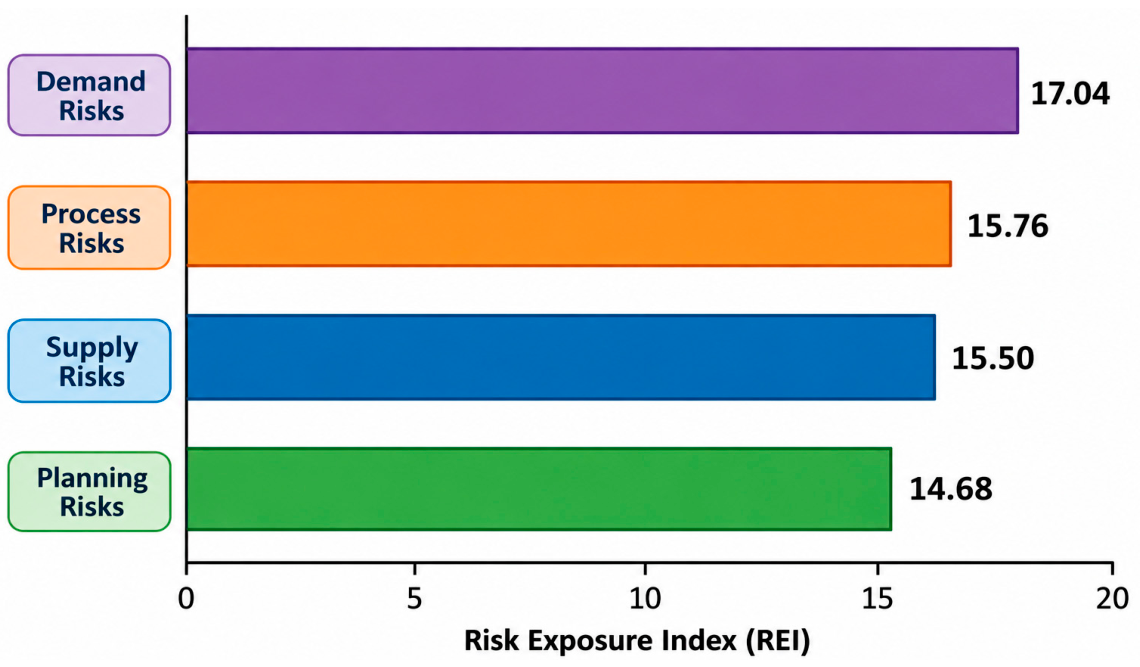

Disclaimer/Publisher’s Note: The statements, opinions and data contained in all publications are solely those of the individual author(s) and contributor(s) and not of MDPI and/or the editor(s). MDPI and/or the editor(s) disclaim responsibility for any injury to people or property resulting from any ideas, methods, instructions or products referred to in the content. |
© 2026 by the authors. Licensee MDPI, Basel, Switzerland. This article is an open access article distributed under the terms and conditions of the Creative Commons Attribution (CC BY) license.