


Abstract
Global energy progress requires simultaneous progress across three essential dimensions: energy efficiency, sustainability and systems resilience. While these concepts are frequently debated in policy and the academic world, this is done mainly as standalone subjects, and their structural interdependencies are often misunderstood, leading to fragmented interventions and poor capital allocation. This paper addresses this gap by building a 3 × 3 conceptual framework in which the literature-based criteria are assigned to each of the three dimensions: energy efficiency, sustainability and systems resilience (EE-S-R). This is done with the aid of a bibliometric analysis of articles retrieved from the Dimensions database in the last 10 years (2016–2025) and processed in VOSviewer, yielding 610 articles and producing 93 candidate terms. The conceptual framework was developed on theoretical grounds and refined through bibliometric analysis, in which a three-criterion selection protocol combining a composite bibliometric indicator with the nexus relevance and conceptual distinctiveness criteria produces nine umbrella components distributed across the three EE-S-R thematic dimensions. The resulting ternary conceptual framework constitutes a grounded methodology to be further used in research or policy design as an important framework for complex multi-criteria decision making that cuts across engineering, governance, environmental science and urban planning.
1. Introduction
Energy transition is among the most significant challenges of this century, not only in its environmental ambition, but also in its structural complexity. The global community should simultaneously pursue three objectives. The first one is based on energy efficiency, having at its core the reduction in energy intensity, investment in efficiency technology and regulatory standards. The second one is linked to environmental concern, being based on sustainability in energy systems, referring to decarbonization of energy supply, deployment of renewables and installing digital smart infrastructure. The third one aims at the assurance of energy system resilience, maintaining continuity of supply during extreme weather events, geopolitical disruptions, and infrastructural vulnerabilities. The three imperatives form a nexus of reinforcing and competing relationships that policy must navigate simultaneously. Energy efficiency, sustainability and resilience (EE-S-R) collectively define this nexus, which constitutes one of the most important challenges of the contemporary era, cutting across engineering, economics, governance, environmental science and urban planning.
Conceptually, energy efficiency, sustainability and resilience operate on different system properties. Briefly, energy efficiency concerns the productive performance of a system, its analytical referent being technical optimization at the input–output level. Sustainability in energy systems concerns long-term environmental compatibility, its analytical referent being the relationship between the energy system and the environment. Resilience concerns structural robustness under disruption, with its referent being system continuity under stress. These three properties are not collinear. For instance, a system can exhibit high efficiency while remaining environmentally unstable, as in the case of an optimized coal plant, or high sustainability while exhibiting low resilience, as in the case of a variable renewable system without adequate storage. The nexus framing, as opposed to a hierarchical or simple overlap model, is justified by the directionality of interaction effects. A hierarchical model would imply that one dimension includes the others; for instance, sustainability is the overachieving objective, and efficiency and resilience are the instruments of it. But energy efficiency generates independent value through economic competitiveness and import dependency reduction, which are not captured by sustainability metrics. At the same time, resilience generates independent value through national security and continuity of essential services that persist regardless of the carbon content of supply. Rapid decarbonization, if it is not coordinated with storage investment and supply diversification, can degrade resilience, an outcome that a hierarchical model cannot adequately represent. These tensions mean that optimizing each dimension independently produces different outcomes from optimizing them together. The nexus framing aims to capture these interaction effects, where each dimension modifies the boundary conditions of the others and where joint optimization problems are more than the sum of the three separate optimization problems. Economic and social aspects of the energy transition are embedded across all dimensions, including employment effects, energy poverty reduction and general welfare.
The transition toward a green economy requires more than a simple substitution of fossil fuels with renewables; it needs a structural reconfiguration of the grid logic. Historically, energy efficiency, sustainability and resilience have been treated as independent research areas. However, modern grids show that a change in one aspect, such as the integration of intermittent renewables, immediately stresses the grid and requires demand-side management. The shift towards decentralized energy needs a radical rethinking of systemic interdependence [1]. Therefore, the approach of the three imperatives is critical, especially in parts of the world already hit by energy disruptions, such as the European Union (EU). Presently, the EU faces a more severe energy crisis than most of the world, given the disruption of Russian pipeline gas, high reliance on imported fossil fuels and disruptions in the Middle East.
Despite the evident importance of the EE-S-R nexus, the research landscape remains fragmented. Studies typically address one or two of the three dimensions, with limited integration. Studies focused on energy efficiency have primarily addressed demand-side implications, with limited engagement with systemic resilience [2]. Sustainability-oriented research has framed energy transitions through multiple scenarios and decarbonization pathways, with limited regard for resilience [3]. Empirical studies of energy technologies have addressed energy efficiency and renewable energy without integrating systemic resilience [4]. Integrative attempts have combined two dimensions: energy efficiency with resilience under carbon adaptation pressures [5], or security with resilience in planning [6]. Studies employing a nexus that links efficiency and resilience have considered urban contexts [7,8]. The systematic mapping of this complex area, by identifying the dominant topics, their interrelations and the most frequent co-appearing factors in the literature, is essential before any advanced analytical works, such as mathematical modeling or multi-decision making, are performed. This study addresses this gap by proposing a framework based on EE-S-R components that integrates bibliometric analysis of the Dimensions database [9] with VOSviewer [10] co-occurrence terms, which provides a better view of the bibliometric relevance of factors and their complex effects. Hence, this research aims to identify, systematically select and structurally characterize nine conceptual umbrella components that together constitute the EE-S-R nexus, providing an empirically grounded component structure that can be further used for decision making and causal influence modeling. More precisely, this study addresses the absence in the existing research of a literature-driven procedure for moving from a diffuse co-occurrence of energy transition themes to a set of analytically traceable components whose selection criteria and dimension affiliation are grounded in empirical evidence of bibliometric prominence and thematic coherence. The novelty of this resides in tackling energy efficiency, sustainability and systems resilience as three constitutive dimensions of a single nexus rather than separate research streams. Moreover, the component identification procedure introduces a filtering mechanism that makes the selected terms traceable and parameter-explicit.
This study pursues three specific objectives:
- To build a relevant body of articles for the EE-S-R nexus from the Dimensions database.
- To design the selection protocol for the VOSviewer terms to construct scientifically coherent umbrella components.
- To construct a 3 × 3 conceptual framework by using three dimensions and three components for each dimension to map a framework to be further used to guide complex multi-criteria decision making for capital and policy interventions.
This paper makes three contributions:
- It applies the PRISMA reporting framework to the document search, screening and selection procedure of bibliometric data retrieved from the Dimensions database, ensuring methodological transparency and reproducibility.
- It conducts a VOSviewer term co-occurrence analysis to identify the most relevant candidate terms and later applies a three-criterion protocol to select nine components for the EE-S-R nexus.
- It provides nine components, developed on theoretical grounds and refined through bibliometric analysis, including occurrence frequency, relevance score, and composite scores.
The rest of this paper is organized into 5 sections: Section 2 reviews the literature, with a focus on the EU situation; Section 3 develops the model architecture and explains the employed methodology; Section 4 presents the results; and Section 5 discusses the findings. This paper is concluded with Section 6.
2. Literature Review
2.1. Energy Efficiency: Progress and Rebound
Energy efficiency represents both the most cost-effective means of reducing emissions and the dimension where the gap between achievable and achieved progress is clearly documented. Global energy intensity improved by 1% in 2024 [11], leading the world away from the COP28 goal of doubling the annual improvement rate by 2030 [12]. In the EU, the energy intensity of gross added value fell by 4.1 % in 2023, with manufacturing recording a 5.5 % reduction [13], yet final consumption remained significantly above target. Previous research [14] established that the trajectory of EU energy demand requires not incremental gains but rather a fundamental restructuring of consumption patterns, a conclusion validated by the persistence of the efficiency gap about twenty years later.
The global primary energy supply reached 15,447 million tons of oil equivalent (Mtoe) in 2024, up 2.2% from 15,143 Mtoe in 2023, driven predominantly by emerging and developing economies [15]. In 2024, the EU’s primary energy consumption reached 1194 Mtoe, the lowest level since 1990, representing a 21% reduction from the 2006 peak of 1511 Mtoe [16], reflecting structural shifts, price signals from the 2022 energy crisis, and genuine efficiency improvements. In this way, the EU figures approached the 2030 target but remained about 20% higher than the target of 992.5 Mtoe. At the same time, the final energy consumption of 900 Mtoe in 2024 [17] remained 18% above the binding 2030 target of 763 Mtoe set by the revised energy efficiency directive [18].
However, efficiency performance is highly polarized in the EU member states, and energy consumption per capita and energy intensity are the two most discriminating performance indicators, both shaped upstream by regulatory and investment factors [19].
Another important factor is the rebound effect, which was shown to partially offset efficiency gains [20]. The economy-wide rebound was quantified at 53– 89 % in developed economies [2,21]. Regulatory frameworks are the primary mechanism for containing rebound, while standards remove low-efficiency products from the market without triggering income-effect rebound [22].
2.2. Renewable Energy: Expansion and Integration Challenge
The global renewable power capacity reached about 5150 GW in 2025, from 4458 GW in 2024 and 2020 GW in 2016, recording more than a doubling in the last 10 years [23].
In terms of renewable energy, the EU reached 25.2% of the gross final energy consumption in 2024, up from 9.6% in 2004, with the electricity sector reaching a 47.5% renewable share [24]. Despite the large gain over the last 10 years, the binding 2030 target of 42.5% of gross final consumption requires a doubling of the average deployment rates seen in the past decade [25,26].
Carbon reduction from renewable integration depends structurally on grid flexibility and storage capacity [27]. Research shows that the joint effect of technology improvement and renewables on emissions substantially exceeds the individual effect of either [4].
2.3. Resilience: Infrastructure, Storage and Smart Grid Development
Energy system resilience has moved from a niche concern in reliability engineering to a central policy priority. Previous research provides the defining classification: absorptive, adaptive, restorative, and transformative resilience dimensions [6]. Research applies this framework to integrated energy systems, identifying supply diversity, storage, and robust infrastructure as the three distinct dimensions [28].
The global electricity transmission and distribution grid currently spans approximately 80 million km [15]. Globally, 737 million people remained without electricity access in 2024, with Sub-Saharan Africa accounting for 80% of the global deficit [15]. Annual grid investment would need to more than double, from about USD 300 billion today to over USD 600 billion/year by 2030 [29]. The EU’s electricity network spans more than 1 million km of high-voltage lines for transmission and distribution, yet the European Commission’s grid actions plan estimates 584 billion EUR of grid investment needs by 2030 [30].
Worldwide, more than 50 countries covered most of their primary needs through fossil fuels, and 74% of the world’s population resided in economies that were dependent on imports, showing a large exposure of global energy systems to price volatility, geopolitical risks and supply disruptions [31]. Energy import dependency in the EU stood at 57% of gross inland consumption in 2024, reinforcing the security reasoning for supply diversification alongside decarbonization [32].
Smart grid digitalization through IoT, AI-driven demand response, digital twins, and cybersecurity is the technical bridge between high renewable penetration and operational resilience [33]. Storage was identified as the most frequently cited technical enabler across resilience studies [34].
2.4. Bibliometric Analysis: Value and Research Infrastructure
Bibliometric analysis has emerged as a standard for mapping research landscapes using co-authorship, co-citation and co-occurrence networks [35]. In energy research, bibliometric approaches have mapped standalone topics like smart grids [36], sustainable buildings [7] and urban resilience [37].
The Dimensions database has emerged as a significant methodological advance over traditional databases, offering broader coverage of the literature, especially over the last ten years, making it very relevant for the present study [38].
VOSviewer has become the most widely adopted software tool for co-occurrence network analysis, identifying terms that are not only frequent but characteristic of a focal domain [39]. The two indicators, occurrence and relevance, are more informative than occurrence alone and are the basis for the composite score used in this study. Co-occurrence analysis was applied in this paper to transform the bibliometric data into a network representation of conceptual proximity. This study applies a two-track PRISMA framework that documents the search and selection from the Dimensions database and the VOSviewer term extraction process.
3. Methods
The global energy system is confronted with three structural imperatives at the same time: improving energy efficiency to reduce costs and demand, advancing sustainability through decarbonization, renewable energy integration and the circular economy, and strengthening resilience to protect energy infrastructures and supply chains against all possible disruptions, physical, climatic or geopolitical. To solve this intertwined structure, this study builds a model of the EE-S-R nexus through a methodology that integrates bibliometric analysis of the Dimensions database and VOSviewer. A distinctive methodological feature is the grouping of related VOSviewer co-occurrence terms into nine umbrella components, which expands the coverage by components and increases the bibliometric relevance of direct influence entries.
The EE-S-R framework was established on theoretical grounds prior to the bibliometric analysis, based on the scholarly literature on energy efficiency, sustainability and resilience. Each of the three dimensions was decomposed into a regulatory/governance sub-dimension, a technical/operational sub-dimension and a systemic/integrative sub-dimension, a structure applied symmetrically across all three dimensions. The bibliometric analysis served to operationalize this structure, with term assignment carried out through iterative thematic grouping constrained by a composite score. The bibliometric analysis grounds the component vocabulary in empirically attested terms drawn from actual co-occurrence patterns in the literature, quantifies the scholarly attention each component receives inside the bibliometric data and determines the definitive naming of each component.
The selection of the Dimensions database is based on the fact that it offers a broader selection than other databases and indexes a larger proportion of open-access outlets. Moreover, it provides richer metadata for co-occurrence analysis, including sustainable development goals and fields of research classifications, which enabled the analyses reported in this study. Moreover, the Dimensions database is operationally linked to VOSviewer, unlike Scopus or Web of Science, and provides a preview of co-occurrence networks, which makes it easier to follow and offers important insights for interested researchers.
3.1. Dimensions Database Search and VOSviewer Co-Occurrence Analysis
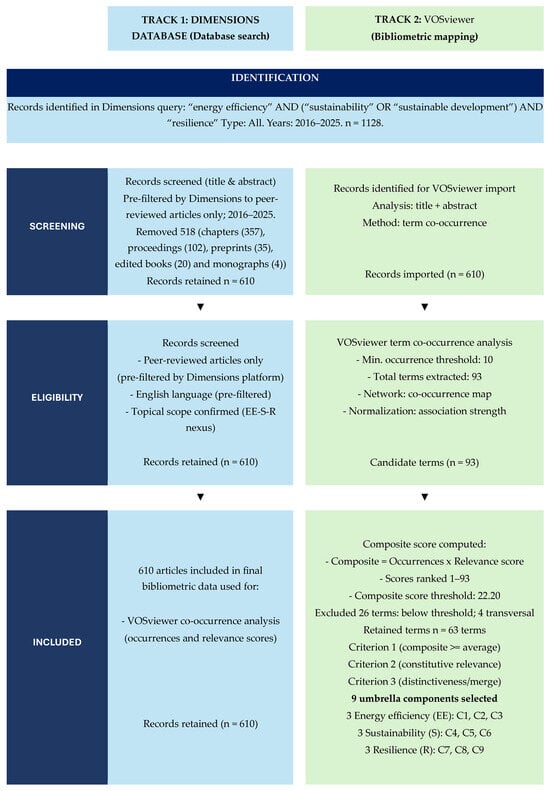
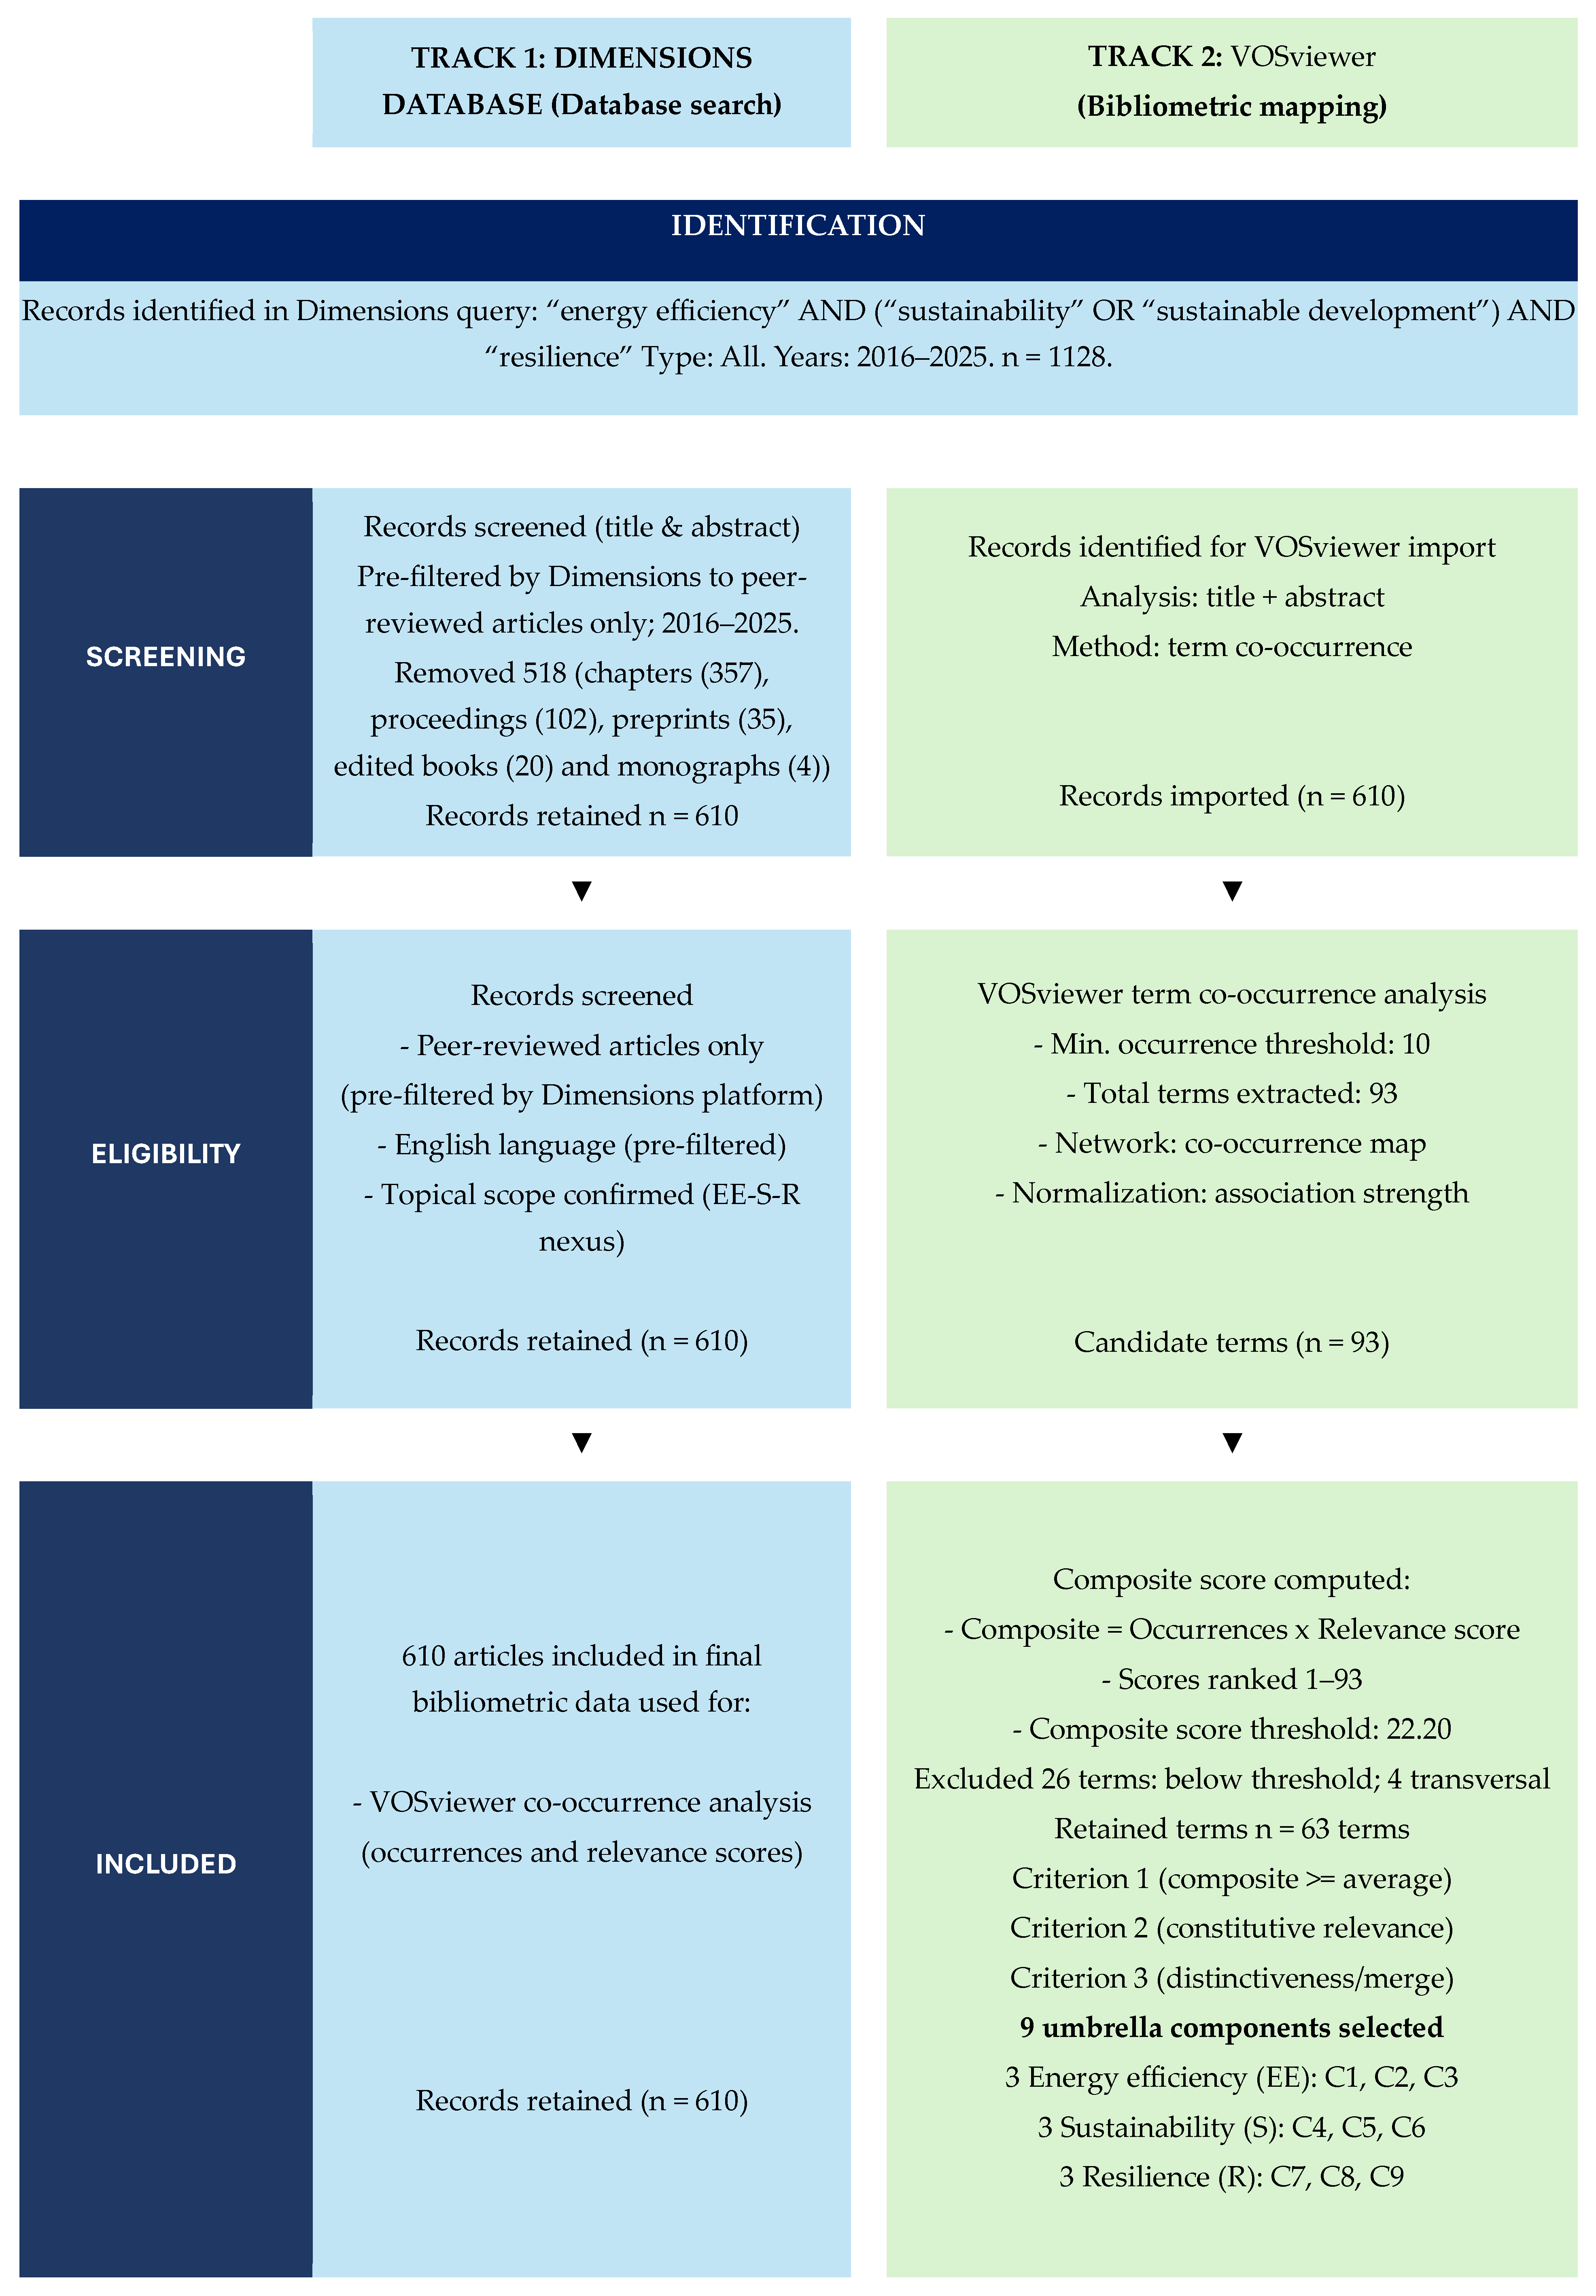
The bibliometric dataset was built following the PRISMA framework [40]. The systematic search was conducted in the Dimensions database using the following query, applied to title and abstract fields: (“energy efficiency”) AND (“sustainability” OR “sustainable development”) AND (“resilience”). Each block corresponds to one of the three dimensions. Publication type was restricted to peer-reviewed articles. The time window covered 2016–2025, capturing the post-Paris Agreement research landscape. The search was executed and exported on 26 March 2026, yielding 1128 initial records, from which 610 were retained. The 1128 initial records refer to publications that included articles (610), chapters (357), proceedings (102), preprints (35), edited books (20) and monographs (4). The retained 610 refer to peer-reviewed articles.
The records were imported into the VOSviewer v1.6.20 software. A title and abstract term co-occurrence analysis was performed, with a minimum occurrence threshold of 10, resulting in 93 unique terms. Each term receives two VOSviewer indicators: (1) an occurrence frequency, i.e., the number of documents containing the term, and (2) a relevance score, i.e., a normalized co-occurrence weight measuring how characteristic a term is of the topics covered by the bibliometric data. Higher-relevance scores indicate terms more specific to the EE-S-R domain.
A composite bibliometric indicator was computed for each of the 93 candidate terms, such as
Composite score = Occurrences × Relevance score (average across grouped terms)
This formula rewards terms that are both frequently discussed in bibliometric data and thematically specific to the EE-S-R domain, avoiding the selection of the general academic vocabulary that would appear frequently, but with a low domain specificity.
3.2. Three-Criteria Selection Protocol of the Nine Umbrella Components
Three sequential criteria were applied to the 93 candidate terms to identify factors suitable for further causal modeling. Nine umbrella components were constructed by grouping related VOSviewer co-occurrence terms according to shared bibliometric cluster and thematic relevance.
Criterion 1: Composite score threshold. The composite score must equal or exceed the sample average (22.20). This threshold ensures statistical prominence within the focal bibliometric data, retaining the terms most characteristic of the EE-S-R domain. Sixty-seven terms were retained (26 terms were excluded).
Criterion 2: Constitutive nexus relevance. The term must represent a direct operational dimension of at least one of the three EE-S-R dimensions rather than a generic instrument or transversal enabler applicable indiscriminately across economic sectors. Terms that did not meet this criterion were excluded (transversal terms including “building”, “model”, “performance”, and “data”). Sixty-three terms were retained (four transversal terms were removed).
Criterion 3: Conceptual distinctiveness and umbrella grouping. Semantically overlapping terms sharing the same bibliometric cluster and thematic referent were consolidated into umbrella groups. For example, “demand response”, “smart metering”, “load management”, and “building energy management” were grouped into C1: Demand-Side Management (DSM). This umbrella approach substantially increases coverage per component. The nine resulting umbrella components are each assigned a code (C1–C9) and dimension (EE-S-R). Table 1 presents the components that pass all three criteria, with component-level aggregates.
Table 1.
EE-S-R model’s 3 × 3 components.
The assignment of the components to a specific dimension takes into consideration the empirical clusters and thematic relevance. VOSviewer identifies four empirical clusters that partially cross the boundaries of the three EE-S-R dimensions. For seven of the nine components, C1, C2, C3, C4, C5, C7 and C9, empirical cluster membership and dimensional assignment coincide. The remaining two components, C6 and C8, co-cluster empirically yet serve a distinct role in the EE-S-R framework. Their assignments to separate dimensions reflect the author’s decision, grounded in the thematic content of the papers, as established through systematic review. C6 is assigned to the sustainability dimension because its constituent terms primarily drive decarbonization pathways, while C8 is assigned to the resilience dimension, as its constituent terms underpin operational continuity under variable supply conditions.
Appendix A.1 displays the list of the 93 candidate terms, listed in descending order of the composite score.
Appendix A.2 displays the assignment of each component to one of the EE-S-R dimensions.
Figure 1 presents the PRISMA flow diagram for bibliometric data.
Figure 1.
PRISMA flow diagram: Dimensions and VOSviewer components selection.
3.3. Building the EE-S-R Conceptual Framework
The relative bibliometric weight of each component to its dimension is quantified through intra-dimension normalization. The composite score of an individual component (Ci) is divided by the sum of the composite score for all components from a specific dimension (Cj), resulting in a proportional weight expressed as a percentage:
4. Results
Table 2 presents the annual publication distribution of the 610 articles extracted from the Dimensions database, with a noticeable acceleration in output from 2023 onwards, cumulating 3883 citations over 2016–2025.
Table 2.
Annual publication distribution in the EE-S-R bibliometric data.
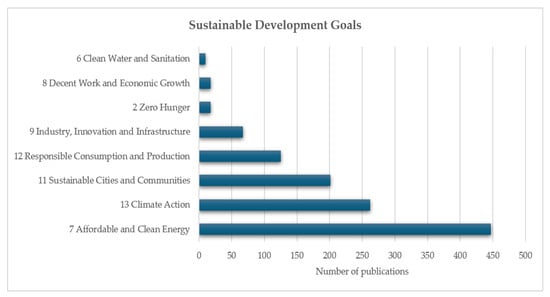
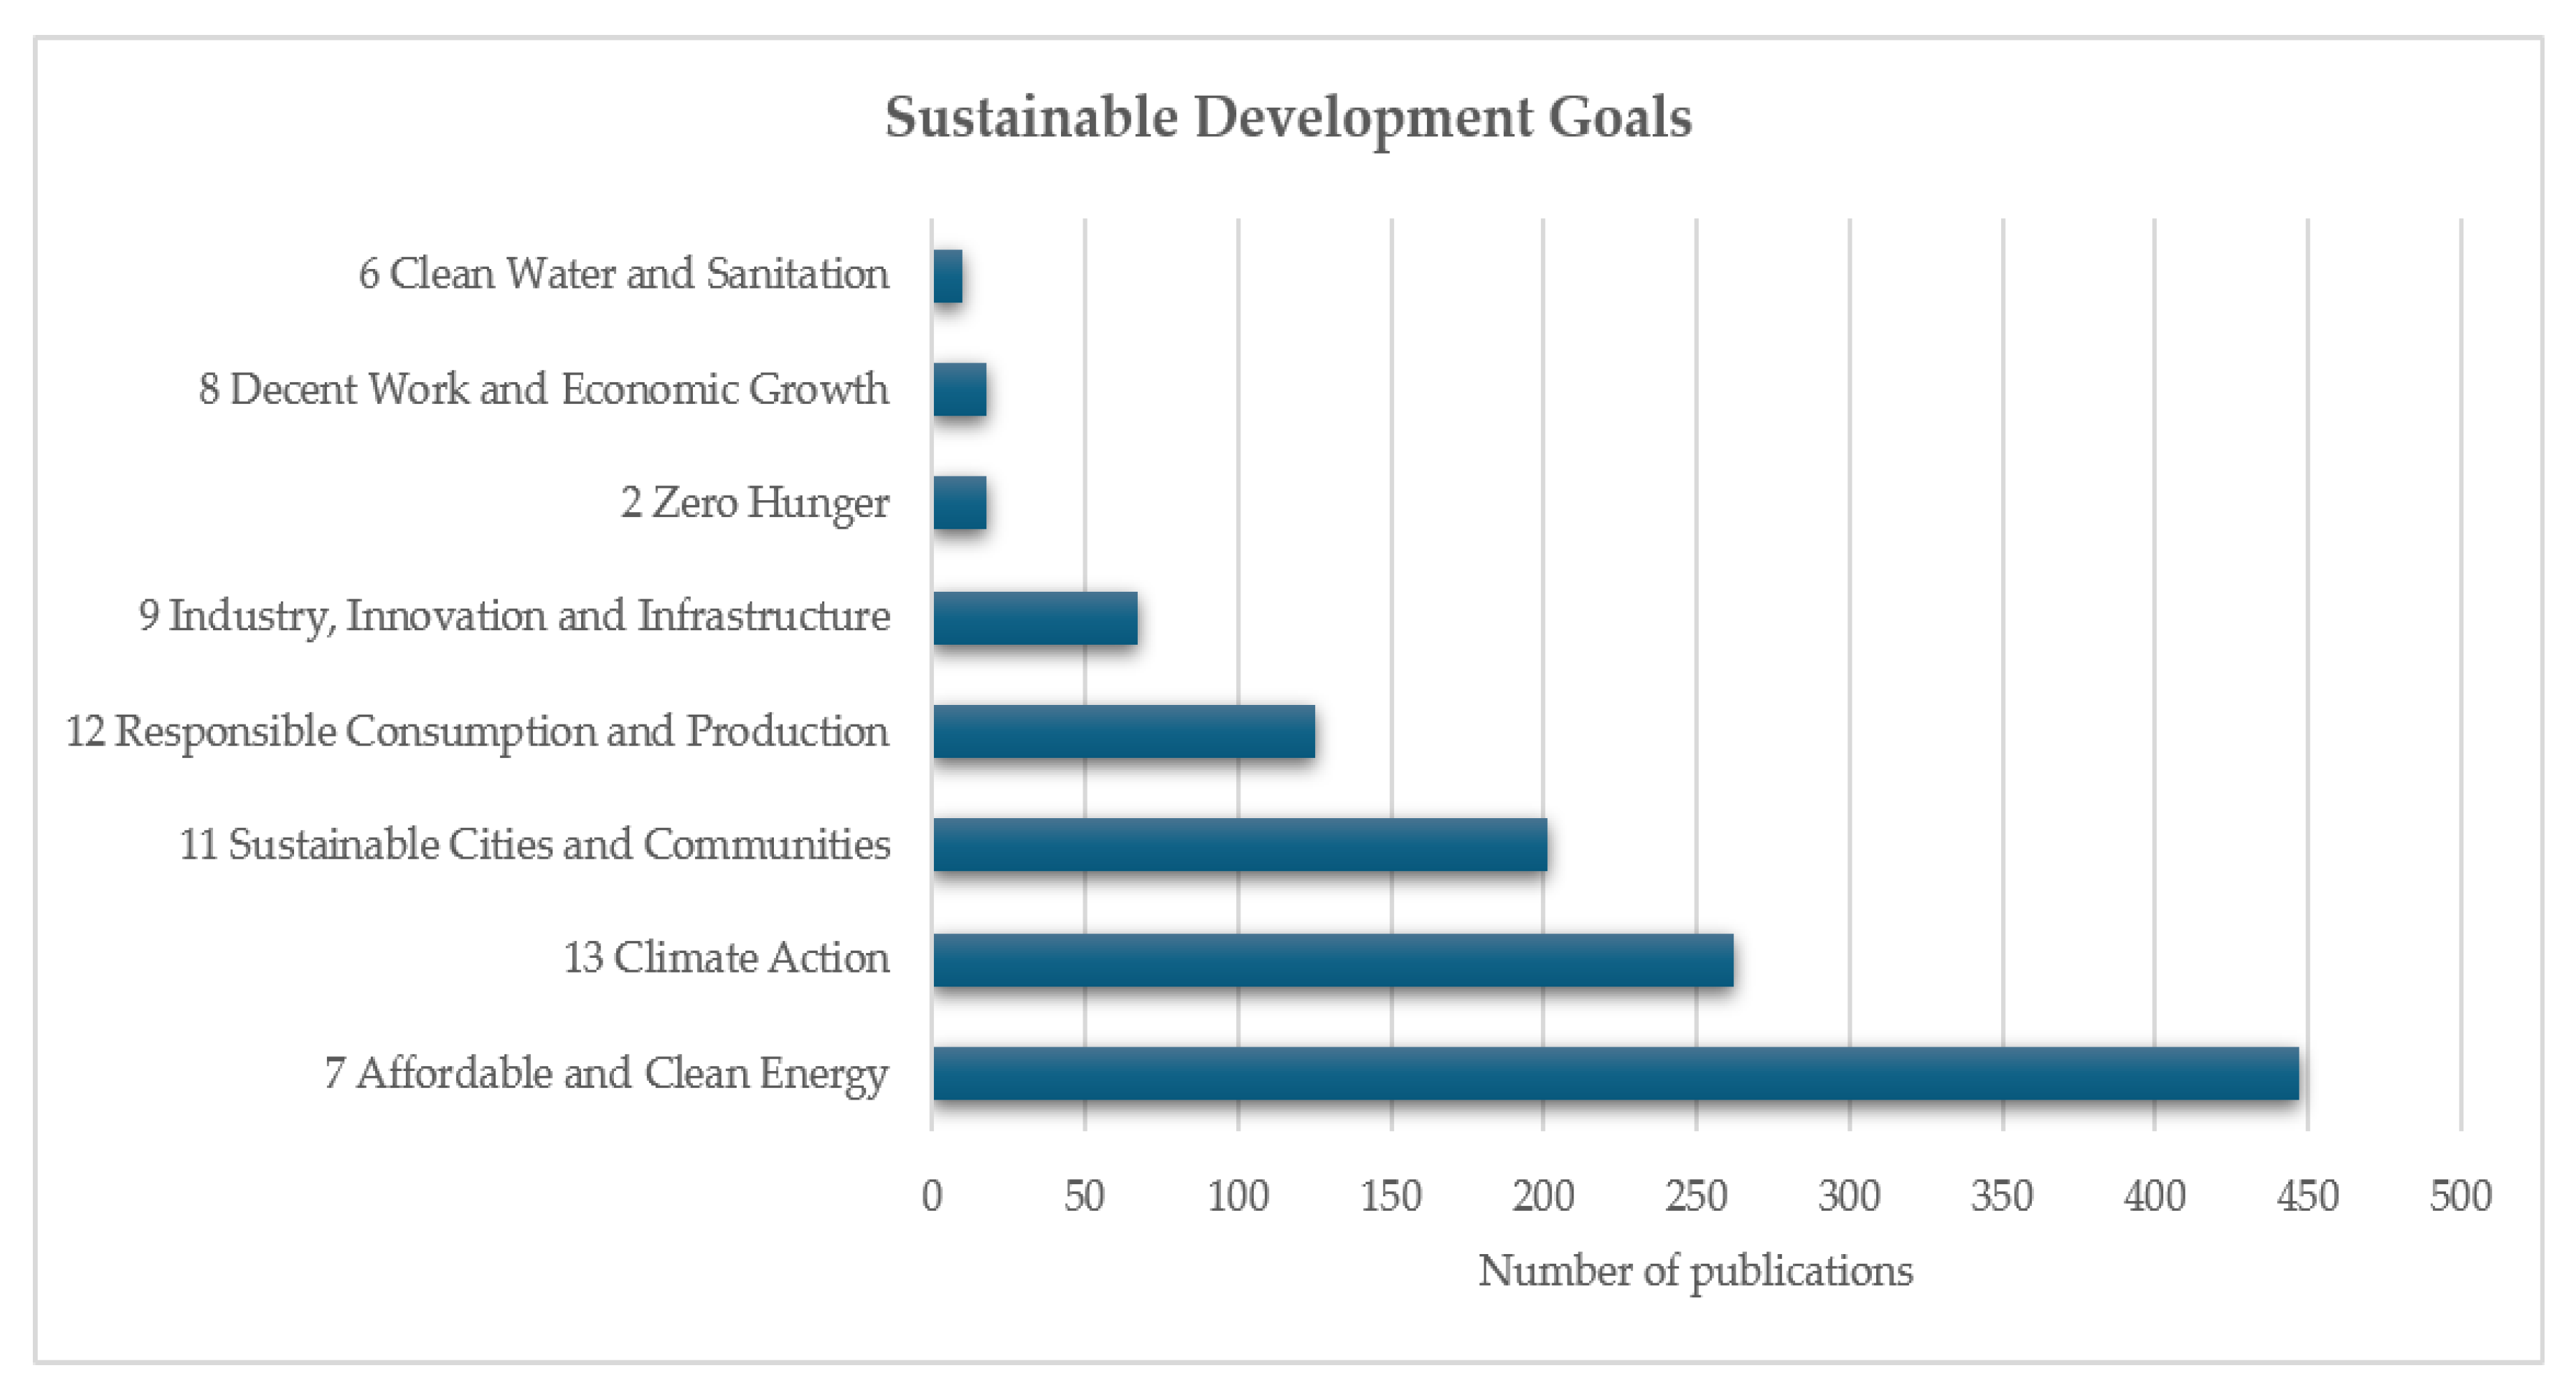
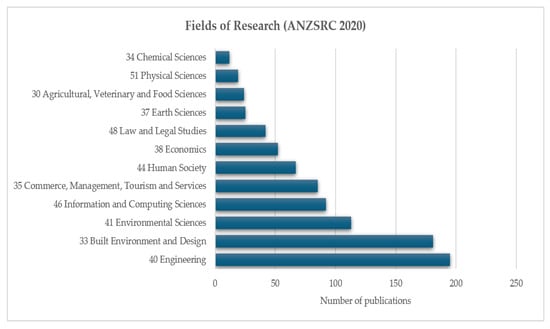
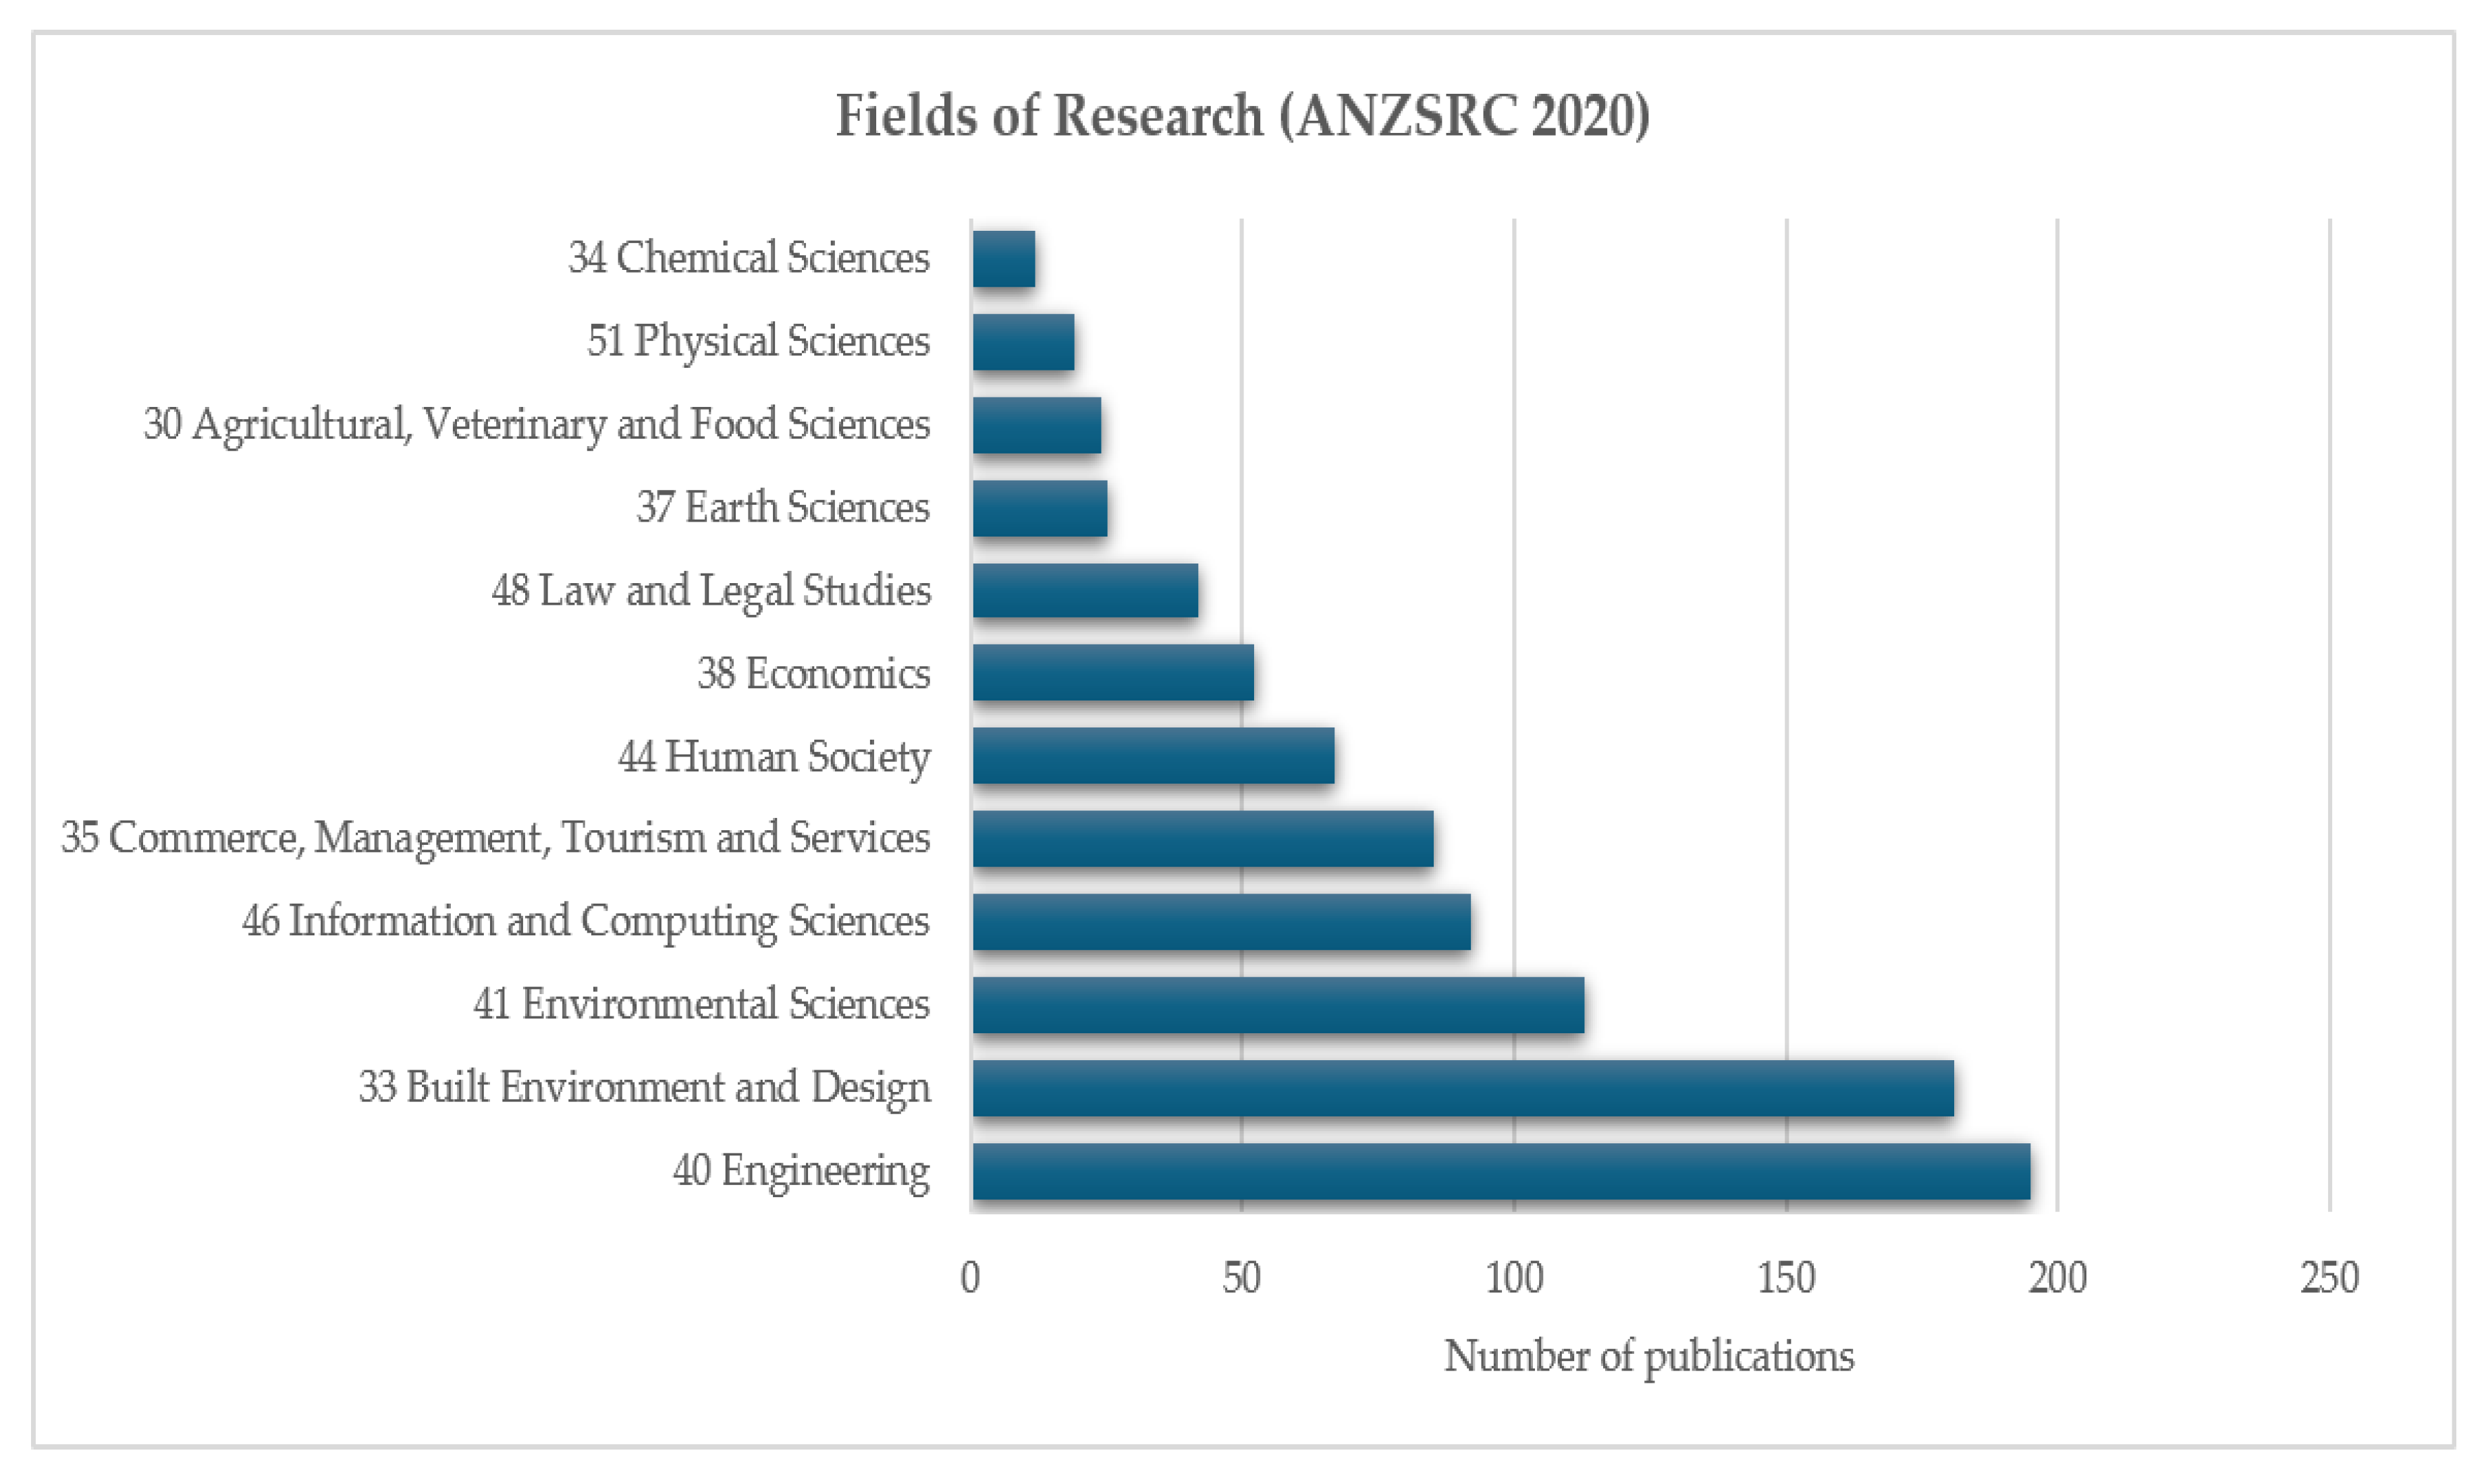
The retained 610 papers span 17 Sustainable Development Goals (SDGs) adopted by the United Nations [41], with the best coverage for SDG 7 (affordable and clean energy), SDG13 (climate action), SDG11 (sustainable cities and communities), SDG12 (responsible consumption and production) and SDG9 (industry, innovation and infrastructure), as revealed by Figure 2. They cover many fields of research categorized according to the ANZRC 2020 fields of research classification scheme [42], belonging mainly to engineering, built environment and design, environmental sciences, and information and computing sciences, as revealed by Figure 3. The five most frequently appearing journals in the bibliometric data are Sustainability (with 222 citations), Energies (with 217 citations), Energy and Buildings (with 201 citations), Journal of Cleaner Production (with 196 citations), and Applied Sciences (with 57 citations).
Figure 2.
Main Sustainable Development Goals covered by bibliometric data. Source: processed from Dimensions bibliometric data.
Figure 3.
Main fields of research covered by bibliometric data. Source: processed from Dimensions bibliometric data.
Table 3 presents the identified key terms belonging to each of the EE-S-R dimensions. The composite score ranges from 45.32 for C4 to 22.73 for C7. The relative bibliometric weight of each component to the specific dimension is computed by Formula (2), and Table 3 also contains calculated values, showing that their values vary from 43.83% for C4 to 28.01% for C6.
Table 3.
The 3 × 3 model EE-S-R: nine components and bibliometric coverage.
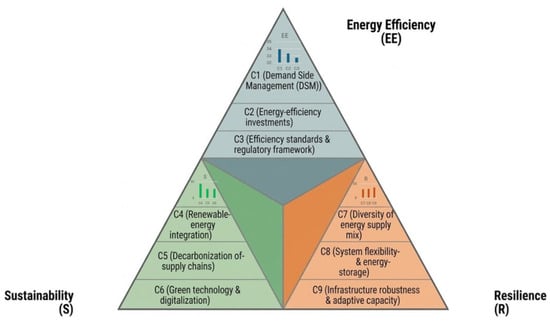
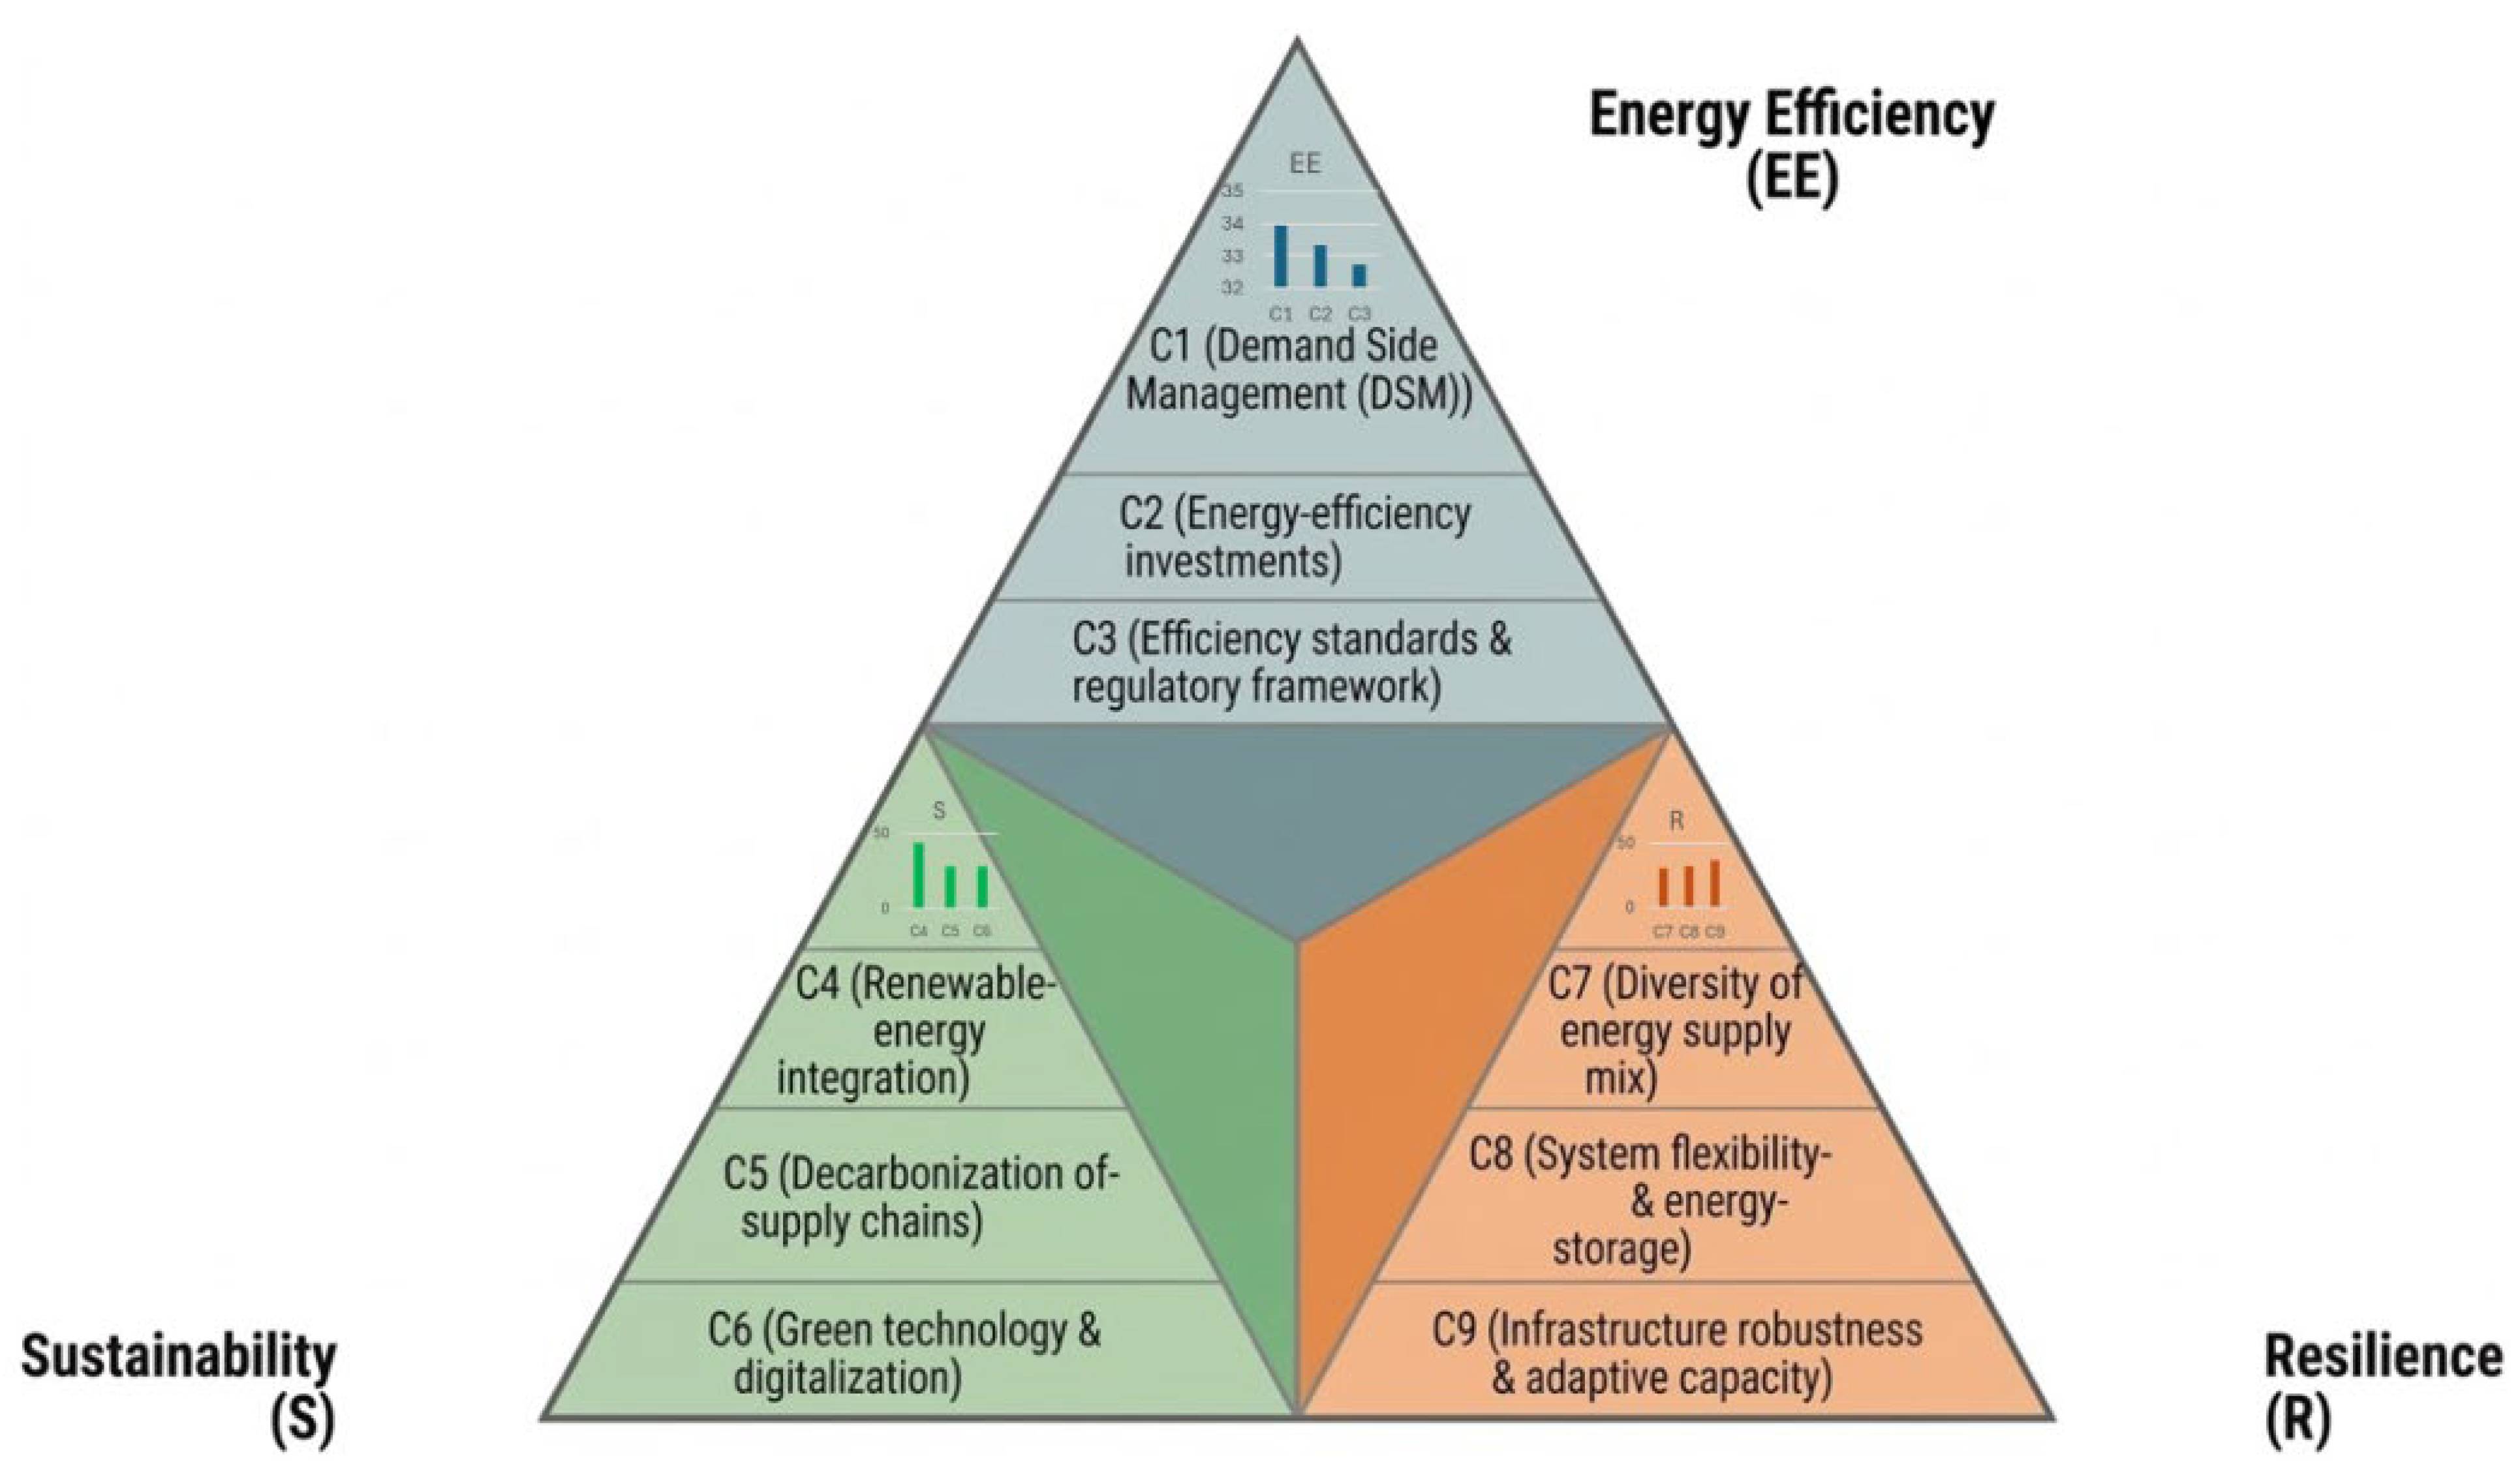
Figure 4 presents the conceptual ternary framework of the 3 × 3 model EE-S-R, with component weights within the corresponding dimensions.
Figure 4.
Conceptual ternary framework of energy efficiency–sustainability–resilience.
5. Discussion
The bibliometric analysis produces a data-driven ranking of candidate terms by their frequency and relevance across 610 papers. The three-criterion protocol quantifies the dimensional specificity of each candidate, identifying the components most distinctly associated with each dimension. In this way, the components retain the strongest bibliometric presence in the EE-S-R literature and are assigned to the dimension they most distinctly represent within the conceptual model. A key methodological contribution of this study is the umbrella grouping, which aggregates 63 terms selected from the initial 93 VOSviewer candidates into nine constitutive categories, grounding the component vocabulary in empirically attested patterns while preserving the theoretical structure of the framework.
The reduction from the full VOSviewer term pool to nine umbrella factors followed a step-by-step procedure. In the first stage, VOSviewer was executed on 610 articles, with a co-occurrence analysis set to title and abstract fields, the counting method set to binary counting and a minimum term occurrence threshold of 10, yielding a candidate pool of 93 terms. The choice of 10 as a minimum threshold represents a calibration decision, as lower thresholds admit terms that appear too infrequently to constitute stable research centers and might inflate the network with noise. A threshold of 10 is considered sufficient to distinguish genuine scholarly attention from incidental co-mention. In a second step, a composite score was computed for each of the 93 terms as the product of its occurrence frequency and its relevance. In this way, the result captures terms that are simultaneously prominent and thematically discriminating. The threshold for retention was set at the average composite score across all 93 terms, which computed to 22.20. This approach was preferred because it adapts automatically to the properties of the selected articles. The threshold was set at the average composite rather than the median for a distributional reason. In a bibliometric distribution, the median cuts the ranked list at the 50th percentile by construction, irrespective of the actual spread of values. It would, therefore, retain half the terms regardless of whether the score distribution exhibits a natural break point, treating the selection as a fixed-proportion filter rather than one responsive to the articles’ structure. The average, in contrast, is sensitive to the distributional shape. Using the average as the threshold allows the bibliometric data to set their own standard of prominence rather than imposing an external proportional criterion. The distribution of the composite scores confirms that no term lies between the highest excluded score (18.79) and the lowest included score (22.33), making the boundary stable with respect to any threshold variation within the interval, such that any threshold set between these two values yields the same 63 terms.
Compound noun phrases sharing a common word (e.g., “energy resilience”, “grid resilience”, and “infrastructure resilience”) were retained as distinct lexical units because their co-occurrence profiles with other terms might represent meaningful empirical signals about sub-thematic differentiation.
In a third step, four general terms that exceeded the composite threshold were removed on grounds of transversality: “building”, “model”, “performance”, and “data”. Their profile is diagnostically consistent, as all four combine high occurrences (68–56), with low relevance scores (0.3286–0.4012), indicating co-occurrence across multiple clusters rather than concentration within a specific component. C6 terms, in contrast, combine moderate-to-high occurrence with above-average relevance scores, indicating concentration within the EE-S-R domain, which justifies their retention based on specific technological mechanisms despite the component’s integrative character. VOSviewer assigns terms from C6 and C8 to the same empirical clusters despite their theoretical placement in different components, based on thematic content. This co-clustering reflects the interdependence between digital-enabling technologies and physical flexibility in the literature. This suggests that the sustainability and resilience dimensions of the nexus are structurally coupled at the level of technology, which is consistent with the nexus argument.
The composite score is defined as the product of occurrence frequency and relevance weight because multiplication implements a connective selection criterion: a term must score substantially on both dimensions simultaneously to be retained. Addition, raw or normalized, would allow a term with very high occurrence and near-zero relevance to pass, which is precisely the condition that characterizes generic cross-cutting vocabulary such as “energy”, “system”, or “management”. Multiplication penalizes this combination naturally, since near-zero relevance drives the product toward zero regardless of how frequently the term appears. Alternative approaches were taken into consideration but excluded on the following grounds: normalized weighted sums require a priori weight specification for which no data-grounded basis exists in this study, while rank-based methods lose the magnitude of inter-term differences.
In a fourth step, the retained terms were assigned to nine umbrella components using a two-criterion rule: primary assignment followed the VOSviewer cluster membership of each term, which reflects empirical co-occurrence proximity. A secondary assignment applied thematic content to the theoretical definition of each component, where two clusters overlapped.
The acceleration in publications noticed after 2021 is consistent with post-COP26 research intensification [68]. The dominance of 2024–2025 papers (83.4% of the total) suggests that the EE-S-R nexus is an emerging research domain, and this study establishes a documented baseline of component coverage. The temporal concentration documented in the dataset reflects a structural feature of the research domain, which was shaped primarily in response to European climate law [69] and the accelerated post-pandemic energy transition agenda. A subperiod analysis was considered not feasible, given the distribution of the data, with 61 papers pre-2023. Comparing results across subperiods of unequal statistical power would not have been a valid stability test. The citation trajectory shows a sharp increase after 2022, consistent with the rapid growth in both publication volume and cumulative citations, reflecting the emergence of EE-S-R research as an active scholarly domain.
The Dimensions database produced 610 papers, and VOSviewer analysis, with a minimum occurrence threshold of 10, produced 93 most-relevant terms, with 2226 links and a total link strength of 5232, applying normalization by association strength. The PRISMA protocol inclusion and exclusion criteria for both tracks, Dimensions and VOSviewer, prioritized thematic relevance over volume, ensuring that the co-occurrence network reflects genuine conceptual proximity and not an incidental keyword overlap. The subsequent aggregation of the 63 terms into nine umbrella components follows a semantic consolidation in which terms that share a common referent in energy systems research are assigned to the same umbrella category.
The 3 × 3 model EE-S-R provides balanced analytical coverage and reflects a conceptual interdependence. The energy efficiency dimension is characterized by internal governance logic: C1 (demand-side management) operationalizes demand management, C2 (investment in energy efficiency) brings the financial flow through which efficiency improvements can be financed, and C3 (efficiency standards) provides the regulatory architecture. The three components of the sustainability dimension—C4, C5 and C6—describe the progression from energy source transformation to full value chain decarbonization, mediated by digital infrastructure. The sustainability dimension is dominated by C4 (renewable energy integration), which is the most important factor in the entire bibliometric dataset. C5 (decarbonization of supply chains) and C6 (green technology and digitalization) are behind, making a rational cluster of sustainability enabling factors. The three components of resilience —C7, C8 and C9—address the capacity of energy systems to withstand, adapt and recover from various disruptions. The resilience dimension shows a more heterogeneous profile, being the most specialized of all dimensions. C9 (infrastructure robustness and adaptive capacity) has a high composite score, driven by the literature on critical infrastructure and urban systems. The resilience dimension is a multi-dimensional system property encompassing the geopolitical dimension of import dependence, the operational dimensions of flexibility and the physical dimension of asset durability.
The nine components of the EE-S-R nexus have differentiated roles and reflect a structure in which institutional, behavioral, financial and technical factors operate at different levels. C1 (demand-side management) reduces peak load, enabling renewable penetration by modulating consumption patterns. The co-occurrence pattern of its constituent terms (demand response, demand-side management, load management, and smart metering) reflects a focus on the operational interface between end users and energy systems. The scholarly literature reveals the importance of demand management for higher renewable penetration rather than standalone efficiency measures.
C2 (investment in energy efficiency) constitutes a primary capital condition for efficiency adaptation and the investment lever. Its bibliometric profile reflects the substantial research on building renovations and energy performance and retrofitting. For instance, buildings cannot perform to their technical potential without retrofit expenditure, and cities cannot transition to smart cities without the financial flows that underpin the energy infrastructure.
C3 (efficiency standards and regulatory framework) represents the institutional activation pathway, compelling market compliance and technology adaptation across public and private sectors. Its selection as an umbrella component reflects the density of co-occurrence between terms such as energy policy, energy regulation, and efficiency standards, terms that cluster together because the literature treats them as instruments operating in the market transformation.
C4 (renewable energy integration) represents the core sustainability component, positioned at the intersection of all three dimensions of the EE-S-R nexus. The breadth of its co-occurrence with terms from all three dimensions reflects the structuring role that renewable energy occupies in the energy transition, confirmed by the richest cross-dimension co-occurrence pattern.
C5 (decarbonization of supply chains) is the environmental component of the nexus, and it has an aggregated outcome: it measures whether the combined action of efficiency, investment, regulation, digitalization and infrastructure has produced an actual reduction in the carbon intensity of energy and production systems. Its bibliometric importance reflects the expansion of research on carbon emissions, greenhouse gases, carbon footprint, life cycle assessment and the circular economy, extending carbon accountability beyond operational boundaries to encompass the full value chain.
C6 (green technology and digitalization) operates as a digital catalyst that enables smart grid integration and cross-dimensional monitoring across the entire EE-S-R nexus. It has a transversal character and runs through the entire nexus. Its bibliometric profile argues for its cross-cutting character: digital twin, artificial intelligence, and the IoT appear in papers classified under energy efficiency, renewable energy and system flexibility.
C7 (diversity of energy supply mix) represents a security component shaped by policy and investment decisions rather than being an autonomous driver of system behavior. Its bibliometric profile reflects research on energy security, distributed energy, energy diversification, energy mix, and energy independence.
C8 (system flexibility and energy storage) is a technical pivot between renewable generation and supply continuity. Without adequate storage and flexibility, increasing renewable penetration worsens grid instability rather than reducing it, as solar and wind generation is intermittent [70]. The co-occurrence of battery systems, smart grids, grid flexibility and system flexibility reflects research on the mechanisms through which this intermittent character is compensated.
C9 (infrastructure robustness and adaptive capacity) provides the material platform on which all other system capabilities rest. Transmission and distribution networks determine the geographical reach over which renewables can be used, and demand response can be coordinated. The co-occurrence of terms such as infrastructure resilience, climate resilience, disaster resilience, and critical infrastructure shows that this factor is understood in the literature as more connected to risk and continuity rather than performance optimization. The adaptive dimension extends beyond resistance to disruption to include the capacity to reconfigure or upgrade infrastructure in response to evolving energy demands, technological change or climate-related pressures.
The bibliometric weighting from Table 3 for each dimension reveals several structural characteristics. Within energy efficiency dimensions, C1 exhibits the highest intra-dimensional bibliometric weight, surpassing C2 and C3, which suggests that demand-side management is more extensively covered in the bibliometric data than investments in energy efficiency or regulatory frameworks. The sustainability dimension is governed by C4, and this indicates that the analyzed bibliometric data favor renewable energy integration in comparison with C5 and C6. The resilience dimension is dominated by C9, which accounts for a larger share, surpassing the weights of C7 and C8. This concentration reflects stronger representation of infrastructure robustness and adaptive capacity in the reviewed literature.
The findings indicate which components receive relatively less bibliometric attention within the bibliometric data, which may inform future research priorities and agenda setting, though verification across broader literature sources remains advisable. Advancing theoretical understanding and practical deployment of various supply mixes and storage solutions is fundamental to national and international agendas. By reinforcing these specific components, in contrast with relying exclusively on decarbonization, for instance, will enhance the capacity of national and regional infrastructure to cope with exogenous system disruptions.
The co-occurrence structure of the analyzed literature suggests theoretically plausible relationships that warrant elaboration. Demand-side management (C1) and renewable energy sources (C4) exhibit a mutually reinforcing dynamic in which demand flexibility supports renewable integration and the other way around. Similarly, investments in energy efficiency and retrofitting (C2) are associated with progress on decarbonization (C5) through their effects on carbon emissions, while grid flexibility and storage (C8) facilitate both deeper decarbonization (C5) and greater supply continuity (C7). Two tensions can be identified: the intermittency of renewable output (C4) constrains grid stability and thus places additional pressure on storage and flexibility assets (C8), and investments in energy efficiency (C2) and in infrastructure resilience (C9) compete for the same public and private funds, at least partially. However, these relationships and tensions are simple associations that emerge from the reviewed literature and constitute suggestions for future empirical testing rather than identified findings.
The present study is subject to several limitations that should be considered when interpreting its findings. The analysis is limited to a single database. However, the Dimensions database offers a broader coverage of the literature over the last ten years, making it very relevant for the present study. Moreover, it provides richer metadata for co-occurrence analysis, which enabled the analyses reported by this study. The search was conducted only in English, thereby excluding a body of non-English literature. However, this study captures the vocabulary in the international peer-reviewed literature, where English serves as a primary means of scientific communication and where the terms submitted to VOSviewer co-occurrence analysis are most consistently defined and applied. Another limitation is linked to the query formulation. To partially mitigate the single-source limitation, the search query was designed to maximize recall within the Dimensions database by combining Boolean operators across the three large dimensions: energy efficiency, sustainability/sustainable development and resilience. However, alternative keyword combinations could yield a different bibliometric database, and the chosen one represents a valid operationalization of the EE-S-R nexus, not a perfect one. Co-occurrence was applied to titles and abstract fields, which may restrict the depth of thematic associations. However, titles and abstracts concentrate the author’s own conceptual framing, reducing noise from incidental or descriptive mentions within the body text. At the same time, the query formulation considers only peer-reviewed articles belonging to the EE-S-R nexus over the last ten years, making it relevant for the quality of the selected research. Research seeking to extend this analysis may supplement this study with a Scopus and/or Web of Science query to assess whether the nine components are stable across different database sources and treat the potential quantitative differences between databases as information about the sociology of knowledge production in the EE-S-R field. The consolidation of the 63 VOSviewer terms into nine umbrella components required interpretative judgment, and the assignment of boundary terms to one component rather than another retains an element of subjectivity.
This paper considers the EE-S-R dimensions as equally weighted at the dimensions level, and this is meant to avoid imposing a normative hierarchy that the bibliometric evidence does not support. Differential weighting remains an appropriate path for future research, particularly for multi-criteria decision analysis applied to specific policy contexts.
This study contributes to a structured methodology for component identification in multi-criteria decision-making research. The nine components will be further used to determine the causal map of the EE-S-R nexus.
6. Conclusions
This paper addresses the triple challenge of improving energy efficiency, advancing sustainability and strengthening resilience of energy systems. These three constructs are deeply connected, forming a triangular structure of interdependence, in which each domain constrains and enables the others and in which optimizing one in isolation risks degrading the remaining two. This paper introduces a conceptual framework based on the EE-S-R nexus comprising nine components, which are linked to a structured set of keywords and technical terms extracted from the Dimensions database and derived from the bibliometric analysis performed with the aid of VOSviewer.
From a methodological standpoint, this study applies bibliometric mapping to the EE-S-R nexus using co-occurrence data retrieved from the Dimensions database and analyzed with VOSviewer. The procedure yielded a candidate pool of 93 terms, of which 63 were subsequently consolidated into nine umbrella components through a composite indicator combining the occurrence frequency and relevance score. The principal conceptual contribution is a 3 × 3 component framework, which organizes the nine components across three dimensions, energy efficiency, sustainability and resilience, each comprising three thematically distinct components.
The EE-S-R framework is based on scholarly results and reveals a differential distribution of scholarly attention across the dimensions and components of the nexus, with renewable energy receiving disproportionate scholarly interest relative to its co-components. Supply diversity, system flexibility and storage remain underexplored in the selected literature within the resilience dimension. Given their systemic importance, future research should give greater attention to these components. The component structure can be further extended or revised in the future based on the forthcoming literature, providing a basis for cumulative framework development.
The policy implications of the framework concern the risks of partial or imbalanced energy transition strategies. Concentrating policy efforts exclusively on decarbonization and renewable energy integration is insufficient to ensure long-term energy stability. Prioritizing sustainability metrics while neglecting the grid storage capacity and supply mix diversification introduces systemic vulnerabilities. Advancing decarbonization agendas in isolation, without integrating diverse energy sources and robust storage solutions, compromises the stability of the energy transition. A coherent transition strategy, therefore, requires that environmental sustainability targets be pursued alongside the infrastructure and storage commitments necessary to support them.
The nine components describe a nexus, and they will be further used to determine their causal effects to be fully operational as a basis for designing policy sequences and investment priorities for the energy transition. The framework is also relevant for business research audiences, and the component structure provides a vocabulary that can be translated into managerial and governance outcomes once the causal architecture is fully established.
Funding
This research received no external funding.
Institutional Review Board Statement
Not applicable.
Informed Consent Statement
Not applicable.
Data Availability Statement
No new data were created in this study. Supplemental data sharing is not applicable to this article.
Acknowledgments
I am grateful to the reviewers for their valuable suggestions, which I hope have rendered this manuscript more coherent and its scientific contribution clearer and more persuasive. The author takes full responsibility for the content of this publication.
Conflicts of Interest
The author declares no conflicts of interest.
Appendix A
Appendix A.1
The list of the 93 terms, in descending order of their composite scores.
| No. | Term | Occurrences | Relevance Score | Composite Score | Umbrella Component |
| 1 | Renewable energy | 48 | 1.3006 | 62.43 | C4 |
| 2 | Energy transition | 92 | 0.6392 | 58.81 | C4 |
| 3 | Wind energy | 30 | 1.5995 | 47.99 | C4 |
| 4 | Photovoltaic | 31 | 1.4041 | 43.53 | C4 |
| 5 | Clean energy | 20 | 1.7871 | 35.74 | C4 |
| 6 | Urban resilience | 58 | 0.6127 | 35.54 | C9 |
| 7 | Machine learning | 21 | 1.6617 | 34.90 | C6 |
| 8 | Greenhouse gas | 38 | 0.9166 | 34.83 | C5 |
| 9 | Solar thermal | 21 | 1.6501 | 34.65 | C4 |
| 10 | Digital twin | 21 | 1.6422 | 34.49 | C6 |
| 11 | Solar energy | 12 | 2.8436 | 34.12 | C4 |
| 12 | Decarbonization | 26 | 1.2909 | 33.56 | C5 |
| 13 | IoT | 41 | 0.8165 | 33.48 | C6 |
| 14 | Carbon emission | 18 | 1.7258 | 31.06 | C5 |
| 15 | Critical infrastructure | 28 | 1.1066 | 30.98 | C9 |
| 16 | Artificial intelligence | 20 | 1.5352 | 30.70 | C6 |
| 17 | Circular economy | 30 | 1.0008 | 30.02 | C5 |
| 18 | Energy consumption behavior | 41 | 0.7119 | 29.19 | C1 |
| 19 | Energy storage | 11 | 2.6215 | 28.84 | C8 |
| 20 | Disaster resilience | 28 | 1.0108 | 28.30 | C9 |
| 21 | Infrastructure resilience | 36 | 0.7842 | 28.23 | C9 |
| 22 | Embodied carbon | 30 | 0.9044 | 27.13 | C5 |
| 23 | Energy audit | 23 | 1.1108 | 25.55 | C2 |
| 24 | Climate resilience | 13 | 1.9544 | 25.41 | C9 |
| 25 | Grid stability | 18 | 1.3737 | 24.73 | C8 |
| 26 | Carbon footprint | 40 | 0.6106 | 24.42 | C5 |
| 27 | Energy saving | 17 | 1.3901 | 23.63 | C2 |
| 28 | System flexibility | 28 | 0.8436 | 23.62 | C8 |
| 29 | Energy conservation | 28 | 0.8432 | 23.61 | C2 |
| 30 | Battery system | 16 | 1.471 | 23.54 | C8 |
| 31 | Energy directive | 13 | 1.8079 | 23.50 | C3 |
| 32 | Smart grid | 20 | 1.1734 | 23.47 | C8 |
| 33 | Energy policy | 16 | 1.4598 | 23.36 | C3 |
| 34 | Demand response | 15 | 1.5557 | 23.34 | C1 |
| 35 | Digitalization | 17 | 1.3698 | 23.29 | C6 |
| 36 | Energy independence | 16 | 1.4558 | 23.29 | C7 |
| 37 | Efficiency standard | 16 | 1.4556 | 23.29 | C3 |
| 38 | Building energy management | 12 | 1.9321 | 23.19 | C1 |
| 39 | Grid flexibility | 14 | 1.652 | 23.13 | C8 |
| 40 | Energy security | 26 | 0.8882 | 23.09 | C7 |
| 41 | Smart metering | 16 | 1.4425 | 23.08 | C1 |
| 42 | Smart building | 17 | 1.3571 | 23.07 | C6 |
| 43 | Energy resilience | 16 | 1.4403 | 23.04 | C9 |
| 44 | Demand-side management | 21 | 1.0903 | 22.90 | C1 |
| 45 | Smart home | 20 | 1.1429 | 22.86 | C6 |
| 46 | Life cycle assessment | 22 | 1.0368 | 22.81 | C5 |
| 47 | Retrofitting | 20 | 1.1396 | 22.79 | C2 |
| 48 | Thermal storage | 21 | 1.0851 | 22.79 | C8 |
| 49 | Energy labeling | 16 | 1.4235 | 22.78 | C3 |
| 50 | Demand flexibility | 17 | 1.3391 | 22.76 | C1 |
| 51 | Energy regulation | 15 | 1.5162 | 22.74 | C3 |
| 52 | Energy efficiency investment | 12 | 1.8949 | 22.74 | C2 |
| 53 | Energy governance | 21 | 1.0804 | 22.69 | C3 |
| 54 | Energy diversification | 33 | 0.6861 | 22.64 | C7 |
| 55 | Energy mix | 36 | 0.6286 | 22.63 | C7 |
| 56 | Building renovation | 34 | 0.6649 | 22.61 | C2 |
| 57 | Energy performance contracting | 20 | 1.1295 | 22.59 | C2 |
| 58 | Hybrid energy system | 33 | 0.6825 | 22.52 | C7 |
| 59 | Decentralized energy | 21 | 1.0713 | 22.50 | C7 |
| 60 | Community resilience | 22 | 1.0224 | 22.49 | C9 |
| 61 | Building | 66 | 0.3407 | 22.49 | Transversal |
| 62 | Distributed energy | 38 | 0.5914 | 22.47 | C7 |
| 63 | Data | 56 | 0.4012 | 22.47 | Transversal |
| 64 | Building code | 31 | 0.7235 | 22.43 | C3 |
| 65 | Model | 60 | 0.3734 | 22.40 | Transversal |
| 66 | Performance | 68 | 0.3286 | 22.34 | Transversal |
| 67 | Load management | 18 | 1.2406 | 22.33 | C1 |
| 68 | Management | 34 | 0.5525 | 18.79 | Not selected |
| 69 | Climate action | 30 | 0.5173 | 15.52 | Not selected |
| 70 | Energy | 30 | 0.4369 | 13.11 | Not selected |
| 71 | Environmental stewardship | 21 | 0.577 | 12.12 | Not selected |
| 72 | Resource consumption | 21 | 0.5534 | 11.62 | Not selected |
| 73 | Technology | 22 | 0.4975 | 10.95 | Not selected |
| 74 | Renewable energy system | 22 | 0.4803 | 10.57 | Not selected |
| 75 | Seismic resilience | 23 | 0.438 | 10.07 | Not selected |
| 76 | Fossil fuel | 17 | 0.5822 | 9.90 | Not selected |
| 77 | Biomass | 21 | 0.4636 | 9.74 | Not selected |
| 78 | Energy integration | 20 | 0.4833 | 9.67 | Not selected |
| 79 | Vulnerability | 20 | 0.4771 | 9.54 | Not selected |
| 80 | Regulatory compliance | 20 | 0.4493 | 8.99 | Not selected |
| 81 | System | 25 | 0.3577 | 8.94 | Not selected |
| 82 | sdgs | 25 | 0.3205 | 8.01 | Not selected |
| 83 | Energy usage | 17 | 0.4702 | 7.99 | Not selected |
| 84 | Long-term resilience | 21 | 0.3721 | 7.81 | Not selected |
| 85 | Electricity | 18 | 0.4124 | 7.42 | Not selected |
| 86 | Economic viability | 13 | 0.5624 | 7.31 | Not selected |
| 87 | Sustainability objective | 20 | 0.361 | 7.22 | Not selected |
| 88 | Competitiveness | 17 | 0.4073 | 6.92 | Not selected |
| 89 | Environmental footprint | 24 | 0.2737 | 6.57 | Not selected |
| 90 | Environmental condition | 18 | 0.273 | 4.91 | Not selected |
| 91 | Environmental responsibility | 15 | 0.3208 | 4.81 | Not selected |
| 92 | Emission | 20 | 0.2356 | 4.71 | Not selected |
| 93 | Sustainable future | 16 | 0.237 | 3.79 | Not selected |
| Average | 22.20 | ||||
Appendix A.2
The assignment of each component to one of the EE-S-R dimensions.
| No. | Component | Term | Dimension (Theoretical) | VOSviewer Cluster (Empirical) | Thematic Reference |
| 1 | C1 | Demand response | Energy efficiency | Cluster 1 | All terms address consumption-side management. |
| 2 | Demand-side management | ||||
| 3 | Building energy management | ||||
| 4 | Smart metering | ||||
| 5 | Load management | ||||
| 6 | Energy consumption behavior | ||||
| 7 | Demand flexibility | ||||
| 8 | C2 | Energy efficiency investment | Capital mobilization for efficiency upgrades. | ||
| 9 | Retrofitting | ||||
| 10 | Building renovation | ||||
| 11 | Energy saving | ||||
| 12 | Energy conservation | ||||
| 13 | Energy performance contracting | ||||
| 14 | Energy audit | ||||
| 15 | C3 | Energy policy | Institutional instruments mandating efficiency. | ||
| 16 | Energy regulation | ||||
| 17 | Efficiency standard | ||||
| 18 | Energy directive | ||||
| 19 | Energy governance | ||||
| 20 | Building code | ||||
| 21 | Energy labeling | ||||
| 22 | C4 | Renewable energy | Sustainability | Cluster 2 | Renewable generation is the primary sustainability metric. |
| 23 | Solar energy | ||||
| 24 | Photovoltaic | ||||
| 25 | Wind energy | ||||
| 26 | Clean energy | ||||
| 27 | Energy transition | ||||
| 28 | Solar thermal | ||||
| 29 | C5 | Carbon emission | Environmental performance and life cycle accounting. | ||
| 30 | Greenhouse gas | ||||
| 31 | Decarbonization | ||||
| 32 | Circular economy | ||||
| 33 | Life cycle assessment | ||||
| 34 | Carbon footprint | ||||
| 35 | Embodied carbon | ||||
| 36 | C6 | Artificial intelligence | Cluster 3 Cluster 4 | Digital and smart technology enable efficiency, optimization and sustainability transition. C6 clusters empirically with C8. | |
| 37 | Digital twin | ||||
| 38 | Machine learning | ||||
| 39 | Smart building | ||||
| 40 | IoT | ||||
| 41 | Digitalization | ||||
| 42 | Smart home | ||||
| 43 | C7 | Energy security | Resilience | Cluster 4 | Supply diversity is a structural resilience property. |
| 44 | Hybrid energy system | ||||
| 45 | Energy diversification | ||||
| 46 | Energy mix | ||||
| 47 | Decentralized energy | ||||
| 48 | Distributed energy | ||||
| 49 | Energy independence | ||||
| 50 | C8 | Energy storage | Cluster 3 Cluster 4 | Grid flexibility and storage assets ensure operational continuity under variable supply conditions. C8 clusters empirically with C6. | |
| 51 | Grid stability | ||||
| 52 | System flexibility | ||||
| 53 | Battery system | ||||
| 54 | Smart grid | ||||
| 55 | Grid flexibility | ||||
| 56 | Thermal storage | ||||
| 57 | C9 | Infrastructure resilience | Cluster 4 | Physical asset durability underpins all system capabilities. Adaptive capacity enables reconfiguration of response to the evolving demands and pressures. | |
| 58 | Urban resilience | ||||
| 59 | Climate resilience | ||||
| 60 | Critical infrastructure | ||||
| 61 | Disaster resilience | ||||
| 62 | Community resilience | ||||
| 63 | Energy resilience |
References
- Rozhkov, A. Decentralized renewable energy integration in the urban energy markets: A system dynamics approach. PLoS Complex Syst. 2025, 2, e0000083. [Google Scholar] [CrossRef] [Scilit]
- Brockway, P.E.; Sorrell, S.; Semieniuk, G.; Heun, M.K.; Court, V. Energy efficiency and economy-wide rebound effects. Renew. Sustain. Energy Rev. 2021, 141, 110781. [Google Scholar] [CrossRef] [Scilit]
- Child, M.; Koskinen, O.; Linnanen, L.; Breyer, C. Sustainability guardrails for energy scenarios of the global energy transition. Renew. Sustain. Energy Rev. 2018, 91, 321–334. [Google Scholar] [CrossRef] [Scilit]
- Naimoglu, M.; Akal, M. The relationship between energy technology, energy efficiency, renewable energy, and the environment in Türkiye. J. Clean. Prod. 2023, 418, 138144. [Google Scholar] [CrossRef] [Scilit]
- Zhou, Y. Climate change adaptation with energy resilience in energy districts: A state-of-the-art review. Energy Build. 2023, 279, 112649. [Google Scholar] [CrossRef] [Scilit]
- Gatto, A.; Drago, C. A taxonomy of energy resilience. Energy Policy 2020, 136, 111007. [Google Scholar] [CrossRef] [Scilit]
- Alam Bhuiyan, M.M.; Hammad, A. Engineering and design for sustainable construction: A bibliometric analysis of current Status and future trends. Sustainability 2024, 16, 2959. [Google Scholar] [CrossRef] [Scilit]
- Menna, C.; Felicioni, L.; Negro, P.; Lupísek, A.; Romano, E.; Prota, A.; Zuccaro, G. Review of methods for the combined assessment of seismic resilience and energy efficiency towards sustainable retrofitting of existing European buildings. Sustain. Cities Soc. 2022, 77, 103556. [Google Scholar] [CrossRef] [Scilit]
- Dimensions. Digital Science. Available online: https://www.dimensions.ai (accessed on 15 September 2026).
- van Eck, N.J.; Waltman, L. Software survey: VOSviewer, a computer program for bibliometric mapping. Scientometrics 2010, 84, 523–538. [Google Scholar] [CrossRef] [Scilit] [PubMed]
- International Energy Agency. Energy Efficiency 2025. 2025. Available online: https://www.iea.org/reports/energy-efficiency-2025/executive-summary (accessed on 17 October 2026).
- United Nations. COP28: Climate Action Can’t Wait. United Nations Framework Convention on Climate Change (UNFCCC). 2023. Available online: https://www.un.org/en/climatechange/cop28 (accessed on 16 October 2026).
- Eurostat. Energy Use of EU Economy: −4.1 % in 2023. Eurostat News. Available online: https://ec.europa.eu/eurostat/web/products-eurostat-news/w/ddn-20260212-1 (accessed on 20 March 2026).
- Momete, D.C. A critical analysis of the primary energy consumption trends from a sustainable perspective. Univ. Politeh. Buchar. Sci. Bull. Ser. B 2007, 69, 73–80. [Google Scholar]
- International Energy Agency (IEA). Global Energy Review 2025. 2025. Available online: https://iea.blob.core.windows.net/assets/5b169aa1-bc88-4c96-b828-aaa50406ba80/GlobalEnergyReview2025.pdf (accessed on 16 October 2026).
- Eurostat. Primary Energy Consumption (Online Data Code: sdg_07_10). European Commission. Available online: https://ec.europa.eu/eurostat/databrowser/view/sdg_07_10/default/table?lang=en (accessed on 15 March 2026).
- Eurostat. Final Energy Consumption (Online Data Code: sdg_07_11). European Commission. Available online: https://ec.europa.eu/eurostat/databrowser/view/sdg_07_11/default/table?lang=en (accessed on 15 March 2026).
- Official Journal of the European Union. Directive (EU) 2023/1791 of the European Parliament and of the Council. Available online: https://eur-lex.europa.eu/legal-content/EN/TXT/PDF/?uri=CELEX:32023L1791 (accessed on 1 March 2026).
- Momete, D.C. Salient insights on the performance of EU member states on the road towards an energy-efficient future. Energies 2023, 16, 925. [Google Scholar] [CrossRef] [Scilit]
- Sorrell, S.; Dimitropoulos, J. The rebound effect: Microeconomic definitions, limitations and extensions. Ecol. Econ. 2008, 65, 636–649. [Google Scholar] [CrossRef] [Scilit]
- Chitnis, M.; Sorrell, S.; Druckman, A.; Firth, S.K.; Jackson, T. Turning lights into flights: Estimating direct and indirect rebound effects for UK households. Energy Policy 2013, 55, 234–250. [Google Scholar] [CrossRef] [Scilit]
- Gillingham, K.; Rapson, D.; Wagner, G. The rebound effect and energy efficiency policy. Rev. Environ. Econ. Policy 2016, 10, 68–88. [Google Scholar] [CrossRef] [Scilit]
- IRENA. Renewable Capacity Statistics 2026; International Renewable Energy Agency: Abu Dhabi, United Arab Emirates, 2026. [Google Scholar]
- Eurostat. Share of Renewable Energy in Gross Final Energy Consumption (Online Data Code: sdg_07_40). European Commission. Available online: https://ec.europa.eu/eurostat/databrowser/view/sdg_07_40/default/table?lang=en (accessed on 18 March 2026).
- Eurostat. Renewable Energy Statistics. Statistics Explained. Available online: https://ec.europa.eu/eurostat/statistics-explained/index.php?title=Renewable_energy_statistics (accessed on 15 April 2026).
- EEA. Share of Energy Consumption from Renewable Sources in Europe. European Environment Agency. Available online: https://www.eea.europa.eu/en/analysis/indicators/share-of-energy-consumption-from (accessed on 15 April 2026).
- Ullah, A.; Nobanee, H.; Ullah, S.; Iftikhar, H. Renewable energy transition and regional integration: Energizing the pathway to sustainable development. Energy Policy 2024, 193, 114270. [Google Scholar] [CrossRef] [Scilit]
- Schmitz, R.; Flachsbarth, F.; Plaga, L.S.; Braun, M.; Härtel, P. Energy security and resilience: Revisiting concepts and advancing planning perspectives for transforming integrated energy systems. Energy Policy 2025, 207, 114796. [Google Scholar] [CrossRef] [Scilit]
- IEA. Electricity Grids and Secure Energy Transitions; International Energy Agency: Paris, France, 2023; Available online: https://www.iea.org/reports/electricity-grids-and-secure-energy-transitions (accessed on 17 October 2026).
- European Commission. Grids, the Missing Link-An EU Action Plan for Grids, COM(2023) 757. Available online: https://eur-lex.europa.eu/legal-content/EN/TXT/PDF/?uri=CELEX:52023DC0757 (accessed on 1 March 2026).
- Bond, K.; Butler-Sloss, S.; Walter, D. Energy Security in an Insecure World; Ember: London, UK, 2025; Available online: https://ember-energy.org/latest-insights/energy-security-in-an-insecure-world (accessed on 17 October 2026).
- Eurostat. Energy in Europe—2026 Edition. Available online: https://ec.europa.eu/eurostat/web/interactive-publications/energy-2026 (accessed on 15 August 2026).
- Bagherian, A.; Gershon, M.; Kumar, S.; Mishra, M.K. Analyzing the relationship between digitalization and energy sustainability: A comprehensive ISM-MICMAC and DEMATEL approach. Expert Syst. Appl. 2024, 236, 121193. [Google Scholar] [CrossRef] [Scilit]
- Amini, M.; Saberi, M.; Jalilpour, M. Electrical energy systems resilience: A comprehensive review on definitions, challenges, enhancements and future proceedings. IET Renew. Power Gener. 2023, 17, 807–827. [Google Scholar] [CrossRef] [Scilit]
- Ismail, A.; Munsi, H.; Yusuf, A.M.; Hijjang, P. Mapping one decade of identity studies: A comprehensive bibliometric analysis of global trends and scholarly impact. Soc. Sci. 2025, 14, 92. [Google Scholar] [CrossRef] [Scilit]
- Prakash, K.P.; Kumar, Y.V.P.; Himajyothi, K.; Reddy, G.P. Comprehensive bibliometric analysis on smart Grids: Key concepts and research trends. Electricity 2024, 5, 75–92. [Google Scholar] [CrossRef] [Scilit]
- Koutra, S.; Mondejar, M.B.; Becue, V. The nexus of ‘urban resilience’ and ‘energy efficiency’ in cities. Curr. Res. Environ. Sustain. 2022, 4, 100118. [Google Scholar] [CrossRef] [Scilit]
- Herzog, C.; Hook, D.; Konkiel, S. Dimensions: Bringing down barriers between scientometricians and data. Quant. Sci. Stud. 2020, 1, 387–395. [Google Scholar] [CrossRef] [Scilit]
- Waltman, L.; van Eck, N.J.; Noyons, E.C.M. A unified approach to mapping and clustering of bibliometric networks. J. Informetr. 2010, 4, 629–635. [Google Scholar] [CrossRef] [Scilit]
- Page, M.J.; McKenzie, J.E.; Bossuyt, P.M.; Boutron, I.; Hoffmann, T.C.; Mulrow, C.D.; Shamseer, L.; Tetzlaff, J.M.; Akl, E.A.; Brennan, S.E.; et al. The PRISMA 2020 Statement: An updated guideline for reporting systematic reviews. Br. Med. J. 2021, 372, n71. [Google Scholar] [CrossRef] [Scilit] [PubMed]
- United Nations. Transforming Our World: The 2030 Agenda for Sustainable Development; Resolution A/RES/70/1; United Nations General Assembly: New York, NY, USA, 2015; Available online: https://sdgs.un.org/2030agenda (accessed on 20 May 2026).
- Australian Bureau of Statistics; Statistics New Zealand. Australian and New Zealand Standard Research Classification (ANZSRC) 2020; ABS: Canberra, Australia; Stats NZ: Wellington, New Zealand, 2020. Available online: https://www.abs.gov.au/statistics/classifications/australian-and-new-zealand-standard-research-classification-anzsrc/latest-release (accessed on 15 September 2026).
- Pinthurat, W.; Surinkaew, T.; Hredzak, B. An overview of reinforcement learning-based approaches for smart home energy management systems with energy storages. Renew. Sustain. Energy Rev. 2024, 202, 114648. [Google Scholar] [CrossRef] [Scilit]
- Zhao, X.; Zhang, Y. Integrated management of urban resources toward Net-Zero smart cities considering renewable energies uncertainty and modelling in digital twin. Sustain. Energy Technol. Assess. 2024, 64, 103656. [Google Scholar] [CrossRef] [Scilit]
- Barata, F.; Igreja, J. Energy Management in Buildings with Intermittent and Limited Renewable Resources. Energies 2018, 11, 2748. [Google Scholar] [CrossRef] [Scilit]
- Marini, A.; Passoni, C.; Belleri, A.; Feroldi, F.; Preti, M.; Metelli, G.; Riva, P. Combining seismic retrofit with energy refurbishment for the sustainable renovation of RC buildings: A proof of concept. Eur. J. Environ. Civ. Eng. 2017, 26, 2475–2495. [Google Scholar] [CrossRef] [Scilit]
- Ahmad, A.; Khan, A.; Javaid, N.; Hussain, H.M.; Abdul, W.; Almogren, A.; Alamri, A.; Azim Niaz, I. An Optimized Home Energy Management System with Integrated Renewable Energy and Storage Resources. Energies 2017, 10, 549. [Google Scholar] [CrossRef] [Scilit]
- Kajjoba, D.; Wesonga, R.; Lwanyaga, J.D.; Kasedde, H.; Olupot, P.W.; Kirabira, J.B. Assessment of thermal comfort and its potential for energy efficiency in low-income tropical buildings: A review. Sustain. Energy Res. 2025, 12, 25. [Google Scholar] [CrossRef] [Scilit]
- Chen, Y.; Timoudas, T.O.; Wang, Q. Flexibility-centric sizing and optimal operation of building-thermal energy storage systems: A systematic modelling, optimization and validation approach. Energy Build. 2025, 338, 115722. [Google Scholar] [CrossRef] [Scilit]
- Jiang, Z.; Yuan, C.; Xu, J. The impact of digital government on energy sustainability: Empirical evidence from prefecture-level cities in China. Technol. Forecast. Soc. Change 2024, 209, 123776. [Google Scholar] [CrossRef] [Scilit]
- Sattar, M.; Moghaddam, M.S.; Azarfar, A.; Salehi, N.; Vahedi, M. Co-optimization of integrated energy systems in the presence of renewable energy, electric vehicles, power-to-gas systems and energy storage systems with demand-side management. Clean Energy 2023, 7, 426–435. [Google Scholar] [CrossRef] [Scilit]
- Choobdari, M.; Moghaddam, M.S.; Davarzani, R.; Azarfar, A.; Hoseinpour, H. Robust distribution networks reconfiguration considering the improvement of network resilience considering renewable energy resources. Sci. Rep. 2024, 14, 23041. [Google Scholar] [CrossRef] [Scilit] [PubMed]
- Wu, K.; Davis, E. Economic determinants of renewable energy consumption in China: Integrating green infrastructure, urban agglomeration, and environmental stressors. Sustain. Dev. 2026, 34, 3689–3698. [Google Scholar] [CrossRef] [Scilit]
- Abbas, A.; Zhao, C.; Waseem, M.; Khan, K.A.; Ahmad, R. Analysis of energy input-output of farms and assessment of greenhouse gas emissions: A case study of cotton growers. Front. Environ. Sci. 2022, 9, 826838. [Google Scholar] [CrossRef] [Scilit]
- Maduta, C.; Melica, G.; D’Agostino, D.; Bertoldi, P. Towards a decarbonised building stock by 2050: The meaning and the role of zero emission buildings (ZEBs) in Europe. Energy Strategy Rev. 2022, 44, 101009. [Google Scholar] [CrossRef] [Scilit]
- Zaplata, S.; Muradin, M.; Feliczek, P.; Banach, J.K.; Sieciński, K. Organizational Resilience Opacity in the Prism of Circular Strategy—Metal Industry Manufacturing Practice. Sustainability 2024, 16, 10517. [Google Scholar] [CrossRef] [Scilit]
- Shoomal, A.; Jahanbakht, M.; Componation, P.J.; Ozay, D. Enhancing supply chain resilience and efficiency through internet of things integration: Challenges and opportunities. Internet Things 2024, 27, 101324. [Google Scholar] [CrossRef] [Scilit]
- Özkan, E.; Kök, İ.; Özdemır, S. DeepTwin: A deep reinforcement learning supported digital twin model for micro-grids. IEEE Access 2024, 12, 196432–196441. [Google Scholar] [CrossRef] [Scilit]
- Bragatto, M.A.; Bucarelli, F.; Carere, M.; Cresta, F.M.; Gatta, A.; Geri, M.; Maccioni, M.; Paulucci, M.; Poursoltan, P.; Santori, F. Near real-time analysis of active distribution networks in a digital twin framework: A real case study. Sustain. Energy Grids Netw. 2023, 35, 101128. [Google Scholar] [CrossRef] [Scilit]
- Sovacool, B.K.; Kester, J.; Zarazua de Rubens, G.; Noel, L. Expert perceptions of low-carbon transitions: Investigating the challenges of electricity decarbonisation in the Nordic region. Energy 2018, 148, 1162–1172. [Google Scholar] [CrossRef] [Scilit]
- Zubieta, L.E. Are microgrids the future of energy? IEEE Electrif. Mag. 2016, 4, 37–44. [Google Scholar] [CrossRef] [Scilit]
- Farooq, A.; Shahid, K.; Olsen, R.L. Prioritization of smart meters based on data monitoring for enhanced grid resilience. Comput. Commun. 2025, 234, 108082. [Google Scholar] [CrossRef] [Scilit]
- Campana, P.; Censi, R.; Ruggieri, R.; Amendola, C. Smart grids and sustainability: The impact of digital technologies on the energy transition. Energies 2025, 18, 2149. [Google Scholar] [CrossRef] [Scilit]
- Ismail, K.B.M.; Kumar, M.A.; Mahalingam, S.; Raj, B.; Kim, J. Carbon fiber-reinforced polymers for energy storage applications. J. Energy Storage 2024, 84, 110931. [Google Scholar] [CrossRef] [Scilit]
- Li, B.; Nian, V.; Shi, X.; Li, H.; Boey, A. Perspectives of energy transitions in East and Southeast Asia. WIREs Energy Env. 2020, 9, e364. [Google Scholar] [CrossRef] [Scilit]
- Hosseina, M.; Moghaddam, M.S.; Hassannia, A. Optimizing energy and load management in island microgrids for enhancing resilience against resource interruptions. Sci. Rep. 2025, 15, 16297. [Google Scholar] [CrossRef] [Scilit] [PubMed]
- Shayeghi, H.; Shahryari, E.; Moradzadeh, M.; Siano, P. A survey on microgrid energy management considering flexible energy sources. Energies 2019, 12, 2156. [Google Scholar] [CrossRef] [Scilit]
- United Nations. 2021 UN Climate change Conference in Glasgow. Available online: https://www.un.org/en/climatechange/cop26 (accessed on 18 August 2026).
- European Parliament; Council of the European Union. Regulation (EU) 2021/1119 (European Climate Law). Official Journal of the European Union. 2021. Available online: https://eur-lex.europa.eu/legal-content/EN/TXT/PDF/?uri=CELEX:32021R1119 (accessed on 17 October 2026).
- Conde, H.J.C.; Demition, C.M.; Honra, J. Storage is the new black: A review of energy storage system applications to resolve intermittency in renewable energy systems. Energies 2025, 18, 354. [Google Scholar] [CrossRef] [Scilit]

Disclaimer/Publisher’s Note: The statements, opinions and data contained in all publications are solely those of the individual author(s) and contributor(s) and not of MDPI and/or the editor(s). MDPI and/or the editor(s) disclaim responsibility for any injury to people or property resulting from any ideas, methods, instructions or products referred to in the content. |
© 2026 by the author. Licensee MDPI, Basel, Switzerland. This article is an open access article distributed under the terms and conditions of the Creative Commons Attribution (CC BY) license.