


Abstract
The assessment of sustainable transport measures relies on traffic microsimulation, in which safety, travel time, energy consumption, and emissions emerge from individual driver behavior. Driver differences can be described using personas: brief verbal characterizations provided to the decision-making model. The text must retain the specified characteristics and influence the model’s responses accordingly. This paper presents a method for generating and evaluating such descriptions for multi-agent traffic microsimulation with local language models running on a single consumer-grade graphics card. The scope is limited to generating and validating the persona texts; the microsimulation itself and comparison with real drivers were outside this study. Four properties were evaluated: fidelity to the driver’s characteristics, text diversity, linguistic correctness, and impact on decisions, with the language-model judges compared against two human raters. The study involved 300 agents, 8 local models, 2 languages, 6 instruction versions, and 86,760 overtaking decisions. All models retained the specified features, but higher fidelity was usually accompanied by lower diversity, and error rates varied more than 100-fold across models. Personas differentiated the responses according to the specified risk propensity (ρ ≈ 0.90) but did not outperform a single labeled sentence. The method provides a validated, controllable representation of driver heterogeneity for microsimulation tools that assess the safety, efficiency, and environmental impacts of transport solutions.
1. Introduction
Road transport is a major source of greenhouse gas emissions, air pollution, noise, and traffic injuries, and the transition to sustainable mobility depends on measures whose effects should be assessed before they are implemented: speed management, intersection control, changes in road layout, or changes in the composition of the vehicle fleet. Traffic microsimulation is a main tool for such in-advance assessment. It reproduces the movement of individual vehicles and derives travel time, traffic conflicts, energy consumption, and emissions from their trajectories, so every indicator it produces depends on how the simulated drivers behave. Drivers differ in speed choice, headways, acceleration, and willingness to overtake, and these differences determine fuel consumption, emissions, and exposure to conflicts. A simulation that gives all agents the same behavior can therefore misjudge a measure’s effect on a real, heterogeneous population. This article presents one component of such an assessment tool: a verified way to describe diverse drivers for multi-agent microsimulation, so the behavioral composition of the simulated population can be set and checked before any sustainability indicator is computed.
Classic car-following models, such as the Intelligent Driver Model (IDM) [1], describe a driver using several numerical parameters. By assigning different values to these parameters, it is possible to capture driver variability [2,3]. In the Simulation of Urban MObility (SUMO) microsimulator, developed by the German Aerospace Center (DLR), this variation—including drivers’ tendency to speed—allowed for the generation of synthetic data that matched detector measurements in over 90% of cases [4]. Synthesizing an agent population serves a similar purpose. It involves creating an artificial population whose distributions of characteristics correspond to aggregate data [5,6]. However, the term “driver profile” has several meanings. It can refer to relatively stable characteristics measured by the Multidimensional Driving Style Inventory (MDSI) [7] or the Driver Behaviour Questionnaire (DBQ) [8]. It can also describe a driver’s current state as determined from vehicle data [9] or a history of traffic violations. This does not necessarily translate directly into road safety. It may also be associated with additional risk, for example, when vehicles are overloaded [10]. Merino-Vivanco et al. [11] statistically identified six driving style profiles but later grouped them into three categories. The risk-prone profile was associated with a higher likelihood of being involved in an accident. However, the authors did not specify how to translate this into traffic model parameters. Al-Rababah et al. [12] emphasize that behavior depends collectively on the driver, the vehicle, and the environment. Without this distinction, one might attribute driver characteristics to road conditions. The cited studies thus show the need for a precise profile description. However, they do not provide a proven method for translating a label into an agent’s decision in a specific situation. In this article, the five driver types and the continuous risk propensity (Section 3.1) form a working taxonomy that operationalizes dimensions known from driving-style research—careful, reckless, and time-pressured driving [7,8,11]—as inputs to text generation. The personas are therefore not measurements of real drivers; they are textual carriers of specified traits. What we test is whether the text preserves these traits and transmits them to a decision model. This is a prerequisite for behavioral realism, not a proof of it: whether agents equipped with such personas behave like real drivers can only be established by comparing simulated and observed decisions, which is the next stage of the work.
In the transportation studies analyzed, researchers use large language models (LLMs) to interpret results [13], design experiments [14], and tailor interactions to the driver [15]. None of these studies address the generation of driver profiles. Solutions are also being developed in which LLMs directly participate in the decision-making process of the driver-agent [16]. Wang et al. [17] compared thirteen models that utilized driver profiles. These models only partially replicated human decisions and best replicated the behavior of drivers with an aggressive driving style. This indicates the need to verify whether the profile description conveys the intended characteristics. In studies that generate data on mobility and daily behaviors based on profiles [18,19], the focus is on evaluating the consistency of the generated behavior distributions with real-world data [18] or their usefulness in prediction [19], rather than on the persona text itself. Textual agent characteristics are also used in research on generative agents [20] and in simulating human responses [21,22]. The PersonaHub project [23] demonstrated that the selection of personas allows one to influence the diversity of artificially generated data. The fidelity of personas is also examined in role-playing tasks [24]. However, this research primarily focuses on English and mostly cloud-based models. It does not cover profiles created locally based on numerical features in a language with extensive inflection, such as Polish. Consequently, evaluating them becomes even more difficult. Text diversity can be assessed in several ways. The distinct-n [25] and self-bilingual evaluation understudy (Self-BLEU) [26] describe the repetition of words and their sequences. The Measure of Textual Lexical Diversity (MTLD) and the hypergeometric distribution D (HD-D) [27] are used to assess lexical richness and are less sensitive to text length. The Vendi metric [28] accounts for the similarity of elements in a set and determines their effective diversity. Tevet and Berant [29] demonstrated that different metrics react differently to changes in content and the way it is expressed. Jiang et al. [30] described the tendency of language models to generate similar texts. Kirk et al. [31] linked a decline in diversity to fine-tuning via reinforcement learning. Shumailov et al. [32], on the other hand, demonstrated that repeated training on data generated by models degrades the reproduction of the original data distribution. These results justify a separate study of persona diversity. A text can also be evaluated by another language model, referred to as an LLM judge. This approach became widespread following the work of Zheng et al. [33]. The authors demonstrated high agreement between model and human evaluations, but also recurring evaluation errors. Wang et al. [34] showed that without an appropriate procedure, judges are not impartial. We therefore selected judges from outside the group of models generating personas. Before evaluation, the numbers in the texts were masked, and the models’ temperature was set to zero. Their evaluations were compared with those of humans using Krippendorff’s α coefficient [35,36]. The degree of agreement among the humans themselves was also taken into account.
A literature review points to three shortcomings. The first concerns creating personas from specified trait distributions for use in a classical, rule-based microsimulator such as SUMO, where driver behavior is defined by numerical parameters of car-following and lane-changing models rather than by a textual description. The second concerns verifying whether the persona’s text retains these traits. The third is the lack of a common procedure for evaluating fidelity, diversity, linguistic quality, and impact on decisions. Available text evaluation methods provide useful metrics but do not combine these tasks with control trials and comparisons to human evaluations. These shortcomings also apply to the Polish language and to models with 4–15 billion parameters, which can run locally on a single consumer-grade graphics card with 12 GB of memory, without access to cloud services. The aim of this article is therefore deliberately narrow: to generate driver personas from specified trait distributions with local language models and to validate the texts themselves, their fidelity, diversity, linguistic quality, and effect on a decision model, before they are used in a microsimulation. The link to sustainable transportation is therefore indirect but specific. Validated personas make the behavioral composition of a simulated driver population controllable, and this is a prerequisite for assessing whether a transport measure improves efficiency without worsening safety, energy consumption, or emissions across the whole range of drivers rather than for an average driver only. The microsimulation itself, the comparison with real drivers’ decisions, and model fine-tuning are outside the scope of this paper and are left for further work.
2. Problem Description
The long-term goal of our work is a multi-agent traffic microsimulation in which a language model makes drivers’ decisions. This article addresses only the first stage of that goal: creating the persona texts and verifying their usability. SUMO was chosen as the target environment because it is open-source, can be controlled programmatically during a run through its TraCI interface, handles whole-network scenarios, includes emission models, and was used in our previous study [4]. The emission models matter for the intended use. SUMO computes fuel consumption and pollutant emissions from each vehicle’s instantaneous speed and acceleration, so the environmental indicators of a scenario derive from simulated driver behavior—the very behavior the personas are meant to shape. The same applies to safety indicators computed from vehicle trajectories, such as time-to-collision or the number of conflicts. Simulators such as PTV Vissim or CARLA serve different purposes—commercial traffic engineering and three-dimensional perception for automated driving, respectively. The persona method itself does not depend on the simulator: the decision model returns actions that can be passed to any microsimulation through its interface. Each agent’s behavior depends on a short description, called a persona. This description is part of the instruction provided to the model, i.e., the prompt. We generate it from traits randomly selected for a given person. The entire process can be expressed as: features θ → text t → behavior y. This study focused on text generation. We examined how to preserve the specified features, vary the descriptions, and avoid linguistic errors. An additional decision test allowed us to assess whether the personas influence the model’s behavior.
Four requirements were established for the set of personas:
- Fidelity means that the recipient is able to infer the attributes θi from the text ti, even though they are not known beforehand. This also applies to the decision-making model.
- Diversity means that drivers with different attributes receive different descriptions. Texts describing people with the same attributes should not be identical either.
- Quality means a correct and complete text. Errors in the description can make it difficult to predict the model’s decisions.
- Functional validity means that the persona influences decisions in accordance with the driver’s specified characteristics. Only then can the description be used to shape the agent’s behavior.
These four requirements are not independent, and each has a practical meaning for a simulation. Fidelity makes the composition of the agent population controllable: if a cautious driver’s description is read as risky, the share of driver types in the simulation drifts away from the one that was specified. Diversity prevents agents with the same traits from becoming copies of one another, which would synchronize their decisions and reduce the simulated population to a handful of templates. Linguistic quality determines whether the decision model and a human reader interpret the text as intended; errors or missing elements add noise unrelated to the traits. Functional validity is the end-to-end check: it shows whether the traits a judge can read from the text actually move the model’s decisions in the intended direction. Fidelity and diversity tend to pull in opposite directions (H3), and functional validity tells whether judge-measured fidelity translates into behavior. A set of personas with high fidelity but low diversity yields a population of near-identical agents within each cell; a set with high diversity but low fidelity yields a population whose composition is no longer under control. The requirements must therefore be assessed together, which is why the selection rule in Section 3.7 combines them. From the standpoint of sustainability assessment, fidelity and diversity are the two properties that decide whether a scenario represents the intended population. The first secures the specified shares of driver types, and the second prevents agents of the same type from acting in unison, which would exaggerate both the benefits and the harms of a measure.
Before generating personas, an analysis plan was documented, and five hypotheses (H1–H5) were adopted. The plan was established internally, without public registration [37]. The term “pre-registered” here therefore means “documented before data was obtained.”
Hypothesis 1 (H1).
This hypothesis concerns fidelity. It assumes that the text allows for a better assessment of risk than random guessing, even among drivers of the same type. Formally, the conditional mutual information between the specified and the inferred risk levels must be significantly greater than zero for each model.
Hypothesis 2 (H2).
This hypothesis concerns content diversity. At least one local model should match the best models in this respect. However, after abandoning cloud-based generators, there was no external reference point. As discussed below, this hypothesis remained unresolved.
Hypothesis 3 (H3).
This hypothesis concerns the relationship between accuracy and diversity. It assumes that a change in the examined factor improves one of these properties at the expense of the other.
Hypothesis 4 (H4).
This hypothesis concerns linguistic quality. It assumes at least a tenfold difference in error rates between models. The Polish-language model should not be inferior to multilingual models.
Hypothesis 5 (H5).
This hypothesis concerns the influence of the persona on decisions. Drivers with a higher risk propensity should choose risky maneuvers more often (H5a). The difference between extreme driver types should be greater with LLM personas than with a simple descriptive template (H5b).
At this stage, no multi-agent microsimulations controlled by personas were conducted. We also did not compare their behavior with real drivers’ decisions, nor did we fine-tune the models. These tasks were left for further research.
3. Research Method and Mathematical Description
The course of the experiment is shown in Figure 1. First, a synthetic population of drivers and instructions for the models were created. Next, personas were generated and evaluated across the four defined domains. The models’ evaluations were compared with those of humans. Based on this, a statistical analysis was conducted, and conclusions were drawn.
Figure 1.
Experiment diagram showing the synthetic population, prompts, eight local models, and sets of personas.
3.1. Formal Generation Model
We identified five driver types, hereinafter referred to as archetypes. They form the set :
- Cautious—drives defensively and predictably: keeps to the speed limit and a large following distance and waits for a safe gap before merging or overtaking;
- Local Resident—makes short, routine trips on familiar roads, knows the shortcuts and enforcement spots, and drives from memory, without hurry or bravado;
- Professional Driver/Delivery Person—driving is the job: many runs a day, schedule and routine, saving time and fuel, treating traffic as a task;
- In a Hurry—acts under time pressure, chooses the fastest route and reacts nervously to jams and slow drivers, but takes a risk only when it saves time;
- Impulsive/Risk-Taker—enjoys fast driving and risky maneuvers for their own sake: hard acceleration, tight overtakes, irritation at other drivers.
These one-sentence characterizations are consistent with the definitions given to the LLM judges and the human raters; from prompt version v5 onward, similar descriptions were also shown to the generators (Section 4.1).
The agent is described by the feature vector
In Equation (1), denotes risk-taking propensity, and denotes lateness in minutes. The indicator specifies whether the driver uses an app that alerts them to traffic checks. The population was created in two steps. First, an archetype was randomly selected according to , with weights . Next, a risk level was randomly selected according to . A normal distribution truncated to the interval was used. The means for the respective archetypes are 0.15; 0.40; 0.45; 0.60; 0.85. The standard deviations range from 0.10 to 0.15. The set of archetypes, the weights π, and the parameters μa and σa were not estimated from a driver survey or from traffic measurements. They are working assumptions adopted by the authors in an earlier simulation prototype. The types correspond to dimensions described in driving-style research—careful, reckless, and time-pressured driving [7,8,11]—supplemented by two types defined by the trip context rather than by style (a local resident and a professional driver). The weights give a plausible mix for a suburban commuter population, and the means were chosen so that the risk distributions of neighboring types overlap. The overlap is a deliberate feature of the design: it makes the same verbal label appear in several types, which is what allows the texts to be tested for distinguishing risk within a type (Section 3.2). Because every model, language, and prompt version receives the same population, the comparisons between them do not depend on whether this mix matches a real population. For a specific application, however, the weights and the risk distributions must be estimated from empirical data—for example, from questionnaire studies of driving style [7,8,11], from detector measurements of speeding [4], or from naturalistic driving data—and the taxonomy itself should be revised in light of the problems identified in Section 5.4. Truncating the distribution means that only values from the permitted range are sampled. Simply replacing values outside the range with 0 or 1 would create artificial clusters of drivers with identical risk levels. However, no numbers were passed to the prompt. The risk level was converted to one of five verbal labels according to the formula
The number specified in the persona could directly influence the model’s decisions. A verbal label lets us verify whether a feature’s meaning is preserved in the description. The distributions for individual archetypes partially overlap. The same label may therefore appear in several driver types, and a single type may encompass several risk levels. This makes it possible to assess whether the text distinguishes between these levels even within a single type. Agents with the same set of features were classified into a common group, called a conditioning cell. There were 83 such groups in the population . Text generation, taking into account a random element, is described by the formula
In Equation (3), denotes the language model, and denotes the prompt template in the version . The temperature controls the randomness of the generation. The symbol denotes the random seed for a given agent and iteration, hereafter referred to as a replica. All models, languages, and prompt versions use the same population and the same seeds. This is a block design that allows for the comparison of descriptions of the same agents.
3.2. Fidelity
Fidelity was verified by extracting features from the generated text. The extraction tool, referred to as the decoder , is unaware of the specified values: . The first such tool is the LLM judge. It receives definitions of archetypes and risk levels, as well as a single text with masked numbers. At a temperature of zero, it returns the recognized features in a fixed JavaScript Object Notation (JSON) format. The result indicates whether the description is legible to an independent reader. The second tool is the linear probe. It is a simple statistical model that recognizes features based on a numerical representation of the text, i.e., an embedding. Logistic regression and 10-fold cross-validation were used. The probe can also detect repetitive descriptive patterns characteristic of a given generator. Each pool was analyzed separately, with one text per agent. Thus, descriptions of the same person did not appear simultaneously in both the training and test data. The accuracy of archetype recognition was evaluated using accuracy and macro-F1. The latter metric considers the results for all driver types separately. For risk assessment, the quadratically weighted kappa [38] was used. It accounts for how far apart the specified and inferred risk levels are. The intraclass correlation coefficient ICC(1), on the other hand, describes the consistency of the inference across successive replicates. The archetype itself already provides information about the typical risk level. Therefore, we separately checked whether the text distinguishes between drivers belonging to the same type. The normalized conditional mutual information (cNMI) is used for this purpose. We calculated the results for each archetype and averaged them, accounting for group sizes. A plug-in estimator with the Miller–Madow correction was used. The generator receives the label rather than the exact value . The measure therefore pertains to the verbal reading of the risk level:
The reference level was determined as the average of 1000 random permutations of the readings within the archetypes. In small groups, the measure may take on positive values even with a random match [39]. Therefore, the tables and graphs show —that is, the result above the random level—along with the value of the permutation test. H1 was evaluated on this basis.
3.3. Diversity Metrics
Vocabulary diversity was assessed using MTLD and HD-D [27], distinct-2 [25], and Self-BLEU-4 [26]. Before calculations, words were reduced to their base forms. For Polish, the Morfeusz 2 morphological analyzer and generator [40] (http://morfeusz.sgjp.pl, accessed on 2 November 2026) was used, and for English, spaCy (https://spacy.io, accessed on 2 November 2026). This ensures that variants of the same word are not treated as separate words. The repetition of descriptive patterns was assessed based on the most frequent sequence of four words, i.e., the 4-g:
The symbol denotes the number of texts containing the 4-g . A value of 0.52 for the indicates that the same four-word phrase appears in 52% of the personas. This could be a phrase copied from the instructions or a formulation repeated by the model itself. To distinguish between these situations, we introduced an additional measure of prompt echo, E4, defined by Equation (6). The prompt echo is the proportion of texts that contain at least one 4-g from the instructions . The index, on the other hand, describes the repeatability after excluding such phrases. Additionally, the normalized entropy of openings was calculated. It shows how much the beginnings of descriptions differ, considering the first three words.
In addition to vocabulary, the diversity of meanings in the texts was also assessed. The e5-large model [41] converts each description into a numerical vector. However, such vectors can be excessively similar even when the content differs. In the study, the raw similarity ranged from 0.85 to 0.95. To mitigate this effect, known as anisotropy, the average reference vector for a given language was subtracted, and the results were re-normalized in accordance with the first step of the procedure [42]. Based on this, the Vendi score (VS) [28] was calculated:
In Equation (7), denote the eigenvalues of the Gram matrix, which describes the similarities between text vectors. The result expresses the effective number of distinct personas under the chosen similarity measurement method. It depends on the e5-large model, vector centering, and the linear kernel. It should not be equated with the number of driver types. Next, the differences between the descriptions were divided into two parts. The first concerns groups with different characteristics. The second concerns descriptions of individuals with the same characteristics. The mean vector of the entire pool is denoted by , the mean vectors of the groups by , and their sizes by . The corresponding scatter matrices are , , and . The following relationship holds: . The metric compares the differences between groups with the differences within groups. It thus shows the extent to which the descriptions distinguish drivers with different characteristics. The measure quantifies the diversity of descriptions for individuals with the same characteristics. In turn, indicates what proportion of the variability in the descriptions is explained by the given characteristics. It takes into account a correction depending on the number of groups: .
3.4. Quality
First, we checked whether the texts met the instructions’ requirements. Completeness refers to the proportion of descriptions completed by the model rather than interrupted by the token limit. The indicator measures the occurrence of numbers that were prohibited from being included. We also examined how often the model explicitly names a trait or archetype. As an auxiliary measure, we calculated the proportion of word forms the morphological analyzer did not recognize.
A judge evaluates linguistic quality based on four criteria on a scale of 1–5. These are:
- Q1 grammatical correctness;
- Q2 naturalness;
- Q3 coherence;
- Q4 closure.
The judge also points out errors and marks two evaluation flags. The main quality indicator, , is the average of the first three scores. Q4 was omitted because the human raters almost always gave the highest scores for this criterion. The proportion of texts with at least one error was calculated separately:
This metric counts texts containing an error, not the number of errors. It is easier to find at least one error in a longer description. Therefore, text length was taken into account when comparing prompt versions. Logistic regression was applied, and the odds ratio of an error occurring was reported after accounting for this difference.
3.5. Functional Validity
The decision test examined whether the persona influences overtaking behavior in accordance with the specified risk propensity. Overtaking was chosen because it links the two sides of the trade-off that sustainability assessment has to capture. It shortens travel time, but it exposes the driver to head-on conflicts and requires strong acceleration, which raises fuel consumption and emissions. The decision model was not part of the generator group. It received only the persona text and the situation description . A total of scenarios were prepared. They differed in speed limit, the preceding vehicle’s speed, and the distance to the oncoming vehicle. An empty lane, weather conditions, and a speed trap warning were also taken into account. The response took the form of for the agent , the scenario , and the replicate . The proportion of overtaking decisions and their relationship to the specified risk propensity were described by the following formulas:
We determined the confidence interval using the bootstrap method by randomly sampling whole agents. Five types of input data were compared. The first consisted of LLM personas. The second consisted of the same texts randomly swapped among agents so that no one received their own description. This control trial should yield . The third variant contained a single sentence with a verbal risk label, and the fourth a template with an exact numerical value . The numerical template provides more detail but does not set a mathematical upper bound on the result. In the fifth variant, the model was not given a persona. This allowed us to determine its basic response to each situation. We also examined whether the proportion of overtaking decisions increases across successive archetypes ordered according to . The Jonckheere–Terpstra test [43] was applied. The difference between the extreme types was described as , and its confidence interval was provided. Additionally, a generalized linear model (GLM) with a binomial distribution was applied:
The model accounts for the separate effects of the scenarios . Standard errors were calculated taking into account that successive decisions by the same agent are correlated. The odds ratio of overtaking was reported for an increase of on the scale . Different sources of personas were compared for the same agents. Results were considered practically equivalent in terms of rank correlation if the entire interval for the difference fell within the range . This auxiliary criterion was not specified prior to data collection. Furthermore, a similar correlation does not imply identical decisions. Therefore, responses in individual scenarios were compared separately.
3.6. Statistical Methods and Calibration of Judges
The uncertainty of measures based on tokens, shares, and fidelity measures was determined using the block bootstrap method (). We sampled agents repeatedly with replacement, meaning the same person could be selected more than once. A random replica of the text was selected for each agent. Confidence intervals were calculated using the bias correction (BC) [44]. Repeatability measures require a different approach. This applies to , , , and distinct-n. Relying on the same text again would artificially increase the repeatability of its words and phrases. Therefore, in these calculations, each agent appeared exactly once, and only a replica of the text was selected. This is not an agent-based bootstrap. The BC-corrected interval, calculated relative to the mean of the replicates, describes the variability of the texts for a fixed population of 300 people. It does not account for uncertainty in the population selection itself. The two types of intervals are distinguished in the tables. The same randomizations were applied to all pools so that the uncertainty in the differences between models could also be determined.
LLM judge ratings require verification, just like the results of any other measurement tool. The reference point was the ratings of two human raters. They worked independently and without consultation, in batches of no more than 20 texts, because they needed to focus on texts that often differed only slightly from one another. In Part A, both human raters read features from a shared sample of 150 Polish texts. They received the same definitions as the LLM judges, and the descriptions’ numbers were masked. Part B concerned linguistic quality. It comprised 150 texts, evaluated according to criteria Q1–Q4 and flags. There were 75 pairs of descriptions by the same individuals, prepared from two versions of the prompt. The order of the texts was randomized, and the human raters did not know their assignment to pairs. Agreement between ratings was measured using Krippendorff’s α coefficient [35,36]. The method for calculating differences was adapted to the data type. Archetypes were treated as distinct categories, while risk levels and ratings 1–5 were treated as ordered values. An interval scale was adopted for QI. In Part A, the judge had to achieve a compared to each human rater separately. The two human raters’ ratings were not combined into a single overall rating. In Part B, the ratings of both human raters were first compared. The α coefficient was low, ranging from −0.02 to 0.58, although 89–99% of the ratings differed by no more than one point. This was due to the frequent assignment of high scores and variations in the human raters’ strictness. Therefore, before the model evaluated the full pools, a relative criterion was adopted: . The judge should be nearly as consistent with the average of the human ratings as the human raters were consistent with one another. The term “consensus” here refers to the average of the ratings given by both human raters.
3.7. Definition of the Model Selection Rule
The rules for model selection were defined before the data was generated. First, the eligibility conditions are checked: completeness , the presence of numbers , the proportion of substitute descriptions used in case of failure , the absence of identical texts, and the limit on repetition . Next, the models are compared according to four criteria , where denotes cost. Greater accuracy and diversity, along with lower error rates and costs, are desirable. A model is rejected if another model is at least as good in every respect and better in at least one. The remaining models form the Pareto front. The dominance condition takes the form:
In the final step, a Borda ranking is created. Each model is assigned a rank for each criterion. The ranks are converted into points and summed using the specified weights:
First, equal weights were applied, followed by 1000 sets of weights randomly selected according to . This demonstrates how a model’s ranking changes when different weights are assigned to individual criteria. Cost was defined as the wall-clock time required to generate a single persona on a single graphics processing unit (GPU), an NVIDIA GeForce RTX 4070 (Gigabyte WINDFORCE, 12 GB GDDR6X, TGP 200 W; Gigabyte Technology Co., Ltd., New Taipei City, Taiwan; full configuration in Section 4.2). Local generation does not incur model invocation fees. The original rule was applied without modification. Additionally, we examined how the result depends on three decisions: replacing the condition for with the condition for , omitting the repetition constraint, and using random weights instead of equal ones. These additional analyses were performed after the data was obtained and are presented separately.
4. Experiment Procedure
4.1. Study Organization and Prompt Preparation
The study was divided into six phases. First, the project files, the population, and the analysis plan were prepared. Next, personas were generated, and their completeness, vocabulary, and content diversity were verified. Subsequent tasks included judges’ and human raters’ reviews of features, followed by an assessment of linguistic quality. Prompt versions were also compared, and a decision test was conducted. Finally, the results were analyzed, and a model selection rule was applied. We recorded any problems encountered, along with their causes and solutions, in a log. All values in the tables and figures were computed by the authors’ own Python 3.13 analysis scripts (data processing, bootstrap resampling, statistical tests, and plotting) and were not entered manually; every figure is stored together with the data file from which it was drawn. The scripts, configuration files, prompts, and intermediate results are available from the authors on request (see Data Availability Statement). The division of tasks is shown in Figure 2. The columns represent the contributors, and the rows represent the successive stages of work. Local models generated personas. Cloud-based models read features, assessed quality, and made decisions in test scenarios. People designed the study, provided reference evaluations, managed the budget, and interpreted the results. Each of these roles was necessary. Human evaluations let us verify the judges’ reliability. The judges then made it possible to assess 41,400 texts, far exceeding what two people could handle. A human-evaluated sample of just 300 texts would not have been sufficient to compare all models and instruction versions.
Figure 2.
Task distribution among humans, local models, and large cloud models, as well as data flow.
The population of agents was sampled once, with a seed of 42. The same file was used for all models, languages, replicas, and prompt versions. The base v2 prompt consists of a system instruction and a user message. The instruction defines the model’s role, requires 2–3 sentences in the second person, and prohibits the use of numbers. The user prompt contains an archetype, a verbal risk level, a delay, and information about the application. The model should represent these characteristics through a person’s personality, habits, or situation rather than listing them explicitly. Version v2 replicates the instruction from earlier preliminary studies. The first phase thus allows us to replicate and verify that experiment. Five subsequent versions of the instructions were prepared. Version v3 discourages repeating the same descriptive patterns, and v4 removes example phrases. Version v5 adds a randomly selected occupation, age, and destination, as well as a description of behavior typical of the archetype. Version v5.1 removes words associated with risk and haste from the archetype description. It also introduces a 70-word limit. Version v5.2 assigns equal weight to both situations: the driver is either running late or not running late. Versions v5 and v5.1 each change two elements, so it is not possible to assess the impact of each change separately. We prepared all instructions in both languages and recorded them with the change history.
4.2. Models and Scope of Computations
The personas were generated by eight open-source models with 4–15 billion parameters. They were run locally via Ollama 0.40.13 on a workstation with an NVIDIA GeForce RTX 4070 graphics card (Gigabyte WINDFORCE, 12 GB GDDR6X, TGP 200 W), an Intel Core i7-14700K CPU (Intel Corporation, Santa Clara, CA, USA), 32 GB of RAM, and Windows 11 (Microsoft Corporation, Redmond, WA, USA). All models were used in 4- or 5-bit quantized form (Table 1) and fit entirely in the GPU memory, so the CPU did not take part in inference; the “GPU usage” column in Table 1 reports the fraction of model layers resident in GPU memory (1.00 = the whole model). With four concurrent requests and a 2048-token context, the GPU was the only bottleneck; a faster CPU would matter only for models exceeding the GPU memory. The set included Gemma 3 [45], Qwen 3 [46], Phi-4 [47], Llama 3 and 3.1 [48], and Mistral NeMo [49]. The Polish-language model Bielik 11B v3 [50,51] was also included. All models operated under the same server settings. A temperature of 0.7, a token limit of 600, and replicas per agent were used. In the first phase, 14,400 texts were generated, and another 27,000 were generated in the prompt comparison phase. Generation took approximately 4.2 and 15 GPU-hours, respectively. The speed ranged from 0.35 to 1.7 personas per second. We assessed the time cost based on these results.
Table 1.
Local models and generation speed of Polish personas for the v2 and prompts. GPU usage—fraction of model layers resident in GPU memory (1.00 = entire model); toks/s—output tokens per second of a single request at four concurrent requests; s/person—wall-clock time per completed persona at the same concurrency.
Three cloud-based models from different families, outside the generator group, extracted features from the texts. The following designations were used:
- A: openai/gpt-5.6-luna;
- B: anthropic/claude-haiku-4.5;
- C: deepseek/deepseek-v4-flash-0731.
The names given are identifiers of the OpenRouter service (https://openrouter.ai, accessed on 6 November 2026) for the September 2026 versions. The models were invoked via the application programming interface (API) at a temperature of zero. Each model evaluated all 14,400 texts from the first phase. Model A’s results were closest to the ratings of the more accurate of the two human raters. Therefore, it was also used to evaluate 27,000 texts from subsequent versions of the prompt. The same model evaluated the quality of all 41,400 descriptions according to separate criteria. Model A was also used in the decision test, this time at a temperature of 0.7. It replaced the previously planned Gemma 3 12B, which generated personas on its own. The analysis plan recorded this change before the test began. In total, over 200,000 paid calls to cloud models were made, and approximately 96 million tokens were processed. Each full run was preceded by a small trial, a cost estimate, and approval to use the budget. The number of tokens and fees were recorded in the cost log. Expenses were covered by the project budget. However, the greatest cost remained the team’s time.
Generative AI was used in this study in two ways. First, generative language models are the object of the study: the eight local models listed in Table 1 generated the personas, the cloud models A–C extracted features from the texts, and model A also rated their linguistic quality and made the decisions in the overtaking test (Section 3.2, Section 3.3, Section 3.4 and Section 3.5). The model versions, prompts, and settings are given in Section 4.1 and Section 4.2. Second, DeepL Write (DeepL SE, Cologne, Germany; https://www.deepl.com/write, accessed on 6 November 2026) was used for language editing and proofreading of the manuscript. The authors reviewed all suggested changes.
4.3. Human Evaluation
Each of the two human raters participated in two rounds of 150 texts each. In Part A, the raters read driver attributes. The texts were presented in random order, with the numbers masked. The raters used the same definitions as the LLM judges. The assigned attribute values were stored separately and were not disclosed during the evaluation. In Part B, the quality of 75 pairs of descriptions of the same individuals was evaluated. The texts came from versions v2 and v5.2 of the three models. The raters did not know which descriptions formed a pair. They used criteria Q1–Q4 and two flags. Both rounds took longer than anticipated. Evaluating 150 short descriptions against several criteria proved exhausting and time-consuming. The estimate of one minute per text was too optimistic. Clear instructions and dividing the material into small batches helped. No further rounds were planned after Part B. The collected evaluations were used to validate the judges, who then evaluated the full datasets. The human evaluations thus served as a benchmark for the large-scale evaluation. Figure 2 highlights the points at which people provided these evaluations and made decisions. Each stage of the cloud computing process required a prior human decision.
4.4. Schedule and Changes in the Study’s Course
The main computations were performed from 5 to 18 September 2026. The schedule is shown in Figure 3. The top panel shows the daily number of judge calls, while the bottom panel shows the stages of human work as well as local and cloud computations. The first week was dominated by fidelity assessment. Comparing prompts took up the second part of the study. Quality assessment and decision testing were conducted during a single day of intensive computations. Humans evaluated the texts on 7 and 17 September, before running the respective models on the full datasets. We therefore established the criterion for a model’s usefulness before this evaluation.
Figure 3.
Schedule and scale of computations.
During the study, five elements of the original plan were modified. After the first phase, the focus shifted from systematically measuring temperature to comparing prompts, as copying instructions and repeating patterns proved more significant. Cloud-based generators were also abandoned. After comparing human evaluations, a relative criterion of usefulness was adopted for the quality judge. A preliminary decision test showed that without a persona, the model almost never chose to pass. Therefore, four scenarios favoring this maneuver were added. Furthermore, instead of Cohen’s d, we used the difference in proportions with a confidence interval. Preliminary tests also revealed excessive similarity in text vectors and incomplete reproducibility of the cloud model’s decisions despite the same seed. Therefore, the vectors were corrected, and decision variability was assessed using replicates and bootstrapping.
5. Results
5.1. Models, Throughput, and Quality
The models, the method of reducing the precision of their parameters (i.e., quantization), and the generation speed are summarized in Table 1, which presents the averages from 3 replicates. Local generation did not incur any call charges. Calls to judges and the decision model incurred charges. All 48 batches of the first phase were complete. Each contained 300 texts, without alternative descriptions. Only one of the 14,400 texts contained an invalid number. Thus, all models met the basic conditions for completeness and instruction compliance. The descriptions averaged between 34 and 90 words, depending on the model. The time to generate a single persona ranged from 0.58 to 2.88 s. Both differences are significant: longer texts are easier to find errors in, and longer processing times increase computational cost. The “toks/s” and “s/person” columns describe different metrics. The first refers to the speed of a single request with four parallel requests. The second indicates the actual time per completed description at the same level of parallelism. Parallel processing resulted in approximately a twofold speedup. Actual generation time was used to assess the computational cost.
The models differed in how closely they followed additional guidelines. Bielik stated the trait directly in about one-third of the Polish texts and half of the English ones. In half of the English descriptions, it also named the archetype. Gemma 3 12B did not do this in any text. The good readability of Bielik’s features must therefore be partly attributed to its direct naming of them, despite the prohibition in the instructions. The Polish language quality differed significantly. According to a judge verified against human evaluations (Section 5.2), the QI index ranged from 2.94 for Phi-4 to 4.92 for Bielik. The proportion of texts containing the error was approximately 69% for Phi-4. In Bielik’s case, errors were found in only 2 out of 900 texts. This more than 100-fold difference confirms H4. However, it reflects the frequency of texts containing errors. It does not mean that one model writes several hundred times better than the other. A similar ranking of models was obtained by examining the proportion of word forms not recognized by the analyzer. However, the judge also pointed out errors that this evaluation method failed to detect. These included, for example, misused words, such as the Polish phrase “lusterka retro” (instead of “lusterka wsteczne,” i.e., rearview mirrors), calques, and syntactic errors. Bielik achieved a better result than all multilingual models. Next was Gemma 3 12B, with a QI of 4.67 and a proportion of erroneous texts of 0.094. In the descriptions of the Llama, Mistral, and Phi-4 models, errors occurred much more frequently: in half to about two-thirds of the texts. In English, all models achieved nearly the highest QI scores, and the proportion of texts containing errors was low (). However, for this language, the judge’s assessment was not compared with human evaluations. Consequently, the quality assessment provides almost no differentiation among the English models. Good linguistic quality does not necessarily imply high fidelity or great diversity. The correlations between QI and and the Vendi metric were weak. With only eight models, these correlations can be treated merely as descriptive. A good example is Phi-4, which performs the worst in Polish but ranks second in terms of feature extraction.
5.2. Fidelity and Calibration Based on Human Assessments
All eight models retain information about the specified features in the text (Table 2). This also applies to differences in risk levels among drivers of the same type. Each model’s result was significantly better than random (), which confirms H1. Bielik retained the most of this information, while Llama 3.1 retained the least. The three judges rated the models similarly; their agreement ranged from 0.92 to 0.97. The results were also reproducible across replicates. The linear probe was slightly less effective at assessing the level of risk, as indicated by lower values . At times, however, it was better at recognizing the archetype. For Gemma 3 12B, it correctly identified the archetype in 89% of texts, compared with 61% for the judge. This is because the two tools assess slightly different characteristics. A simple statistical model can learn the repetitive phrasing of a given generator. The LLM judge assesses whether the characteristics are understandable to a reader who has not been trained on these texts. Recognizing the driver type was more difficult than assessing the risk level. The errors were not random. “In a hurry” was sometimes interpreted as “Risk-taker.” Gemma often attributed the haste to the driver’s profession, leading both types to be classified as “Professional driver.” In the 19 disputed descriptions, all judges selected the same answer, which differed from the specified trait. The human raters agreed with them in 84% of cases. This points to a problem with the descriptions’ content and the adopted driver classification, rather than solely with the assessment tool itself.
Table 2.
Fidelity assessment for the Polish language.
A comparison of the ratings given by the human raters and judges is shown in Figure 4 and Figure 5, which present Judge A’s trait ratings, the ICC(1) across replicates, agreement with the other judges, and the results of the linear probe. The averages across 3 replicates are provided. The graph shows the Krippendorff α coefficient, and the line indicates the adopted threshold of 0.67. Part A concerns trait interpretation, and Part B concerns text quality. The human raters were fairly consistent in identifying the archetype and risk level, although one rater interpreted the traits significantly more accurately. For risk, they achieved values of 0.73 and 0.88, respectively. Judge A achieved a value of 0.89, a result close to that of the more accurate rater. It was the only one who also agreed with both human raters on the archetype. Therefore, it was used in the subsequent comparison of prompts and the decision test. When assessing linguistic quality, the human raters most often differed by no more than one point. This applied to 89–99% of the ratings, depending on the criterion. Nevertheless, the statistical agreement among the ratings was low. Most texts received high scores, and one rater was stricter than the other. With such concentrated results, even small differences lower the agreement coefficient. The quality judge was at least as consistent with the average of both human raters’ scores as the raters were with each other. It reproduced the models’ ranking and detected errors also pointed out in the human raters’ comments. However, it evaluated more strictly and exaggerated small differences. Its results are therefore useful for comparing models. However, one should not treat every score as an exact, absolute measure of quality.
Figure 4.
Judge calibration based on human ratings, Part A (fidelity): Krippendorff’s α for the archetype and the risk level (n = 150 texts). The dashed line marks the adopted threshold of 0.67.
Figure 5.
Judge calibration based on human ratings, Part B (quality): Krippendorff’s α for criteria Q1–Q3 and the quality index QI (n = 150 texts). The dashed line marks the 0.67 level.
The archetype’s accuracy differentiates models more strongly than risk: Bielik and Llama 3 achieve 0.90–0.92, while Gemma 3 12B achieves only 0.61. The confusion matrices for the four models (Figure 6 and Figure 7) show that errors are not random but are distributed along the axes of risk and haste: “In a Hurry” is sometimes interpreted as “Risk-taker” (Bielik 24%, Phi-4 27%), and in Gemma’s model, “In a Hurry” and “Risk-taker” are mostly classified as “Professional driver”—the model attributes haste to a profession, and the judge selects the professional category. The same property is evident in human evaluation: in 19 disputed texts where the judges were unanimous but incorrect, the human raters agreed with the judges in 84% of cases, rather than with the assigned trait. The judge–truth discrepancy is therefore a property of the persona and taxonomy, not an error on the part of the judge.
Figure 6.
Archetype confusion matrices (Polish, Judge A): bielik-11b-v3 and gemma3-12b.
Figure 7.
Archetype confusion matrices (Polish, Judge A): phi4-14b and llama3.1-8b.
5.3. Diversity
In terms of lexical richness, Phi-4, Gemma 3 12B, and Bielik performed best. However, repeating the same phrases proved more significant. Figure 8 and Figure 9 compare overall repetition , prompt echo , and repetition after removing this echo . The line indicates the 0.15 threshold used to select the model. In the English texts, the metric was significantly higher than in the Polish texts. Much of this difference stemmed from the instructions. They contained examples such as “You have a habit of…,” which the models copied in 57–98% of the descriptions. The Polish equivalent was shorter, and word variation further reduced the number of identical four-word sequences. The allows us to distinguish between copying the instructions and the model’s own patterns. After omitting the phrases from the prompt, the English texts became significantly less repetitive. In Polish, Bielik remained the most formulaic, with a of 0.52. The phrase “You are a driver who always…” appeared in 155 out of 300 descriptions. The alone, without identifying the source of the repetitions, is therefore insufficient for comparing languages and instructions.
Figure 8.
Template-like nature and echo of the prompt for individual models and languages: (left) 4-g concentration TC4; (right) share of texts with prompt echo E4. The dashed line marks the 0.15 threshold. Arrows (↓) indicate that lower values are better.
Figure 9.
Template-like nature after excluding the prompt echo (TC4−) for individual models and languages. The dashed line marks the 0.15 threshold. The arrow (↓) indicates that lower values are better.
In terms of text semantic diversity, Bielik scored the lowest (Vendi), while Llama 3.1 scored the highest. The values were approximately 49 and 79, respectively, for a pool of 300 individuals. These are not the number of driver types. They describe the diversity under a specific text representation model and similarity calculation method. Bielik clearly distinguished between descriptions of drivers with different characteristics, as confirmed by the metric. At the same time, it showed the least differentiation among individuals with the same characteristics, as assessed by . Llama 3.1 generated more diverse texts, but a significant portion of the differences did not stem from the specified characteristics. These could include both random details and content outside the accepted driver description. Vendi’s greater diversity was usually accompanied by lower accuracy in risk assessment . This relationship is shown in Figure 10 and Figure 11, where comes from Judge A’s evaluations, and the segments at the points represent variability across replicates. The rank correlation was ρ = −0.64. For the one-tailed test, was 0.05, and for the two-tailed test, 0.10. The result aligns with H3, but comparing eight models is insufficient to treat this relationship as a general rule. In English, the relationship was significantly weaker. This is because repeating phrases from the instructions made the models’ texts more similar.
Figure 10.
Relationship between fidelity and diversity for individual models: Polish texts (Spearman’s ρ = −0.64). Arrows (↑) indicate that higher values are better.
Figure 11.
Relationship between fidelity and diversity for individual models: English texts (Spearman’s ρ = −0.10). Arrows (↑) indicate that higher values are better.
The decision not to use cloud-based generators made it impossible to test H2. There was no external reference point for the local models. Their differences in terms of Vendi were therefore presented descriptively.
5.4. Comparison of Prompt Versions
A comparison of six prompt versions for the three models is shown in Figure 12 and Figure 13. The analysis considered archetype recognition, risk assessment within a type, Vendi diversity, and QI quality. Instruction changes typically improved the selected property but revealed other limitations. Version v3, with an additional request to avoid clichés, increased diversity by 30–90%. For Bielik, the repeatability of decreased from 0.52 to 0.27. At the same time, the archetype became harder to identify. The prompt to specify a profession led to more frequent identification of “Professional Driver.” “Local resident,” on the other hand, lost its clear distinguishing features. This is because it describes a connection to a place rather than a driving style.
Figure 12.
Comparison of prompt versions from v2 to v5.2 for three models in Polish: (left) archetype accuracy; (right) within-type risk cNMI+ (Judge A).
Figure 13.
Comparison of prompt versions from v2 to v5.2 for three models in Polish: (left) Vendi diversity; (right) quality index QI.
Removing the example phrases in v4 eliminated the echo of the English prompt without compromising the other results. This was the only beneficial change without a clear trade-off in another area. However, it did not eliminate all repetitions. Bielik continued to use the same profession in nearly half of the English descriptions. This pattern was detected only by and analysis of the text’s first words. Version v5, with additional context about the person, facilitated archetype recognition and reduced the repetition of a single profile. At the same time, the risk score within the type, as measured by cNMI+, deteriorated by half. The likely cause was the risk-related words contained in the archetype description. The model produced a level typical of the category rather than one specific to a particular person. Since two elements were changed at once, the result cannot be attributed solely to this cause.
Version v5.1 removed these words and limited the description to 70 words. The risk score for Bielik and Phi-4 improved, and the archetype was recognized in 94–98% of cases. However, the risk accuracy of version v2 was not restored. Version v5.2 made it easier to recognize tardiness but made it more difficult to identify the “In a Hurry” type in people who were not late. The percentage of correctly identified individuals of this type dropped from 97% to 57%. This demonstrates the overlap between a driver’s type and their current state. Gemma 3 12B was particularly sensitive to changes in category descriptions. In no subsequent version did it regain the cNMI+ result from v2.
No single prompt version was the best across all evaluations. Version v5 allowed for a better balance between diversity and archetype recognition than v2. However, it performed worse when combining diversity with risk level assessment . Changing the prompt thus shifted the balance between these requirements but did not resolve the conflict. According to the judge, Polish quality deteriorated in all versions after v2. With Phi-4, the difference disappeared when text length was taken into account. With Gemma, one problem was incorrect declension, as in the Polish phrase “piętnastoma minut.” Versions v5 and v5.1 also changed the length of the descriptions. The comparison therefore applies to the instructions as a whole, rather than the impact of a single isolated factor. Three issues were identified in the categorization of drivers. “Local resident” does not have a clearly defined driving style. The “In a hurry” type overlaps semantically with the “running late” state. The archetype description may also impose a trait that should be specified separately for each person. Simply correcting the instructions does not solve these problems. Modifications were completed in v5.2.
5.5. Functional Validity and Behavioral Test
The test covered 86,760 overtaking decisions. Eight persona sources were compared for 300 agents, 12 scenarios, and three replicates. Additionally, 360 decisions without a persona were included. Without a driver description, the model almost always behaved the same way in a given situation. It did not overtake when an oncoming vehicle was 200–400 m away. With an empty lane or a large gap, it overtook every time. The persona modified these extreme reactions in both directions. It differentiated between agents, though it did not change the overall passing frequency. The results confirm H5a. Details are summarized in Table 3. A comparison of personas, templates, and texts shuffled among agents is shown in Figure 14. The correlation between the specified risk propensity and the frequency of passing was approximately 0.90 for all three generators. The increase in frequency also corresponded to the order of archetypes according to . Cautious drivers overtook in 3–5% of cases, while risk-takers did so in 88–92% of cases. A trend test confirmed this relationship ( = 0.001). This correlation measures the internal consistency between the specified trait and the decision model’s responses to the same twelve scenarios. It is not evidence that the agents behave like real drivers: the responses were generated by a language model, not recorded from people, and no empirical decision data were used in this study.
Table 3.
Assessment of functional validity for the Polish language and individual persona sources. All LLM personas from prompt v2. OR—odds ratio; JT—Jonckheere–Terpstra trend test; CI—95% confidence interval; R−O gap—difference between the Risk-Taker and Cautious archetypes.
Figure 14.
Proportion of “I overtake” decisions for archetypes ordered according to . Grey dashed lines show the shuffled controls for Bielik 11B v3, Gemma 3 12B, and Phi-4 14B.
The “Local Resident” and “Professional Driver” types were exceptions to this consistent increase. In Gemma and Phi-4, both had nearly the same passing frequency. However, the GLM statistical model confirmed a strong association between the decision and the parameter : an increase of 0.1 was associated with more than three times the likelihood of passing. The relationship with was also present within the middle archetypes. The model thus detected differences between individuals of the same type, indirectly conveyed by the label . After randomly swapping texts between agents, the correlation dropped to a value close to zero, and its confidence intervals included zero. The distinct differences between archetypes also disappeared. The influence of the persona thus stemmed from the fit of the description to the agent, rather than from the mere addition of text.
H5b was not confirmed. The most appropriate reference for the persona is a one-sentence template with a verbal risk label. Neither variant contains an exact numerical value. The correlation differences were small, and all confidence intervals fell within the accepted range of ±0.05. The difference in overtaking frequency between risk-takers and cautious drivers was also similar: 0.85–0.87 for personas and 0.85 for the template. Thus, personas and a single labeled sentence are equally effective at ranking agents according to their propensity to pass. This does not imply identical decisions in every situation. Nor does it prove that all risk information is retained. Rank correlation does not measure the amount of information, and the generator receives only the label . The numerical template yielded a slightly higher correlation than the personas. The difference was significant for Bielik and Phi-4, but not for Gemma. However, the personas distinguished between extreme driver types more clearly. The numerical scale thus allowed for a smoother gradation of decisions, while the textual description more clearly contrasted a cautious driver with a risk-taker.
The persona also influenced how drivers responded to road conditions. A driver described as cautious often refrained from passing even when the lane was empty and the pavement was dry. He chose this maneuver in about one-third to one-half of cases. For the template, this figure was 96%, and without the persona, it was 100%. In contrast, the risk-taking persona encouraged overtaking even when an oncoming vehicle was 200–400 m away. The text thus more strongly linked decisions to the described driver personality. However, different versions of the text for the same person reduced consistency. For a single replica, the correlation was approximately 0.85–0.87, not the approximately 0.90 obtained when replicas were combined. Similarly, the consistency in the proportion of overtaking between replicas was lower for personas than for the template. The main conclusion held up after separately testing the original eight scenarios and the boundary scenarios. The personas continued to show a strong association with risk, while the shuffled texts yielded a result close to zero.
5.6. Model Selection Rule
The model selection rule was applied as defined prior to data analysis. The results are shown in Figure 15. The color of each point indicates the proportion of texts containing the error , and the size of the point indicates the generation time. The line represents the Pareto front for the two axes of the graph. The symbols ★ and ● indicate models belonging to the four-criteria front, with and without the repeatability condition, respectively. The condition was decisive for a model’s inclusion. For Polish, only both Gemma models and Llama 3 met this condition. Bielik was excluded despite having the highest fidelity and linguistic correctness because it achieved a of 0.52. In English, no model met this condition. Among the eligible Polish models on the Pareto front, both Gemma models remained. With equal weights, Gemma 3 4B ranked higher. It was favored by its lower cost and greater diversity. With random weights, it won in 65% of cases, while Gemma 3 12B won in 35%.
Figure 15.
Pareto front for the Polish language in the Vendi × cNMI+ risk framework. Arrows (↑) indicate that higher values are better.
After disregarding the repeatability condition, seven out of eight models remained on the front. The front, therefore, did little to narrow the selection. Most often, either Gemma 3 4B or Bielik came out on top. Bielik ranked first when fidelity and quality mattered most. When diversity and cost were weighted more heavily, it fell to the bottom of the ranking. Gemma 3 12B is usually ranked in the middle. In English texts, the error rate () showed almost no difference between the models. After disregarding the reproducibility condition, the ranking thus depended mainly on diversity and cost. Mistral NeMo ranked highest, even though 63% of its texts contained prompt echoes. This is not a recommendation for this model. The result shows that poorly chosen criteria can lead to undesirable choices.
6. Discussion
What limits the usefulness of the generated personas? Text fluency and completeness are not sufficient for evaluation. The models copied examples from the instructions, and after these were removed, they created their own, equally repetitive patterns. Furthermore, the archetype description could obscure individual risk levels, reducing the ability to discern differences within a type by up to half. The results support differentiating a person’s context and examining traits even within a single category. The classification of drivers itself requires unambiguous definitions. A driver’s type should not overlap semantically with their current state nor impose traits that are selected separately. In classical population synthesis [4,5], this problem does not apply to language, since traits are represented numerically.
Is it possible to combine descriptive fidelity with diversity? In the dataset under study, greater diversity was typically accompanied by lower fidelity. The correlation between Vendi and was −0.64, with a one-tailed of 0.05. The direction of the relationship corresponds to H3, but comparing eight models does not let us treat it as a general rule. This result is consistent with the problem of reconciling population diversity with individual fidelity [19] and with research on the convergence of LLM texts [28,30]. Prompt changes also improved one property at the expense of another. Version v2 favored preserving features, while v4 favored diversity. Version v5.1 improved risk assessment compared to v5 while maintaining high archetype readability. The choice of instructions should therefore depend on the intended use.
What does the persona contribute to the agent’s decision? The elaborate description did not rank agents by overtaking frequency better than a single sentence with a verbal risk label. However, a similar correlation in ranks does not imply identical decisions or the retention of all information, especially since the generator received only the label . The persona linked decisions more strongly to the driver’s personality, sometimes limiting the response to favorable road conditions. This may vary across driving styles but requires comparison with human behavior. Such data can be obtained from studies using a high-end driving simulator, in which driver behavior is recorded in repeatable scenarios and evaluated using an objective model [52]. Survey studies of risk perception among professional drivers [53] show that the perceived danger of a road situation depends on experience and crash history; such data could ground the “Professional Driver” archetype and provide a reference for the realism of its decisions. In our taxonomy, the “Professional Driver” type is defined by routine and schedule rather than by risk; empirical studies of this group [53] suggest that its risk perception is shaped by experience, which a future version of the archetype description could reflect. The flexibility of the description also reduced reproducibility: the correlation was approximately 0.85 for a single persona per agent and approximately 0.90 after combining replicates. The rationale for using personas should therefore be sought in the way behavior is shaped, not in their superiority over a simple label.
How reliable are the LLM judge’s assessments? Ratings by two human raters allowed us to verify the judges and then extend the analysis to 41,400 descriptions. However, reviewing 300 texts was the most labor-intensive part of the study. The quality judge rated more strictly than humans and amplified minor differences. Its results are therefore useful primarily for comparing models, and the calibration applies exclusively to the Polish language. The required consistency should be based on human consistency and established before evaluating the full datasets. Future studies should consider a three-point scale or pairwise comparisons. These could limit the impact of varying strictness among raters.
What determines the choice of the best model? Applying a plan established before the data was obtained [37] revealed the importance of thresholds and criterion weights. The reproducibility condition ruled out the model with the highest fidelity and quality, and—in English—all generators. The Pareto front for the four criteria did little to narrow the selection, while equal weights favored a small and fast model. The original rule was retained, and the impact of other settings was shown separately. In subsequent studies, thresholds should be determined based on a preliminary sample or relative conditions. A criterion that gives the highest rating to nearly all models should not be the deciding factor in the ranking. The selection rule must also be adapted to the language.
Which model is suitable for a given application? To capture individual risk tolerance, Bielik 11B v3 or Gemma 3 12B with prompt v2 can be used. Bielik conveys characteristics more faithfully and writes with almost no errors, but it is more formulaic and about twice as slow. Gemma 3 12B is suitable for describing population backgrounds. It is the only model that meets the admission criteria and belongs to the Pareto front with a cNMI above 0.25 and a proportion of erroneous texts below 0.10. When speed is a priority, Gemma 3 4B may be the right choice. Phi-4 makes errors in approximately 69% of Polish texts, while Llama and Mistral combine low fidelity with low linguistic quality. The recommendations apply exclusively to Polish personas.
To what extent can the results be generalized? The study covered eight generators with 4–15 billion parameters and three evaluation models in their September 2026 versions. The population itself is synthetic: the archetype weights and the risk distributions are assumptions, not estimates (Section 3.1). The results therefore concern the transmission of specified traits through text, not the prevalence of these traits among real drivers. The human ratings were provided by two raters and covered 300 Polish texts. Centering the text vectors was a practical adjustment, but it did not guarantee that all similarity distortion would be eliminated. The decision test covered only overtaking, one model, and one language. It measured the LLM’s response to a description, not the behavior of real drivers. Vehicle-side factors, such as differences in braking performance between vehicles [54], were not modeled either; the personas describe the driver alone. The results therefore do not replace validation in microsimulation. Further research should improve driver classification and compare agents’ decisions with empirical data.
How does this work relate to sustainability? Its contribution lies in the tools used to assess sustainability rather than in measuring sustainability itself. Microsimulation is an established instrument for the in-advance evaluation of transport measures, and the credibility of the safety, energy, and emission indicators it produces depends on how driver heterogeneity is represented. The method presented here makes that representation explicit and testable. The chain from specified trait distributions through persona texts to the decisions of the agents can be checked at each step, with control trials and calibration against human raters, before any indicator is computed. Two practical consequences follow. First, a planner can vary the composition of the driver population. For example, the share of hurried or risk-taking drivers can be varied, and the measure’s assessment can be examined for robustness to that composition. This complements the variation in numerical parameters used in classical models [4]. Second, because the generators run locally on a single consumer-grade graphics card and the evaluation procedure is fully scripted, planning units without access to cloud services or large computing budgets can reproduce the tool. These are capabilities of the method, not demonstrated effects. The study verifies the personas, and the sustainability indicators themselves will be obtained only at the microsimulation stage.
7. Conclusions
We present a method for creating driver personas based on population characteristics and for evaluating their fidelity, diversity, quality, and impact on decisions. We compared eight local models in two languages using the same population of agents. All models retained clear information about the specified characteristics. For the risk level, the value of the ranged from 0.78 to 0.90. The ability to distinguish differences within a type was also better than random. The results were reproducible and consistent across judges, and comparison with human raters confirmed the assessment’s usefulness. However, the identification of a driver’s type and the level of their individual traits must be evaluated separately. Improving one result may worsen the other. Greater diversity in descriptions was usually associated with lower accuracy. Changes to the instructions did not resolve this conflict. This is an observation from the studied dataset, not a general property of all models. H2 remained unresolved because we lacked a comparison with cloud-based generators. The ready-made examples in the instructions were often copied. Removing them improved the results, but simply asking for originality did not prevent new patterns from emerging. A more effective way to diversify the descriptions was to add person-specific context. Linguistic quality must be evaluated separately. In Polish, the proportion of texts containing errors varied by more than a hundredfold, and Bielik outperformed all multilingual models. Faithful preservation of features did not guarantee correct language.
Personas changed the decision model’s responses in accordance with their specified risk propensity; this shows that the text transmits the trait, not that the resulting behavior is realistic. The correlation was approximately 0.90, and after swapping texts between agents, it dropped to near zero. However, an elaborate description did not organize the agents any better than a single sentence with a verbal risk label. Its possible advantage lies in the diversity of characters and the naturalness of the descriptions. No advantage was demonstrated in the mere communication of risk level. The text’s freedom also reduced decision repeatability. Therefore, the usefulness of personas needs to be tested in a microsimulation. Human evaluations were necessary to verify the judges, although they required significant work. Two rounds of 150 texts each then allowed for the evaluation of 41,400 descriptions. Applying a previously defined model selection rule showed how strongly the ranking depends on thresholds and weights. Therefore, recommendations should be tied to a specific task and language. This article makes a methodological contribution: a procedure for generating driver personas from specified trait distributions using local language models and validating the texts on four criteria—fidelity, diversity, linguistic quality, and functional validity—with control trials, uncertainty estimates, and calibration of LLM judges against human raters. At this stage, the practical applications are hypotheses. The intended application is the sustainability assessment of transport measures by microsimulation, in which safety, travel time, energy consumption, and emissions are derived from individual driver behavior. Validated personas make the behavioral composition of the simulated population controllable. They could help assess whether the evaluation of a traffic solution changes with that composition and identify situations in which improved traffic efficiency is accompanied by a decline in safety or higher energy consumption and emissions. The presented study does not yet demonstrate such utility. It confirms the influence of descriptions on a decision model’s responses in selected situations; it does not cover vehicle interactions or network-level effects. The next stage must therefore integrate the personas into a microsimulation model and validate it against empirical data, as conventional traffic models are calibrated against field measurements [4,55]. Depending on the application, the model should then evaluate travel time, traffic conflicts, energy consumption, or emissions. Energy consumption and emissions are listed here because they depend on driving style—speeds, accelerations, headways, and overtaking frequency—which microsimulation emission models compute from each vehicle’s trajectory; a persona population with a different share of hurried or risk-taking drivers would therefore change the energy and emission balance of a scenario as well as its safety indicators. This link remains to be demonstrated in the next stage. The size of the effect justifies the effort: road transport produced 73% of the European Union’s transport-related greenhouse gas emissions in 2023 [56], and reviews of eco-driving report that driving style alone changes fuel consumption and CO2 emissions by 5–40% [57]. A simulation tool that represents the spread of driving styles in a controllable way is therefore a precondition for assessing measures aimed at these emissions, and the method presented here provides and verifies one of its components.
Author Contributions
Conceptualization, Z.K.; methodology, Z.K.; software, Z.K.; validation, M.R. 75%, Z.K. 25%; formal analysis, M.R. 80%, Z.K. 20%; investigation, M.R. 75%, Z.K. 25%; resources, M.R. 80%, Z.K. 20%; data curation, M.R. 75%, Z.K. 25%; writing—original draft preparation, M.R. 65%, Z.K. 35%; writing—review and editing, M.R. 35%, Z.K. 65%; visualization, Z.K.; supervision, Z.K.; project administration, Z.K.; funding acquisition, Z.K. All authors have read and agreed to the published version of the manuscript.
Funding
This research was co-funded by the Warsaw University of Technology as part of its support for scientific activities in the discipline of civil engineering, geodesy, and transportation, grant number 16/ILGiT/2026.
Institutional Review Board Statement
Not applicable.
Informed Consent Statement
Not applicable.
Data Availability Statement
The raw data supporting the conclusions of this article will be made available by the authors on request.
Acknowledgments
During the preparation of this manuscript and study, the authors used the generative language models listed in Table 1 and Section 4.2 (eight local models run via Ollama 0.40.13 and three cloud models accessed through OpenRouter) for the purposes of conducting the research and testing described in this article, in which generative language models are the object of study, and DeepL Write (DeepL SE, Cologne, Germany; web version) for editing and proofreading the manuscript. The authors have reviewed and edited the output and take full responsibility for the content of this publication.
Conflicts of Interest
The authors declare no conflicts of interest. The funders had no role in the design of the study; in the collection, analyses, or interpretation of data; in the writing of the manuscript; or in the decision to publish the results.
Abbreviations
The following abbreviations are used in this manuscript:
| API | Application programming interface |
| BC | Bias-corrected (bootstrap confidence interval) |
| CI | Confidence interval |
| cNMI | Conditional normalized mutual information |
| DBQ | Driver Behaviour Questionnaire |
| GLM | Generalized linear model |
| GPU | Graphics processing unit |
| HD-D | Hypergeometric distribution D (lexical diversity index) |
| ICC | Intraclass correlation coefficient |
| IDM | Intelligent Driver Model |
| JSON | JavaScript Object Notation |
| JT | Jonckheere–Terpstra (trend test) |
| LLM | Large language model |
| MDSI | Multidimensional Driving Style Inventory |
| MTLD | Measure of Textual Lexical Diversity |
| OR | Odds ratio |
| QI | Quality index |
| Self-BLEU | Self-Bilingual Evaluation Understudy |
| SUMO | Simulation of Urban MObility |
| VS | Vendi Score |
References
- Treiber, M.; Hennecke, A.; Helbing, D. Congested traffic states in empirical observations and microscopic simulations. Phys. Rev. E 2000, 62, 1805–1824. [Google Scholar] [CrossRef] [Scilit]
- Ossen, S.; Hoogendoorn, S.P. Heterogeneity in car-following behavior: Theory and empirics. Transp. Res. Part C Emerg. Technol. 2011, 19, 182–195. [Google Scholar] [CrossRef] [Scilit]
- Makridis, M.A.; Anesiadou, A.; Mattas, K.; Fontaras, G.; Ciuffo, B. Characterizing driver heterogeneity within stochastic traffic simulation. arXiv 2021, arXiv:2107.02618. [Google Scholar] [CrossRef] [Scilit]
- Rychlicki, M.; Kasprzyk, Z. Synthetic Data Generation for Machine Learning-Based Hazard Prediction in Area-Based Speed Control Systems. Appl. Sci. 2025, 15, 8531. [Google Scholar] [CrossRef] [Scilit]
- Beckman, R.J.; Baggerly, K.A.; McKay, M.D. Creating synthetic baseline populations. Transp. Res. Part A Policy Pract. 1996, 30, 415–429. [Google Scholar] [CrossRef] [Scilit]
- Borysov, S.S.; Rich, J.; Pereira, F.C. How to generate micro-agents? A deep generative modeling approach to population synthesis. Transp. Res. Part C Emerg. Technol. 2019, 106, 73–97. [Google Scholar] [CrossRef] [Scilit]
- Taubman-Ben-Ari, O.; Mikulincer, M.; Gillath, O. The multidimensional driving style inventory—Scale construct and validation. Accid. Anal. Prev. 2004, 36, 323–332. [Google Scholar] [CrossRef] [Scilit]
- Reason, J.; Manstead, A.; Stradling, S.; Baxter, J.; Campbell, K. Errors and violations on the roads: A real distinction? Ergonomics 1990, 33, 1315–1332. [Google Scholar] [CrossRef] [Scilit]
- Potams, A.J.; Ghandour, R.; Al Barakeh, Z.; Youssef, K. Driver Behavior Classification on Secondary Roads Using Machine Learning Models. Technologies 2026, 14, 524. [Google Scholar] [CrossRef] [Scilit]
- Kowaleczko, P.; Kamiński, T.; Rychlicki, M.; Kasprzyk, Z.; Stawowy, M.; Trzeszkowski, J. Applying Machine Learning to Preselective Weighing of Moving Vehicles. Appl. Sci. 2025, 15, 1743. [Google Scholar] [CrossRef] [Scilit]
- Merino-Vivanco, X.; Díaz-Muñoz, F.; García-Ramírez, Y. Latent Driving Style Profiles and Road Safety Outcomes Across Generational Extremes: The Role of Driving Exposure in Accidents and Traffic Infractions. Safety 2026, 12, 77. [Google Scholar] [CrossRef] [Scilit]
- Al-Rababah, A.; Rahman, S.M.; Shafiullah, M. Advances in Driver Behavior Classification: Traditional Paradigms, Deep Learning, Generative AI, and Explainable Systems. Int. J. Intell. Transp. Syst. Res. 2026, 24, 757–795. [Google Scholar] [CrossRef] [Scilit]
- Zeroual, I.; Jaziri, R.; Bernard, G. Unsupervised Learning for Intelligent Driver Profiling. In Proceedings of the 2025 IEEE/ACS 22nd International Conference on Computer Systems and Applications (AICCSA), Doha, Qatar, 19–22 October 2025; pp. 1–6. [Google Scholar] [CrossRef] [Scilit]
- Li, S.; Azfar, T.; Ke, R. ChatSUMO: Large Language Model for Automating Traffic Scenario Generation in Simulation of Urban MObility. IEEE Trans. Intell. Veh. 2025, 10, 4962–4973. [Google Scholar] [CrossRef] [Scilit]
- Xu, Z.; Chen, T.; Huang, Z.; Xing, Y.; Chen, S. Personalizing Driver Agent Using Large Language Models for Driving Safety and Smarter Human–Machine Interactions. IEEE Intell. Transp. Syst. Mag. 2025, 17, 96–111. [Google Scholar] [CrossRef] [Scilit]
- Jin, Y.; Yang, R.; Yi, Z.; Shen, X.; Peng, H.; Liu, X.; Qin, J.; Li, J.; Xie, J.; Gao, P.; et al. SurrealDriver: Designing LLM-powered Generative Driver Agent Framework based on Human Drivers’ Driving-thinking Data. arXiv 2023, arXiv:2309.13193. [Google Scholar] [CrossRef] [Scilit]
- Wang, P.; Wu, G.; Zhao, Y.; Lin, Y.; Yang, H.F. LLM agents can partially mimic human driving behaviors and decision values but better align with aggressive profiles. Transp. Res. Part C Emerg. Technol. 2026, 186, 105606. [Google Scholar] [CrossRef] [Scilit]
- Li, X.; Huang, F.; Lv, J.; Xiao, Z.; Li, G.; Yue, Y. Be More Real: Travel Diary Generation Using LLM Agents and Individual Profiles. arXiv 2024, arXiv:2407.18932. [Google Scholar] [CrossRef] [Scilit]
- Li, H.; Ding, J.; Gong, J.; Li, Y. Large language model as user daily behavior data generator: Balancing population diversity and individual personality. arXiv 2025, arXiv:2505.17615. [Google Scholar] [CrossRef] [Scilit]
- Park, J.S.; O’Brien, J.; Cai, C.J.; Morris, M.R.; Liang, P.; Bernstein, M.S. Generative Agents: Interactive Simulacra of Human Behavior. In Proceedings of the 36th Annual ACM Symposium on User Interface Software and Technology (UIST ’23), San Francisco, CA, USA, 29 October–1 November 2023; pp. 1–22. [Google Scholar] [CrossRef] [Scilit]
- Argyle, L.P.; Busby, E.C.; Fulda, N.; Gubler, J.R.; Rytting, C.; Wingate, D. Out of One, Many: Using Language Models to Simulate Human Samples. Polit. Anal. 2023, 31, 337–351. [Google Scholar] [CrossRef] [Scilit]
- Park, J.S.; Zou, C.Q.; Shaw, A.; Hill, B.M.; Cai, C.; Morris, M.R.; Willer, R.; Liang, P.; Bernstein, M.S. Generative Agent Simulations of 1,000 People. arXiv 2024, arXiv:2411.10109. [Google Scholar] [CrossRef] [Scilit]
- Ge, T.; Chan, X.; Wang, X.; Yu, D.; Mi, H.; Yu, D. Scaling Synthetic Data Creation with 1,000,000,000 Personas. arXiv 2024, arXiv:2406.20094. [Google Scholar] [CrossRef] [Scilit]
- Li, M.; Wei, Z.; Shi, X.; Deng, Y. Do LLMs Understand Personality? Rethinking Persona Fidelity Evaluation through Structured Behavioral Inference. arXiv 2026, arXiv:2608.26674. [Google Scholar] [CrossRef] [Scilit]
- Li, J.; Galley, M.; Brockett, C.; Gao, J.; Dolan, B. A Diversity-Promoting Objective Function for Neural Conversation Models. In Proceedings of the 2016 Conference of the North American Chapter of the Association for Computational Linguistics: Human Language Technologies, San Diego, CA, USA, 12–17 June 2016; pp. 110–119. [Google Scholar] [CrossRef] [Scilit]
- Zhu, Y.; Lu, S.; Zheng, L.; Guo, J.; Zhang, W.; Wang, J.; Yu, Y. Texygen: A Benchmarking Platform for Text Generation Models. In Proceedings of the 41st International ACM SIGIR Conference on Research & Development in Information Retrieval, Ann Arbor, MI, USA, 8–12 July 2018; pp. 1097–1100. [Google Scholar] [CrossRef] [Scilit]
- McCarthy, P.M.; Jarvis, S. MTLD, vocd-D, and HD-D: A validation study of sophisticated approaches to lexical diversity assessment. Behav. Res. Methods 2010, 42, 381–392. [Google Scholar] [CrossRef] [Scilit]
- Friedman, D.; Dieng, A.B. The Vendi Score: A Diversity Evaluation Metric for Machine Learning. Trans. Mach. Learn. Res. 2023. Available online: https://openreview.net/forum?id=g97OHbQyk1 (accessed on 21 September 2026).
- Tevet, G.; Berant, J. Evaluating the Evaluation of Diversity in Natural Language Generation. In Proceedings of the 16th Conference of the European Chapter of the Association for Computational Linguistics: Main Volume, Online, 19–23 April 2021; pp. 326–346. [Google Scholar] [CrossRef] [Scilit]
- Jiang, L.; Chai, Y.; Li, M.; Liu, M.; Fok, R.; Dziri, N.; Tsvetkov, Y.; Sap, M.; Choi, Y. Artificial Hivemind: The Open-Ended Homogeneity of Language Models (and Beyond). In Proceedings of the Advances in Neural Information Processing Systems 38 (NeurIPS 2025), San Diego, CA, USA, and Mexico City, Mexico, 30 November–7 December 2025; pp. 90705–90774. [Google Scholar] [CrossRef] [Scilit]
- Kirk, R.; Mediratta, I.; Nalmpantis, C.; Luketina, J.; Hambro, E.; Grefenstette, E.; Raileanu, R. Understanding the Effects of RLHF on LLM Generalisation and Diversity. In Proceedings of the 12th International Conference on Learning Representations (ICLR 2024), Vienna, Austria, 7–11 May 2024. [Google Scholar]
- Shumailov, I.; Shumaylov, Z.; Zhao, Y.; Papernot, N.; Anderson, R.; Gal, Y. AI models collapse when trained on recursively generated data. Nature 2024, 631, 755–759. [Google Scholar] [CrossRef] [Scilit]
- Zheng, L.; Chiang, W.-L.; Sheng, Y.; Zhuang, S.; Wu, Z.; Zhuang, Y.; Lin, Z.; Li, Z.; Li, D.; Xing, E.P.; et al. Judging LLM-as-a-Judge with MT-Bench and Chatbot Arena. In Proceedings of the Advances in Neural Information Processing Systems 36 (NeurIPS 2023), New Orleans, LA, USA, 10–16 December 2023; pp. 46595–46623. [Google Scholar] [CrossRef] [Scilit]
- Wang, P.; Li, L.; Chen, L.; Cai, Z.; Zhu, D.; Lin, B.; Cao, Y.; Kong, L.; Liu, Q.; Liu, T.; et al. Large Language Models are not Fair Evaluators. In Proceedings of the 62nd Annual Meeting of the Association for Computational Linguistics (Volume 1: Long Papers), Bangkok, Thailand, 11–16 August 2024; pp. 9440–9450. [Google Scholar] [CrossRef] [Scilit]
- Krippendorff, K. Content Analysis: An Introduction to Its Methodology, 2nd ed.; SAGE Publications: Thousand Oaks, CA, USA, 2004. [Google Scholar]
- Krippendorff, K. Computing Krippendorff’s Alpha-Reliability; University of Pennsylvania: Philadelphia, PA, USA, 2011; Available online: https://repository.upenn.edu/bitstreams/0421f871-f005-4322-b06a-a66bec328e3b/download (accessed on 21 September 2026).
- Nosek, B.A.; Ebersole, C.R.; DeHaven, A.C.; Mellor, D.T. The preregistration revolution. Proc. Natl. Acad. Sci. USA 2018, 115, 2600–2606. [Google Scholar] [CrossRef] [Scilit]
- Cohen, J. Weighted kappa: Nominal scale agreement with provision for scaled disagreement or partial credit. Psychol. Bull. 1968, 70, 213–220. [Google Scholar] [CrossRef] [Scilit]
- Vinh, N.X.; Epps, J.; Bailey, J. Information theoretic measures for clusterings comparison: Variants, properties, normalization and correction for chance. J. Mach. Learn. Res. 2010, 11, 2837–2854. [Google Scholar]
- Woliński, M. Morfeusz Reloaded. In Proceedings of the Ninth International Conference on Language Resources and Evaluation (LREC 2014), Reykjavik, Iceland, 26–31 May 2014; pp. 1106–1111. [Google Scholar] [CrossRef] [Scilit]
- Wang, L.; Yang, N.; Huang, X.; Yang, L.; Majumder, R.; Wei, F. Multilingual E5 Text Embeddings: A Technical Report. arXiv 2024, arXiv:2402.05672. [Google Scholar] [CrossRef] [Scilit]
- Mu, J.; Viswanath, P. All-but-the-Top: Simple and Effective Postprocessing for Word Representations. In Proceedings of the 6th International Conference on Learning Representations (ICLR 2018), Vancouver, BC, Canada, 30 April–3 May 2018; Available online: https://openreview.net/forum?id=HkuGJ3kCb (accessed on 21 September 2026).
- Jonckheere, A.R. A distribution-free k-sample test against ordered alternatives. Biometrika 1954, 41, 133–145. [Google Scholar] [CrossRef] [Scilit]
- Efron, B. Better bootstrap confidence intervals. J. Am. Stat. Assoc. 1987, 82, 171–185. [Google Scholar] [CrossRef]
- Gemma Team; Kamath, A.; Ferret, J.; Pathak, S.; Vieillard, N.; Merhej, R.; Perrin, S.; Matejovicova, T.; Ramé, A.; Rivière, M.; et al. Gemma 3 Technical Report. arXiv 2025, arXiv:2503.19786. [Google Scholar] [CrossRef] [Scilit]
- Yang, A.; Li, A.; Yang, B.; Zhang, B.; Hui, B.; Zheng, B.; Yu, B.; Gao, C.; Huang, C.; Lv, C.; et al. Qwen3 Technical Report. arXiv 2025, arXiv:2505.09388. [Google Scholar] [CrossRef] [Scilit]
- Abdin, M.; Aneja, J.; Behl, H.; Bubeck, S.; Eldan, R.; Gunasekar, S.; Harrison, M.; Hewett, R.J.; Javaheripi, M.; Kauffmann, P.; et al. Phi-4 Technical Report. arXiv 2024, arXiv:2412.08905. [Google Scholar] [CrossRef] [Scilit]
- Grattafiori, A.; Dubey, A.; Jauhri, A.; Pandey, A.; Kadian, A.; Al-Dahle, A.; Letman, A.; Mathur, A.; Schelten, A.; Vaughan, A.; et al. The Llama 3 Herd of Models. arXiv 2024, arXiv:2407.21783. [Google Scholar] [CrossRef] [Scilit]
- Turuvekere Sreenivas, S.; Muralidharan, S.; Joshi, R.; Chochowski, M.; Mahabaleshwarkar, A.S.; Shen, G.; Zeng, J.; Chen, Z.; Suhara, Y.; Diao, S.; et al. LLM Pruning and Distillation in Practice: The Minitron Approach. arXiv 2024, arXiv:2408.11796. [Google Scholar] [CrossRef] [Scilit]
- Ociepa, K.; Flis, Ł.; Kinas, R.; Wróbel, K.; Gwoździej, A. Bielik 11B v3: Multilingual Large Language Model for European Languages. arXiv 2026, arXiv:2601.11579. [Google Scholar] [CrossRef] [Scilit]
- Ociepa, K.; Flis, Ł.; Wróbel, K.; Gwoździej, A.; Kinas, R. Bielik 11B v2 Technical Report. arXiv 2025, arXiv:2505.02410. [Google Scholar] [CrossRef] [Scilit]
- Pełka, M.; Kruszewski, M.; Kasprzyk, Z.; Rychlicki, M. Model for Evaluating the Effectiveness of Practical Training with the Use of a High-End Driving Simulator. Appl. Sci. 2025, 15, 8083. [Google Scholar] [CrossRef] [Scilit]
- Trifunović, A.; Senić, A.; Čičević, S.; Ivanišević, T.; Vukšić, V.; Simović, S. Evaluating the Road Environment Through the Lens of Professional Drivers: A Traffic Safety Perspective. Mechatron. Intell. Transp. Syst. 2024, 3, 31–38. [Google Scholar] [CrossRef] [Scilit]
- Simović, S.; Ivanišević, T.; Vasiljević, S.; Trifunović, A. Influential Factors on Braking Coefficients and Variability in Braking Force of Vehicle Service Brakes: A Neural Network Approach. Mechatron. Intell. Transp. Syst. 2025, 4, 166–179. [Google Scholar] [CrossRef] [Scilit]
- Lizarbe Alarcón, H.; Bermejo Escalante, L.E.; Ayala Bizarro, R.G.; Ircañaupa Huamani, A.S.; Bravo Anaya, R.G.; Tacuri Gamboa, A.; Garcia Saez, E.C.; Retamozo Fernández, S.W.; Tenorio-Huarancca, D.O. Calibration of a Mesoscopic Simulation Model for the Optimization of Traffic Performance Parameters in a Commercial District. Int. J. Transp. Dev. Integr. 2025, 9, 700–721. [Google Scholar] [CrossRef] [Scilit]
- European Environment Agency. Greenhouse Gas Emissions from Transport in Europe. Indicator, Published 6 November 2025. Available online: https://www.eea.europa.eu/en/analysis/indicators/greenhouse-gas-emissions-from-transport (accessed on 3 November 2026).
- Alam, M.S.; McNabola, A. A Critical Review and Assessment of Eco-Driving Policy & Technology: Benefits & Limitations. Transp. Policy 2014, 35, 42–49. [Google Scholar] [CrossRef] [Scilit]
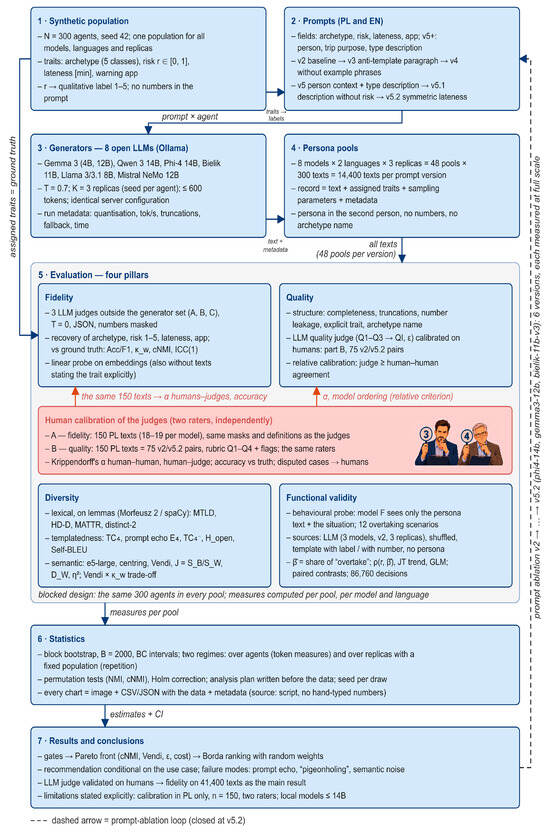
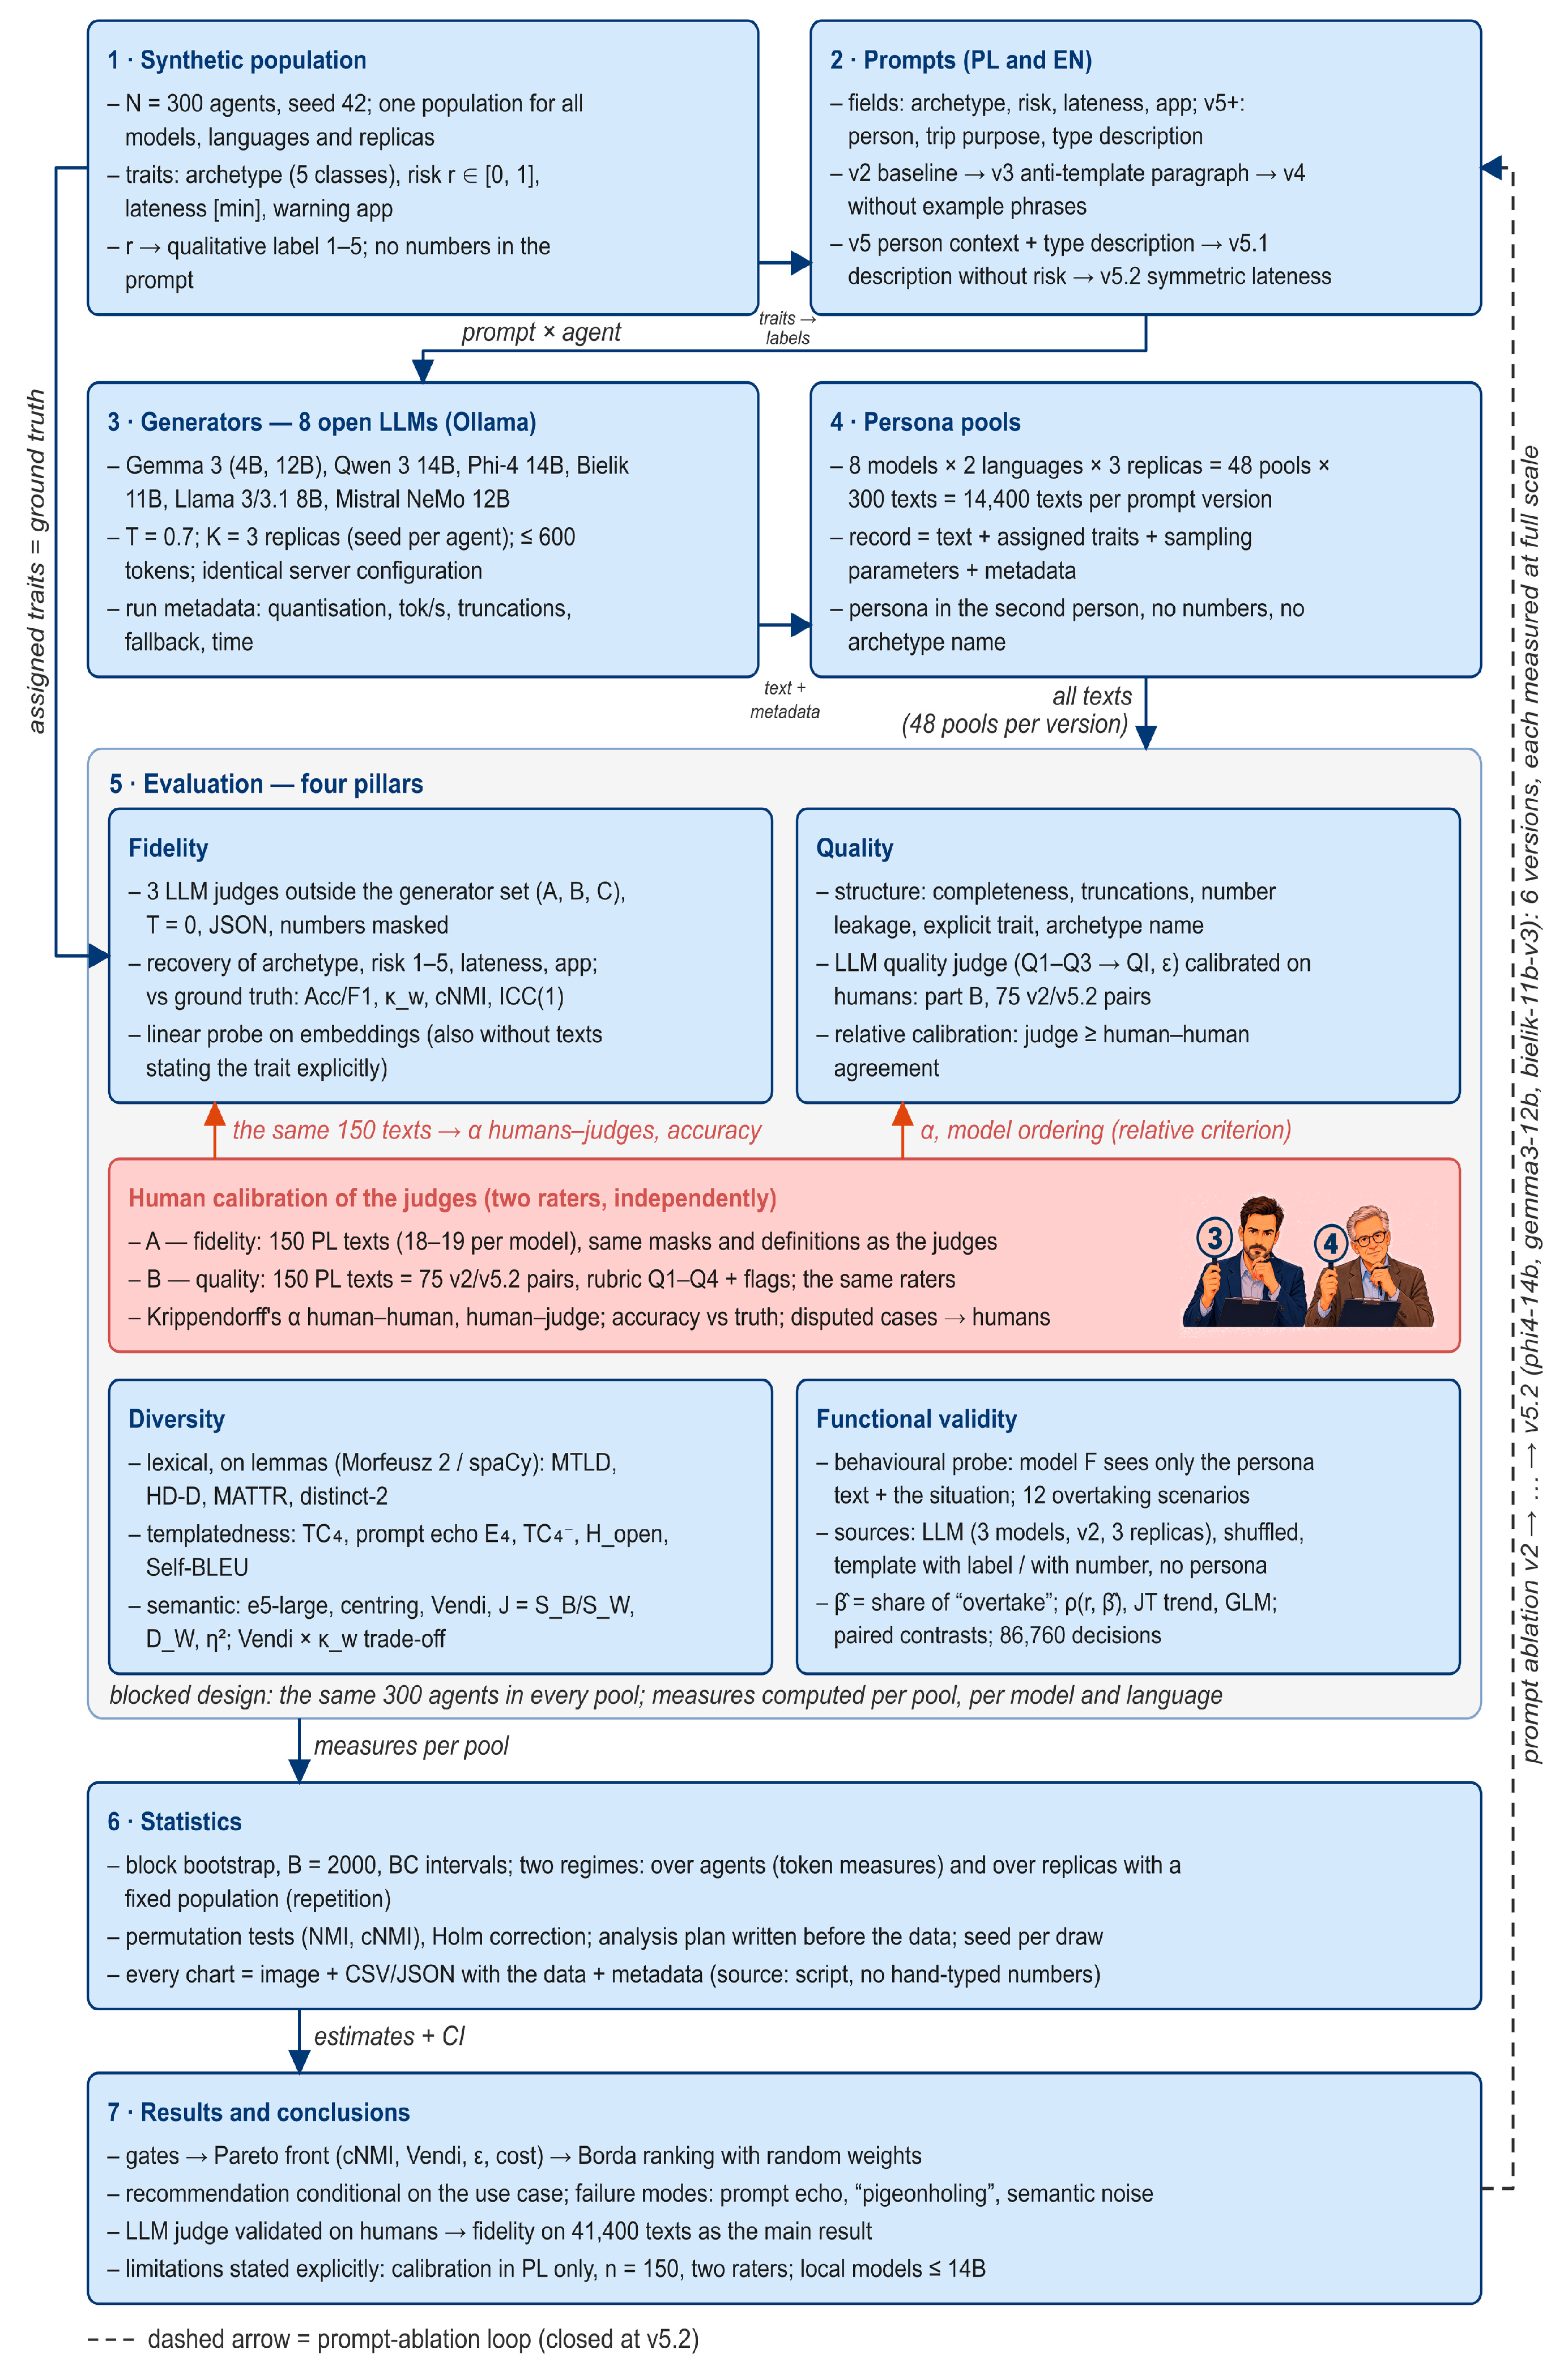
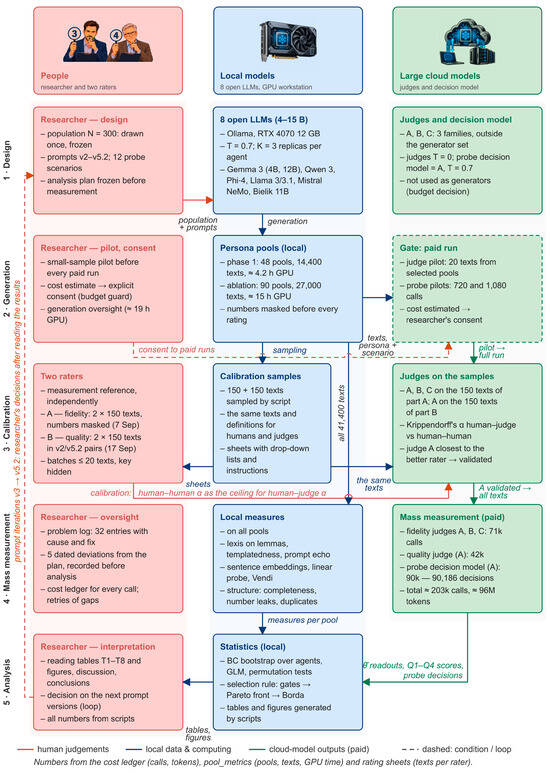
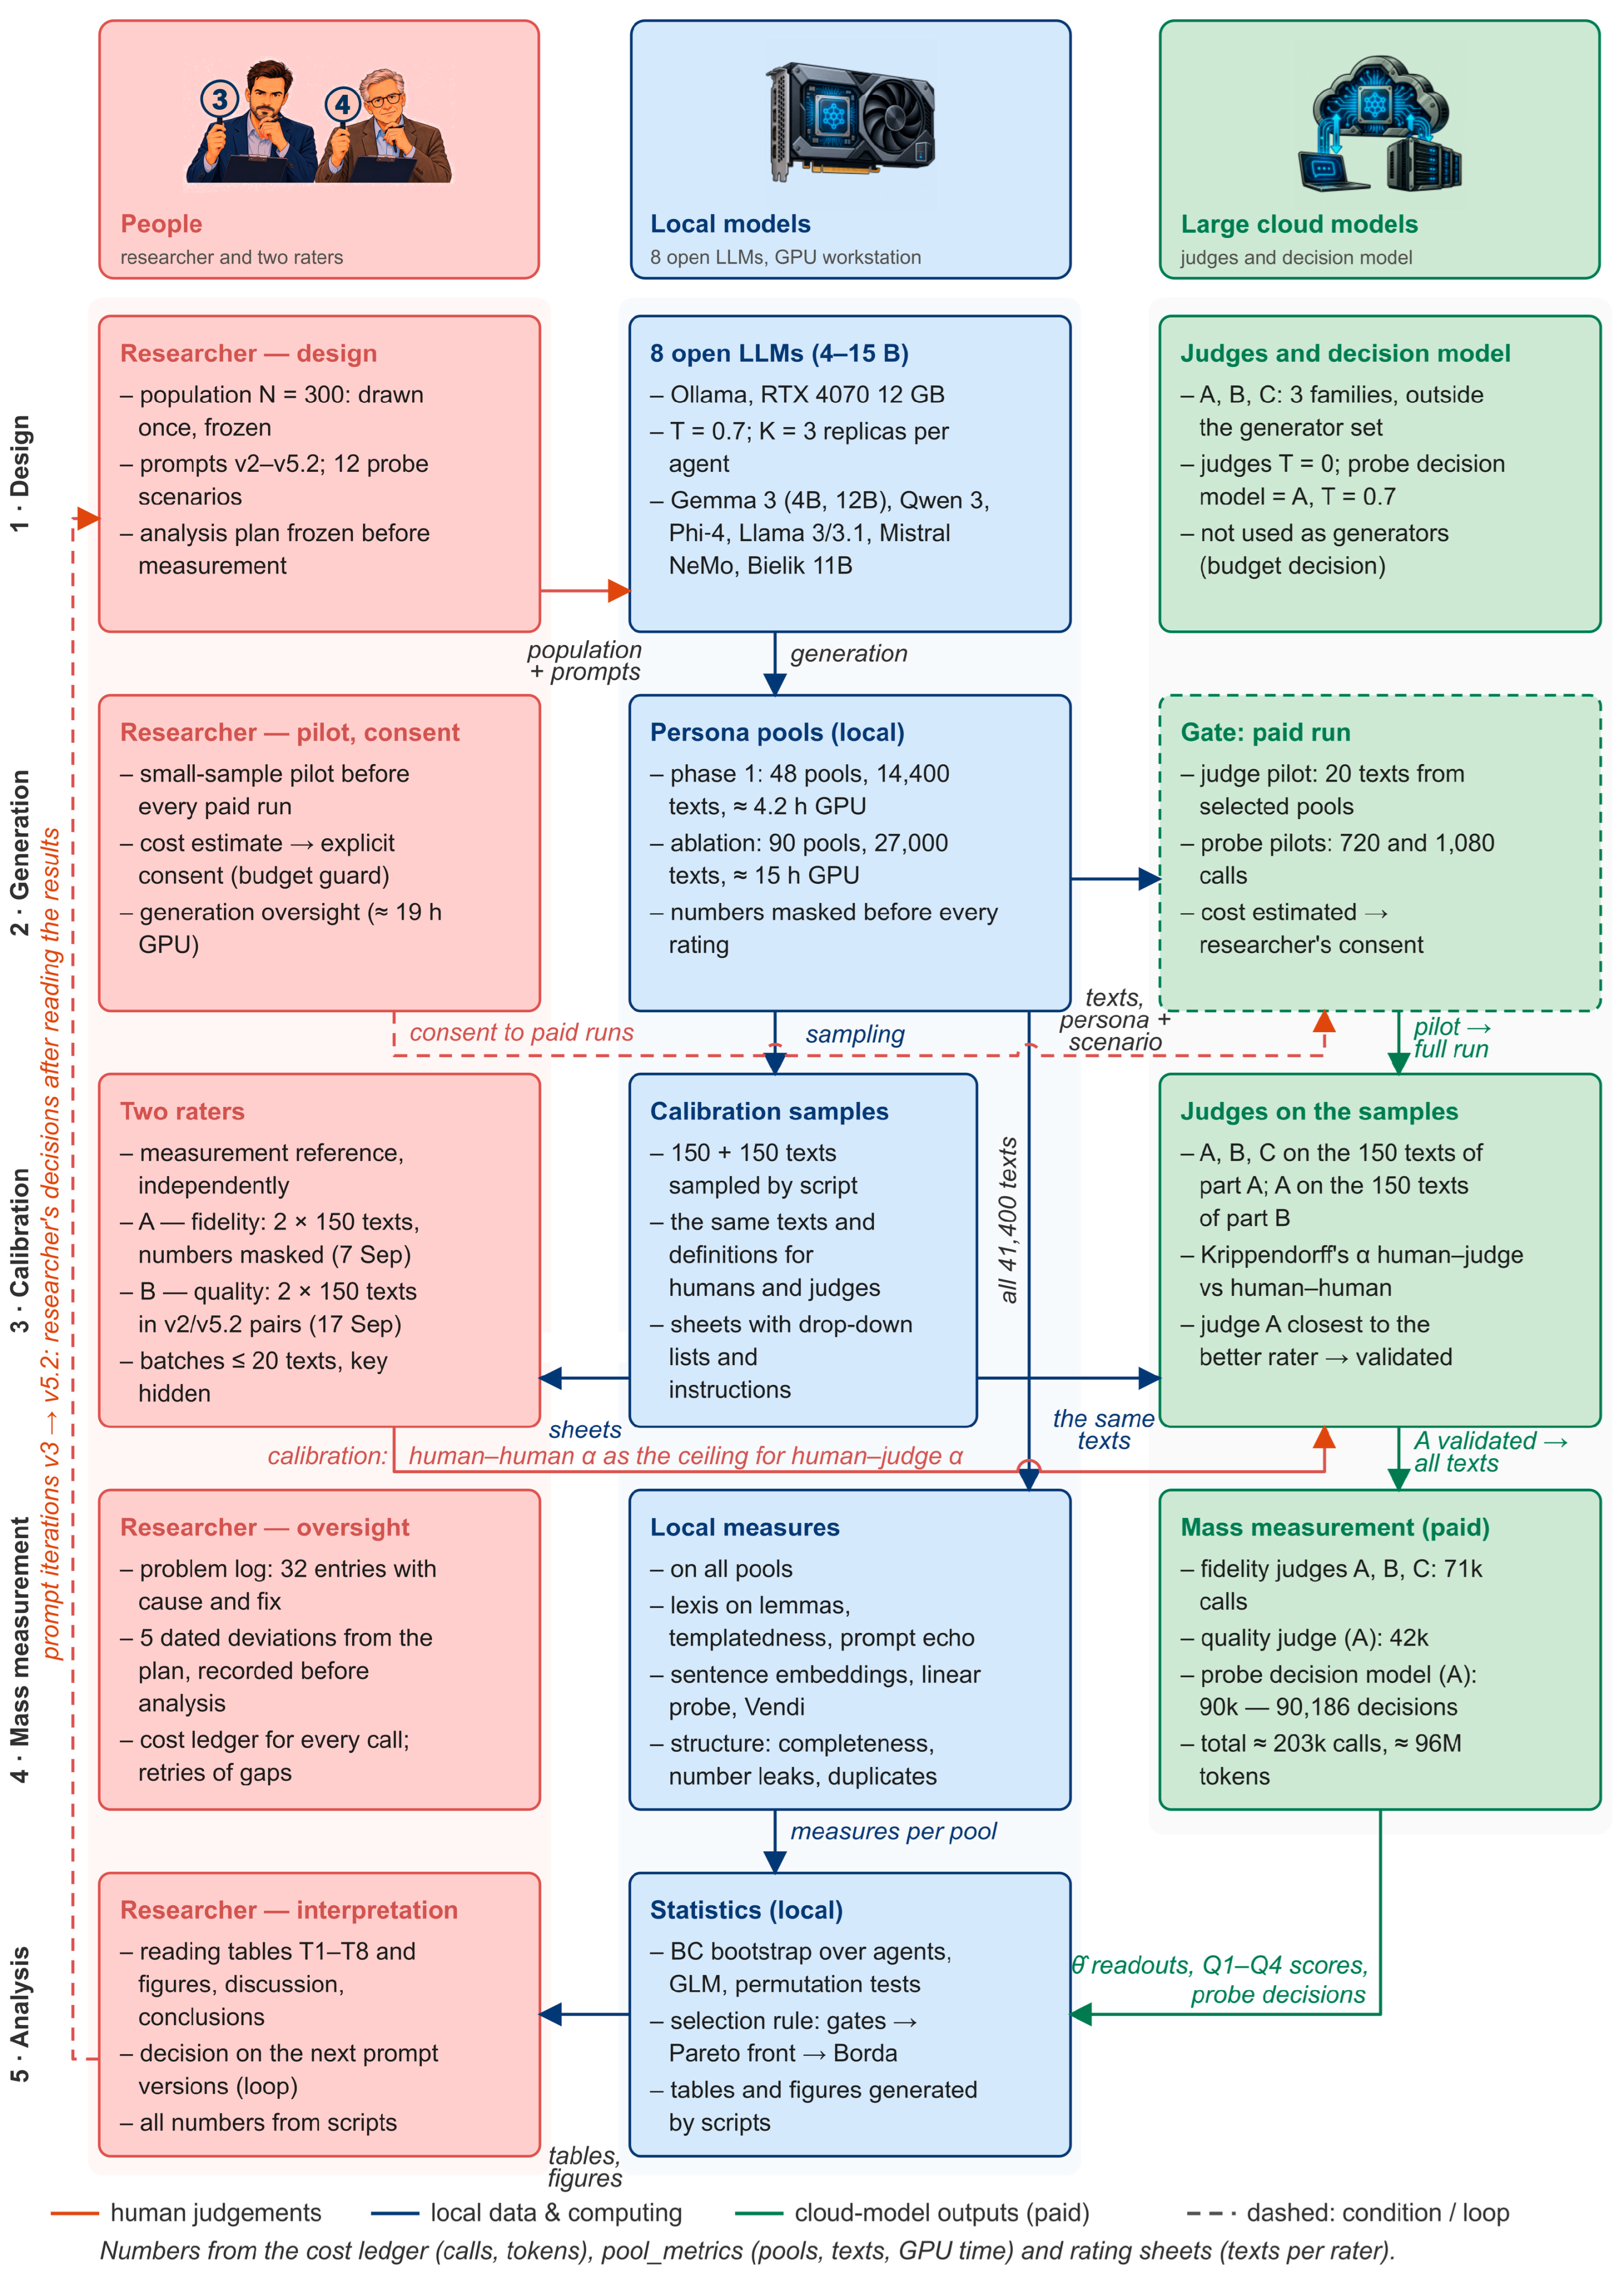
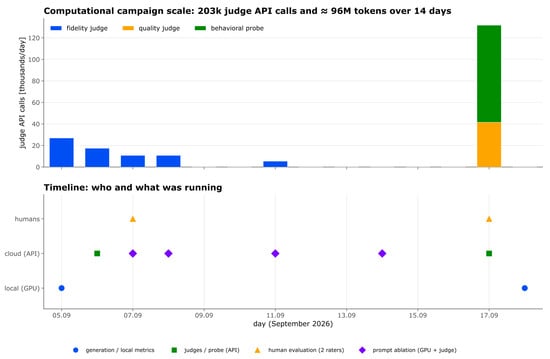
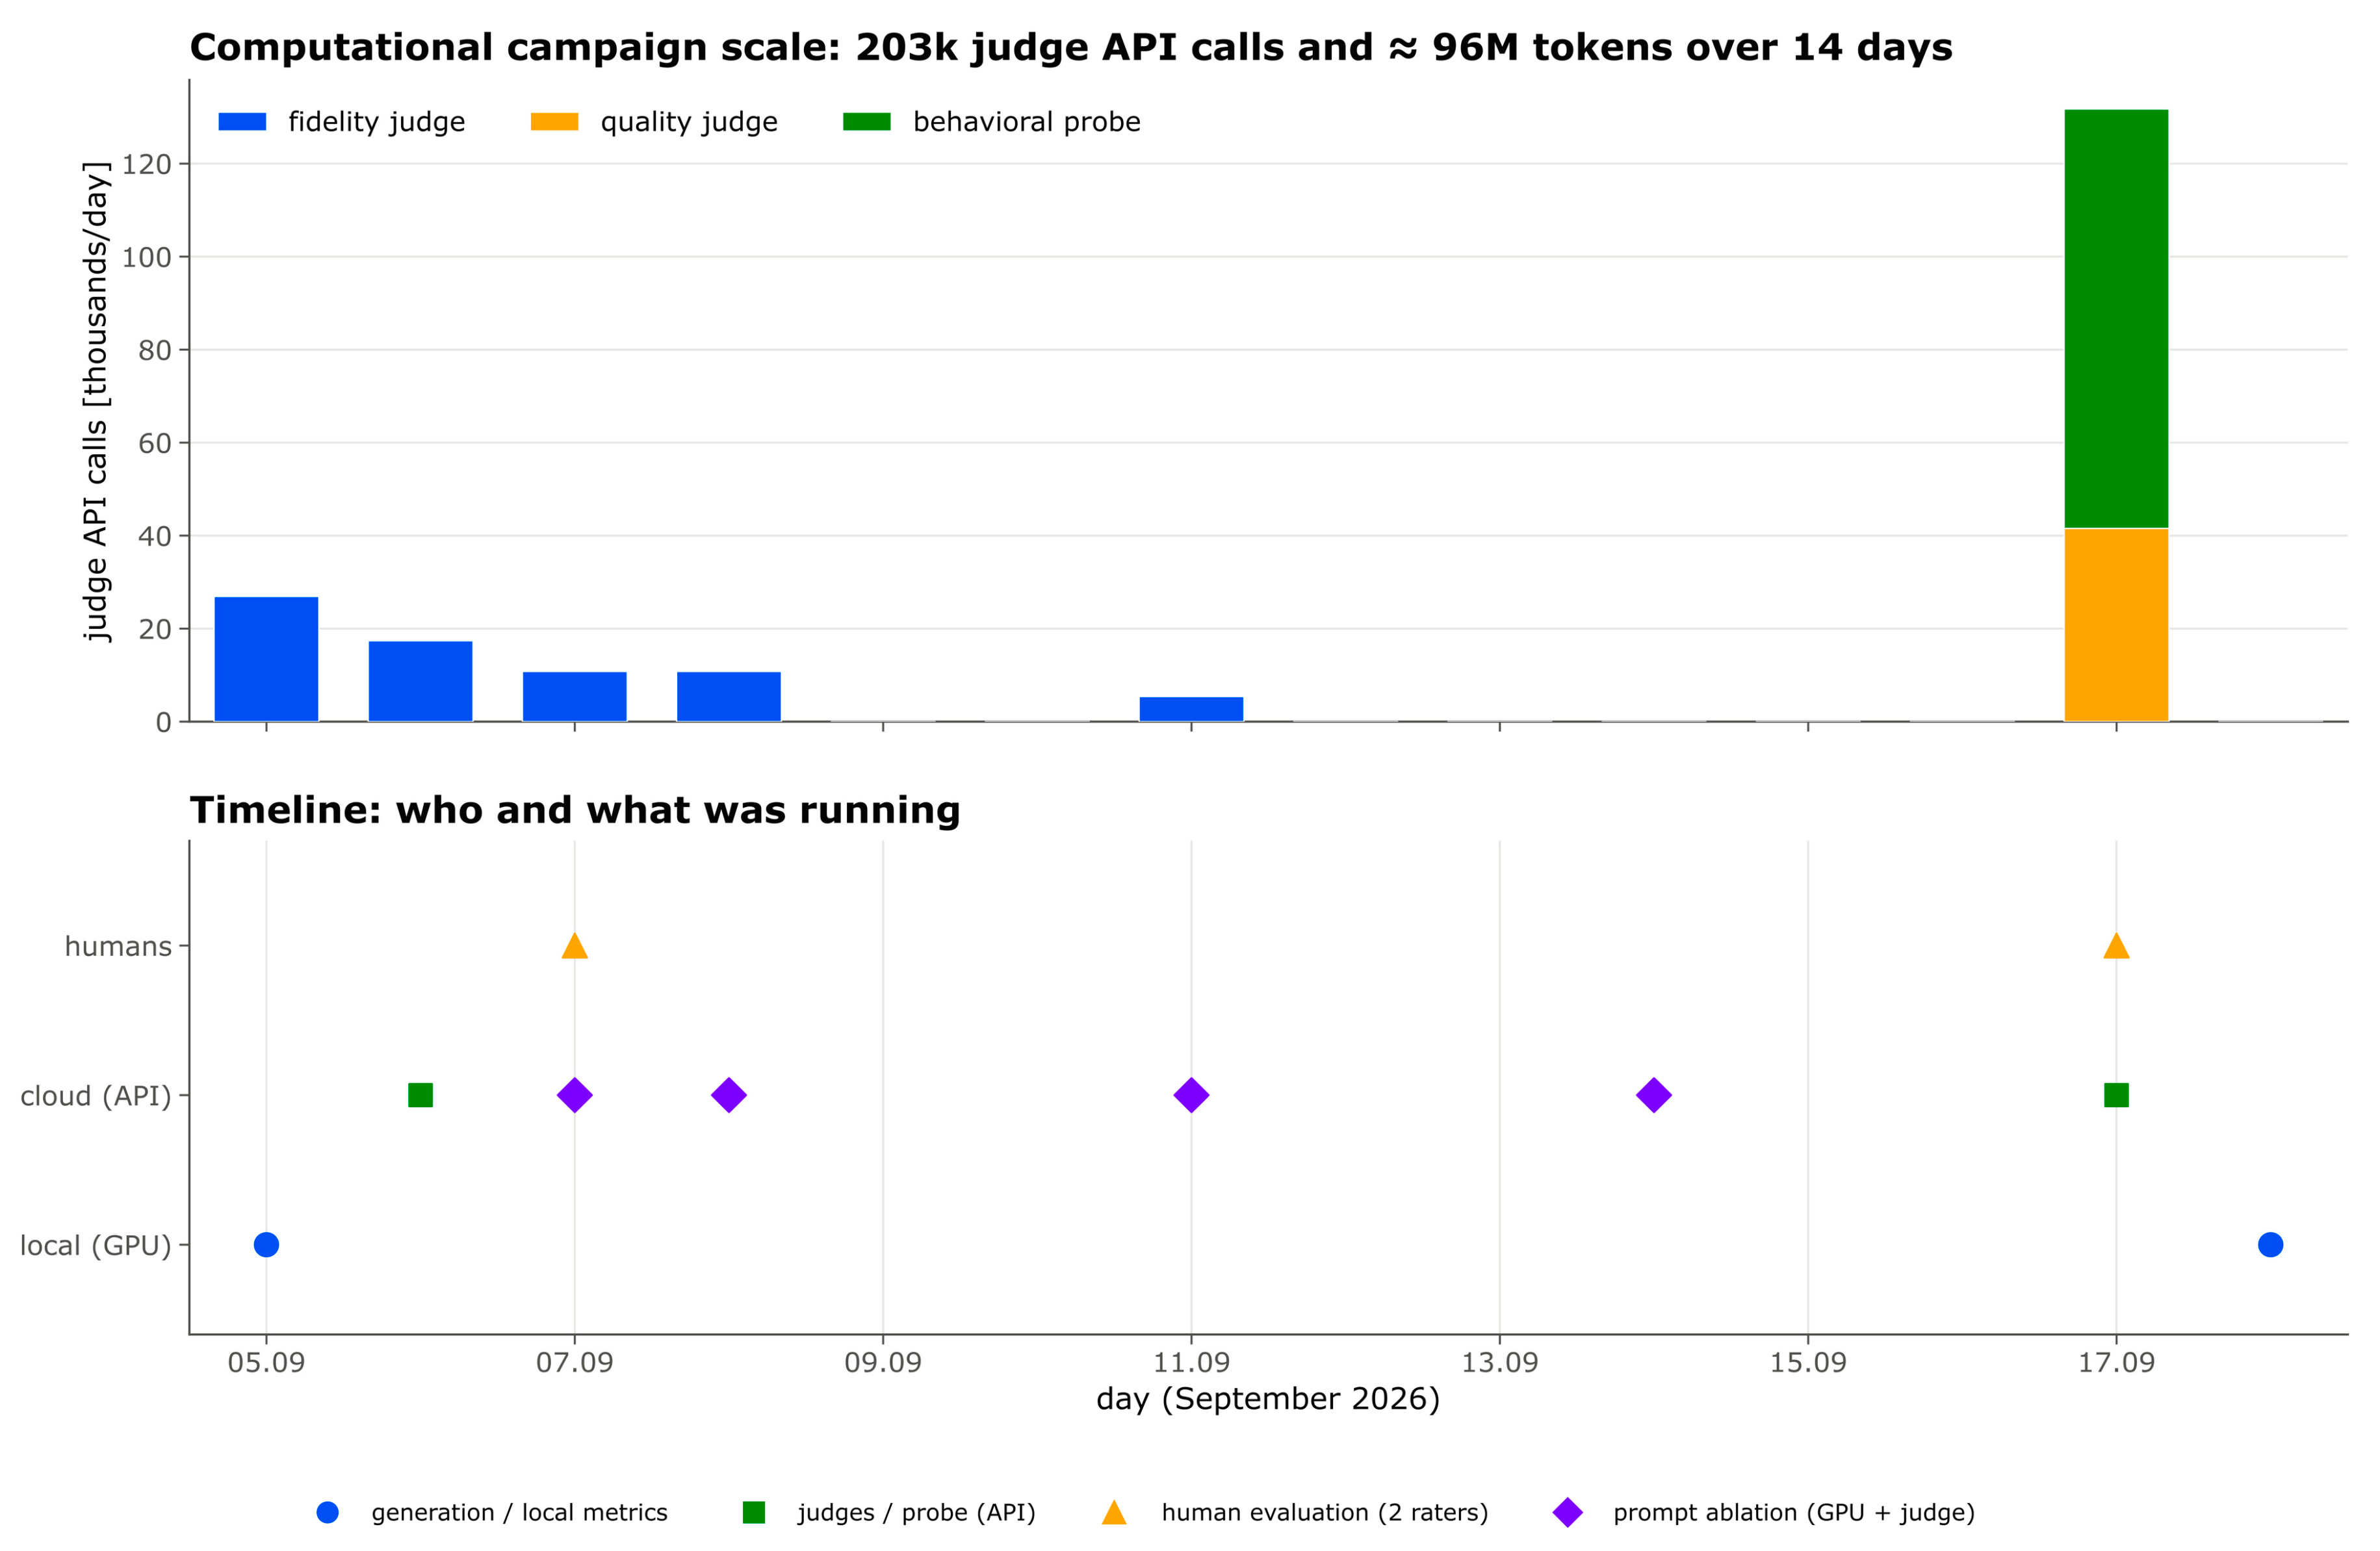
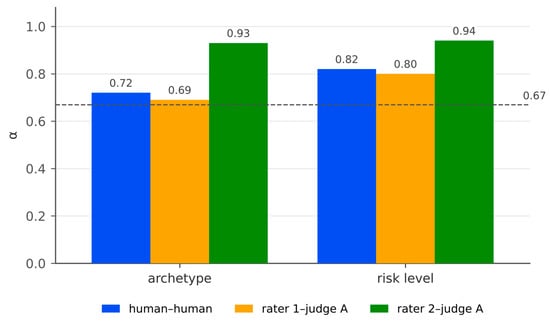
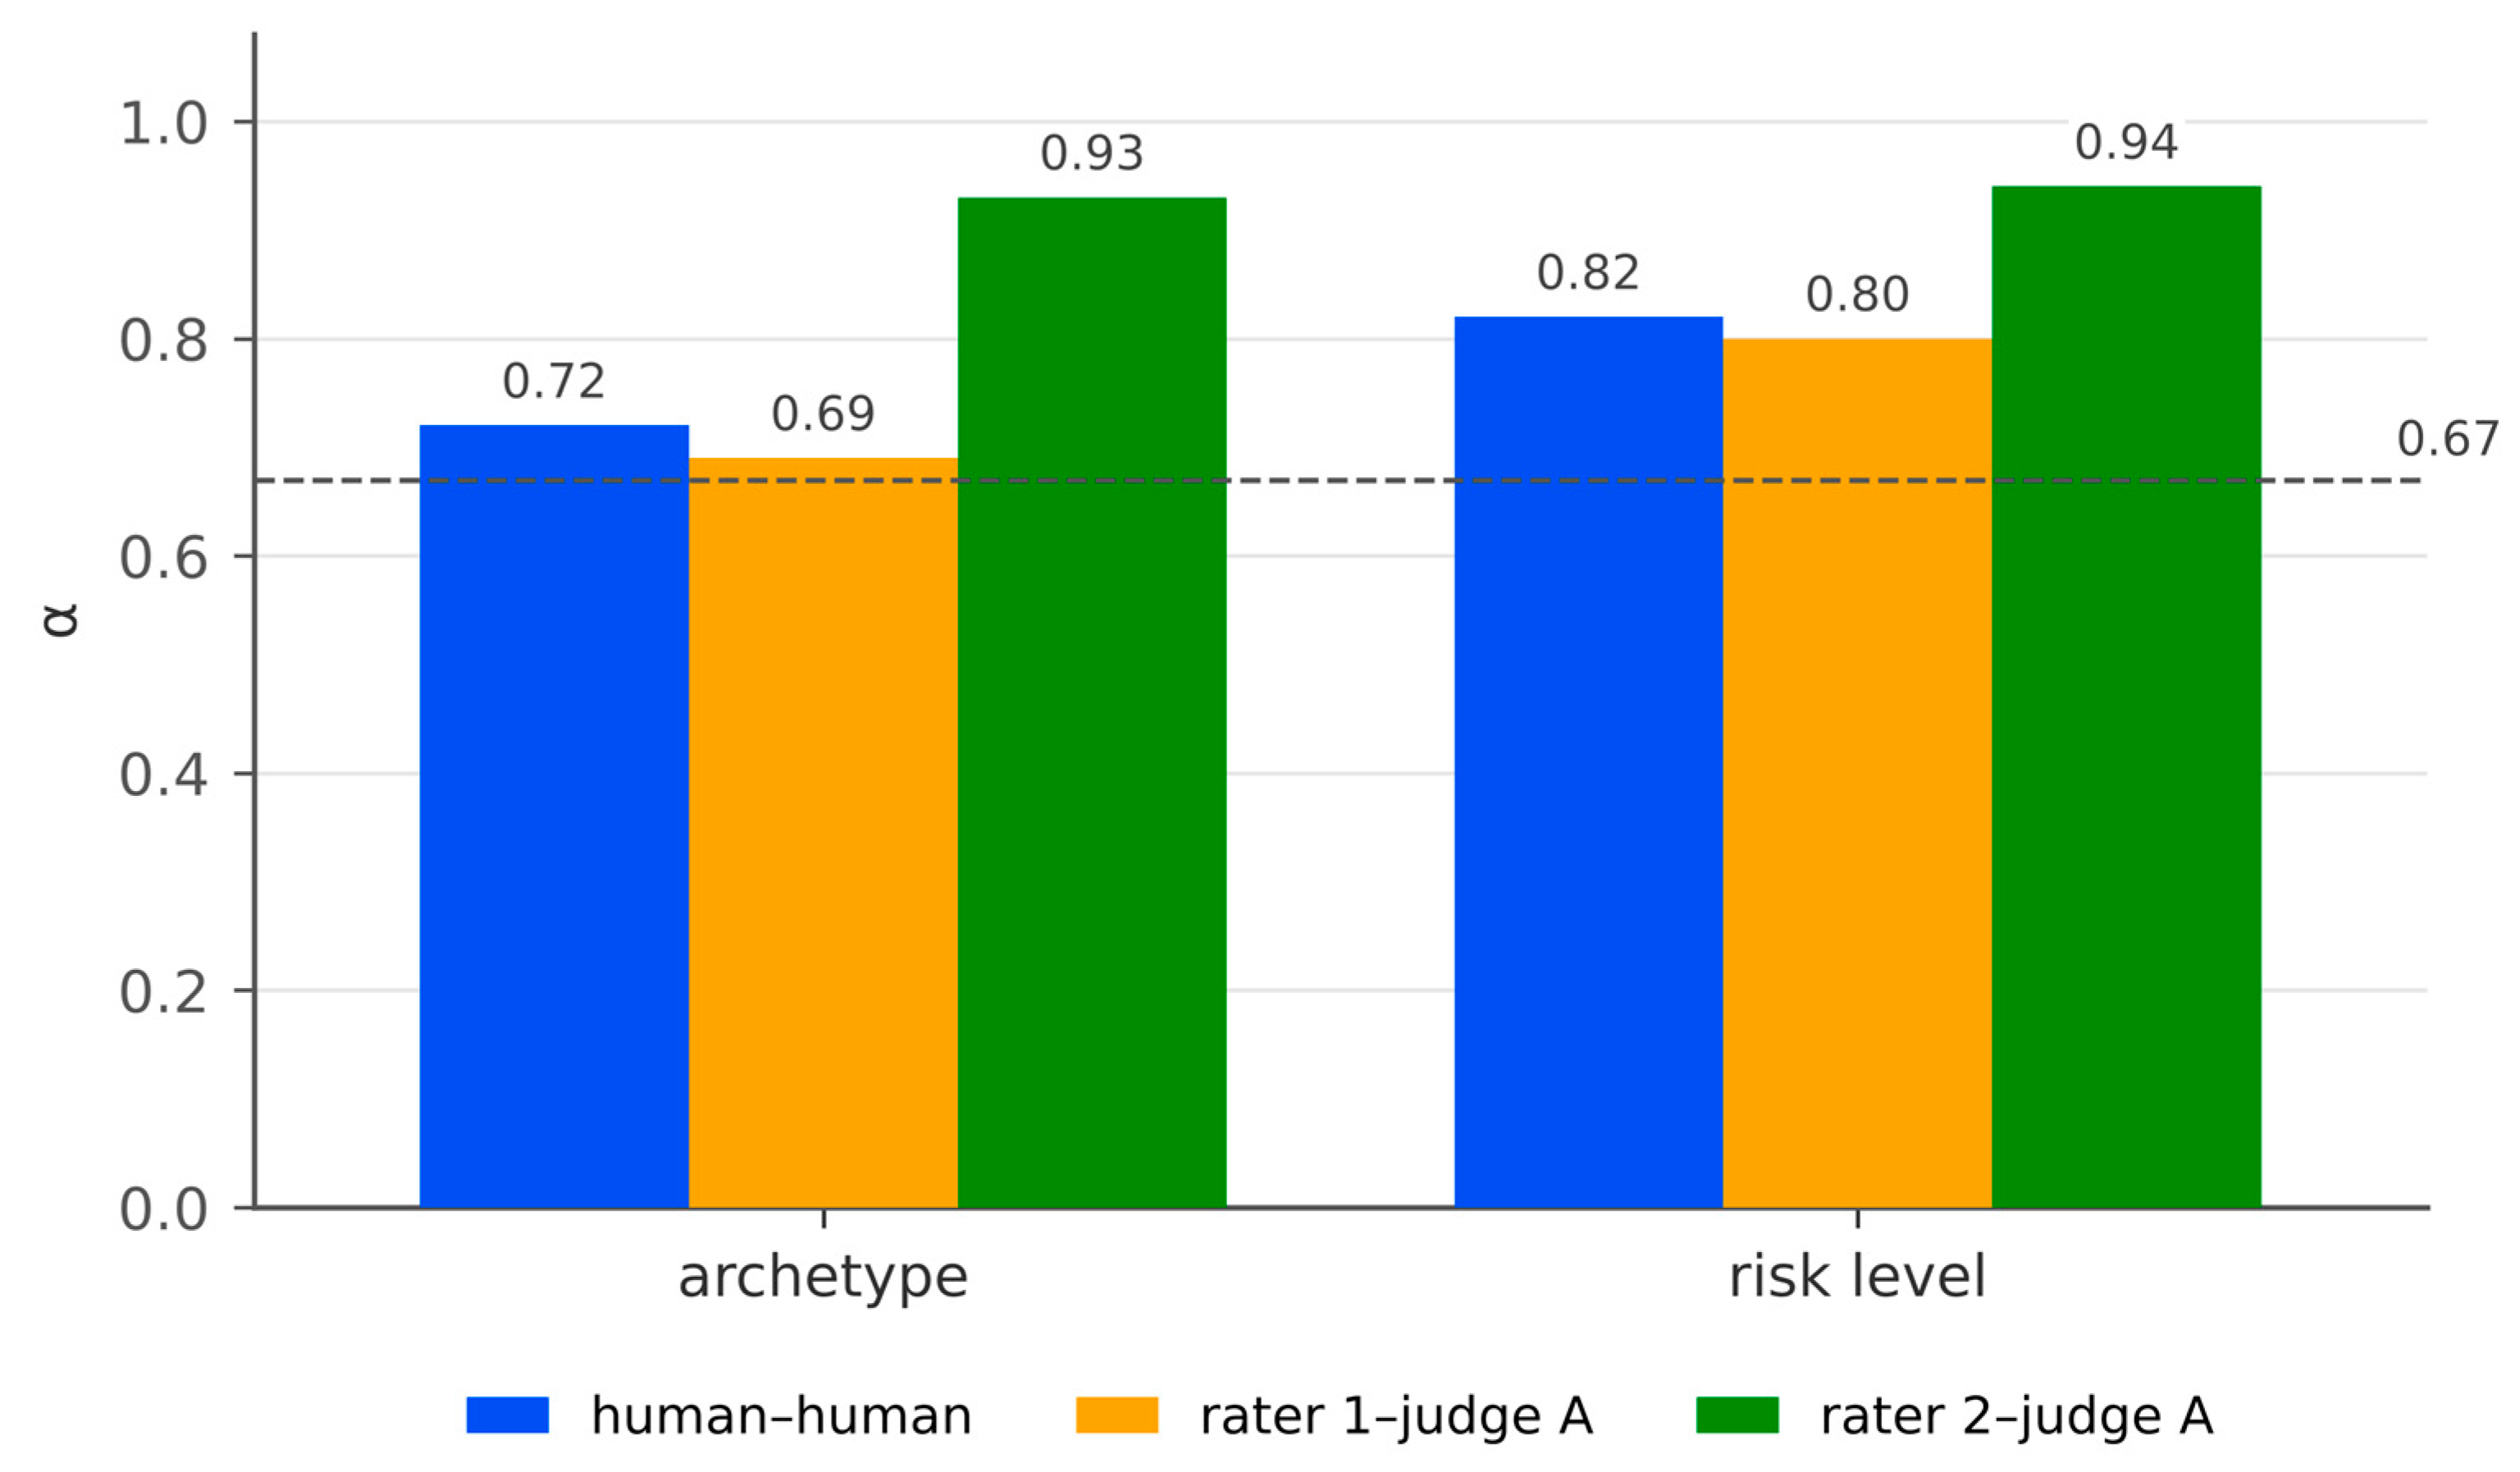
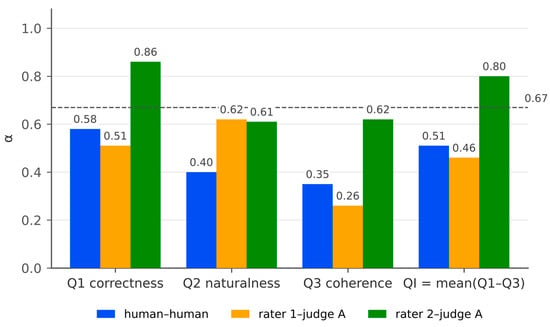
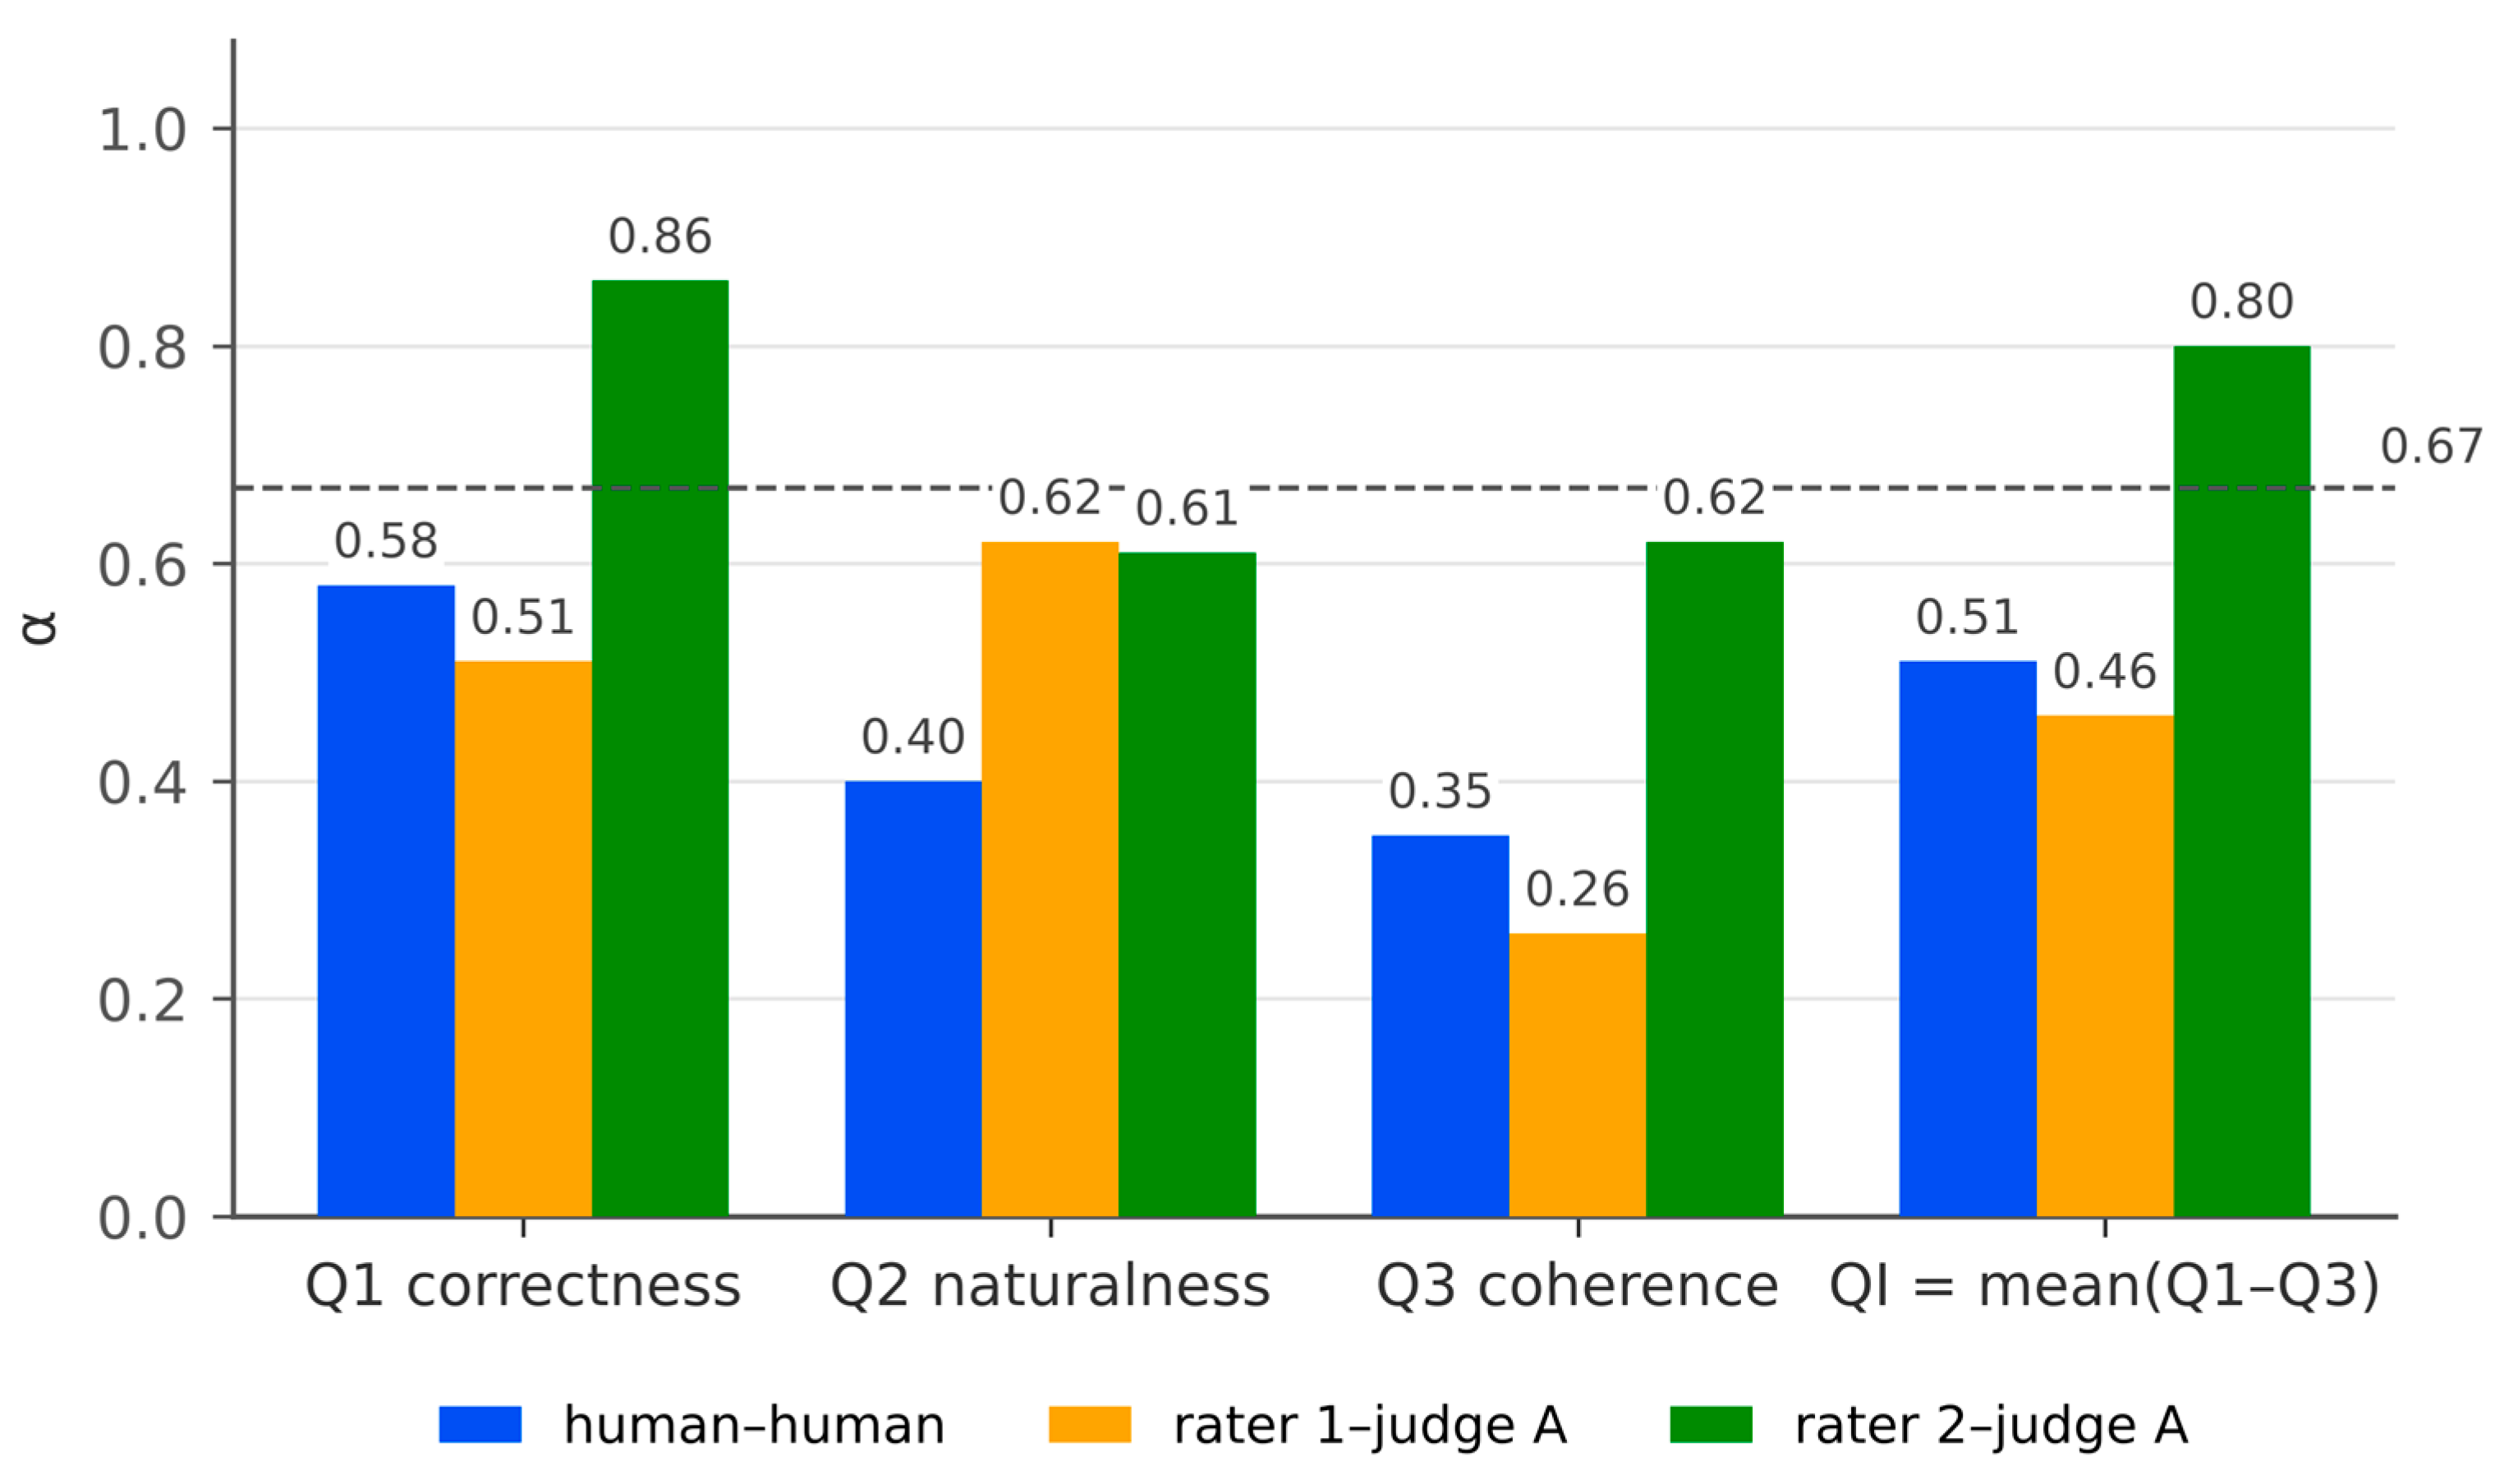
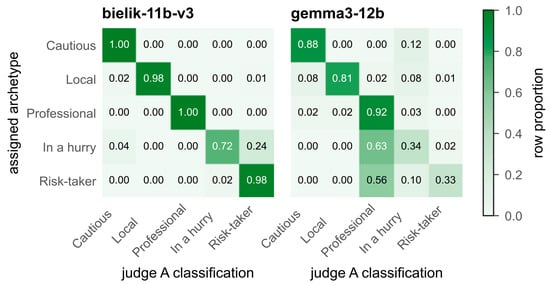
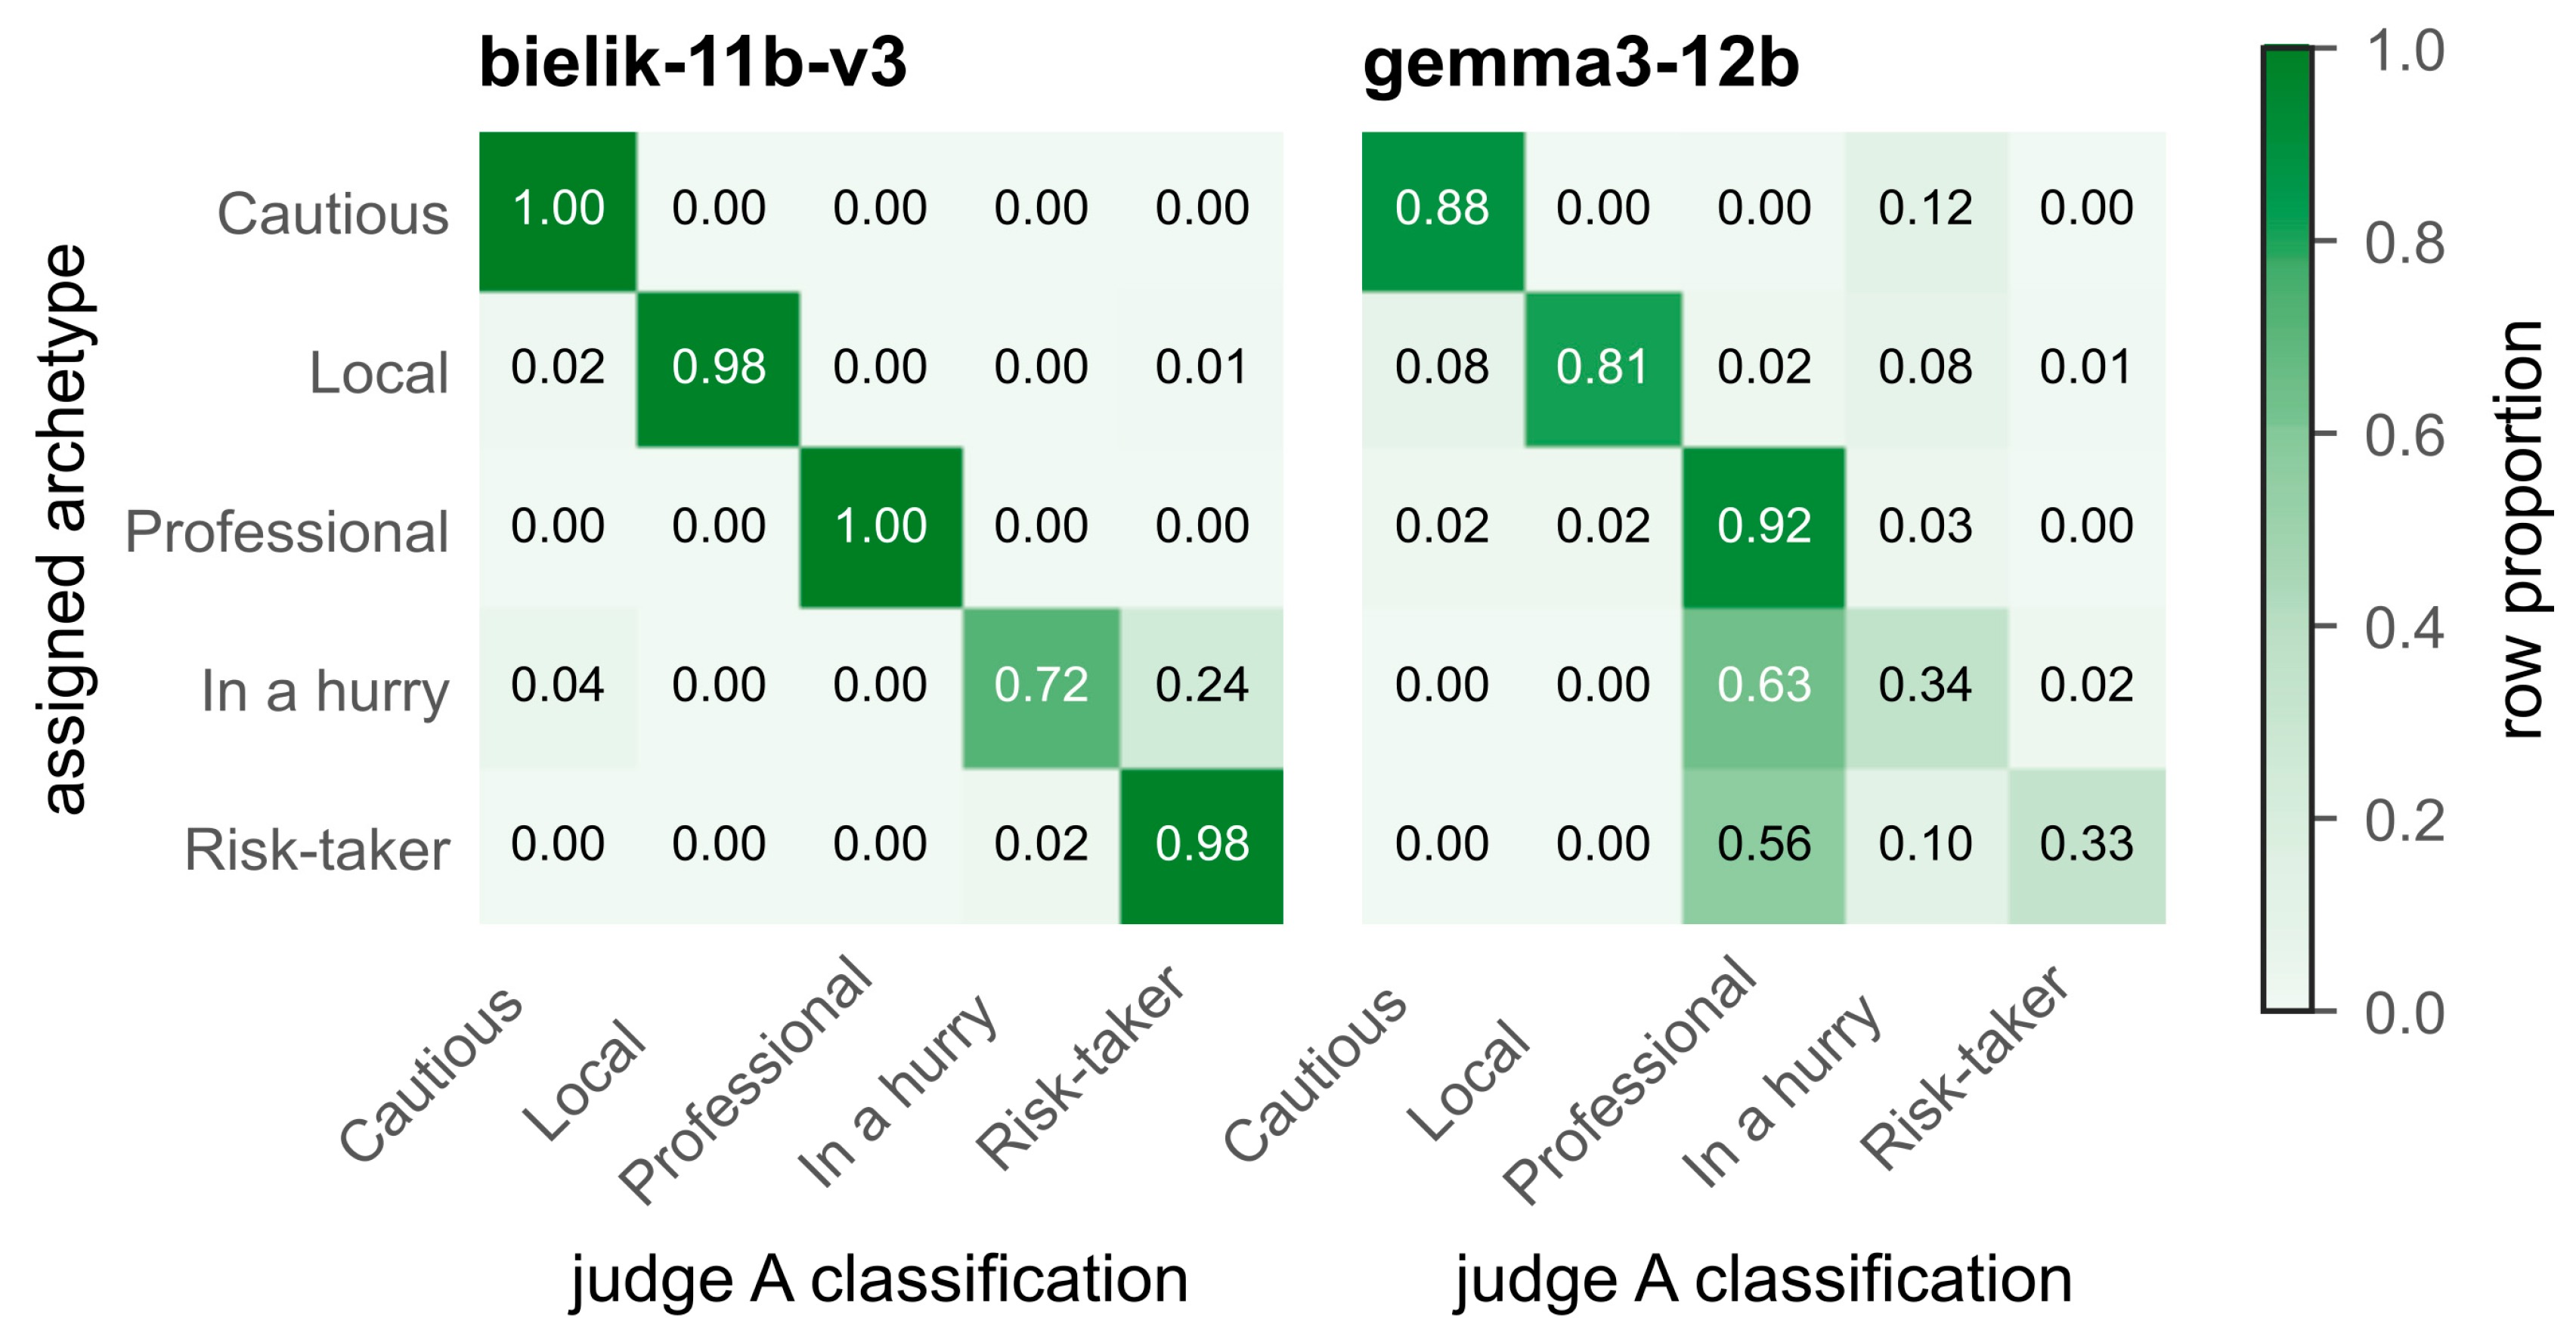
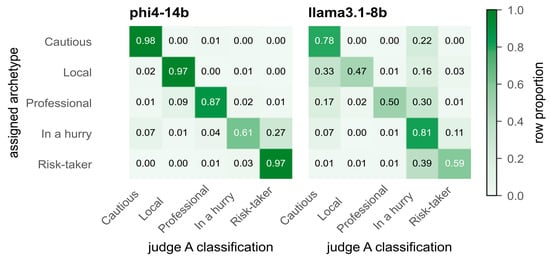
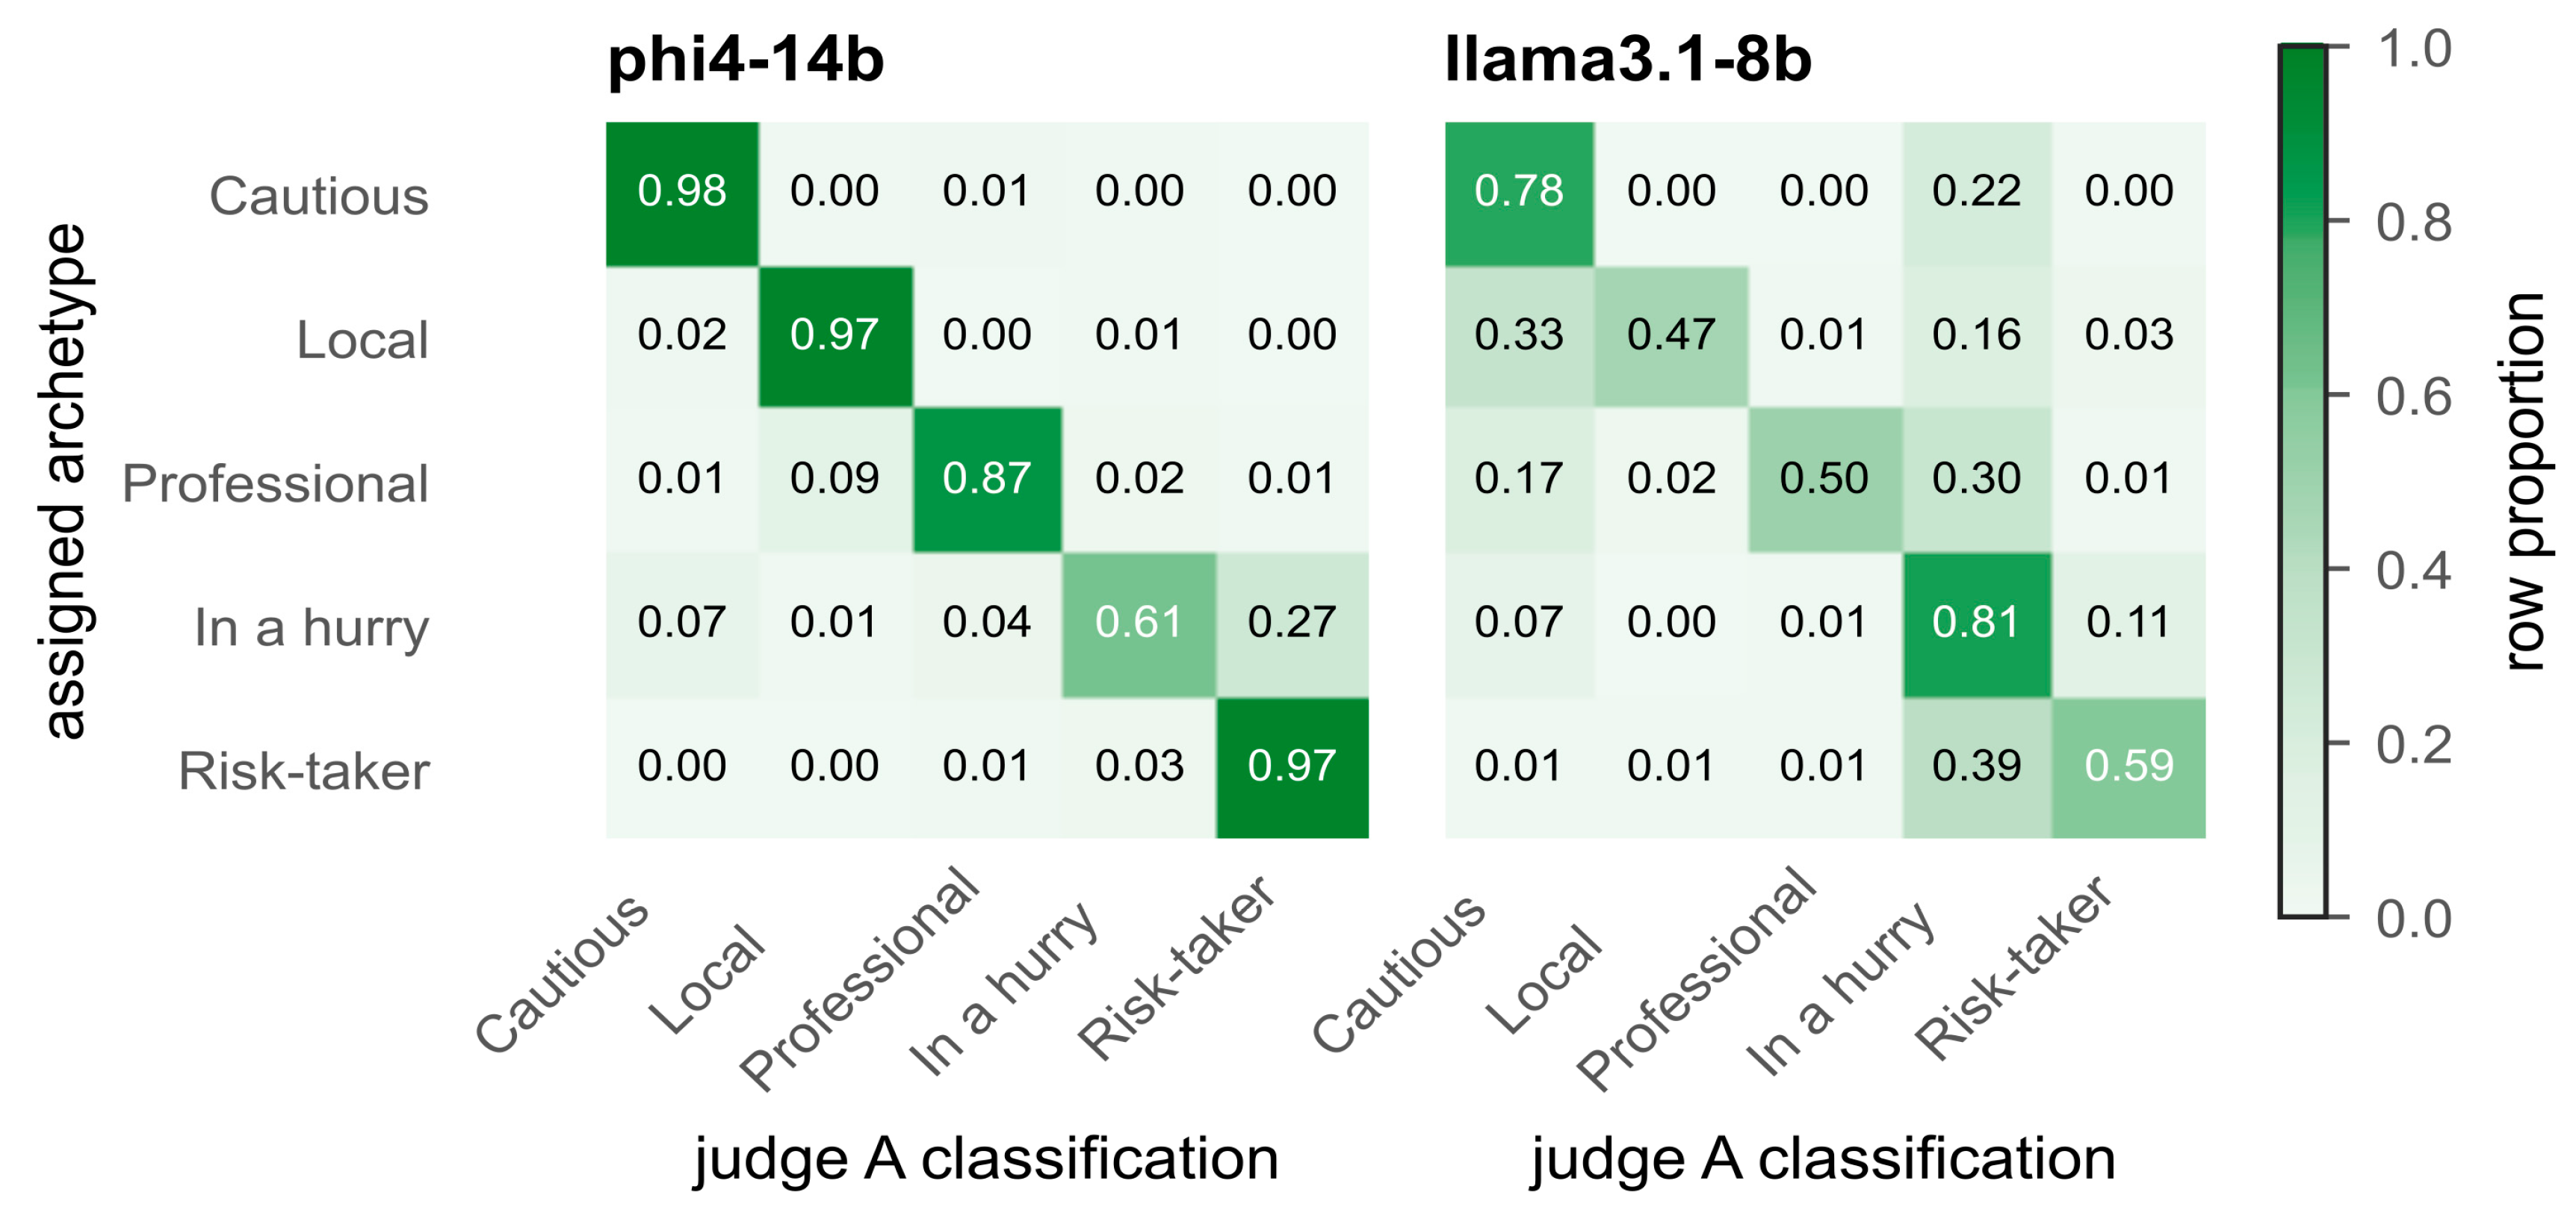
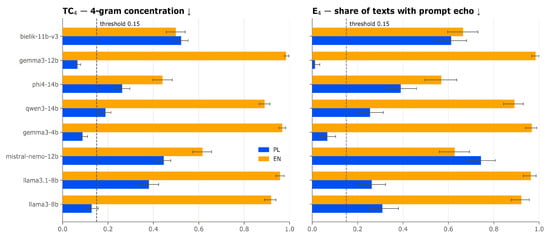
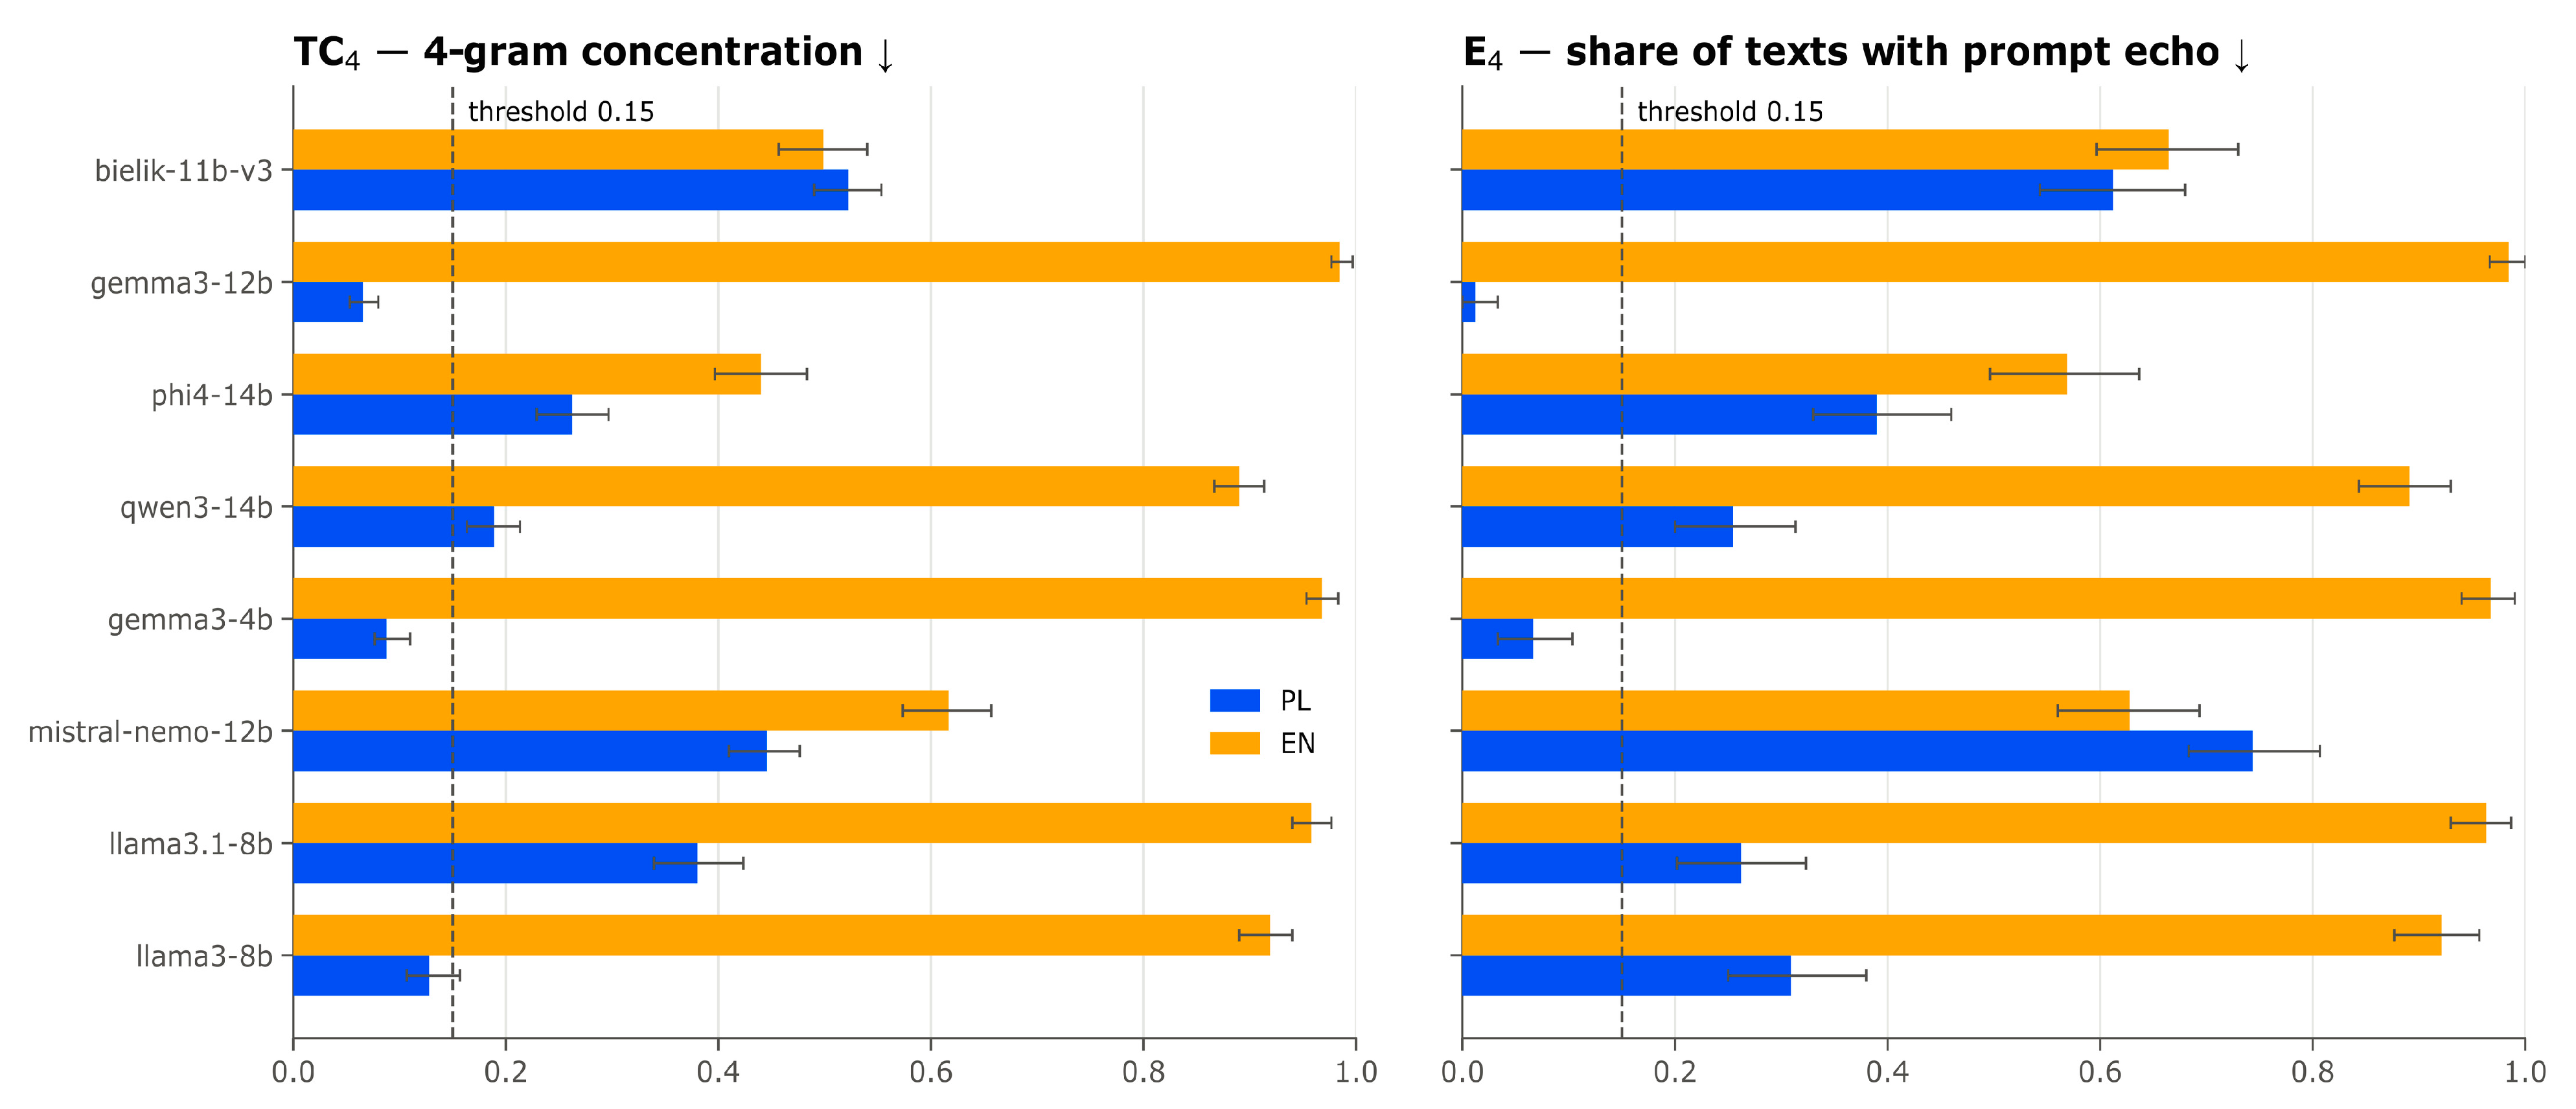
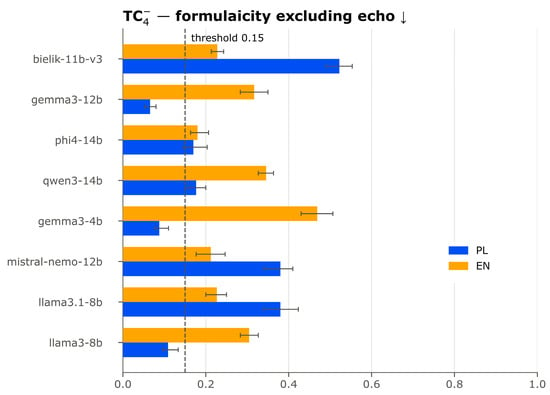
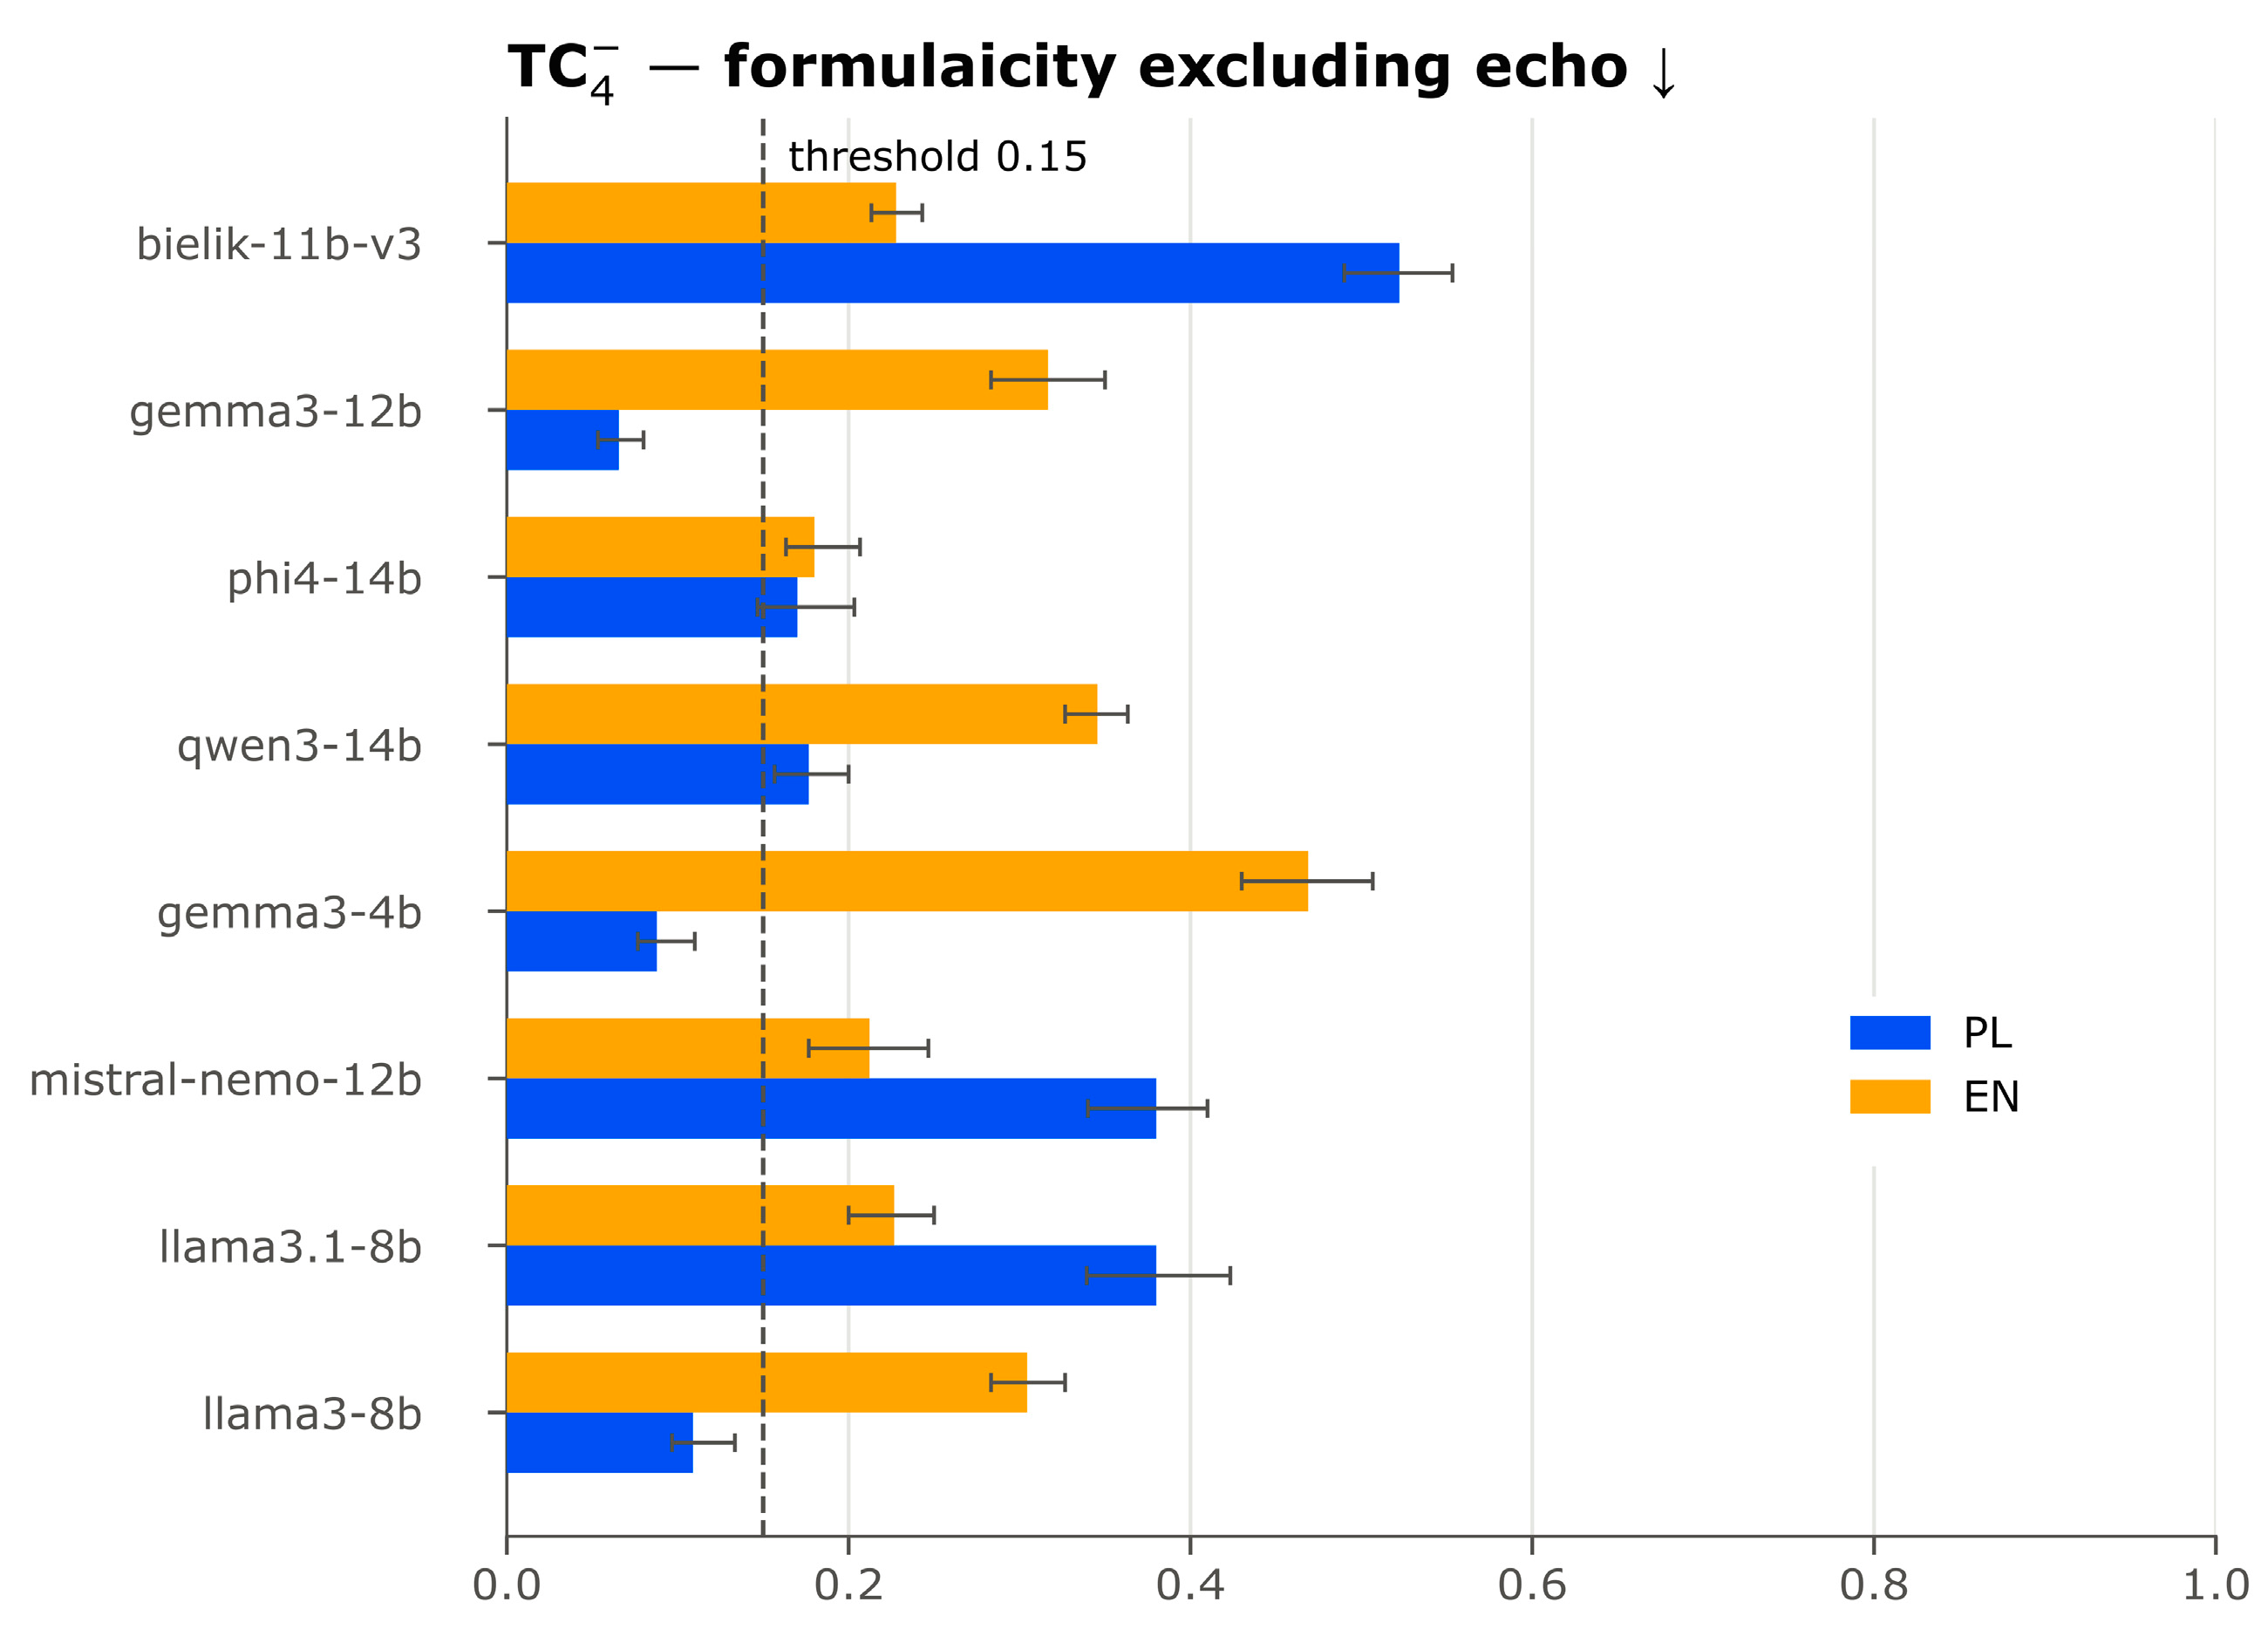
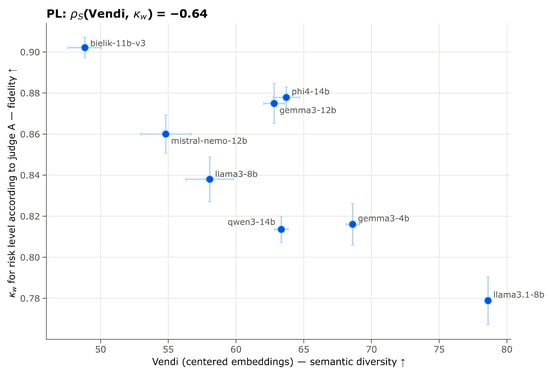
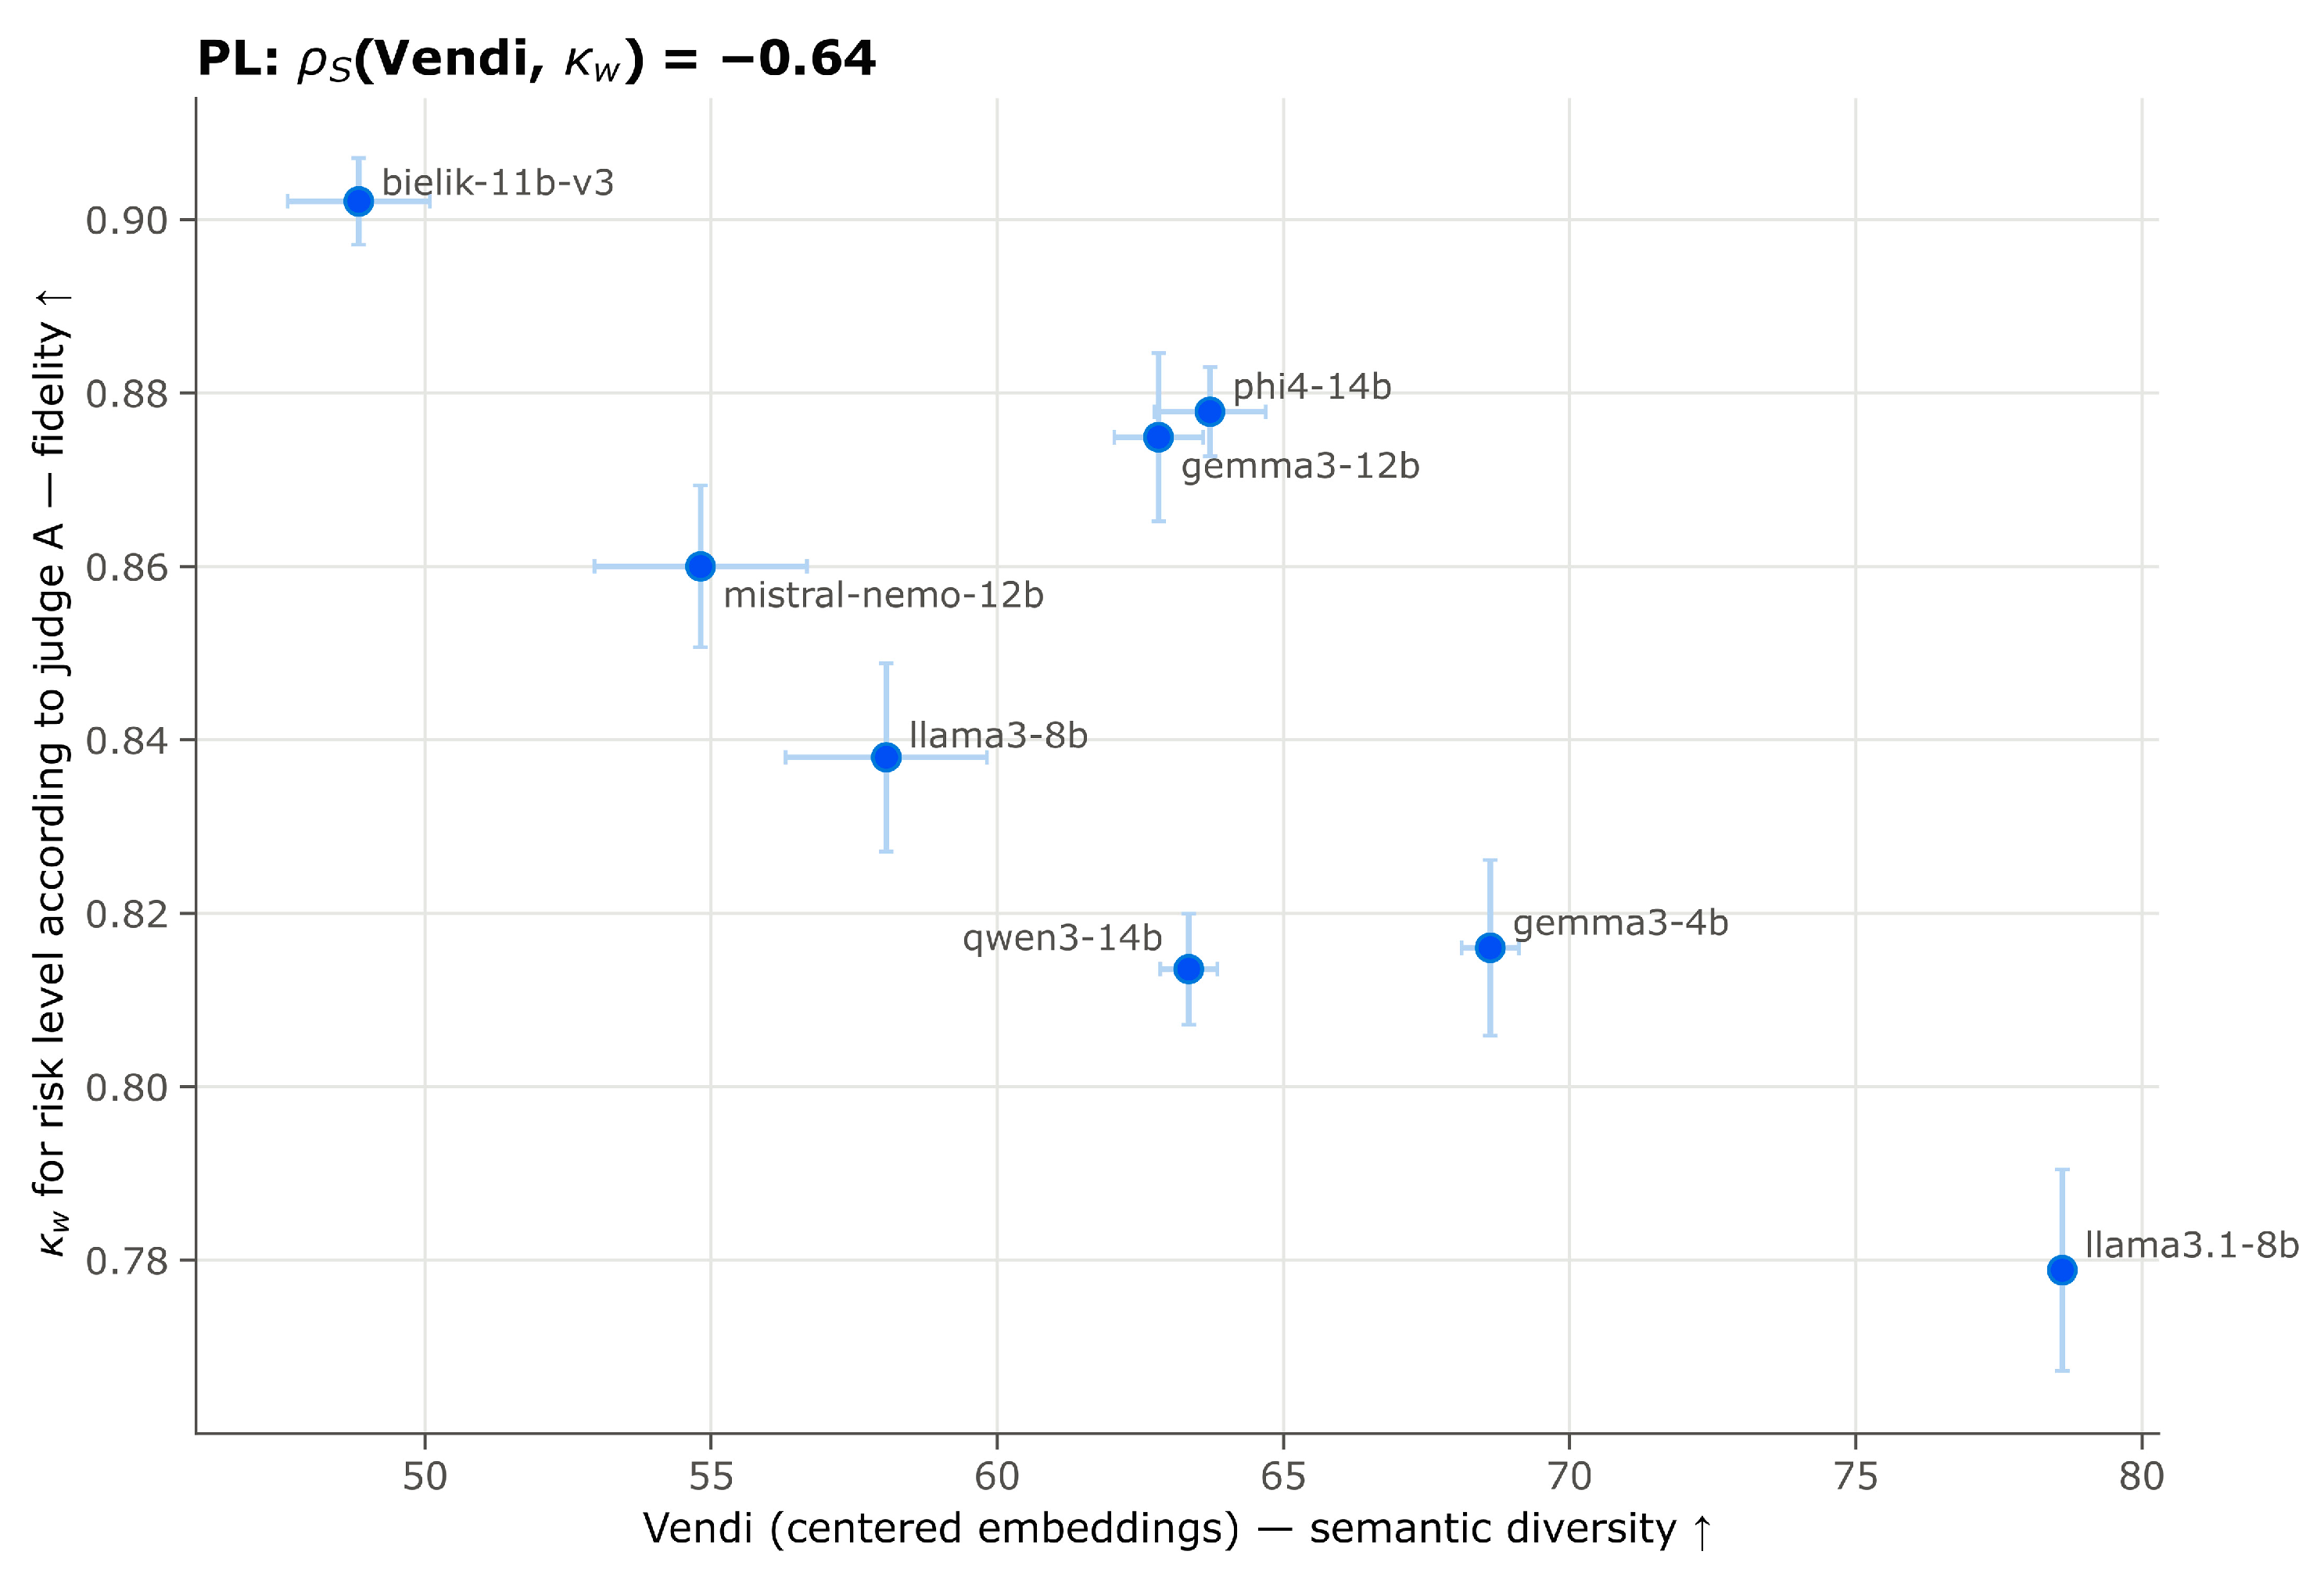
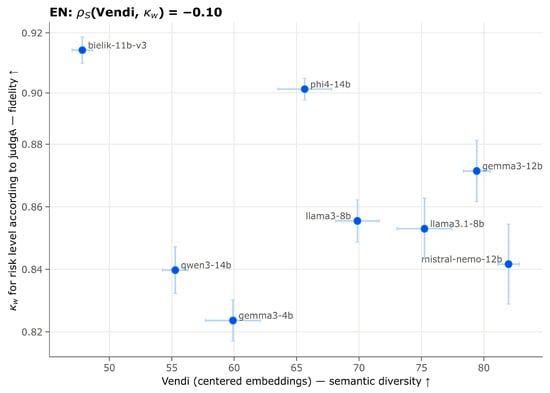
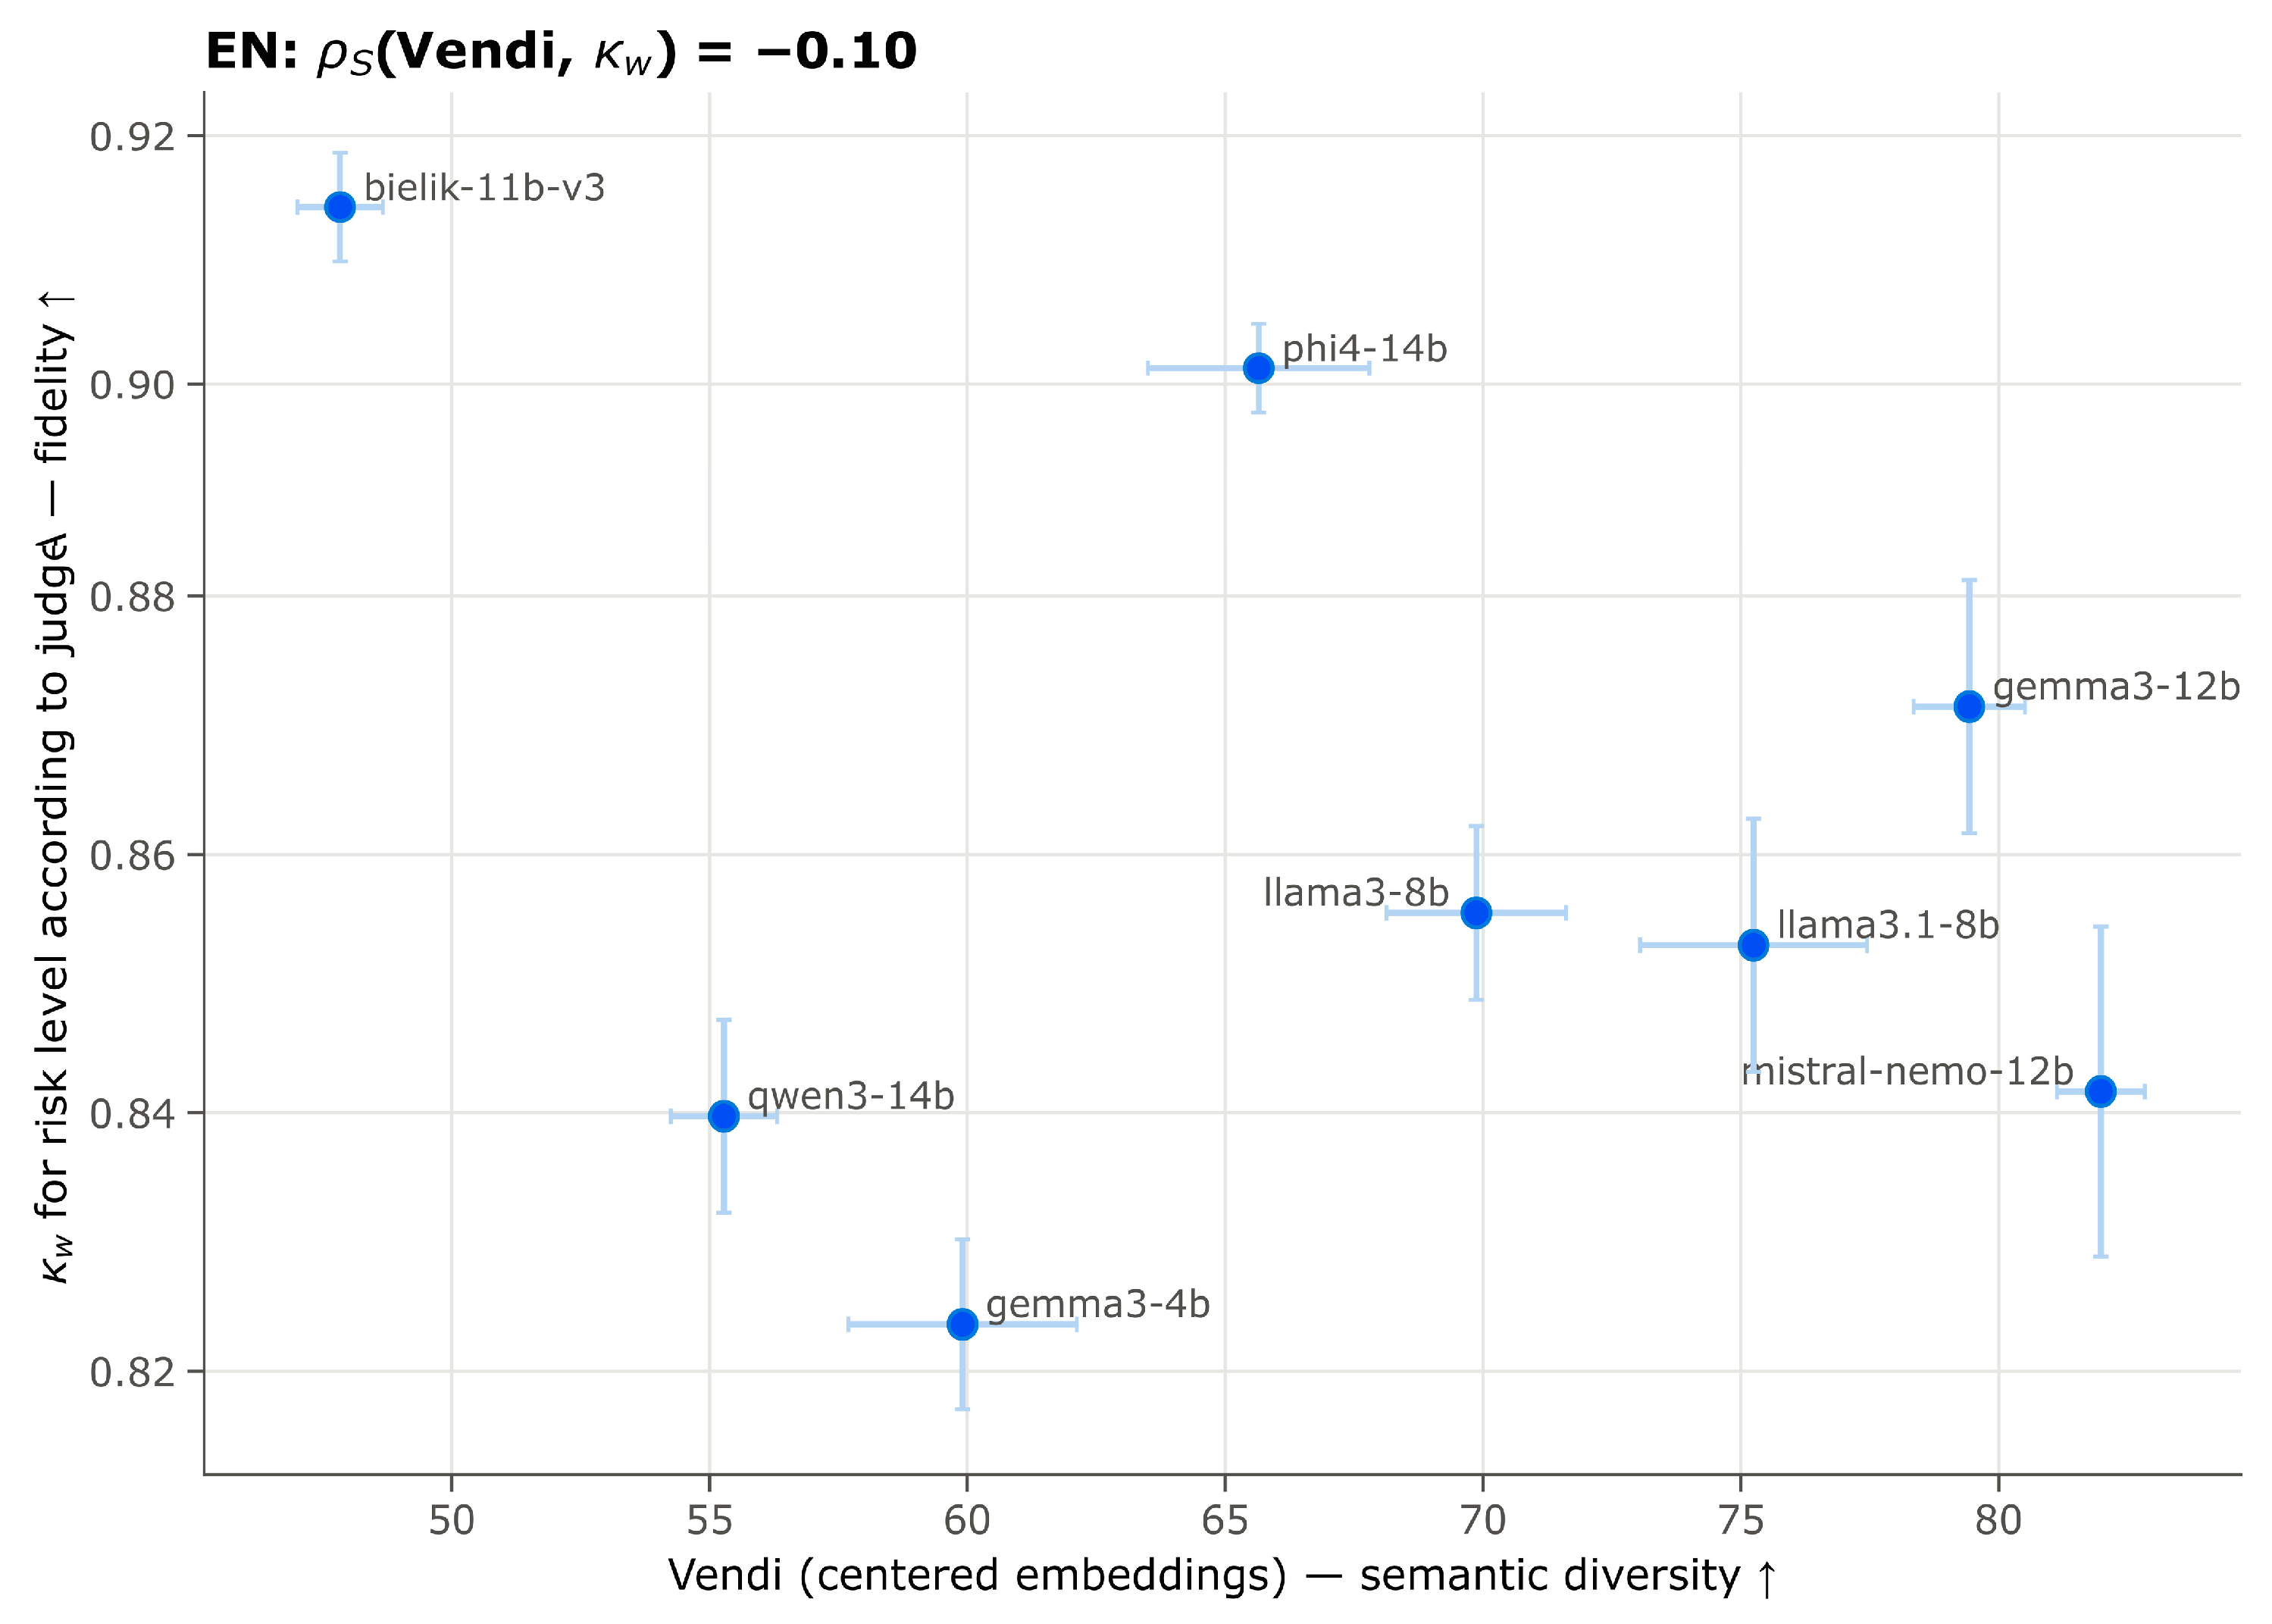
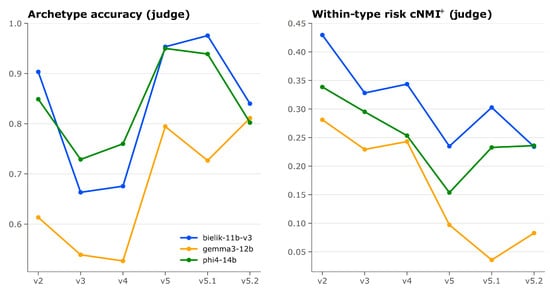
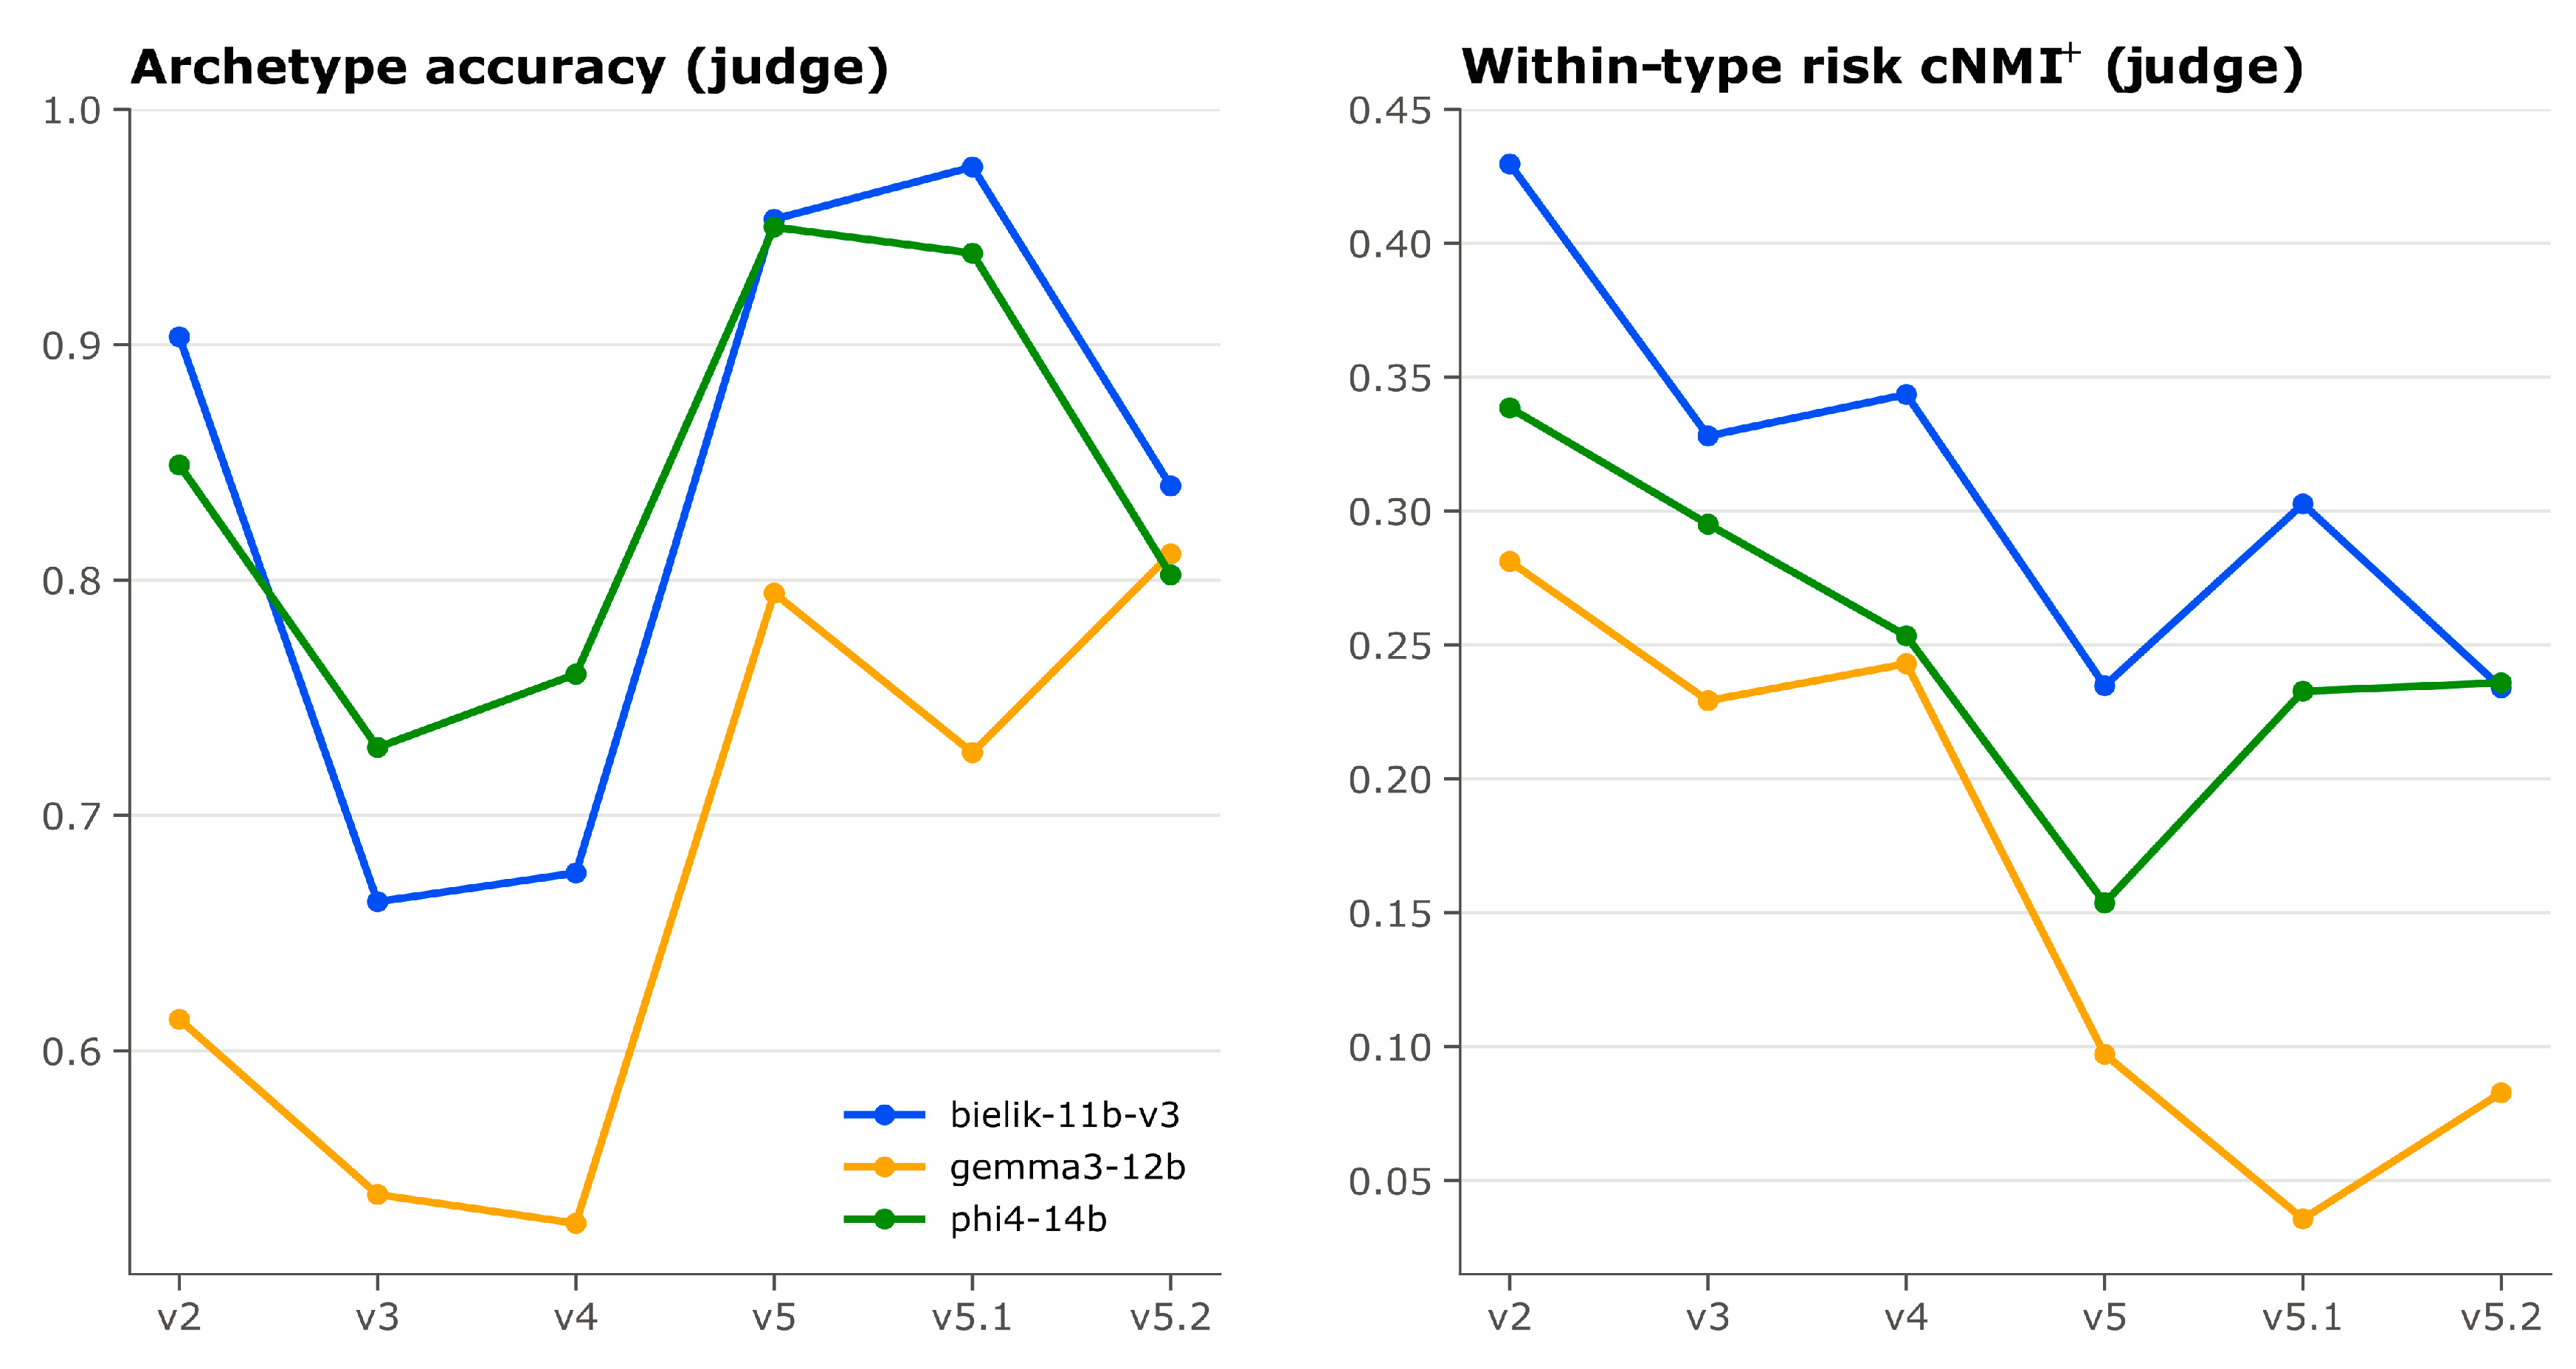
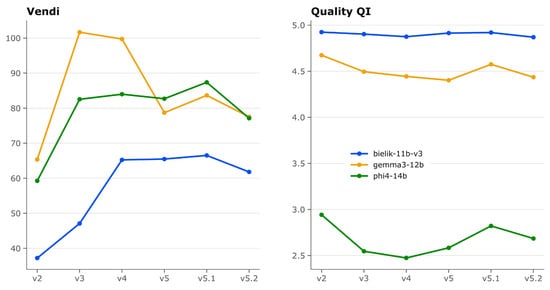
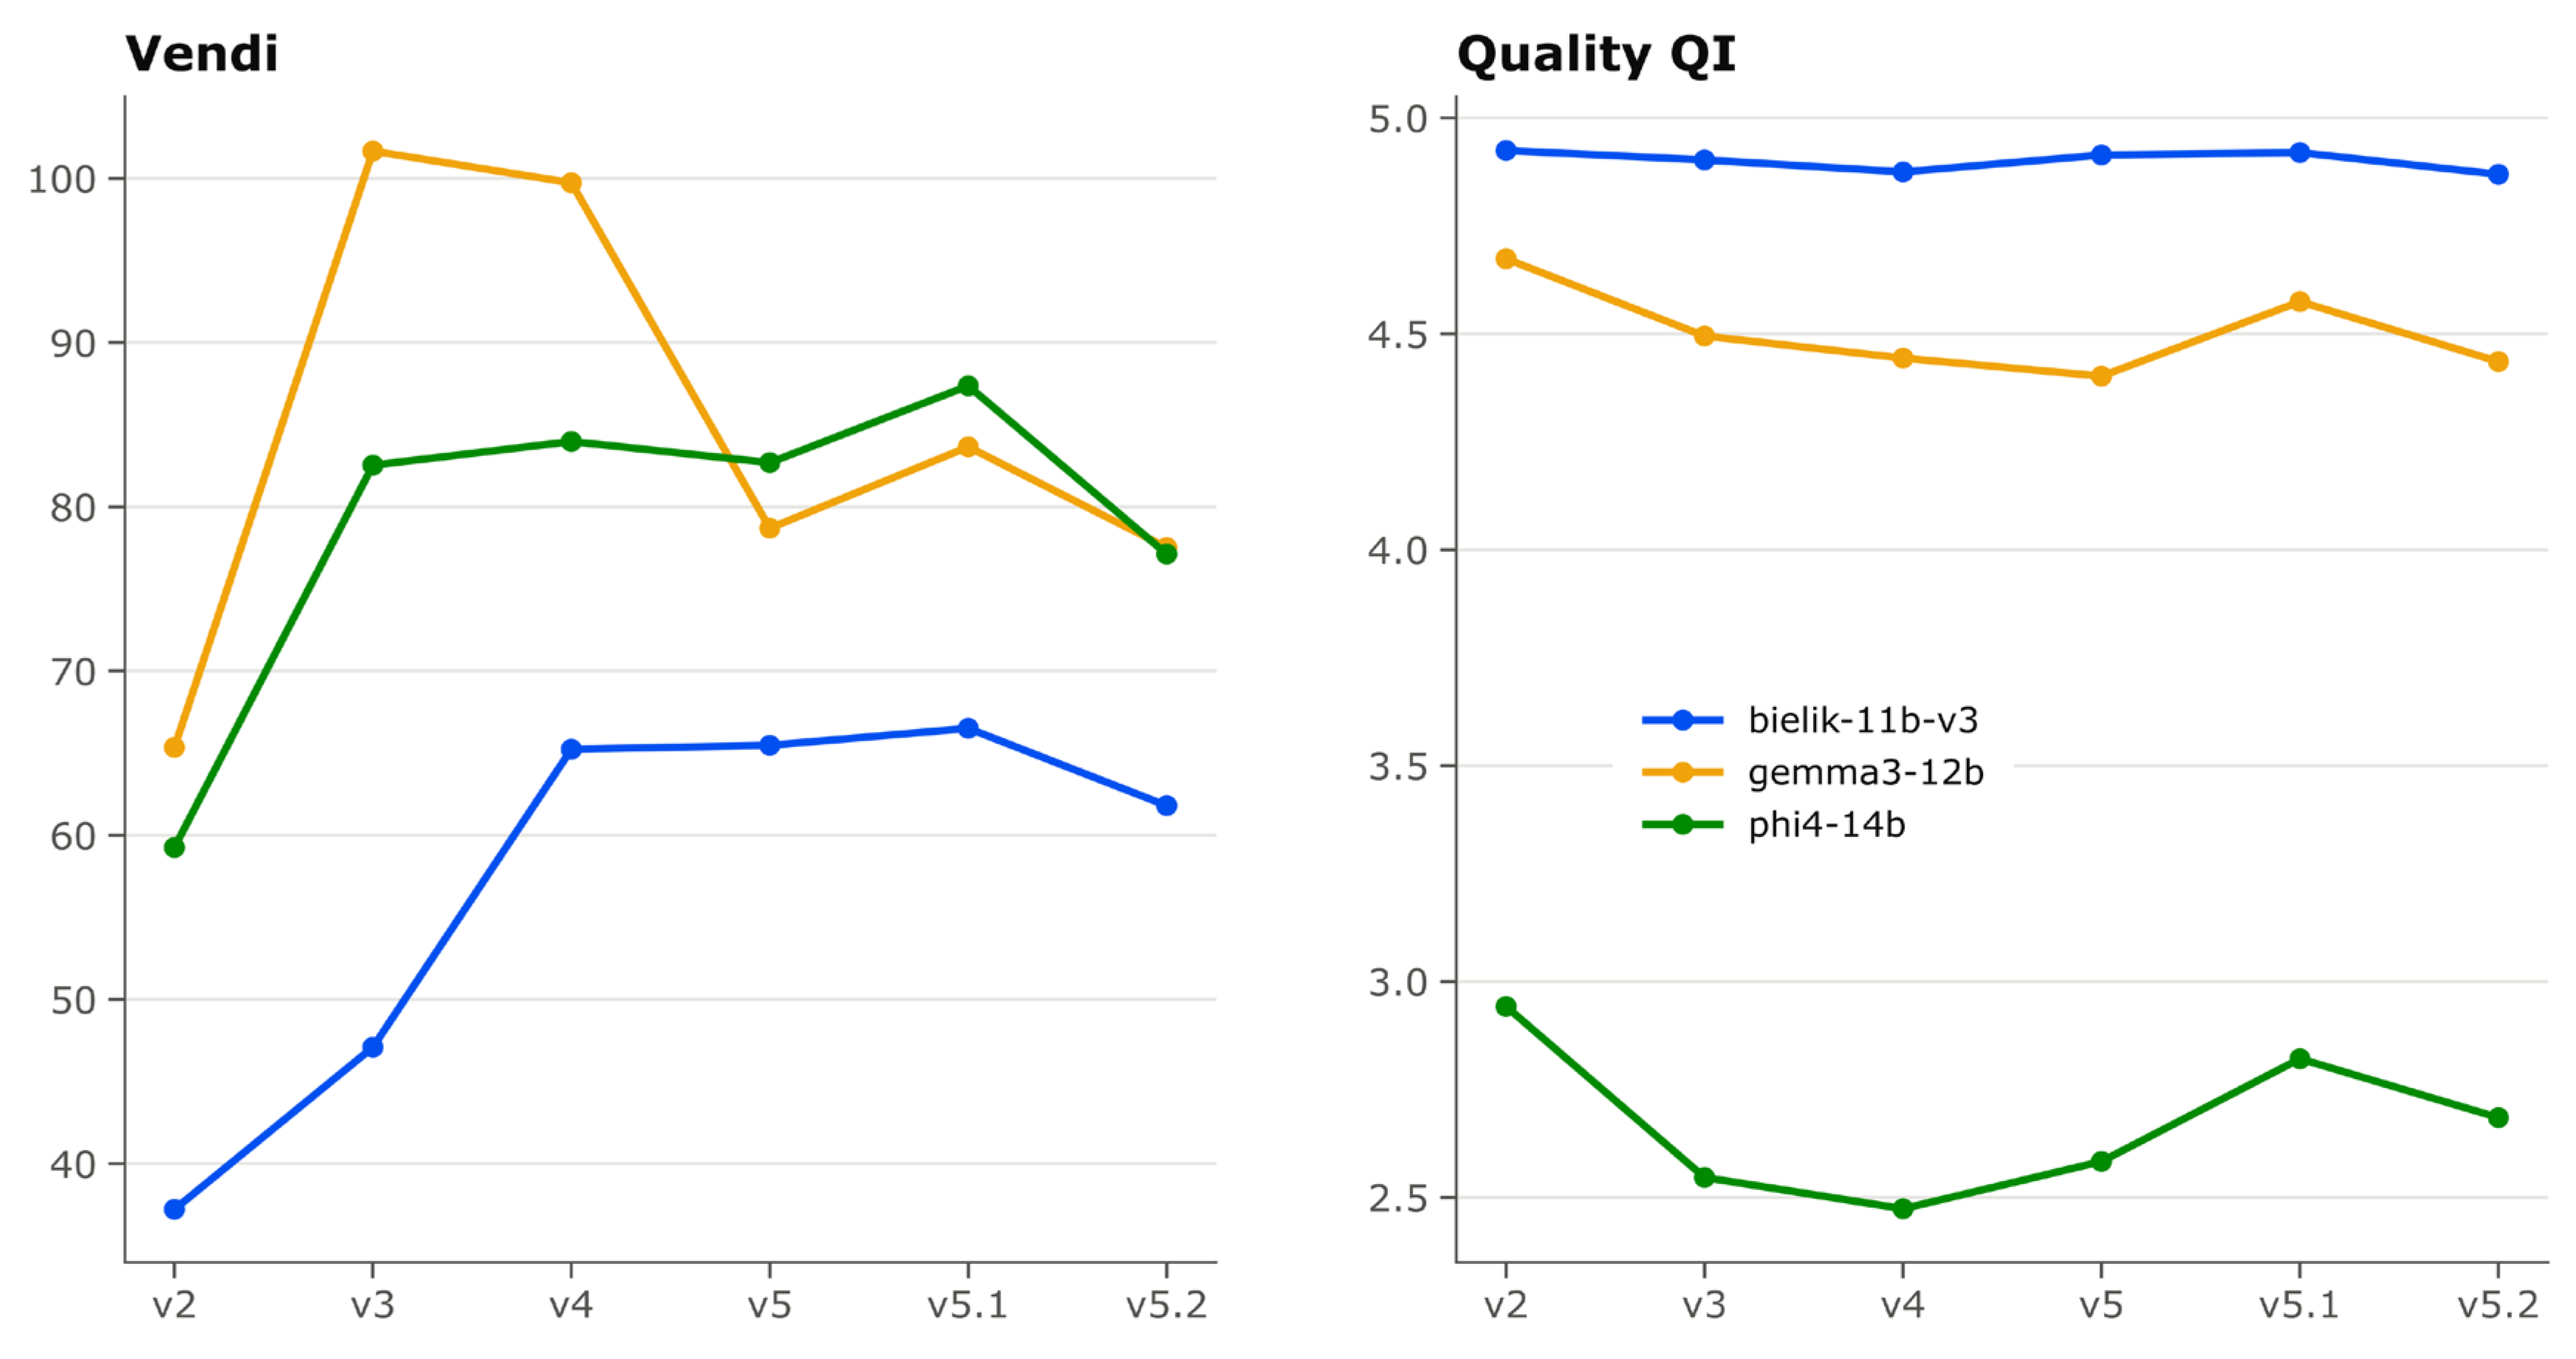
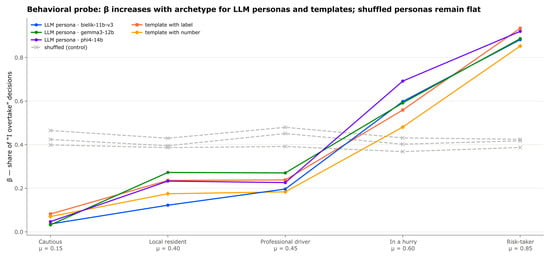
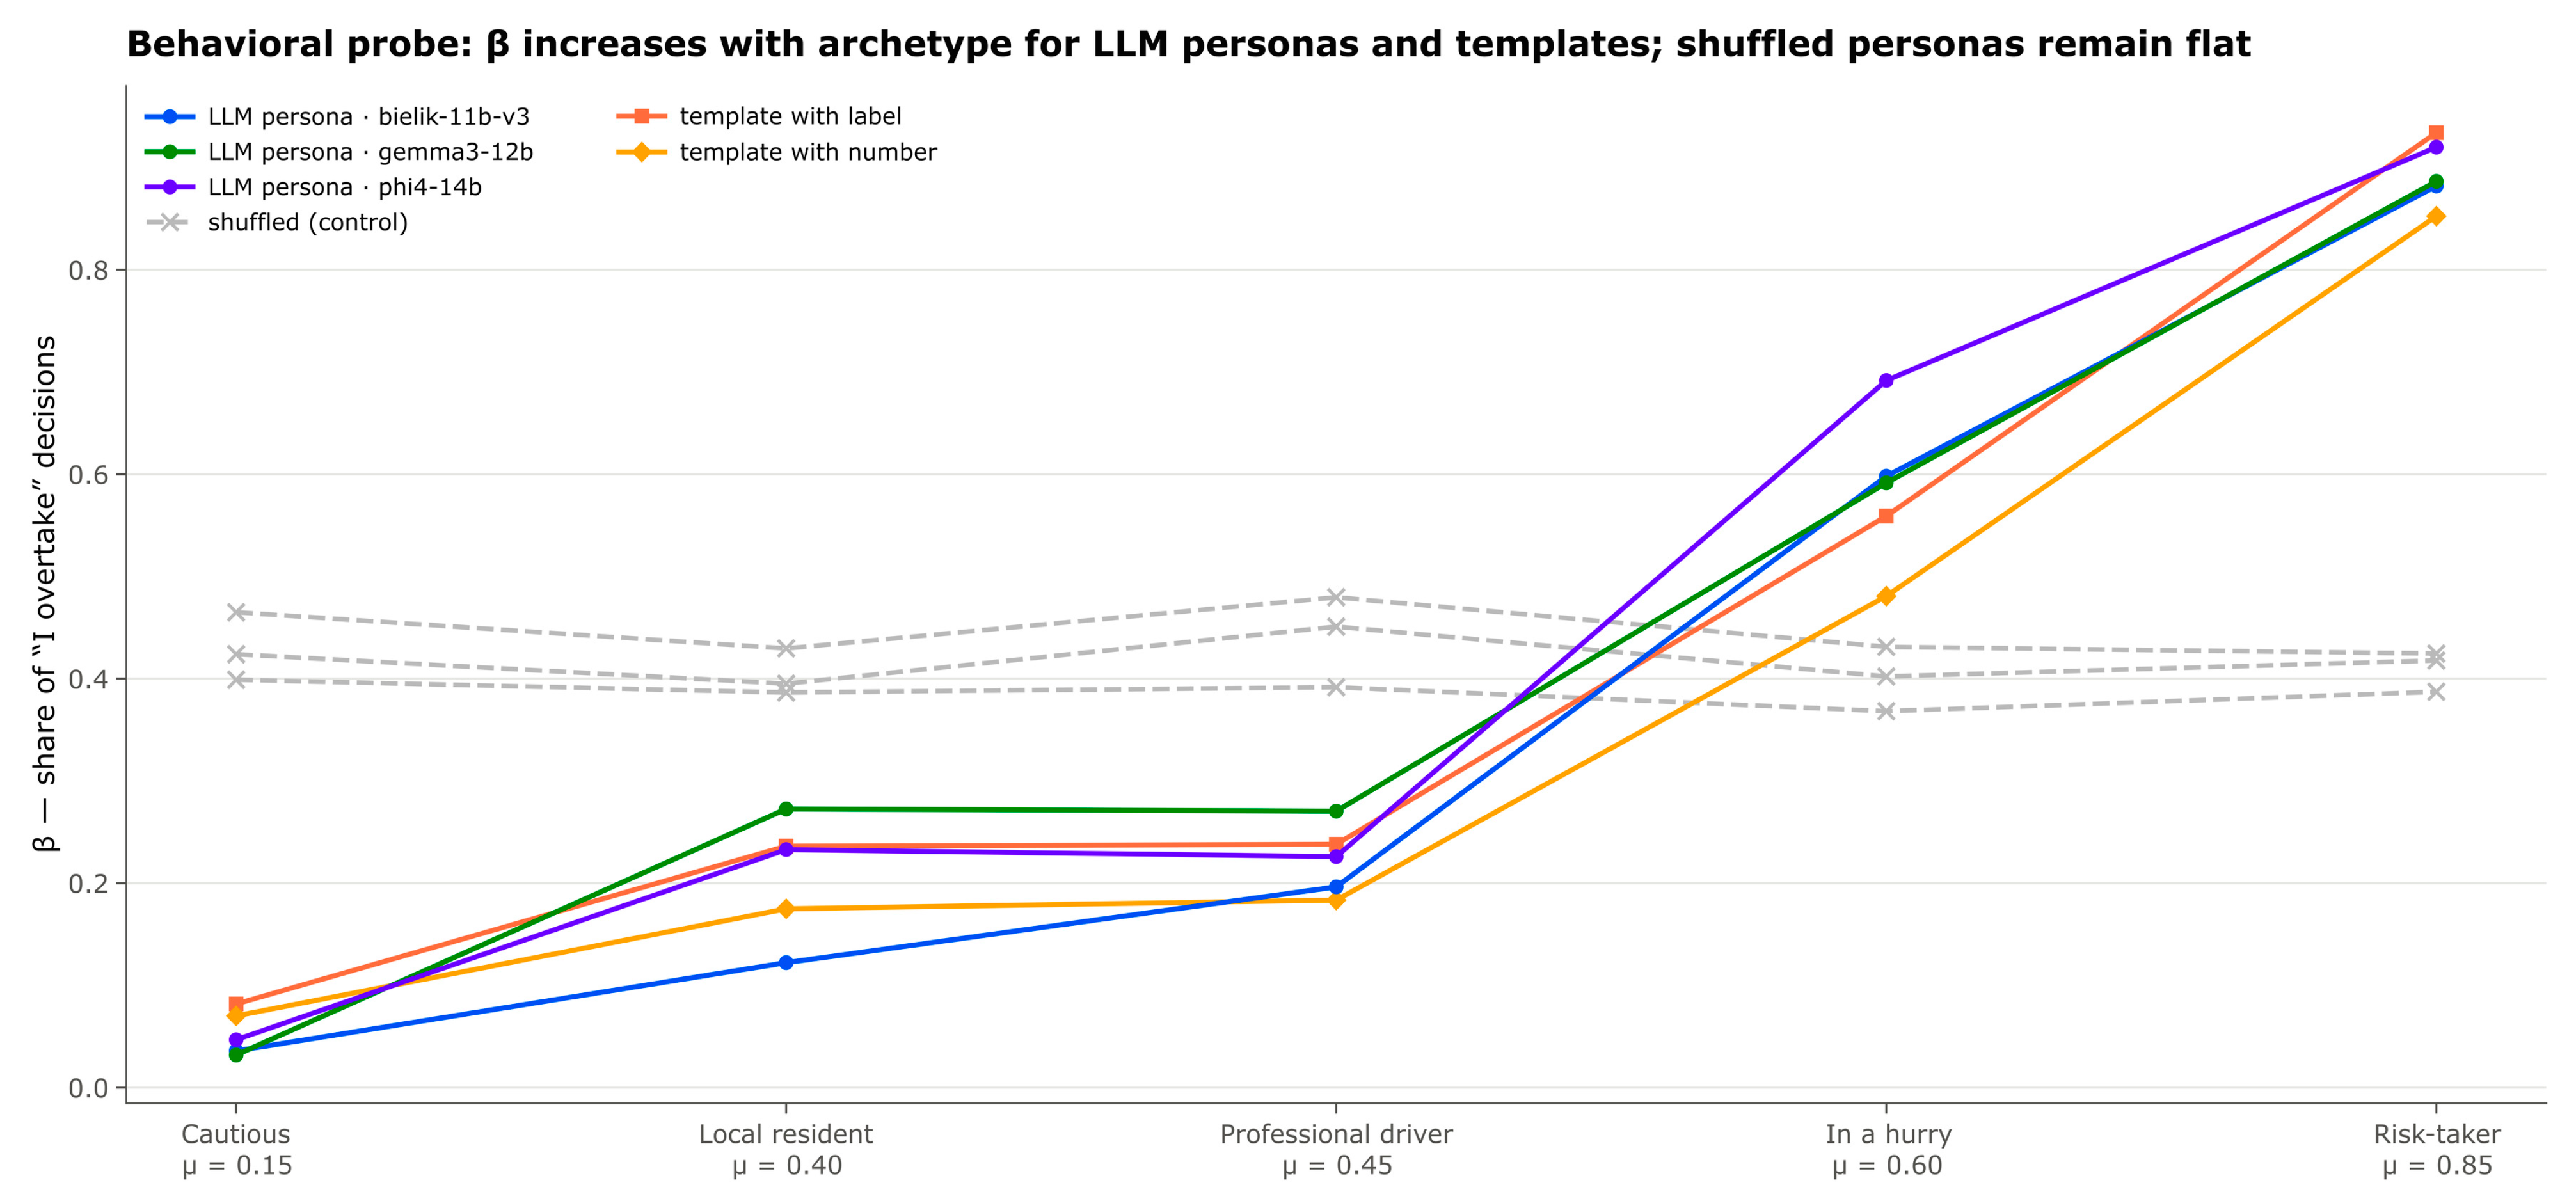
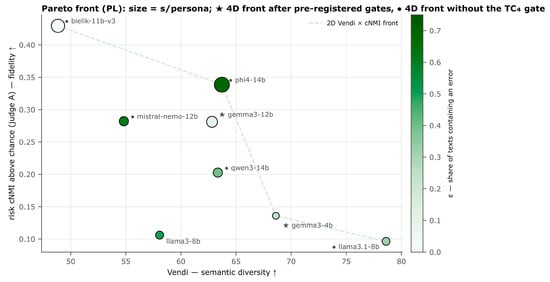
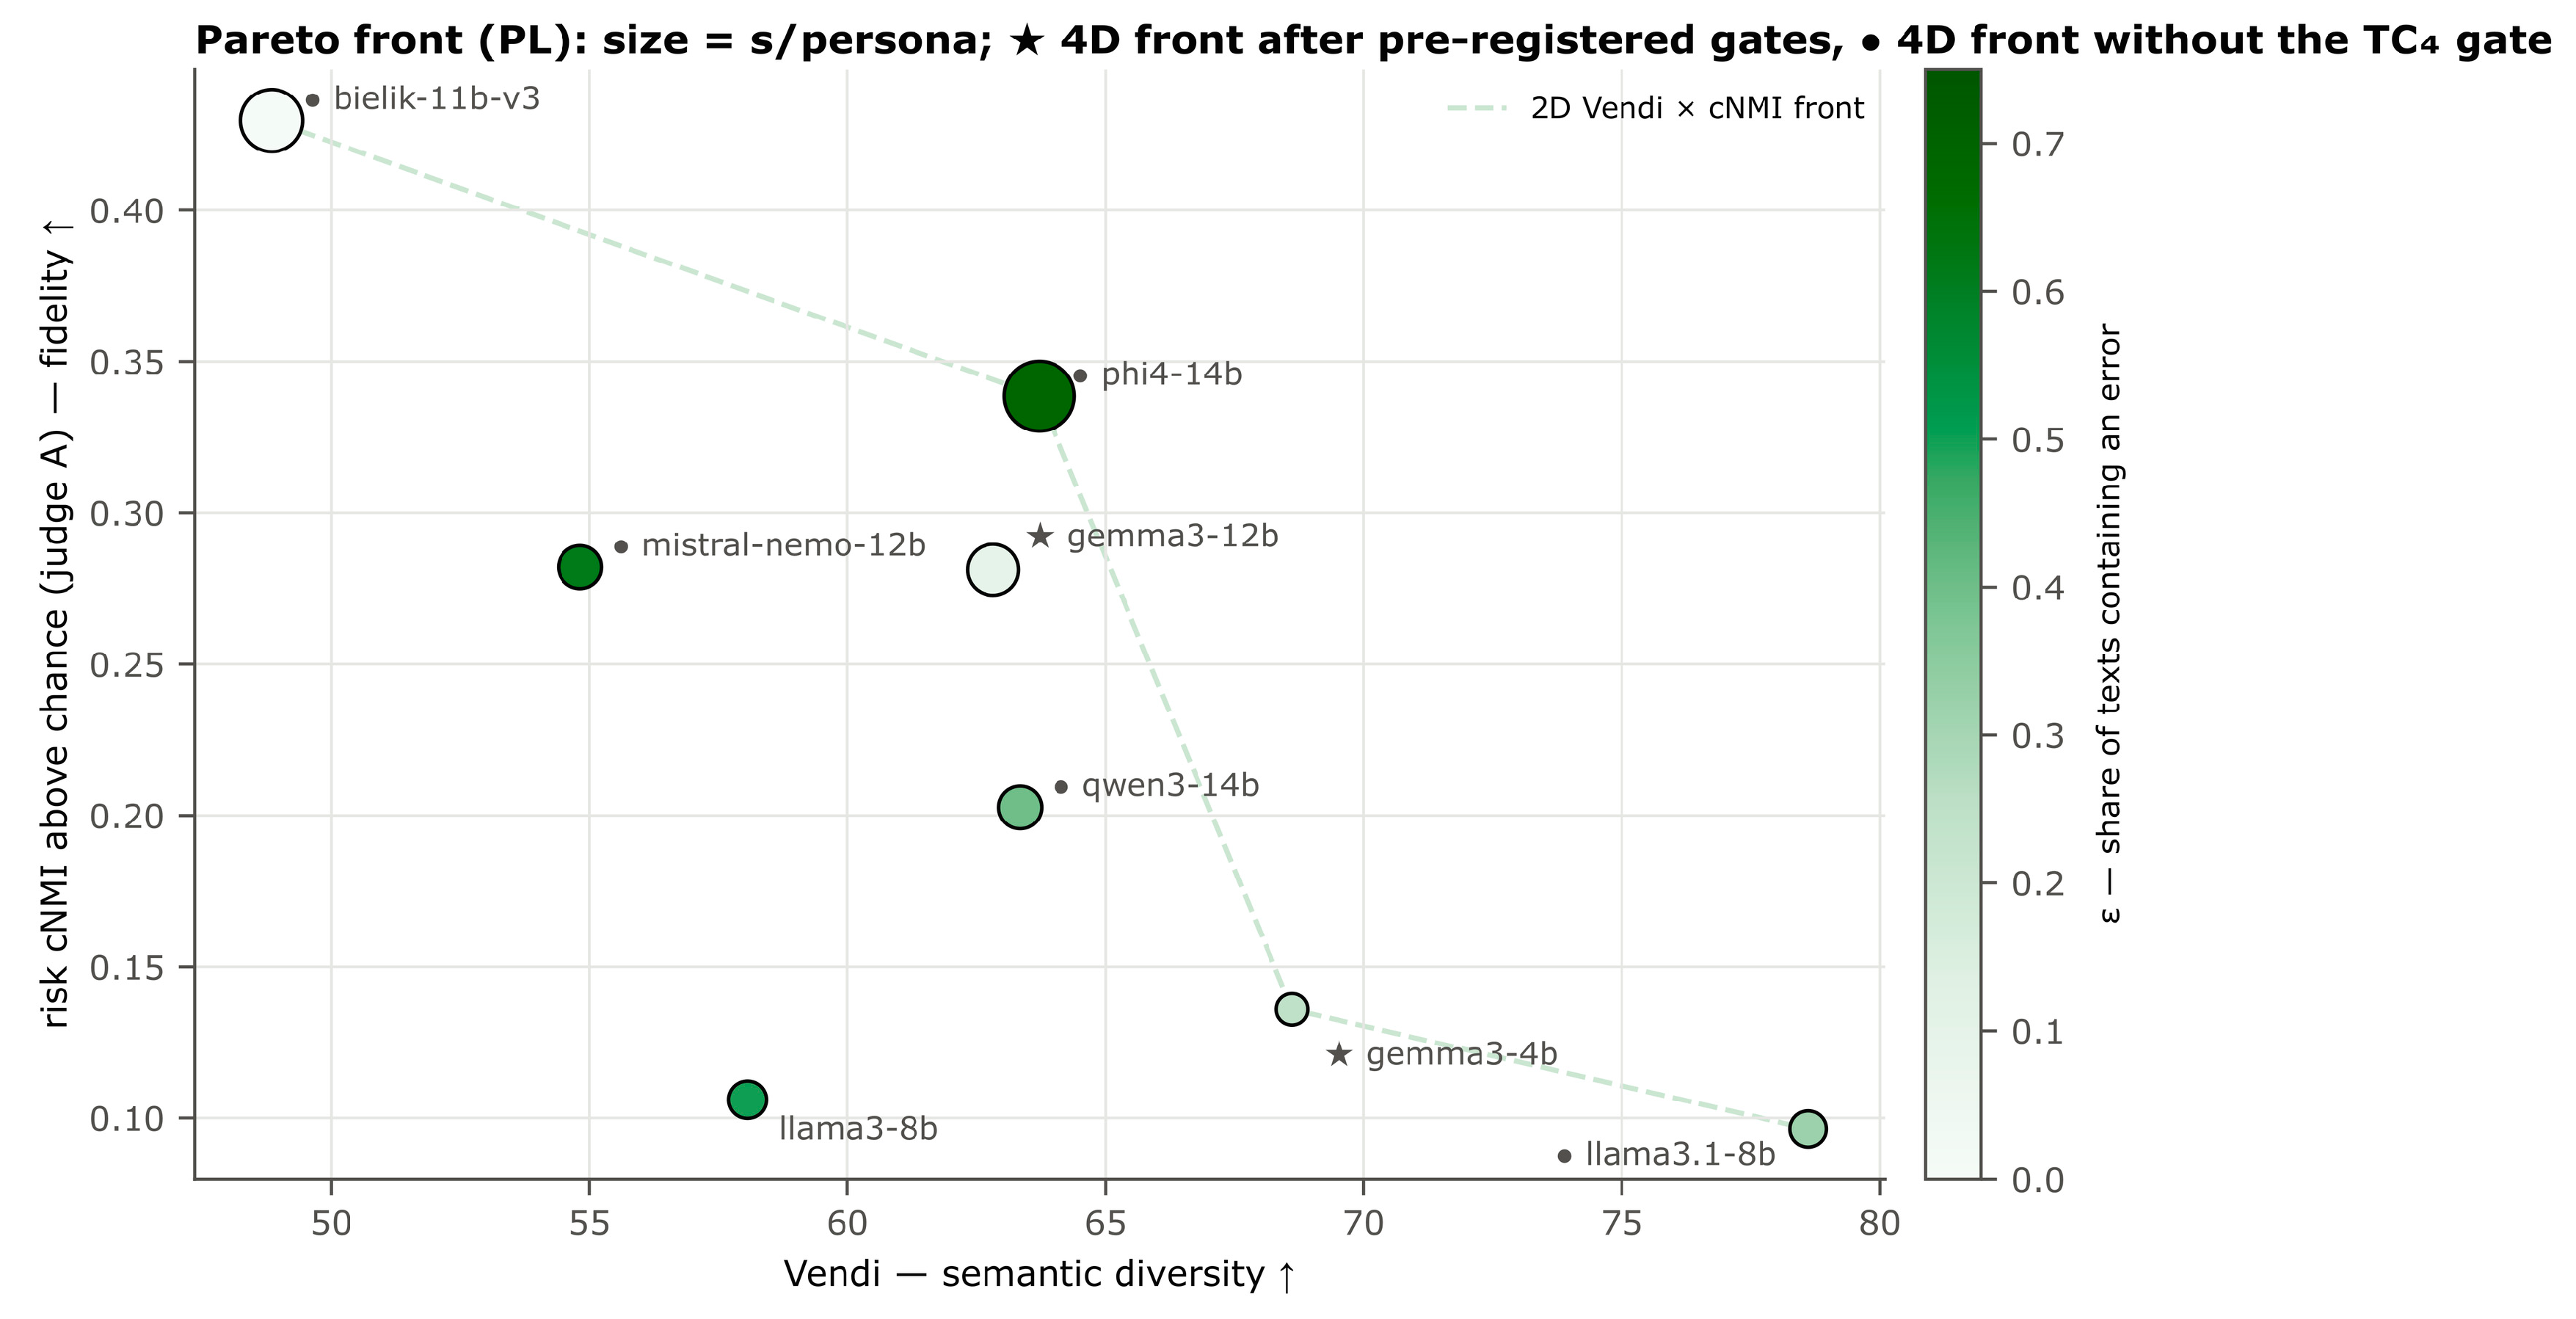

Disclaimer/Publisher’s Note: The statements, opinions and data contained in all publications are solely those of the individual author(s) and contributor(s) and not of MDPI and/or the editor(s). MDPI and/or the editor(s) disclaim responsibility for any injury to people or property resulting from any ideas, methods, instructions or products referred to in the content. |
© 2026 by the authors. Licensee MDPI, Basel, Switzerland. This article is an open access article distributed under the terms and conditions of the Creative Commons Attribution (CC BY) license.