


Abstract
Flood detention areas (FDAs) are essential components of basin-scale flood risk management, but they represent particularly critical conflict zones between socioeconomic development and flood safety in highly urbanized basins dominated by major metropolitan areas, such as the Haihe River Basin (HRB). These tensions are primarily manifested through land use transitions, yet the long-term dynamics of land use and associated ecosystem service value (ESV) remain insufficiently understood on an annual scale. Based on 30 m annual land use data, we assessed all 28 FDAs in the HRB from 1985 to 2024 using a regionally adjusted equivalent factor method. Cropland remained the dominant land use type but declined from 9217 to 7870 km2, whereas impervious surfaces increased from 1198 to 2417 km2. Equivalent-factor-based ESV exhibited marked fluctuations and decreased from 83.82 × 10⁸ CNY in 1985 to 75.91 × 10⁸ CNY in 2024. Overall ESV declined by 9.43%, but its drivers varied among periods. Changes in valuation coefficients dominated ESV dynamics before 2015, whereas land use change became the dominant driver after 2015, during a period of continued cropland loss and impervious-surface expansion. Despite substantial improvements in water-body ecosystem services driven by ecological water replenishment policies, the overall ESV of FDAs in the HRB declined by 9.43%, mainly due to cropland conversion to impervious surfaces, potentially increasing flood risks. These findings reveal a transition from cropland-dominated service accounting towards joint support by cropland and water bodies, and provide a quantitative basis for differentiated land use management and ecological restoration across individual FDAs.
1. Introduction
River floods pose a major threat to both human communities and natural ecosystems, often resulting in severe social, environmental, and economic consequences [1,2]. Between 1980 and 2013, flood events worldwide were associated with direct economic damage exceeding USD 1 trillion and more than two hundred thousand fatalities [3]. Flood detention areas (FDAs) represent one of the most widely adopted non-structural measures for flood mitigation in large river basins worldwide [4]. These designated floodplain spaces form an important component of basin-scale flood risk management [5]. During extreme floods, they can temporarily store excess water, attenuate flood peaks, and reduce risk to downstream settlements and infrastructure [6], thereby reducing peak discharge and protecting downstream urban centers, transportation infrastructure, and industrial assets. The strategic importance of these FDAs has been increasingly recognized, particularly in the context of accelerating climate change [7]. Beyond their primary flood mitigation function, FDAs also serve as important ecological spaces that support diverse ecosystem services, including agricultural production, biodiversity conservation, water purification, groundwater recharge, and carbon sequestration [8]. Land use/cover (LUC) dynamics, ecosystem service changes, and their interactions are important indicators for understanding the balance among flood risk management, socioeconomic development, and ecological conservation in FDAs [9,10].
Such assessments rely heavily on understanding LUC dynamics [11,12]. By transforming ecosystem structures and functions—largely through changes in soil characteristics and the intensity of human activity—LUC shifts directly dictate ecosystem service capacity and value [13]. In recent years, research on these ecological impacts has gradually increased [14], with growing attention being paid to ecosystem service valuation as a tool for sustainable management. In 1997, Costanza et al. [15] estimated the economic value of 17 categories of ecosystem services across 16 global biomes, laying the groundwork for the unified accounting of ecosystem service value (ESV). Following Costanza, Xie et al. [16,17] developed an equivalent factor table tailored to China’s terrestrial ecosystems, which has since been applied across multiple scales—national, provincial [18], basin [19], and urban agglomeration—to characterize spatiotemporal ESV distributions, driving forces, and LUC change impacts. Currently, the most widely used indirect evaluation method is the equivalent coefficient method, which estimates ESV by multiplying the ESV per unit area by the corresponding LUC area. Previous studies have explored ESV assessment [20] and paid attention to the impact of LUC change on the ESV [21], advancing our understanding of ESV dynamics and their relationships with LUC changes [22,23,24,25]. Despite these advances, comprehensive assessments of ESV dynamics in response to LUC changes remain limited in FDAs. FDAs represent a distinct category of floodplain landscapes where LUC patterns are shaped not only by urbanization and ecological restoration but also by episodic flood storage operations that introduce unique disturbance regimes. Moreover, most existing ESV studies rely on LUC data collected at five- to ten-year intervals, which may fail to capture rapid LUC transitions driven by urbanization and ecological policies. Annual-scale assessments at the individual FDA level are therefore needed to identify trend breaks and support the design of differentiated management. Furthermore, substantial heterogeneity exists among FDA characteristics, highlighting the need for systematic classification to inform targeted management strategies. However, existing studies have paid limited attention to identifying distinct patterns of ESV changes across FDAs and quantifying their underlying drivers.
The Beijing–Tianjin–Hebei region, a major political and economic center of China [26], lies largely within the Haihe River Basin (HRB), where 28 FDAs play a critical role in regional flood risk reduction. However, rapid urbanization and socioeconomic development in the HRB over the past four decades have significant altered LUC patterns within FDAs [27], potentially intensifying trade-offs among flood protection, agricultural production, and ecological conservation and highlighting the need for systematic quantitative assessment.
Therefore, this study aims to fill this gap by providing a comprehensive, annual-scale assessment of LUC transitions and ESV dynamics across all 28 FDAs in the HRB over 40 years (1985–2024). Specifically, we (1) characterize LUC transitions among nine LUC types using annual 30 m resolution datasets; (2) quantify spatiotemporal ESV dynamics using an adjusted equivalent factor method that incorporates provincial-scale variation; (3) identify groups of FDAs with similar temporal trajectories using K-Means clustering; and (4) use Shapley value decomposition to separate LUC effects from equivalent-factor effects. The findings of this study can provide baseline evidence for differentiated land management, ecological conservation, and future assessments of FDA operation and compensation.
2. Materials and Methods
2.1. Study Area
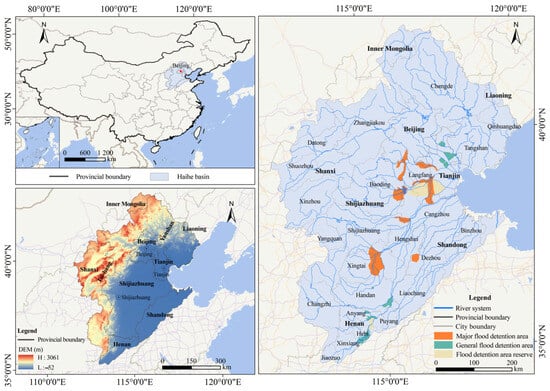
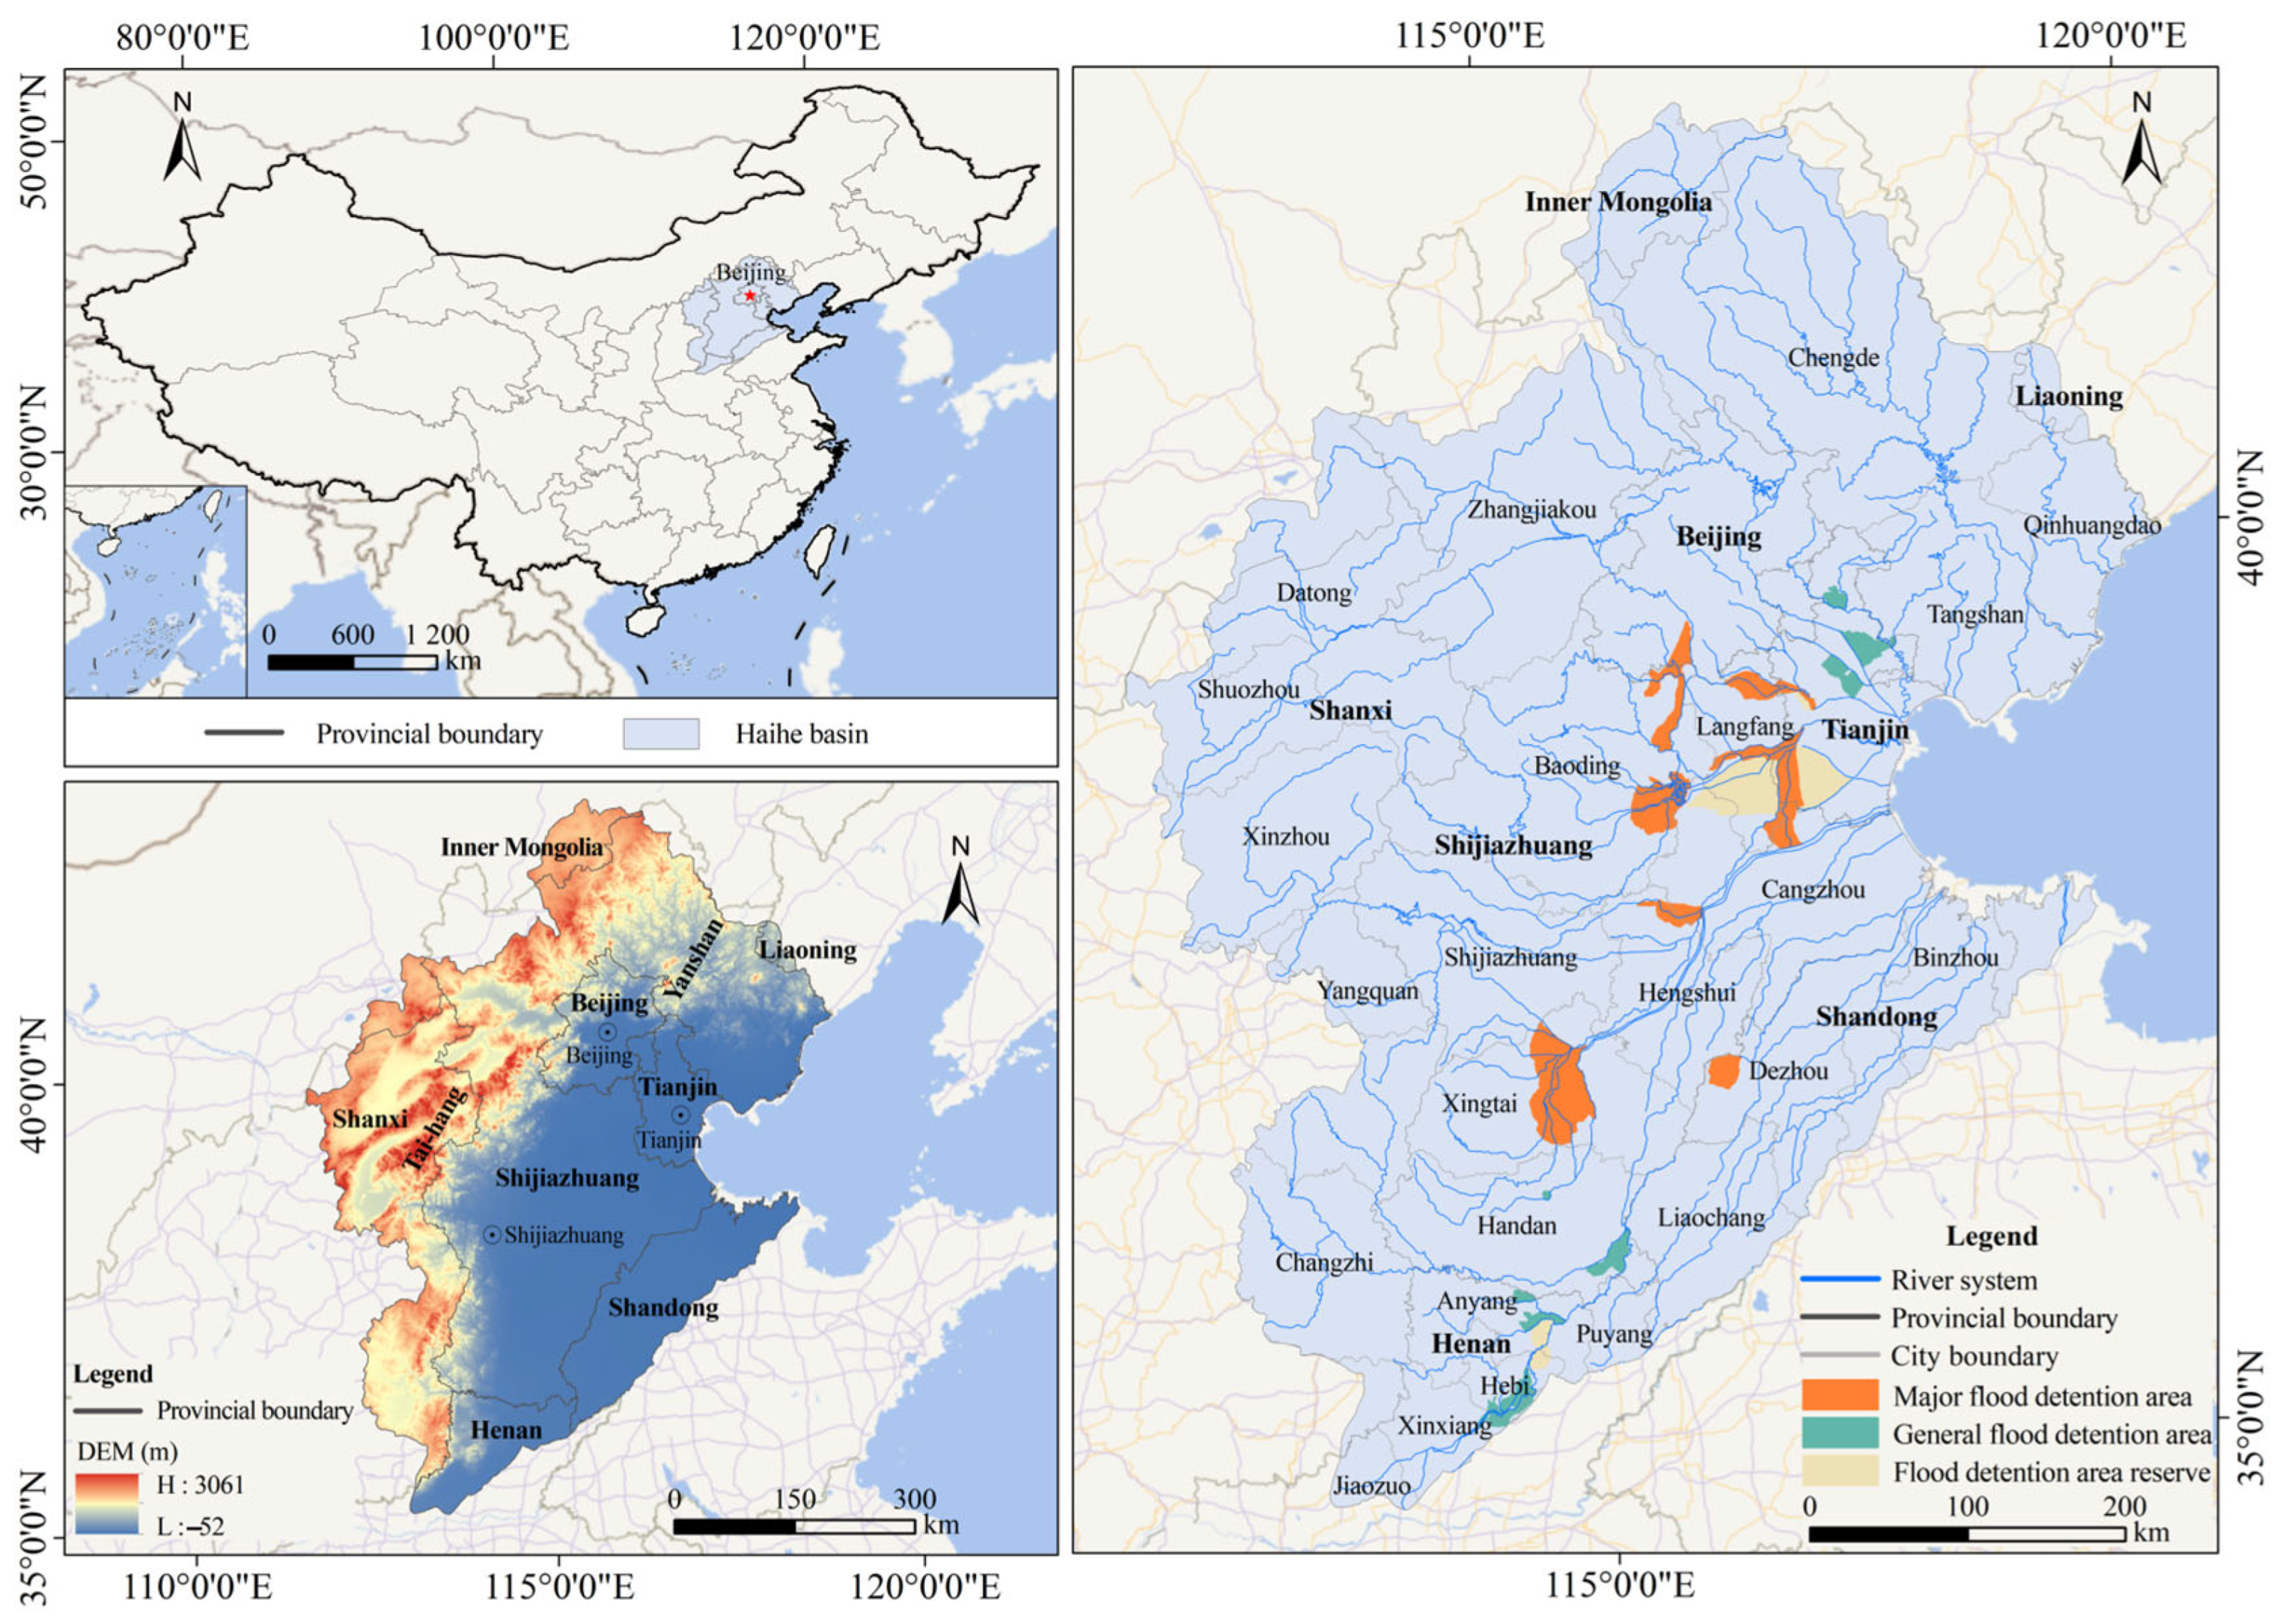
The HRB is located in northern China and covers approximately 31.82 × 10⁴ km2. Its terrain descends from the Yanshan and Taihang mountains in the northwest to the southeastern alluvial plain (Figure 1). The data were processed using ArcGIS 10.2. Mountains and plateaus occupy about 59% of the basin, whereas plains occupy 41%. The basin has a semi-arid to semi-humid continental monsoon climate. Mean annual precipitation ranges from approximately 400 mm in the northwest to 650 mm in the southeast, with 70–80% occurring from June to September [28]. The classification of the 28 FDAs is provided in Figure S1.
Figure 1.
Location of the 28 FDAs.
2.2. Data Sources
The annual LUC datasets were obtained from [29] at a spatial resolution of 30 m. The accuracy of these datasets had been previously evaluated through comparisons with the China Land Use/Cover Datasets (CLUDs) for the 1980s, 1990, 1995, 2000, 2005, 2010, and 2015, demonstrating good agreement between the two datasets. These data were classified into 9 categories. Annual data on the yields, production costs, and revenues of rice, wheat, and maize were obtained from the National Agricultural Product Cost–Benefit Data Compilation.
2.3. Methods
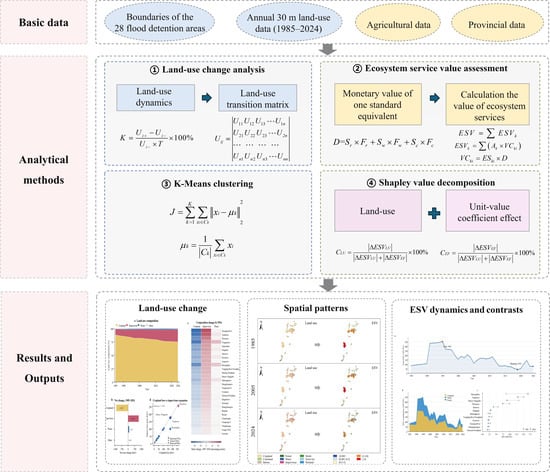
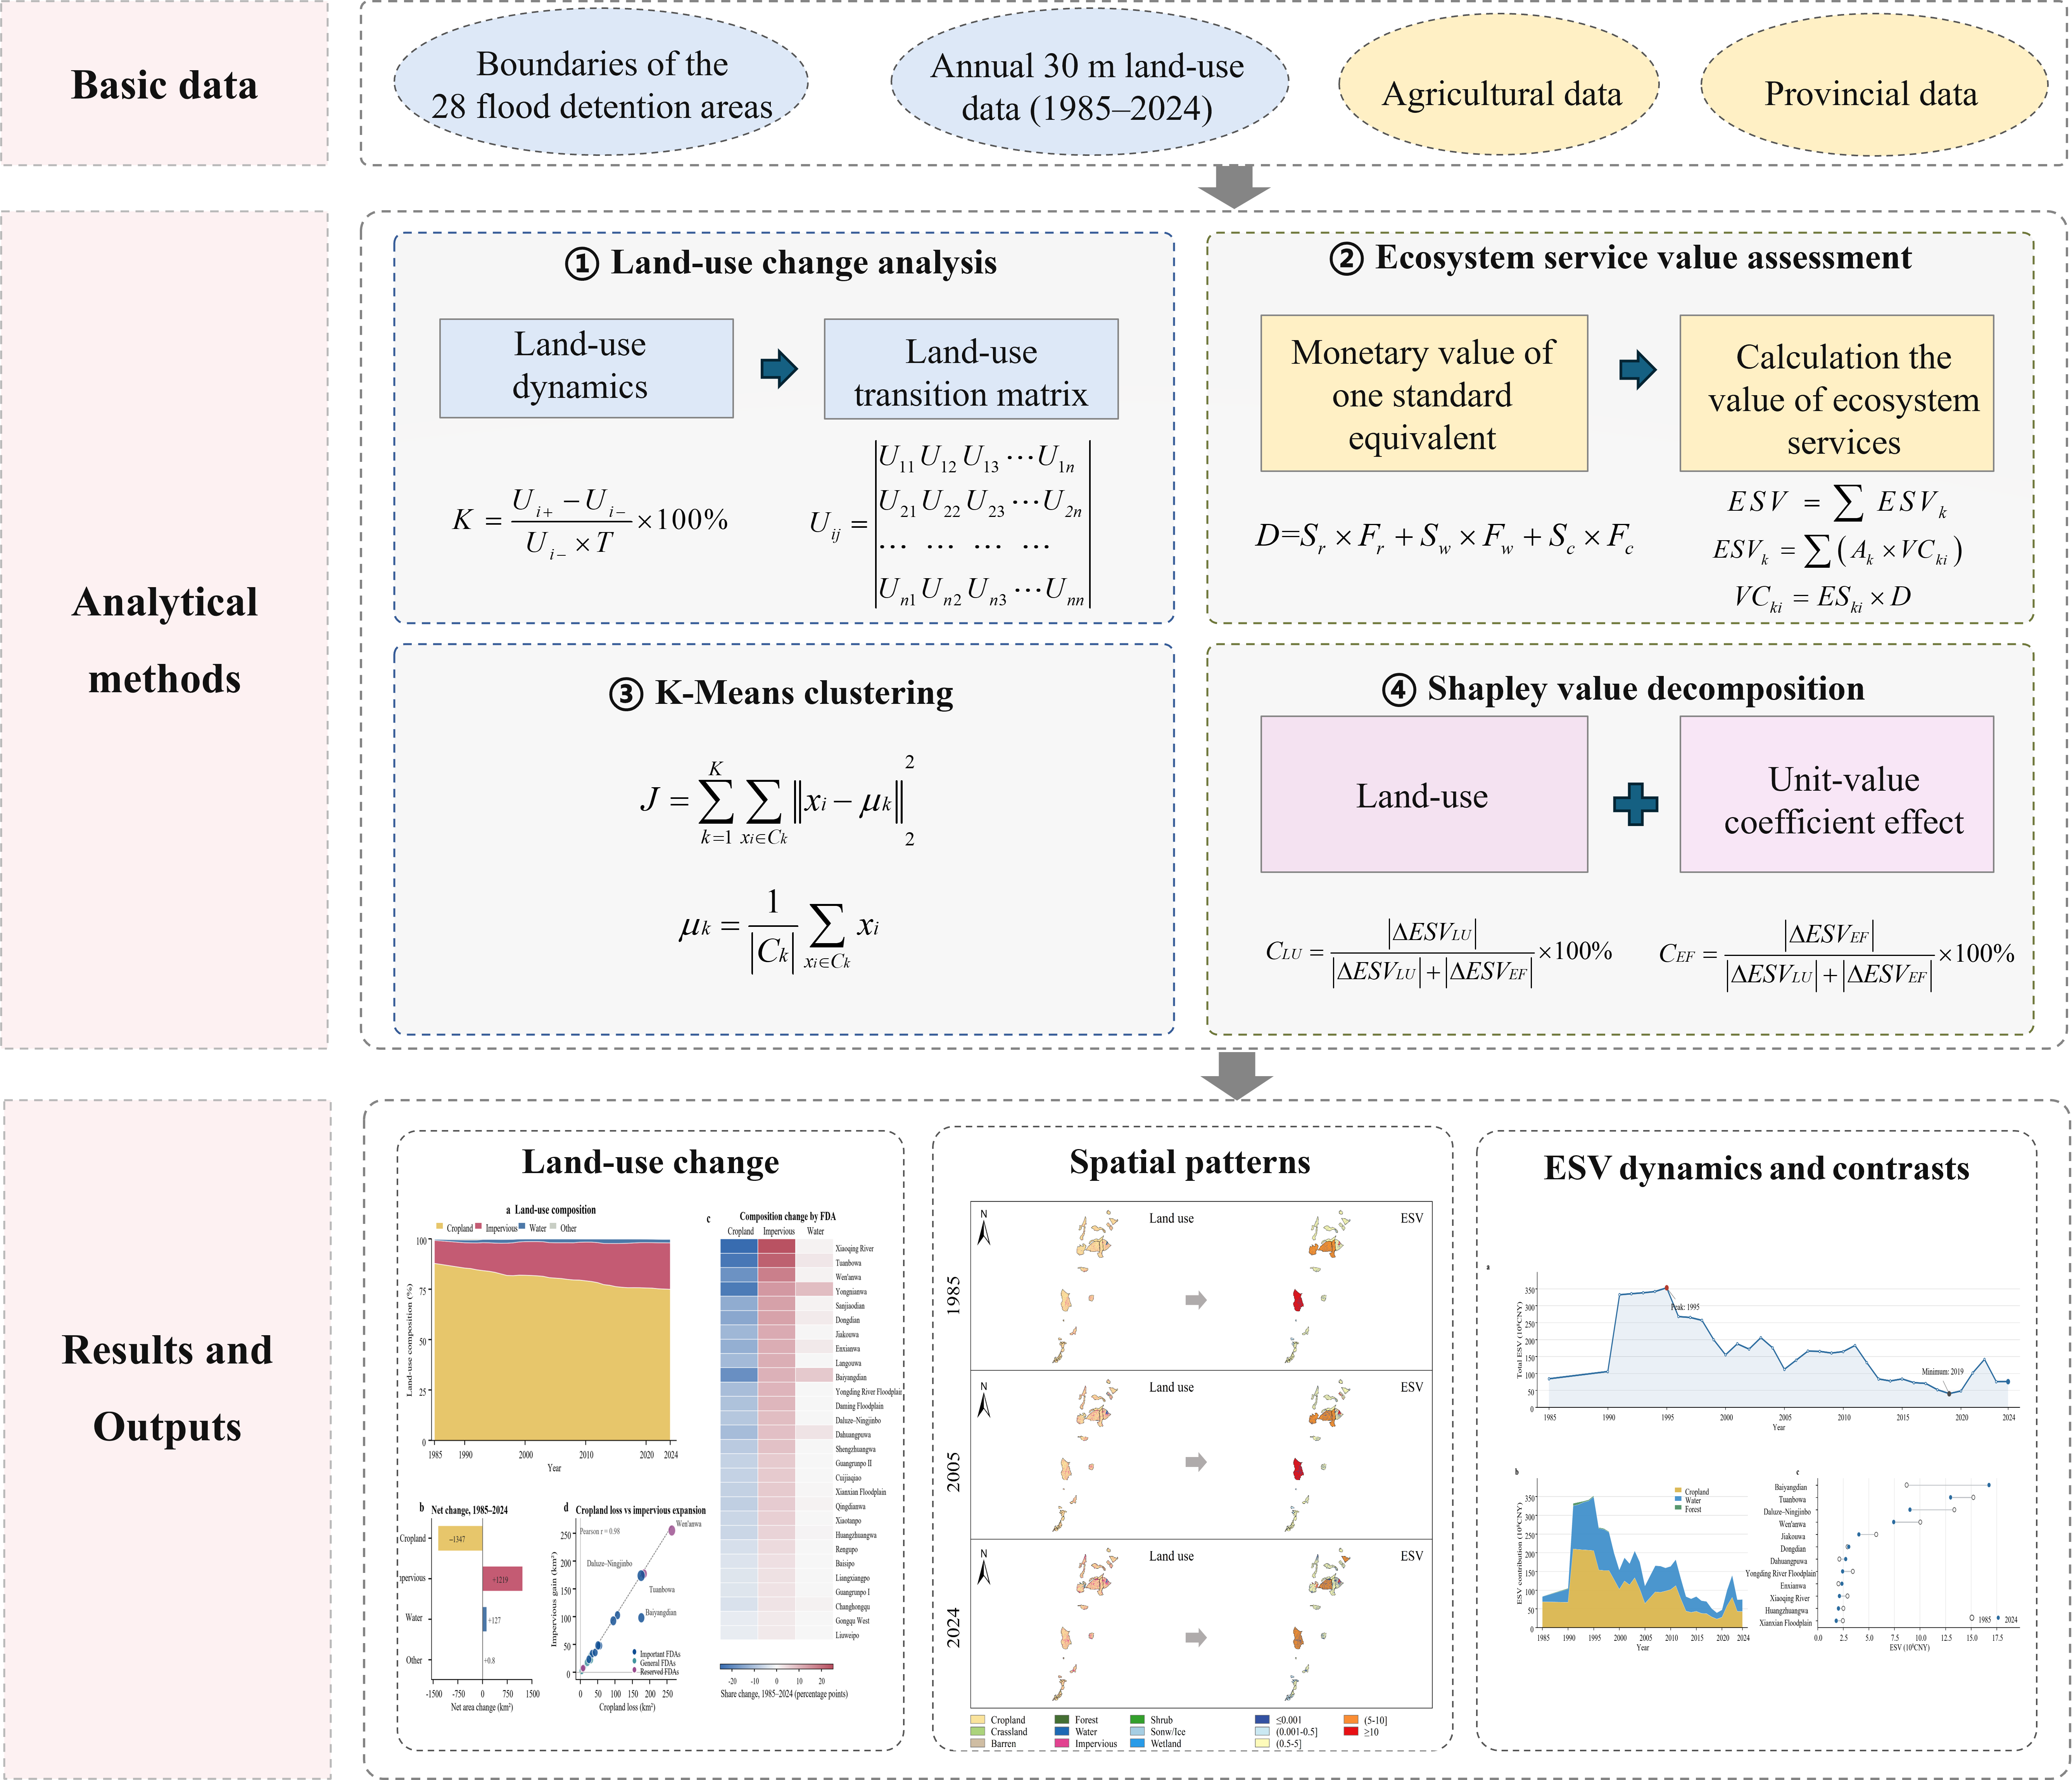
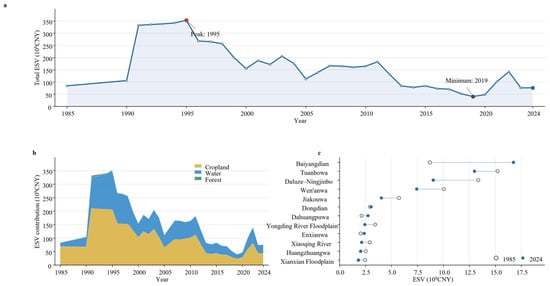
A comprehensive analytical framework was developed in this research, combining changes in LUC analysis, ecosystem services value assessment, K-Means clustering and Shapley value decomposition to investigate long-term changes in ESV across 28 FDAs in the HRB. Specifically, spatiotemporal LUC dynamics over the 1985–2024 period were characterized using LUC dynamics and transition matrix. Subsequently, ESV changes were quantified using the equivalent factor method. Finally, K-Means clustering was employed to classify FDAs based on their characteristics, while the Shapley approach was used to estimate quantifications of the contributions of different factors to ESV changes. The overall analysis framework is presented in Figure 2.
Figure 2.
Analytical framework. In ESV dynamics and contrasts, (a) Changes in total ESV during 1985–2024; (b) contributions of different land-use types to total ESV; (c) ESV across individual FDAs.
2.3.1. Analysis of Land Use Dynamics
- (1)
- Land use dynamics
The LUC dynamic degree measures the annualized relative change in the area of an LUC class during a specified period [19]:
where K is relative change in the area of type land; Ui− and Ui+ are its initial and final areas (km2); is the interval length in years.
- (2)
- Land use transition matrix
The LUC transition matrix records the area converted from each initial LUC class to every final class during a specified period:
where Uij is the area converted from LUC type to type (km2), and is the number of classes (n = 9) [29].
2.3.2. ESV Assessment Model
The ESV assessment followed the equivalent factor method, which is suitable for large-scale assessments over long time periods [16]. The calculation proceeded from the standard equivalent value, through region-specific coefficients, to annual ESV estimates for each LUC class and FDA.
Step 1: We calculated the monetary value of one standard ecosystem service equivalent:
where D is the monetary value of one standard equivalent (CNY ha−1 yr−1). Sr, Sw, and Sc are the shares of rice, wheat, and corn in their combined planted area. Fr, Fw, and Fc are their mean net profits per unit area (CNY ha−1 yr−1).
Step 2: Based on the ecosystem service equivalent factor table (Table S1), we adjusted the equivalent factors according to the LUC characteristics of the FDAs, accounting for the spatial distributions of dryland, paddy fields, and forest resources. The LUC categories were then matched with the corresponding ecosystem types in the equivalent factor table, and ESV was calculated using the adjusted equivalent factors and the area of each LUC category. The function is
where ESVk is the annual of LUC type , Ak is its area, VCki is the value coefficient for service , and ESki is the corresponding equivalent factor. The total for each FDA and year is the sum across LUC types and service functions.
2.3.3. K-Means Clustering
To identify the long-term change patterns of ESV across different FDAs, the K-Means clustering method was employed for analysis. K-Means is a distance-based unsupervised classification approach [30]. It partitions samples into multiple clusters with high internal homogeneity and substantial inter-cluster heterogeneity by minimizing the squared Euclidean distance between each sample and its assigned cluster centroid. The function is
where denotes the number of clusters, Ck represents the cluster, xi is the feature vector of the FDAs, and μk is the centroid of the corresponding cluster. The algorithm first sets initial cluster centroids, then assigns each sample to the nearest centroid according to Euclidean distance, and recalculates the centroid of each cluster. This process is iterated repeatedly until the sample assignments and cluster centroids converge. The optimal value of was selected using the elbow method by identifying the point at which the rate of decrease in the within-cluster sum of squares slows markedly.
2.3.4. Shapley Value Decomposition
To determine the primary driver of ecosystem services, dynamics were primarily calculated using LUC change or, in equivalent factors, the valuation coefficient; Shapley value decomposition was applied to separate the total change in ESV from 1985 to 2024 into an LUC effect and a valuation coefficient effect [31]. The formulas are as follows:
where is the change in ESV in the FDAs during the study period; is the ESV change attributable to LUC change; is the ESV change attributable to changes in equivalent factors’ valuation coefficients; is the area of LUC type (); is the ecosystem service value equivalent per unit area; is the contribution rate of the LUC effect; is the contribution rate of the equivalent-factor valuation effect.
3. Results
3.1. Spatial and Temporal Pattern of Land Use
3.1.1. Land Use Changes
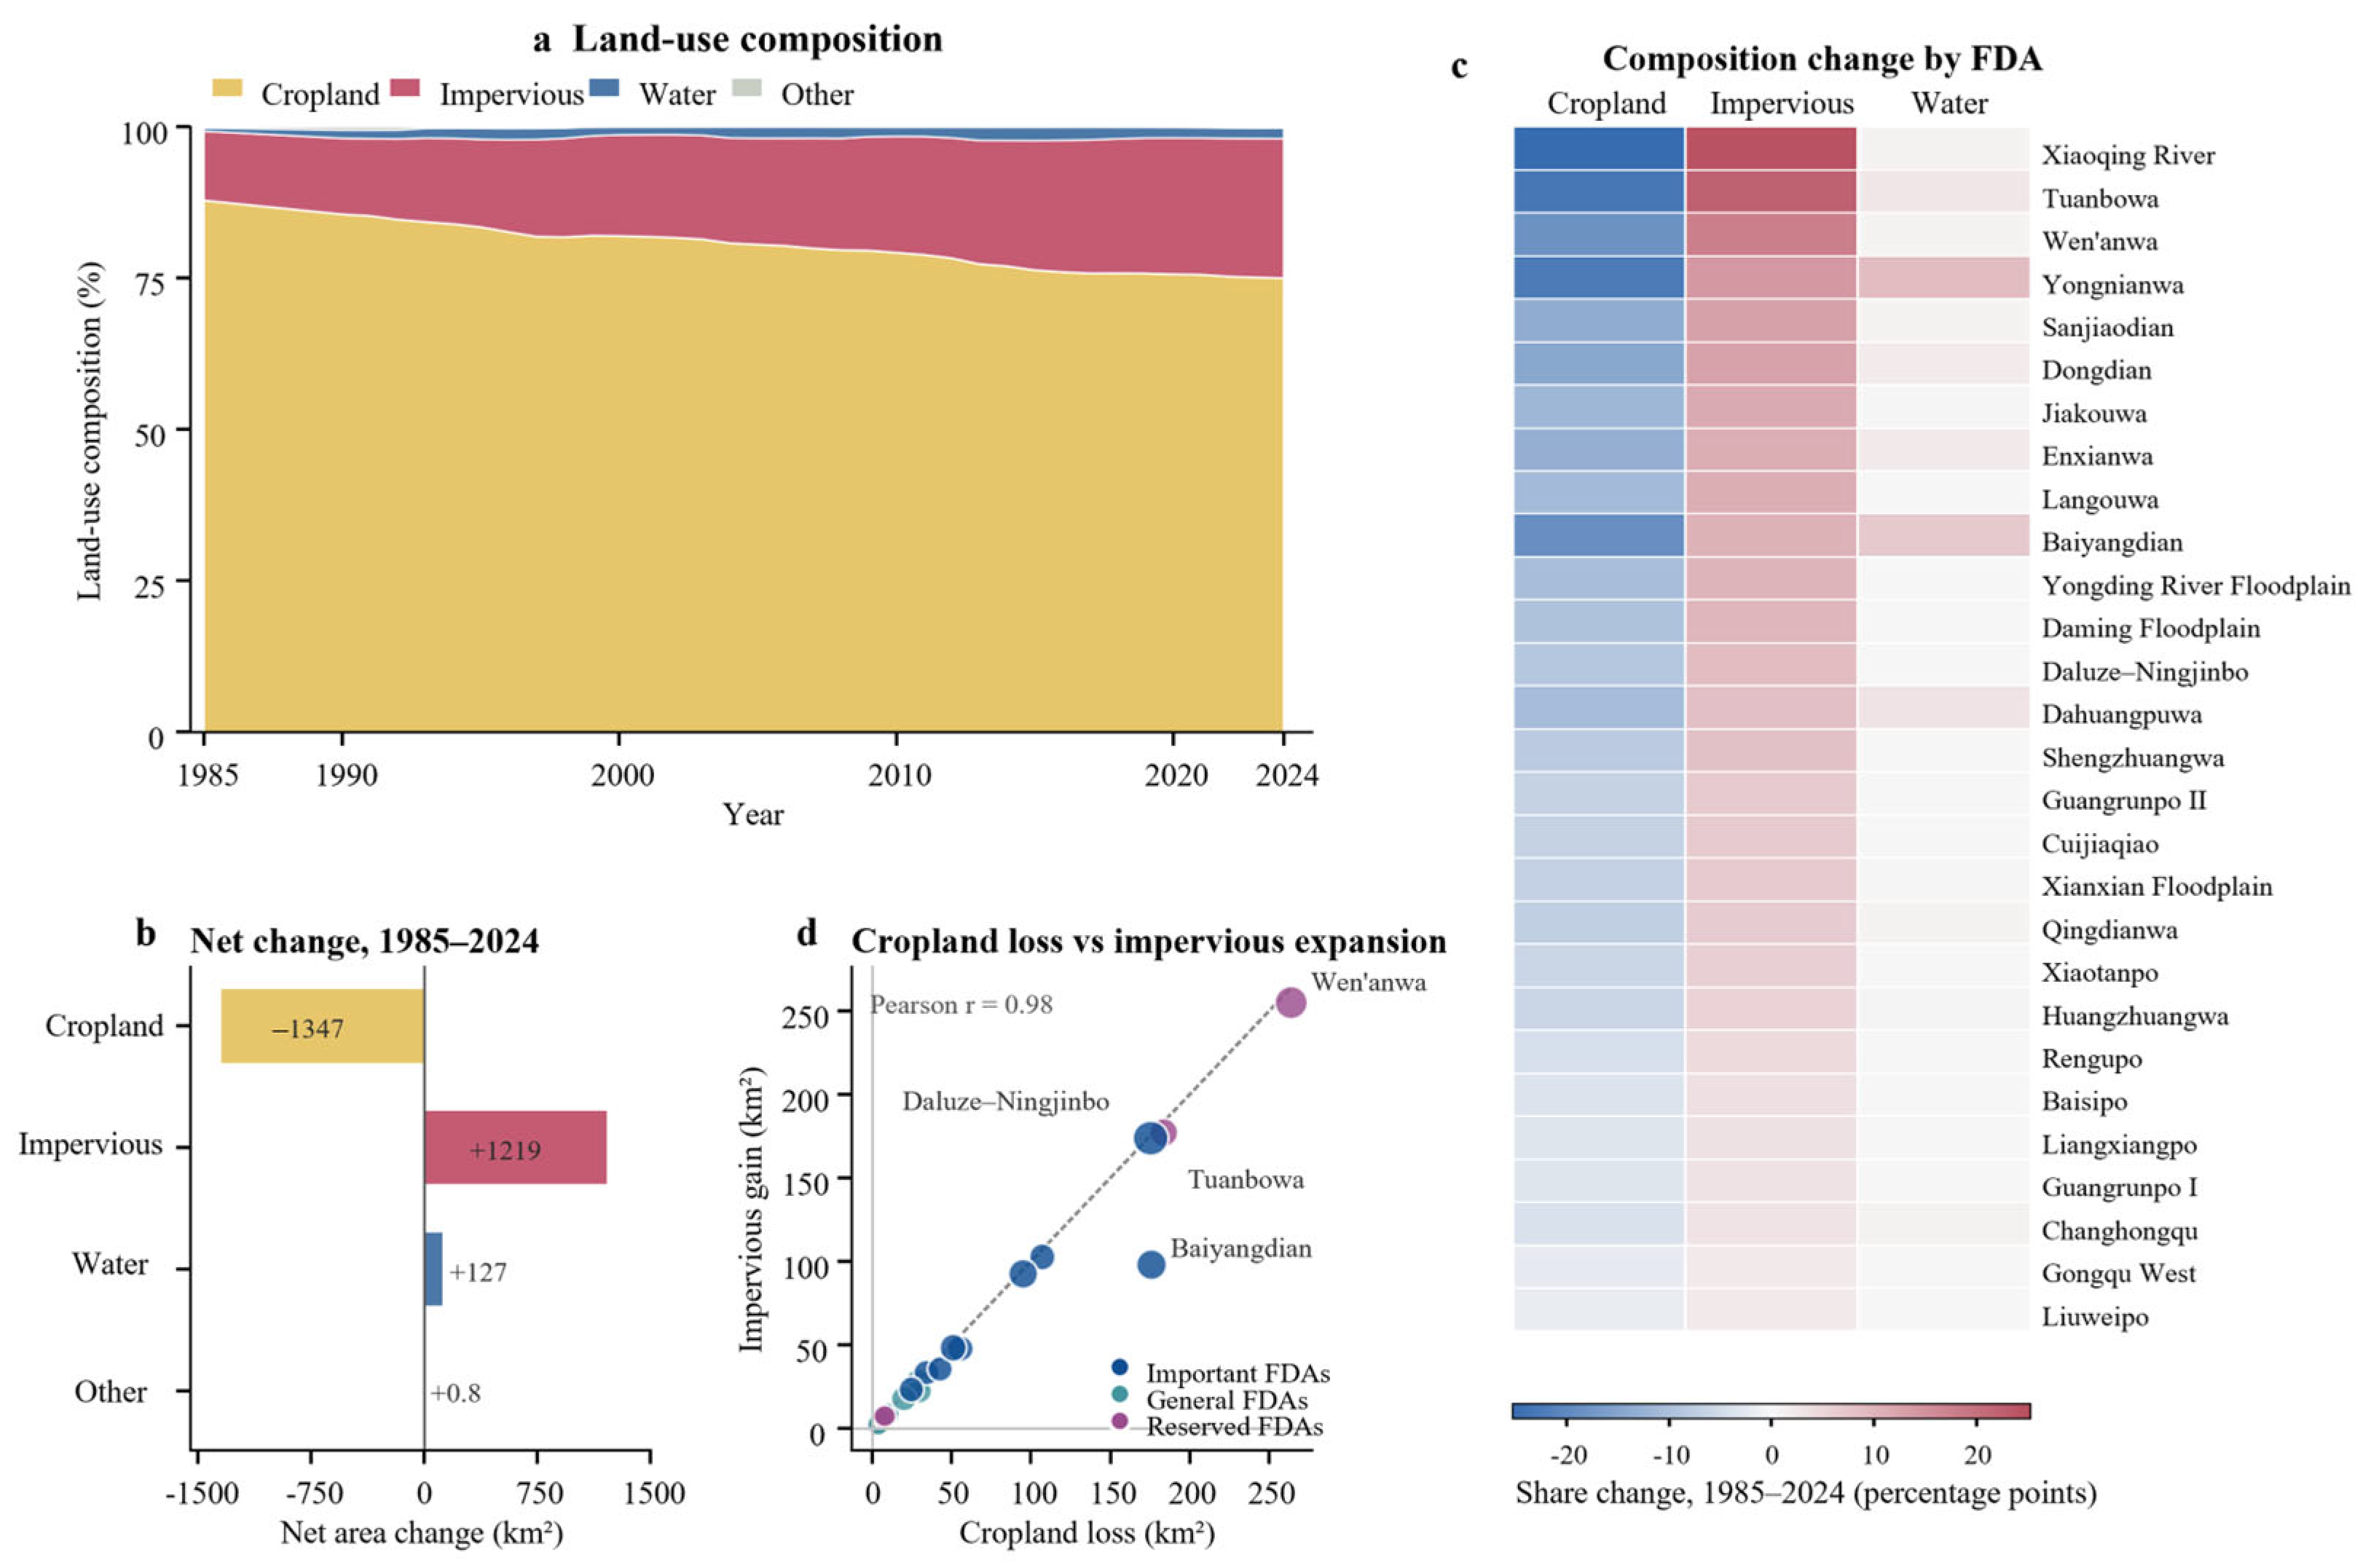
Figure 3 shows the LUC patterns across the 28 FDAs from 1985 to 2024. Cropland accounted for the largest proportion of the total area in 28 FDAs, followed by impervious surfaces and water (Figure 3a). The cropland decreased from 9217 km2 in 1985 to 7870 km2 in 2024, representing a relative decline of 14.62%, whereas the area of impervious surfaces increased from 1198 to 2417 km2. Among individual FDAs, the dynamic degree of water bodies ranged from −2.6% to 57.8% (Figure 3b,c). Pronounced fluctuations in water area were primarily driven by four major flood events in the HRB, as supported by the corresponding flood-inundation extents and hydrological records. Substantial changes in water area were observed during the representative flood years of 1996, 2016, 2021, and 2023.
Figure 3.
Land use patterns across the 28 FDAs from 1985 to 2024.
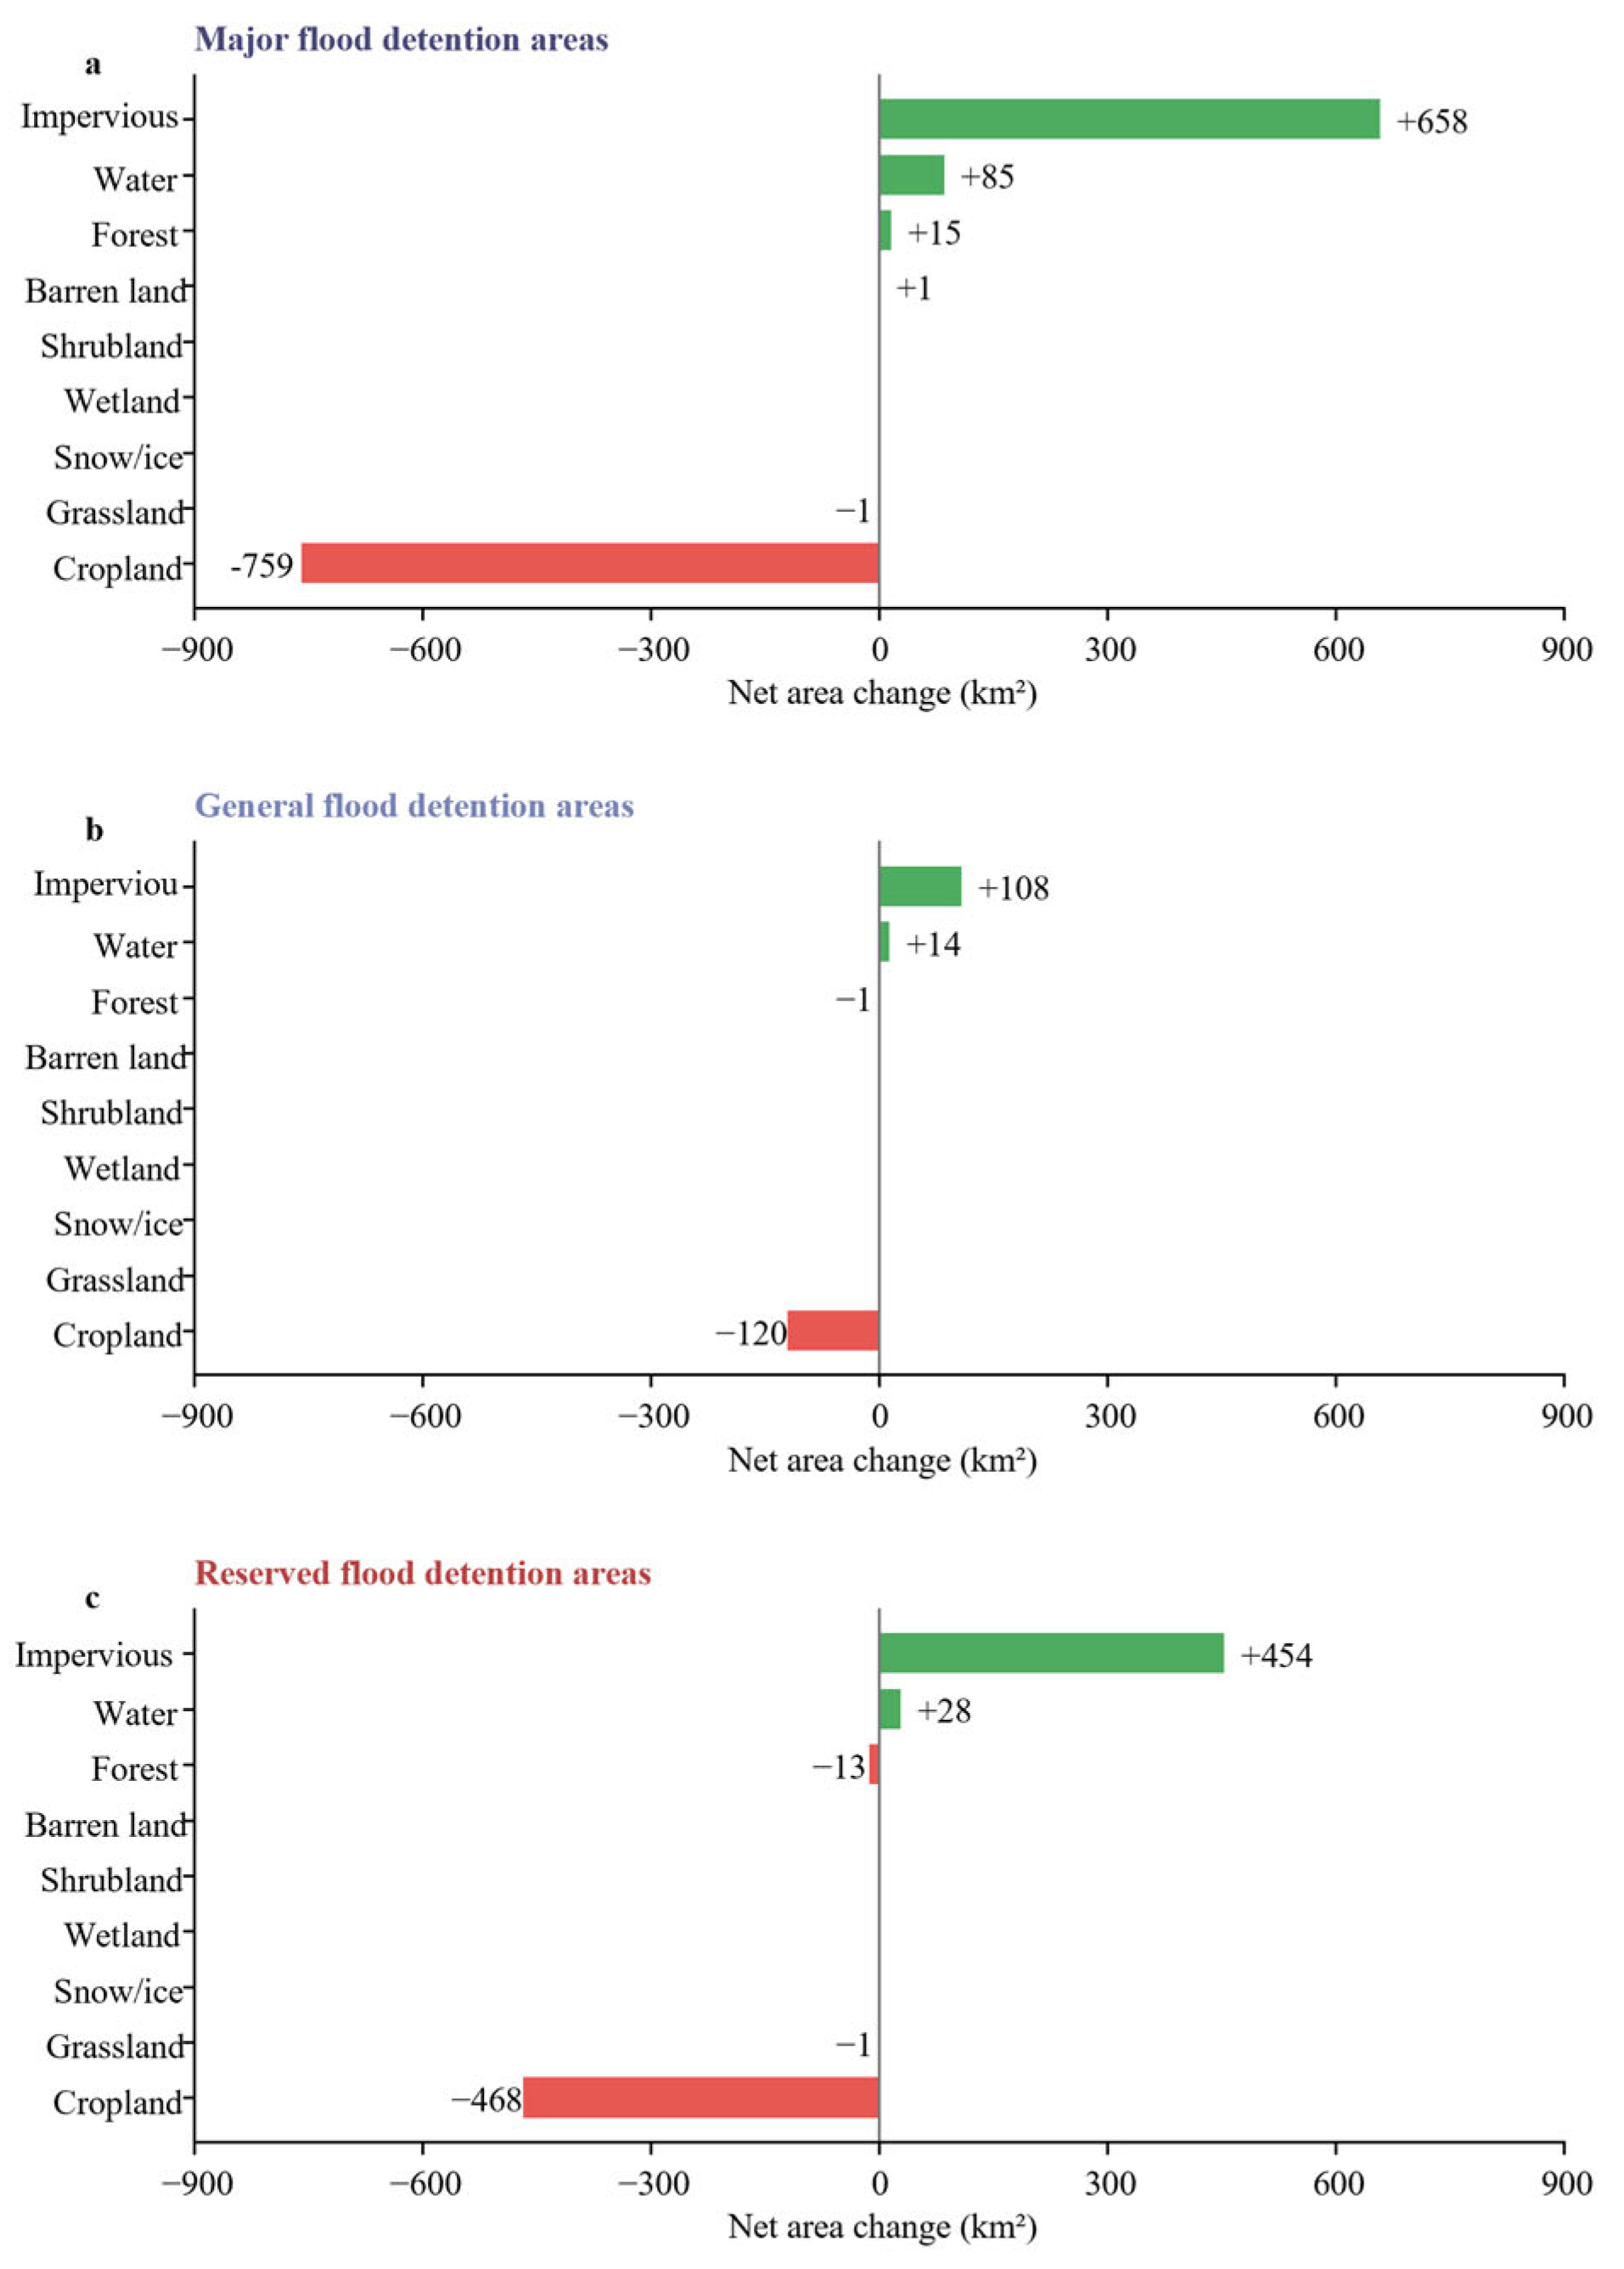
The extent of LUC changes differed across the three FDA categories (major, general and reserved). Major FDAs exhibited the largest absolute changes in LUC area, whereas general FDAs exhibited the smallest changes (Figure 4). In major FDAs, cropland decreased by 750 km2, and its share of the total area declined from 88.8% to 76.4%, a reduction of 12.4%. Over the same period, impervious surfaces increased by 658 km2, with their share rising from 10.9% to 21.7%, an increase of 10.8% (Figure 4a). General FDAs exhibited relatively small changes, with cropland decreasing by 120 km2 and impervious surfaces increasing by 108 km2. Their respective shares decreased by 6.7% and increased by 6.0% (Figure 4b). In reserved FDAs, cropland area decreased by 468 km2, and its share declined from 85.4% to 67.3%, a reduction of 18.1%. Meanwhile, impervious surfaces increased by 454 km2, with their share rising from 12.4% to 29.9%, an increase of 17.5% (Figure 4c).
Figure 4.
Net land use change across FDAs, 1985–2024.
3.1.2. Land Use Transition Patterns
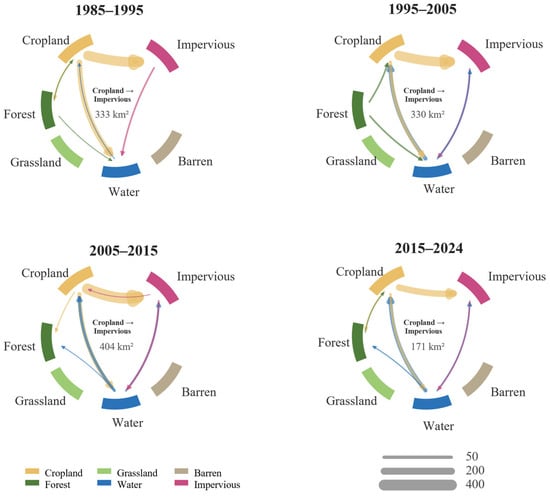
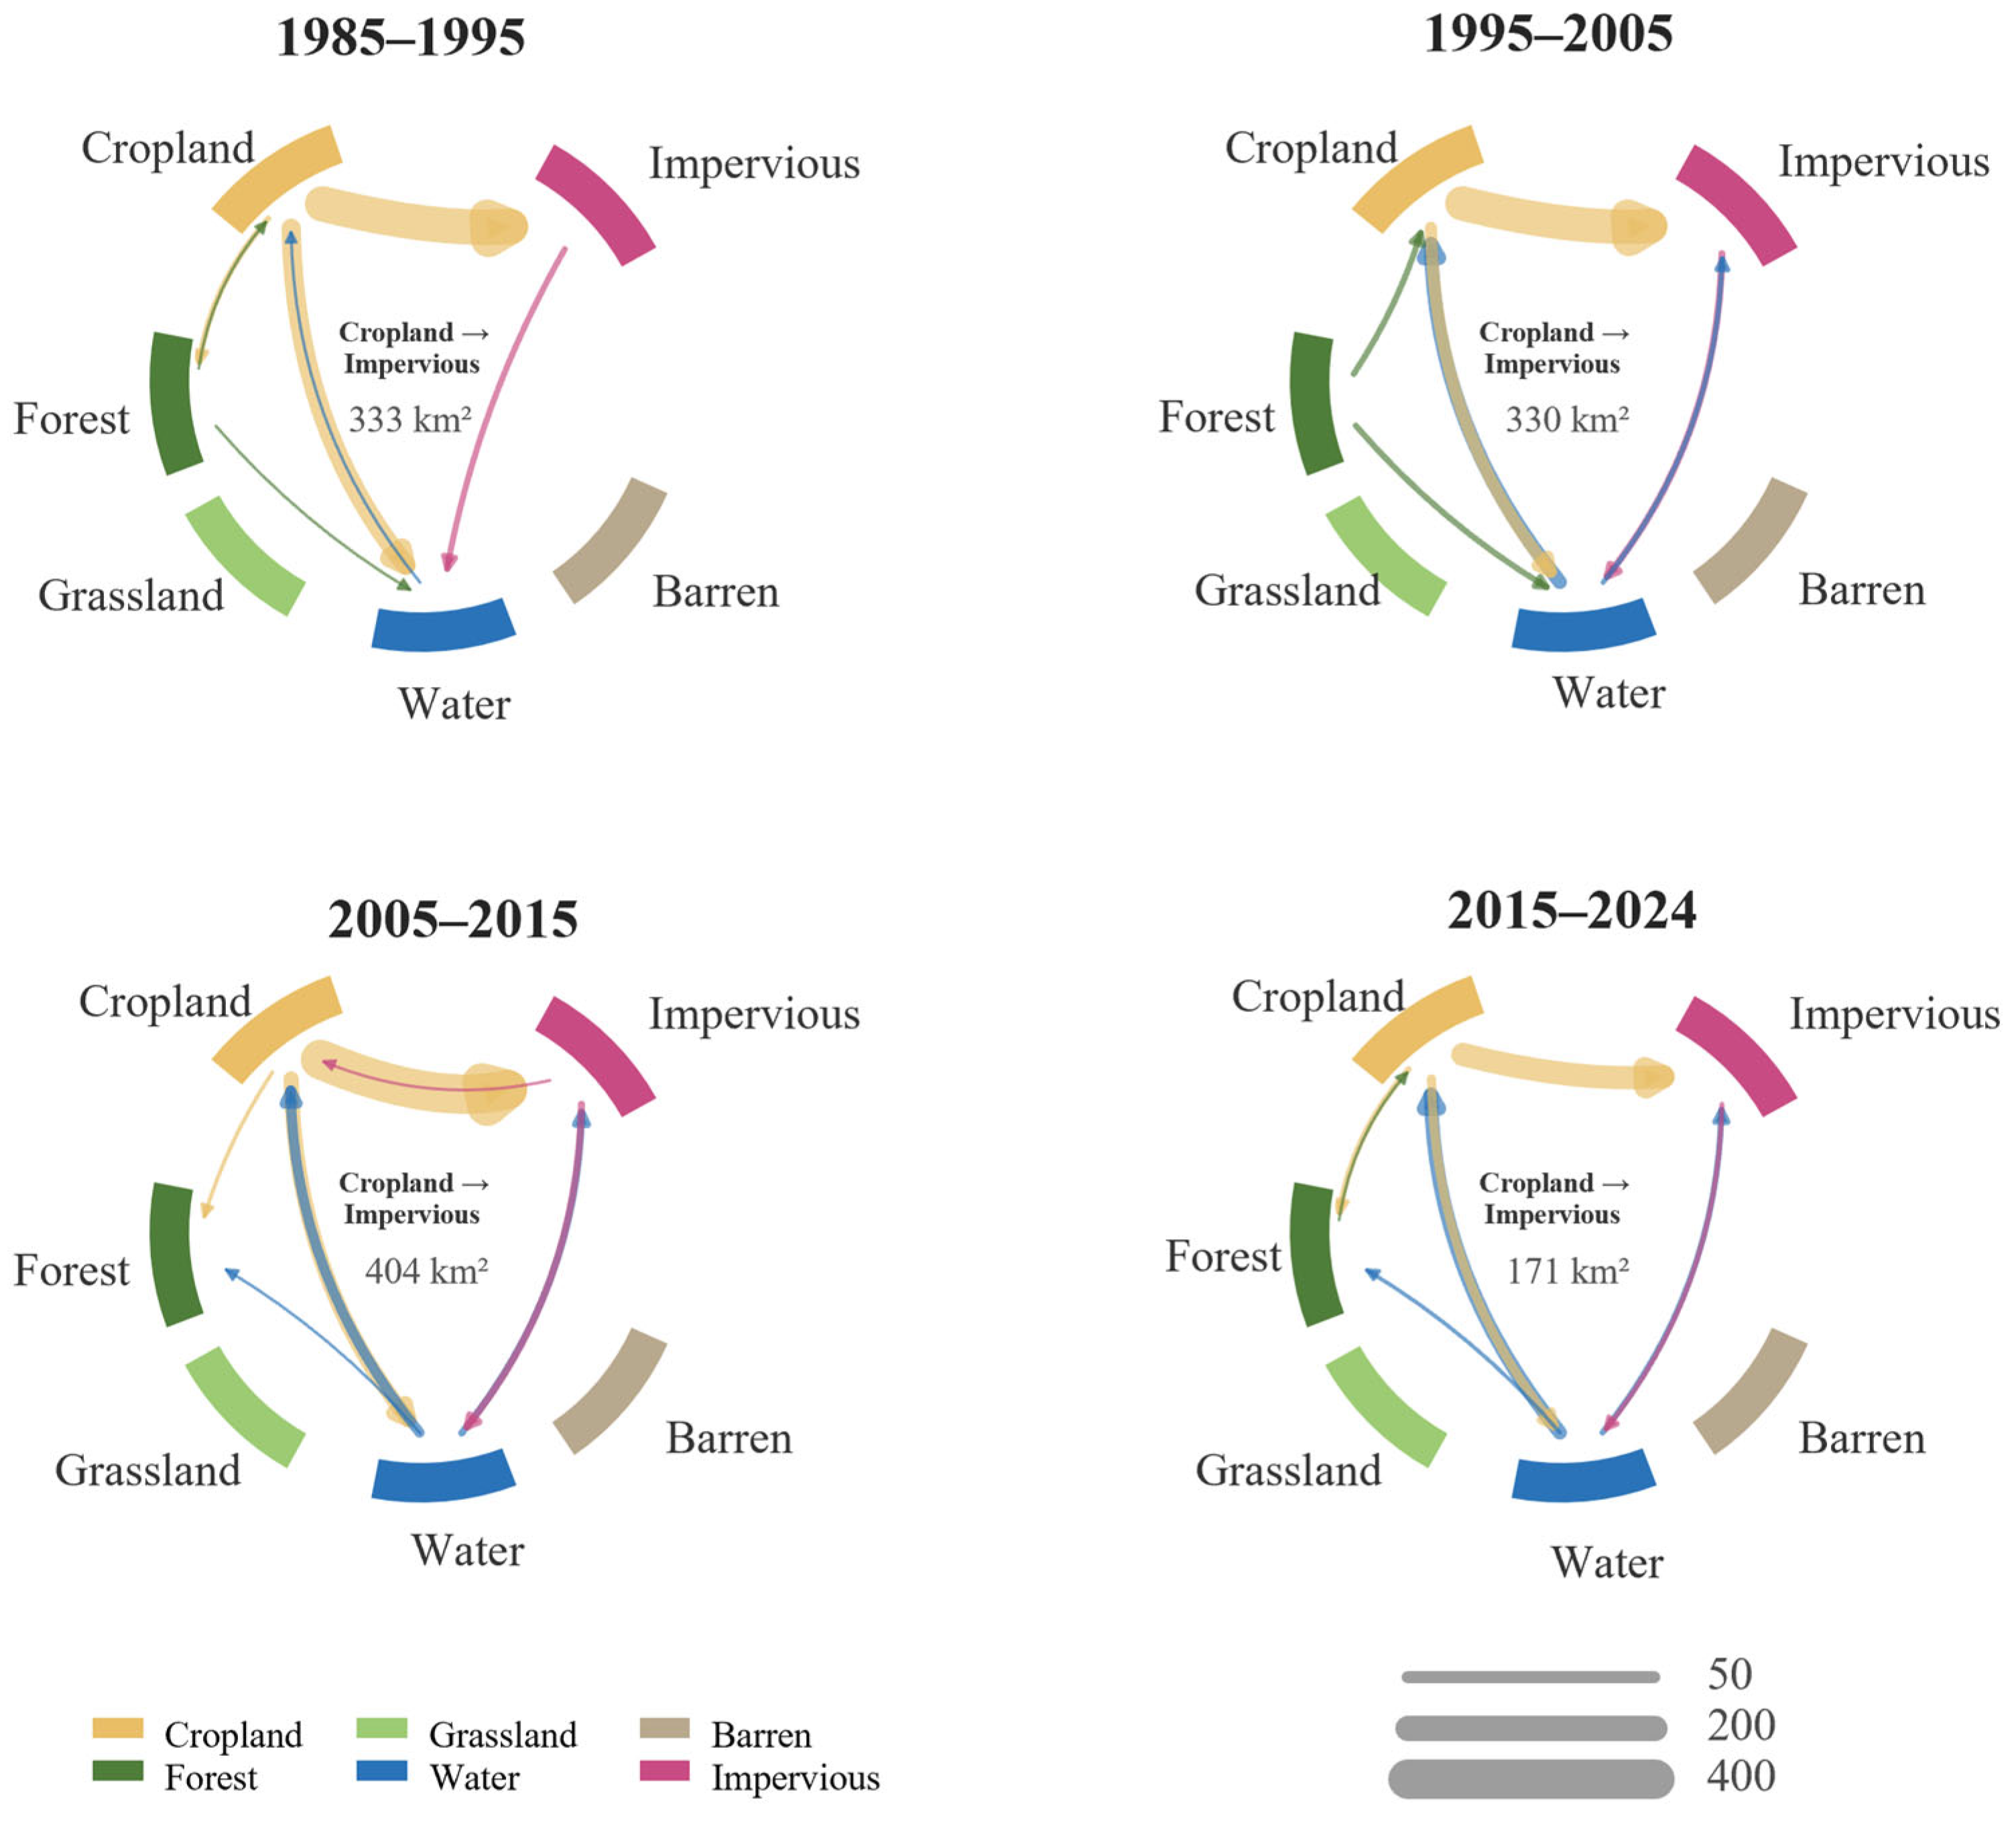
The LUC transition matrix indicated that the conversion of cropland to impervious surfaces was the largest and most persistent unidirectional transition pathway (Figure 5). LUC transition intensity was relatively high between 2005 and 2015 and subsequently decreased after 2015, although the expansion of impervious continued. Substantial bidirectional exchanges between water and cropland further demonstrated that water-area changes were highly dynamic and phase-dependent.
Figure 5.
Land use transition patterns.
3.2. Spatiotemporal Pattern of ESV
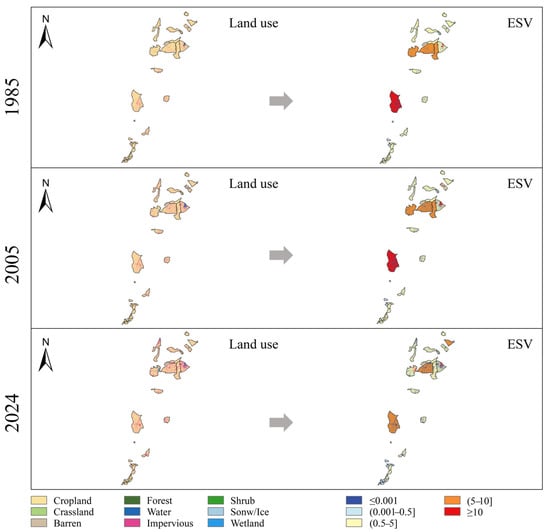
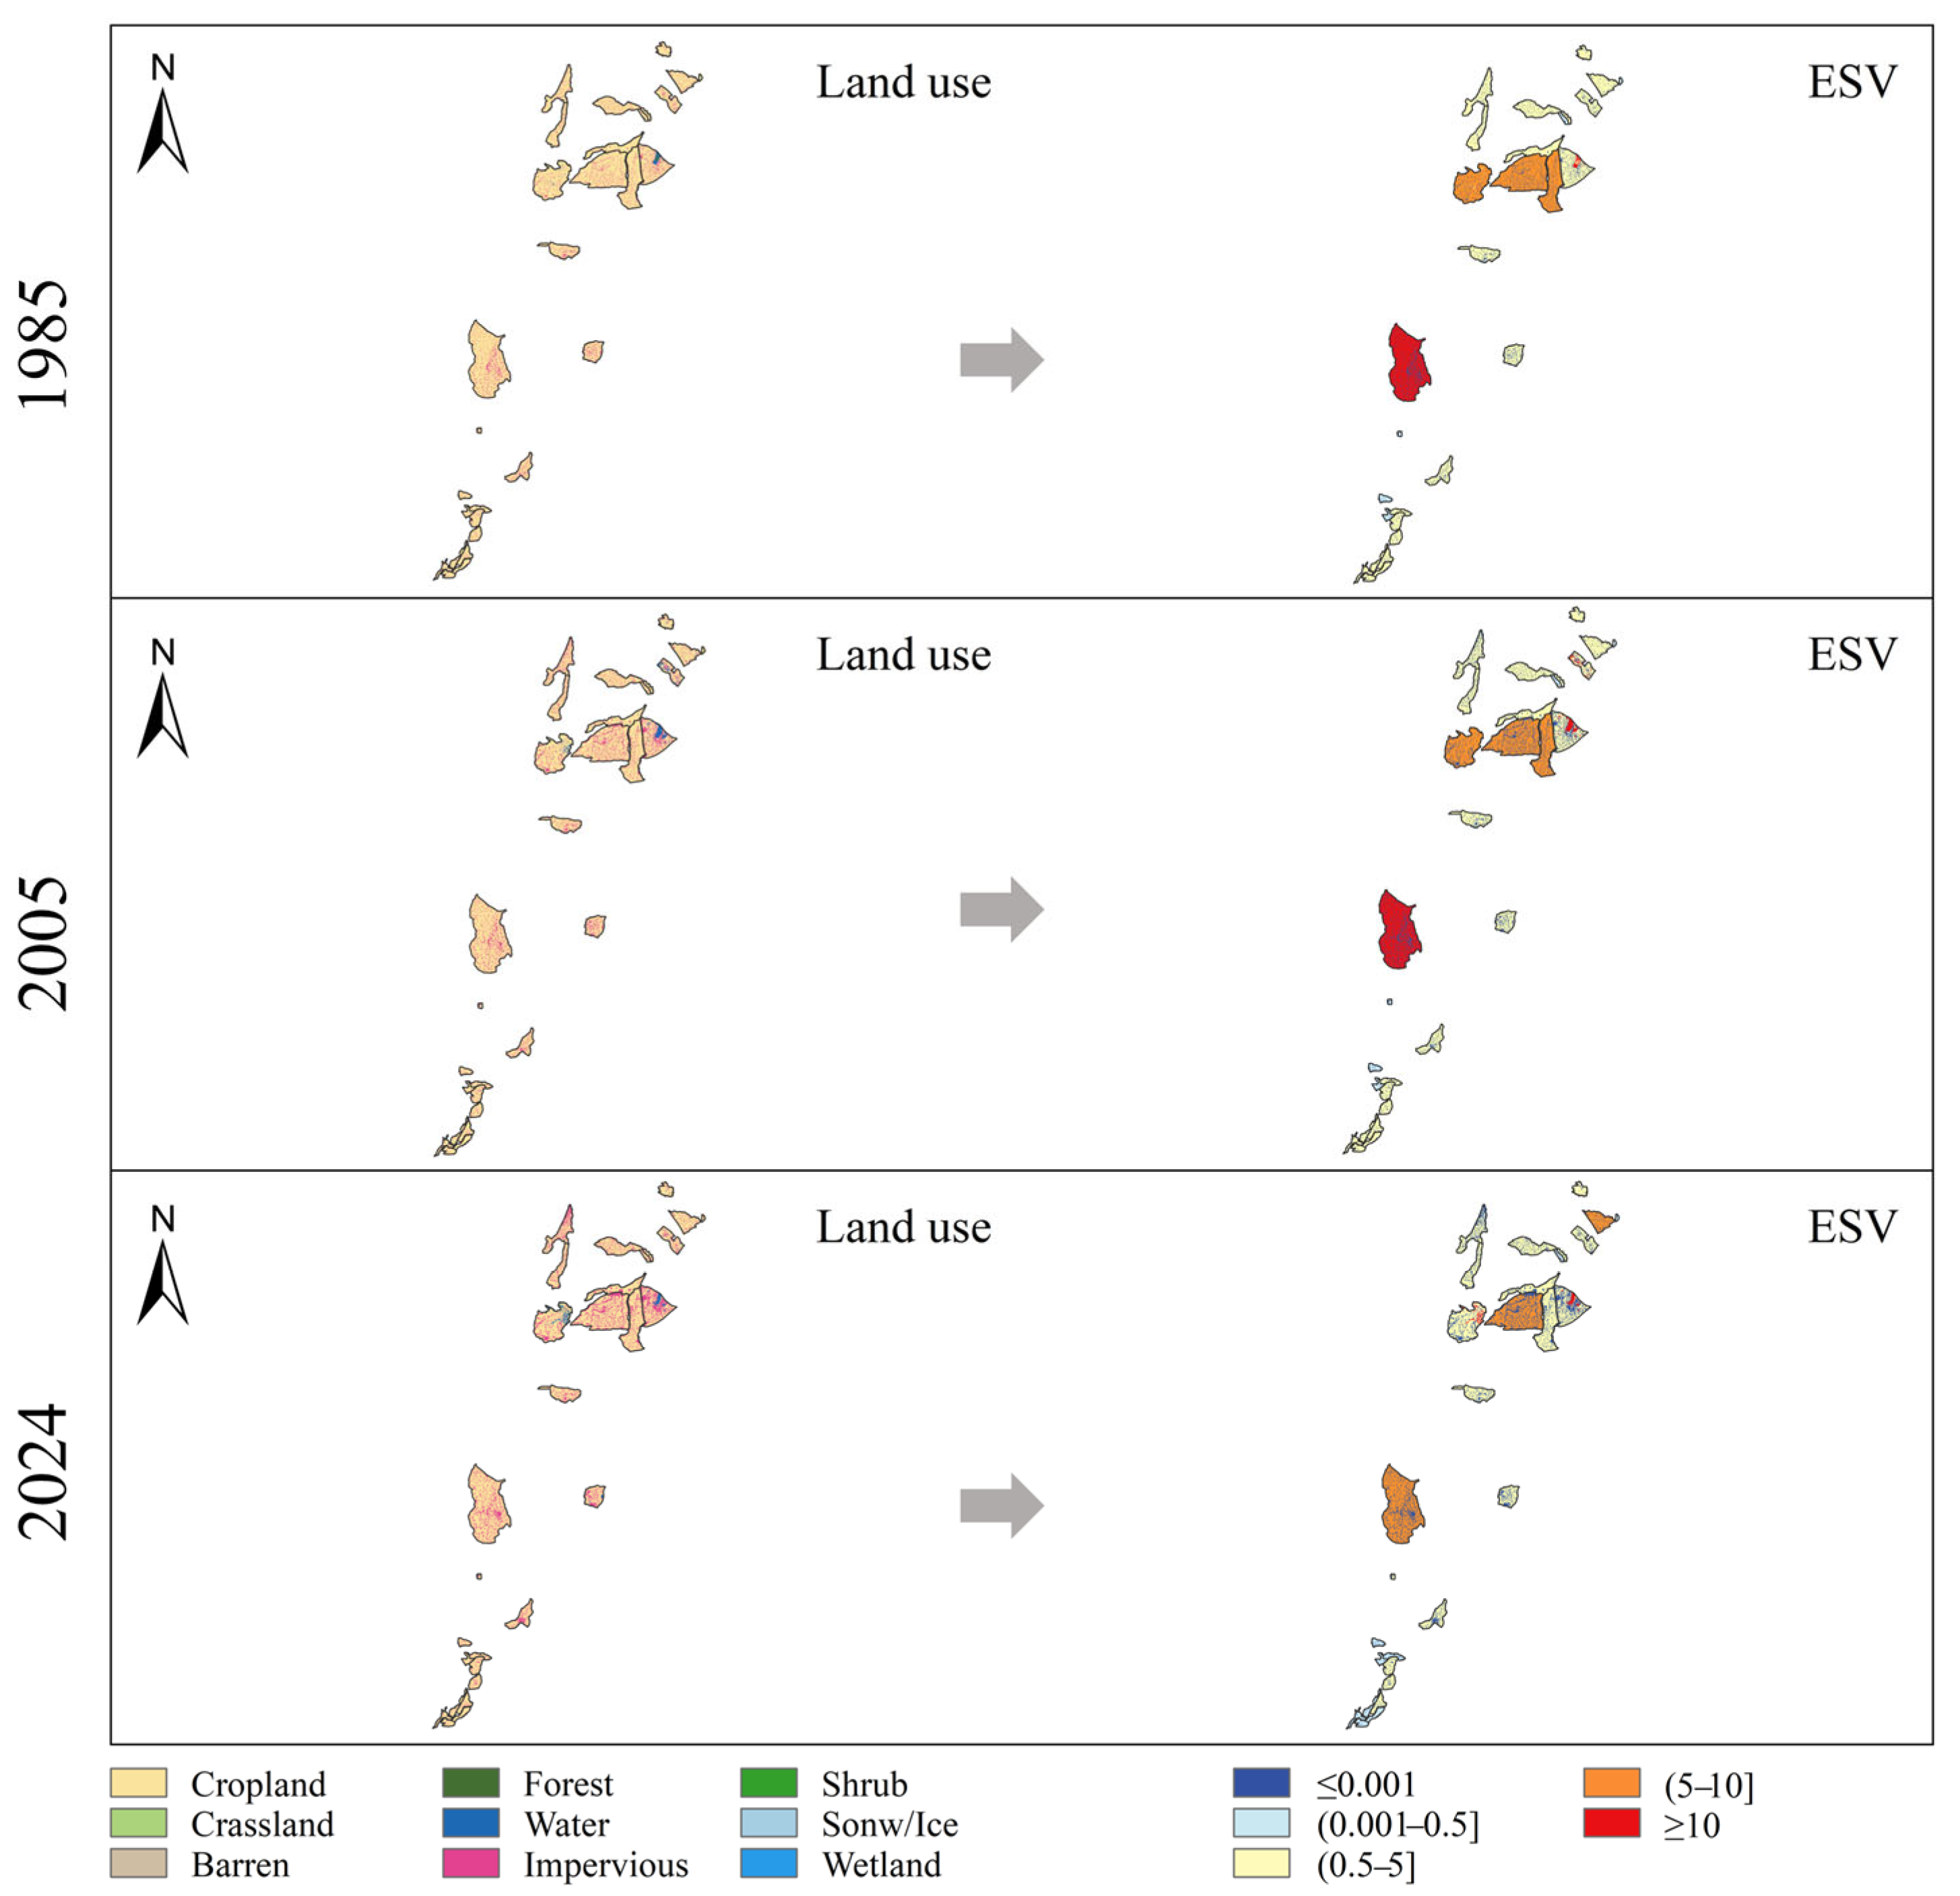
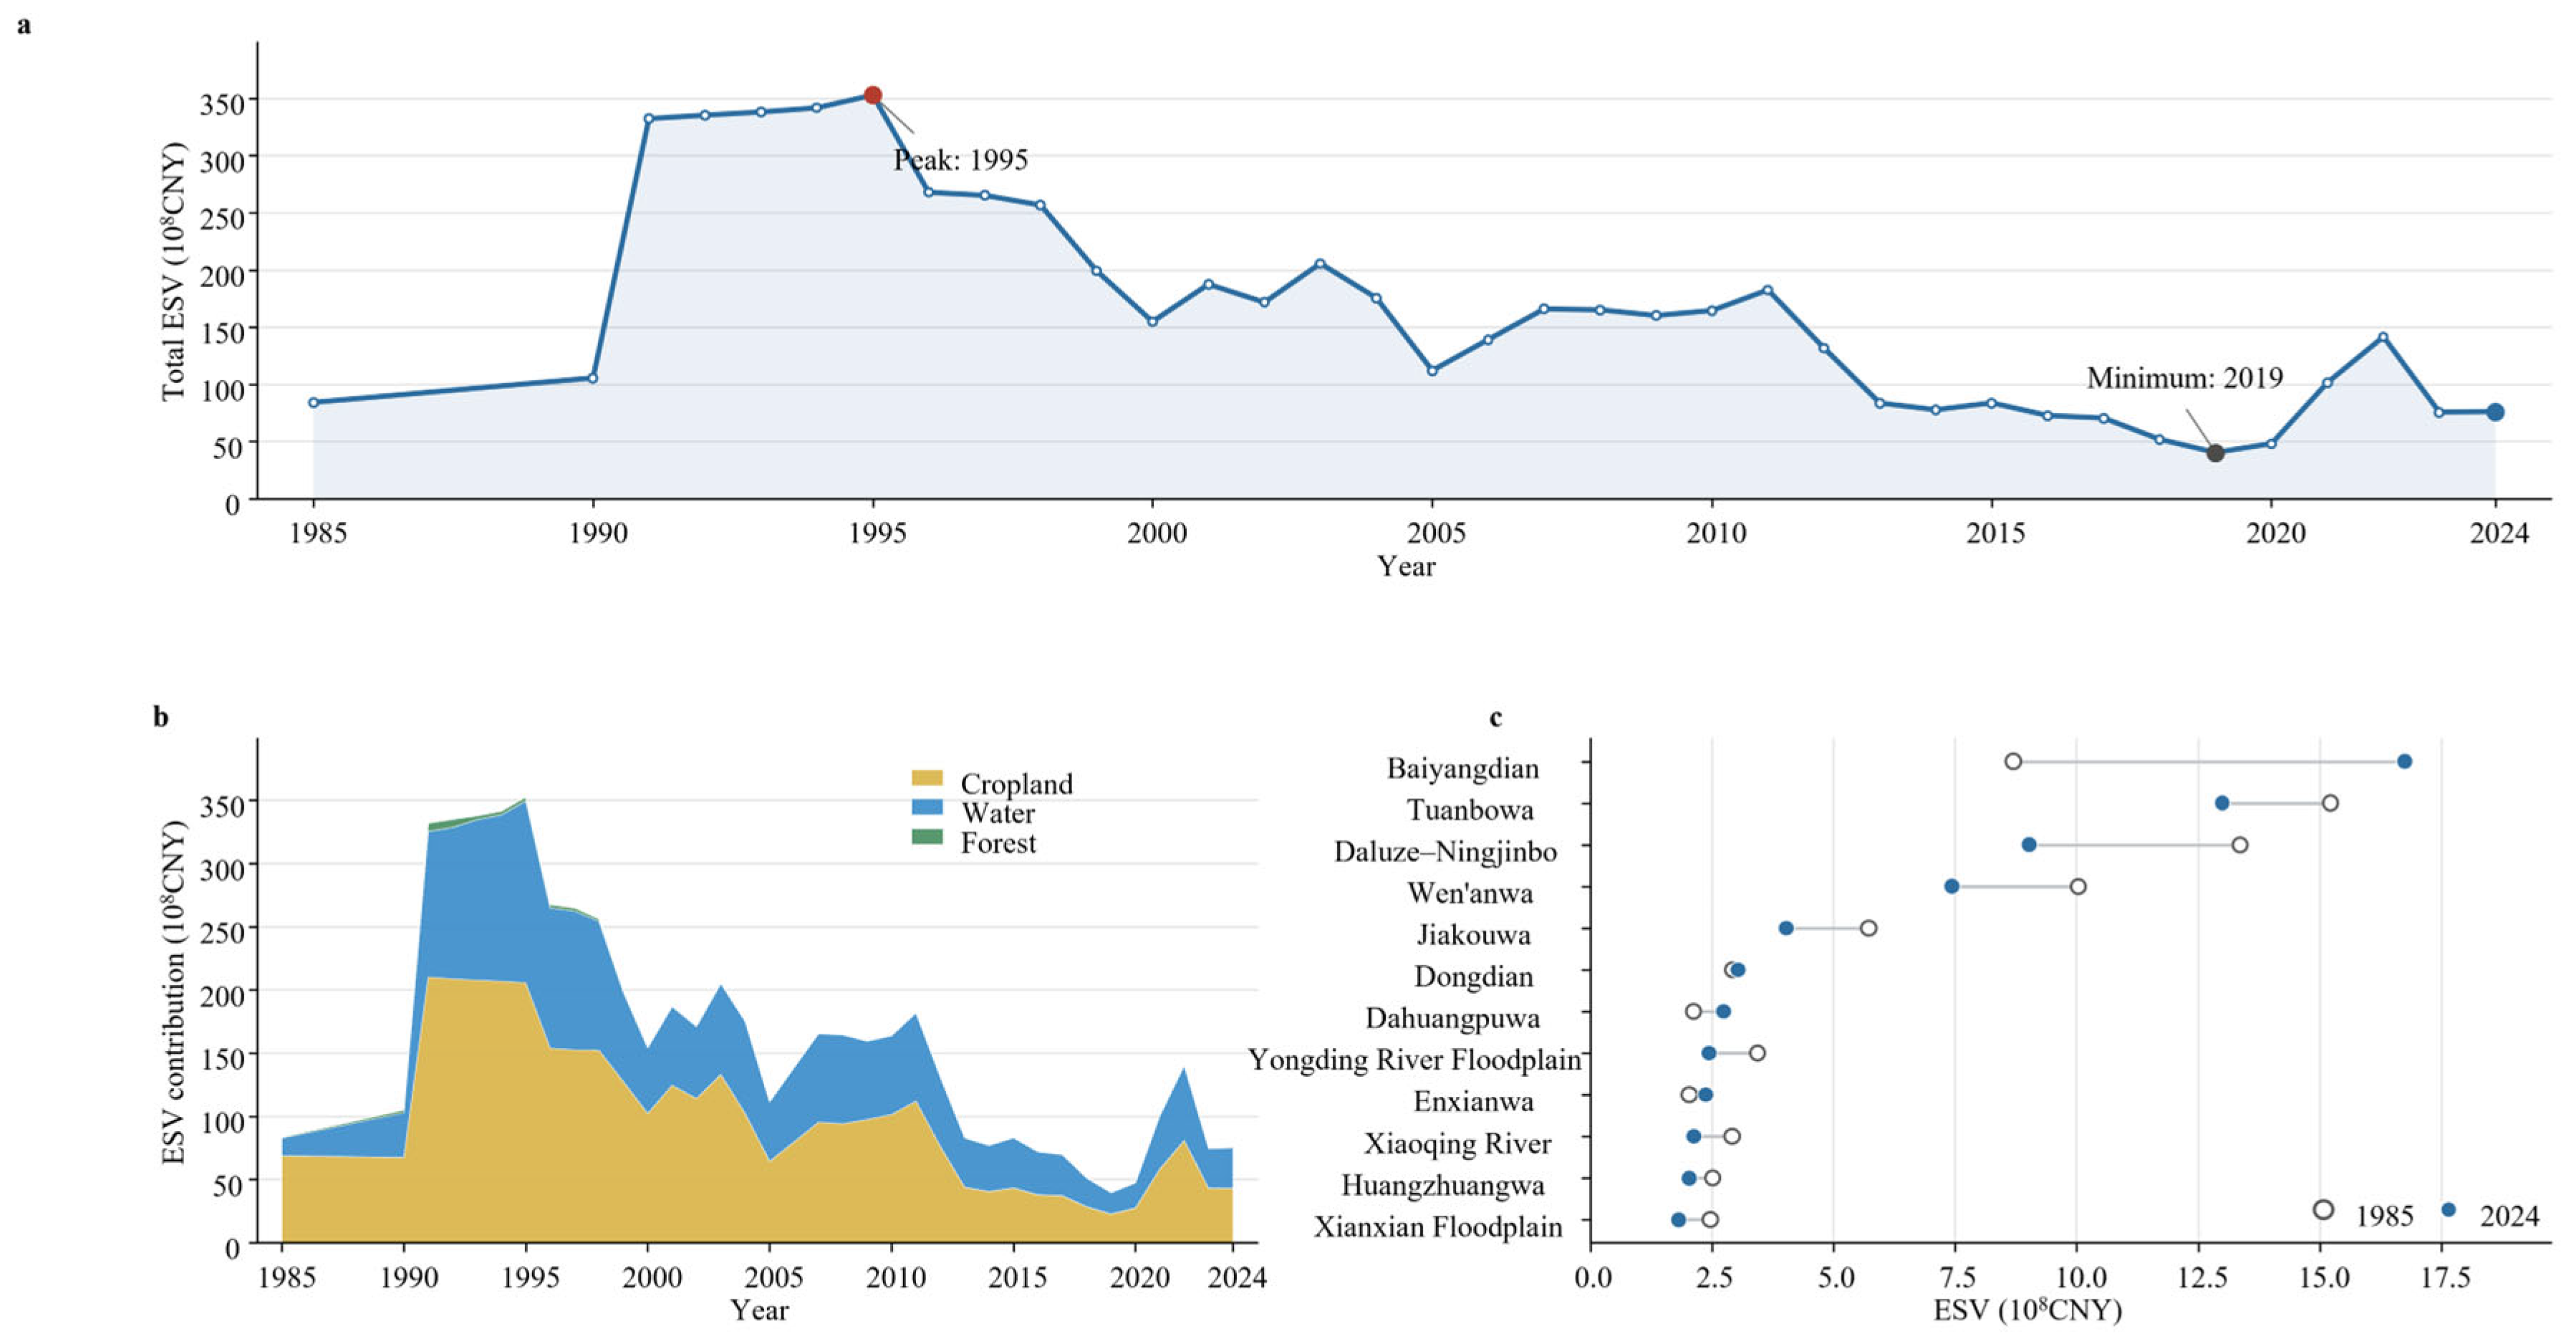
Figure 6 shows the spatial distribution of estimated ESV across the 28 FDAs. FDAs in the central and southwestern regions, including Baiyangdian, Dongdian, Wen’anwa, Jiakouwa, Tuanbowa, and Daluze–Ningjinbo, generally exhibited relatively high ESV. Many of these FDAs contained substantial areas of water bodies or wetlands, which were assigned relatively high coefficients in the valuation table used in this study. Total ESV fluctuated markedly during 1985–2024 but exhibited a modest long-term decline (Figure 7a). It decreased from 83.82 × 10⁸ CNY in 1985 to 75.91 × 10⁸ CNY in 2024, representing a cumulative reduction of 9.4%. ESV increased rapidly from 1991 to 1995 and peaked at 353.01 × 10⁸ CNY in 1995. It subsequently declined overall, reaching a minimum of 39.97 × 10⁸ CNY in 2019. ESV then rebounded and reached 141.34 × 10⁸ CNY in 2022, before decreasing to 75.26 × 10⁸ CNY in 2023 and increasing slightly to 75.91 × 10⁸ CNY in 2024. The contribution structure also changed over the study period, with the relative contribution of cropland decreasing and that of water bodies increasing (Figure 7b). The observed ESV fluctuations may be attributed to two main factors: First, climate change and declining water resource availability. An increasing trend in drought duration was observed in the HRB, with frequent drought events occurring between 1997 and 2003 [32,33]. Second, urbanization-driven LUC changes. With rapid urbanization, construction land has expanded within some FDAs, leading to an increase in impervious surfaces and a further reduction in ecosystem regulating functions.
Figure 6.
Land use and ESV in the 28 FDAs.
Figure 7.
Temporal variation in ESV and differences among FDAs. (a) Changes in total ESV during 1985–2024; (b) contributions of different land-use types to total ESV; (c) ESV across individual FDAs.
Three categories of FDAs underwent LUC restructuring dominated by cropland loss and impervious expansion. However, they differed in the magnitude and intensity of LUC change and in their ESV responses. Major FDAs experienced the largest absolute LUC changes but maintained relatively stable ESV owing to increases in water and forests. General FDAs underwent the least pronounced changes in LUC composition, yet their ESV still declined moderately. Reserved FDAs exhibited both the greatest degree of impervious expansion and the largest decline in ESV, indicating that they experienced the greatest pressure on ecosystem service provision among the three FDA categories.
ESV trajectories differed substantially among the 28 FDAs (Figure 7c). In 2024, Baiyangdian, Tuanbowa, Daluze–Ningjinbo, and Wen’anwa had relatively high estimated ESV. Compared with 1985, the ESV of Baiyangdian increased by approximately 92.5%, whereas that of Tuanbowa, Daluze–Ningjinbo, Wen’anwa, and most other FDAs decreased to varying degrees. Overall, the results reveal a fluctuating but generally downward trend in total ESV, a transition from cropland-dominated contributions to joint support by cropland and water, and pronounced spatial heterogeneity in both the direction and magnitude of ESV change.
3.3. ESV Clustering Results
K-Means clustering separated the 28 FDAs into three ESV trajectory types. Cluster I comprised Baiyangdian and Dahuangpuwa, represented a high-ESV and high-fluctuation type. Among them, Baiyangdian is classified as a major FDA, while Dahuangpuwa is a general FDA. Cluster II contains 21 FDAs, making it the cluster with the largest sample size, including six major FDAs, 10 general ones, and five reserved areas. The average ESV of this cluster was 4.95 × 10⁸ CNY. From 1985 to 2024, the average ESV decreased by 27.38% and the median ESV declined by 29.08%. The end-of-period ESV of all 21 areas was lower than the initial value, indicating that long-term decline is the most consistent characteristic of this cluster. With an average coefficient of variation of 0.549, this cluster exhibits moderate annual fluctuations and a relatively distinct long-term downward trend. Notably, all five reserved FDAs are grouped into Cluster II. This suggests that despite differences in area, initial ESV, and specific LUC composition, the reserved areas share strong consistency in comprehensive features such as ESV level, phased changes, and long-term downward trajectory. Cluster III covers five areas: Enxianwa, Dongdian, Qingdianwa, Huangzhuangwa and Yongnianwa. The average ESV of this cluster was 3.19 × 10⁸ CNY, with the figure standing at 1.74 × 10⁸ CNY in 2024. Its overall value level is lower than that of Cluster I and Cluster II. With an average coefficient of variation of 0.435, this cluster is categorized as the low-ESV and low-fluctuation type.
3.4. The Primary Driver of Ecosystem Service Dynamics
Changes in ESV were jointly driven by variations in the valuation coefficient effect and LUC change. The drivers of ESV in the FDAs exhibited a pronounced phase-dependent shift between 1985 and 2024. From 1985 to 2000, the combined ESV of the three FDA categories increased by 70.82 × 10⁸ CNY, of which 53.55 × 10⁸ CNY was attributable to the valuation coefficient effect and 17.26 × 10⁸ CNY to the LUC effect. This indicates that the early increase in ESV was driven primarily by rising ecosystem service values per unit area. From 2000 to 2015, ESV decreased by 71.20 × 10⁸ CNY. The valuation coefficient effect shifted from positive to negative, whereas the LUC effect remained positive. Therefore, the decline in ESV during this period was primarily attributable to decreasing equivalent value coefficients, while the expansion of high-value LUC types, particularly water bodies, partially offset the decline. From 2015 to 2024, ESV decreased by a further 7.53 × 10⁸ CNY, but the underlying drivers differed markedly from those in the preceding periods: the LUC effect became negative, whereas the valuation coefficient effect was slightly positive. These results indicate that ESV changes before 2015 were governed primarily by valuation parameters, whereas after 2015 they became increasingly dominated by changes in LUC composition.
4. Discussion
4.1. Analysis of Land Use Change Results
The dominant LUC transition across the 28 FDAs was characterized by the simultaneous loss of cropland and expansion of impervious surfaces. This pattern was consistent with the broader process of urbanization in the Beijing–Tianjin–Hebei region [34]. Nevertheless, the LUC composition of the FDAs remained strongly dominated by cropland, indicating that agricultural production continued to be their principal LUC function. This pattern reflected the long-standing dual role of FDAs: supporting agricultural production under normal conditions while providing temporary flood-storage space during extreme flood events. It also demonstrated the intensive use of FDA land and the close integration of agricultural production into the regional flood-management system. Consequently, when FDAs are activated for flood detention, direct impacts are likely to be concentrated in crop inundation, soil and land degradation, and disruptions to agricultural production, potentially resulting in substantial economic losses.
The continued expansion of impervious surfaces indicates sustained urban development pressure within the FDAs. In general, an increase in impervious cover would be expected to increase runoff coefficients, shorten the time of concentration, and increase peak discharge [35]. It may also increase the exposure of people, buildings, and infrastructure to flooding [36]. Collectively, these changes could undermine the natural food-regulation function of FDAs and increase the complexity of evacuation, resettlement, and compensation during flood-detention operations [37,38]. Such concerns may be particularly relevant to FDAs located near major urban areas, including the Xiaoqing River, Yongding River Floodplain, and Dongdian FDAs.
4.2. Incorporating Ecosystem Values into Compensation Mechanisms for FDA Operation
FDAs are integral components of basin-scale flood risk management systems, serving as critical “safety valves” by attenuating flood peaks, temporarily storing excess floodwater, and safeguarding major cities and other high-priority areas. In 2000, the Chinese government established the initial institutional framework for compensating losses resulting from FDA operation [39]. The revised “Measures for Compensation for the Use of Flood Detention Areas”, implemented in 2025, further expanded the eligible recipients and scope of compensation and improved the provisions governing compensation standards, funding responsibilities, and disbursement procedures. Nevertheless, the current framework remains focused primarily on direct material losses caused by FDA operation, including damage to crops, commercial aquaculture and livestock production, economic forests, housing, non-transferable agricultural machinery, major household durable goods, and livestock and poultry. The maintenance, loss, and restoration of ecosystem services have not yet been incorporated into the compensation accounting framework [40]. Our results indicate that some FDAs, particularly Baiyangdian, support substantial estimated ecosystem service values. Future assessments could therefore extend beyond the existing direct-loss compensation framework by evaluating how FDA operation affects ecosystem service provision, ecological restoration costs, and relevant beneficiaries. Verified ecological losses and restoration costs could then provide supporting evidence for developing differentiated ecological compensation mechanisms.
4.3. Implications for Land Use Management in Flood Detention Areas of the HRB
Major FDAs should prioritize controlling further large-scale expansion of impervious surfaces while protecting the spatial continuity of existing water bodies and forests [10]. Their relatively stable ESV depends on the effects generated by increases in these high-value LUC types. If these gains are reversed, substantial cropland loss and construction-related land occupation could rapidly translate into declining ESV. Management of general FDAs should recognize their weak ecological-service base. These areas had the lowest ESV per unit area in 2024 and contained relatively small proportions of high-value ecological land. Since 2015, water body loss has become a direct driver of ESV decline. Management should therefore prioritize maintaining the stability of small water bodies, drainage channels, and wetland patches to prevent further contraction of the already limited aquatic ecological space. Reserved FDAs should be prioritized for LUC regulation and ecological-function restoration. They experienced the greatest decline in the proportion of cropland, the most pronounced expansion of impervious surfaces, and the largest long-term reduction in ESV. Management should not only restrict new construction-related land occupation but also examine the spatial relationships between existing impervious surfaces and flood-conveyance corridors, low-lying areas, and river networks. Restoration should focus on water bodies and wetlands with genuine hydrological connectivity and flood-storage capacity. Effective wetland restoration requires consideration of the natural processes underlying sustainability ecosystem development, rather than focusing solely on changes in land-cover patterns [41]. In particular, restoring hydrological connections between fragmented water bodies and wetlands, while maintaining natural water-level fluctuations where compatible with flood-control requirements, may help improve ecological functions and support long-term ESV stability.
4.4. Limitations and Future Perspectives
This study revealed spatiotemporal associations between LUC patterns and estimated ESV and employed Shapley value decomposition to quantify the contributions of LUC change and variations in equivalent-value coefficients during different periods. However, the accuracy of LUC classification, particularly the distinction between wetlands and water bodies, is critical for ESV estimation and subsequent analyses [42]. Furthermore, although Shapley value decomposition quantifies the contributions of different factors to ESV changes, it does not establish causal relationships between ESV dynamics and external drivers, such as floods, droughts, urbanization, ecological restoration policies, and water-management operations. Therefore, future research should integrate hydrological and process-based ecosystem-service models to better represent ecosystem conditions, ecological processes, and functional responses [43,44]. Combining these models with data on flood-hazard exposure, service beneficiaries, opportunity costs, ecological restoration costs, compensation requirements, and stakeholder preferences would provide a stronger basis for developing and evaluating management and ecological compensation options tailored to individual FDAs.
5. Conclusions
5.1. Main Conclusions
This study provides an annual assessment of LUC change and equivalent-factor-based ESV dynamics across all 28 FDAs in the HRB from 1985 to 2024. It further identifies long-term ESV trajectories and determines the dominant drivers of ESV change during different periods. The main findings are as follows:
- (1)
- Cropland remained the dominant LUC class, although its area declined substantially, while impervious surfaces expanded predominantly through cropland conversion. This pattern reflects increasing development pressure within areas that continue to perform agricultural and flood-storage functions.
- (2)
- The estimated ESV fluctuated markedly and declined from 83.82 to 75.91 × 10⁸ CNY (−9.4%), with a peak of 353.01 × 10⁸ CNY in 1995 and a minimum of 39.97 × 10⁸ CNY in 2019. ESV trajectories differed markedly among individual FDAs.
- (3)
- Shapley decomposition showed that equivalent factors dominated the 1985–2000 increase and the 2000–2015 decline, whereas LUC change dominated the decline after 2015.
5.2. Suggestions
It is recommended to develop differentiated management and compensation strategies according to the LUC characteristics and ESV dynamics of different FDA categories. For key FDAs, priority should be given to protecting water bodies and other high-value ecological land through conservation incentives. For example, the Baiyangdian FDA, a key FDA classified as a high-ESV and high-fluctuation type, should prioritize the protection of existing water and wetlands while maintaining their hydrological connectivity. For general FDAs, targeted financial support should focus on the conservation and maintenance of small water bodies, wetlands, and drainage networks. For reserved FDAs, ecological restoration efforts should prioritize areas experiencing substantial LUC changes and ESV declines, while compensation mechanisms associated with LUC restrictions could also be explored. Furthermore, ESV assessments could provide supplementary information for identifying ecological conservation priorities and guiding the allocation of ecological compensation funds.
Supplementary Materials
The following supporting information can be downloaded at: https://www.mdpi.com/article/10.3390/su182111390/s1, Figure S1: The classification of the 28 FDAs; Table S1. Ecosystem service value equivalent per unit area.
Author Contributions
Conceptualization, Y.L. and L.H.; methodology, Y.L.; software, Y.L.; validation, Y.L., L.H. and E.J.; formal analysis, X.L.; investigation, X.L.; resources, Z.D.; data curation, X.L. and Z.D.; writing—original draft preparation, Y.L. and L.H.; writing—review and editing, Y.L. and L.H.; visualization, E.J.; supervision, E.J.; project administration, X.L. and Z.D.; funding acquisition, X.L. and Z.D. All authors have read and agreed to the published version of the manuscript.
Funding
This research was funded by the National Natural Science Foundation of China (U2243601, 52409027).
Institutional Review Board Statement
Not applicable.
Informed Consent Statement
Not applicable.
Data Availability Statement
The original contributions presented in this study are included in the article/supplementary material. Further inquiries can be directed to the corresponding authors.
Conflicts of Interest
Authors X.L. and Z.D. were employed by the company China Water Resources Beifang Investigation, Design and Research Co., Ltd. The remaining authors declare that the research was conducted in the absence of any commercial or financial relationships that could be construed as a potential conflict of interest.
References
- Dottori, F.; Szewczyk, W.; Ciscar, J.-C.; Zhao, F.; Alfieri, L.; Hirabayashi, Y.; Bianchi, A.; Mongelli, I.; Frieler, K.; Betts, R.A.; et al. Increased human and economic losses from river flooding with anthropogenic warming. Nat. Clim. Change 2018, 8, 781–786. [Google Scholar] [CrossRef] [Scilit]
- Leskens, J.G.; Brugnach, M.; Hoekstra, A.Y.; Schuurmans, W. Why are decisions in flood disaster management so poorly supported by information from flood models? Environ. Model. Softw. 2014, 53, 53–61. [Google Scholar] [CrossRef] [Scilit]
- Cheng, Y.; Xia, J.; Fang, H.; Zhou, M.; Zhou, Z.; Lu, J.; Li, D.; Falconer, R.A.; Bai, Y. Modelling of Flood Risks to People’s Life and Property in the Lower Yellow River Under Different Floodplain Management Modes. Engineering 2025, 51, 240–253. [Google Scholar] [CrossRef] [Scilit]
- Luo, Q.; Feng, L.; Park, E.; Walling, D.E.; Huang, L.; Wang, M.; Woolway, R.I.; Fang, H.; Gong, J. Global net increase in surface water connectivity in river–floodplain systems. Nat. Geosci. 2026, 19, 556–564. [Google Scholar] [CrossRef] [Scilit]
- Amirnejad, H.; Hosseini, S.; Azadi, H. Payment for ecosystem services of the Hyrcanian forests based on stakeholder preferences for flood risk mitigation. Ecosyst. Serv. 2026, 79, 101834. [Google Scholar] [CrossRef] [Scilit]
- Asadzadeh, M.; Umirov, N.; Kim, S.J. Water detention structures as a flood mitigation strategy: A case study of the Elgin Creek Basin. J. Hydrol.-Reg. Stud. 2026, 65, 103347. [Google Scholar] [CrossRef] [Scilit]
- Hawker, L.; Darby, S.E.; Slater, L.; Parsons, D.R.; Boothroyd, R.J.; Ashworth, P.J.; Cloke, H.; Delorme, P.; Gebrechorkos, S.H.; Griffith, H.; et al. River channel change can affect flood hazard and impact substantially. Commun. Earth Environ. 2026, 7, 585. [Google Scholar] [CrossRef] [Scilit] [PubMed]
- Deng, C.; Fu, J.; Zhang, G.; Liu, Y.; Li, S. Network structural-functional mismatch dominates the cascading processes of flood regulation service flows. Ecol. Eng. 2026, 226, 107936. [Google Scholar] [CrossRef] [Scilit]
- Murphy, D.; Weatherill, J.; Henriques, R.; Quishi, X.; Harrison, S. A holistic study on the effects of a rural flood detention basin: Flood peaks, water quality and grass growth. J. Environ. Manag. 2025, 373, 123858. [Google Scholar] [CrossRef] [Scilit] [PubMed]
- Zhang, F.; Xie, C.; Liu, H.; Zhou, T.; Shan, B.; Chen, J. Ecological conservation redline delineation in flood detention areas: A case study in Anxiang County, Yangtze River Basin, China. J. Clean. Prod. 2024, 462, 142662. [Google Scholar] [CrossRef] [Scilit]
- Baral, H.; Keenan, R.J.; Sharma, S.K.; Stork, N.E.; Kasel, S. Spatial assessment and mapping of biodiversity and conservation priorities in a heavily modified and fragmented production landscape in north-central Victoria, Australia. Ecol. Indic. 2014, 36, 552–562. [Google Scholar] [CrossRef] [Scilit]
- Batabyal, A.A.; Kahn, J.R.; O’Neill, R.V. On the scarcity value of ecosystem services. J. Environ. Econ. Manag. 2003, 46, 334–352. [Google Scholar] [CrossRef] [Scilit]
- Wang, Y.; Zhou, Y.; Zhang, X.; Franz, K.J.; Jia, G. Water regulation mitigates but does not eliminate water scarcity under rapid economic growth in the Haihe River basin. Resour. Conserv. Recycl. 2025, 215, 108098. [Google Scholar] [CrossRef] [Scilit]
- Li, Y.; Wu, H.; Blaschke, T.; Pradhan, B.; Mohamed Shariff, A.R.B.; Avtar, R.; Lin, A.; Shao, W. Integrating future land use uncertainty and spatial scales into ecosystem service degradation risk assessment for urban ecological management. Appl. Geogr. 2026, 186, 103860. [Google Scholar] [CrossRef] [Scilit]
- Costanza, R.; d’Arge, R.; de Groot, R.; Farber, S.; Grasso, M.; Hannon, B.; Limburg, K.; Naeem, S.; O’Neill, R.V.; Paruelo, J.; et al. The value of the world’s ecosystem services and natural capital. Nature 1997, 387, 253–260. [Google Scholar] [CrossRef] [Scilit]
- Xie, G.; Zhang, C.; Zhang, C.; Xiao, Y.; Lu, C. The value of ecosystem services in China. Resour. Sci. 2015, 37, 1740–1746. (In Chinese) [Google Scholar] [CrossRef]
- Xu, J.; Xiao, Y.; Xie, G.; Jiang, Y. Ecosystem Service Flow Insights into Horizontal Ecological Compensation Standards for Water Resource: A Case Study in Dongjiang Lake Basin, China. Chin. Geogr. Sci. 2019, 29, 214–230. [Google Scholar] [CrossRef] [Scilit]
- Kong, Y.; He, W.; Yuan, L.; Zhang, Z.; Gao, X.; Zhao, Y.e.; Mulugeta Degefu, D. Decoupling economic growth from water consumption in the Yangtze River Economic Belt, China. Ecol. Indic. 2021, 123, 107344. [Google Scholar] [CrossRef] [Scilit]
- Liu, Y.; Qu, B.; Jiang, E.; Hao, L.; Zhu, Y.; Jing, Y. Allocating payments for ecosystem services under future multiple scenarios in the Yellow River Basin, China. Ecol. Indic. 2023, 157, 111232. [Google Scholar] [CrossRef] [Scilit]
- Gao, X.; Zeng, S.; Shen, J.; Yang, X.; Kang, L.; Chi, C.; Song, R. Predicting payment for ecosystem services regarding land use: A simulation study in China. Environ. Impact Assess. Rev. 2023, 98, 106972. [Google Scholar] [CrossRef] [Scilit]
- Zhou, Z.; Sun, X.; Zhang, X.; Wang, Y. Inter-regional ecological compensation in the Yellow River Basin based on the value of ecosystem services. J. Environ. Manag. 2022, 322, 116073. [Google Scholar] [CrossRef] [Scilit] [PubMed]
- Chen, J.; Fu, H.; Chen, S.T. Multi-Scenario Simulation and Assessment of Ecosystem Service Value at the City Level from the Perspective of “Production-Living-Ecological” Spaces: A Case Study of Haikou, China. Land 2023, 12, 21. [Google Scholar] [CrossRef] [Scilit]
- Chen, Z.H.; Zhang, Q.X.; Li, F.; Shi, J.L. Comprehensive Evaluation of Land Use Benefit in the Yellow River Basin from 1995 to 2018. Land 2021, 10, 643. [Google Scholar] [CrossRef] [Scilit]
- Zhai, T.; Zhang, D.; Zhao, C. How to optimize ecological compensation to alleviate environmental injustice in different cities in the Yellow River Basin? A case of integrating ecosystem service supply, demand and flow. Sustain. Cities Soc. 2021, 75, 103341. [Google Scholar] [CrossRef] [Scilit]
- Zhang, Y.; Wang, Y.; Fu, B.; Lu, Y.; Liang, X.; Yang, Y.; Ma, R.; Yan, S.; Wu, X. Identification of critical ecological areas using the ecosystem multifunctionality-stability-integrity framework: A case study in the Yellow River basin, China. J. Environ. Manag. 2023, 348, 119296. [Google Scholar] [CrossRef] [Scilit] [PubMed]
- Li, H.; Wang, Q.; Zuo, M.; Long, X.; Zang, X. Scale effects and driving mechanisms of flood in a multilevel sub-basin perspective—A case study of Haihe River Basin, China. Environ. Impact Assess. Rev. 2025, 115, 107984. [Google Scholar] [CrossRef] [Scilit]
- Xu, M.; Wang, W.; Xia, C.; Wang, Z.; Guo, X. Spatial mismatch and association network of urban flood risk and resilience from a supply–demand perspective: A case study of Beijing, China. Sustain. Cities Soc. 2026, 148, 107691. [Google Scholar] [CrossRef] [Scilit]
- Xu, X.; Yang, D.; Yang, H.; Lei, H. Attribution analysis based on the Budyko hypothesis for detecting the dominant cause of runoff decline in Haihe basin. J. Hydrol. 2014, 510, 530–540. [Google Scholar] [CrossRef] [Scilit]
- Yang, J.; Huang, X. The 30 m annual land cover dataset and its dynamics in China from 1990 to 2019. Earth Syst. Sci. Data 2021, 13, 3907–3925. [Google Scholar] [CrossRef] [Scilit]
- Budría, S.; Bravo-Chew, L. Segmentation of energy-poor households using K-means clustering: Insights into energy poverty dynamics. J. Clean. Prod. 2026, 574, 148996. [Google Scholar] [CrossRef] [Scilit]
- Shorrocks, A.F. Decomposition procedures for distributional analysis: A unified framework based on the Shapley value. J. Econ. Inequal. 2013, 11, 99–126. [Google Scholar] [CrossRef] [Scilit]
- Ling, M.; Guo, X.; Shi, X.; Han, H. Temporal and spatial evolution of drought in Haihe River Basin from 1960 to 2020. Ecol. Indic. 2022, 138, 108809. [Google Scholar] [CrossRef] [Scilit]
- Wei, J.; Wang, W.-g.; Huang, Y.; Ding, Y.-m.; Fu, J.-y.; Chen, Z.-f.; Xing, W.-q. Drought variability and its connection with large-scale atmospheric circulations in Haihe River Basin. Water Sci. Eng. 2021, 14, 1–16. [Google Scholar] [CrossRef] [Scilit]
- Du, H.; Zhao, L.; Zhang, P.; Li, J.; Yu, S. Ecological compensation in the Beijing-Tianjin-Hebei region based on ecosystem services flow. J. Environ. Manag. 2023, 331, 117230. [Google Scholar] [CrossRef] [Scilit] [PubMed]
- Li, D.; Wu, S.; Liu, L.; Liang, Z.; Li, S. Evaluating regional water security through a freshwater ecosystem service flow model: A case study in Beijing-Tianjian-Hebei region, China. Ecol. Indic. 2017, 81, 159–170. [Google Scholar] [CrossRef] [Scilit]
- Zhai, Y.; Zhai, G.; Yu, Z.; Lu, Z.; Chen, Y.; Liu, J. Coupling coordination between urbanization and ecosystem services value in the Beijing-Tianjin-Hebei urban agglomeration. Sustain. Cities Soc. 2024, 113, 105715. [Google Scholar] [CrossRef] [Scilit]
- Jacobson, C.R. Identification and quantification of the hydrological impacts of imperviousness in urban catchments: A review. J. Environ. Manag. 2011, 92, 1438–1448. [Google Scholar] [CrossRef] [Scilit] [PubMed]
- Lin, Y.; Hu, X.; Wang, F.; Tang, Q.; Zhao, Y.; Li, Y.; Li, T.; Liu, C.; Wang, X.; Li, D. Quantifying the Lifespan of 3D Flood Structures: Unlocking the Potential of Flood Detention Areas for Enhanced Flood Control in China. Water Resour. Res. 2025, 61, e2025WR039992. [Google Scholar] [CrossRef] [Scilit]
- Li, S.; Ge, X.; Jin, G.; Lou, Z.; Yang, H. Flood dynamic monitoring and XGBoost-SHAP based risk assessment: A case study of the 23·7 extreme rainstorm in BTH region, China. Environ. Sustain. Indic. 2025, 28, 101020. [Google Scholar] [CrossRef] [Scilit]
- Tran, V.N.; Ivanov, V.Y.; Huang, W.; Murphy, K.; Daneshvar, F.; Bednar, J.H.; Alexander, G.A.; Kim, J.; Wright, D.B. Connectivity in urbanscapes can cause unintended flood impacts from stormwater systems. Nat. Cities 2024, 1, 654–664. [Google Scholar] [CrossRef] [Scilit]
- Zhi, L.; Shao, D.; Xie, X.; Li, X.; Cui, B.; Bai, J. Natural process-based coastal wetland restoration by relocating river flow paths in a river-dominated delta. Commun. Earth Environ. 2025, 6, 608. [Google Scholar] [CrossRef] [Scilit]
- Yin, L.; Wang, L.; Behrangi, A.; Niu, G.-Y.; Lu, S.; Zheng, W. LACC: A lightweight attention-conditional convolution network for long-term Wetland classification. Environ. Res. 2026, 302, 124613. [Google Scholar] [CrossRef] [Scilit] [PubMed]
- Cumming, G.S. Protected area management has significant spillover effects on vegetation. Nature 2026, 650, 642–651. [Google Scholar] [CrossRef] [Scilit] [PubMed]
- Yue, C.; Xu, M.; Ciais, P.; Tao, S.; Shen, H.; Chang, J.; Li, W.; Deng, L.; He, J.; Leng, Y.; et al. Contributions of ecological restoration policies to China’s land carbon balance. Nat. Commun. 2024, 15, 9708. [Google Scholar] [CrossRef] [Scilit] [PubMed]
Disclaimer/Publisher’s Note: The statements, opinions and data contained in all publications are solely those of the individual author(s) and contributor(s) and not of MDPI and/or the editor(s). MDPI and/or the editor(s) disclaim responsibility for any injury to people or property resulting from any ideas, methods, instructions or products referred to in the content. |
© 2026 by the authors. Licensee MDPI, Basel, Switzerland. This article is an open access article distributed under the terms and conditions of the Creative Commons Attribution (CC BY) license.