


Abstract
To examine whether a place-based energy-transition policy improves corporate environmental, social, and governance (ESG) performance, we develop research adopting an interactional perspective between micro-level corporate behavior and the macro-level policy environment. Our analysis utilizes 37,817 firm-year observations from Chinese A-share firms listed in Shanghai and Shenzhen over the period 2009–2023. The empirical results are as follows. Firstly, the policy has a significantly positive effect on corporate ESG performance. Secondly, this effect is transmitted through greater environmental protection expenditure, stronger green innovation, and increased city-level credit supply. Thirdly, media attention further amplifies the policy impact. Finally, the effect is stronger among non-state-owned firms, mature-stage firms, high-carbon-intensity firms, and firms operating in less competitive markets. These findings clarify how local energy-transition initiatives shape corporate sustainability and highlight the complementary roles of environmental investment, green innovation, credit provision, and information scrutiny.
1. Introduction
Adhering to green development is essential for sustainable growth. Globally, countries are increasingly emphasizing corporate environmental, social, and governance (ESG) performance [1]. Advancing corporate ESG practice aligns with China’s new development philosophy, fostering the “dual circulation” economic pattern and achieving national “dual carbon” goals of peaking emissions and carbon neutrality [2]. New energy demonstration cities represent urgent steps toward optimizing energy structure, expanding clean energy use, improving urban environmental quality, and realizing green, sustainable development. As core actors, enterprises reduce carbon emissions, drive green technological innovation, and pursue high-quality growth. Despite policy incentives and market opportunities from these cities, firms face significant challenges, including high green innovation costs and technological barriers in green industries. Thus, enhancing corporate ESG performance in new energy demonstration cities serves as a critical entry point for advancing green development and balancing economic efficiency with environmental sustainability [3].
The corporate ESG evaluation system integrates environmental, social, and governance factors into a framework for assessing a firm’s sustainable development capacity. Existing literature on corporate ESG performance primarily focuses on its impacts on financial outcomes and firm value. Drawing on Freeman’s stakeholder theory [4], scholars argue that superior ESG performance enhances stakeholder trust and support, thereby improving financial performance, increasing firm value, and alleviating financing constraints [5,6,7,8]. Recent studies, however, suggest a negative or insignificant correlation between ESG performance and firm performance [9,10], with some evidence indicating that strong ESG engagement may even adversely affect firm value [11]. Key internal factors—debt financing costs, equity access, and governance structures—are closely linked to ESG outcomes. Firms with higher ESG ratings typically face lower debt costs and better equity opportunities [12]. Additionally, ref. [13] find that gender diversity on corporate boards, especially female director inclusion, significantly enhances ESG performance. External environmental conditions introduce uncertainty: worsening regional air pollution may prompt stronger ESG practices, while rising operational uncertainty can heighten awareness of ESG’s strategic value and drive action [14]. Firms also respond heterogeneously to external changes based on ownership. Studies show that foreign-invested and family-owned enterprises improve ESG performance under sanctions, whereas state-owned enterprises often prioritize other strategic areas and exhibit weaker ESG focus [15].
Current research indicates substantial progress in research on corporate ESG performance. Existing literature primarily focuses on the policy effectiveness and technological applications of new energy cities [16,17,18,19,20,21], with relatively few studies systematically examining their influence on corporate ESG performance. As a key policy instrument and practical platform for advancing sustainable development and the green economy [22], the relationship between new energy demonstration city initiatives and firms’ ESG performance has not been thoroughly investigated. The development of these demonstration cities involves government policy design, technological innovation, and infrastructure enhancement, and also relies heavily on the active participation and coordination of enterprises. However, there is a lack of in-depth exploration regarding corporate ESG behavior within the process of new energy demonstration city development. Furthermore, the policy’s influence may vary across industries and firm characteristics, suggesting potential heterogeneity in ESG outcomes. To date, research comparing ESG performance among different types of enterprises within the context of new energy demonstration city construction remains limited, highlighting the need for further empirical investigation.
Building on this foundation, the present study employs the construction of new energy demonstration cities as a quasi-natural experiment to systematically examine the impact of this policy initiative on corporate ESG performance. The marginal contributions of this paper are threefold. First, it adopts an interactional perspective between micro-level corporate behavior and the macro-level policy environment to explore how the construction of new energy demonstration cities influences firms’ ESG performance. This perspective deepens understanding of the dynamic relationship between policy interventions and corporate behavioral responses, enriching the existing body of research. Second, the study analyzes the mechanisms through which the policy affects ESG performance across three dimensions: corporate environmental investment, green innovation, and urban credit level. This multidimensional approach not only broadens the theoretical scope of ESG research but also highlights the synergistic effects among policy tools, corporate capabilities, and urban development. Third, through firm-level heterogeneity analysis, the paper investigates behavioral differences among enterprises during the energy transition and their underlying drivers. This multi-layered analytical framework provides novel insights into the heterogeneous characteristics of corporate ESG performance across different firm types.
2. Theoretical Framework and Research Hypothesis
The construction of new energy demonstration cities represents a core strategy for urban sustainability and a key driver of corporate ESG performance [18,23,24]. From an institutional theory perspective, coercive policies and incentive-based instruments collectively shape a regulatory field that internalizes environmental externalities by increasing the cost of “environmental negative externality internalization” [25]. This encourages firms to integrate carbon footprint optimization into their core strategies, thereby directly enhancing the environmental (E) dimension of ESG performance. The effect extends beyond the improvement in tangible indicators such as energy intensity. It also stimulates innovations in life-cycle management through supply-chain carbon traceability. Demands for climate-risk disclosure and the growth of green consumer preferences drive firms to institutionalize governance (G) responses [26]. Meanwhile, the “just transition” agenda further broadens the social (S) dimension [27].
Research indicates that the establishment of new energy demonstration cities reduces transition costs and systematically enhances firms’ environmental ESG performance [28]. On one hand, these cities send a clear message of green transformation to the market, signaling firms’ “sustainable development capability” to investors and thereby lowering equity financing costs [29]. On the other hand, policy pressure also compels firms to establish dedicated transformation departments and internal governance frameworks, shifting ESG performance from a voluntary initiative to a mandatory responsibility. This transition is manifested in concrete practices, such as energy conservation, emission reduction, and green product innovation.
H1.
The new energy demonstration city policy has a significant impact on corporate ESG performance.
During the construction of new energy demonstration cities, regulatory pressures have reshaped the strategic nature of firms’ environmental expenditures. Mandatory clean-energy substitution targets and deadlines for phasing out high-emission equipment have been imposed, thereby increasing the cost of environmental non-compliance [30]. This heightened regulatory intensity compels firms to increase defensive expenditures—such as end-of-pipe treatment facilities—thereby directly improving ESG environmental scores. Simultaneously, the incentive mechanisms of demonstration-city policies promote a shift toward preventive environmental investment. Fiscal instruments and tax incentives embedded in these policies reduce the marginal cost of green inputs, extending their positive impact to firms’ overall ESG performance.
From a resource-based perspective, increased environmental spending is often accompanied by internal governance restructuring. Investment and financing for large-scale environmental equipment encourage the establishment of green financial control systems; pollution abatement improves community relations [31]; and green factory certification enhances employee identification and engagement [32]. Thus, environmental expenditure transforms from a passive compliance cost into a proactive source of competitive advantage—shifting from an “expense item” to a “capital asset”.
H2.
The new energy demonstration city policy enhances corporate ESG performance by increasing firms’ environmental expenditures.
Within new energy demonstration cities, intensified market competition compels firms not only to secure market share in traditional sectors but also to attain leadership in green innovation and the low-carbon economy. To maintain a competitive edge, firms should enhance their environmental technologies, optimize resource allocation, and reduce pollutant emissions [33]. Regarding local governments, they have established regional laboratories and pilot platforms that substantially reduce firms’ R&D costs and attract high-end talent, thereby fostering the pooling of human capital [34]. These initiatives transform green innovation from isolated breakthroughs into systemic capabilities. Green technological innovation, in turn, drives process improvements and reshapes firms’ cost structures, lowering carbon intensity per unit of output below industry thresholds and improving ESG ratings [35].
Furthermore, governments prioritize the procurement of green-certified products, granting firms demand-side price premiums. This not only ensures stable revenue streams but also enhances firms’ social (S) dimension of ESG performance [36]. In competitive markets, firms should also respond to consumer expectations by improving the environmental attributes of their products and reducing carbon emissions and pollution, thereby upgrading their ESG performance and strengthening market position.
H3.
The new energy demonstration city policy promotes corporate ESG performance by enhancing firms’ green innovation.
The new energy demonstration city policy restructures regional financial ecosystems by strategically redirecting urban credit from traditional high-carbon industries to green and low-carbon domains. On one hand, as a form of coercive institutional pressure, ESG factors are internalized as core criteria in loan approval processes. To access scarce financial resources, firms must improve their ESG performance to meet the new institutional standards and maintain operational legitimacy [37].
On the other hand, regional carbon-asset pledge platforms assign clear collateral value to firms’ carbon assets and green technology patents, sending strong signals of environmental advantage and long-term potential to the market [38]. This incentivizes banks to offer lower-cost credit, thereby creating a virtuous cycle where improved ESG performance results in reduced financing costs. Furthermore, by accepting carbon quotas and green patents as eligible collateral, these platforms contribute to reducing banks’ risk exposure. Guided by the policy, the structure of bank lending undergoes a fundamental transformation: local banks integrate firms’ carbon intensity and clean-technology patent counts into their loan assessment models, offering lower interest rates to firms with higher ESG ratings. Commercial banks in demonstration cities also establish minimum credit quotas for industries such as photovoltaics and energy storage, extend loan maturities to align with renewable investment cycles, and provide long-term financing that enables firms to pursue irreversible clean-energy investments [39].
H4.
The new energy demonstration city policy promotes corporate ESG performance by enhancing urban credit levels.
3. Study Design
3.1. Data Source and Sample Selection
We constructed a panel dataset of A-share companies listed in Shanghai and Shenzhen between 2009 and 2023. The initial sample was refined as follows. First, following [40], the real estate sector was excluded due to its highly leveraged, capital-intensive, presale-based business model and land-reserve-dependent asset structure, which differ substantially from those of typical productive firms. Consequently, firms in both the financial and real estate sectors were excluded. Second, companies designated as ST, *ST, or PT were removed. Third, firms with substantial missing data were discarded. Finally, observations with a debt-to-asset ratio greater than one were eliminated. After screening, the final dataset comprised 37,817 firm-year observations. Firm-level ESG performance indicators were obtained from the China Securities ESG Rating System, while other variables were sourced from the China Urban Statistical Yearbook, the China Energy Statistical Yearbook, the CEI Statistical Database, CSMAR, and the WIND database. To mitigate the influence of outliers on regression analyses, continuous variables were winsorized at the 1% level in both tails.
3.2. Variables
3.2.1. Dependent Variable: Corporate ESG Performance
The dependent variable is firms’ environmental, social and governance (ESG) performance. Given discrepancies in coverage, standards and time spans among rating agencies, following [41], we select ESG rating scores published by the China Securities Index (CSI) as the measure of listed firms’ ESG performance. Higher scores indicate stronger ESG outcomes.
3.2.2. Core Explanatory Variable: New Energy Demonstration City Policy
The core explanatory variable (didit) is a dummy variable capturing the effect of the new energy demonstration city policy. It is constructed as the interaction of a treatment-group dummy and a policy dummy, that is didit = postt × treati. The National Energy Administration released the first list of demonstration cities in 2014, which is taken as the policy implementation point. The treatment-group dummy treati equals 1 if a listed firm is located in a city approved as a demonstration zone and 0 otherwise. The policy dummy postt equals 1 for treatment-group firms in 2014 and later years, and 0 otherwise. The treatment status is based on the National Energy Administration’s Notice on the List of New Energy Demonstration Cities (Industrial Parks) (the First Batch), announced in 2014. Although the notice uses the term “first batch”, the National Energy Administration did not subsequently issue a second list or supplementary list under the same programme. Later initiatives, such as the high-proportion new energy demonstration cities in 2016 and rural energy revolution pilot counties in 2023, had different policy objectives, evaluation criteria, and instruments and are therefore excluded from the treated group. Accordingly, the year 2014 is used as the common policy implementation year, following the conventional treatment-by-post interaction approach [42].
3.2.3. Control Variables
Following prior ESG research [43], we incorporate a set of firm-level control variables that may affect ESG performance. Specifically, firm size (lnsize) is measured as the natural logarithm of total assets, firm age (lnage) is calculated as the difference between the sample year and the firm’s founding year, plus one, leverage (lev) is measured as the ratio of total liabilities to total assets, profitability (roa) is measured as the ratio of net profit to total assets, cash flow ratio (cashflow) is defined as the ratio of cash flow from operating activities to total assets, fixed asset ratio (fixed) is measured as the proportion of fixed assets to total assets, CEO duality (dual) is assigned a value of 1 if the positions of chairperson and general manager are held by the same individual, and 0 otherwise, and ownership concentration (top1) is measured as the shareholding ratio of the largest shareholder. Detailed variable definitions are presented in Table 1.
Table 1.
Descriptive Statistics of Main Variables.
3.3. Descriptive Statistics
Table 1 reports the descriptive statistics of the main variables. The mean ESG score of firms is 73.498, with a minimum of 58.910 and a maximum of 83.930, indicating that most firms perform above the industry benchmark. The mean value of the policy shock variable (did) is 0.251, suggesting that 25.1% of the sample is affected by the energy transition policy, which aligns with real-world conditions. Firm size (lnsize) has a mean of 22.203, highlighting the predominance of large firms in the sample. The mean leverage ratio (lev) is 41.8%, close to the warning threshold, and its standard deviation of 20.8% reflects substantial variation in capital structures across industries. The mean fixed asset ratio (fixed) is 20.2%, suggesting that most firms in the sample are asset-light. CEO duality (dual) occurs in 28.7% of firms, consistent with governance characteristics of emerging markets. Ownership concentration (top1) averages 34.1%, confirming the prevalence of a “dominant shareholder” structure. Profitability (roa) averages 6.2%, with some negative values, underscoring heterogeneity in operational risks. The mean cash flow ratio (cashflow) is 4.7%, indicating that most firms possess basic debt-servicing capacity, although the standard deviation of 6.9% suggests considerable variation in cash flow stability.
3.4. Model Specification
We treat the establishment of new energy demonstration cities as a quasi-natural experiment. To identify the effect of this policy on firms’ ESG performance, we employ a difference-in-differences (DID) model, specified as follows:
where i denotes the firm, j the industry, and t the year. The dependent variable ESGit represents the ESG performance of firm i in year t. didit = postt × treati. The variable treat is a policy dummy that equals 1 for firms located in pilot cities and 0 otherwise, while post is a time dummy that equals 1 for the post-policy period (2014 onwards) and 0 otherwise. controlsit is the set of control variables, capturing firm-level time-varying characteristics. ηt denotes the year fixed effects, θi the firm fixed effects, and δj the industry fixed effects. εijt is the error term. Following standard practice in the literature, all standard errors are clustered at the firm level to account for within-firm correlation over time.
ESGit = β0 + β1didit + γcontrolsit + ηt + θi + δj + εijt
3.5. Testing Methods
3.5.1. Parallel Trend Testing Method
A key prerequisite for the credibility of the Difference-in-Differences (DID) estimates is the parallel trend assumption. We test this assumption using an event-study approach, examining whether firms in demonstration and non-demonstration cities exhibited similar trends in ESG performance prior to the policy. Specifically, we align the post-policy years into a five-year window and exclude the year immediately preceding the policy (z ≠ 1) to avoid perfect collinearity.
3.5.2. Mediation Effect Testing Methods
Given the clear limitations of the traditional three-step mediation test in causal inference [44], we adopt a four-step mediation framework [45,46]. This framework examines four key components: (1) the total policy effect on ESG; (2) the policy effect on each proposed mechanism variable; (3) the relationship between that mechanism variable and ESG; and (4) the joint relationship of policy exposure and the mechanism variable with ESG when both are included in the same regression. We estimate the following mediation models, in which the mechanism variables (Mit) include corporate environmental protection expenditure (lnEPInvest), corporate green innovation (Green), and city-level credit supply (lnloan). All other variable definitions remain consistent with Model (1).
ESGit = α0 + α1Mit + αcontrolsit + ηt + θi + δj + ζijt
Mit = β0 + β1didit + βcontrolsit + ηt + θi + δj + ςijt
ESGit = θ0 + θ1didit + θ2Mit + θcontrolsit + ηt + θi + δj + ξijt
4. Empirical Results
4.1. Baseline Regression
Table 2 reports the baseline regression results. Column (1) indicates that, when examining only the effect of the new energy demonstration city policy on firms’ ESG performance, the coefficient is significantly positive at the 1% level, offering initial evidence that the policy enhances ESG outcomes. Column (2) reveals that, following the inclusion of firm-level control variables, the coefficient of the treatment variable (did) remains significantly positive. Column (3) further demonstrates that, even after controlling for firm, year, and industry fixed effects, the coefficient continues to be significantly positive at the 1% level. This indicates that the establishment of new energy demonstration cities significantly improves firms’ ESG performance after accounting for both observable and unobservable factors. These findings support Hypothesis 1.
Table 2.
Baseline Regression Results.
Regarding the control variables, firm size, profitability, and ownership concentration exhibit significantly positive coefficients, implying that larger, more profitable firms and those with concentrated ownership are more positively affected by the policy. In contrast, firm age, leverage, and fixed asset ratio display significantly negative coefficients, indicating that older firms face sunk costs in transformation, and that higher leverage and heavier asset structures impede improvements in ESG performance under the policy.
To analyze the composition of the policy effect, we conduct separate regressions of the environmental (E), social (S), and governance (G) pillar scores on the policy indicator. Table 3 reveals positive and statistically significant coefficients for all three pillars, with the largest point estimate observed in the environmental dimension. This pattern aligns with enhanced environmental governance, as well as improvements in social responsibility and corporate governance.
Table 3.
Baseline Regression Results for the Environmental, Social, and Governance Pillars.
4.2. Validity of the DID Approach
4.2.1. Parallel Trend Test
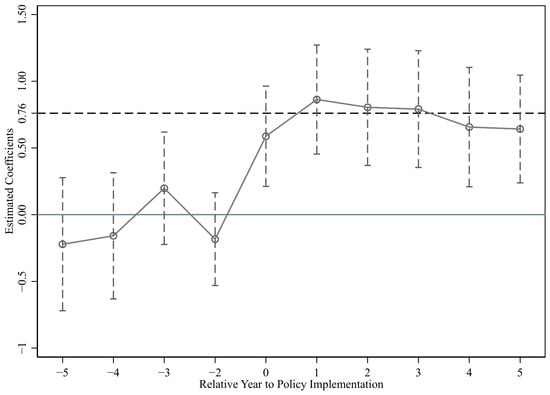
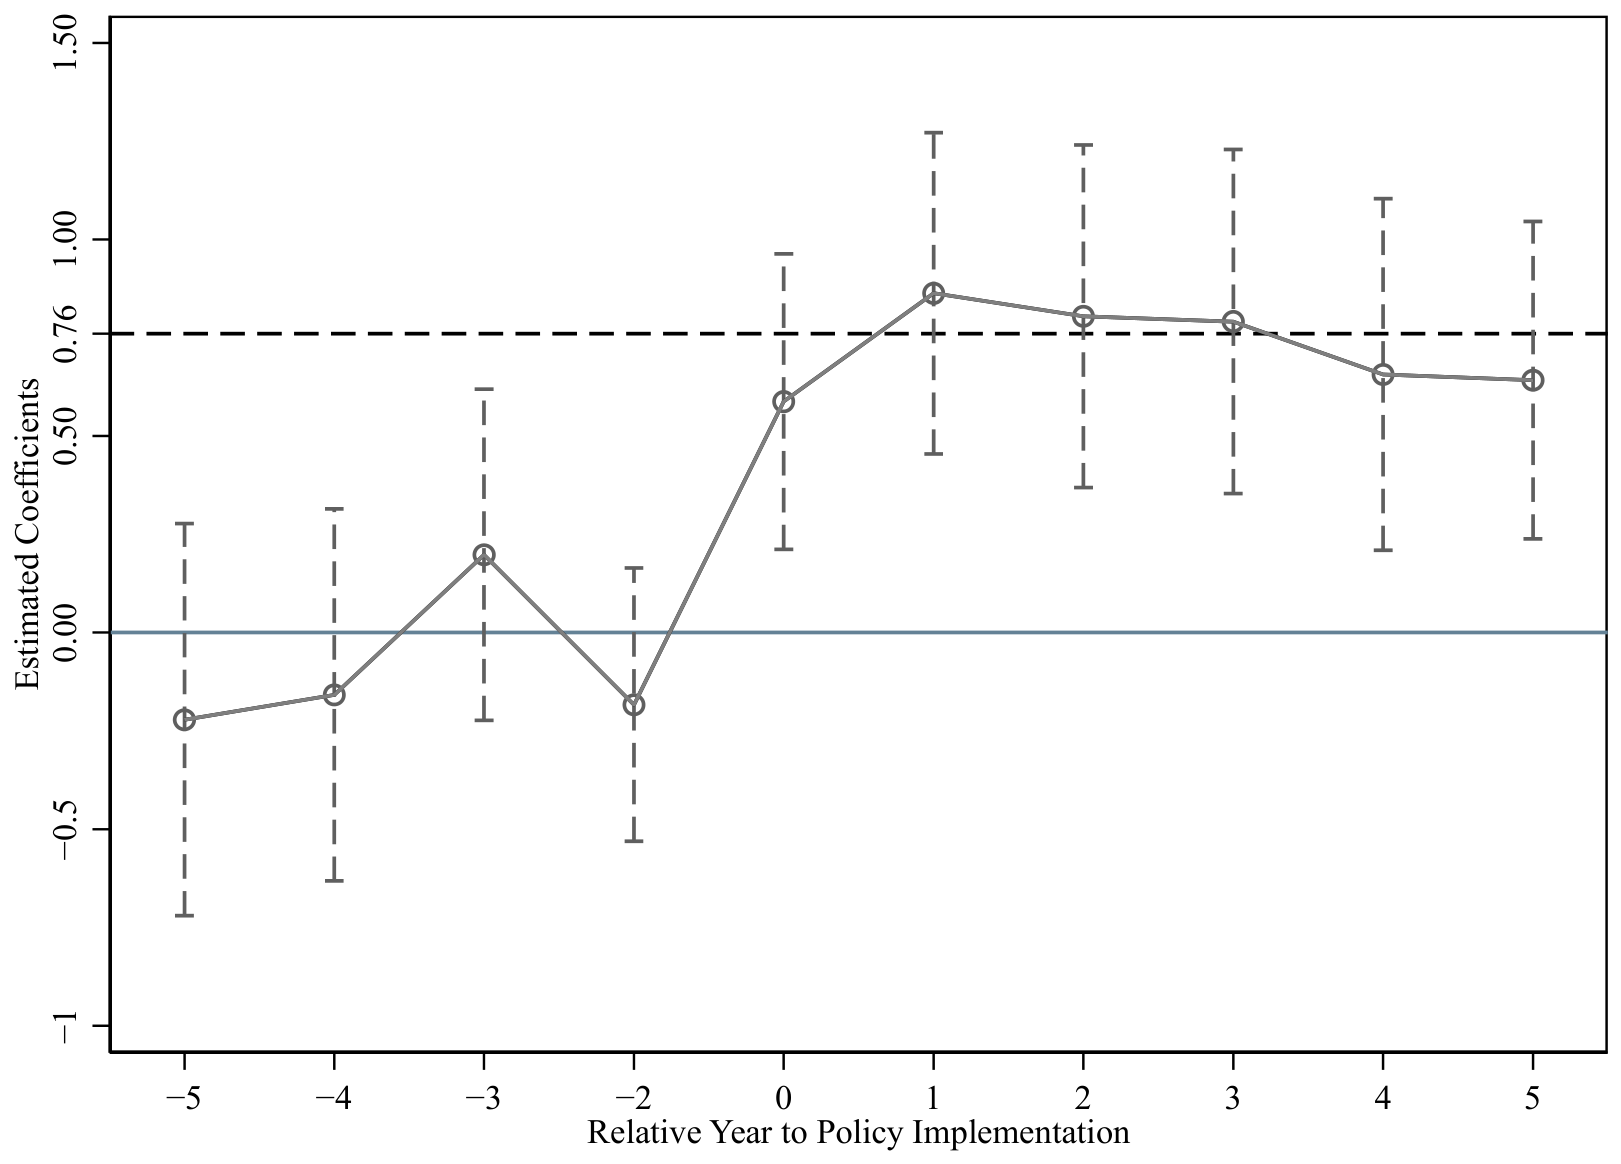
The results, presented in Figure 1, indicate that the dynamic ESG coefficients are statistically insignificant prior to the establishment of demonstration cities, implying no systematic differences in ESG trends between the treatment and control groups. However, following the policy implementation, the coefficients become significantly positive and remain stable over time, suggesting that the impact of the policy does not attenuate. These findings confirm that the national new energy demonstration city initiative, as an exogenous policy shock, exerts a significant positive effect on firms’ ESG performance, thereby validating the parallel trend assumption.
Figure 1.
Results of Parallel Trend Test.
4.2.2. Placebo Test
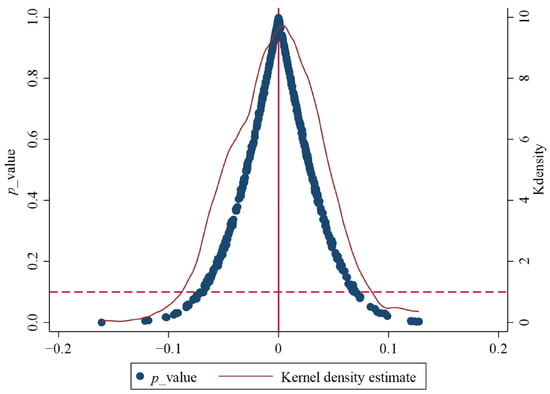
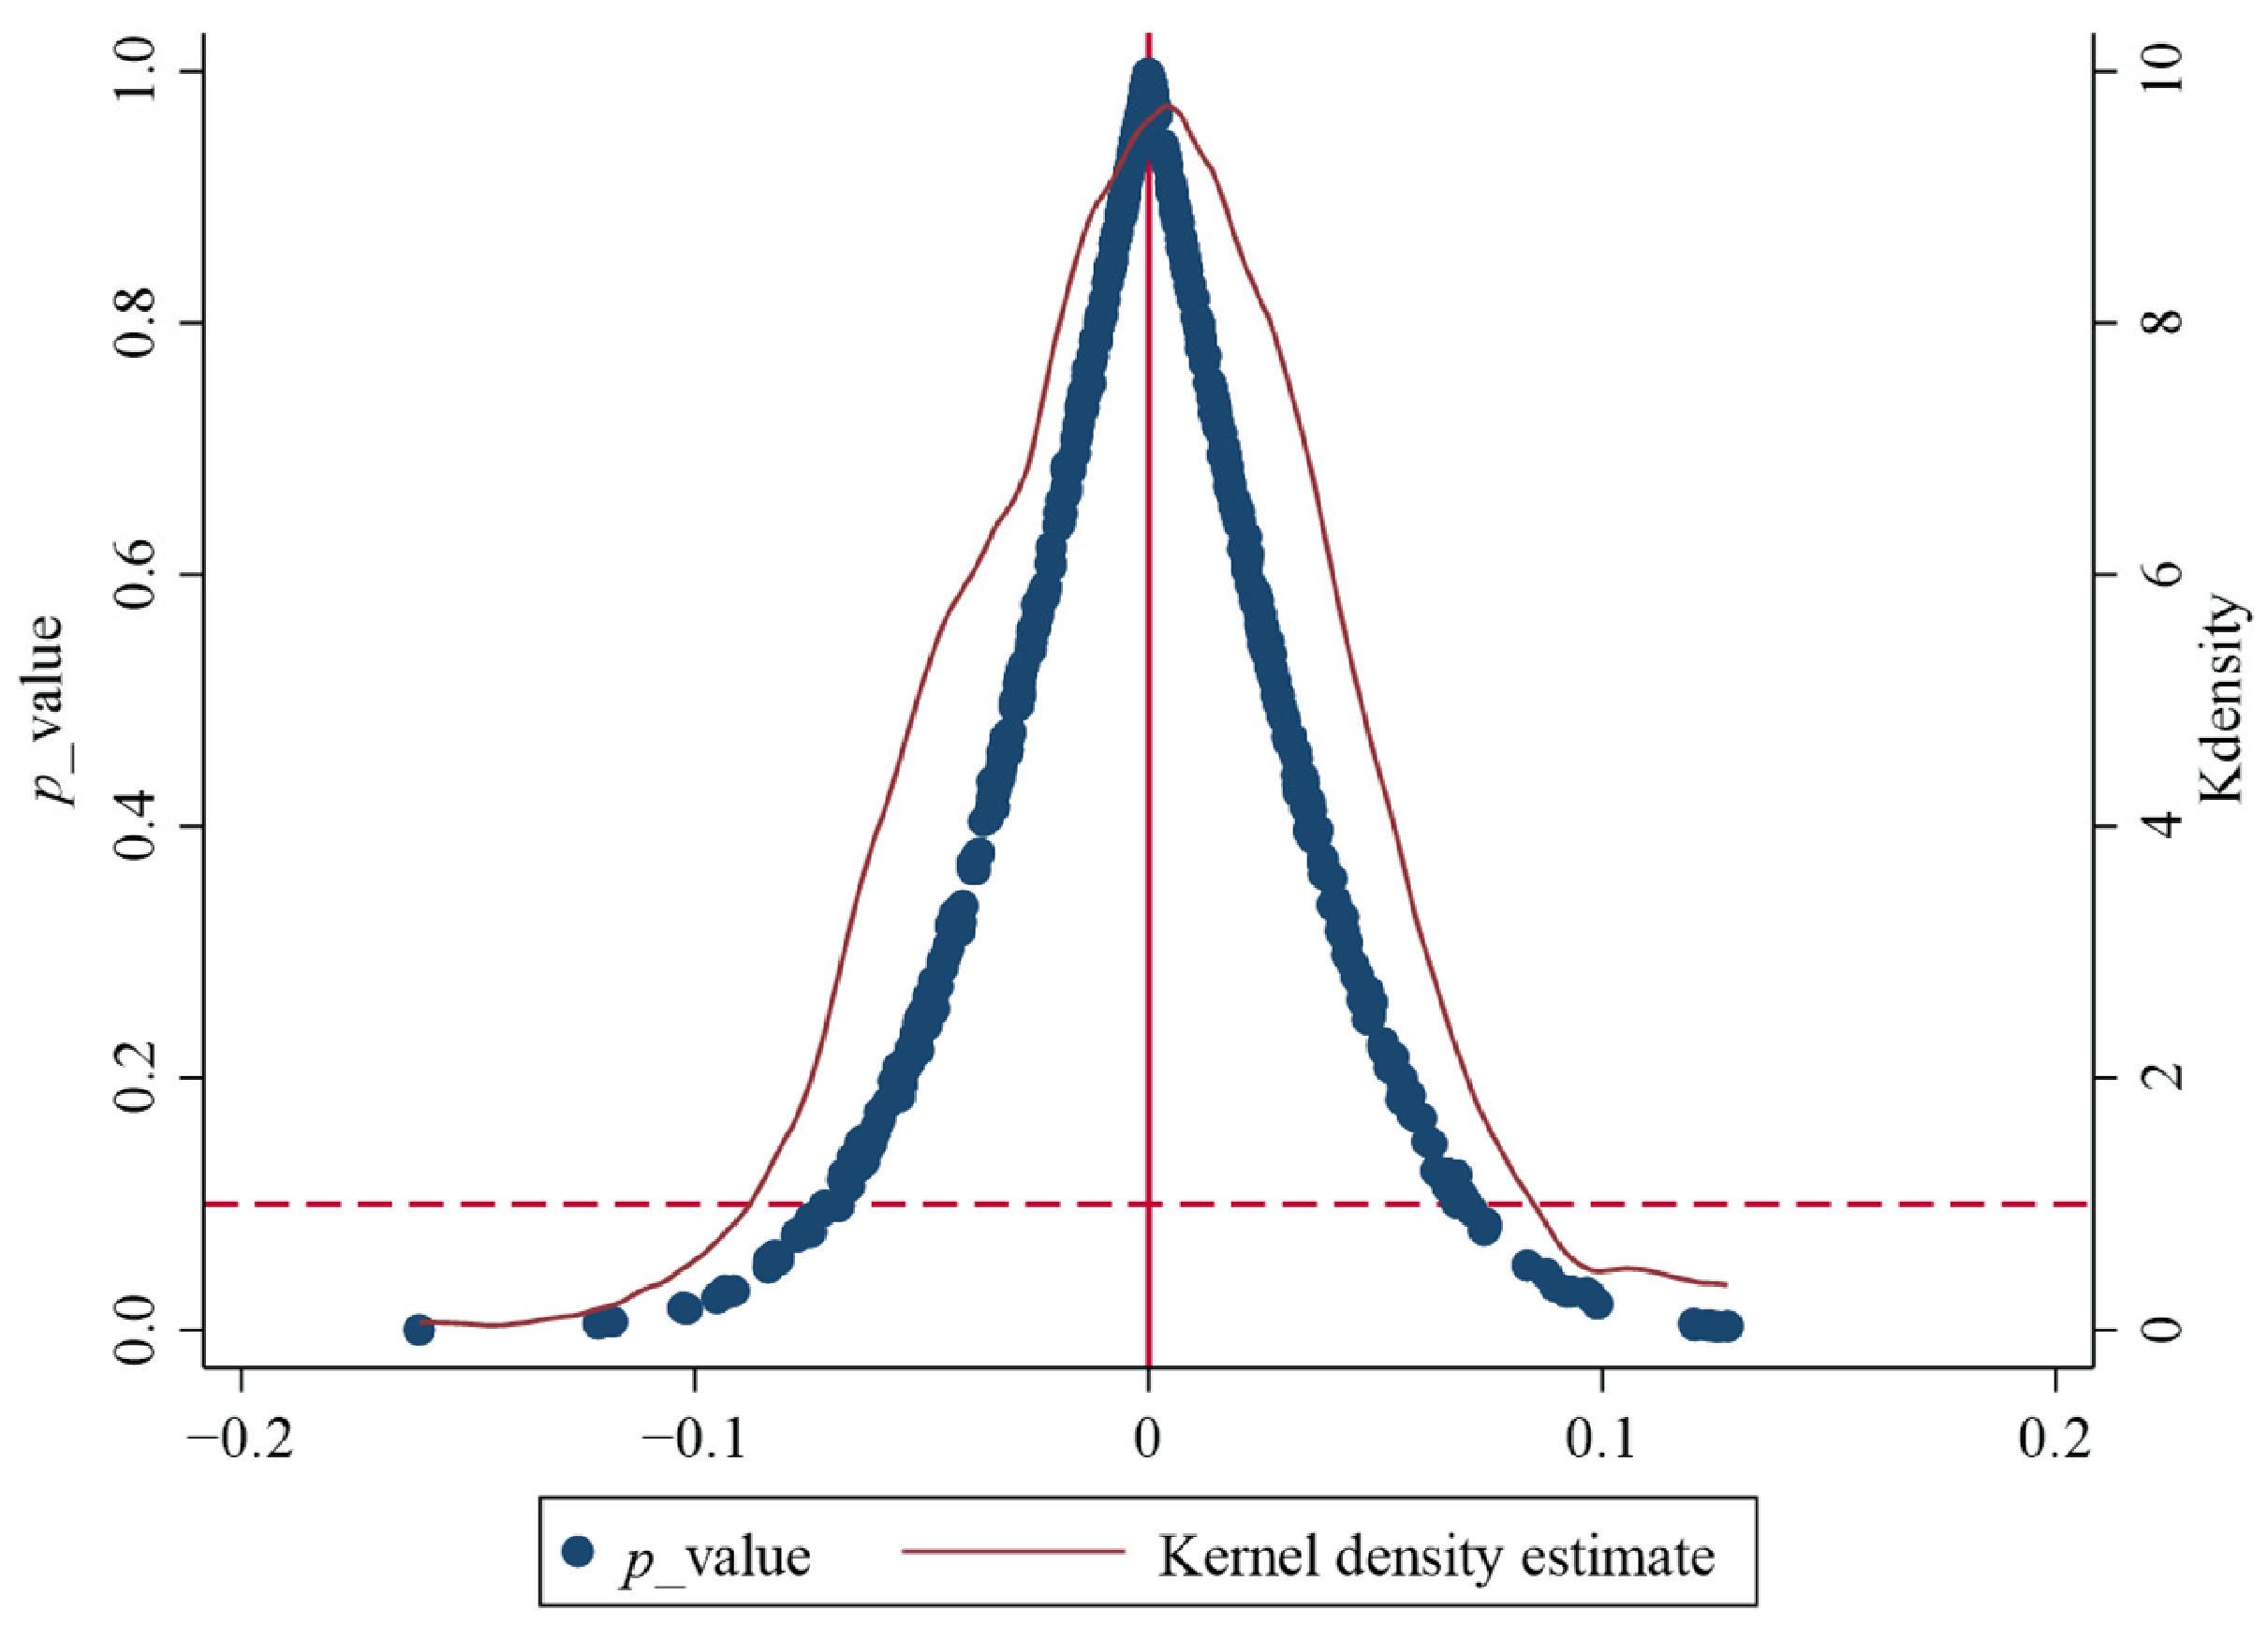
To ensure the accuracy of the results and rule out confounding effects unrelated to the policy, we conduct a placebo test. This involves randomly assigning firms into treatment and control groups and repeating the regression analysis. This procedure is designed to verify the causal effect of the new energy demonstration city policy on ESG performance. Specifically, firms are randomly designated as treated (assumed to be affected by the policy), while the remaining firms form the control group. This random sampling process is repeated 500 times to enhance reliability.
As shown in Figure 2, most placebo coefficients are statistically insignificant and approximately normally distributed around zero. In contrast, the benchmark DID coefficient reported earlier (0.760) lies outside the simulated distribution. This finding indicates that the observed improvement in ESG performance is not driven by unobservable factors, thereby confirming the robustness of the baseline results.
Figure 2.
Results of Placebo Test.
To examine potential anticipation effects, we also construct counterfactual policy dates one, two, three, and four years prior to the actual implementation. As reported in Table 4, none of the placebo treatment coefficients are statistically significant. A joint test of the pre-policy event-study coefficients yields an F-statistic of 1.83 (p = 0.120), indicating that the null hypothesis of jointly zero pre-policy coefficients cannot be rejected at the 10% significance level. Collectively, these results provide additional support for the parallel-trends assumption.
Table 4.
Counterfactual Policy-Timing Placebo Tests.
4.3. Robustness Analysis
4.3.1. Heterogeneous Treatment Effect Robustness
To evaluate the sensitivity of the estimated policy effect to treatment-effect heterogeneity in conventional two-way fixed-effects models, we re-estimate the average treatment effect using the imputation estimator proposed by [47] and the estimator developed by [48]. Table 5 reports positive estimates of 0.768 and 0.696, respectively, both of which are statistically significant at the 1% level and close to the baseline estimate of 0.760. These findings indicate that the positive policy association persists under alternative estimation methods.
Table 5.
Results of Heterogeneous Treatment Effect Robustness Tests.
4.3.2. Extended Measurement Window
To evaluate the robustness of the results to policy timing flexibility, we re-estimate the model by lagging the policy variable (did) by one and two periods, and by leading the ESG rating variable by one and two periods. This approach enables us to assess both the immediacy and persistence of policy effects. Due to the absence of required lead or lag values at the sample boundaries, these specifications contain fewer observations than the baseline model. As presented in columns (1) and (2) of Table 6, the coefficients of the leading ESG variables remain significantly positive. Columns (3) and (4) indicate that the lagged did coefficients are also significantly positive at the 1% level, aligning with the direction of the baseline results. Furthermore, the significance of these coefficients increases with the length of the measurement window.
Table 6.
Results of Robustness Analysis based on Extended Measurement Window.
Two factors may account for this pattern. First, the implementation of the policy may require time for its effects on firms’ ESG performance to become observable; extending the window helps capture this lag. Second, the persistence of the effect suggests that the energy transition policy promotes ESG improvements not only in the short term but also over the medium and long term. Additionally, the results may reflect cumulative effects: as implementation progresses, policy impacts accumulate and exert stronger influence on firms’ ESG performance.
4.3.3. PSM-DID Estimation
Firms in pilot and non-pilot cities may exhibit systematic differences, which raises concerns regarding sample selection bias. To address this issue, we apply propensity score matching (PSM) to pair firms in pilot cities with comparable firms in non-pilot cities based on key observable characteristics. This method ensures that the treatment and control groups share similar distributions of pre-policy attributes, thereby mitigating selection bias and endogeneity. As presented in column (1) of Table 7, the coefficient of did is 0.682 and is statistically significant at the 1% level. This finding indicates that, after accounting for sample selection through PSM, the new energy demonstration city policy continues to exert a significant positive effect on firms’ ESG performance. The result confirms the robustness of the baseline estimates.
Table 7.
Results of Robustness Analysis based on PSM-DID Estimation.
To assess matching quality, Table 8 presents a comparison of the covariate distributions between the treatment and control groups before and after propensity score matching. Following matching, the absolute standardized mean differences for all reported covariates are less than 1%, and the post-matching t-test p-values are greater than 0.10, indicating balance in the observed characteristics.
Table 8.
Covariate Balance Tests of Pre- and Post-Propensity Score Matching.
4.3.4. Excluding Similar Policy Interference
The preceding analysis demonstrates that the energy transition policy significantly enhances firms’ ESG performance. However, other concurrent policies may also influence regional ESG outcomes. To address this concern, we examine three batches of low-carbon province and low-carbon city pilot policies introduced in 2010, 2012, and 2017. Specifically, we construct dummy variables for regions covered by these low-carbon pilot programs, time dummies for their implementation periods, and interaction terms between the two to capture their potential effects. As reported in column (2) of Table 7, after controlling for these low-carbon pilot policy variables, the coefficient of did remains significantly positive. This finding suggests that similar policies did not materially confound the estimated effect of the new energy demonstration city initiative on firms’ ESG performance.
4.3.5. Alternative Dependent Variable
To more precisely capture varying levels of firms’ ESG performance, we follow the method of [49] and adopt a trichotomous measure (ESG_T). Specifically, firms rated AAA-A are assigned a score of 3, BBB-B a score of 2, and CCC-C a score of 1. This approach enables us to test whether the pilot policy promotes ESG improvements at higher performance tiers. As reported in column (3) of Table 7, the coefficient of ESG_T remains significantly positive at the 1% level, confirming that our findings are robust to alternative measures of ESG performance.
4.4. Mechanism Analysis
Theoretical analysis suggests that the new energy demonstration city policy enhances firms’ ESG performance primarily through three channels: corporate environmental protection expenditure, green innovation, and city-level credit supply. Existing evidence suggests that the new energy demonstration city policy has contributed to urban energy transition [50], thereby providing a macro-level antecedent for the proposed firm-level channels. The first step is already reported in column (3) of Table 2 and is not repeated in Table 9, Table 10 and Table 11. These regressions offer complementary evidence regarding the proposed transmission pathways.
Table 9.
Results of Mechanism Test based on Corporate Environmental Protection Expenditure.
Table 10.
Results of Mechanism Test based on Corporate Green Innovation.
Table 11.
Results of Mechanism Test based on Urban Credit Level.
4.4.1. Corporate Environmental Protection Expenditure
Through fiscal incentives and technological support, the energy transition policy effectively promotes firms’ investments in environmental protection. Following [51], we measure this expenditure as the natural logarithm of environment-related investments and expenses disclosed in firms’ annual reports. Larger values indicate a stronger environmental commitment, whereas smaller values imply weaker prioritization.
As shown in columns (1) and (2) of Table 9, the coefficients of environmental protection expenditure are significantly positive, indicating that the policy stimulates firms to increase such expenditures and that these expenditures, in turn, significantly improve ESG performance. Column (3) further confirms that the policy promotes ESG performance by raising corporate environmental protection expenditure, thereby shifting ESG investments from “passive compliance costs” to “proactive strategic investments.” These findings support Hypothesis 2. A bootstrap analysis with 1000 resamples reports a confidence interval for the indirect effect of [0.009, 0.021]; the reported mediated proportion is approximately 2%.
4.4.2. Corporate Green Innovation
Following [52], this study measures corporate green innovation as the ratio of independently granted green utility model patents to the total number of patents obtained in a given year. Columns (1)–(3) of Table 10 report the effects of the energy transition policy on corporate green innovation. The coefficients of both the did estimator and corporate green innovation are significantly positive at the 1% level, thereby supporting Hypothesis 3. Bootstrap analysis reports an indirect-effect confidence interval of [0.050, 0.074] and a mediated proportion of 8.17%, as presented in Table 10.
Two main mechanisms may explain this result. First, the pilot policy for new energy cities incentivizes firms to engage in green innovation to reduce pollution-related costs, thereby generating an innovation compensation effect. Second, firms are motivated to pursue green innovation to secure a first-mover advantage by developing distinctive environmental strategies that enhance market share.
According to legitimacy theory, green innovation enables firms to improve their ESG performance by fostering environmentally friendly production and reducing pollutant emissions, thereby enhancing environmental benefits. Green innovation also increases resource-use efficiency, reduces energy consumption, and mitigates “three wastes” pollution. These actions help firms comply with environmental tax requirements, strengthen their reputation as environmentally responsible enterprises, cultivate a green brand image, stimulate green consumer purchasing behavior, and ultimately enhance corporate financial performance and ESG outcomes.
4.4.3. Urban Credit Level
Following [53], this study measures the level of urban credit using the logarithm of the year-end balance of total loans issued by financial institutions in each city. The results in columns (1)–(3) of Table 11 present the impact pathways of the energy transition policy on corporate ESG performance. Both the DID estimator and urban credit level exhibit significantly positive coefficients at the 1% level, thereby supporting Hypothesis 4. The bootstrap confidence interval for the indirect effect is [0.145, 0.199], with a mediated proportion of 22.89%, which is the largest among the three channels examined.
The findings identify two primary mechanisms. First, the energy transition policy transmits a positive signal that redirects financial resources toward new energy industries and associated enterprises, thereby increasing the overall credit supply and lending capacity of cities. Expanded credit availability broadens firms’ financing channels, reduces financing costs, and effectively mitigates financial constraints, providing critical funding for ESG-related initiatives. Second, from a resource-based perspective, an improved urban credit environment enables firms to allocate capital more efficiently to key ESG domains, such as green technology research and sustainable supply chain development. For instance, firms may utilize credit financing to upgrade environmentally friendly production equipment—aligning with policy orientation while reducing pollution, enhancing resource efficiency, and improving environmental performance. Additionally, credit resources can be directed toward employee training, community engagement, and governance improvements, strengthening firms’ social responsibility and long-term sustainability.
Enhanced ESG performance, in turn, reinforces financial institutions’ confidence, creating a virtuous cycle of “credit support→ESG improvement→renewed credit support”, thereby amplifying the transmission effects of energy transition policy.
4.5. Moderating Effect Analysis
The positive impact of the new energy demonstration city policy on corporate ESG performance is influenced by external factors. Chief among these is media attention, which mitigates information asymmetry in policy implementation through its information-diffusion function. Although the policy provides institutional incentives, corporate ESG initiatives are often characterized by long payback periods and strong externalities, which may dampen managerial motivation. By tracking policy outcomes and disclosing firms’ environmental actions, media coverage transforms ESG performance into public information, enabling investors, consumers, and other stakeholders to better discern firms’ commitment to green transition. Consequently, firms that actively respond to the policy and improve ESG standards gain greater market recognition, reinforcing the real effect of the policy signal.
Moreover, media attention serves as a reputational monitoring and disciplinary mechanism. High levels of media scrutiny expose corporate environmental behavior to public oversight. Firms that fail to effectively implement energy transition policies risk reputational damage, public criticism, and even policy sanctions triggered by negative coverage. Such social pressure compels firms to invest more actively in environmental protection and ESG management. Conversely, firms with strong ESG performance can convert positive media attention into reputational capital, thereby internalizing policy requirements into long-term strategic behavior.
Following [54], this study incorporates media attention as a moderating variable, measured by the natural logarithm of the annual number of news headlines mentioning a firm. The baseline model includes both media attention and its interaction term with the energy transition policy. As presented in column (1) of Table 12, the policy-by-media attention coefficient is 0.218 (p < 0.01), indicating a positive moderating relationship. To address potential reverse causality from ESG outcomes to media coverage, column (2) employs media attention lagged by one year. The lagged interaction term remains positive and significant (0.294, p < 0.01), serving as a robustness check; however, lagging alone does not fully eliminate endogeneity concerns. Functioning as an external governance mechanism, media attention intensifies both the incentives and constraints imposed by the policy, thereby encouraging firms to translate policy directives into tangible ESG advancement.
Table 12.
Moderating Effect Results.
4.6. Heterogeneity Analysis
4.6.1. Ownership Structure Heterogeneity
To examine heterogeneity by ownership type, firms are categorized into state-owned and non-state-owned enterprises. As presented in columns (1) and (2) of Table 13, the energy transition policy significantly enhances ESG performance for both types of firms. The coefficient for state-owned enterprises is 0.515 (significant at the 5% level), while that for non-state-owned enterprises is 0.879 (significant at the 1% level). These findings indicate that the policy’s positive impact on ESG performance is more pronounced among non-state-owned firms. A Chow test of the group difference yields an F-statistic of 13.07 (p = 0.0003), confirming a statistically significant difference between the estimated treatment effects for state-owned and non-state-owned firms.
Table 13.
Heterogeneity Analysis based on Ownership Structure and Lifecycle.
A plausible explanation lies in the institutional and managerial characteristics of these ownership forms. State-owned enterprises (SOEs) often bear broader social and policy mandates, with their environmental governance practices shaped by administrative directives and institutional constraints. Consequently, they typically exhibit a higher baseline level of environmental investment and ESG management prior to policy implementation, leaving limited scope for marginal improvement. In contrast, non-state-owned enterprises are generally more responsive to policy incentives. Market-oriented signals embedded in the energy transition policy provide stronger motivation for these firms to increase investment in environmental technologies and governance. Furthermore, their greater managerial flexibility and innovation capacity enable them to more swiftly convert external policy stimuli into concrete green strategies, thereby accelerating the advancement of ESG practices within non-state sectors. When viewed alongside the overall increases in environmental expenditure and green innovation, this pattern is more consistent with investment-backed transformation than with purely symbolic ESG disclosure. However, greenwashing cannot be ruled out based on these indicators alone.
4.6.2. Lifecycle Heterogeneity
Given that firms exhibit distinct behavioral orientations across different stages of their lifecycle, this study adopts the classification method of [55], which identifies growth, maturity, and decline stages based on the composition of operating, financing, and investing cash flows. Group regressions are conducted accordingly, with results reported in columns (3)–(5) of Table 13. The estimated policy coefficients are 0.724, 1.276, and 0.729 for growth-stage, mature-stage, and declining firms, respectively. The effect is largest for mature firms, while the estimates for growing and declining firms are nearly identical. Pairwise Chow tests yield the following results: mature versus growth, F = 4.20 (p < 0.05); mature versus decline, F = 4.91 (p < 0.05); and growth versus decline, F = 6.93 (p < 0.01).
Mature firms generally exhibit stable cash flows and abundant resource reserves, enabling them to respond effectively to policy incentives by increasing investments in green technologies, environmental facilities, and ESG management systems. Consequently, they demonstrate the most pronounced policy response. Growth-stage firms, despite resource constraints, possess significant development potential and tend to actively engage in environmental initiatives to build a green reputation, capture policy benefits, and establish a foundation for long-term sustainable growth. In contrast, declining firms often confront acute resource shortages and survival pressures. Their strategic focus typically centers on maintaining operations and ensuring short-term profitability, resulting in limited motivation and capacity for forward-looking environmental investment. While their estimated policy coefficient is similar to that of growth-stage firms, their capacity for additional long-term environmental investment may be constrained relative to mature firms. Compared to firms in other stages, mature firms may also incur greater reputational costs from greenwashing, making substantive adjustment a plausible—but not separately identified—explanation for their larger estimated effect.
4.6.3. Carbon Intensity Heterogeneity
Following [56], this study obtains firm-level carbon emission data from the China Emission Accounts and Datasets (CEADs) and measures carbon intensity as the ratio of a firm’s CO2 emissions to its main business revenue. Firms are classified based on the median carbon intensity: those above the median are defined as high-carbon-intensity firms, and those below as low-carbon-intensity firms. Grouped regressions are then conducted, with the results reported in columns (1) and (2) of Table 14. The findings indicate that the energy transition policy significantly enhances ESG performance among high-carbon-intensity firms but has no statistically significant effect on low-carbon-intensity firms. The reported between-group Chow test yields F = 7.07 (p = 0.0079), indicating a statistically significant difference between the two estimated coefficients.
Table 14.
Heterogeneity Analysis based on Carbon Intensity and Market Competition.
This asymmetry may be attributed to the distinct regulatory and operational environments of the two groups. High-carbon-intensity firms, which are often concentrated in energy-intensive and heavily polluting industries, are key targets of environmental regulation and carbon neutrality initiatives. The implementation of the new energy demonstration city policy imposes stricter emission controls, higher compliance costs, and stronger social scrutiny on these firms. In response, they are compelled to improve their ESG performance to restore corporate reputation, mitigate environmental risk, and gain policy-related compliance benefits. Furthermore, such firms possess greater potential for technological upgrading and energy efficiency improvement. Policy instruments—such as fiscal subsidies, technical standards, and market-access incentives—help transform external regulatory pressure into internal motivation for green transformation, thereby producing significant gains in ESG performance. Given that heightened regulatory scrutiny may increase the likelihood of detecting greenwashing, the observed improvement is consistent with substantive adjustment, although a direct test of greenwashing would still be necessary.
In contrast, low-carbon-intensity firms typically operate in environmentally friendly sectors or have already established robust environmental practices. Their lower emission levels result in reduced regulatory pressure and diminished transformation demands, leading to limited marginal incentives from policy interventions and, consequently, no significant changes in ESG outcomes.
4.6.4. Market Competition Heterogeneity
As key participants in market systems, firms are inevitably influenced by the degree of market competition. This study measures market concentration using the Herfindahl-Hirschman Index (HHI), where a higher value indicates greater market concentration and, correspondingly, lower competition intensity. Columns (3) and (4) of Table 14 present the regression results. The coefficient and significance level of the policy treatment effect are higher for firms operating in low-competition markets compared to those in highly competitive markets. This indicates that the energy transition policy exerts a stronger positive impact on ESG performance in less competitive environments. The reported Chow test yields F = 11.19 (p = 0.0008), indicating a significant difference between the low- and high-competition subsamples.
In markets characterized by lower competition intensity, firms experience reduced survival pressure and diminished price rivalry, often retaining greater organizational slack and profit margins. This enables them to respond more proactively to national policy signals. Furthermore, in the absence of intense market rivalry, firms have stronger incentives to enhance ESG performance as a means to capture policy benefits, strengthen government-enterprise relations, and build industrial reputation. Consequently, policy signals are more effectively translated into substantive green investment behaviors. Their greater resource slack may facilitate the financing of sustained green investment, which aligns with—but does not confirm—substantive rather than symbolic ESG improvement.
In contrast, firms operating in highly competitive markets face heightened cost pressures and survival challenges, which compel them to prioritize short-term profitability and market share. While energy transition policies offer external incentives, intense competition drives firms to allocate scarce resources primarily to production-oriented activities such as market expansion and efficiency improvement, thereby displacing long-term strategic investment in ESG initiatives. In addition, highly competitive markets typically demonstrate greater transparency and allocative efficiency, implying that an individual firm’s ESG actions are less likely to generate immediate competitive advantages or reputational premiums—further diminishing the marginal effect of policy incentives.
5. Conclusions and Policy Implications
5.1. Main Results
The results reveal three key findings. (1) The energy transition policy significantly affects firms’ ESG performance, and this conclusion remains robust. (2) The policy operates through three main channels: (a) increasing firms’ environmental expenditures, shifting environmental governance from “passive compliance” to “proactive investment”; (b) fostering green innovation that reduces carbon emissions and enhances resource efficiency; and (c) improving urban credit levels, guiding financial resources toward green sectors and alleviating financing constraints. (3) The policy impact is more pronounced among non-state-owned firms, mature firms, high-carbon-intensity firms, and firms in less competitive markets. Moreover, media attention, as an external governance mechanism, significantly amplifies the policy’s positive effect on ESG performance.
5.2. Policy Suggestions
First, coordinate environmental regulation, innovation support, and green finance. Strengthen environmental requirements to encourage firms to shift environmental expenditure from passive compliance to proactive investment; support the development and adoption of green technologies; and channel financial resources toward green activities to alleviate funding constraints.
Second, implement differentiated policies. Focus on reducing green financing constraints for non-state-owned firms; enhance ESG disclosure and green supply-chain leadership among mature firms; combine stricter carbon constraints with transition finance for high-carbon-intensity firms; utilize the resource capacity of firms in less competitive markets while guarding against strategic greenwashing; and provide innovation risk-sharing and transition assistance to growing and declining firms, respectively.
Third, improve ESG disclosure and media oversight. Strengthen corporate environmental disclosure standards, increase transparency, and enable media scrutiny and reputational monitoring to reduce information asymmetry in policy implementation.
Fourth, establish dynamic evaluation and incentive mechanisms. Consider ESG outcomes in policy assessment and financing reviews, with appropriate environmental risk lists and green-performance recognition mechanisms. Offer justified financing and market-access support to stronger performers while reinforcing accountability for lagging firms, in order to encourage substantive transformation rather than symbolic disclosure.
5.3. Limitations and Future Research
Some limitations warrant acknowledgment. First, concurrent green policies, time-varying city-level economic shocks, and changes in firms’ registered locations across prefecture-level cities may confound the estimated relationship. As the available data did not permit dedicated tests for all these factors, future research should incorporate additional concurrent-policy indicators, city-level time-varying controls, and analyzes that exclude relocating firms. Second, interactions among ownership, firm life cycle, carbon intensity, and market competition—currently considered separately in the present heterogeneity analysis—should also be examined.
Author Contributions
Conceptualization, Q.L.; methodology, G.H.; software, Z.X.; validation, W.L.; formal analysis, Q.L.; investigation, Z.X.; resources, T.Z.; data curation, Z.X.; writing—original draft preparation, Q.L.; writing—review and editing, T.Z.; visualization, G.H.; supervision, W.L.; project administration, W.L.; funding acquisition, G.H. and T.Z. All authors have read and agreed to the published version of the manuscript.
Funding
This research was funded by Chinese Academy of Social Sciences (25CKX007), Humanities and Social Sciences Youth Foundation, Ministry of Education (21YJCZH252), Science Fund for Distinguished Young Scholars of Anhui Province (2024AH030066, 2023AH030033), Sichuan Provincial Postdoctoral Science Foundation (TB2023088), Anhui Provincial Department of Education (2023kcszsf055), General Project of the Think Tank of Anhui University of Technology (ZKPT202609, ZKPT202617), International Student Education and Teaching Project of the School of International Education, Anhui University of Technology (LXS20260701), Top-notch Talent Cultivation Program for Universities in Anhui Province (gxbjZD2022096), Major Scientific Research Project of Universities in Anhui Province (2024AH040371, 2024AH053332).
Institutional Review Board Statement
Not applicable.
Informed Consent Statement
Not applicable.
Data Availability Statement
The data presented in this study are available on request from the corresponding authors.
Conflicts of Interest
The authors declare no conflict of interest.
References
- Chen, S.W.; Wu, Z.L. Corporate ESG Performance and Stock Pricing Efficiency. N. Am. J. Econ. Financ. 2025, 79, 102440. [Google Scholar] [CrossRef] [Scilit]
- Bermejo, V.J.; Rizzo, A.E.; Zakriya, M. What Drives Corporate ESG? Disentangling the Importance of Investors and Managers. J. Financ. Intermediation 2026, 65, 101194. [Google Scholar] [CrossRef] [Scilit]
- Sahu, S.R.; Sur, J.K. Does ESG reporting enhance firm performance? J. Policy Model. 2025, 48, 107018. [Google Scholar] [CrossRef] [Scilit]
- Freeman, R.E. Strategic Management: A Stakeholder Approach; Pitman: Boston, MA, USA, 1984. [Google Scholar]
- Edmans, A. Does the Stock Market Fully Value Intangibles? Employee Satisfaction and Equity Prices. J. Financ. Econ. 2011, 101, 621–640. [Google Scholar] [CrossRef] [Scilit]
- Deng, X.; Kang, J.; Low, B.S. Corporate Social Responsibility and Stakeholder Value Maximization: Evidence from Mergers. J. Financ. Econ. 2013, 110, 87–109. [Google Scholar] [CrossRef] [Scilit]
- Flammer, C. Does Corporate Social Responsibility Lead to Superior Financial Performance? A Regression Discontinuity Approach. Manag. Sci. 2015, 61, 2549–2568. [Google Scholar] [CrossRef] [Scilit]
- Qiu, M.; Hong, Y. An Analysis of Enterprises’ Financing Cost with ESG Performance under the Background of Ecological Civilization Construction. J. Quant. Technol. Econ. 2019, 36, 108–123. [Google Scholar]
- Ruhaya, A.; Alam, M.M.; Jamaliah, S.; Zamri, M. The Impacts of Environmental, Social, and Governance Factors on Firm Per formance. Manag. Environ. Qual. Int. J. 2018, 29, 182–194. [Google Scholar] [CrossRef] [Scilit]
- Duque-Grisales, E.; Aguilera-Caracuel, J. Environmental, Social and Governance (ESG) Scores and Financial Performance of Multilatinas: Moderating Effects of Geographic International Diversification and Financial Slack. J. Bus. Ethics 2021, 168, 315–334. [Google Scholar] [CrossRef] [Scilit]
- Garcia, A.S.; Orsato, R.J. Testing the Institutional Difference Hypothesis: A Study about Environmental, Social, Governance, and Financial Performance. Bus. Strategy Environ. 2020, 29, 3261–3272. [Google Scholar] [CrossRef] [Scilit]
- Zahid, R.A.; Saleem, A.; Maqsood, U.S. ESG Performance, Capital Financing Decisions, and Audit Quality: Empirical Evidence from Chinese State-owned Enterprises. Environ. Sci. Pollut. Res. 2023, 30, 44086–44099. [Google Scholar] [CrossRef] [Scilit] [PubMed]
- Mehmood, A.; De Luca, F.; Quach, H. Investigating How Board Gender Diversity Affects Environmental, Social and Governance Performance: Evidence from the Utilities Sector. Util. Policy 2023, 83, 101588. [Google Scholar] [CrossRef] [Scilit]
- Pan, Y.; Guo, M. Air Pollution and Corporate ESG Performance. J. Quant. Technol. Econ. 2023, 40, 112–132. [Google Scholar]
- Su, C.; Liu, Y. Energy Transition and Corporate Environmental Responsibility Fulfillment. Enterp. Econ. 2025, 44, 78–88. [Google Scholar]
- Cui, L.; Sun, W.; Li, X. Research on Environmental Effect of New Energy Demonstration City Construction. East China Econ. Manag. 2022, 36, 57–65. [Google Scholar]
- Sancho-Esper, F.; Rodriguez-Sanchez, C.; Miquel-Romero, M.J.; Sarabia-Sánchez, F.J. Two roads to understanding youth acceptance of energy transition policies: A symmetrical and asymmetrical perspective. Energy Policy 2026, 211, 115102. [Google Scholar] [CrossRef] [Scilit]
- Sun, H.; Bai, N. What impact does the energy transition have on corporate ESG performance? Identifying causal mechanisms using double machine learning. Finance Res. Lett. 2026, 108, 110452. [Google Scholar] [CrossRef] [Scilit]
- Oni, A.A.; Olawale, R.A.; Oluwabiyi, E.O.; Olasilola, B.O.; Fajingbesi, A.; Adeyekun, F.P.; Eslamipoor, R. Digital technology’s role in circular waste management: A systematic review. Bus. Strategy Environ. 2026. early view. [Google Scholar] [CrossRef] [Scilit]
- Oni, A.A.; Olawale, R.A.; Oluwabiyi, E.O.; Olasilola, B.O.; Fajingbesi, A.; Adeyekun, F.P.; Eslamipoor, R. Harnessing Natural Sunlight for Solar-Driven Photocatalysis in Sustainable Agricultural Runoff Remediation. Sustainability 2026, 18, 1869. [Google Scholar] [CrossRef] [Scilit]
- Eslamipoor, R. Integrating recycling and emission reduction: A business strategy analysis with multi-objective mixed-integer linear programming framework for optimising sustainable closed-loop supply chain network design. Bus. Strategy Environ. 2026. early view. [Google Scholar] [CrossRef] [Scilit]
- Hu, J. The Motivation, Practical Progress, and Future Orientation of China’s Promotion of Energy Revolution. J. Xi’an Univ. Finance Econ. 2024, 37, 90–102. [Google Scholar]
- Huang, M.; Yang, L. An Empirical Assessment of the Carbon-Reduction Effects of New Energy Demonstration City Policies. Stat. Decis. 2025, 41, 54–59. [Google Scholar]
- Liu, M.; Du, M.; Liu, X. Government Subsidy and the Performance of New Energy Enterprises: A Study from the Perspective of Heterogeneity and Time Lag. Sci. Res. Manag. 2022, 43, 17–26. [Google Scholar]
- Scott, W.R. Institutions and Organizations: Ideas, Interests, and Identities; Sage Publications: Thousand Oaks, CA, USA, 2014. [Google Scholar]
- Eccles, R.; IIoannou Serafeim, G. The Impact of Corporate Sustainability on Organizational Processes and Performance. Manag. Sci. 2014, 60, 2835–2857. [Google Scholar] [CrossRef] [Scilit]
- Huang, J.; Chen, L.; Ding, J. Corporate Social Responsibility, Mediacoverage and Stock Pricecrash Risk. Chin. J. Manag. Sci. 2022, 30, 1–12. [Google Scholar]
- Xu, H. New Energy Demonstration Cities and Regional Economic Growth. East China Econ. Manag. 2021, 35, 76–85. [Google Scholar]
- Wang, M.; Ye, T.; Kong, D. Green Manufacturing and Corporate Environmental Information Disclosure: Evidence from the Policy Experiment of “Creation of Green Factories” in China. Econ. Res. J. 2024, 59, 116–134. [Google Scholar]
- Ding, J.; Li, Z.; Huang, J. Can Green Credit Policies Promote Enterprise Green Innovation? A Policy Effect Differentiation Perspective. J. Financ. Res. 2023, 510, 55–73. [Google Scholar]
- Guo, M.; Yang, Y. The Impact of Climate Risk Perception on Corporate ESG Performance. J. Xi’an Jiaotong Univ. (Soc. Sci.) 2025, 45, 27–38. [Google Scholar]
- Li, Y.; Li, Z.; Ou, G. Platform Economy and Industrial Structure Optimization and Upgrading in the Context of Digital Economy. World Surv. Res. 2023, 3–14. [Google Scholar]
- Jia, R.; Shao, S.; Zheng, Y.; Fan, M.; Yu, Y. High-speed Railway and Haze-governing Performance in China: An Empirical Investigation based on the Spatial Difference in Differences Model. China Soft Sci. 2023, 109–121. [Google Scholar]
- Qi, S.; Zhang, Q.; Wang, B. Market-oriented Incentives to the Innovation of New Energy Companies—Evidence from Venture Capital and Companies’ Patents. China Ind. Econ. 2017, 95–112. [Google Scholar]
- Zhou, X.; Han, L. Digital Inclusive Finance, Risk-taking and Corporate Green Innovation. Stat. Decis. 2022, 38, 159–164. [Google Scholar]
- Xie, X.; Zhu, Q. How Can Green Innovation Solve the Dilemmas of “Harmonious Coexistence”? J. Manag. World 2021, 37, 128–149. [Google Scholar]
- Chen, L.; Yu, H. ESG Performance, Financing Constraints, and Corporate Performance. Friends Account. 2022, 24–30. [Google Scholar]
- Gu, H.; Yu, J. Macro-prudential Regulation, Monetary Policies and the Risk Effect of Bank Loan Competition. Stat. Res. 2023, 40, 53–67. [Google Scholar]
- Chen, H.; Zhang, L. ESG Performance, Digital Transformation and Enterprise Value Enhancement. J. Zhongnan Univ. Econ. Law 2023, 136–149. [Google Scholar]
- Lin, Y.; Lin, C.; Wei, Z. Thinking of ‘change’ in ‘difficulty’: Minimum wage standards and corporate digital transformation. J. Manag. Sci. 2026, 39, 69–86. [Google Scholar]
- Li, Z.; Chen, J. Corporate ESG Performance and Corporate Short-term Debt for Long-term Use. J. Quant. Technol. Econ. 2023, 40, 152–171. [Google Scholar]
- Card, D.; Krueger, A.B. Minimum wages and employment: A case study of the fast-food industry in New Jersey and Pennsylvania. Am. Econ. Rev. 1994, 84, 772–793. [Google Scholar]
- Hu, J.; Yu, X.; Han, Y. Can ESG Rating Promote Green Transformation of Enterprises? J. Quant. Technol. Econ. 2023, 40, 90–111. [Google Scholar]
- Jiang, T. Mediating Effects and Moderating Effects in Causal Inference. China Ind. Econ. 2022, 5, 100–120. [Google Scholar]
- Zeng, G.; Su, S.; Peng, S. Corporate Leverage and Technological Innovation. China Ind. Econ. 2023, 155–173. [Google Scholar]
- Niu, Z.; Xu, C.; Wu, Y. Business Environment Optimization, Human Capital Effect and Firm Labor Productivity. J. Manag. World 2023, 39, 83–100. [Google Scholar]
- Borusyak, K.; Jaravel, X.; Spiess, J. Revisiting Event-Study Designs: Robust and Efficient Estimation. Rev. Econ. Stud. 2024, 91, 3253–3285. [Google Scholar] [CrossRef] [Scilit]
- De Chaisemartin, C.; D’Haultfœuille, X. Two-Way Fixed Effects Estimators with Heterogeneous Treatment Effects. Am. Econ. Rev. 2020, 110, 2964–2996. [Google Scholar] [CrossRef] [Scilit]
- Shangguan, Z.; Zhang, Y. Enterprise ESG Performance and Financial Asset Allocation: Stimulation or Inhibition? J. Shanghai Univ. Finance Econ. 2023, 25, 44–58. [Google Scholar]
- Wang, L.; Wang, H.; Shao, J. The path to energy saving: New energy demonstration city policy and energy transition development. Environ. Dev. Sustain. 2025, 1–35. [Google Scholar] [CrossRef] [Scilit]
- Shen, H.; Huang, N. Will the Carbon Emission Trading Scheme Improve Firm Value? Finance Trade Econ. 2019, 40, 144–161. [Google Scholar]
- Zhao, Q.; Li, H. Does ESG Rating Promote Corporate Green Technology Innovation: Micro Evidence from Chinese Listed Companies. South China J. Econ. 2024, 42, 116–135. [Google Scholar]
- Song, Q.; Lin, Y. Financial Agglomeration and Green Technology Innovation of Manufacturing Enterprises under the Background of Accelerating the Development of a Manufacturing Powerhouse. Financ. Econ. Res. 2023, 38, 84–99. [Google Scholar]
- Wang, L.; Lian, Y.; Dong, J. Study on the Impact Mechanism of ESG Performance on Corporate Value. Secur. Mark. Her. 2022, 23–34. [Google Scholar]
- Huang, H.; Zhai, S.; Chen, J. Corporate Life Cycle, Financing Methods and Financing Constraints—Based on the Moderating Effect Research of Investor Sentiment. J. Financ. Res. 2016, 433, 96–112. [Google Scholar]
- Jing, G. The Impact of Green Finance Reform on Green Total Factor Productivity in China: Mechanism and Effect Evolution. South China Financ. 2024, 35–48. [Google Scholar]

Disclaimer/Publisher’s Note: The statements, opinions and data contained in all publications are solely those of the individual author(s) and contributor(s) and not of MDPI and/or the editor(s). MDPI and/or the editor(s) disclaim responsibility for any injury to people or property resulting from any ideas, methods, instructions or products referred to in the content. |
© 2026 by the authors. Licensee MDPI, Basel, Switzerland. This article is an open access article distributed under the terms and conditions of the Creative Commons Attribution (CC BY) license.