


Abstract
Environmental innovation that reduces the use of energy, materials, and water and lowers emissions in firms’ own operations is central to sustainable development, yet small and medium-sized enterprises (SMEs) often lack the financial, technological, and human resources to pursue it, and governments seek to relieve these constraints through financial and non-financial support. How such support combines with the constraints SMEs face, however, remains unclear. This study examines how financial, capability, market and regulatory constraints combine with government financial and non-financial support in relation to environmental innovation. Applying fuzzy-set qualitative comparative analysis to innovation-active SMEs from the 2024 Korean Innovation Survey, it analyses the pooled sample and four Pavitt sectors. The results show that the main configuration combines the absence of financial constraint with capability and market constraints and involves no government support. In addition, the configurations differ across sectors: capability constraints recur in supplier-dominated and scale-intensive industries, market and regulatory constraints accompany environmental innovation among specialised suppliers, and no configuration emerges in science-based industries. Government support appears much more often in configurations for the absence of environmental innovation, and financial support appears together with financial constraint only in these configurations. The sector-level capability constraints recur across most robustness specifications, whereas the pooled configurations are sensitive to calibration choices. These findings suggest that sustainability policies supporting environmental innovation in SMEs should be designed around the combinations of constraints firms face and the innovation patterns of their sectors.
1. Introduction
Climate change is giving rise to various challenges, such as increasingly frequent natural disasters and threats to energy and food security [1]. In response, firms face pressure to pursue environmental innovation that enables a cost-effective and risk-managed transition to a low-carbon economy by reducing costs, managing risks, ensuring value-chain stability and responding to consumer preferences for products with stronger environmental performance [2,3,4]. Because environmental innovation lowers the use of energy, materials and water and reduces emissions in firms’ own operations, it links firms’ competitiveness to sustainable development. Climate-response capability is therefore no longer a matter of environmental protection alone but a source of economic, industrial and technological competitiveness [5,6].
While large firms can actively pursue carbon reduction and environmental innovation through their financial, technological and human resources [7], small and medium-sized enterprises (SMEs) remain vulnerable amid the rapid pace of the global transition. SMEs are flexible, but their innovative capacity may be limited to incremental changes [8], and their knowledge of environmental management has been found to be low [9]. Accordingly, governments have sought to alleviate the financial, capability-related, and market-related constraints of SMEs by using financial and non-financial policies. A growing body of the literature has examined the determinants of environmental innovation, and recent studies show that these determinants interact: the effect of environmental penalties on firms’ environmental innovation changes when subsidies are granted at about the same time [10], and environmental innovation emerges from the interplay of internal capabilities, government policies and market dynamics [11]. However, these studies largely focus on the effect of each barrier or each type of support. Support is likely to help mainly firms that face the constraint it targets and to matter little for others. Such an average effect mixes these two groups, which may explain why the effects of government support have been found to be mixed [12,13,14]. In the same way, a single constraint may work differently across firms. Uncertain demand, for example, may discourage environmental innovation in one firm but push another to cut costs. The key question is therefore which combinations of constraints and support go together with environmental innovation. A configurational approach can answer this question because it shows whether different combinations lead to the same outcome and whether the absence of environmental innovation is simply the reverse of its presence. Previous configurational studies, however, have combined environmental pressures or support with firms’ resources and capabilities [15,16], not with the constraints SMEs face.
Against this background, this study examines how the internal constraints faced by SMEs combine with external resources—specifically, government financial and non-financial support—in relation to environmental innovation. In this study, environmental innovation refers to innovation that generates environmental benefits within the firm, such as reduced consumption of energy, materials, and water, lower emissions, and increased recycling. This study aims to identify the combinations of conditions associated with environmental innovation by applying fuzzy-set qualitative comparative analysis (fsQCA) to innovation-active manufacturing SMEs. Sectors also differ in where their technology comes from and in whether their innovation targets processes or products [17], so the constraints firms face and the role of support may also differ across sectors. In supplier-dominated sectors, where technology comes with purchased equipment, environmental innovation may depend on how firms acquire and adopt new equipment. In scale-intensive sectors, it may depend more on process improvements that firms make on their own. In specialised-supplier and science-based sectors, where innovation focuses on products, environmental innovation in the firm’s own processes may be less closely linked to the constraints and support examined here. This study therefore asks three questions: which combinations of constraints and government support go together with environmental innovation among innovation-active SMEs; how these combinations differ across Pavitt sectors; and whether the combinations for the absence of such innovation are simply the reverse of those for its presence. By linking each type of support to the constraint it targets, this study asks not whether government support works on average, but under which combinations of constraints government support goes together with environmental innovation and under which it does not.
2. Theoretical Background
2.1. Environmental Innovation with Benefits for the Firm: Cost Savings and Barriers
Environmental innovation differs from other innovation. Like all innovation, it produces knowledge spillovers, but it also generates environmental benefits that accrue largely to society rather than to the innovator [18,19]. The determinants of environmental innovation differ by the type of environmental impact, and cost savings are an important motivation for reducing energy and material use [20]. This study focuses on benefits obtained within the firm: reduced material, water and energy use; lower emissions; cleaner inputs; and recycling. Such innovation resembles cost-reducing process innovation and corresponds to pollution prevention, which builds on continuous improvement inside the firm [21]. Its returns are realised internally.
In pursuing such innovation, firms face cost-related, knowledge-related, market-related, and regulatory barriers [22]. Since the outcomes of innovation are uncertain, external finance for innovation is difficult or costly to obtain [23], and financial constraints on innovation are more severe for smaller enterprises [24]. In the case of environmental innovation, financial barriers have a direct negative effect on investment decisions [25], financial constraints affect the development of environmental innovation in European SMEs, with effects that vary by the type of funding [12], and limited financial resources hinder energy-efficiency investment in more indebted manufacturing SMEs [26]. Moreover, environmental innovation is associated with R&D cooperation [27] and with external knowledge sourcing [28], which places a burden on SMEs that lack partners, knowledge, and qualified personnel. As for market constraints, customer requirements and demand are established drivers of environmental innovation [20,29], so uncertain demand and intense competition may weaken this pull. For innovation that saves costs, however, the same pressures may work in the opposite direction: a firm that cannot raise its prices has a reason to lower its costs.
These constraints may operate in different ways. D’Este et al. [22] distinguish revealed barriers, which reflect the difficulty of the innovation process and the learning that comes with engaging in it, from deterring barriers, which prevent firms from committing to innovation. Comparing firms with different degrees of engagement in innovation, they find both effects for cost and market barriers, with a particularly strong deterring effect for market barriers, and a mainly revealed effect for knowledge barriers. A constraint can therefore relate to innovation in two ways. It hinders innovation when the missing resource limits what a firm can invest in or carry out, which is the usual reading of financial constraints. It accompanies innovation when firms perceive it because they are innovating: firms that search for knowledge, partners and personnel are more likely to notice that these are scarce, and for innovation that saves costs, market pressure may act as a motive rather than only as an obstacle. In both cases, the same perceived constraint can be found in firms with environmental innovation and in firms without it, depending on the other conditions they face. Because this study examines innovation-active SMEs, it focuses on how the constraints perceived by firms engaged in innovation combine with other conditions, rather than on whether these constraints deter firms from innovating. Because demand- and market-related obstacles can be as important as financial ones [30], the constraints should be examined together.
2.2. Government Support and Environmental Regulation
Organisations depend on external actors for critical resources and seek alternative sources when these are hard to obtain [31,32]. For SMEs, government support is one such alternative source. In this view, financial instruments such as tax incentives, grants and subsidies, loans and guarantees are critical for a financially constrained firm but largely redundant for an unconstrained one. According to the existing literature, however, the effects of government financial support are not always positive but rather mixed [12,13,14]. Non-financial support, such as human resource, technology, and certification support, is intended for SMEs that lack knowledge, skills, or access to markets. Government support may thus alleviate the constraints faced by SMEs by addressing the specific limiting factors it targets. Recent evidence on environmental innovation confirms that the contribution of support depends on the mix of instruments. For instance, combining general innovation policy with environmental policy raises process-related environmental innovation more than innovation policy alone but not more than environmental policy alone [33]. Non-financial support may also fail to relieve the constraint it addresses [34]. However, the mere fact that a firm receives government support does not show whether the scale, timing, or design of the support is appropriate or whether it is actually effective. A firm might receive support because it faces constraints; it might receive an amount of support that is far too small to resolve those constraints; or it might continue to face constraints even while receiving support. Therefore, the coexistence of support and constraints does not necessarily mean that the support has failed. In this sense, since government policy instruments interact with one another and their effects depend on the specific mix employed, it is necessary to examine innovation activities in the context of various policies and the specific situation that firms face [35,36,37,38,39].
Meanwhile, environmental regulation, one of the government’s policy tools, occupies an ambiguous position. According to the Porter hypothesis, well-designed regulation can trigger innovation that offsets compliance costs [5], and policy interventions are found to be more powerful in inducing clean innovation when they are designed as a policy mix [40]. Regulation also imposes burdens, however, and can hamper innovation when markets or rules are uncertain [41,42]. Whether SMEs experience environmental regulation as a constraint or a stimulus is therefore an empirical question whose answer may depend on the other conditions a firm faces.
The arguments above imply that SMEs’ constraints, environmental regulation and government instruments do not operate independently but are mutually interrelated. The effect of a constraint may depend on which other constraints an SME faces and on which support it receives, and the effect of a given support instrument may depend in turn on the constraint it is meant to relieve. Examining the relationships formed by their combination, rather than each condition in isolation, is therefore required to understand how any one condition operates. Moreover, because SMEs differ in the constraints they face and the support they receive, different combinations may lead to the same outcome [43,44,45]. Recent studies confirm such interdependence for pairs of policy instruments [10] and for internal, market and governmental drivers [11], but they do not relate support to the constraints firms face. Studies adopting a configurational approach have combined environmental pressures or support with firms’ resources and capabilities [15,16] or technology factors with knowledge search [46], and Fernández-Muñiz et al. [47] combine perceived barriers with leaders’ personality traits in a small sample of 40 SMEs. How SMEs’ constraint profiles combine with financial and non-financial government support in association with environmental innovation in a large sample has thus rarely been examined.
2.3. Sectoral Heterogeneity in Environmental Innovation
According to Pavitt [17], the sources, direction and appropriability of technical change differ between supplier-dominated, scale-intensive, specialised-supplier and science-based sectors because sectors differ in the origin of their technological knowledge, in user requirements and in appropriability conditions. In supplier-dominated sectors, firms are typically small and rarely conduct in-house R&D. They rely on machinery and materials bought from suppliers, and thus technology and innovation stem from outside the firm, embodied in the capital goods and intermediate inputs they purchase. Their innovation is therefore mainly process-oriented and aimed at cost reduction. Scale-intensive sectors depend on large production volumes, which make even small process improvements valuable. Unlike in supplier-dominated sectors, knowledge is generated in-house through production engineering and learning by doing. Specialised suppliers produce machinery and instruments for performance-sensitive users; their innovation is product-oriented and rests on close interaction with users. Science-based sectors draw on rapidly advancing science and in-house R&D. Later studies have revised and extended the taxonomy and found that it captures structural differences in patterns of innovation [48,49].
These innovation patterns suggest why the combinations of constraints and support associated with environmental innovation may differ across sectors. Empirical studies confirm that the drivers of environmental innovation vary with technological opportunities and sectoral conditions [50]. In supplier-dominated sectors, improvements in a firm’s own operations largely arrive with machinery and materials from suppliers [17,51]. Acquiring equipment has been found to matter more for environmental innovation than acquiring patents [52], and in a supplier-dominated industry such as pulp and paper, the adoption of clean technologies depends on the interplay of the firm’s resources, external pressures and the characteristics of the technology [53]. Environmental innovation in these sectors may therefore depend on how firms acquire and adopt new equipment, which can involve both funding and the skills needed to use it. In scale-intensive sectors, firms improve processes through their own production engineering and learning by doing [17]. Cost savings are a main motive for innovations that reduce energy and material use [20], and only process-related, not product-related, environmental innovation has been found to be driven by cost savings [54]. Environmental innovation in these sectors may therefore depend more on process improvements made in-house. Some of these industries, such as refined petroleum, non-metallic minerals and basic metals, are also emission-intensive, and regulation is the main driver of innovations that reduce air and water pollution and hazardous substances [20]. In specialised-supplier and science-based sectors, innovation is directed at products for users [17], and the environmental performance of products responds mainly to customer requirements and expected regulation [20]. Environmental innovation in the firm’s own processes may thus be less closely linked to the constraints and support examined here. This potential explanation suggests that the configuration of constraints and government support related to environmental innovation may vary across industrial sectors.
3. Data and Methodology
3.1. Data
The data are drawn from the 2024 Korean Innovation Survey (KIS): Manufacturing Sector, an official national statistical survey conducted by the Science and Technology Policy Institute (STEPI) in line with the Oslo Manual and the Community Innovation Survey. Of the 4595 responding firms, 3805 are SMEs. Because the outcome is environmental innovation, the sample is restricted to the 1576 innovation-active SMEs that introduced at least one product or business-process innovation in 2021–2023, and firms for which environmental regulation was not applicable are excluded (n = 283). The findings therefore apply to innovation-active SMEs subject to environmental regulation; SMEs that did not innovate, including those deterred from innovating by the constraints examined here, are not observed. The final sample of 1293 SMEs is classified by two-digit KSIC industry into supplier-dominated (n = 259), scale-intensive (n = 443), specialised-supplier (n = 325) and science-based (n = 266) sectors following Pavitt [17] (Table 1).
Table 1.
Classification of manufacturing industries into Pavitt sectors (N = 1293).
3.2. fsQCA
fsQCA identifies combinations of conditions that are sufficient for an outcome and thereby captures conjunctural causation, equifinality and causal asymmetry, which net-effect estimates cannot [44,55]. QCA was developed for small and intermediate numbers of cases, but it is increasingly applied to large samples of firms [56,57] as an alternative and a complement to regression analysis, which answers a different, related question [56,58]. In this study, first, truth-table rows with few cases are excluded by a frequency threshold above one, while at least 80% of the cases are retained [56,59]. Second, because large-N results are sensitive to calibration and thresholds, robustness tests are required [60,61,62], and because analytic decisions are often incompletely reported in large-N QCA [63], all thresholds are stated below.
Raw measures are calibrated into fuzzy-set membership scores between 0 and 1 with the direct method, using anchors for full membership (0.95), the crossover (0.5), and full non-membership (0.05) [55]. Necessity is examined first with a consistency threshold of 0.90. For sufficiency, truth-table rows must contain at least five cases in the pooled analysis and three in the sector analyses, which retains 97% and 86–93% of the cases. In the truth table, a row is coded as sufficient for the outcome if its raw consistency is at least 0.85 and its PRI (proportional reduction in inconsistency) is at least 0.65, which is stricter than the minimum of 0.50 [59,64]. The complete truth tables, including the number of cases, raw consistency and PRI of every observed row and logical remainder, and the conservative, parsimonious and intermediate solutions for all analyses are reported in Supplementary Tables S1–S12.
For the absence of the outcome, the thresholds are raised to 0.90 for raw consistency and 0.70 for PRI. There are two reasons. First, the absence of the outcome is the larger set in terms of membership scores: the mean membership reported in Table A1 is about 0.54 for the absence and 0.46 for the outcome, because SMEs that report no environmental benefit are almost fully out of the outcome set, whereas SMEs just above the crossover are only partly in it. The larger a set, the more easily any row is a subset of it, so raw consistency is inflated, and a stricter test is needed to keep rows that are only trivially consistent out of the solution. Second, the analysis of the absence serves to check whether the absence mirrors the presence, and a conservative standard guard against over-interpreting it. The consistency and PRI thresholds apply to truth-table rows only. Following common practice, the fit of the resulting configurations is reported with consistency and coverage at two levels [44,55]. For each configuration, consistency shows how far the cases in the configuration also show the outcome, raw coverage shows how much of the outcome the configuration covers, and unique coverage shows how much is covered only by this configuration. For the solution, the same measures are computed for all configurations together. Because a configuration can also cover cases from other rows, its consistency may fall below the row threshold.
Intermediate solutions are derived with the directional expectations that constraints are absent and support is present, without an expectation for regulatory constraint, whose effect is theoretically ambiguous (Section 2.2). A directional expectation states whether a condition is expected to help produce the outcome when it is present [55,65]. Government support provides resources that firms lack (Section 2.2), so it is expected to help, or at least not to hinder, environmental innovation. This does not contradict the argument that the effects of support depend on context. That argument concerns whether support makes a difference, not whether it harms innovation: support helps firms that face the constraint it targets and matters little for others. In addition, a directional expectation is applied only to combinations with too few or no cases in the data. For these combinations, it assumes only that adding support to a combination that already goes together with environmental innovation would not remove it. It does not assume that support produces environmental innovation, and whether support actually appears in the configurations is still decided by the observed cases. Following the enhanced standard analysis [65], logical remainders that would serve as simplifying assumptions in both the analysis of the outcome and that of its absence (contradictory simplifying assumptions) are excluded from the minimisation; this applies to seven remainders in the pooled sample and to one remainder each in the scale-intensive and specialised-supplier analyses. Where the consistency of an intermediate solution falls below 0.80, the conservative solution is reported. Core conditions are those that appear in both the parsimonious and the intermediate solution [44]. Where several equally parsimonious models exist, a condition is treated as core only if it is core in a majority of these models. Where the models yield different intermediate solutions, the reported solution consists of the conditions that appear in a majority of the alternative solutions, and configurations that appear in only some of them are marked. The number of solutions in which each configuration appears and the number of models in which each condition appears as core are reported in Appendix B. Robustness is assessed with lower thresholds, shifted crossovers, and percentile-based anchors [62]. The analysis uses the QCA package (version 3.25.7) in R (version 4.6.1).
3.3. Variables
3.3.1. Outcome
The outcome is environmental innovation, that is, product or business-process innovations that reduce negative environmental impacts within the firm. Following the CIS, the KIS asks whether the firm’s innovation yielded six such benefits, each rated as not introduced (0), low contribution (1), or high contribution (2) (Table 2). The summed score forms IEB_FIRM (0–12). Scores of one or two can arise from a single benefit area or from low contributions only. A score of at least three requires benefits in at least two areas, with at least one high contribution or three low contributions, so the crossover (2.5) separates incidental from more than incidental benefits. Full membership (8) requires benefits in at least four areas, at least two of them with a high contribution, and full non-membership corresponds to no benefit. About 28% of the SMEs report no benefit, 50% score three or more, and 14% score eight or more; a higher crossover is examined in the robustness tests (Section 4.5).
Table 2.
Outcome items.
3.3.2. Conditions
Financial, capability, and market constraints are measured by the sum of their items (Table 3), each rated from not applicable (0) to very high (5); ‘not applicable’ indicates that the obstacle was not perceived. Full membership corresponds to all items rated ‘high’ (4), full non-membership to all items rated ‘very low’ (1) and the crossover to an average rating of about 2.4 for financial constraint (9.5/4), 2.5 for capability constraint (17.5/7), and 2.25 for market constraint (4.5/2), half-points close to the midpoint of the 0–5 scale; a sum of 10 on the four financial items, for example, yields a membership of 0.56 and a sum of 9 yields 0.43. Regulatory constraint is measured by a bipolar item on the effect of environmental regulation on innovation (1 = strongly hindered, 3 = no effect, 5 = strongly promoted), reversed so that the set captures hindering regulation; the crossover lies between ‘somewhat hindered’ and ‘no effect’, so that firms reporting no effect are more out than in (0.27). Because this item is bipolar, the set differs from the other constraints. The other constraints measure how strongly an obstacle hampers innovation, whereas this item measures whether regulation hampers or promotes it. The presence of regulatory constraint is therefore comparable to that of the other constraints, as both indicate a perceived obstacle to innovation. Its absence, however, combines firms for which regulation has no effect with firms for which it promotes innovation, so it is interpreted only as the absence of hindering regulation, not as regulation that promotes innovation. For the same reason, no directional expectation is set for this condition (Section 3.2).
Table 3.
Condition items and calibration anchors.
Government financial and non-financial support are measured by the number of instruments used in each category rather than by importance ratings, which may themselves reflect innovation success. The count captures whether and how widely firms use each type of government support, not the amount received or its adequacy and effectiveness. The crossover separates non-use from the use of one instrument, the qualitatively decisive distinction, and full membership corresponds to three instruments. All crossovers lie at half-points so that no case has a membership of exactly 0.5 (Table 3). The anchors follow the meaning of the response categories rather than sample percentiles, which would place half of the firms in each set irrespective of the severity reported and are undefined for support measures whose median is zero [59,65]. The share of SMEs that are more in than out of a set ranges from 21% (financial constraint) to 46% (financial support). The distributions of the raw measures and membership scores are reported in Appendix A (Table A1). For financial constraint, the crossover lies above the 75th percentile of the summed score because most SMEs rate financial obstacles as very low or low; the anchors thus reflect the severity reported rather than a firm’s position in the sample.
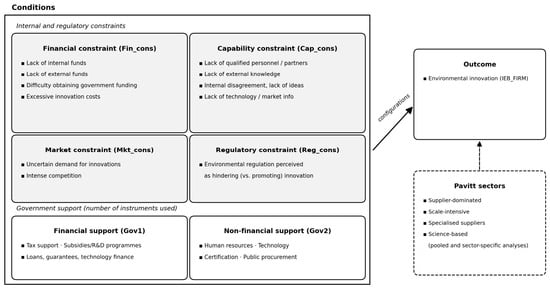
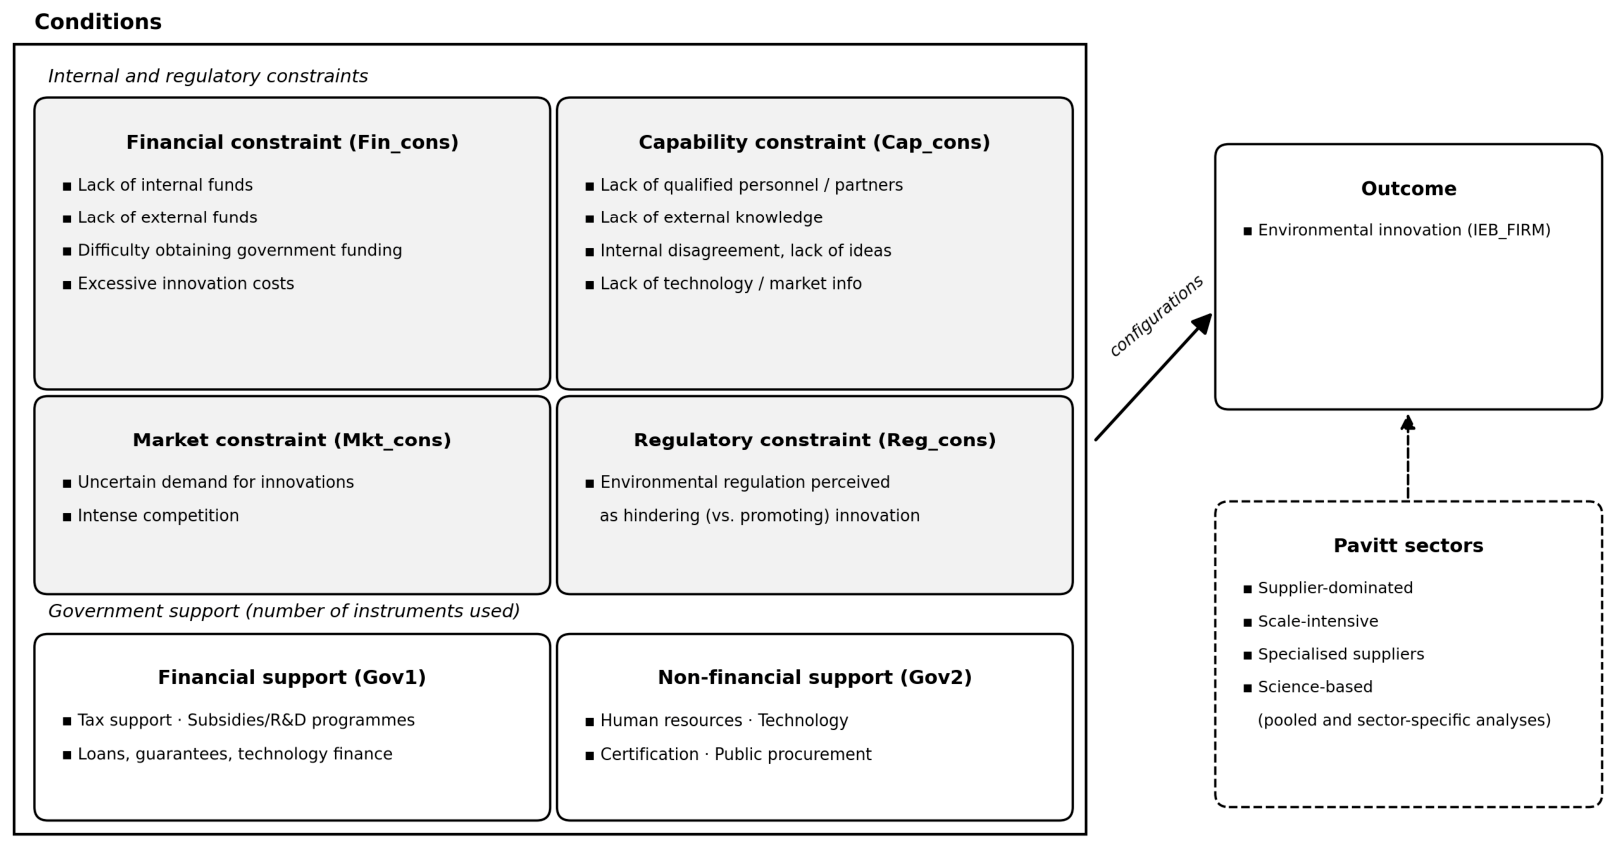
Figure 1 summarises the research framework.
Figure 1.
Research framework.
4. Results
4.1. Necessity Analysis
In Table 4, the necessity analysis shows that there is no condition reaching the necessity threshold of 0.90 in the pooled sample or in any sector (Appendix A, Table A2). No single condition is therefore necessary for environmental innovation. The highest consistency is found for the absence of financial constraint (0.877), but it remains below the threshold and largely reflects the fact that only 21% of the SMEs are more in than out of the financially constrained set. The absence of financial constraint should therefore not be read as a necessary condition.
Table 4.
Analysis of necessary conditions for IEB_FIRM: pooled sample (N = 1293).
4.2. Results for the Pooled Sample
Table 5 shows the two configurations for environmental innovation in the pooled sample. F2 is the main configuration. It has the highest raw coverage (0.338; unique coverage 0.250) and combines the absence of financial constraint with capability and market constraints, the absence of hindering regulation, and the absence of both types of support, all as core conditions. Firms in this configuration tend to report environmental innovation without using any government support while perceiving capability-related obstacles and an uncertain, competitive market. F1 is a smaller configuration (raw coverage 0.108) with high consistency (0.935). It combines financial, capability, and market constraints with non-financial support, the absence of financial support, and the absence of hindering regulation, all as core conditions. These firms report financial, capability-related, and market obstacles, use no financial instrument, and use at least one non-financial instrument, that is, human resources, technology, certification, or public procurement support. These configurations show which conditions occur together with environmental innovation, not how firms achieve it. The presence of capability and market constraints in F1 and F2 does not show how firms deal with these obstacles, and the presence of non-financial support together with financial constraint in F1 does not show that the support has relieved the constraint.
Table 5.
Configurations for IEB_FIRM: pooled sample (N = 1293).
The fit of the pooled solution calls for caution. The solution consistency of 0.850 only modestly exceeds the level of 0.75–0.80 usually regarded as acceptable [44,55], and F2, the main configuration, is the less consistent of the two (0.852), so a noticeable share of membership in F2 is not matched by the outcome. The configurations should therefore be read as combinations that are usually, but not always, accompanied by environmental innovation. The solution coverage of 0.357 leaves about two-thirds of the membership in the outcome unexplained, and most of what is explained comes from F2 (unique coverage 0.250) rather than F1 (0.019). The pooled results thus describe one dominant and one minor path for a subset of SMEs, not a full account of how SMEs achieve environmental innovation. In large-N fsQCA with heterogeneous cases, configurations identify sufficient paths for subsets of cases rather than explaining all cases [56,59]. SMEs with environmental innovation that are not covered may have achieved it through factors not included in the model, such as in-house R&D or environmental management practices, or may belong to combinations of conditions in which firms with and without environmental innovation are mixed, so that these combinations do not pass the consistency and PRI thresholds.
4.3. Results by Pavitt Sector
Table 6 reports the sector-specific configurations for environmental innovation. In supplier-dominated industries, four configurations are found. SD1 and SD3 are the main configurations and combine the absence of financial constraint with capability constraint and the absence of non-financial support. SD2 combines financial support with the absence of financial constraint and of hindering regulation, and SD4 combines financial support and capability constraint with hindering regulation and the absence of market constraint; all four configurations include the absence of non-financial support. The supplier-dominated solution has the lowest consistency among the sector solutions (0.801), and its intermediate solution was even less consistent (0.788), so the conservative solution is reported. Four separate configurations are needed, and together they are less consistent than the solutions for the other sectors, which means that firms with the same combination of conditions differ more in whether they achieve environmental innovation. Only the combination of capability constraint with the absence of non-financial support, shared by SD1 and SD3, appears in every robustness specification (Section 4.5), whereas SD2 and SD4 are less stable. The conclusions for this sector are therefore based only on this combination.
Table 6.
Configurations for IEB_FIRM by Pavitt sector.
The configurations alone cannot indicate the underlying mechanisms, but they allow some conjectures about them. Firms in industries such as food and beverages, textiles, or furniture may achieve environmental innovation by replacing equipment, with capability constraint reflecting the effort needed to adopt and operate it. SD2 may indicate that financial support complements investments by financially sound firms, follows investment decisions or has relieved earlier financial constraints, and SD4 may reflect equipment upgrades in response to regulation. The lower consistency may arise because the sector combines industries with very different production conditions.
In scale-intensive industries, two configurations are found. SI2 is the main configuration and combines capability constraint with the absence of financial support, non-financial support and hindering regulation, together with the absence of financial constraint. SI1 shares capability constraint and the absence of financial constraint, hindering regulation and financial support with SI2, but includes the absence of market constraint as a core condition instead of the absence of non-financial support.
Capability constraint combined with the absence of hindering regulation appears in every robustness specification that yields configurations (Section 4.5). Given the role of in-house production engineering in this sector (Section 2.3), one possible interpretation is that firms in industries such as basic metals, plastics or non-metallic minerals pursue incremental process improvements with their own resources, so that technical capability rather than finance is their main limitation. The configurations do not show such process improvements directly; they show only that environmental innovation occurs together with capability constraint and without financial constraint or financial support.
Among specialised suppliers, one configuration is found. SS1 combines the absence of financial constraint with market and regulatory constraints and the absence of financial support, all as core conditions. Its consistency is 0.868, but its coverage is low (0.217), so SS1 accounts for only part of the specialised suppliers with environmental innovation. Market and regulatory constraints, combined with the absence of financial constraints, appear in every robustness specification except that with lower thresholds, in which regulatory constraints do not appear in the solution (Section 4.5).
The configuration alone cannot reveal the underlying mechanism, but it allows some conjectures. Firms may pursue environmental innovation with their own resources in response to market uncertainty and regulatory pressure. Alternatively, compliance with regulation may itself lead to environmental innovation even though regulation is perceived as an obstacle to innovation. The low coverage may arise because innovation in this sector is product-oriented (Section 2.3), so environmental innovation in the firm’s own processes may arise through more diverse routes than any single combination of the conditions examined here can capture.
No configuration is found in science-based industries. In the truth table (Supplementary Table S5), 25 rows contain at least three cases and cover 240 of the 266 SMEs, but none meet the cut-offs: the highest raw consistency is 0.846 and the highest PRI is 0.570, below the thresholds of 0.85 and 0.65. In every combination of conditions, SMEs with and without environmental innovation are thus mixed. This does not mean that science-based SMEs do not achieve environmental innovation, but that no combination of the conditions examined here is consistently associated with it.
4.4. Results for the Absence of the Outcome
Table 7 reports five configurations for the absence of environmental innovation in the pooled sample. NF1 and NF2 combine the absence of capability constraint with both financial and non-financial support, together with financial constraint (NF1) or hindering regulation (NF2). NF3 and NF4 combine the absence of financial and market constraints with non-financial support, together with the absence of financial support (NF3) or hindering regulation (NF4). NF5 combines financial, market, and regulatory constraints with financial support. NF2 and NF4 have very low unique coverage (0.006 each) and largely overlap with NF1 and NF3, with which they share the absence of capability constraint together with both types of support, or the absence of financial and market constraints together with non-financial support. They are therefore read not as independent paths but as variants around these shared cores [44]. The solution consistency (0.869) is below the raw consistency threshold of 0.90 because this threshold applies to truth-table rows, whereas the configurations are simplified combinations that also cover cases in other rows, including rows that do not meet the threshold (Section 3.2). Each configuration still has a consistency of at least 0.888, and the solution remains above the level usually regarded as acceptable [44,55].
Table 7.
Configurations for the absence of IEB_FIRM: pooled sample (N = 1293).
The configurations alone cannot show why these firms report no environmental innovation, but they allow some conjectures. Firms in NF1 and NF2 may not be undertaking demanding process changes, may direct their innovation toward products or markets, or may treat environmental regulation as a compliance obligation. Firms in NF3 and NF4 may face limited market pressure to improve efficiency or may operate in protected markets, and NF4 is also consistent with compliance without further environmental effort. In NF5, support may have been directed to these firms because they are constrained, or it may have been used for business survival or product development rather than for environmental innovation; the data do not show whether the support was appropriate or effective. Overall, the results show that the configurations for the absence of environmental innovation are not simply the inverse of those for its presence.
Table 8 reports the sector-specific configurations for the absence of environmental innovation. In scale-intensive industries, three configurations are found. SI-N1 combines the absence of capability constraint with hindering regulation and non-financial support. SI-N2 combines financial constraint with the absence of capability and market constraints. SI-N3 combines financial, market, and regulatory constraints with both financial and non-financial support. Among specialised suppliers, SS-N3 and SS-N4 combine financial constraint with financial support. The two configurations largely overlap; SS-N4 adds little unique coverage (0.010) and is read as a variant of the same path. In science-based industries, SB-N2 combines financial constraint with hindering regulation, but it appears in only one of the three intermediate solutions. Among specialised suppliers and science-based industries, configurations commonly combine the absence of market constraint with support. No configuration is found in supplier-dominated industries.
Table 8.
Configurations for the absence of IEB_FIRM by the Pavitt sector.
SI-N1 may describe firms that either do not undertake demanding process changes or treat regulation mainly as a compliance cost. SI-N2 is consistent with firms that lack resources and face little pressure to act, and SI-N3 may indicate firms facing multiple pressures whose limited financial resources restrict the adoption of environmental innovation. The combination of financial constraint and financial support in SS-N3 and SS-N4 may reflect support directed to constrained firms, support that covers only part of the cost, or programmes that require substantial contributions from firms. The combination of the absence of market constraint with support among specialised suppliers and science-based industries may indicate that firms with secure demand use support for product development rather than environmental innovation.
Overall, the configurations for the absence of environmental innovation only partly reverse those for its presence, and no configuration is the complete opposite of F2. Conditions such as the absence of capability constraint, the absence of market constraint, financial constraint, hindering regulation, and the use of support are more common among configurations without environmental innovation. In particular, government support appears in 12 of the 14 configurations for the absence, compared with only three of the nine configurations for the presence. This comparison should be read with care. Counting configurations gives each the same weight, although some cover many firms and others only a few, and the solutions on both sides explain only part of their outcome. Support is also often directed to firms that face constraints, so its frequent appearance in configurations without environmental innovation may show where support goes rather than what it does. The same caution applies to the finding that financial support and the financial constraint it targets appear together only in configurations for the absence of environmental innovation (NF1, NF5, SI-N3, SS-N3 and SS-N4), whereas non-financial support appears together with both capability and market constraints only in F1, a configuration for its presence. These patterns describe configurations rather than individual firms and therefore do not establish that government support reduces environmental innovation.
4.5. Robustness Check
Table 9 shows the results of the robustness check following the logic of Oana and Schneider [62]. The configurations obtained under each specification, with their consistency and coverage, are reported in Appendix C (Table A4). Each specification is estimated with the same procedure as the baseline, including the enhanced standard analysis. With lower thresholds of 0.80 for raw consistency and 0.60 for PRI, all baseline typical cases remain covered. Raising the constraint crossovers by 0.5 of an average rating retains one pooled configuration, F2 (61% of the typical cases), while F1 is lost; the sector solutions are largely retained (73–84%). When the outcome crossover is raised by one point or support requires at least two instruments, no pooled configuration meets the cut-offs, although the supplier-dominated and scale-intensive solutions largely persist under the stricter support calibration; under the stricter outcome calibration, the sector solutions are also largely lost. Under percentile anchors, the pooled solution retains no typical case, whereas the scale-intensive and specialised-supplier solutions are largely retained. In scale-intensive industries, capability constraint combined with the absence of hindering regulation appears in the solution of every specification that yields configurations and is thus relatively stable, although it too disappears when the outcome crossover is raised. The pooled solution depends on the calibration of the outcome, support and constraint sets and should be read with this caution.
Table 9.
Robustness of the solutions for IEB_FIRM.
5. Discussion and Conclusions
5.1. Discussion of the Findings
The results show that environmental innovation among SMEs is associated with several combinations of conditions. A recurring pattern is the presence of capability constraints. In the pooled sample, the main configuration for environmental innovation combines the absence of financial constraint with capability and market constraints, while both financial and non-financial support are absent. A similar pattern also appears in supplier-dominated and scale-intensive industries. Environmental innovation among specialised suppliers is associated with market and regulatory constraints, whereas scale-intensive firms report environmental innovation even without market pressure. In science-based industries, no common configuration is identified.
Government support appears much more frequently in configurations associated with the absence of environmental innovation than in those associated with its presence. In addition, financial support and the financial constraint it is intended to address appear together only in configurations associated with the absence of environmental innovation, whereas non-financial support accompanies both capability and market constraints in F1. Finally, the configurations for the absence of environmental innovation are not simply the opposites of those for its presence. Although several conditions are more common in configurations associated with the absence of environmental innovation, no configuration fully reverses the main configuration.
These patterns can be interpreted in several ways, although the configurations themselves do not show the underlying mechanisms. One possible explanation for the recurring capability constraints is that even if firms possess sufficient financial resources for environmental innovation, they may still face difficulties in identifying, adopting, or implementing appropriate technologies. This is in line with evidence that knowledge barriers mainly reflect learning from engagement in innovation rather than deterring it [22], and that barriers related to skilled labour, partners and technological knowledge matter more for firms in countries closer to the technological frontier, whereas finance barriers matter less [66]. The nature of the capability constraint may differ across sectors: in supplier-dominated industries, it may concern the adoption and operation of externally supplied machinery, whereas in scale-intensive industries it may involve the technical skills required for incremental improvements in production processes. The sector results also suggest that market and regulatory pressures may relate differently to environmental innovation across technological regimes. The absence of a common configuration in science-based industries is open to two readings. This may reflect the heterogeneity of these industries, or environmental innovation may arise from R&D and product development rather than from distinct combinations of constraints and support. R&D has been found to be a central internal knowledge source for environmental innovation [67]. However, other evidence shows that internal R&D is not the main source of environmental innovation, which depends more on regulation, cost savings and external knowledge [68]. This explanation therefore remains a proposition to be tested.
The patterns of government support should not be interpreted as evidence that government support reduces environmental innovation, since the configurational analysis does not establish a causal effect. Instead, they are consistent with several possibilities. Since support often targets firms facing financial and non-financial constraints, these firms—unlike others—may have little room to consider environmental innovation. Alternatively, given evidence that government financial support helps SMEs survive but does not lead to growth [69], that additional funds are spent on innovation mainly by firms with high innovative capability [70], and that subsidies do not significantly affect environmental innovation [54], such support may be used for product development or firm survival but may not be sufficient to overcome the constraints that firms face. By contrast, government R&D subsidies have been found to reduce the long-term survival of Korean SMEs [71], so the role of support in firm survival may depend on the type of support and remains to be verified. However, since this study measures support by the number of instruments used, not by the amount received, it is difficult to distinguish between these possibilities; therefore, caution should be exercised in the interpretation of the findings. The contrast between financial and non-financial support suggests that the two types of support may relate differently to environmental innovation, a proposition that requires further testing.
In sum, the results suggest that the combinations of constraints and support may reflect the process through which SMEs adopt environmental innovation. Capability constraints may be encountered in the course of pursuing such innovation rather than preventing it, market pressure may act as a motive and not only as an obstacle, and the absence of the outcome is only partly the reverse of its presence, so the presence and absence of environmental innovation are not defined by a simple mirror-image relationship.
5.2. Policy Implications
Because environmental innovation in SMEs contributes to resource efficiency and the low-carbon transition, the design of support for it is part of the policy mix for sustainability transitions [36], and the findings offer several implications for this design. First, government support should be tailored to the constraints firms face and to technological regimes rather than applied uniformly. The combinations of conditions that accompany environmental innovation differ across sectors, and no single condition is necessary for it. Second, finance may not be the main limitation for many innovating firms, so support aimed at building technical capability may be more conducive to environmental innovation than additional finance. The main configurations show that environmental innovation often occurs among firms that report capability constraints but not financial constraints, and many of these firms use no government support. In scale-intensive industries, where this link between capability constraint and environmental innovation is relatively stable across specifications, programmes that strengthen engineering skills for process improvement may be particularly relevant. Third, the design and implementation of environmental regulations may deserve attention alongside direct support. Among specialised suppliers, environmental innovation accompanies market and regulatory constraints, whereas across the sample, hindering regulation is more common in combinations without environmental innovation. Fourth, financial support programmes should be evaluated for whether their scale and the contribution they require from firms match the constraints firms face. Financial support coexists with financial constraint only in configurations in the absence of environmental innovation, and this study does not show whether this support was adequate. These implications rest on associations rather than causal effects. Whether support is adequate in amount, how firms actually use it, and which mechanisms underlie the sectoral differences were not observed in this study and remain questions for future research.
5.3. Limitations and Future Research
This study has several limitations. First, its cross-sectional design does not permit causal inference. Because support and environmental innovation refer to the same period, the data do not show whether support preceded or followed the innovation or whether the constraints firms report acted as barriers or as stimuli, and the firm-level mechanisms proposed to interpret the configurations remain to be examined in interviews and panel studies. Second, the study focuses on environmental innovation within the firm, and both constraints and environmental benefits are self-reported. Perceptions of obstacles may differ between firms facing the same conditions, and firms that achieved environmental innovation may judge regulation more favourably after the fact. In addition, government support is measured by the number of instruments used, not by the amount received or its adequacy, so the analysis cannot show whether it was sufficient. Third, as is common in large-N fsQCA, where case heterogeneity lowers consistency and makes solutions more responsive to calibration and threshold choices [56], some solutions vary with these choices; in particular, the pooled solution and F1 depend on the calibration of the outcome, support and constraint sets (Section 4.5). Moreover, solution coverage is moderate, so the configurations describe sufficient paths for only part of the SMEs with environmental innovation; future research could add conditions such as R&D intensity or environmental management practices. Fourth, the sample includes only innovation-active SMEs subject to environmental regulation. Barriers that deter firms from innovating [22] are therefore not observed, and the findings should not be generalised to SMEs as a whole. Future research that includes non-innovators could distinguish revealed from deterring barriers. Finally, the data come from a single survey of Korean manufacturing SMEs, and the findings may differ in other countries and periods.
Supplementary Materials
The following supporting information can be downloaded at https://www.mdpi.com/article/10.3390/su182111197/s1. Table S1: Truth table for the presence of IEB_FIRM, pooled sample (N = 1293); Table S2: Truth table for the presence of IEB_FIRM, supplier-dominated industries (N = 259); Table S3: Truth table for the presence of IEB_FIRM, scale-intensive industries (N = 443); Table S4: Truth table for the presence of IEB_FIRM, specialised suppliers (N = 325); Table S5: Truth table for the presence of IEB_FIRM, science-based industries (N = 266); Table S6: Truth table for the absence of IEB_FIRM, pooled sample (N = 1293); Table S7: Truth table for the absence of IEB_FIRM, supplier-dominated industries (N = 259); Table S8: Truth table for the absence of IEB_FIRM, scale-intensive industries (N = 443); Table S9: Truth table for the absence of IEB_FIRM, specialised suppliers (N = 325); Table S10: Truth table for the absence of IEB_FIRM, science-based industries (N = 266); Table S11: Conservative, parsimonious and intermediate solutions for the presence of IEB_FIRM; Table S12: Conservative, parsimonious and intermediate solutions for the absence of IEB_FIRM.
Funding
This research received no external funding.
Institutional Review Board Statement
Not applicable.
Informed Consent Statement
Not applicable.
Data Availability Statement
The data analysed in this study were obtained from the 2024 Korean Innovation Survey (KIS): Manufacturing Sector conducted by the Science and Technology Policy Institute (STEPI).
Conflicts of Interest
The author declares no conflicts of interest.
Abbreviations
The following abbreviations are used in this manuscript:
| CIS | Community Innovation Survey |
| fsQCA | Fuzzy-set qualitative comparative analysis |
| KIS | Korean Innovation Survey |
| KSIC | Korean Standard Industrial Classification |
| PRI | Proportional reduction in inconsistency |
| QCA | Qualitative comparative analysis |
| R&D | Research and development |
| SMEs | Small and medium-sized enterprises |
| STEPI | Science and Technology Policy Institute |
Appendix A
Table A1 reports the distributions of the raw measures and of the calibrated membership scores in the pooled sample.
Table A1.
Distributions of the raw measures and membership scores (N = 1293).
Table A2 reports the analysis of necessary conditions for environmental innovation of firms in each Pavitt sector. No condition reaches the necessity threshold of 0.90 in any sector.
Table A2.
Analysis of necessary conditions for IEB_FIRM by Pavitt sector (consistency).
Appendix B
Table A3 reports, for each analysis with several equally parsimonious models or several intermediate solutions, the number of solutions in which each configuration appears and the number of parsimonious models in which each of its conditions appears as core. A condition is shown as core in Table 6, Table 7 and Table 8 if it appears as core in a majority of the equally parsimonious models.
Table A3.
Core conditions across equally parsimonious models and alternative intermediate solutions.
References
- Stern, N. The Economics of Climate Change: The Stern Review; Cambridge University Press: Cambridge, UK, 2006. [Google Scholar]
- Alam, A.; Du, A.M.; Rahman, M.; Yazdifar, H.; Abbasi, K. SMEs respond to climate change: Evidence from developing countries. Technol. Forecast. Soc. Change 2022, 185, 122087. [Google Scholar] [CrossRef] [Scilit]
- Pinkse, J.; Bohnsack, R. Sustainable product innovation and changing consumer behavior: Sustainability affordances as triggers of adoption and usage. Bus. Strategy Environ. 2021, 30, 3120–3130. [Google Scholar] [CrossRef] [Scilit]
- Zhou, G.; Liu, L.; Luo, S. Sustainable development, ESG performance and company market value: Mediating effect of financial performance. Bus. Strategy Environ. 2022, 31, 3371–3387. [Google Scholar] [CrossRef] [Scilit]
- Porter, M.E.; van der Linde, C. Toward a new conception of the environment–competitiveness relationship. J. Econ. Perspect. 1995, 9, 97–118. [Google Scholar] [CrossRef] [Scilit]
- Acemoglu, D.; Aghion, P.; Bursztyn, L.; Hemous, D. The environment and directed technical change. Am. Econ. Rev. 2012, 102, 131–166. [Google Scholar] [CrossRef] [Scilit] [PubMed]
- Liao, Z.; Liu, Y. What drives environmental innovation? A meta-analysis. Bus. Strategy Environ. 2021, 30, 1852–1864. [Google Scholar] [CrossRef] [Scilit]
- Hansen, O.E.; Søndergård, B.; Meredith, S. Environmental innovations in small and medium sized enterprises. Technol. Anal. Strateg. Manag. 2002, 14, 37–56. [Google Scholar] [CrossRef] [Scilit]
- Merritt, J.Q. EM into SME won’t go? Attitudes, awareness and practices in the London Borough of Croydon. Bus. Strategy Environ. 1998, 7, 90–100. [Google Scholar] [CrossRef]
- Li, R.; Ramanathan, R. The interactive effect of environmental penalties and environmental subsidies on corporate environmental innovation: Is more better or worse? Technol. Forecast. Soc. Change 2024, 200, 123193. [Google Scholar] [CrossRef] [Scilit]
- Arranz, C.F.A. A system dynamics approach to modelling eco-innovation drivers in companies: Understanding complex interactions using machine learning. Bus. Strategy Environ. 2024, 33, 4456–4479. [Google Scholar] [CrossRef] [Scilit]
- Cecere, G.; Corrocher, N.; Mancusi, M.L. Financial constraints and public funding of eco-innovation: Empirical evidence from European SMEs. Small Bus. Econ. 2020, 54, 285–302. [Google Scholar] [CrossRef] [Scilit]
- Dimos, C.; Pugh, G. The effectiveness of R&D subsidies: A meta-regression analysis of the evaluation literature. Res. Policy 2016, 45, 797–815. [Google Scholar] [CrossRef] [Scilit]
- Cuerva, M.C.; Triguero-Cano, Á.; Córcoles, D. Drivers of green and non-green innovation: Empirical evidence in low-tech SMEs. J. Clean. Prod. 2014, 68, 104–113. [Google Scholar] [CrossRef] [Scilit]
- Cui, R.; Xia, E.; Guo, X. Antecedent configurations toward radical green innovation: Based on resource orchestration theory. Technol. Forecast. Soc. Change 2025, 214, 124038. [Google Scholar] [CrossRef] [Scilit]
- Park, Y.; Chung, Y.; Son, H. Configurational paths for SMEs’ innovation: Focusing on information resources, absorptive capacity, and government support. Technol. Anal. Strateg. Manag. 2024, 36, 252–265. [Google Scholar] [CrossRef] [Scilit]
- Pavitt, K. Sectoral patterns of technical change: Towards a taxonomy and a theory. Res. Policy 1984, 13, 343–373. [Google Scholar] [CrossRef] [Scilit]
- Rennings, K. Redefining innovation—Eco-innovation research and the contribution from ecological economics. Ecol. Econ. 2000, 32, 319–332. [Google Scholar] [CrossRef] [Scilit]
- Jaffe, A.B.; Newell, R.G.; Stavins, R.N. A tale of two market failures: Technology and environmental policy. Ecol. Econ. 2005, 54, 164–174. [Google Scholar] [CrossRef] [Scilit]
- Horbach, J.; Rammer, C.; Rennings, K. Determinants of eco-innovations by type of environmental impact—The role of regulatory push/pull, technology push and market pull. Ecol. Econ. 2012, 78, 112–122. [Google Scholar] [CrossRef] [Scilit]
- Hart, S.L. A natural-resource-based view of the firm. Acad. Manag. Rev. 1995, 20, 986–1014. [Google Scholar] [CrossRef] [Scilit]
- D’Este, P.; Iammarino, S.; Savona, M.; von Tunzelmann, N. What hampers innovation? Revealed barriers versus deterring barriers. Res. Policy 2012, 41, 482–488. [Google Scholar] [CrossRef] [Scilit]
- Hall, B.H. The financing of research and development. Oxf. Rev. Econ. Policy 2002, 18, 35–51. [Google Scholar] [CrossRef] [Scilit]
- Canepa, A.; Stoneman, P. Financial constraints to innovation in the UK: Evidence from CIS2 and CIS3. Oxf. Econ. Pap. 2008, 60, 711–730. [Google Scholar] [CrossRef] [Scilit]
- Ghisetti, C.; Mancinelli, S.; Mazzanti, M.; Zoli, M. Financial barriers and environmental innovations: Evidence from EU manufacturing firms. Clim. Policy 2017, 17, S131–S147. [Google Scholar] [CrossRef] [Scilit]
- Hrovatin, N.; Cagno, E.; Dolšak, J.; Zorić, J. How important are perceived barriers and drivers versus other contextual factors for the adoption of energy efficiency measures: An empirical investigation in manufacturing SMEs. J. Clean. Prod. 2021, 323, 129123. [Google Scholar] [CrossRef] [Scilit]
- De Marchi, V. Environmental innovation and R&D cooperation: Empirical evidence from Spanish manufacturing firms. Res. Policy 2012, 41, 614–623. [Google Scholar] [CrossRef] [Scilit]
- Ghisetti, C.; Marzucchi, A.; Montresor, S. The open eco-innovation mode. An empirical investigation of eleven European countries. Res. Policy 2015, 44, 1080–1093. [Google Scholar] [CrossRef] [Scilit]
- Kesidou, E.; Demirel, P. On the drivers of eco-innovations: Empirical evidence from the UK. Res. Policy 2012, 41, 862–870. [Google Scholar] [CrossRef] [Scilit]
- Pellegrino, G.; Savona, M. No money, no honey? Financial versus knowledge and demand constraints on innovation. Res. Policy 2017, 46, 510–521. [Google Scholar] [CrossRef] [Scilit]
- Pfeffer, J.; Salancik, G.R. The External Control of Organizations: A Resource Dependence Perspective; Harper & Row: New York, NY, USA, 1978. [Google Scholar]
- Hillman, A.J.; Withers, M.C.; Collins, B.J. Resource dependence theory: A review. J. Manag. 2009, 35, 1404–1427. [Google Scholar] [CrossRef] [Scilit]
- Greco, M.; Germani, F.; Grimaldi, M.; Radicic, D. Policy mix or policy mess? Effects of cross-instrumental policy mix on eco-innovation in German firms. Technovation 2022, 117, 102194. [Google Scholar] [CrossRef] [Scilit]
- Schäfer, D.; Stephan, A.; Fuhrmeister, S. The impact of public procurement on financial barriers to general and green innovation. Small Bus. Econ. 2024, 62, 939–959. [Google Scholar] [CrossRef] [Scilit]
- Flanagan, K.; Uyarra, E.; Laranja, M. Reconceptualising the ‘policy mix’ for innovation. Res. Policy 2011, 40, 702–713. [Google Scholar] [CrossRef] [Scilit]
- Rogge, K.S.; Reichardt, K. Policy mixes for sustainability transitions: An extended concept and framework for analysis. Res. Policy 2016, 45, 1620–1635. [Google Scholar] [CrossRef] [Scilit]
- Costantini, V.; Crespi, F.; Palma, A. Characterizing the policy mix and its impact on eco-innovation: A patent analysis of energy-efficient technologies. Res. Policy 2017, 46, 799–819. [Google Scholar] [CrossRef] [Scilit]
- Santos, R.; Brás, G.R.; Preto, M.T. Exploring internal, market and institutional dynamics that drive eco-innovation: Evidence from Portuguese companies. Bus. Strategy Environ. 2025, 34, 10925–10941. [Google Scholar] [CrossRef] [Scilit]
- Tchórzewska, K.B.; del Río, P.; García-Quevedo, J.; Martínez-Ros, E. Carrot first, stick second? Environmental policy-mix sequencing and green technologies. Technol. Forecast. Soc. Change 2025, 210, 123835. [Google Scholar] [CrossRef] [Scilit]
- Veugelers, R. Which policy instruments to induce clean innovating? Res. Policy 2012, 41, 1770–1778. [Google Scholar] [CrossRef] [Scilit]
- Blind, K.; Petersen, S.S.; Riillo, C.A.F. The impact of standards and regulation on innovation in uncertain markets. Res. Policy 2017, 46, 249–264. [Google Scholar] [CrossRef] [Scilit]
- Stern, A.D. Innovation under regulatory uncertainty: Evidence from medical technology. J. Public Econ. 2017, 145, 181–200. [Google Scholar] [CrossRef] [Scilit] [PubMed]
- Fiss, P.C. A set-theoretic approach to organizational configurations. Acad. Manag. Rev. 2007, 32, 1180–1198. [Google Scholar] [CrossRef] [Scilit]
- Fiss, P.C. Building better causal theories: A fuzzy set approach to typologies in organization research. Acad. Manag. J. 2011, 54, 393–420. [Google Scholar] [CrossRef] [Scilit]
- Misangyi, V.F.; Greckhamer, T.; Furnari, S.; Fiss, P.C.; Crilly, D.; Aguilera, R.V. Embracing causal complexity: The emergence of a neo-configurational perspective. J. Manag. 2017, 43, 255–282. [Google Scholar] [CrossRef] [Scilit]
- Rhaiem, K.; Doloreux, D. A strategic perspective of eco-innovation drivers: Evidence from Canadian SMEs. J. Clean. Prod. 2022, 368, 133211. [Google Scholar] [CrossRef] [Scilit]
- Fernández-Muñiz, N.; Triguero, Á.; de la Cuesta-González, M. Breaking down barriers: The adoption of eco-innovation by SMEs and the influence of personality traits. Bus. Strategy Environ. 2024, 33, 6565–6585. [Google Scholar] [CrossRef] [Scilit]
- Castellacci, F. Technological paradigms, regimes and trajectories: Manufacturing and service industries in a new taxonomy of sectoral patterns of innovation. Res. Policy 2008, 37, 978–994. [Google Scholar] [CrossRef] [Scilit]
- Bogliacino, F.; Pianta, M. The Pavitt taxonomy, revisited: Patterns of innovation in manufacturing and services. Econ. Politica 2016, 33, 153–180. [Google Scholar] [CrossRef] [Scilit]
- Galliano, D.; Nadel, S. Firms’ eco-innovation intensity and sectoral system of innovation: The case of French industry. Ind. Innov. 2015, 22, 467–495. [Google Scholar] [CrossRef] [Scilit]
- García-Sánchez, A.; Rama, R. Eco-innovation in the food and beverage industry: Persistence and the influence of crises. Sustainability 2025, 17, 2971. [Google Scholar] [CrossRef] [Scilit]
- Cainelli, G.; De Marchi, V.; Grandinetti, R. Does the development of environmental innovation require different resources? Evidence from Spanish manufacturing firms. J. Clean. Prod. 2015, 94, 211–220. [Google Scholar] [CrossRef] [Scilit]
- del Río González, P. Analysing the factors influencing clean technology adoption: A study of the Spanish pulp and paper industry. Bus. Strategy Environ. 2005, 14, 20–37. [Google Scholar] [CrossRef] [Scilit]
- Triguero, A.; Moreno-Mondéjar, L.; Davia, M.A. Drivers of different types of eco-innovation in European SMEs. Ecol. Econ. 2013, 92, 25–33. [Google Scholar] [CrossRef] [Scilit]
- Ragin, C.C. Redesigning Social Inquiry: Fuzzy Sets and Beyond; University of Chicago Press: Chicago, IL, USA, 2008. [Google Scholar]
- Greckhamer, T.; Misangyi, V.F.; Fiss, P.C. The two QCAs: From a small-N to a large-N set theoretic approach. Res. Sociol. Organ. 2013, 38, 49–75. [Google Scholar] [CrossRef] [Scilit]
- Misangyi, V.F.; Acharya, A.G. Substitutes or complements? A configurational examination of corporate governance mechanisms. Acad. Manag. J. 2014, 57, 1681–1705. [Google Scholar] [CrossRef] [Scilit]
- Vis, B. The comparative advantages of fsQCA and regression analysis for moderately large-N analyses. Sociol. Methods Res. 2012, 41, 168–198. [Google Scholar] [CrossRef] [Scilit]
- Greckhamer, T.; Furnari, S.; Fiss, P.C.; Aguilera, R.V. Studying configurations with qualitative comparative analysis: Best practices in strategy and organization research. Strateg. Organ. 2018, 16, 482–495. [Google Scholar] [CrossRef] [Scilit]
- Cooper, B.; Glaesser, J. Exploring the robustness of set theoretic findings from a large n fsQCA: An illustration from the sociology of education. Int. J. Soc. Res. Methodol. 2016, 19, 445–459. [Google Scholar] [CrossRef] [Scilit]
- Rutten, R. Applying and assessing large-N QCA: Causality and robustness from a critical realist perspective. Sociol. Methods Res. 2022, 51, 1211–1243. [Google Scholar] [CrossRef] [Scilit]
- Oana, I.-E.; Schneider, C.Q. A robustness test protocol for applied QCA: Theory and R software application. Sociol. Methods Res. 2024, 53, 57–88. [Google Scholar] [CrossRef] [Scilit]
- Elgin, D.J.; Erickson, E.; Crews, M.; Kahwati, L.C.; Kane, H.L. Applying qualitative comparative analysis in large-N studies: A scoping review of good practices before, during, and after the analytic moment. Qual. Quant. 2024, 58, 4241–4256. [Google Scholar] [CrossRef] [Scilit]
- Cangialosi, N. Fuzzy-set qualitative comparative analysis (fsQCA) in organizational psychology: Theoretical overview, research guidelines, and a step-by-step tutorial using R software. Span. J. Psychol. 2023, 26, e21. [Google Scholar] [CrossRef] [Scilit] [PubMed]
- Schneider, C.Q.; Wagemann, C. Set-Theoretic Methods for the Social Sciences: A Guide to Qualitative Comparative Analysis; Cambridge University Press: Cambridge, UK, 2012. [Google Scholar] [CrossRef] [Scilit]
- Hölzl, W.; Janger, J. Distance to the frontier and the perception of innovation barriers across European countries. Res. Policy 2014, 43, 707–725. [Google Scholar] [CrossRef] [Scilit]
- Marzucchi, A.; Montresor, S. Forms of knowledge and eco-innovation modes: Evidence from Spanish manufacturing firms. Ecol. Econ. 2017, 131, 208–221. [Google Scholar] [CrossRef] [Scilit]
- Horbach, J.; Oltra, V.; Belin, J. Determinants and specificities of eco-innovations compared to other innovations—An econometric analysis for the French and German industry based on the Community Innovation Survey. Ind. Innov. 2013, 20, 523–543. [Google Scholar] [CrossRef] [Scilit]
- Park, S.; Lee, I.H.; Kim, J.E. Government support and small- and medium-sized enterprise (SME) performance: The moderating effects of diagnostic and support services. Asian Bus. Manag. 2020, 19, 213–238. [Google Scholar] [CrossRef] [Scilit]
- Hottenrott, H.; Peters, B. Innovative capability and financing constraints for innovation: More money, more innovation? Rev. Econ. Stat. 2012, 94, 1126–1142. [Google Scholar] [CrossRef] [Scilit]
- Kim, S. The impact of government innovation subsidies on the survival of SMEs in Korea. STI Policy Rev. 2018, 9, 55–76. [Google Scholar] [CrossRef]

Disclaimer/Publisher’s Note: The statements, opinions and data contained in all publications are solely those of the individual author(s) and contributor(s) and not of MDPI and/or the editor(s). MDPI and/or the editor(s) disclaim responsibility for any injury to people or property resulting from any ideas, methods, instructions or products referred to in the content. |
© 2026 by the author. Licensee MDPI, Basel, Switzerland. This article is an open access article distributed under the terms and conditions of the Creative Commons Attribution (CC BY) license.