


Abstract
Air connectivity can broaden access to international tourism markets, yet its association with tourism development may vary substantially with network maturity and existing accessibility. Using Brazil as a Global South destination, this study compares inbound tourism from OECD, BRICS+, and Central and South American markets from 2002–2022. An unbalanced country–year panel is combined with Principal Component Analysis to construct synthetic indicators of air connectivity and other structural dimensions, followed by panel-data estimation, specification testing, robust inference and endogeneity diagnostics. The results show a connectivity gradient across the regional models. The Air Connectivity Factor shows its strongest association with inbound tourism in Central and South America (β = 0.212; partial R2 = 56.8%), remains statistically significant for BRICS+ markets (β = 0.117; partial R2 = 17.0%), and is not retained in the preferred OECD specification. Digital readiness and visa exemption also display relevant associations in emerging-market models. These differences indicate that connectivity’s explanatory relevance depends on existing accessibility conditions, rather than following a uniform pattern across origin markets. The composite indicators measure accessibility and market conditions, not sustainability outcomes, so the sustainability implications are interpretive. From this perspective, the findings support selective rather than indiscriminate connectivity expansion. Policy assessment should consider whether improved accessibility diversifies tourism markets, strengthens South–South integration, and broadens participation in international tourism, while accounting for aviation’s environmental costs. The Brazilian case thus contributes to a broader Global South discussion that considers sustainable transport, tourism governance, and international cooperation together when evaluating future air-corridor priorities.
1. Introduction
1.1. Air Connectivity, Sustainable Tourism and International Integration
Access to mobility networks (i.e., connecting destinations to dispersed origin markets) is uneven worldwide, but it matters especially for destinations in the Global South, since international access shapes whether and how markets can diversify and engage more broadly in the global tourism economy. The spatial organisation of aviation thus extends beyond transport operations to include hub locations, route distribution, and the internal arrangement of international corridors, which shape whether markets can interact directly or use intermediary gateways [1,2,3,4]. International aviation traffic remains highly concentrated through known hubs and corridors, although many of the world’s emerging economies are less well-positioned within these networks [1,2,3,4]. This relationship creates a sustainability tension. Better accessibility may enlarge the range of feasible tourism exchanges, whereas additional aviation activity entails environmental costs and may reproduce spatially concentrated development patterns. The relevant policy question is therefore not simply whether more connectivity coincides with more tourism, but whether the importance of connectivity varies across markets and where accessibility improvements might address existing structural gaps. Previous studies link direct services, seat capacity, available seat kilometres, and flight frequency to inbound tourism flows [5,6,7,8,9]. Research on direct services, liberalisation and carrier entry likewise links aviation-market conditions with international mobility [10,11,12]. These findings justify analysing connectivity as a differentiated policy resource rather than assuming that its expansion has equivalent economic, spatial or environmental value across markets [13,14,15,16].
Brazil offers a relevant case for this comparison. Its developed network of domestic flights and sizeable tourism assets exist alongside a small number of origin countries that account for its inbound market. Emerging economies and BRICS+ partners, in particular, remain relatively underrepresented among international visitor arrivals. Brazil offers a relevant case for comparing markets that vary substantially in economic size and aviation development, yet all have access to the destination. The empirical question is whether the statistical relationship between air connectivity and inbound tourism varies among OECD, BRICS+ and C&SA origin markets, 2002–2022.
This comparison also connects to the larger Geographies of Global South mobility. South–South air links are comparatively less developed than most North–South routes, something Franciscone and Fernandes [17] link to persistent, non-coalesced development among emerging economies. Franciscone et al. [18] propose the Global South Air Transport Belt (GSATB) to reconceptualise such connectivity. For this paper, we use the GSATB only as an empirically grounded conceptual framing device for discussing findings; the data do not test or affirm the GSATB framework, and we do not assume corridor expansion is inherently beneficial. Instead, we explore an empirical question that predates corridor design: Is connectivity more explanatorily relevant in relatively underserved markets than in developed aviation markets? This distinction matters because sustainable corridor planning must disentangle accessibility expansions that alleviate structural deficiencies from capacity expansions, which may simply add traffic without bringing tourism or integration benefits.
1.2. Air Connectivity as a Transport Policy Challenge
International air networks develop through the interaction of commercial demand and institutional factors. Bilateral and multilateral air-service agreements, airport investments, regulatory frameworks, competition policies, and international cooperation shape market access, available routes, and hub growth [1,14,19,20]. As a result, economies of similar size can have markedly different levels of international accessibility [21].
These disparities are particularly relevant for newer markets where occasional long-haul connections are not intense; reliance on transfer airports, limited connectivity choices, and other system barriers can reduce travel willingness even with high demand [3]. Transportation policies have the potential to influence this by means of planning, liberalisation, harmonisation, and facilitation measures; our antecedents have linked transport inputs and aviation capacity to inbound tourism [22,23], while gravity-based analysis has operationalised these local systems as levels of combined road and air network infrastructure [24]; related measures have also summarised connectivity in Index form, such as the Domestic Airport Connectivity Index analysed by Liao and Zhang [25]. Our indicator uses similar dimensional-reduction logic, adapting a suitable indicator for the long-term, multi-market dimensions of the Brazilian experience.
1.3. Brazil, BRICS+ and the Changing Geography of Tourism Demand
Brazil has several features that make the contrast between its market size and its international accessibility analytically clear. The country boasts a large domestic market, substantial air-transport infrastructure, and a strategic location bridging North and South America and connecting to North America, Europe, Africa, and Asia. Its international air network is nonetheless anchored in a small number of gateways and traditional corridors, with a relatively more developed set of connections with North America and Europe, while options for direct services between Brazil and a range of Asian, African and Middle Eastern markets are fewer, in terms of both frequency and variety of connectivity [2,3,26].
This network pattern coincides with a changing geography of global demand. Passenger growth and tourism activity increasingly involve markets beyond the traditional North Atlantic system, alongside income growth and expanding middle classes in Asia, the Middle East, Africa and Latin America [14,27,28]. International network structures have not necessarily evolved at the same rate, and travel between emerging economies still often depends on established intermediary hubs [1,3,20]. In Brazil, this mismatch motivates an examination of market diversification, international accessibility, and Brazil’s possible role within wider South–South mobility networks.
1.4. Regulatory and Institutional Barriers to International Connectivity
International aviation operates within an institutional structure in which market access and network formation are partly governed by bilateral and multilateral agreements, traffic rights, allocation mechanisms and regulatory arrangements [1,14,20]. Slot constraints, competition rules, airline alliances, and airport capacity further shape carrier network decisions and how national markets connect with international systems [3,13].
Long-haul services between geographically distant and initially thin markets are especially sensitive to these conditions. Restrictive traffic rights, limited demand density and bilateral constraints may weaken route viability and increase reliance on intermediary hubs, thereby increasing generalised travel costs [21]. For emerging economies, diversification of international links may therefore depend on combinations of aviation agreements, market liberalisation, airport development, competition arrangements and travel facilitation rather than on infrastructure expansion alone [16,29].
Against this background, the empirical design treats connectivity as an observed characteristic of the transport-accessibility environment rather than as an exclusively demand-generated outcome. Policy, infrastructure, regulation, airline strategy, and market demand may all shape its evolution [1,14,20]. Brazil’s combination of substantial aviation capacity and a concentrated inbound-tourism portfolio therefore offers a useful case for testing whether the statistical relevance of connectivity differs across origin markets occupying different positions within the international aviation system.
1.5. Analytical Approach and Contribution of the Study
The study’s main contribution is identifying a connectivity gradient: the explanatory importance of air connectivity for inbound tourism varies systematically across markets with different levels of aviation maturity and existing accessibility. Rather than assuming connectivity is a universally equivalent input for tourism policy, the study investigates whether its incremental explanatory value is higher where international accessibility is more limited and lower where aviation networks are already well developed. This cross-market gradient provides a generalizable analytical proposition for testing in other Global South destinations: assess the relevance of additional connectivity based on the accessibility context, rather than relying solely on connectivity growth.
Three related contributions support this central proposition. First, the study constructs a PCA-based Air Connectivity Factor from departures, passenger traffic and air freight, providing a longitudinal operational indicator for comparing heterogeneous origin markets. Second, it links the connectivity gradient to sustainable transport and tourism policy by distinguishing accessibility gains from the quantitative expansion of aviation activity: markets where connectivity explains more may warrant closer assessment of accessibility constraints, whereas mature markets may place greater emphasis on efficiency, resilience, and environmental performance. Third, it provides an empirical bridge between tourism policy and the emerging debate on South–South corridors. The GSATB is not tested here; the analysis instead provides a screening framework to inform decisions about whether, where, and under what complementary institutional, environmental, and commercial conditions additional Global South connectivity should be assessed [17].
1.6. Research Propositions
Three propositions guide the analysis. They draw on earlier work on air-service availability and tourism demand, which suggests that the tourism response to additional air services weakens once service levels are already high [11,15,20].
P1. Air connectivity is positively associated with inbound tourism to Brazil after controlling for the economic, technological, institutional and geographical characteristics of origin markets.
P2. This association is weaker in mature aviation markets (OECD) than in markets with limited direct access to Brazil (BRICS+) or where air travel is a primary means of regional mobility (Central and South America).
P3. Visa exemption and technological conditions are associated with inbound tourism alongside air connectivity, particularly in emerging markets.
P2 describes what this study calls the connectivity gradient. Because the preferred model for each group was selected separately, the evidence on P2 from those models is partly exploratory. A common specification estimated in the same way for all groups (Table A10) is therefore used to check whether the gradient holds when the models are directly comparable.
2. Methodology
2.1. Research Design and Data Sources
The empirical design considers Brazil as the universal destination and origin country–year as the observational unit. This approach enables the analysis of the relationship between inbound tourism and international air transport connectivity between origin markets with different degrees of economic development, air transport experience, and accessibility. Brazil is well suited to this analysis, given its balanced, large internal aviation system and airport infrastructure, as well as its sharply varying international links across regions of the world.
The study uses a country–year panel covering 2002–2022 to examine the association between air connectivity and inbound tourism to Brazil. This period includes the COVID-19 shock and the initial recovery through 2022.
The analysis considers origin markets in three analytically distinct groups: OECD countries, BRICS+ countries, and Central and South American countries. A fourth, integrated specification combines the available origin markets and assesses whether the regional patterns remain visible within a heterogeneous global sample.
Table A9 lists the origins represented in each group. The OECD group includes 37 countries; the BRICS+ group includes eight countries (China, Egypt, India, Indonesia, Iran, Russia, Saudi Arabia, and South Africa); and the Central and South American group includes 18 origins other than Brazil. Chile, Colombia and Costa Rica enter both the OECD and Central/South American regressions, so regional counts are not additive. The integrated dataset contains 60 distinct origins over 21 years, implying a maximum of 1260 country–year observations. The panel contains 1048 observations because origin coverage varies over time and records with missing or non-positive tourist arrivals were excluded. Table A2 reports the samples actually used in each regression. The Central/South American regression includes 17 origins, excluding French Guiana because the required life-expectancy and export controls are unavailable for its 21 observations. Missing export data also exclude 17 observations for Guyana, 16 for Suriname and eight for Venezuela. The regional regressions therefore sum to 62 origin memberships and 1049 observations, including 63 country–year observations counted twice across the OECD and Central/South American samples. The integrated model retains the 62 observations excluded from the regional regression, yielding 1049 − 63 + 62 = 1048 observations.
The resulting database is an unbalanced country–year panel assembled from publicly available secondary sources. The dependent variable is the annual number of international tourist arrivals in Brazil by country of residence. The data were obtained from the World Tourism Organization (UNWTO, now UN Tourism), Yearbook of Tourism Statistics dataset, Brazil Table 112, “Arrivals of non-resident tourists at national borders, by country of residence”, using observations for 2002–2022 [30]. The variable enters the models in natural logarithms. Socioeconomic, labour-market, technology, health and trade variables come from the World Bank’s World Development Indicators (WDI) [31] and were downloaded for all origin countries for 2002–2022. Table A1 lists each variable with its WDI code and unit. For example, GDP per capita is measured in current US dollars (NY.GDP.PCAP.CD), and GNI per capita is measured in current US dollars using the Atlas method (NY.GNP.PCAP.CD). WDI data were downloaded on 29 August 2025. The aviation variables come from the Air Transport Statistical Database (Dados Estatísticos do Transporte Aéreo) of the Brazilian National Civil Aviation Agency (ANAC) [32]. This database reports monthly flight-stage records by airline and by origin and destination airport. Records of scheduled international flights from airports in each origin country to airports in Brazil were summed to annual country totals for three fields: departures (number of flights), paid passengers (number of passengers) and paid cargo (kg). The remaining variables are: (i) VisaExempt, a dummy equal to 1 when nationals of the origin country could enter Brazil as tourists without a visa in that year, based on the visa-regime table of the Brazilian Ministry of Foreign Affairs [33]; (ii) UnescoSites, the number of UNESCO World Heritage sites in the origin country [34]; (iii) Capital_Distance, the great-circle distance in kilometres between the capital of the origin country and Brasília, from the CEPII GeoDist database [35]; (iv) LanguageDistance_PT, an index of the distance between the main official language of the origin country and Portuguese, ranging from 0 (same language) to 4, based on the language classification of Fearon [36]; and (v) security, measured by the overall Global Peace Index score [37], available from 2008, and the intentional homicide rate from the WDI. Variables were retained when their average data completeness exceeded 80%.
2.2. Variable Construction and Air Connectivity Measurement
Candidate explanatory variables were organised into seven conceptual blocks: air connectivity; socioeconomic conditions; trade and finance; health and education; technology; labour-market conditions; and institutional, cultural and accessibility characteristics, including geographical distance, security and travel facilitation. Candidate variables were organised into the following blocks: air connectivity (departures, paid passengers and paid cargo); socioeconomic conditions (GDP per capita, GNI per capita, population, population growth and labour force); trade and finance (exports as a share of GDP, foreign direct investment inflows in current US dollars, outflows in current US dollars and as a share of GDP, and the exchange rate); health and education (health expenditure, life expectancy, infant mortality and education expenditure); technology (internet users and mobile-cellular subscriptions); labour-market conditions (unemployment rate and GDP growth); and institutional, cultural and accessibility characteristics (distance between capitals, linguistic distance from Portuguese, linguistic diversity, visa exemption, UNESCO sites, Global Peace Index and homicide rate). Table A1 reports the block, definition, unit, source and coverage of each variable. Principal components were constructed for the origin-country connectivity, socioeconomic, trade and finance, health, technology, labour-market and institutional blocks. For Brazil, components were constructed for the socioeconomic, trade and finance, health and education, and institutional blocks; education expenditure was included only in the destination block. Additional components combined destination socioeconomic and health variables and represented distance-related characteristics. UNESCO sites and the homicide rate were not included in the PCA inputs, and visa exemption was retained as a separate covariate. The final models included selected components alongside individual covariates where retained, including health expenditure, life expectancy, exports as a share of GDP and visa exemption.
Longitudinal measurement of international connectivity is constrained by the uneven historical availability of detailed route- and network-level indicators. Measures based on centrality, route density, or direct-connectivity structures can provide richer descriptions of network topology, but comparable historical coverage across a large, heterogeneous set of origin markets is not always available. The present study therefore uses operational aviation measures to construct a longitudinal proxy for the intensity of international air-transport supply represented in the dataset.
Because several variables within the conceptual blocks are strongly correlated, Principal Component Analysis (PCA) was applied separately to each block after z-score standardisation [38]. Missing values in the variables entering the PCA were handled through hierarchical median imputation, first at the Region × Year level, then at the regional level, and finally at the global level when observations remained unavailable. Indicators with structurally shorter temporal coverage were not extrapolated beyond their observed period. In particular, the Global Peace Index (GPI), available from 2008 onward, was incorporated only into the post-2008 institutional component, while the pre-2008 component was estimated without the GPI. PCA was estimated on the pooled sample of origin-country observations before regional models were fitted, providing a common component scale across groups. Missingness in the non-aviation variables examined in the sensitivity analysis ranged from 2.0% to 5.9%, excluding the fully observed geographical and linguistic distance variables. Missing PCA inputs were treated using hierarchical median imputation, while aviation zeros and missing values were replaced with 1 during panel construction. Median imputation can reduce variability and alter correlations, potentially affecting component scores and regression estimates. Sensitivity was assessed using complete-case analysis and multiple imputation by chained equations with predictive mean matching (20 imputed datasets). The pooled connectivity transformation was held fixed across treatments, while the other required PCA components and panel models were re-estimated. Multiple-imputation estimates were combined using Rubin’s rules [39]. Table A11 compares the connectivity coefficients across these approaches.
The ANAC aviation variables were treated separately during panel construction. In the baseline specification, recorded zeros and missing aviation values after data integration were replaced with 1 before PCA estimation. This value was adopted as a small positive baseline constant, rather than as an observed measure of bilateral activity.
Sensitivity to the replacement constant was assessed by reconstructing the indicator and re-estimating the models under the alternative treatments. To assess whether the baseline treatment influenced the connectivity estimates, the connectivity component was reconstructed using two alternative replacement values, 0 and 0.5, instead of 1. The preferred regional and full-sample models were then re-estimated while holding the remaining model structure unchanged. The estimated connectivity coefficients remained stable in sign and statistical significance across the alternative treatments. Coefficient magnitudes changed little, and the cross-market pattern observed in the baseline specification was preserved.
The first principal component (PC1) from each block was retained as the synthetic indicator used in subsequent modelling. Retention was based on the proportion of variance explained by PC1, along with the substantive interpretability of the corresponding loadings. The factor scores were shifted to positive values where required and subsequently log-transformed for use in the panel specifications.
The focal measure, ConnectivityComp_Origin, combines international departures, revenue passenger traffic and air-freight activity. The underlying ANAC variables refer specifically to direct bilateral international air activity between each origin country and Brazil, rather than to the origin country’s total international aviation activity. They comprise scheduled international departures, paid passengers and paid cargo recorded on direct services from the respective origin country to Brazil. Accordingly, the factor captures the operational intensity of direct bilateral air services with Brazil and excludes indirect itineraries through intermediary countries or hubs. Departures represent service frequency and operational availability, passenger traffic captures the scale of passenger movement, and air freight provides an additional measure of operational aviation intensity. Cargo and passenger operations may also share aircraft capacity through belly-freight services, so freight activity can inform the broader operational depth of international air services. PCA combines these correlated measures into a single factor while avoiding their simultaneous introduction as highly collinear regressors. The resulting indicator should therefore be interpreted as a proxy for operational connectivity, not as a measure of airline-network topology, centrality, or direct-route structure.
Connectivity and tourism may grow hand in hand. While infrastructure, regulation, bilateral agreements, airline network strategy, and market-access conditions shape aviation supply, tourism demand may, in turn, make some (additional) services economically viable and later drive expansion. Tourism studies have captured this feedback loop before. Culiuc [40], for example, finds, based on bilateral tourism flows, that direct air services and tourism demand may have positive feedback, whereby tourism may even drive direct service provision in the first place. Therefore, ConnectivityComp_Origin enters ex ante as a proxy for the accessibility environment, and we interpret its estimated coefficient as a conditional correlation rather than a de facto causal effect on supply.
The models also include derived controls. Total GDP reflects the overall economic scale. Year-specific indicators for 2020–2022 capture pandemic disruption and recovery, along with the additional post-2020 and decay specifications listed in the database. The decay term, defined as 1/(Year − 2020 + 1), represents the decreasing intensity of the pandemic-related disturbance during the observed recovery years. The dependent variable is the natural logarithm of arrivals. Coefficients on logged regressors are therefore elasticities, and coefficients on dummy variables are read as approximate percentage differences of 100 × (exp(β) − 1). The PCA scores were shifted to positive values before taking logs, so the connectivity coefficient gives the percentage change in arrivals associated with a 1% change in the shifted score. Because the shift constant is arbitrary, you cannot convert the coefficient into a number of flights or passengers. However, you can compare it across groups because the same transformation is applied in every model.
2.3. Econometric Strategy
Four panel specifications were estimated to compare the connectivity–tourism relationship across market contexts: BRICS+ origin countries, OECD origin countries, Central and South American origin countries, and an integrated specification combining the available country groups.
For each specification, pooled ordinary least squares, fixed effects (FEs) and random effects (REs) were considered. Random-effects estimation used the Swamy–Arora procedure [41]. The preferred estimator was selected through the conventional sequence of panel specification tests described by Baltagi [42]: an F-test comparing fixed effects with pooled estimation, the Breusch–Pagan Lagrange Multiplier test comparing random effects with pooling [43], and the Hausman test comparing fixed and random effects [44].
The selection rule therefore follows each subsample’s statistical structure rather than imposing a common estimator across regions. Fixed effects are used where the specification tests indicate that time-invariant country heterogeneity should be controlled through unit effects; random effects are retained where their assumptions are not rejected and where they permit more efficient estimation. The resulting models provide comparable evidence on how the conditional association between connectivity and inbound tourism differs across market groups while accommodating the distinct panel structures of those groups.
PCA-based indicators were constructed to reduce multicollinearity among correlated explanatory variables within the conceptual blocks. Within each group, the resulting components and remaining controls were introduced into the panel regressions in descending order of the absolute magnitude of their Pearson correlations with tourist arrivals in Brazil. When strong correlations remained between candidate regressors, priority was given to the regressor more strongly correlated with the dependent variable. Regressors were retained in the final specifications based on statistical significance at the 5% level (p < 0.05), rather than information criteria, while pandemic controls were maintained. ConnectivityComp_Origin was excluded from the final OECD model because it was not statistically significant conditional on the other controls, rather than on theoretical grounds. Differences in the final control sets therefore partly reflect the variable-selection procedure. Non-retention of connectivity does not establish the absence of an association, and differences in statistical significance across models do not establish statistically significant differences between group coefficients. To assess the cross-group pattern under comparable modelling choices, a common specification was estimated for the three regional samples and the integrated sample, using the same regressors (the five components, visa exemption and pandemic indicators), the same random-effects estimator and Driscoll–Kraay standard errors. Table A10 reports the connectivity coefficients and partial R2 values obtained under this common specification.
2.4. Model Diagnostics and Robustness
Diagnostic assessment was undertaken for each preferred panel specification. Heteroskedasticity was examined with the Breusch–Pagan test [45], serial correlation with the Wooldridge procedure [46], and cross-sectional dependence with the Pesaran CD test [47]. Variance Inflation Factors were additionally examined for multicollinearity, with values above 10 treated as indicating potentially problematic collinearity.
Inference was adjusted according to the diagnostic profile of each model. Driscoll–Kraay standard errors were used where heteroskedasticity, serial correlation and cross-sectional dependence jointly required robust correction [48]. Random-effects models displaying heteroskedasticity across country units used country-clustered White-type robust standard errors [49,50]. Where temporal heterogeneity was relevant, time effects were included together with cluster-robust inference. These choices followed the diagnostics in Table A4. The OECD model showed heteroskedasticity, serial correlation and strong cross-sectional dependence (Pesaran CD z = 19.07), so Driscoll–Kraay errors [51] were used; they are robust to all three problems and suit panels with a long time dimension. In the BRICS+ model, cross-sectional dependence was not significant at the 5% level (z = 1.75; p = 0.080), and country-clustered errors were used. Two limitations follow. First, clustered errors do not correct for the cross-sectional dependence found in the Central and South American and integrated models. Second, with only eight clusters in the BRICS+ model, clustered errors can understate the true standard errors [52]. To check that differences in significance across groups are not caused by the error structure, all models were re-estimated with Driscoll–Kraay errors (Table A10).
Table A10 preserves the regional ordering of both connectivity coefficients (0.036, 0.071 and 0.101) and partial R2 values (1.50%, 2.32% and 3.85%) across the OECD, BRICS+ and Central/South America, respectively. Connectivity is positive and statistically significant in all three samples, supporting the gradient as a descriptive pattern.
Partial R2 was calculated for ConnectivityComp_Origin in order to quantify its incremental explanatory contribution conditional on the other regressors included in each specification. The statistic is used here as an explanatory-effect-size measure and not as evidence of causal attribution. It was computed from nested models as partial R2 = (R2full − R2restricted)/(1 − R2restricted), where the restricted model drops ConnectivityComp_Origin and keeps all other regressors, with the estimator and the transformations unchanged. For a single regressor, this equals the squared partial correlation, t2/(t2 + df), where t is the t-statistic of the connectivity coefficient, and df is the residual degrees of freedom, providing a simple check.
A supplementary endogeneity diagnostic was implemented for the BRICS+ and Central and South American specifications, in which the connectivity factor is retained. The one-period lag of ConnectivityComp_Origin was used as an instrument in a Durbin–Wu–Hausman procedure. The exogeneity null was not rejected in either model. These results provide no statistical evidence of endogeneity under the adopted test and instrument, but the test has clear limits. Connectivity is highly persistent, which explains the very large first-stage F-statistics (623.0 and 4487.9; Table A7). A lagged regressor is a valid instrument only if it is uncorrelated with the current error term. When unobserved shocks to tourism demand persist over time, the lag is likely correlated with the error, so the instrument may be invalid and the test may fail to detect endogeneity [53,54]. The test is therefore treated as weak evidence, and the coefficients are read as conditional associations, not causal effects. Stronger identification would require an external source of variation in aviation supply that does not depend on travel to Brazil, as discussed in the limitations. The specification tests therefore support retaining the panel estimators as the principal models [42].
A further sensitivity analysis examined whether treating zero values in the ANAC bilateral aviation series materially affected the principal findings. ConnectivityComp_Origin was reconstructed using alternative treatments of observations with no recorded direct bilateral activity, and the preferred regional models were re-estimated using the resulting factor scores. Robustness was assessed in terms of coefficient direction, statistical relevance and, most importantly, preservation of the relative connectivity gradient across OECD, BRICS+ and Central and South American markets.
Across these alternative specifications, the qualitative ordering of the regional connectivity results remained unchanged, indicating that the connectivity gradient is not driven by the baseline zero-value treatment.
Data preparation, PCA construction, panel estimation, diagnostic testing and result export were implemented in R [55] within a common analytical workflow. The same processing sequence was applied across model groups to support consistency and traceability of the analysis.
Figure 1 summarises the analytical sequence used to connect the Brazilian empirical case to broader questions of tourism accessibility, sustainable transport policy, and South–South integration.
Figure 1.
Analytical framework of the study.
3. Results and Discussion
3.1. Descriptive Evidence
Brazil shows a marked contrast between the scale of domestic aviation and the international diversification of its tourism market. The country has extensive airport infrastructure and a large domestic air-transport system, while international visitor flows remain comparatively concentrated [56]. Established services to North America and Europe coexist with more limited direct access from several markets in Asia, Africa and the Middle East, where itineraries may depend on intermediary hubs.
The descriptive comparison therefore distinguishes OECD, BRICS+ and Central and South American origin countries. These groups differ substantially in economic structure, geographical proximity, network maturity, and institutional accessibility, creating heterogeneous market contexts for the subsequent panel analysis. Collectively, they represent more than five billion inhabitants and include both established and expanding sources of international travel demand [31].
Table 1 summarises the observed variables before their transformation into synthetic components. The distributions show wide cross-country variation in aviation activity, economic scale, demographics, digital development, labour-market conditions and institutional accessibility. This heterogeneity matters analytically because no single observed indicator can adequately capture the multidimensional differences among the origin markets. The aviation variables have 1048 observations and no missing values because the ANAC records cover every country–year in the panel: a year without direct flights is recorded as zero activity, not as a missing value. The other variables come mainly from the WDI, where some country–years are not reported, so their counts fall between 986 and 1027.
Table 1.
Descriptive statistics of the main variables by thematic block (Brazil, 2002–2022).
PCA is consequently used to condense correlated variables into a smaller set of components entering the econometric models. The purpose is dimensionality reduction and improved interpretability, not to create direct measures of sustainability. Sustainability implications are introduced subsequently when the empirical associations are interpreted in relation to accessibility, diversification and the environmental implications of additional aviation activity.
From 2002 to 2022, the dataset records approximately 103.5 million international arrivals to Brazil. OECD markets account for 53.6% of the total, Central and South America for 43.4%, BRICS+ countries for 1.8%, and the remaining markets for 1.1%. Figure 2 therefore documents a highly uneven distribution across the analytical groups, with the overwhelming majority of observed arrivals originating in established OECD and neighbouring Latin American markets.
Figure 2.
Distribution of international tourist arrivals in Brazil by country group (2002–2022). Source: Own elaboration based on UNWTO [30] data. Note: Percentages may not sum to 100% due to rounding.
The relatively small BRICS+ share is notable given the group’s demographic and economic heft. The share alone cannot prove that connectivity drives the divergence, but it highlights a possible diversification shortcoming that warrants further scrutiny. Going forward, diversification matters for sustainable tourism because a market’s underlying structure shapes its vulnerability to spatially localised shocks and the extent of visitor diversity in international tourism. The econometrics team will then examine whether the divergence asymmetry is predictably associated with differences in underlying air connectivity.
The COVID-19 period offers an additional test of persistence. Since international mobility was disrupted during 2020–2022, the empirical framework distinguishes between pandemic-year effects and recovery dynamics, rather than treating the entire sample as structurally homogeneous.
Figure 2 should therefore be viewed descriptively: economic and demographic scale by themselves do not reflect the actual distribution of visitors. Variations in geographical proximity, institutions, historical ties, and air accessibility may all influence the pattern. The concentration of Brazil’s long-haul international flights at a small number of gateway airports further contextualises the country’s international accessibility, but does not suggest that airport concentration alone explains the observed tourism distribution.
Figure 3 compares 2019, the last complete pre-pandemic year, to 2022. International tourism plunged during the disruption, but OECD and Central and South American markets remained the two dominant origins in the composition we observe.
Figure 3.
Distribution of international tourist arrivals in Brazil by country group–2019 and 2022. Source: Own elaboration based on UNWTO (2022) data.
Figure 4 places this comparison within the longer 2002–2022 trend, showing that OECD and Central and South American origin markets already dominated arrivals before the pandemic.
Figure 4.
Comparison of tourist arrivals to Brazil by country group (2002–2022). Source: Elaborated from UNWTO (2022) data.
Across the full period, OECD countries remain the largest source group and Central and South America the second. BRICS+ arrivals increase at times but remain a small share of the total. The descriptive series therefore suggest that the changing weight of emerging economies in the global economy has not been matched by an equivalent restructuring of Brazil’s inbound-tourism portfolio.
This difference should not be read as evidence that rising income is irrelevant to tourism demand. Rather, it indicates that economic scale and income growth alone cannot reproduce the observed cross-market distribution of arrivals. Accessibility, institutional conditions, geographical proximity, and established tourism relationships offer plausible additional dimensions for joint evaluation.
Figures S1–S3 in the Supplementary Materials add country-level detail to this aggregate picture. OECD origin markets display comparatively established tourism flows across much of the sample, while Central and South American countries maintain a substantial regional presence. BRICS+ markets remain smaller in aggregate and display pronounced disruption around the pandemic years. These figures reinforce heterogeneous origin-market trajectories but do not provide causal evidence.
Taken together, the descriptive evidence points to persistent concentration and limited diversification in Brazil’s inbound-tourism portfolio. The next stage of analysis therefore shifts from visual and aggregate comparison to multivariate estimation. The panel models test whether the connectivity indicator remains explanatory after accounting for socioeconomic, technological, institutional, and geographical characteristics, and whether that relevance differs among OECD, BRICS+, and Central and South American markets.
3.2. Principal Component Analysis
Table 2 reports the variance represented by the first principal component retained from each thematic block. PC1 accounts for 56.2% of the variance in SocioComp_Origin and more than 80% in TechComp_Origin, LaborComp_Origin, ConnectivityComp_Origin and DistanceComp. The comparatively lower percentage for the socioeconomic block should be recognised when interpreting that component, while the remaining blocks display a stronger concentration of variance in PC1.
Table 2.
Percentage of Variance Explained by the First Component.
Table 3 provides the eigenvector weights and therefore the substantive basis for naming the components. This interpretation does not treat the components as directly observed constructs; instead, it identifies the combinations of original variables that dominate each synthetic score. The table reports the absolute PC1 coefficients (eigenvector weights) for each min–max-normalised and mean-centred input variable, with their signs shown separately. These are neither squared coefficients nor percentages; within each block, their squares sum to one, subject to rounding.
Table 3.
PC1 coefficients (eigenvector weights) of the variables in the first principal components used in the econometric models. Only variables and components included in the final regressions are presented.
SocioComp_Origin appears to be mostly correlated with GDP per capita and GNI per capita (both in current US$). Consequently, SocioComp_Origin can be thought of as an index of the origin market’s socioeconomic capacity; although PC1 explains 56.2% of the variation in this block, SocioComp_Origin should be regarded as a parsimonious indicator of socioeconomic conditions.
TechComp_Origin accounts for 82.9% of the variance within its block and is primarily loaded by internet use and mobile subscriptions. As such, it reflects digital preparedness and describes the technological domain in which residents seek information, communicate, make online transactions, and book their journeys.
LaborComp_Origin accounts for 86.5% of the block’s variance, with the unemployment variable carrying a dominant loading while growth loads very lightly. Hence, this element should be understood as a measure of labour-market conditions rather than a broad indicator of macroeconomic performance.
ConnectivityComp_Origin explains 89.2% of the variance in its block. The loadings are largest for departures and revenue passenger traffic, with air cargo offering another operational dimension. Thus, the component can be seen as an index of aviation connectivity intensity present in the dataset, not directly capturing route topology, centrality or hub structure. Empirically, it serves as a parsimonious operational proxy for the accessibility dimension incorporated into the subsequent panel models.
DistanceComp accounts for 83.4% of the corresponding block and fuses together geographic and linguistic distance. Since both original measures indicate distance from Brazil, this factor isolates the geographic and cultural closeness that influence international migrants’ ease of mobility and travel.
The retained components thus reduce the database’s dimensionality while preserving interpretable distinctions among socioeconomic capacity, digital readiness, labour-market conditions, operational air connectivity, and geographical/cultural proximity. In the regression analysis, coefficients on these components are interpreted as conditional associations with variation in the underlying synthetic dimensions, not as the causal effects of individual original variables.
3.3. Heterogeneity in the Connectivity–Tourism Relationship
Table 4 reports the preferred panel specifications for OECD, BRICS+, Central and South American and integrated origin-market samples. The comparison tests whether air connectivity’s statistical significance is similar across markets or varies with network maturity and accessibility.
Table 4.
Preferred panel data models by origin-market group: OECD, BRICS+, Central and South America and integrated (global) specification. Dependent variable: ln(international tourist arrivals in Brazil).
The distinction between market groups is central to the interpretation. OECD countries generally represent comparatively mature aviation environments, whereas many BRICS+ and Latin American origin markets exhibit different combinations of geographical distance, route density, institutional accessibility and network development. The analysis therefore tests for heterogeneity rather than assuming a universal connectivity coefficient.
ConnectivityComp_Origin is evaluated together with the other structural components and controls selected for each model. Table 4 reports the estimated coefficients, while Table A6 reports partial R2 for the connectivity factor. The two measures answer different questions: the coefficient describes the direction and magnitude of the conditional association, whereas partial R2 indicates the incremental explanatory contribution of connectivity within each selected specification.
The regional specifications display adjusted R2 values of 0.819 for OECD, 0.811 for BRICS+ and 0.813 for Central and South America; the integrated model has an adjusted R2 of 0.546. The integrated specification’s lower fit reflects the greater heterogeneity introduced by combining markets that differ substantially in geography, institutions, socioeconomic characteristics, and aviation structures.
The preferred models show a cross-market gradient. ConnectivityComp_Origin is not retained in the preferred OECD model, is positive and statistically significant in the BRICS+ model and displays its largest regional coefficient and partial R2 in Central and South America. This pattern supports the interpretation that connectivity’s explanatory relevance depends on context and is stronger in the two emerging-market specifications than in the mature OECD specification. Because the preferred models were selected separately for each group, this pattern is checked against the common specification in Table A10. Table A10 retains this ordering under common modelling assumptions, while also identifying a positive and significant association for the OECD. The results are therefore consistent with the proposed gradient, but do not establish statistically significant differences between groups.
The supplementary Durbin–Wu–Hausman tests do not reject exogeneity of ConnectivityComp_Origin in the BRICS+ or Central and South American models (Table A7). This finding supports retaining the selected panel specifications but does not establish causal effects. The results below are therefore discussed as conditional associations.
3.4. Central and South American Markets
Central and South America shows the strongest link between connectivity and tourism among the regional specifications. ConnectivityComp_Origin has a coefficient of β = 0.212 (p < 0.001), with a partial R2 of 56.8%. When accounting for the other regressors, connectivity explains considerably more variation in this regional sample than in the BRICS+ or OECD specifications.
This coefficient should be interpreted in light of the PCA factor’s composition. Departures and revenue passenger traffic have the highest connectivity loadings, so the result mainly reflects differences in operational service intensity rather than network structure. This view aligns with research linking service availability, flight frequency, and aviation accessibility to tourism flows [1,3,7,8,11,13,15]. The regional context also matters: long distances and few alternatives for medium- and long-distance surface transport make aviation especially important for international mobility within Latin America [22,24].
VisaExempt is also positive and statistically significant (β = 1.635; p < 0.001), showing that institutional accessibility is associated with higher inbound flows within the selected specification. The Covid_Decay coefficient is negative (β = −1.386; p < 0.001), consistent with pandemic-related disruption persisting during the observed recovery period. Because the dependent variable is in logs, this implies arrivals about four times higher from visa-exempt countries in this group (exp(1.635) − 1 ≈ 4.1), other factors held constant. The large size may reflect overlap among visa exemption, regional agreements, and proximity in this group, so it should not be read as the effect of visa policy alone.
Life expectancy and exports as a share of GDP are also retained, indicating that the regional tourism pattern cannot be reduced to aviation variables alone. Nevertheless, the partial R2 result identifies connectivity as the dimension with the largest incremental explanatory contribution in this regional model. The coefficient on life expectancy (β = 2.843) is an elasticity: a 1% difference in life expectancy, about 0.8 years at the sample mean, is associated with about 2.8% more arrivals. Life expectancy varies within a narrow range (standard deviation 5.2 years), so a large elasticity is expected, and the variable most likely acts as a broad proxy for development level rather than a direct driver of travel.
Another implication for sustainable tourism policy is that this result seems to vindicate assessing regional accessibility as part of a broader integration intervention, rather than treating additional traffic as the ultimate objective. Route networks, service levels, airport coordination, and travel facilitation may be especially relevant in this market segment, but corridor policies should also consider emissions, operational efficiency, the territorial pattern of tourist profitability, and resilience. The empirical result only indicates where connectivity seems to matter; it does not, on its own, prove that increasing regional airport capacity will enhance sustainability.
3.5. BRICS+ Markets: Air Connectivity, Digitalisation and Institutional Accessibility
In the BRICS+ specification, ConnectivityComp_Origin has a positive, statistically significant effect (β = 0.117; p < 0.001), with a partial R2 near 17.0%. Its explanatory contribution is lower than in Central and South America but still clearly differs from the OECD result, where the preferred model excludes connectivity.
Similarly, the model with the BRICS+ (and interactions) finds a statistically significant association for TechComp_Origin (β = 0.163; p = 0.014). Because this component is largely determined by internet use and mobile subscriptions, it suggests that digital context adds explanatory power to the access context. The access context is still determined by departures and number of passengers [1,3,13].
The two dimensions are not meant to be read as independent, causal mechanisms. Instead, the model indicates that origin markets with varying degrees of digital and aviation connectivity show similar differences in tourism flow volume once the selected controls are introduced. These channels—information access, travel planning, digital transactions, and physical access—plausibly explain this complementarity.
Other positive and statistically significant BRICS+ dimensions are VisaExempt (β = 0.606; p < 0.001). The BRICS+ indicator combines three dimensions, aviation connectivity, digital readiness, and institutional accessibility, all relevant to the observed tourism pattern. This matters for policy because aviation supply alone does not capture the full accessibility environment.
From a sustainable-tourism perspective, the BRICS+ evidence consequently supports an integrated policy lens. New air services should be evaluated alongside visa arrangements, digital access, and tourism governance, not solely by projected passenger growth. The strategic relevance of a South–South connection depends on whether it reduces an existing accessibility gap, diversifies Brazil’s origin-market portfolio and contributes to broader economic participation while remaining compatible with environmental constraints. In this sense, the BRICS+ model provides a stronger basis for coordinated connectivity policy than for aviation expansion considered in isolation.
3.6. Mature OECD Aviation Markets
The OECD specification provides the principal contrast with the two emerging-market models. The preferred specification omits ConnectivityComp_Origin, suggesting it adds little explanatory power for variation in OECD-origin tourism flows once the selected model structure is accounted for. This result is consistent with, though it does not prove, a saturation interpretation in which accessibility differentiates less across already mature aviation markets. Connectivity was dropped because it was not statistically significant in this group; its absence is therefore a result of the selection rule and should be compared with the common-specification estimate in Table A10.
This interpretation aligns with previous research suggesting that the tourism relevance of additional network expansion can diminish after air-service availability reaches relatively high levels [11,15,20]. The result should nevertheless be stated narrowly: the model does not imply that air services cease to be necessary for OECD tourism; rather, cross-country variation in the connectivity factor does not provide sufficient additional explanatory value to remain in the preferred specification.
Instead, SocioComp_Origin (β = 0.668; p < 0.001), TechComp_Origin (β = 0.296; p < 0.001) and LaborComp_Origin (β = 0.282; p < 0.001) are retained with statistically significant coefficients. In this sample, variation in socioeconomic capacity, digital readiness, and labour-market conditions therefore contributes more directly to the preferred statistical explanation of tourism flows than operational connectivity.
The negative coefficients for the 2020 and 2021 indicators (β = −1.298 and −2.194, respectively; p < 0.001) capture the exceptional contraction in international mobility during the pandemic period. Their magnitude shows that high pre-existing network maturity did not insulate long-haul tourism from a system-wide mobility shock. In percentage terms, these coefficients imply arrivals were about 73% lower in 2020 and 89% lower in 2021.
The sustainability implication therefore differs from that for Central and South America or BRICS+. Where accessibility is already comparatively mature, the results offer little empirical basis for treating quantitative network expansion as the principal tourism-policy lever. Instead, greater emphasis can be placed on efficiency, resilience, service quality, capacity utilisation, and environmental performance. The cross-market comparison therefore supports differentiated connectivity strategies, not a general prescription that emerging markets should simply reproduce the network density of mature OECD corridors.
3.7. Integrated Specification and Cross-Market Heterogeneity
The integrated model complements the regional results by combining heterogeneous origin markets into a single specification. ConnectivityComp_Origin remains positive and statistically significant (β = 0.118; p < 0.001), while LaborComp_Origin (β = 0.182; p < 0.001) and VisaExempt (β = 0.710; p < 0.001) are also retained. The adjusted R2 is 0.546, below the values obtained in each regional model.
The lower explanatory fit is substantively informative because the integrated sample combines countries with markedly different geographical relationships with Brazil, institutional environments, socioeconomic conditions and aviation-network maturity. The result therefore reinforces the rationale for regional disaggregation: a single global coefficient masks substantial heterogeneity in connectivity’s explanatory relevance.
Consequently, the global connectivity coefficient should be treated as an average conditional association rather than a universal policy parameter. The regional models show that the same general connectivity dimension has very different explanatory relevance across market contexts, ranging from non-retention in OECD to a partial R2 of 56.8% in Central and South America. For policy purposes, the heterogeneity itself is therefore more informative than the integrated coefficient.
Multicollinearity calls for caution when interpreting cross-market differences in the integrated model. The interaction between OECD membership and log connectivity has a VIF of 10.73, the only value above the conventional threshold of 10 (Table A5). Multicollinearity alone does not bias coefficient estimates, but it can increase their standard errors. This may limit the precision with which the model estimates the difference in the connectivity coefficient between OECD markets and the reference group. The interaction results should therefore be considered alongside the regional estimates, which are obtained from separate samples without group dummies or cross-market interaction terms.
4. Implications for Sustainable Tourism, Transport Policy and South–South Integration
4.1. Differentiated Connectivity Strategies
The results above concern accessibility and tourism demand. None of the composite indicators measures emissions, environmental pressure or the local distribution of benefits, so the sustainability points in this section are interpretation, not empirical findings. The central policy implication is the heterogeneous value of connectivity, rather than a general argument for network expansion. Equivalent increases in aviation supply should not be assumed to have equivalent relevance for tourism across origin markets. In sustainability terms, this supports selective evaluation: markets where accessibility remains strongly associated with tourism can receive greater analytical attention, while mature corridors can focus more on efficiency, resilience, utilisation of existing capacity, and environmental performance.
Central and South America and BRICS+ illustrate two different forms of emerging-market opportunity. Connectivity has its largest explanatory contribution in the Latin American specification and remains statistically relevant in BRICS+, but the BRICS+ result also depends on a wider accessibility environment that includes digital readiness and visa arrangements. Policy assessment should therefore move beyond adding routes alone. Bilateral and multilateral air-service agreements, travel facilitation and digital integration can be assessed jointly when considering underserved South–South markets.
The role of VisaExempt in these new-market models underscores that this integrative understanding is correct. Cooperation among regions, airline alliances, operational compatibilities and visa facilitation might suppress some of these various travel frictions [57]. The econometric outcomes do not establish which cluster of institutions is more desirable, but they reveal that physical connectivity and institutional accessibility need not be examined as separate policy areas.
A similar warning can be made for infrastructure development. Brazil currently has plenty of capacity at international airports and its long-haul traffic is mostly already routed through well-defined corridors. Diversification issues may relate to network access and network utilization rather than transport infrastructure. New direct links with new markets must therefore be assessed for their potential accessibility improvement, resilience, economic and commercial justifications, and sustainability performance [58].
Market maturity provides an organising principle for this differentiation. In the OECD model, connectivity adds little explanatory information, whereas it is substantially more relevant in the two emerging-market specifications. Policy resources can therefore be prioritised for further assessment where accessibility constraints appear most consequential, while avoiding the stronger causal claim that the estimated coefficients directly measure the marginal return to a new route or additional flight.
Taken together, the results position air-transport policy within a wider system of tourism accessibility and international integration. The empirical framework identifies markets where connectivity explains more variation, providing an evidence base for screening potential priorities for further assessment. It should not be interpreted as a route-selection algorithm or as evidence that a particular investment will necessarily produce additional arrivals. For a framework such as the GSATB, used here only as a heuristic guide, the present results provide an initial demand-and-accessibility layer to combine with operational, financial, environmental, and institutional evaluation.
4.2. Sustainable Connectivity Versus Connectivity Growth
The distinction between connectivity growth and sustainable connectivity is central to this study’s sustainability contribution. Connectivity growth refers to the quantitative expansion of aviation activity through additional services, frequencies, capacity, or passenger flows, whereas sustainable connectivity concerns the conditions under which improved accessibility generates integration and diversification benefits that justify its associated economic, environmental, and social costs. The two concepts should therefore not be treated as interchangeable. Higher passenger volumes or additional flights alone cannot demonstrate sustainable tourism development, especially because aviation activity generates environmental externalities and the benefits of additional accessibility may vary substantially across markets.
The connectivity gradient identified in this study provides a way to incorporate this distinction into policy assessment. Where connectivity already has limited incremental explanatory relevance, as in the preferred OECD specification, additional quantitative expansion may warrant greater scrutiny relative to alternatives centred on efficiency, resilience, service quality and environmental performance. Conversely, connectivity retains substantial explanatory relevance, as in Central and South America and, to a lesser extent, BRICS+; accessibility gaps may justify closer assessment of potential connectivity improvements, but not an automatic presumption in favour of additional aviation capacity. Sustainable-connectivity assessment should therefore combine the accessibility evidence developed here with emissions intensity, aircraft and operational efficiency, load factors, destination carrying capacity, resilience, commercial viability and the territorial distribution of tourism benefits. The sustainability question is thus not whether connectivity should increase, but whether a particular accessibility improvement generates enough integration and diversification value relative to its multidimensional costs.
4.3. From Connectivity Estimates to Corridor Priorities
The regional estimates can organise a first-stage screening of connectivity priorities. Because ConnectivityComp_Origin represents operational aviation intensity, differences in its coefficient and partial R2 identify market groups in which connectivity has greater or lesser explanatory relevance. This connectivity gradient does not estimate a particular route’s profitability, environmental performance, or causal tourism impact. Instead, it indicates where a more detailed corridor-level assessment is most warranted. Table 5 translates this comparative evidence into policy questions relevant to regional integration, BRICS+ cooperation and the GSATB, used here as a heuristic guide.
Table 5.
Translating empirical findings into sustainable tourism and connectivity policy priorities.
Table 5 should therefore be read as a screening framework rather than as a prescription for increasing traffic. Accessibility is one dimension of corridor prioritisation; financial viability, environmental externalities, social distribution, operational feasibility and institutional compatibility remain separate decision criteria. For BRICS+ and Global South cooperation, this interpretation allows connectivity and tourism diversification to be considered without equating aviation growth with sustainability.
The Air Connectivity Factor’s principal value is therefore comparative. It provides a transparent, replicable way to distinguish markets where operational connectivity contributes more to the statistical explanation of tourism flows. In Brazil, this evidence prioritises further evaluation of regional and South–South accessibility gaps over already mature OECD corridors. The results are relevant to the questions raised by the GSATB agenda, but they do not test the framework and cannot show that specific GSATB routes would produce tourism or economic gains.
5. Limitations and Directions for Future Research
Several restrictions also limit the applicability of the results. First, ConnectivityComp_Origin measures operational aviation intensity based on a PCA. Although it captures the combined effect of several correlated indicators over time within the panel, the measure does not replicate airline network topology (e.g., airport centrality, availability of direct flights, hub reliance, route density, etc.). Future studies could merge this longitudinal variable with network variables to see whether operational measures and structural connectivity variables affect tourism flows differently.
Secondly, the measure is in synthetic units. Altering ConnectivityComp_Origin cannot be mapped directly back to the number of flights, seats, routes, or additional passenger kilometres, making the estimated coefficient operationally awkward for aviation authorities, tour operators, or airlines. At the route level, the synthetic score should map to directly observable measures like frequency, fare, and direct service before being used for investment appraisal.
Third, the country-level observational unit conceals spatial heterogeneity within national aviation systems. Brazil has only a handful of international gateways, clustered mainly in the Southeast, whereas origin countries also show considerable variation in hub locations and access. Datasets at airport, route, and city-pair level would let future research examine how these spatial structures relate to tourism accessibility and regional development.
Fourth, causal identification remains limited. The Durbin–Wu–Hausman tests do not reject exogeneity of the connectivity factor in the BRICS+ and Central and South American models, but this result applies to the adopted specification and one-period-lag instrument, and a lagged instrument may not be valid when both connectivity and unobserved demand shocks are persistent. It cannot rule out all forms of reciprocal causation, because tourism demand may itself contribute to airline entry, frequency decisions, and long-run service expansion. The coefficients are therefore interpreted as conditional associations. Future work could pursue stronger identification through external instruments, quasi-experimental designs, natural experiments, appropriate dynamic-panel methods or exogenous shocks affecting aviation supply. One candidate external instrument is total air departures from the origin country (WDI indicator IS.AIR.DPRT), which reflects aviation supply in the origin market rather than travel to Brazil alone.
Fifth, the empirical application uses Brazil as the common destination. The extent to which the estimated connectivity gradient generalises to other Global South destinations remains an open empirical question. Comparative applications to other BRICS+ and emerging economies could distinguish general patterns of network maturity from features specific to Brazilian geography, tourism specialisation, institutions and aviation-market structure.
Sixth, richer aviation databases could substantially deepen the analysis. Route structures, flight schedules, fares, seat capacity, passenger itineraries, hub dependence, and multimodal accessibility would enable integrating the current panel approach with network science, spatial analysis, and accessibility modelling.
Finally, the study does not directly estimate sustainability outcomes. Aviation emissions, carbon intensity, destination-level environmental pressure, carrying capacity, tourism-income distribution, employment quality and community outcomes are not dependent variables in the present models. Consequently, the finding that connectivity is more strongly associated with tourism in particular markets should not be interpreted as evidence that additional aviation activity in those markets is intrinsically sustainable. Future corridor assessments should combine accessibility and tourism indicators with environmental and distributional measures to jointly evaluate economic integration, emissions, and local social outcomes.
The second concerns the data and model choices. The panel runs only to 2022 and covers the first part of the pandemic recovery. Extending this panel to 2023 and beyond, once data become available, would reveal whether the gradient persists after international travel normalises. The preferred models were each selected for each group on statistical significance, so the gradient here is partly an ad hoc result. The common specification in Table A10 mitigates this issue, but formally testing for differences in the gradient between groups, for example with a pooled model and group interaction effects for all regressors, would provide a firmer answer. Last, some values of controls were imputed; results with different imputation approaches are shown in Table A11. Table A11 shows that the connectivity coefficient remains positive and statistically significant for BRICS+, Central/South America and the global reference category.
These challenges are part of a wider research agenda. The current approach provides an empirical filter for comparing connectivity between origin markets; future work can gradually incorporate route-level operational data, network structure, improved causal designs, and multi-dimensional sustainability indices. Among these research directions, applications such as the GSATB could be tested as facilitators for South–South integration, rather than as a given infrastructural product.
6. Conclusions
This study examined whether the statistical link between international air connectivity and inbound tourism differs among origin markets with varying roles in the aviation system. Focusing on Brazil as a representative Global South destination, the analysis compared OECD, BRICS+, and Central and South American markets from 2002 to 2022. The main empirical result is a connectivity gradient across the preferred regional models. ConnectivityComp_Origin shows its strongest regional association in Central and South America (β = 0.212; partial R2 = 56.8%), remains statistically significant in BRICS+ (β = 0.117; partial R2 ≈ 17.0%), and is not included in the preferred OECD model.
The connectivity gradient constitutes the study’s principal generalisable contribution. Rather than supporting a universal relationship between additional connectivity and tourism, the results indicate that connectivity’s incremental explanatory relevance varies substantially across market contexts and aligns with differences in existing accessibility and aviation-market maturity. The Brazilian evidence therefore supports testing a comparative proposition in other Global South destinations: connectivity should be assessed as a context-dependent accessibility resource whose relevance may decline as market accessibility becomes more established. In BRICS+, the simultaneous relevance of digital readiness and visa exemption further demonstrates that physical aviation access forms only one component of a broader accessibility environment.
Brazil’s inbound-tourism portfolio remains strongly concentrated in OECD and neighbouring Latin American markets, while BRICS+ accounts for a comparatively small share of arrivals. This distribution illustrates a wider Global South issue: changes in global economic weight do not automatically translate into equivalent changes in tourism interaction. Market diversification depends on a combination of geographical, institutional, digital and transport-accessibility conditions.
These results support a selective interpretation of sustainable connectivity. The policy objective should not be to maximise flights, routes, or passenger volumes. Instead, the empirical framework can identify markets where accessibility deserves closer policy assessment. Any subsequent corridor decision must incorporate dimensions outside the current model, including emissions, operational efficiency, financial viability, destination capacity, resilience, and the distribution of local tourism benefits.
For BRICS+ and other Global South economies, the implications therefore concern coordination among aviation agreements, tourism governance, visa facilitation, digital access and sustainable-transport planning. The GSATB provides one possible framework for organising this discussion, but this analysis uses it only as a heuristic guide and does not test it. The connectivity gradient can support initial screening of underserved South–South markets, after which environmental, social, institutional, and commercial criteria should determine whether individual corridors merit development.
Future comparative research should test whether the gradient observed for Brazil is reproduced in other BRICS+ and Global South destinations. By combining country-panel analysis with route- and airport-level network data, future studies could use stronger causal-identification strategies and explicit carbon and distributional indicators to move from connectivity screening to a multidimensional assessment of sustainable tourism corridors. Such an extension would provide a stronger empirical basis for understanding how international accessibility can contribute to tourism diversification and economic integration without equating aviation growth with sustainability.
Supplementary Materials
The following supporting information can be downloaded at: https://www.mdpi.com/article/10.3390/su182111194/s1, Figure S1: Tourist arrivals to Brazil from OECD countries (2002–2022); Figure S2: Tourist arrivals to Brazil from Central and South American countries (2002–2022); Figure S3: Tourist arrivals to Brazil from BRICS+ countries (2002–2022).
Author Contributions
Conceptualization, C.F.D.M.C., R.S. and E.F.; methodology, C.F.D.M.C., E.F. and B.F.; validation, C.F.D.M.C., E.F. and B.F.; formal analysis, C.F.D.M.C., R.S., E.F. and B.F.; investigation, C.F.D.M.C., E.F. and B.F.; data curation, C.F.D.M.C. and B.F.; writing—original draft preparation, C.F.D.M.C. and E.F.; writing—review and editing, R.S., E.F. and B.F.; visualization, C.F.D.M.C. and R.S.; supervision, R.S. and E.F. All authors have read and agreed to the published version of the manuscript.
Funding
This research received no external funding.
Institutional Review Board Statement
Not applicable.
Informed Consent Statement
Not applicable.
Data Availability Statement
The data analysed in this study were compiled from publicly available secondary sources, including the World Tourism Organisation, the World Bank’s World Development Indicators, the Brazilian National Civil Aviation Agency (ANAC), CEPII, UNESCO and the Global Peace Index. Appendix A provides further information on the variables and their respective sources. Aviation data were taken from the ANAC Air Transport Statistical Database [32] and arrival data from the UN Tourism Statistics Database [30].
Acknowledgments
The authors gratefully acknowledge their respective institutions—the Federal University of Rio de Janeiro (COPPE/UFRJ), the Brazilian Institute of Geography and Statistics (IBGE), Durban University of Technology (DUT), and the Brazilian Department of Airspace Control (DECEA)—for fostering institutional collaboration and academic exchange. This cooperative environment brought together researchers from different institutional and disciplinary backgrounds and made this study’s collaborative research possible. Declaration of Generative AI and AI-assisted technologies in the writing process: During the preparation of this manuscript, the authors used ChatGPT (OpenAI; GPT-6) and Claude (Anthropic; Claude Opus 5.5) for language editing, grammar and readability support. The authors critically reviewed and edited all AI-assisted outputs and take full responsibility for the manuscript’s content.
Conflicts of Interest
The authors declare no conflicts of interest.
Appendix A
Table A1.
Variables by conceptual block, with definitions, units, sources and coverage.
Table A2.
Model specification and goodness-of-fit statistics across country groups.
Table A3.
Tests for Panel Data Model Selection.
Table A4.
Diagnostics for Panel Data Models.
Table A5.
Variance Inflation Factor (VIF) Test for Multicollinearity for Panel Data Models.
Table A6.
Partial R2 of ConnectivityComp_Origin.
Table A7.
Endogeneity Diagnostics for the Air Connectivity Variable.
Table A8.
Sensitivity of the Connectivity Results to Alternative Treatments of Zero Bilateral Aviation Activity.
Table A9.
Origin countries represented in the analytical dataset, by group.
Table A10.
Common specification for all groups: same regressors, estimator and standard-error correction.
Table A11.
Connectivity coefficient under alternative treatments of missing values.
References
- De Wit, J.; Zuidberg, J.; Burghouwt, G. Airline network competition and connectivity quality: Assessing the European airline market. J. Air Transp. Manag. 2009, 15, 188–197. [Google Scholar] [CrossRef] [Scilit]
- Graham, A.; Papatheodorou, A.; Forsyth, P. Aviation and Tourism: Implications for Leisure Travel; Routledge: London, UK, 2016. [Google Scholar]
- Zhang, A.; Fu, X.; Yang, H. Air transport liberalization and its impact on airline competition and network connectivity. Transp. Policy 2018, 72, 34–47. [Google Scholar] [CrossRef] [Scilit]
- Dobruszkes, F.; Vowles, T.; Mondou, V. Air transport liberalization and international tourism: Evidence from Europe and beyond. J. Transp. Geogr. 2019, 79, 102464. [Google Scholar] [CrossRef] [Scilit]
- Tveterås, S.; Roll, K.H. Long-Haul Flights and Tourist Arrivals; Working Paper; University of Stavanger: Stavanger, Norway, 2011. [Google Scholar]
- Tveterås, S.; Roll, K.H. Non-stop flights and tourist arrivals. Tour. Econ. 2014, 20, 5–20. [Google Scholar] [CrossRef] [Scilit]
- Koo, T.T.R.; Tan, D.; Duval, D.T. The effect of levels of air service availability on inbound tourism demand from Asia to Australia. In Advances in Airline Economics; Emerald: Bingley, UK, 2018; Volume 7, pp. 197–217. [Google Scholar] [CrossRef] [Scilit]
- Kuok, R.U.K.; Koo, T.T.R.; Lim, C. Air transport capacity and tourism demand: A panel cointegration approach. Tour. Econ. 2023, 29, 2059–2080. [Google Scholar] [CrossRef] [Scilit]
- Tang, J.; Wu, H.; Ramos, V.; Sriboonchitta, S. The impact of international air routes on tourism. Ann. Tour. Res. 2023, 101, 103562. [Google Scholar] [CrossRef] [Scilit]
- Ho, C.-Y.; Peng, T.; Takayama, H.; Xu, L. The Impact of Air Connectivity on International Travel: Evidence from Cross-Border Card Payments. 2024. Available online: https://hatakayama.github.io/paper_web/Air_Connectivity_and_Cross_border_Travel.pdf (accessed on 30 August 2026).
- Alderighi, M.; Gaggero, A.A. Flight availability and international tourism flows. Ann. Tour. Res. 2019, 79, 102642. [Google Scholar] [CrossRef] [Scilit]
- Silveira, L.; Santos, N.; Costa, V. The liberalisation of air transport and the impacts on travel and tourism: The case of the Azores Archipelago. Case Stud. Transp. Policy 2023, 11, 100969. [Google Scholar] [CrossRef] [Scilit]
- Burghouwt, G.; Redondi, R. Connectivity in air transport networks: Models, measures and applications. J. Transp. Geogr. 2013, 34, 293–295. [Google Scholar] [CrossRef] [Scilit]
- International Civil Aviation Organization (ICAO). Annual Report of the Council 2022; ICAO: Montreal, QC, Canada, 2022. [Google Scholar]
- Forsyth, P.; Dwyer, L.; Spurr, R. The impacts of air transport on tourism. In Aviation and Tourism: Implications for Leisure Travel; Graham, A., Papatheodorou, A., Forsyth, P., Eds.; Routledge: London, UK, 2014; pp. 17–35. [Google Scholar]
- Zhang, F.; Graham, D.J. Air transport and economic growth: A review of the impact mechanism and causal relationships. Transp. Rev. 2020, 40, 506–528. [Google Scholar] [CrossRef] [Scilit]
- Franciscone, B.G.; Fernandes, E. Operational improvements and sustainable air transport development in the Global South. J. BRICS Stud. 2025, 4, 73–89. [Google Scholar] [CrossRef] [Scilit]
- Franciscone, B.G.; Zou, X.; Fernandes, E. The Global South Air Transport Belt: A catalyst for sustainable tourism and economic growth. Transp. Policy 2024, 159, 14–27. [Google Scholar] [CrossRef] [Scilit]
- Airports Council International (ACI). Airport Economics Report; Airports Council International: Montreal, QC, Canada, 2015. [Google Scholar]
- Fu, X.; Oum, T.H.; Zhang, A. Air transport liberalization and its impacts on connectivity, competition and economic growth. Transp. Policy 2019, 81, A1–A4. [Google Scholar] [CrossRef] [Scilit]
- Button, K.; Yuan, J. Airfreight transport and economic development: An examination of causality. Urban Stud. 2013, 50, 329–340. [Google Scholar] [CrossRef] [Scilit]
- Seetanah, B.; Khadaroo, J. An analysis of the relationship between transport capital and tourism development in a dynamic framework. Tour. Econ. 2009, 15, 785–802. [Google Scholar] [CrossRef] [Scilit]
- Bulatovic, I.; Papatheodorou, A. Civil aviation and tourism demand in Montenegro: A panel data approach. J. Air Transp. Manag. 2023, 110, 102413. [Google Scholar] [CrossRef]
- Gołembski, G.; Majewska, J. The impact of transport infrastructure on international inbound tourism: A gravity model for Poland. Int. J. Contemp. Manag. 2018, 17, 213–232. [Google Scholar] [CrossRef] [Scilit]
- Liao, M.; Zhang, A. Untangle Air Connectivity and Tourism Development in China’s Domestic Market; Social Science Research Network: New York, NY, USA, 2026; Available online: https://papers.ssrn.com/sol3/papers.cfm?abstract_id=6772099 (accessed on 30 August 2026).
- International Air Transport Association (IATA). Annual Review 2025; IATA: Montreal, QC, Canada, 2025. [Google Scholar]
- Quah, D. The global economy’s shifting centre of gravity. Glob. Policy 2011, 2, 3–9. [Google Scholar] [CrossRef] [Scilit]
- Boeing. Commercial Market Outlook 2025–2044; Boeing Commercial Airplanes: Seattle, WA, USA, 2025. [Google Scholar]
- Upham, P.; Gössling, S.; Scott, D. Distributional issues: Who wins and who loses from aviation growth? In Climate Change and Aviation: Issues, Challenges and Solutions; Gössling, S., Upham, P., Eds.; Earthscan: London, UK, 2009; pp. 35–52. [Google Scholar]
- UN Tourism. Tourism Statistics Database: Inbound Tourism, Arrivals of Non-Resident Tourists at National Borders by Country of Residence; UN Tourism: Madrid, Spain, 2026; Available online: https://www.untourism.int/tourism-statistics/tourism-statistics-database (accessed on 30 August 2026).
- World Bank. World Development Indicators; World Bank: Washington, DC, USA, 2024. [Google Scholar]
- Agência Nacional de Aviação Civil (ANAC). Dados Estatísticos do Transporte Aéreo [Air Transport Statistical Database]; ANAC: Brasília, Brazil. Available online: https://www.gov.br/anac/pt-br/assuntos/dados-e-estatisticas/dados-estatisticos (accessed on 27 July 2025).
- Ministério das Relações Exteriores (MRE). Quadro Geral de Regime de Vistos Para a Entrada de Estrangeiros No Brasil [General Table of Visa Regimes for Entry of Foreigners Into Brazil]; MRE: Brasília, Brazil, 2025.
- UNESCO World Heritage Centre. World Heritage List; UNESCO: Paris, France, 2025; Available online: https://whc.unesco.org/en/list/ (accessed on 29 July 2025).
- Mayer, T.; Zignago, S. Notes on CEPII’s Distances Measures: The GeoDist Database; CEPII Working Paper No. 2011-25; CEPII: Paris, France, 2011. [Google Scholar]
- Fearon, J.D. Ethnic and cultural diversity by country. J. Econ. Growth 2003, 8, 195–222. [Google Scholar] [CrossRef] [Scilit]
- Institute for Economics & Peace (IEP). Global Peace Index 2024: Measuring Peace in a Complex World; IEP: Sydney, Australia, 2025. [Google Scholar]
- Jolliffe, I.T.; Cadima, J. Principal component analysis: A review and recent developments. Philos. Trans. R. Soc. A 2016, 374, 20150202. [Google Scholar] [CrossRef] [Scilit]
- van Buuren, S.; Groothuis-Oudshoorn, K. Mice: Multivariate imputation by chained equations in R. J. Stat. Softw. 2011, 45, 1–67. [Google Scholar] [CrossRef] [Scilit]
- Culiuc, A. Determinants of International Tourism. In IMF Working Paper; WP/14/82; International Monetary Fund: Washington, DC, USA, 2014. [Google Scholar] [CrossRef] [Scilit]
- Swamy, P.A.V.B.; Arora, S.S. The exact finite sample properties of the estimators of coefficients in the error components regression model. Econometrica 1972, 40, 261–275. [Google Scholar] [CrossRef] [Scilit]
- Baltagi, B.H. Econometric Analysis of Panel Data, 6th ed.; Springer: Cham, Switzerland, 2021. [Google Scholar]
- Breusch, T.S.; Pagan, A.R. The Lagrange multiplier test and its applications to model specification in econometrics. Rev. Econ. Stud. 1980, 47, 239–253. [Google Scholar] [CrossRef] [Scilit]
- Hausman, J.A. Specification tests in econometrics. Econometrica 1978, 46, 1251–1271. [Google Scholar] [CrossRef] [Scilit]
- Breusch, T.S.; Pagan, A.R. A simple test for heteroscedasticity and random coefficient variation. Econometrica 1979, 47, 1287–1294. [Google Scholar] [CrossRef] [Scilit]
- Wooldridge, J.M. Econometric Analysis of Cross Section and Panel Data, 2nd ed.; MIT Press: Cambridge, MA, USA, 2010. [Google Scholar]
- Pesaran, M.H. General diagnostic tests for cross-sectional dependence in panels. Empir. Econ. 2021, 60, 13–50. [Google Scholar] [CrossRef] [Scilit]
- Hoechle, D. Robust standard errors for panel regressions with cross-sectional dependence. Stata J. 2007, 7, 281–312. [Google Scholar] [CrossRef] [Scilit]
- White, H. A heteroskedasticity-consistent covariance matrix estimator and a direct test for heteroskedasticity. Econometrica 1980, 48, 817–838. [Google Scholar] [CrossRef] [Scilit]
- Arellano, M. Computing robust standard errors for within-groups estimators. Oxf. Bull. Econ. Stat. 1987, 49, 431–434. [Google Scholar] [CrossRef] [Scilit]
- Driscoll, J.C.; Kraay, A.C. Consistent covariance matrix estimation with spatially dependent panel data. Rev. Econ. Stat. 1998, 80, 549–560. [Google Scholar] [CrossRef] [Scilit]
- Cameron, A.C.; Gelbach, J.B.; Miller, D.L. Bootstrap-based improvements for inference with clustered errors. Rev. Econ. Stat. 2008, 90, 414–427. [Google Scholar] [CrossRef] [Scilit]
- Reed, W.R. On the practice of lagging variables to avoid simultaneity. Oxf. Bull. Econ. Stat. 2015, 77, 897–905. [Google Scholar] [CrossRef] [Scilit]
- Bellemare, M.F.; Masaki, T.; Pepinsky, T.B. Lagged explanatory variables and the estimation of causal effect. J. Polit. 2017, 79, 949–963. [Google Scholar] [CrossRef] [Scilit]
- R Core Team. R: A Language and Environment for Statistical Computing; R Foundation for Statistical Computing: Vienna, Austria, 2025. [Google Scholar]
- World Tourism Organization (UNWTO). World Tourism Barometer; UNWTO: Madrid, Spain, 2022. [Google Scholar]
- Costa, J.; Alves, T.; Andrade, A.; Kalakou, S. Assessing efficiency in public service obligations in European air transport using data envelopment analysis. Case Stud. Transp. Policy 2021, 9, 1783–1809. [Google Scholar] [CrossRef] [Scilit]
- Dimitriou, D.; Sartzetaki, M. Criticality of a regional airport development to mitigate COVID-19 economic effects. Case Stud. Transp. Policy 2022, 10, 581–590. [Google Scholar] [CrossRef] [Scilit]
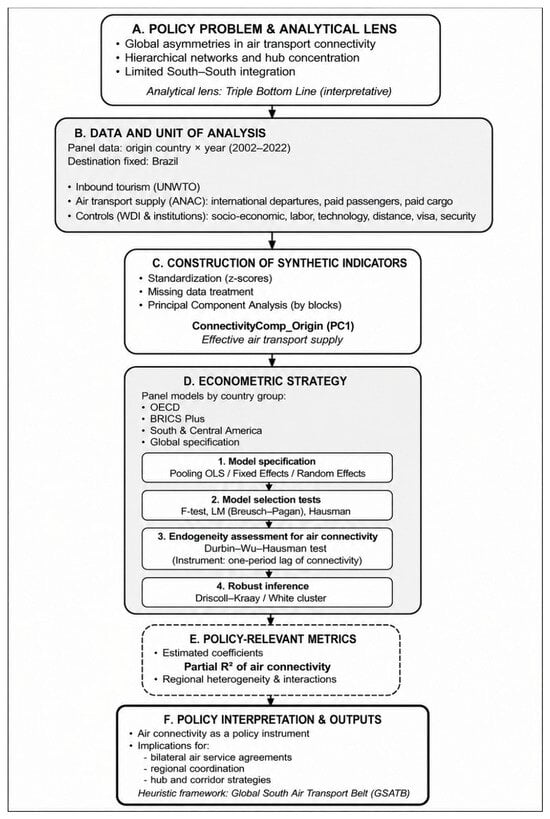
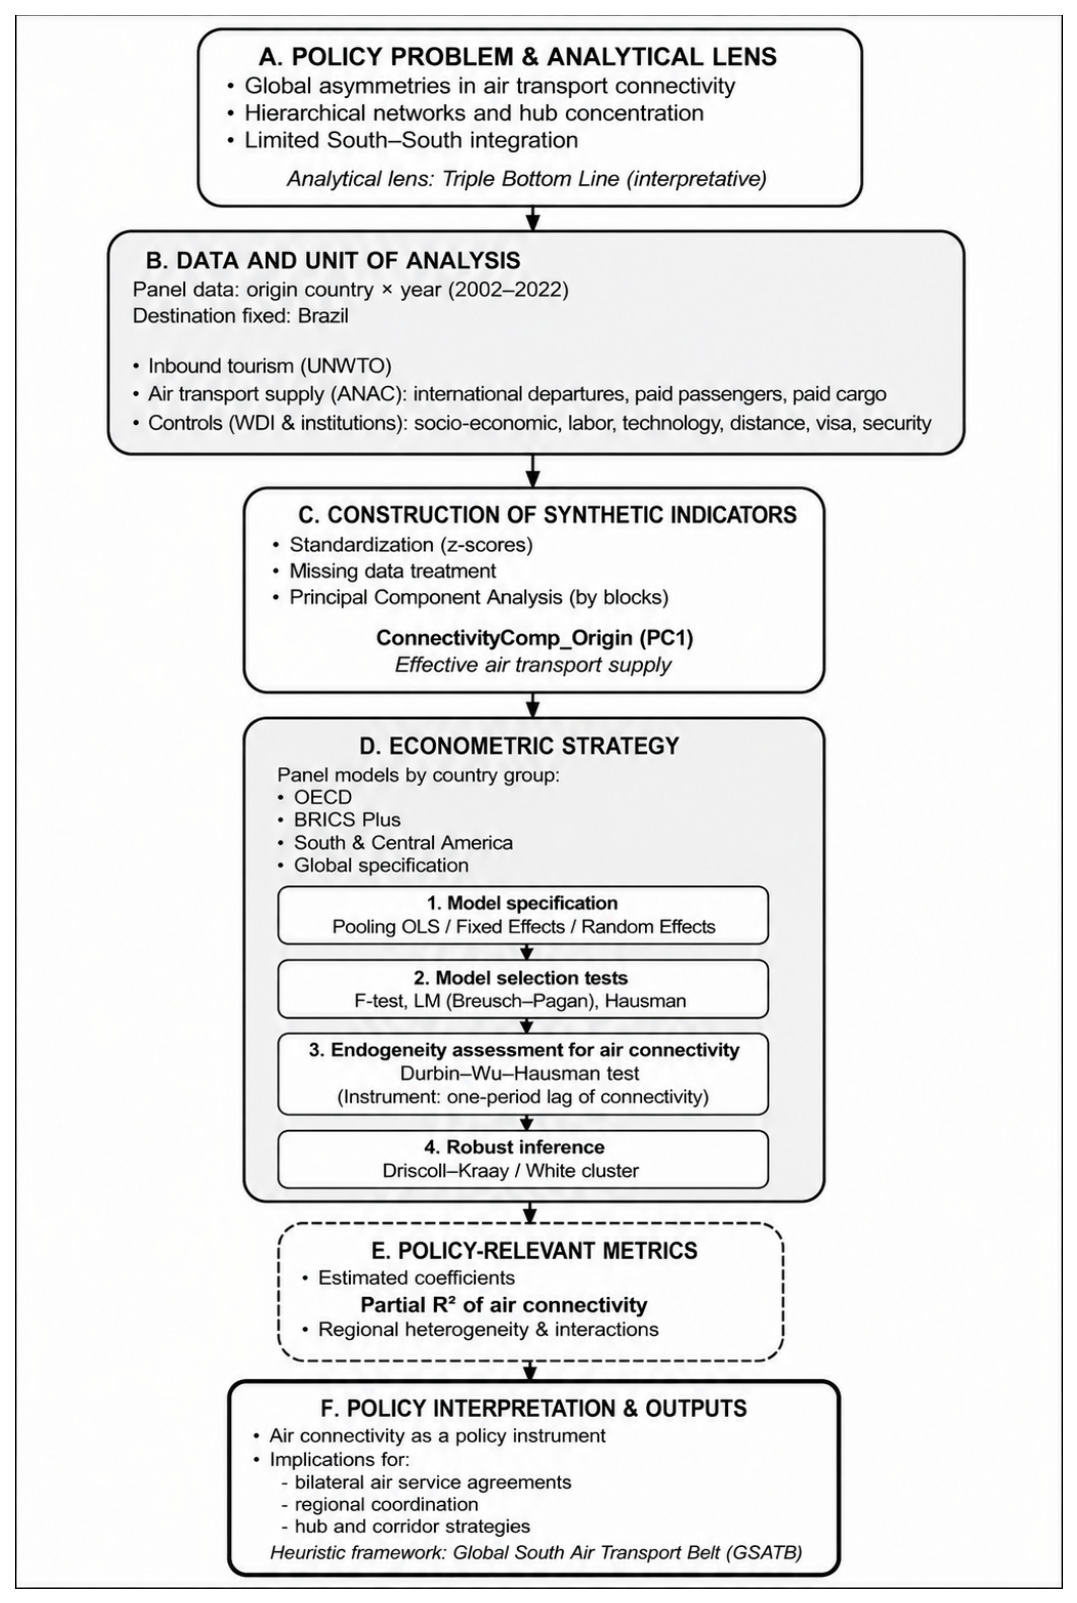
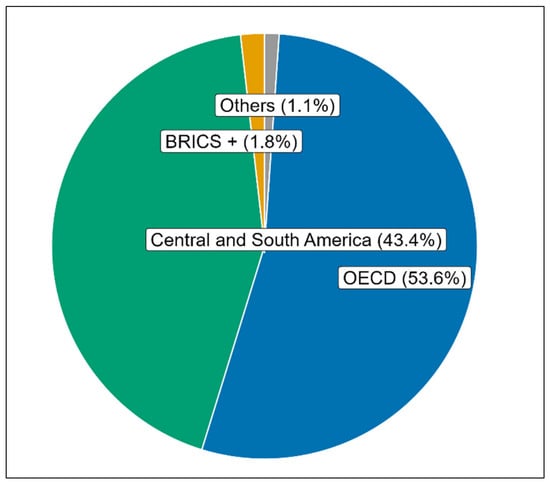
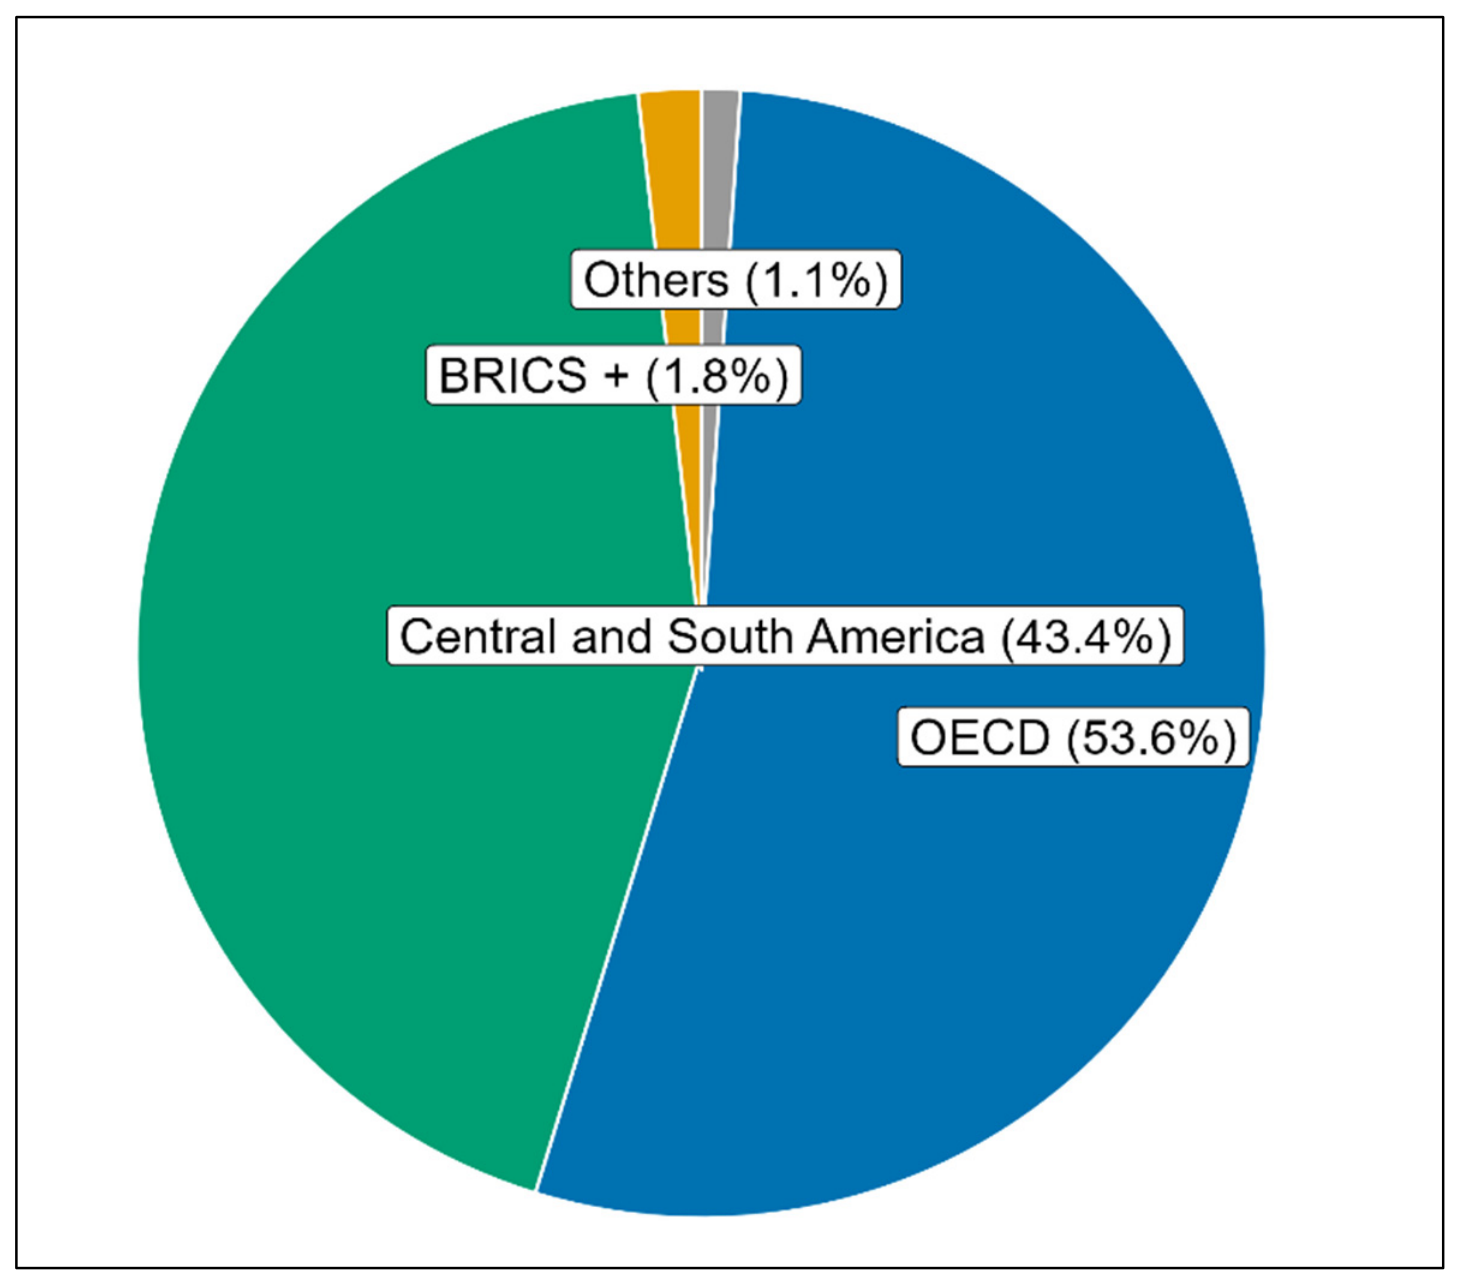
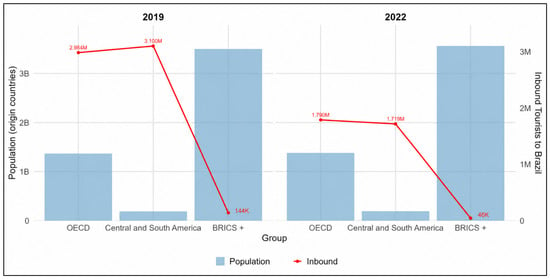
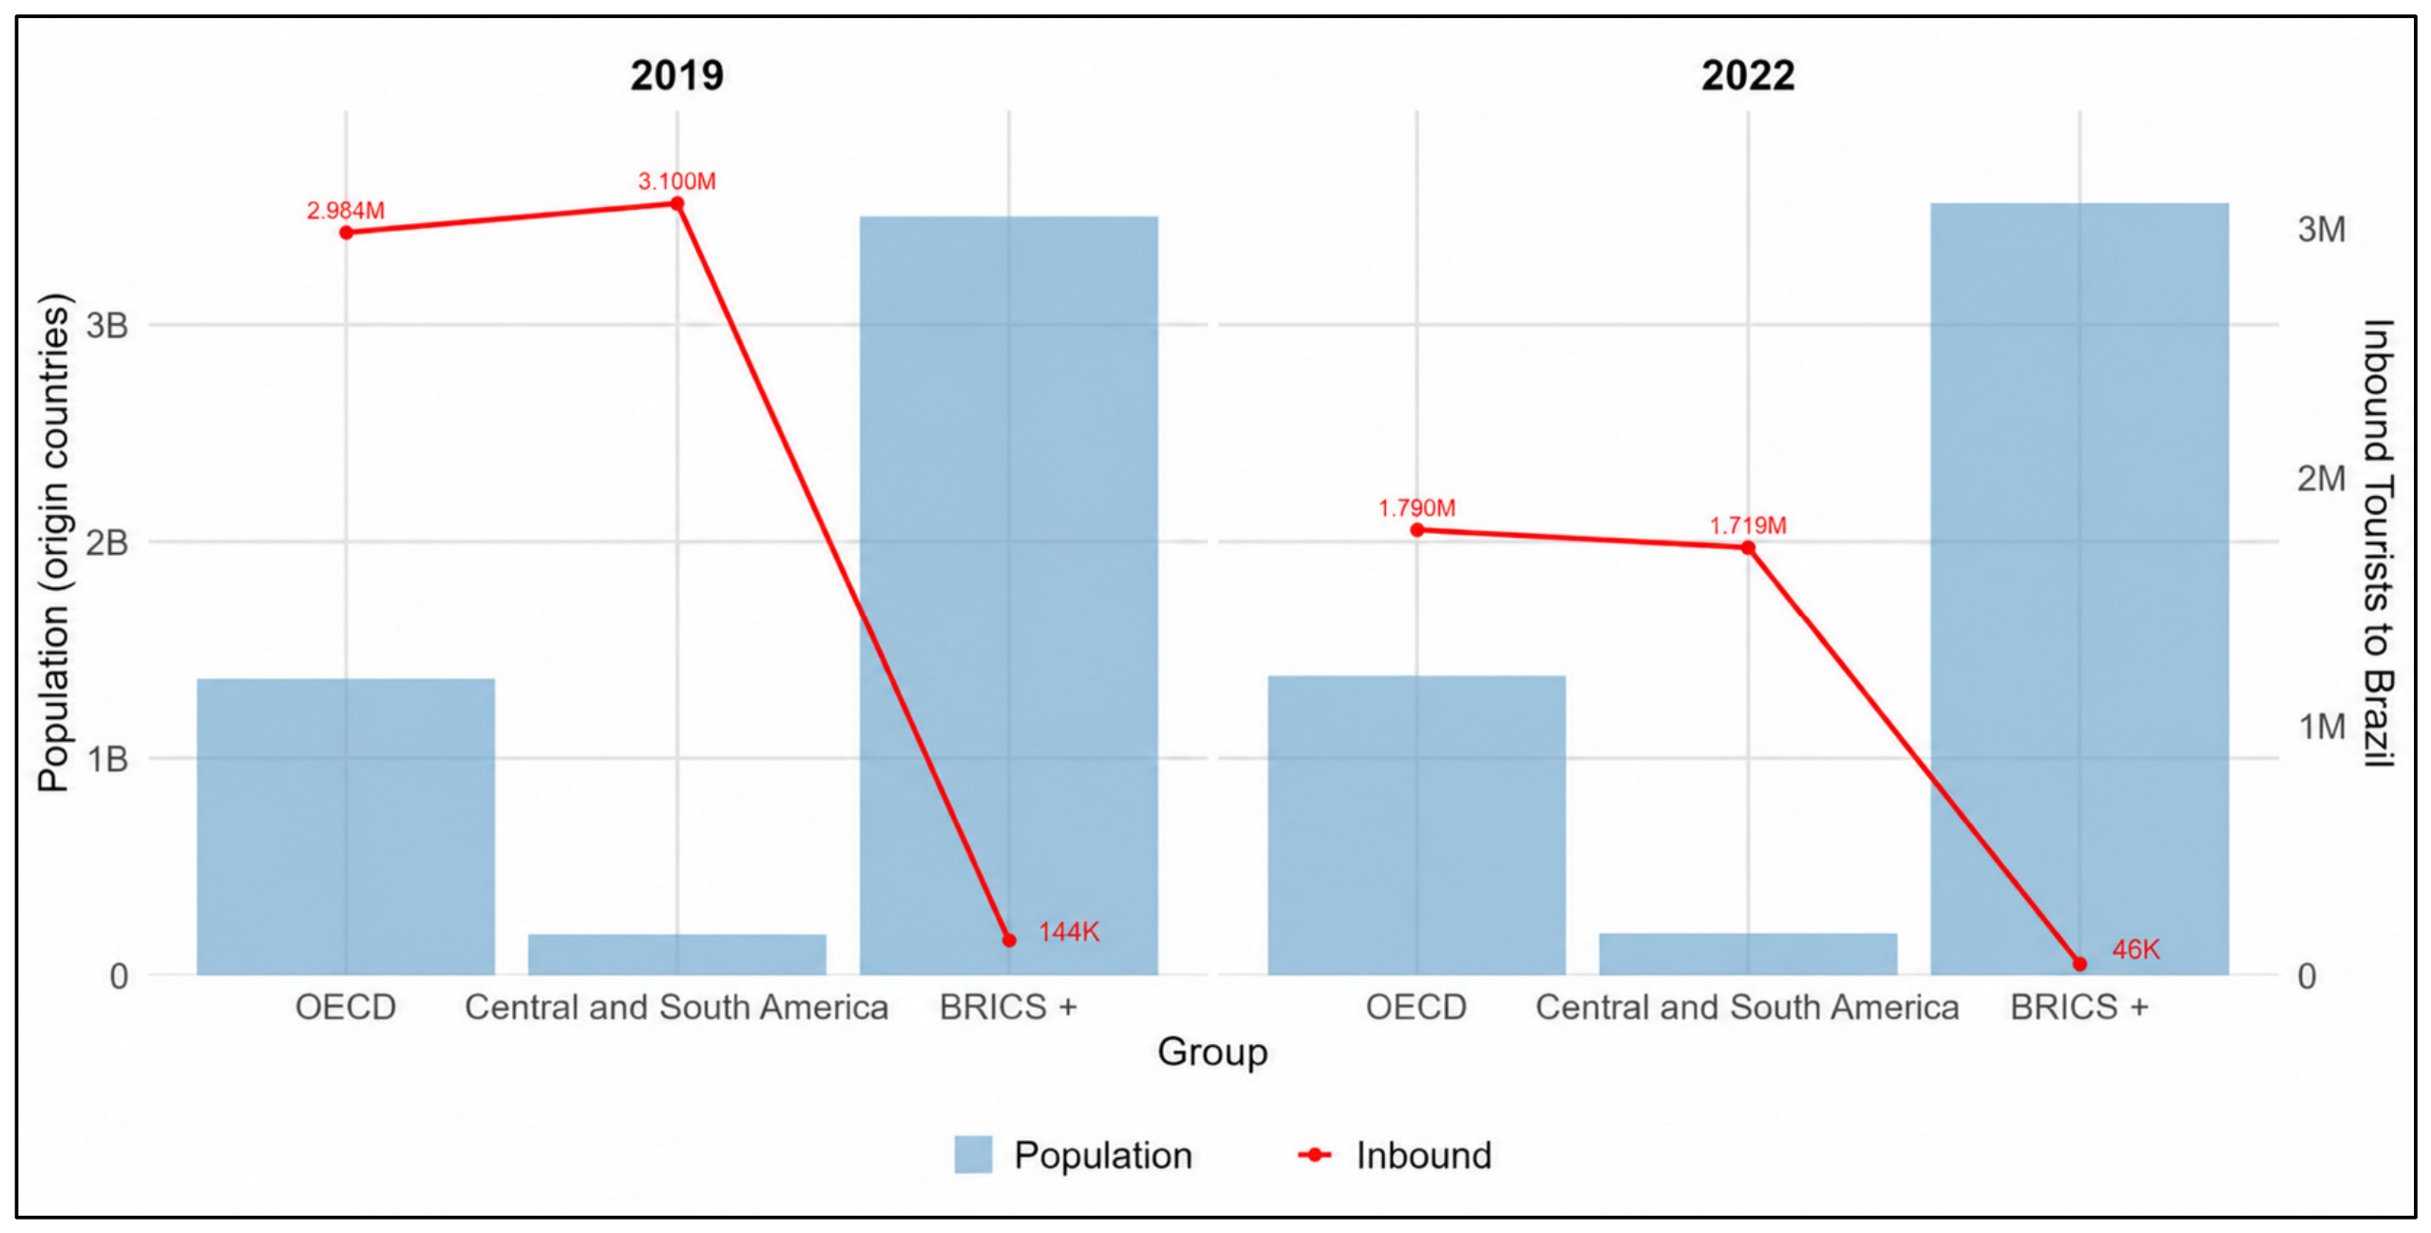
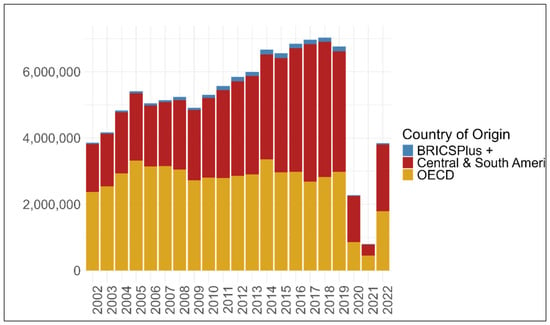
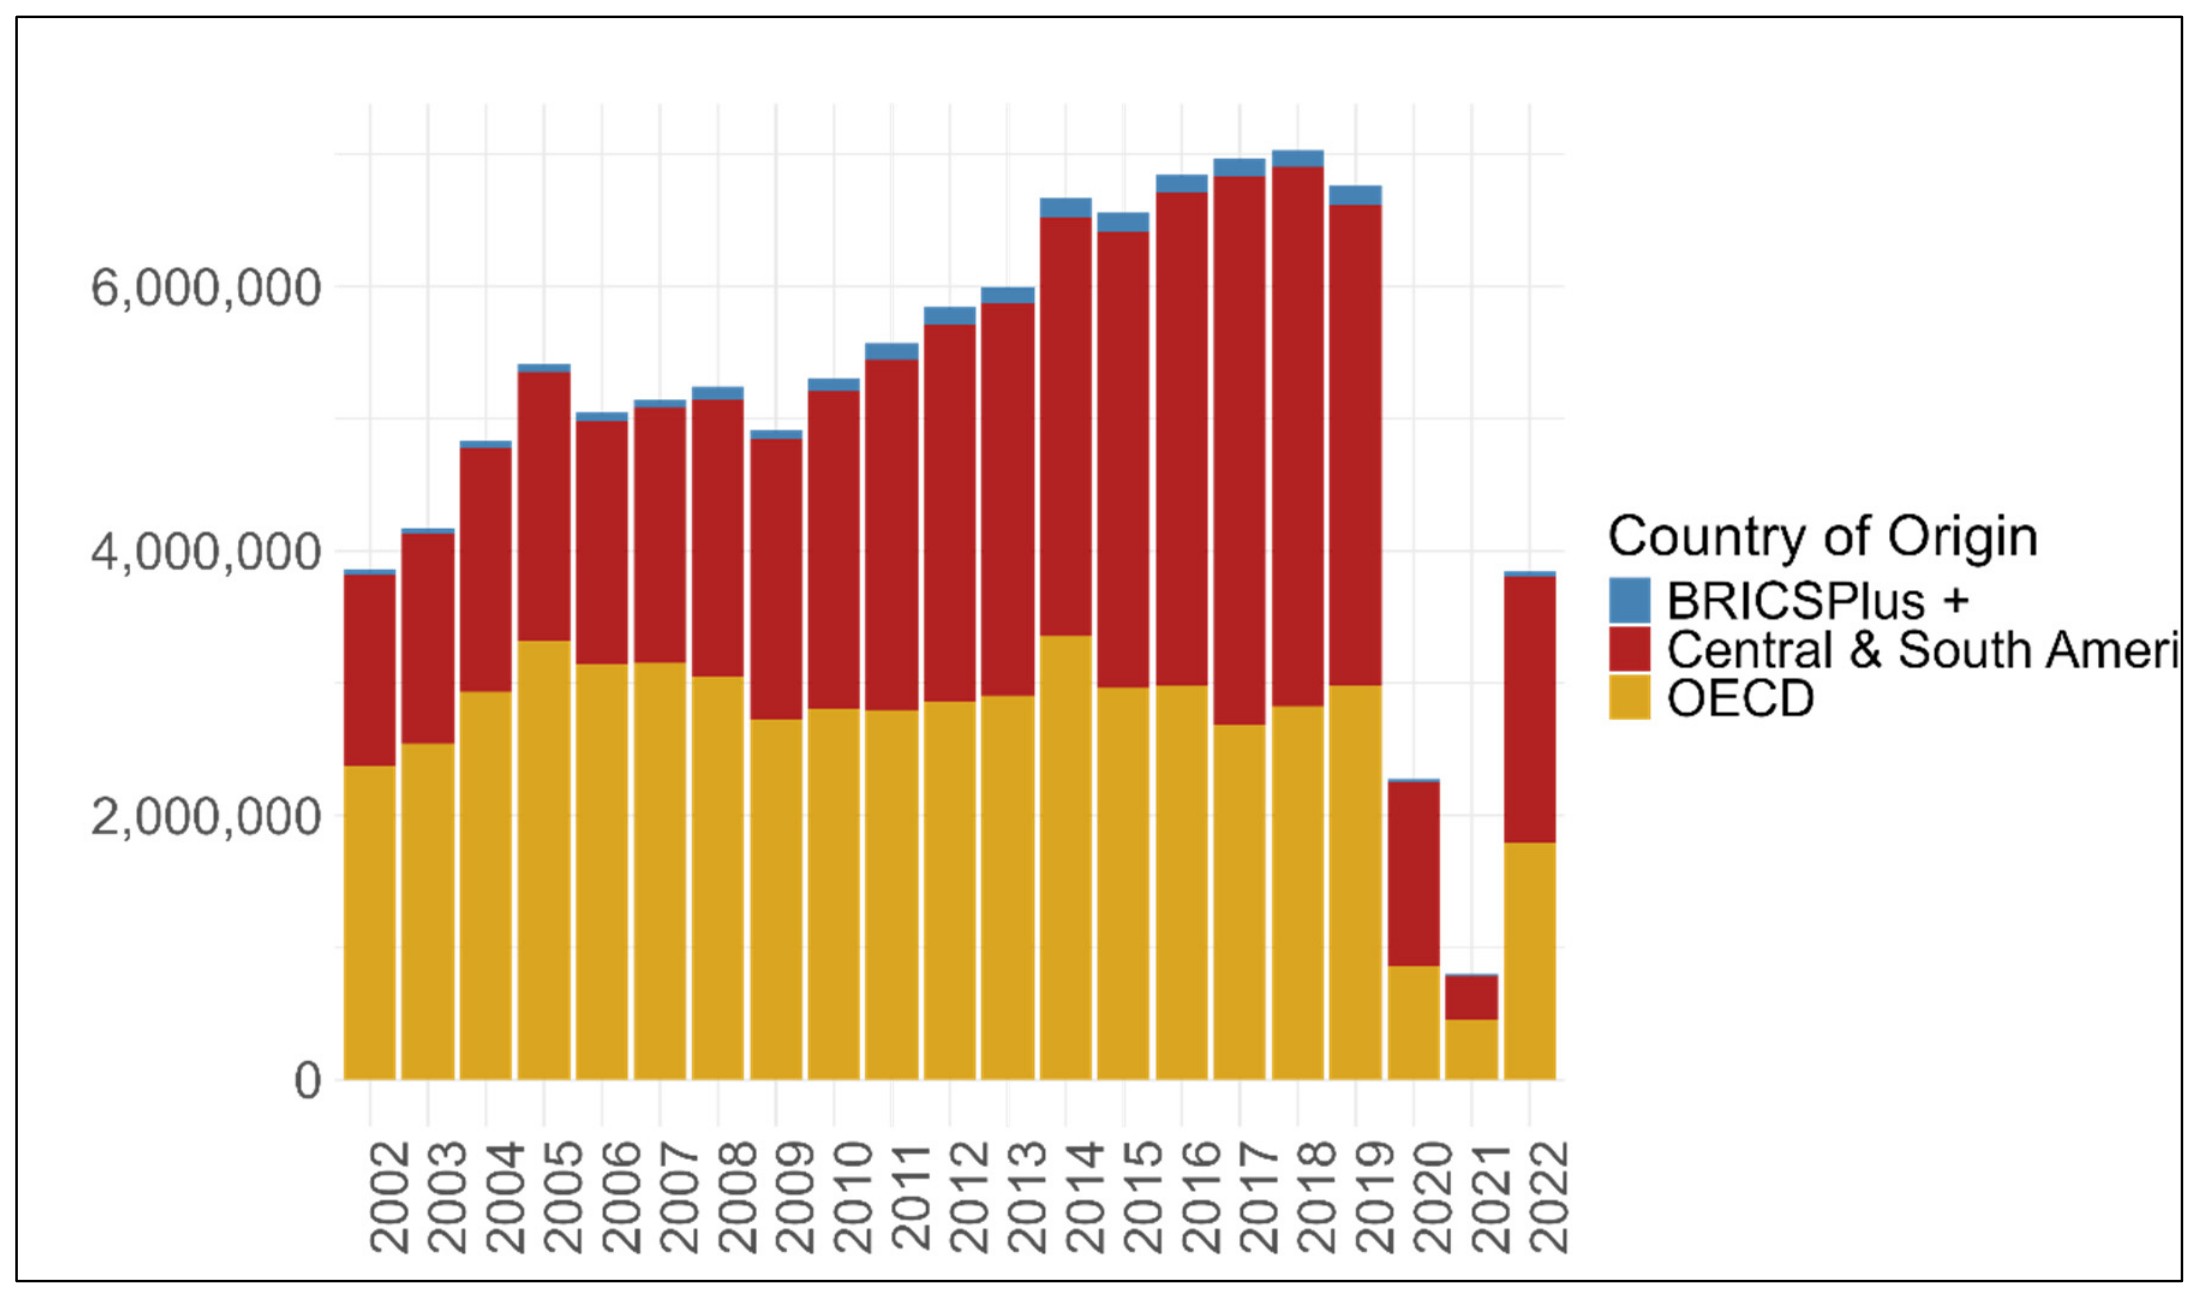

Disclaimer/Publisher’s Note: The statements, opinions and data contained in all publications are solely those of the individual author(s) and contributor(s) and not of MDPI and/or the editor(s). MDPI and/or the editor(s) disclaim responsibility for any injury to people or property resulting from any ideas, methods, instructions or products referred to in the content. |
© 2026 by the authors. Licensee MDPI, Basel, Switzerland. This article is an open access article distributed under the terms and conditions of the Creative Commons Attribution (CC BY) license.