


Abstract
Direct economic losses from storm surge disasters are driven jointly by natural hazard factors and socioeconomic exposure. Because loss data are inherently zero-inflated and right-skewed, a single linear model cannot adequately capture them. Using a balanced panel of 11 coastal provinces in China over 2001–2024, this study decomposes the loss-generation process into two stages—whether a disaster occurs and the magnitude of losses—and develops a two-stage (Hurdle-type) panel model, further employing instrumental-variable two-stage least squares (IV-2SLS) to address the endogeneity of disaster prevention and mitigation expenditure. The results show that, at the annual provincial scale, disaster occurrence is determined nearly deterministically by whether a storm surge process occurs, so that the disaster-occurrence probability equation exhibits complete separation and its coefficients are not separately identifiable. Conditional on disaster occurrence, storm surge height is the most robust positive driver of loss magnitude: each additional centimeter of storm surge height raises direct economic losses by approximately 1.5% on average, a finding confirmed by robustness checks that replace the dependent variable, winsorize the losses, exclude extreme samples, and apply two-way and wild cluster bootstrap inference. After correction for endogeneity with the proposed instrument, the positive effect of disaster prevention and mitigation expenditure weakens substantially and becomes statistically insignificant, indicating that the positive OLS relationship is not robust to the proposed IV specification. Accordingly, this study proposes differentiated disaster-management measures that distinguish the stages of disaster occurrence and loss magnitude and strengthen the monitoring and early warning of hazard intensity. These findings provide an evidence-based basis for sustainable coastal development and for enhancing coastal disaster resilience.
1. Introduction
Storm surge is one of the most destructive marine disasters along the coast of China [1,2]. It is a phenomenon in which sea level rises abnormally and coastal water levels significantly exceed normal tidal levels under the action of weather systems such as typhoons or extratropical cyclones, typically causing damage such as seawater intrusion and levee failure. Because direct economic losses from storm surge are driven jointly by natural hazard factors and socioeconomic exposure, the analysis of their causes, the identification of driving factors, and the assessment of their impacts are complex, and existing research lacks a refined identification framework within a unified setting. Therefore, identifying the key drivers of storm surge direct economic losses and scientifically assessing the contribution of each influencing factor have important practical significance for sustainable coastal zone management and disaster prevention and mitigation decision-making.
Existing research on the drivers and assessment of storm surge direct economic losses can be grouped into three strands. The first strand is the quantification of storm surge direct economic losses. The spatiotemporal distribution and variation of storm surge economic losses in coastal China have been characterized [1,2], and storm surge losses have been assessed for the South China Sea, the New York metropolitan area, and coastal China, respectively [3,4,5]. Direct and indirect losses of storm surge disasters have been separated using input–output models [6], and a data-augmentation-based assessment system has been proposed for regional direct economic losses from storm surge [7]. The second strand is the identification of loss drivers. Several studies have examined the driving effects of coastal economic development on storm surge direct economic losses [8,9,10], while the vulnerability of storm surge exposure in coastal China has been comprehensively assessed from a micro perspective, showing that the spatial heterogeneity of vulnerability is an important source of loss disparities [11,12]. Storm surge risk assessment methods for coastal counties have been developed, treating high water levels, surge, and inundation extent as the dominant factors affecting direct economic losses [3,13]. The third strand concerns evaluation models of influencing factors. Traditional evaluation techniques mainly include input–output models [6] and machine-learning algorithms [4,5,7]. A typhoon–rainstorm–storm surge–flood disaster chain model has been constructed, revealing the amplifying effect of multi-hazard superposition on direct losses [14], and the chain risk transmission of typhoon–storm surge–flood–dike breach has been further characterized [15].
Panel models can simultaneously exploit information from both the cross-sectional and time-series dimensions to accurately identify causal relationships among variables and have been widely applied in studies of macroeconomic growth [16], industrial economic development [17], and technological innovation [18,19]. Applying panel models to the study of storm surge direct economic losses can both horizontally compare loss differences across coastal provinces in the same period and vertically capture loss variations within the same province across years driven by changes in storm surge and socioeconomic conditions. It can also resolve the inherent low-frequency, high-loss, and many-zeros characteristics of storm surge direct economic losses through a two-stage model and correct endogeneity with instrumental-variable two-stage least squares [20,21], offering strong applicability for accurately identifying the effects of natural hazard factors and socioeconomic exposure conditions on storm surge direct economic losses.
Despite this progress, three gaps remain. First, existing studies largely treat storm surge direct economic losses as a single outcome and do not decompose the loss-generation process into the two distinct mechanisms of disaster occurrence and loss magnitude, so that the zero-inflated and right-skewed nature of the data is not explicitly modeled. Second, the few studies that adopt a selection or two-part framework do not confront the complete separation that arises when disaster occurrence is nearly determined by the hazard occurrence, and thus their first-stage coefficients are not separately identifiable. Third, the potential endogeneity of disaster prevention and mitigation expenditure is seldom addressed. This study aims to fill these gaps. Its originality lies in (i) decomposing the loss-generation process into a disaster-occurrence stage and a loss-magnitude stage within a unified two-stage panel framework, and (ii) explicitly diagnosing and interpreting complete separation in the first stage and instrumenting disaster prevention and mitigation expenditure to address reverse causality. The research objectives are to identify the key drivers of storm surge direct economic losses and to quantify the contribution of hazard intensity, exposure, and disaster prevention response. Consistent with the hazard-source–exposure–mitigation logic, we test two hypotheses: (H1) conditional on disaster occurrence, storm surge height—the core hazard-intensity variable—significantly amplifies the magnitude of direct economic losses; and (H2) the ordinary least squares (OLS) estimate of disaster prevention and mitigation expenditure is biased by reverse causality, such that the positive relationship is not robust to an instrumental-variable specification.
2. Background
A storm surge disaster is not a purely natural phenomenon; rather, it results from the interaction of hazard factors, exposure, and emergency response capacity under specific hazard-forming environments. According to the hazard-source–exposure–mitigation disaster logic rooted in disaster system theory, these factors jointly determine the magnitude of direct economic losses from storm surge processes. Under this framework, the destructive energy of hazards, the exposure and vulnerability of elements at risk, and the moderating effect of emergency response capacity jointly determine the magnitude of direct economic losses.
2.1. Influence Mechanism
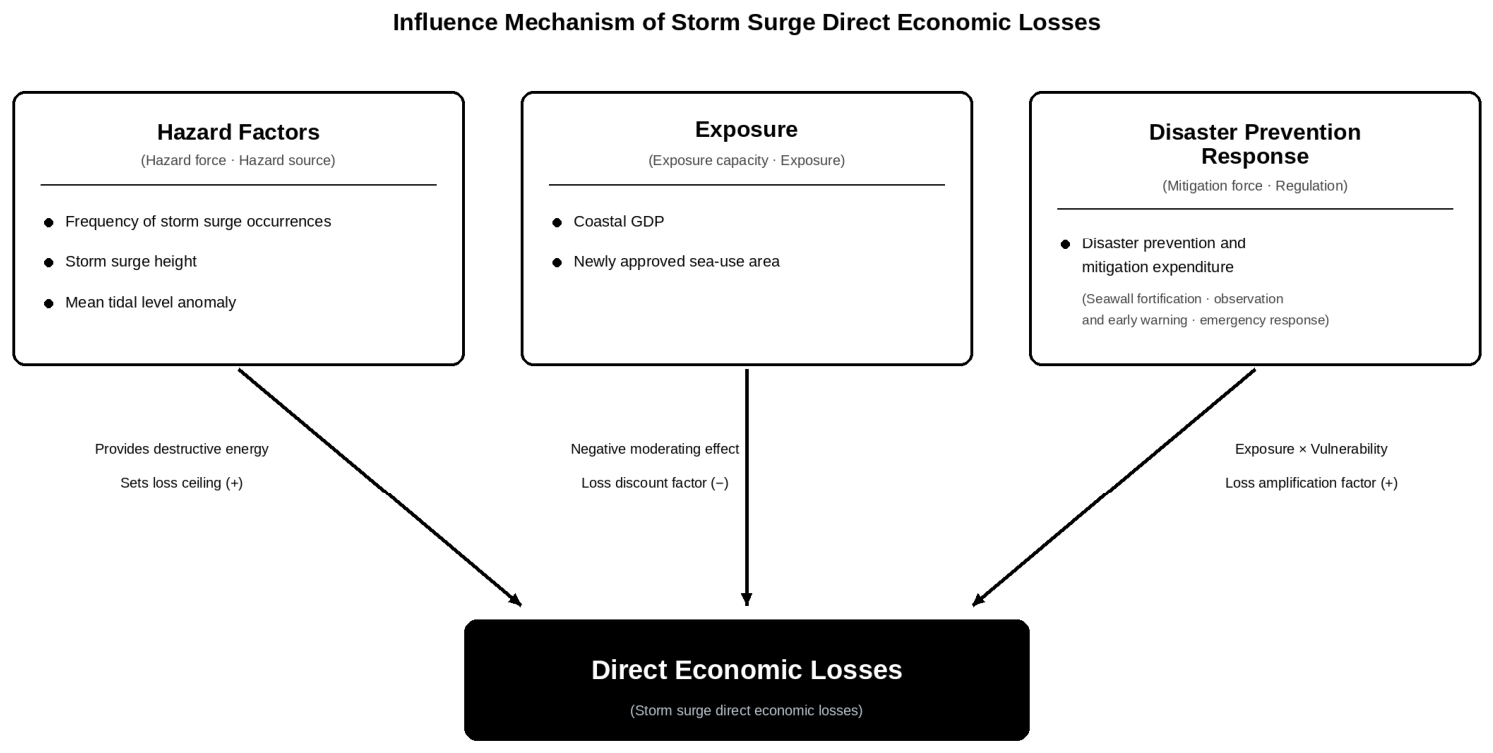
Direct economic losses from storm surge result from the coupling of hazard factors, exposure, and emergency response capacity: hazard factors provide destructive energy, the exposure and vulnerability of elements at risk determine the conversion ratio of energy into actual losses, and emergency response capacity exerts a negative moderating effect at the end of the chain, as illustrated in Figure 1.
Figure 1.
Influence mechanism of storm surge direct economic losses.
2.1.1. Hazard Factors
Hazard factors are the driving force of storm surge disasters, and their intensity determines the potential inundation depth and impact force. They are characterized by variables including storm surge frequency, storm surge height, and the mean tidal level anomaly. This hazard-intensity characterization is consistent with risk-assessment studies that treat surge height, high water levels, and inundation extent as the dominant drivers of direct losses [3,13] and with disaster-chain models of multi-hazard superposition [14,15].
(1) Storm surge frequency. The frequency directly determines how often the exposure is impacted within a year, measuring the effect of hazard factors from the “how often” dimension.
(2) Storm surge height. Wind stress from typhoons or extratropical cyclones transports water shoreward and, combined with the suction effect of the low-pressure center on the sea surface, causes abnormal sea-level rise that determines the inundation extent and depth, measuring the effect of hazard factors from the “how strong” dimension.
(3) Mean tidal level anomaly. Although astronomical tides are periodic and predictable ocean phenomena, whether they coincide in phase with storm surge is also key to determining disaster intensity. This study uses the mean tidal level anomaly to characterize the relative height of astronomical tides.
2.1.2. Exposure Factors
Exposure comprises the property, facilities, and economic activities within the influence of storm surge and determines the carrying basis for converting hazard factors into actual losses. It is characterized by coastal GDP and sea-use area. This exposure characterization follows the empirical literature linking coastal economic development and asset concentration to storm surge losses [8,9,10] and the vulnerability assessments of exposed coastal assets [11,12].
(1) Coastal GDP. It reflects the overall scale of asset stock and economic activity. The larger the economic scale and the higher the concentration of coastal assets, the more elements at risk in the hazardous zone, and the greater the potential losses under the same hazard intensity. This study uses coastal GDP to characterize it.
(2) Sea-use area. It reflects the intensity of sea development and the density of sea-use activities. The larger the sea-use area, the denser the port, coastal engineering, land reclamation, and aquaculture activities. This study uses the newly approved sea-use area to characterize it.
2.1.3. Emergency Response Capacity Factors
Emergency response capacity weakens the impact of hazard factors on exposure through engineering and non-engineering means, typically characterized by disaster prevention and mitigation expenditure. It covers the construction and maintenance of coastal protection works such as seawalls and the operation of marine observation and early-warning systems. Its mechanism includes two aspects: first, by improving coastal protection construction, it directly reduces inundation depth and extent, serving as the most direct means of reducing losses; second, by enhancing emergency response efficiency, it shortens the exposure duration of elements at risk, constituting a discount factor for direct economic losses. The mitigating role of emergency response capacity is consistent with the disaster-system view that prevention and protection measures dampen the conversion of hazard energy into realized losses [13].
2.2. Related Literature on Disaster Loss Assessment Methods
Beyond the storm surge literature, a growing body of work applies artificial intelligence (AI), machine learning (ML), and advanced statistical methods to disaster risk assessment and economic loss estimation. Machine-learning approaches—including random forests, gradient boosting, and neural networks—have been used to predict storm surge inundation and to estimate damage at high spatial resolution, complementing process-based hydrodynamic models [4,5,7]. Bayesian networks and disaster-chain models have been developed to propagate risk across cascading hazards [14,15]. In parallel, statistical methods designed for zero-inflated and right-skewed outcomes—such as Hurdle models, Heckman-type selection models, and Tobit models—have been widely adopted in the broader disaster economics and environmental economics literatures, where losses are frequently zero for a substantial share of observations and positive and highly skewed otherwise. Recent studies also examine how technological capacity and institutional conditions shape environmental and disaster outcomes [22]. These methodological developments inform the present study in two respects. First, they motivate the two-stage decomposition: a single equation cannot simultaneously explain why a disaster occurs and how large the resulting loss is. Second, they caution that machine-learning predictors, while flexible, are less transparent for causal inference than parametric panel models with explicit endogeneity correction; the present study therefore adopts a parametric two-stage panel framework whose mechanisms and coefficients are directly interpretable and whose endogeneity is addressed through instrumental variables.
2.3. Variable Settings
Hazard factors, exposure, and emergency response capacity are not simply additive. Based on the mechanism pathways and influencing factors above, the relationship can be expressed as:
where L denotes storm surge direct economic losses; H denotes hazard-factor intensity; E denotes the combined effect of exposure and vulnerability; and M denotes disaster prevention and mitigation expenditure.
L = f(H, E, M)
The influencing factors of storm surge direct economic losses are shown in Table 1. The dependent variable is storm surge direct economic losses; the hazard-factor explanatory variables include storm surge frequency, storm surge height, and mean tidal level anomaly; the exposure variables include coastal GDP and newly approved sea-use area; and the disaster prevention response variable is disaster prevention and mitigation expenditure. The explanatory and control variables are selected so that each maps onto one of the three theoretical dimensions of the framework—hazard intensity, exposure, and emergency response—thereby giving the estimated coefficients a direct structural interpretation.
Table 1.
Variable system of storm surge direct economic losses.
3. Data and Methods
3.1. Data Sources and Variable Definitions
This study takes 11 coastal provinces in China as the research object, with a sample period of 2001–2024, forming a balanced panel of 11 cross-sections and 24 periods, totaling 264 observations. Among the variables, storm surge direct economic losses and storm surge frequency are obtained from the China Marine Disaster Bulletin of various years; coastal GDP is obtained from the China Statistical Yearbook and the provincial statistical yearbooks of coastal provinces; newly approved sea-use area is obtained from the China Sea Area Use Statistical Bulletin; storm surge height and mean tidal level anomaly data are obtained from coastal tide-gauge-station observations; and disaster prevention and mitigation expenditure is obtained from the China Finance Yearbook and departmental final accounts of the Ministry of Finance. All nominal value variables are deflated to constant prices with 2001 as the base year.
The dependent variable, storm surge direct economic losses, is defined, following the China Marine Disaster Bulletin, as the monetary value of damage to houses, infrastructure, aquaculture, crops, and other property directly caused by storm surge events (excluding indirect and secondary losses) and is measured in ten-thousand CNY and expressed in logarithmic form in the loss-magnitude equation; observations with zero losses are excluded from the conditional (second) stage. Of the 264 province–year observations, 172 record positive direct economic losses and enter the second-stage estimation, while 92 are zero-loss observations. Because annual aggregation may conflate multiple distinct events, storm surge height is defined as the maximum storm surge height recorded in the province–year, and storm surge frequency is the count of storm surge processes recorded in that province–year. Disaster prevention and mitigation expenditure is defined as ex ante prevention and mitigation investment—the construction and maintenance of coastal protection works and the operation of marine observation and early-warning systems—and does not include ex post disaster relief or reconstruction spending, which would mechanically generate a positive contemporaneous association with losses. Missing values are imputed by linear interpolation; outlier observations beyond three standard deviations are winsorized rather than dropped to preserve the panel balance. The stationarity of the main variables is examined using panel unit-root tests, and serial correlation within provinces is addressed through province-clustered standard errors together with year fixed effects.
This study sets coastal GDP, storm surge frequency, storm surge height, and disaster prevention and mitigation expenditure as explanatory variables, and newly approved sea-use area and mean tidal level anomaly as control variables.
3.2. Model Specification
3.2.1. Two-Stage Decomposition and Disaster-Occurrence Definition
Considering that storm surge direct economic loss data are right-skewed and contain many zeros, exhibiting low-frequency and high-loss characteristics, if a linear regression or a single-equation model were used, zeros would be interpreted as true zero losses. Therefore, the loss-generation process needs to be decomposed into two stages—whether a disaster occurs and the magnitude of losses. A disaster occurrence is defined as the recording of positive direct economic losses in a province–year, and the corresponding binary indicator is:
where yit denotes the storm surge direct economic losses of region i in year t.
dit = 1{ yit > 0 }
3.2.2. Disaster-Occurrence Probability Equation
A panel Probit model is used to characterize the disaster-occurrence probability. Whether a disaster occurs depends on whether hazard intensity crosses the hazard threshold, and the hazard-factor variables are included in the vector zit. The Probit specification is standard for binary-outcome panel models with an underlying latent threshold-crossing structure, in which a disaster is recorded once hazard intensity exceeds a latent threshold [23].
where zit is the vector of variables explaining the disaster-occurrence decision, including hazard variables such as storm surge frequency and storm surge height; γ denotes the parameters to be estimated; αi denotes the first-stage individual effect; and Φ(·) denotes the standard normal cumulative distribution function.
P(dit = 1|zit) = Φ(zit′γ + αi)
After the panel Probit model is estimated, the inverse Mills ratio is constructed:
where φ(•) denotes the standard normal density function, and λit measures the intensity with which an observation is selected into the disaster sample.
λit = φ(zit′γ + αi)/Φ(zit′γ + αi)
3.2.3. Loss-Magnitude Equation
Conditional on dit = 1, the magnitude of storm surge direct economic losses is modeled, with exposure and emergency response variables included in xit. Because storm surge direct economic losses are highly right-skewed, a log-linear specification is adopted. The log-linear form is standard in disaster-loss and damage-function studies: it mitigates the severe skewness of losses, yields coefficients that are directly interpretable as semi-elasticities (the approximate percentage change in losses per unit change in the regressor), and reduces the influence of extreme observations [9,24].
where xit denotes the variables explaining loss magnitude, including exposure and disaster prevention response; β denotes the parameters to be estimated; αi denotes the second-stage individual effect; and εit denotes the disturbance term.
lnyit = xit′β + αi + εit, dit = 1
If the error terms of the two stages are correlated, the inverse Mills ratio is added to the second-stage equation to correct selection bias:
where ρ denotes the correlation coefficient of the two-stage error terms and σε denotes the standard deviation of the second-stage error term. If the coefficient on λi is significantly different from zero, sample-selection bias exists and the correlated (Heckman-type) structure should be adopted; otherwise the two stages are independent and the Hurdle-type structure is appropriate.
lnyit = xit′β + αi + ρ•σε•λit + εit
3.2.4. Likelihood Decomposition
(1) Two-stage independent model (Hurdle-type). If the two stages are independent (ρ = 0), the joint likelihood decomposes into the product of two independent parts:
where f(•) is the conditional density function of the second-stage log losses. The first product corresponds to non-disaster observations (dit = 0), and the second to disaster observations (dit = 1); the two parts can be maximized separately.
L = Π{d = 0}[1 − Φ(zit′γ + αi)]•Π{d = 1}{Φ(zit′γ + αi)•f(lnyit|xit) }
(2) Two-stage correlated model (Heckman-type). If ρ ≠ 0—that is, unobservable factors simultaneously affect the disaster-occurrence probability and loss magnitude—the joint likelihood is:
L = Π{d = 0}[1 − Φ(zit′γ + αi)]•Π{d = 1}{(1/σε)•φ[(lnyit − xit′β − αi)/σε]•Φ[(zit′γ + αi + ρ(lnyit − xit′β − αi)/σε) /√(1 − ρ2)]}
Equation (8) follows the standard bivariate normal selection formulation, in which the conditional normalizing denominator is √(1 − ρ2), and it degenerates into the Hurdle-type likelihood of Equation (7) when ρ = 0.
3.2.5. Model Selection and Tests
(1) Individual-effect specification test. For panel data, it is necessary to determine whether unobservable individual effects exist and whether fixed or random effects should be adopted, typically using the Hausman test:
where βFE and βRE are the fixed-effects and random-effects estimators, respectively, and k is the number of coefficients to be tested. If the null hypothesis is rejected, fixed effects should be adopted; otherwise, random effects should be used.
H = (βFE − βRE)′[Var(βFE) − Var(βRE)]−1(βFE − βRE)~χ2(k)
(2) Two-stage estimation strategy. In the first stage, a random-effects Probit is adopted: the fixed-effects Probit estimator is biased in short panels because the Probit model lacks a sufficient statistic for individual effects, and the random-effects specification avoids the incidental-parameters problem. In the second stage, fixed effects are used to estimate the loss-magnitude equation, eliminating individual effects through the within transformation:
where ȳi and are the individual time means of the corresponding variables. The within transformation absorbs time-invariant province-specific differences, using only the within-individual time variation to identify the marginal effects of each variable, and year dummy variables are included to absorb time fixed effects.
(3) Non-nested test. To verify the necessity of the two-stage specification, the Vuong test is used to compare the non-nested fit of the two-stage model and a single Tobit model. The test statistic is:
where mi is the difference in the log-likelihood contribution of the two models for observation i, and sm is the sample standard deviation of the log-likelihood-ratio sequence. If V is significantly positive, the two-stage model significantly outperforms the single Tobit model. Because the observations are dependent within provinces over time, the log-likelihood contributions are not independent, and the reported Vuong statistic should be interpreted as descriptive rather than as a strict model-selection test; its direction and magnitude, rather than its exact p-value, are relied upon here. The individual-effect and model-selection tests follow the standard panel-data econometrics treatment [23], and the two-stage instrumental-variable estimation of panel models follows recent applications [20,21].
V = (1/√n)·Σimi/sm
3.2.6. Endogeneity and Instrumental Variable
Disaster prevention and mitigation expenditure may be endogenous to storm surge direct economic losses: in years with severe disaster losses, local governments tend to increase disaster prevention expenditure ex post, so the expenditure coefficient may be biased by reverse causality. To address this, instrumental-variable two-stage least squares (IV-2SLS) is applied to the loss-magnitude equation, using the first lag of disaster prevention and mitigation expenditure as the instrument for current expenditure. In the first stage, current expenditure is regressed on the instrument and all exogenous variables, and the first-stage F statistic is computed to test for weak instruments; in the second stage, the endogenous variable is replaced by its fitted value.
The first lag satisfies the relevance condition (a high first-stage F statistic), but its exclusion restriction must be interpreted cautiously: past expenditure may influence current losses through durable protective infrastructure such as seawalls and drainage systems and may also reflect a province’s historical disaster exposure and inherent vulnerability. The first-stage F statistic establishes relevance but does not validate the exclusion restriction. Accordingly, the IV results are interpreted as a specification-robustness exercise rather than as definitive causal estimates. The use of a lagged value follows the common practice in panel applications of employing lagged regressors as internal instruments [16,20]; however, a single lagged instrument cannot by itself establish the exclusion restriction, so the IV results are interpreted as a robustness exercise that tests the direction and stability of the expenditure effect rather than as a definitive causal estimate.
3.2.7. Statistical Inference
For robustness, cluster-robust standard errors are used to correct for within-province serial correlation and heteroscedasticity. Because the panel contains only 11 province clusters, conventional cluster-robust standard errors can be severely biased in small-cluster settings; we therefore supplement province-clustered and province–year two-way-clustered inference with a wild cluster bootstrap, which provides valid inference when the number of clusters is small [24].
4. Results
4.1. Descriptive Statistics
As shown in Table 2, storm surge direct economic losses exhibit obvious right skewness (skewness 4.421) and leptokurtosis (kurtosis 25.921), with a huge disparity between the minimum and maximum values. Zero values account for approximately 34.8% of the sample, consistent with the low-frequency, high-loss, and many-zeros distribution characteristics.
Table 2.
Statistical characteristics of storm surge direct economic loss indicators.
4.2. Bivariate Relationships
Before model estimation, this study examines the pairwise correlations among all variables included in the empirical models (Table 3). Because losses are severely right-skewed, the Spearman rank correlation is reported alongside the Pearson coefficient for correlations involving the dependent variable. Storm surge frequency (0.453) and storm surge height (0.341) show the strongest correlations with losses, consistent with their role as the core hazard-intensity drivers. Among the explanatory variables, the largest pairwise correlation is between coastal GDP and disaster prevention expenditure (0.637); the corresponding variance inflation factors (VIFs) are all below 2.2, well under the conventional threshold of 10, indicating that multicollinearity does not materially affect the second-stage specification.
Table 3.
Pairwise correlation matrix among the variables (full sample, N = 264).
4.3. Two-Stage Model Results
In a non-nested model comparison, the log-likelihood of the two-stage model is −2120.44, while that of the single Tobit model is −2418.92; the Vuong statistic is 7.716. This descriptive comparison favors the two-stage model, consistent with the theoretical argument that the loss-generation process decomposes into two mechanisms.
The first stage is the disaster-occurrence probability equation. From the data characteristics, there is a nearly deterministic correspondence between storm surge frequency and disaster occurrence: when the frequency is 0, the disaster ratio is 0; when the frequency is greater than or equal to 1, the disaster ratio reaches 92.6% or higher (Table 4). This indicates that whether a disaster occurs is largely determined directly by whether a storm surge process occurs, and the first-stage disaster-occurrence probability equation suffers from complete separation, so the coefficient on storm surge frequency cannot be identified. That is, at the annual provincial scale, the presence or absence of a storm surge process, rather than its intensity, is the decisive factor in the disaster-occurrence state. Because the disaster-occurrence state is effectively determined by the hazard occurrence itself, the first stage does not yield an identifiable probability model of the translation from a physical storm surge event into an economic disaster. The present study therefore focuses on identifying the second stage—the loss-magnitude equation conditional on disaster occurrence.
Table 4.
Storm surge frequency and disaster ratio.
In the model specification test, the Hausman test statistic for the second-stage loss-magnitude equation is 20.99, significantly rejecting the null hypothesis that individual effects are uncorrelated with the explanatory variables at the 1% level (p = 0.002). Under the robust Hausman test proposed by Wooldridge [23], the Wald statistic is 18.24 (p = 0.006), with a consistent conclusion. The second-stage loss-magnitude equation is therefore estimated with two-way fixed effects, and the results are shown in Table 5. From the Hurdle-type (two-stage independent) specification, the coefficient on storm surge height is 0.0148, significantly positive at the 5% level, indicating that each 1 cm increase in storm surge height raises storm surge direct economic losses by approximately 1.5% on average (exp(0.0148) − 1 ≈ 1.5%, because the dependent variable enters in logarithmic form and the coefficient is therefore a semi-elasticity). The coefficient on disaster prevention and mitigation expenditure is 0.722, significantly positive at the 5% level, which is contrary to the theoretical expectation that disaster prevention expenditure reduces losses; this pattern is consistent with reverse causality, in which more severe loss years attract greater ex post expenditure. The coefficients on coastal GDP, newly approved sea-use area, and mean tidal level anomaly are all insignificant.
Table 5.
Estimation results of the second-stage loss-magnitude equation.
In the Heckman-type (with inverse Mills ratio) specification, the coefficient on the inverse Mills ratio is significant at the 1% level. However, because the first-stage disaster-occurrence equation exhibits complete separation, the inverse Mills ratio and the sample-selection-correction term cannot be effectively identified in this application; the statistical significance of the inverse Mills ratio therefore cannot be interpreted as evidence of a genuine selection process. This does not by itself establish that the two stages are independent, but it does mean that the Heckman-type specification is not estimable with reliable precision here. Accordingly, this study adopts the Hurdle-type specification as the baseline and treats the Heckman-type specification as a descriptive comparison; the selection issue is further discussed in Section 5.3.
4.4. Endogeneity Treatment: IV-2SLS Estimation
To address the reverse-causality problem of disaster prevention and mitigation expenditure, this study uses the first lag of expenditure as the instrument and employs fixed-effects two-stage least squares (FE-2SLS); the results are shown in Table 6. The first-stage F statistic is 110.79, indicating no weak-instrument problem. After correction, the coefficient on disaster prevention and mitigation expenditure drops sharply from 0.722 (significant at the 5% level) to 0.250 and is no longer significant. Because the standard error of the IV estimate is substantially larger than that of the OLS estimate, this loss of significance could reflect either the removal of reverse-causality bias or simply the lower precision of the IV estimator and the untestable exclusion restriction of the lagged instrument. The conclusion is therefore limited to the statement that the positive OLS relationship is not robust to the proposed IV specification, and does not by itself identify a genuine negative causal effect of prevention expenditure. Meanwhile, the coefficient on storm surge height remains significantly positive under both the OLS and IV-2SLS specifications (0.0148 and 0.0152), indicating that the positive driving effect of storm surge height on loss magnitude is robust and that it is the most robust hazard driver of loss magnitude conditional on disaster occurrence.
Table 6.
IV-2SLS estimation results of disaster prevention and mitigation expenditure (instrument: first lag of expenditure).
4.5. Robustness Checks
To test the robustness of the core conclusions, this study conducts checks in terms of replacing the dependent variable, winsorizing losses, excluding extreme samples, changing standard errors, and modifying the model specification (Table 7). Overall, the positive driving effect of storm surge height on loss magnitude remains significantly positive under all robustness specifications, with the coefficient stable in the range of 0.0136–0.0253, making it the most robust hazard driver of loss magnitude conditional on disaster occurrence. The coefficient on disaster prevention and mitigation expenditure is significantly positive in most specifications but becomes insignificant under two-way-clustered standard errors or after extreme provinces are excluded, consistent with the judgment that its OLS estimate may reflect reverse causality.
Table 7.
Robustness check results (second-stage loss-magnitude equation).
Under wild cluster bootstrap inference with only 11 clusters, the storm surge height coefficient remains statistically significant at conventional levels, whereas the expenditure coefficient does not, reinforcing the conclusion that the expenditure effect is not robust to small-cluster-robust inference.
5. Discussion
5.1. Comparison with Previous Studies
Our finding that storm surge height is the most robust driver of loss magnitude is consistent with the risk-assessment literature that treats surge height, high water levels, and inundation extent as dominant hazard-intensity factors [3,13], and with machine-learning assessments in which surge characteristics are among the most informative predictors [4,5]. At the same time, our result that coastal GDP and sea-use area are insignificant in the loss-magnitude equation differs from studies that emphasize the driving role of coastal economic development [8,9,10]. This discrepancy likely reflects two features of our design: the within-province fixed-effects specification absorbs time-invariant exposure differences and identifies only time variation, and our exposure measures (annual coastal GDP flow and newly approved sea-use area) are coarse proxies for the stock of exposed assets. Finally, the non-robust, often positive association between prevention expenditure and losses echoes the reverse-causality concern documented in the disaster economics literature, in which ex post funding responds to past losses. The contribution of this study is therefore not a new loss-estimation model per se, but the explicit decomposition of the loss-generation process into a deterministic occurrence stage and an estimable loss-magnitude stage, together with a transparent account of the endogeneity of prevention expenditure that reconciles the otherwise puzzling positive expenditure–loss association with reverse causality.
5.2. Implications
The results carry three implications for sustainable coastal zone management. First, because disaster occurrence at the annual provincial scale is nearly determined by hazard occurrence, policy should concentrate on monitoring and early warning of hazard processes rather than on predicting the occurrence margin. Second, because storm surge height is the most robust and quantitatively meaningful driver of loss magnitude, refined monitoring and forecasting of surge height—including its phase alignment with astronomical tides—offers the highest-value target for reducing losses. Third, the difficulty of identifying a robust mitigating effect of prevention expenditure at the annual provincial scale implies that more precise special-purpose expenditure measures and longer-lag engineering-capacity stock data (e.g., seawall compliance rates) are needed before prevention spending can be credibly credited with loss reduction. These measures follow directly from the empirical results: because only storm surge height is robustly and quantitatively associated with loss magnitude, the highest-return investments are those that improve the measurement and prediction of surge height, whereas broad-based prevention spending—whose marginal benefit could not be established at the annual provincial scale—should be evaluated with more precise special-purpose expenditure data before its effectiveness is credited.
5.3. Limitations
Several limitations qualify the results. First, the first-stage disaster-occurrence equation exhibits complete separation: because disaster occurrence is defined mechanically as the recording of positive losses and storm surge frequency is a near-perfect predictor of such recording, the first stage cannot identify the probability that a physical storm surge event translates into an economic disaster, and the selection process between the two stages remains unresolved. Alternative approaches—such as penalized or rare-events logit models, correlated random-effects specifications, or event-level data—may be better suited to characterizing this margin and should be explored in future work. Second, the exclusion restriction of the lagged expenditure instrument is untestable and may be violated by durable protective infrastructure, so the IV results are best interpreted as robustness evidence rather than definitive causal estimates. Third, annual aggregation conflates multiple storm surge events and may obscure the physical relationship between event-level hazard intensity and damage; event-level data would permit cleaner identification. Fourth, the exposure measures—coastal GDP (a broad flow variable) and newly approved sea-use area (an annual increment rather than a stock of exposed assets)—do not capture population density, capital stock, land use, coastal construction, urbanization, or protective infrastructure, and same-year GDP may itself be affected by the disaster. Fifth, the Vuong statistic is reported descriptively given the panel dependence of the likelihood contributions, and its exact p-value should not be over-interpreted. Finally, the small number of provinces limits the precision of cluster-robust inference, motivating our use of a wild cluster bootstrap. Complete separation also has a specific implication for the estimates: the maximum-likelihood coefficient on storm surge frequency diverges, the first-stage Probit is identified only by the few discordant observations, and consequently no reliable inverse Mills ratio or selection-correction term can be constructed. The second-stage loss-magnitude estimates are therefore identified conditional on the observed occurrence state rather than through a selection equation, which is precisely why the Hurdle-type specification is adopted.
6. Conclusions
Using a balanced panel of 11 coastal provinces in China over 2001–2024, this study decomposes the generation of storm surge direct economic losses into two stages and yields three main findings. First, at the annual provincial scale, disaster occurrence is determined nearly deterministically by whether a storm surge process occurs, so the first stage exhibits complete separation and is not separately identifiable. Second, conditional on disaster occurrence, storm surge height is the most robust positive driver of loss magnitude, each centimeter raising direct economic losses by approximately 1.5% on average. Third, the positive OLS effect of disaster prevention and mitigation expenditure is not robust to an instrumental-variable specification, indicating that its OLS estimate likely reflects reverse causality rather than a genuine loss-increasing effect.
These results imply that storm surge disaster management should distinguish the occurrence stage from the loss-magnitude stage: the former relies on monitoring and early warning of hazard processes, whereas the latter should target refined monitoring and forecasting of hazard intensity such as storm surge height, together with longer-term engineering-based mitigation capacity. Future work should introduce hazard-condition variables (e.g., the phase alignment of astronomical tides) and engineering-capacity variables (e.g., seawall compliance rates) and should pursue event-level data and estimation approaches suited to the rare-events and complete-separation features identified here. Overall, these findings inform evidence-based disaster risk reduction and resilience building, contributing to sustainable coastal development.
Author Contributions
Conceptualization, L.D. and S.N.; methodology, L.D. and H.X.; validation, L.D., M.Q. and J.Z.; formal analysis, L.D.; data curation, Y.S.; writing—original draft preparation, L.D. All authors have read and agreed to the published version of the manuscript.
Funding
This research was funded by the Ministry of Science and Technology of the People’s Republic of China, “Multi-scale dynamic environmental change effects in the Beibu Gulf,” grant number 2026XNKK0500, and National Key R&D Program of China, grant number 2022RDC2013304.
Institutional Review Board Statement
Not applicable.
Informed Consent Statement
Not applicable.
Data Availability Statement
The original contributions presented in this study are included in the article. Further inquiries can be directed to the corresponding author.
Conflicts of Interest
The authors declare no conflicts of interest.
References
- Fang, J.; Liu, W.; Yang, S.; Brown, S. Spatial-temporal changes of coastal and marine disasters risks and impacts in Mainland China. Ocean Coast. Manag. 2017, 139, 125–140. [Google Scholar] [CrossRef] [Scilit]
- Lin, J.; Xu, Y.; Hou, Y.; Xue, X. Spatio-temporal distribution, composition and influencing factors of economic losses of storm surge disasters in China. Int. J. Disaster Risk Reduct. 2023, 90, 103669. [Google Scholar] [CrossRef] [Scilit]
- Zhang, Y.; Zhang, T.; Shen, W.; Ou, Z.; Zhang, J. Economic loss assessment of typhoon-induced storm surge disasters in the South China Sea. Front. Earth Sci. 2023, 11, 1258524. [Google Scholar] [CrossRef] [Scilit]
- 4.; Ayyad, M.; Hajj, M.; Marsooli, R. Machine learning-based assessment of storm surge in the New York metropolitan area. Sci. Rep. 2022, 12, 23627. [Google Scholar] [CrossRef] [Scilit] [PubMed]
- Zhang, S.; Zhang, J.; Li, X.; Du, X.; Zhao, T.; Hou, Q.; Jin, X. Estimating the grade of storm surge disaster loss in coastal areas of China via machine learning. Ecol. Indic. 2022, 136, 108533. [Google Scholar] [CrossRef] [Scilit]
- Jin, X.; Sumaila, U.; Yin, K. Direct and indirect loss evaluation of storm surge disaster based on static and dynamic input-output models. Sustainability 2020, 12, 7347. [Google Scholar] [CrossRef] [Scilit]
- Sun, H.; Wang, J.; Ye, W. A data augmentation-based evaluation system for regional direct economic losses of storm surge disasters. Int. J. Environ. Res. Public Health 2021, 18, 2918. [Google Scholar] [CrossRef] [Scilit] [PubMed]
- Yang, L.; Han, K.; Chen, Z. Study on the dynamic relationship between coastal economic growth and marine disaster losses. Sci. Geogr. Sin. 2015, 35, 969–975. (In Chinese) [Google Scholar]
- Yi, X.; Sheng, K.; Wang, Y.; Wang, S. Can economic development alleviate storm surge disaster losses in coastal areas of China? Mar. Policy 2021, 129, 104531. [Google Scholar] [CrossRef] [Scilit]
- Lin, J.; Wang, S.; Zhao, Y.; Xue, X. The inequality of economic development increases the direct economic loss of storm surge disasters. Ocean Coast. Manag. 2024, 258, 107427. [Google Scholar] [CrossRef] [Scilit]
- Yuan, H.; Lyu, Y.; Zhang, S. Analysis of aquaculture farmers’ adaptation behavior toward typhoon disaster in Zhoushan Islands and Dongtou Islands and its influencing factors. J. Nat. Resour. 2022, 37, 1089. (In Chinese) [Google Scholar] [CrossRef] [Scilit]
- Liu, X.; Liu, Y.; Wang, Z.; Yang, X.; Zeng, X.; Meng, D. Comprehensive assessment of vulnerability to storm surges in coastal China: Towards a prefecture-level framework. Remote Sens. 2023, 15, 4828. [Google Scholar] [CrossRef] [Scilit]
- Shi, X.; Qiu, J.; Chen, B.; Zhang, X.; Guo, H.; Wang, J.; Bei, C. Storm surge risk assessment method for a coastal county in China: Case study of Jinshan District, Shanghai. Stoch. Environ. Res. Risk Assess. 2020, 34, 627–640. [Google Scholar] [CrossRef] [Scilit]
- Wan, J.; Wang, L.; Yue, Y.; Wang, Z. Quickly assess the direct loss of houses caused by a typhoon-rainstorm-storm surge disaster chain. Water 2022, 14, 3037. [Google Scholar] [CrossRef] [Scilit]
- Wang, T.; Tan, X.; Chen, X.; Huang, X.; Tian, Y.; Xiao, P.; Wang, W. A Bayesian network-based risk assessment model for the typhoon-storm surge-flood-dike burst disaster chain. SSRN Prepr. 2024. [Google Scholar] [CrossRef] [Scilit]
- Zhang, X.; Luo, P. Medium- and long-term credit, state-owned economy and total factor productivity: An IV-2SLS empirical study based on provincial panel data. Economist 2013, 12, 42–50. (In Chinese) [Google Scholar] [CrossRef]
- Sun, C.; Zhang, W. Outward foreign direct investment and industrial green transformation: An empirical study based on China’s provincial panel data. J. Beijing Inst. Technol. 2022, 24, 103–117. (In Chinese) [Google Scholar]
- Nababan, T.S. Unveiling the simultaneous relationship between economic growth and employment opportunity: A panel TSLS approach. Front. Res. 2026, 6, 89–105. [Google Scholar] [CrossRef] [Scilit]
- Zhao, J.; Hou, L.; Wang, Y. Theoretical model and configuration paths of new quality productive forces cultivation: A fuzzy-set qualitative comparative analysis (fsQCA) based on China’s provincial dynamic panel. Sci. Technol. Manag. Res. 2026, 46, 1–11. (In Chinese) [Google Scholar]
- Cui, G.; Norkutė, M.; Sarafidis, V.; Yamagata, T. Two-stage instrumental variable estimation of linear panel data models with interactive effects. Econom. J. 2022, 25, 340–361. [Google Scholar] [CrossRef] [Scilit]
- Adesina, F.I.; Ikpefan, O.A.; Ehikioya, B.I. Dynamics of regulatory capital and bank performance in Nigeria using the Driscoll-Kraay and fixed effects-2SLS approaches. J. Risk Financ. Manag. 2026, 19, 658. [Google Scholar] [CrossRef] [Scilit]
- Kilinc, N.; Proskuryakova, L.N. Assessing the influence of innovation and digitalization on carbon footprint across the Middle East, North Africa, and South Caucasus regions. Nat. Resour. Forum 2026, e70068. [Google Scholar] [CrossRef] [Scilit]
- Wooldridge, J.M. Econometric Analysis of Cross Section and Panel Data; MIT Press: Cambridge, MA, USA, 2002. [Google Scholar]
- Cameron, A.C.; Gelbach, J.B.; Miller, D.L. Bootstrap-based improvements for inference with clustered errors. Rev. Econ. Stat. 2008, 90, 414–427. [Google Scholar] [CrossRef] [Scilit]

Disclaimer/Publisher’s Note: The statements, opinions and data contained in all publications are solely those of the individual author(s) and contributor(s) and not of MDPI and/or the editor(s). MDPI and/or the editor(s) disclaim responsibility for any injury to people or property resulting from any ideas, methods, instructions or products referred to in the content. |
© 2026 by the authors. Licensee MDPI, Basel, Switzerland. This article is an open access article distributed under the terms and conditions of the Creative Commons Attribution (CC BY) license.