


Abstract
Green housing strategies are often selected based on climate-responsive principles or ranked through additive indicators, even when deficient infrastructure or material hazards should preclude deployment. This study develops a reproducible, non-compensatory regional screening framework for Mexico City, Tabasco, and Yucatán. The framework is a conceptual pre-feasibility instrument based on public secondary data; it is not a building certification, a parcel-level decision model, or a validated energy simulation. Official demographic, housing, climate, economics, labor, market, and industrial corridor evidence is integrated through transparent ordinal rules and veto conditions. Robustness was examined by varying every quantitative threshold by ±20% and by testing the ecological association between the 2024 housing backlog rate and basic service deprivation across Mexico’s 32 federal entities. The association was strong (Pearson r = 0.816, p < 0.001; Spearman ρ = 0.693, p < 0.001), while the three portfolio classes remained unchanged under the sensitivity test. In the focal cases, housing backlog affected 6.01% of the housing stock in Mexico City, 63.78% in Tabasco, and 13.94% in Yucatán; basic service deprivation affected 5.5%, 43.8%, and 30.1% of the respective populations. The resulting regional propositions are targeted infill and retrofit in Mexico City, safeguarded flood-resilient pilots in Tabasco, and infrastructure-linked growth in Yucatán. An explicit indicator-to-response matrix, a project baseline protocol, a financial screening equation, a stakeholder validation pathway, and post-occupancy KPIs establish the evidence required before investment. Economic opportunity is treated as enabling evidence, whereas essential services and material hazards retain veto power.
1. Introduction
Buildings are no longer a secondary focus of climate policy. The 2025–2026 Global Status Report for Buildings and Construction attributes approximately 37% of global energy- and process-related carbon dioxide emissions to the sector and links it to nearly one-half of global material extraction [1]. This burden is being amplified by climatic conditions that are moving beyond the historical baselines used to design much of the current housing stock: the World Meteorological Organization confirmed 2024 as the warmest year in the observational record, at about 1.55 °C above the 1850–1900 average [2]. For housing systems, this is not merely an emissions problem. It is simultaneously a question of thermal safety, household affordability, water security, infrastructure capacity, and spatial access to employment.
The environmental performance of social and affordable housing is governed by interacting rather than isolated variables. Recent systematic reviews identify envelope quality, indoor environmental quality, energy use, affordability, occupant behavior, maintenance, and institutional capacity as recurrent determinants [3,4]. Latin American evidence further shows that nominally efficient technologies may underperform when designs disregard climatic heterogeneity, user practices, or the fragmented implementation of building regulations [5,6]. A technically elegant dwelling can still be unsustainable if it is disconnected from jobs, unaffordable to operate, exposed to recurrent flooding, or delivered where water and sanitation networks are structurally deficient.
1.1. Mexico’s Bioclimatic and Housing Policy Problem
Mexico is an analytically demanding case because one national housing market contains sharply different thermal regimes, urban forms, incomes, hazards, and institutional capacities. Mexico City is characterized by its high altitude, a predominantly temperate subhumid climate, high land values, intense urban heat island effects, and a service-oriented economy. Tabasco is characterized by warm humid conditions, very high rainfall, hydrocarbon-linked production, and recurrent flood exposure. Yucatán is characterized by warm subhumid conditions, rapid metropolitan and industrial expansion, limestone geology, aquifer vulnerability, and hurricane risk. Treating these cases as variants of one design problem obscures the mechanisms that determine feasibility.
Building performance research already supplies a strong technical warning against uniform solutions. Parametric studies in tropical Mexican social housing show that orientation, solar control, natural ventilation, and envelope configuration can materially reduce cooling loads and discomfort [7]. A year-round rooftop shading intervention has likewise demonstrated the importance of controlling solar gains before adding mechanical capacity [8]. Forward-looking simulations for southeastern Mexico indicate that thermal comfort in social housing becomes more difficult under climate change, with results sensitive to envelope and operational variables [9]. Passive measures can reduce the incidence of energy poverty in the southeast, but their benefits depend on utility cost, income, and climate conditions [10,11]. A 2026 analysis across 13 Mexican climatic zones estimated annual modeled household energy requirements of approximately 3924–7377 kWh, with cooling responsible for roughly 53% of use, and 77% of evaluated cases exceeding a 10% energy burden threshold [12]. The justice problem is sharper than an access metric suggests: an electricity connection does not guarantee the affordable energy services required for health and comfort [13].
1.2. Research Gap, Objective, and Contributions
Three gaps remain. First, most building studies optimize a reference dwelling without testing whether the surrounding housing market, productive structure, and service networks can support deployment. Second, regional development narratives often infer housing opportunities from GDP, investment, or announced infrastructure while treating climate and basic services as secondary constraints. Third, feasibility studies frequently collapse heterogeneous dimensions into an additive index, allowing a strong economic score to compensate mathematically for a floodplain location or absent sanitation. That compensation may be convenient, but it is neither physically nor ethically defensible.
Green building rating systems operate primarily at the asset or project scale and commonly aggregate credits or weighted indicators; recent reviews show that indicator selection, weighting, regionalization, and life-cycle boundaries can materially alter a rating [14]. Within MCDA, AHP and TOPSIS are useful for preference elicitation and ranking but remain compensatory unless hard constraints are imposed; weighted fuzzy models likewise aggregate performance after constructing an indicator hierarchy [15,16]. PROMETHEE and ELECTRE permit outranking, incomparability, and veto thresholds, although they require more extensive preference elicitation and alternative-specific data [15,17]. Resident adoption evidence also demonstrates that a technically favorable score does not establish social acceptance [18]. The framework developed here occupies a narrower analytical niche: transparent regional triage using harmonized public data. It neither certifies buildings nor ranks detailed design alternatives; it determines which regional propositions merit parcel-level appraisal, and which must wait until service or hazard gates are resolved.
The main question is: how does green housing feasibility change when climatic fit, housing need, basic service readiness, productive momentum, market pressure, and industrial corridor geography are evaluated jointly without assuming that one can substitute for another? The aim is to construct and apply a transparent regional screening framework to Mexico City, Tabasco, and Yucatán. The article contributes by (i) positioning a veto-restricted screening logic relative to green building rating systems and compensatory, outranking MCDA; (ii) publishing traceable state indicators with explicit temporal and inferential boundaries; (iii) testing threshold sensitivity and the national association between housing backlog and basic service deprivation; (iv) mapping each regional indicator to a physical or institutional challenge and a conditional design response; and (v) specifying project-level simulation, financial, stakeholder, and post-occupancy validation requirements. The intended output is a conceptual pre-feasibility screen, not a direct building decision tool.
2. Materials and Methods
2.1. Comparative Design and Unit of Analysis
The present research uses a structured comparative case design. The primary unit of analysis is the federal entity because the most recent harmonized official indicators for GDP, housing deprivation, and mortgage market performance are reported at that scale. Industrial corridors and metropolitan nodes are treated as implementation geographies nested within each entity. The three cases were purposefully selected to maximize contrast in climate, urban structure, productive specialization, and housing conditions rather than to represent a statistically random sample of Mexico. The design supports analytical comparison and project screening; it does not estimate a national causal effect.
The assessment has four linked layers. The first characterizes long-run demographic change and current housing need. The second identifies climatic loads, passive design priorities, water harvesting potential, and non-negotiable hazards. The third evaluates market and productive momentum using state GDP, sectoral value added, FDI, labor conditions, and house price appreciation. The fourth combines the preceding evidence through decision rules that distinguish deployable opportunities, conditional opportunities, and contexts requiring safeguarded development project pilots. Precision is instead pursued through provenance, consistent units, transparent derivations, and explicit limitations.
2.2. Data Acquisition, Hierarchy, and Temporal Cut-Off
Data were reviewed through 7 October 2026. The source hierarchy was: (1) official federal statistics or program records; (2) official state planning documents; and (3) indexed peer-reviewed literature with persistent identifiers for building performance, decision analysis, and hazard interpretation. As shown on Table 1, for each indicator, the release, reference year, unit, and geographic scale were recorded. The most recent comparable observation was retained, but values from different years were not combined into a single numerical score.
Table 1.
Evidence base, temporal coverage, and analytical use.
2.3. Derived Indicators
Population change is described with compound annual growth rates (CAGRs), calculated for 1950–2020 and 2000–2020. Unlike a high-order polynomial, the CAGR is interpretable, bounded by observed endpoints, and is not presented as a forecast. Future population quantities should be taken directly from CONAPO’s cohort-component projection series [20], not generated by unconstrained extrapolation from eight census points.
where P0 and Pt are the populations at the beginning and end of the interval, and n is the number of elapsed years.
CAGR = (Pt/P0)1/n − 1
An indicative current-price state GDP was calculated by multiplying the state share reported by INEGI by the 2024 national GDP of MXN 33.507 trillion [24]. Because published state shares are rounded to one decimal place, these monetary values are suitable for scale comparison and charting but not fiscal reconciliation. Real growth rates, rather than the approximate nominal amounts, are used to classify productive momentum.
2.4. Non-Compensatory Feasibility Rules
The screening framework adopts non-compensatory decision support without manufacturing cardinal precision from three purposively selected cases. The method differs from AHP and TOPSIS because it does not elicit weights or calculate distance to an ideal alternative. It differs from a full PROMETHEE or ELECTRE exercise because it does not construct pairwise preference functions across a closed set of projects [15,17]. Instead, declared ordinal bands structure the regional diagnosis, and legally or physically material service and hazard conditions operate as vetoes. Rapid GDP growth cannot neutralize severe service deprivation, a floodplain, unsafe sanitation, or an unresolved structural hazard. Table 2 reports every rule, so another analyst can reproduce or contest the classification without a hidden coefficient.
Table 2.
Decision dimensions, thresholds, and veto logic.
2.5. Analytical Checks, Scale Boundary, and Temporal Alignment
Two quantitative checks were added. First, the 2024 housing backlog rate was computed for all 32 federal entities as backlog dwellings divided by total housing stock using SNIIV records [25]. It was paired with INEGI’s 2024 share of the population lacking basic housing services [26]. Pearson correlation tests linear association, while Spearman correlation tests rank monotonicity; two-sided p-values are reported. The analysis was ecological and cross-sectional: one variable was dwelling-based and the other population-based, so it did not identify household-level exposure or causality. Second, all quantitative classification boundaries were varied by ±20%, with changes in intermediate and final classes recorded in Appendix A.
The state was the unit of comparison, and the corridor was an implementation hypothesis, not an observed project site. State results can reject an implausible regional proposition or establish a due diligence agenda but cannot authorize a dwelling design. Advancement requires municipal or parcel data on hazards, water and sanitation capacity, land tenure and value, transport accessibility, household demand, construction cost, and applicable permits. Temporal alignment is interpretive rather than arithmetic: 2024 housing, deprivation, GDP, and FDI indicators form the principal evidence anchor, while 1H 2026 prices and 2026-Q1 labor conditions are reported as directional market signals and never pooled into a composite index.
2.6. Translation from Regional Evidence to Project-Level Requirements
Climate evidence is translated into testable pre-design hypotheses rather than universal construction prescriptions. No hourly building energy simulation was conducted in this regional study, and no numerical energy, comfort, or moisture benefit is claimed for the proposed packages. A project advancing beyond screening must compare an intervention with an otherwise identical code-minimum reference building on the same site, holding geometry, orientation, occupancy schedules, internal gains, infiltration, ventilation, HVAC efficiency and controls, tariffs, and emission factors constant. The protocol must use a documented current weather file and, where defensible downscaled data are available, mid-century SSP2-4.5 and SSP5-8.5 weather scenarios; outputs must include hourly operative temperature, adaptive comfort exceedance, cooling energy, peak demand, and high humidity exposure. This requirement follows Mexican optimization evidence [35] and future climate projections for Mexican single-family housing [36].
Regulatory compliance is treated as a minimum requirement, not proof of sustainability. NOM-020-ENER-2011 limits heat gains through residential envelopes [37], while a 2024 review identifies a broader but fragmented package of mandatory standards, voluntary systems, financing programs, and incentives [38]. Mexico’s New Housing NAMA demonstrates how whole building performance and affordable housing finance can be linked [39]. The proposed KPI system keeps mandatory compliance separate from stretch performance and post-occupancy verification.
2.7. Quality Control, Visual Provenance, and Reproducibility
All calculations used displayed units and public source values. The national correlation dataset, threshold sensitivity matrix, and methodological comparison are reported in Appendix A; the rainwater screening equation and its losses are isolated in Appendix B. Unconstrained extrapolations and exploratory graphics with incomplete historical metadata were not considered in the analysis, as avoiding arbitrary curve fitting ensures greater methodological validity and analytical rigor. No primary data, resident survey, Delphi panel, field measurement, or calibrated simulation was conducted; the manuscript is accordingly framed as a conceptual regional screening study with an explicit validation pathway.
3. Results
3.1. Demographic Trajectory and Housing Need
The long-run population series reveals divergent urbanization trajectories (Table 3). Between 1950 and 2020, Mexico City grew at an average annual rate of 1.591%, Tabasco at 2.738%, and Yucatán at 2.169%. The recent 2000–2020 interval is more consequential for present planning: Mexico City slowed to 0.340% per year, whereas Tabasco and Yucatán grew by 1.202% and 1.695%, respectively. These rates should not be read as forecasts. They indicate that housing pressure in Mexico City is increasingly shaped by replacement, household formation, affordability, and intra-metropolitan location, while southeastern demand still contains a stronger population growth component [19,20].
Table 3.
Observed population change in the three study regions.
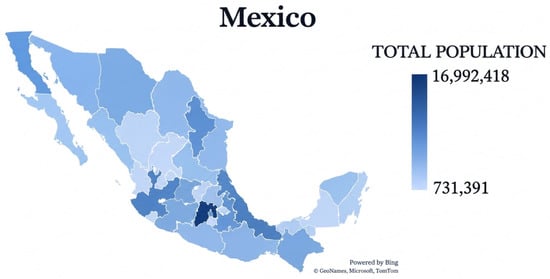
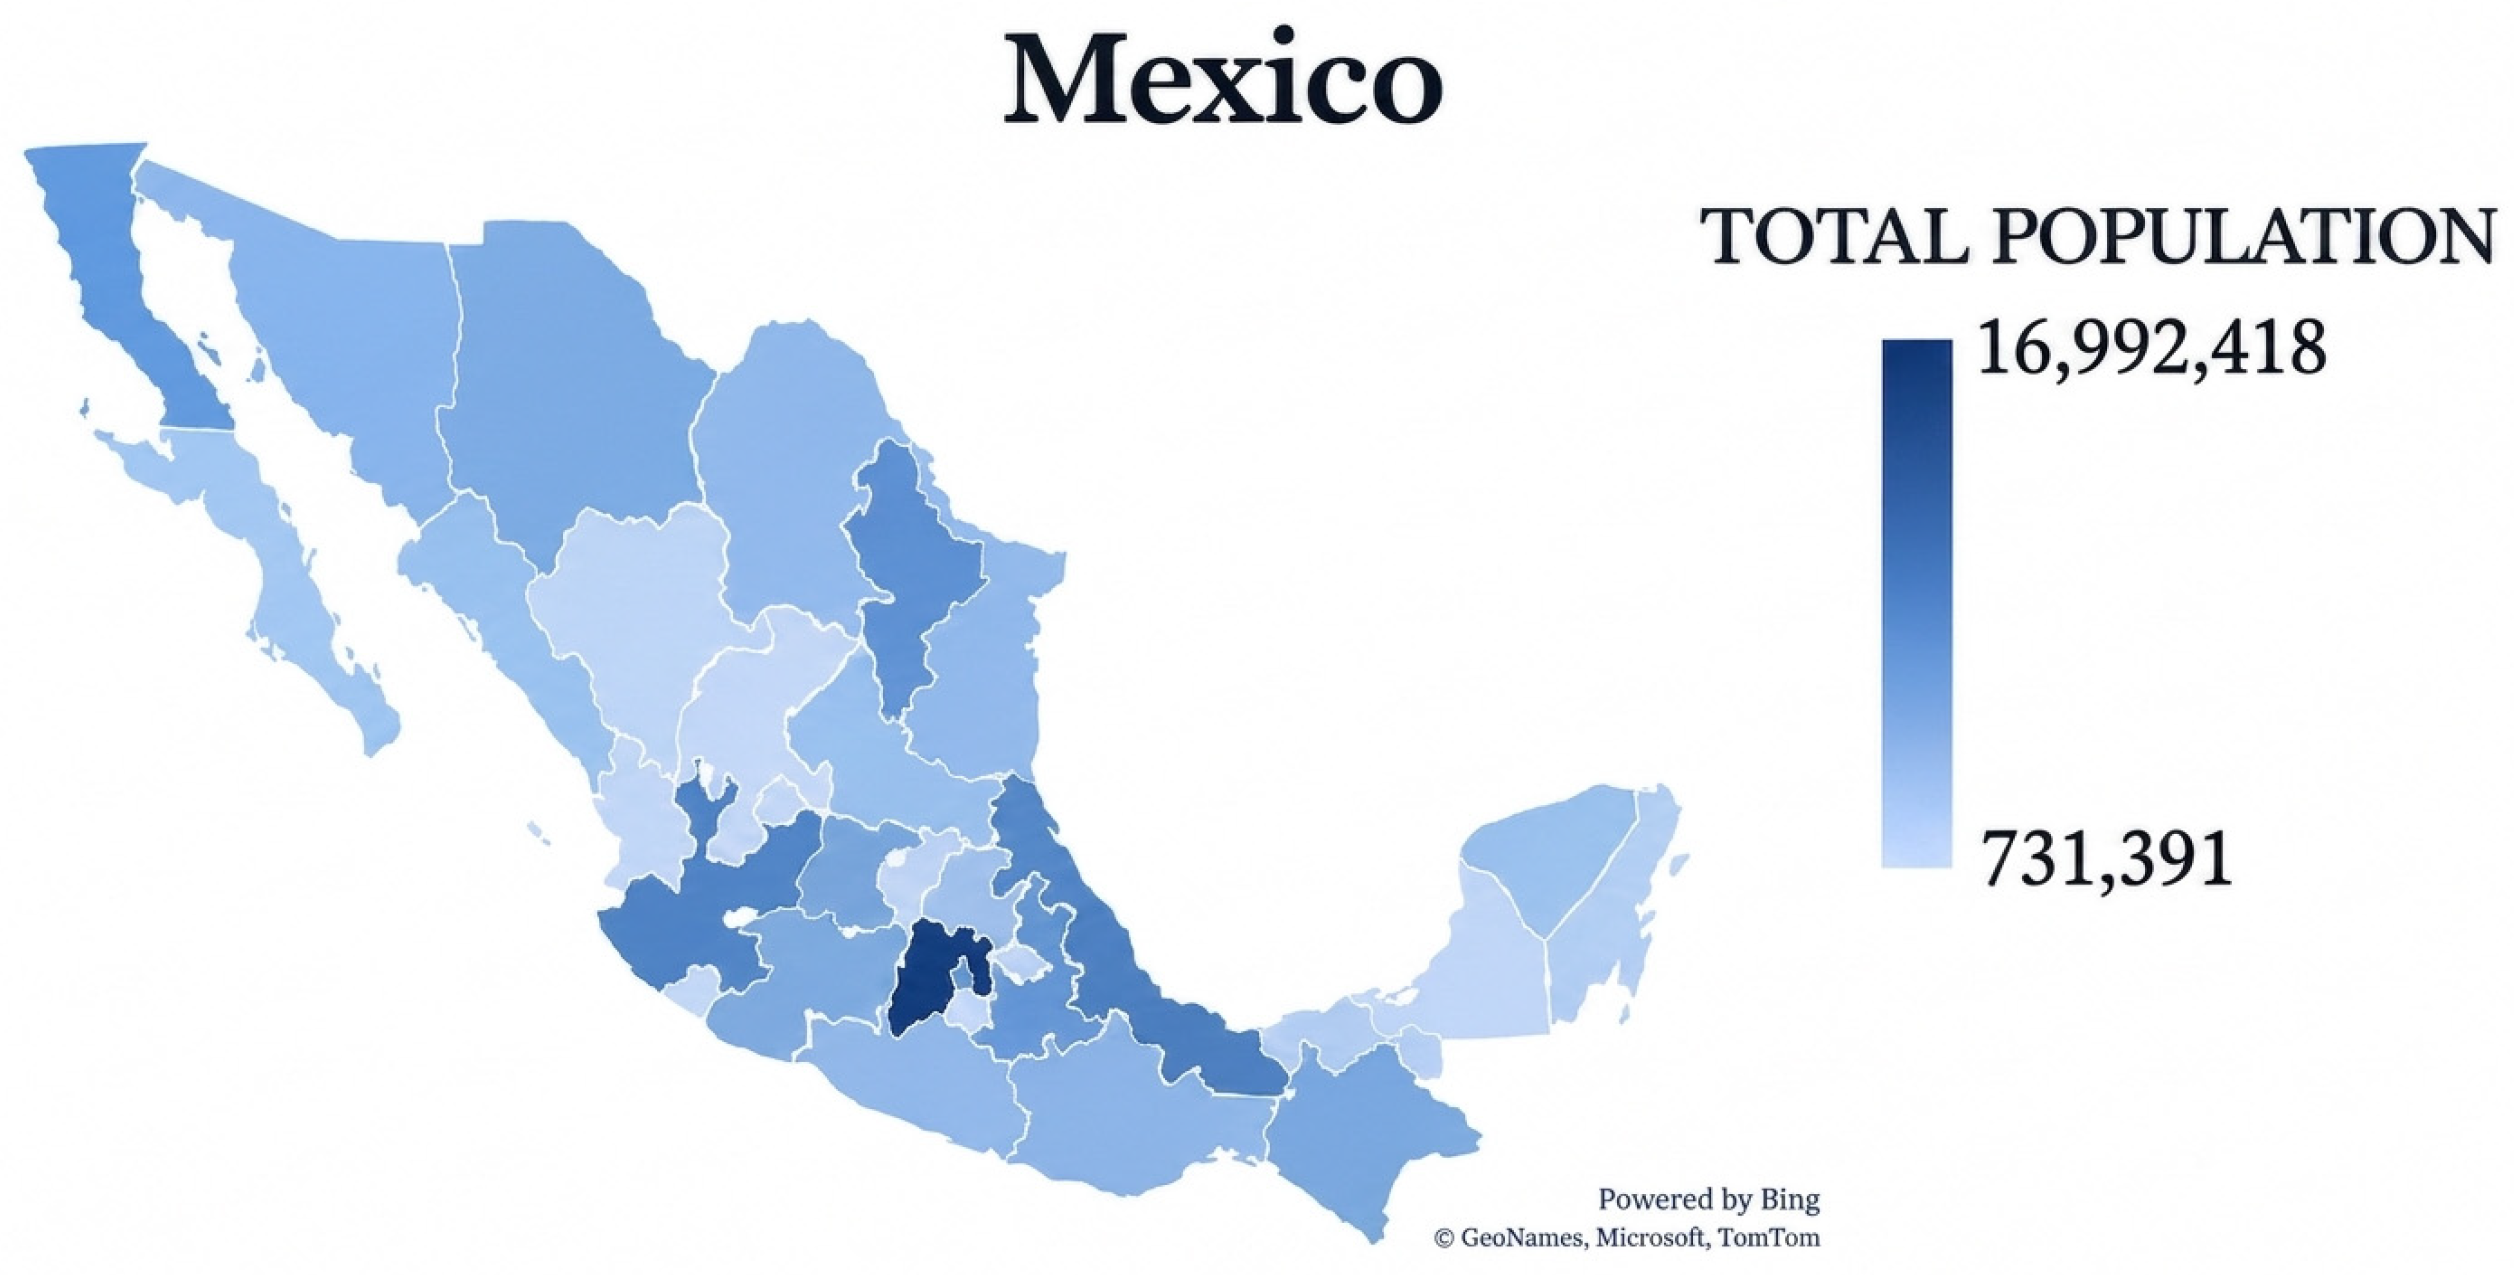
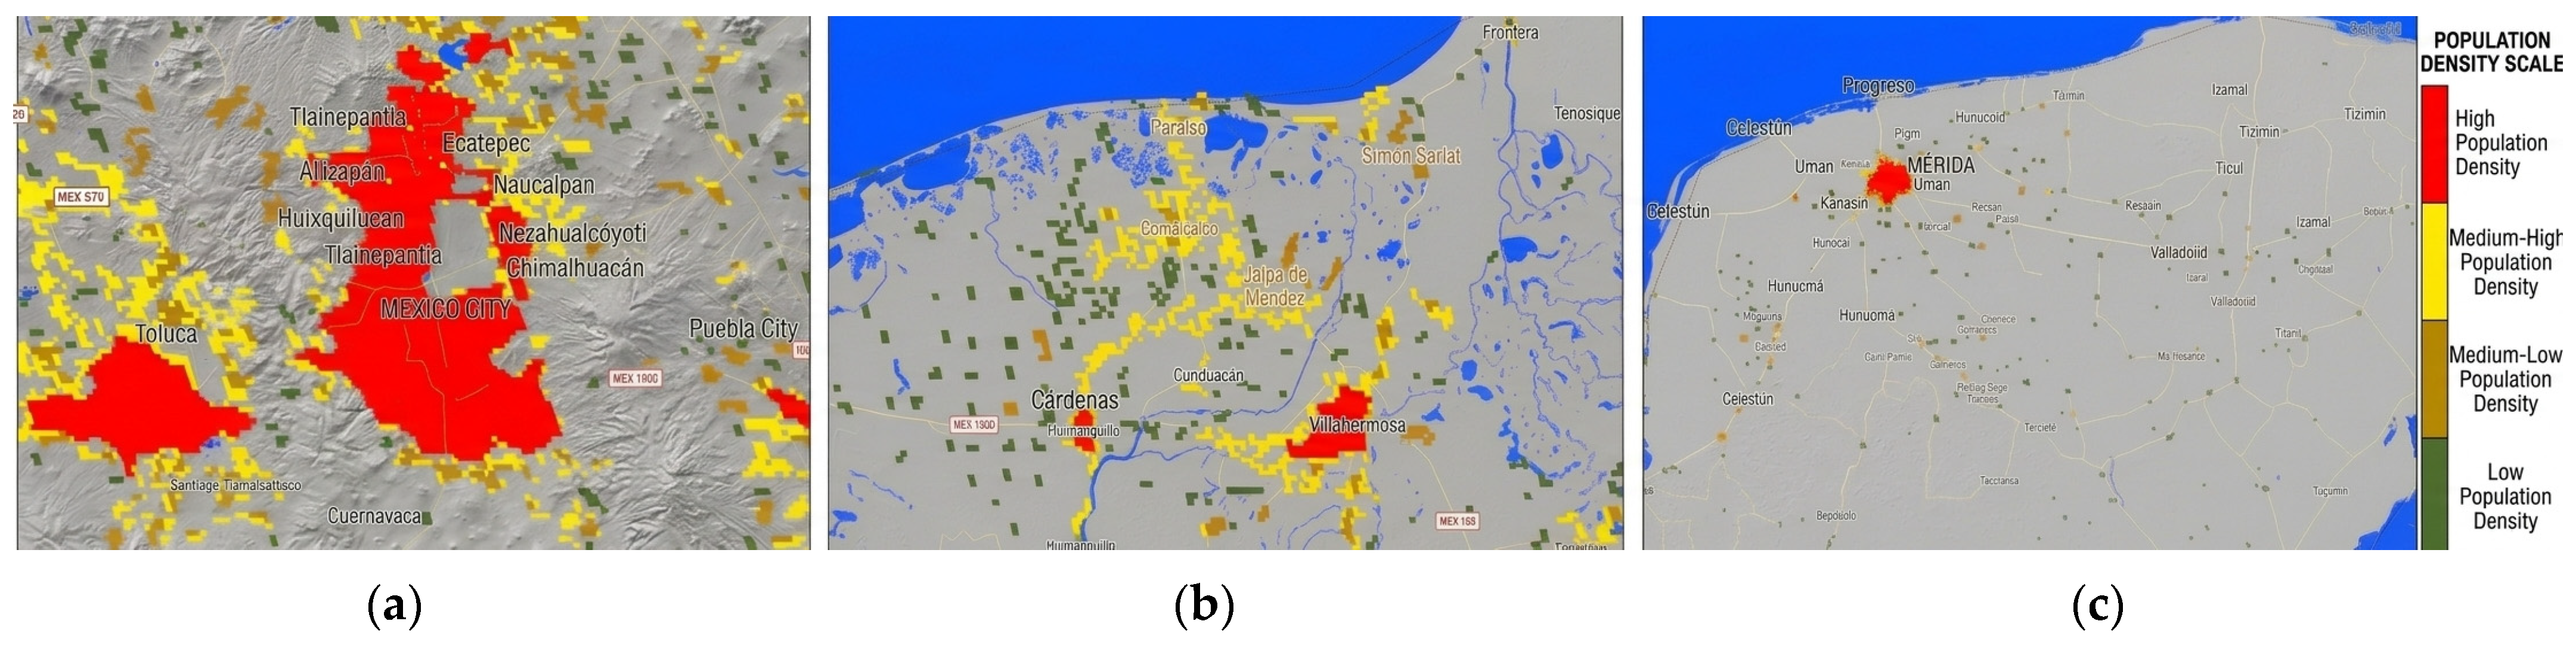
The national distribution in Figure 1 locates the three cases within Mexico’s highly uneven settlement distribution. Figure 2 narrows that view to the internal concentration of each study area. The maps support spatial orientation rather than numerical comparison: by the use of the specific GHSL layer year used to generate the three heat-map panels, so their patterns are not treated as contemporaneous population estimates [40].
Figure 1.
Total population by federal entity in the 2020 Census. Source: INEGI [19].
Figure 2.
Population intensity maps of (a) Mexico City, (b) Tabasco, and (c) Yucatán. Base-map toponyms are proper names and remain unchanged. The source year of the original GHSL layer was not stored in the manuscript; the panels are descriptive and excluded from the MCDA classification. GHSL methodology (Pesaresi et al. [40]).
Housing backlog does not follow population size mechanically (Table 4). The official indicator, housing backlog, captures dwellings requiring replacement, extension, or improvement; it measures a defined component of housing inadequacy rather than the broader construct of total housing needs. Mexico City reduced its backlog from 8.02% in 2018 to 6.01% in 2024, leaving 182,009 dwellings classified in backlog. Yucatán improved from 18.64% to 13.94%, with 98,456 dwellings still affected. Tabasco improved by 3.23 percentage points yet remained at 63.78%, 472,099 dwellings, almost two of every three in the state. Physical and qualitative need, rather than population alone, anchors the social case for investment [25].
Table 4.
Official housing backlog (rezago habitacional) by region, 2018 and 2024.
Original dwelling type and household composition graphics with incomplete historical retrieval metadata or exploratory curve fitting were not considered in the study to ensure greater validity and prevent invalid temporal comparisons, and no value from this metadata entered the screening framework.
The 2024 deprivation indicators distinguish material adequacy from networked services (Table 5). Mexico City records 3.7% deprivation in housing quality/space and 5.5% in basic services. Tabasco records 10.1% and 43.8%, respectively; Yucatán records 9.9% and 30.1%. This divergence matters because replacing wall or roof materials does not supply safe water, drainage, electricity, or clean cooking conditions. Basic service deprivation is treated as an infrastructure constraint rather than a score that can be averaged away [26].
Table 5.
Population affected by housing deprivation in 2024.
Version comparability requires an explicit source note. The 2.4%, 33.8%, and 29.6% values reported in the earlier manuscript corresponded to the 2022 multidimensional-poverty estimates produced by CONEVAL from ENIGH 2022, whereas the 5.5%, 43.8%, and 30.1% values used here are the 2024 estimates produced by INEGI from ENIGH 2024 [26]. The institution responsible for producing the data changed after the transfer of poverty measurement responsibilities, but INEGI retained the CONEVAL methodology to preserve continuity of the official series. The numerical differences are therefore a 2022-to-2024 update based on successive ENIGH rounds, not competing estimates for the same year or an author-defined record. Only the 2024 values enter the cross-sectional screen, and the differences are not interpreted as evidence of a causal policy effect.
Across all 32 federal entities, the 2024 housing backlog rate and basic service deprivation were strongly associated (Pearson r = 0.816, p = 1.27 × 10⁻⁸; Spearman ρ = 0.693, p = 1.12 × 10⁻⁵; n = 32). These results move the diagnosis beyond the three-case description: entities with more dwellings in official backlog also tend to contain larger population shares without basic housing services. They do not establish causality, and the differing denominators prohibit household-level inference. The full audit table is reported in Appendix A [25,26].
3.2. Climate, Water Yield, and Binding Physical Risks
Table 6 converts state climate summaries into a compact regional screen. Mexico City’s temperate subhumid profile permits mixed-mode hypotheses, although the regional mean conceals urban canyon, heat island, and altitude gradients. Geospatial evidence for metropolitan Mérida confirms that state-average temperature is insufficient for neighborhood design [41]. In Tabasco, heat, humidity, rainfall, and flood exposure shift the priority toward solar exclusion, air movement, moisture durability, and flood-safe site planning [42]. In Yucatán, heat and hurricane resilience interact with karst hydrogeology; observed salinization mechanisms reinforce the need to protect recharge and prevent sanitation solutions from exporting contamination to the aquifer [43].
Table 6.
Climatic screening and gross rooftop rainwater yield estimate.
Annual precipitation volume is not a service performance result. Tabasco has the largest gross yield but also the strongest flood and drainage constraints; Yucatán’s aquifer sensitivity increases the importance of safe non-potable substitutions; and Mexico City’s lower yield may still be useful under intermittent supply. Any project claim requires a daily rainfall–demand balance, tank sizing, first-flush and treatment design, overflow routing, and water quality monitoring. The values in Table 6 cannot support claims of potable supply, autonomy, or annual demand coverage [44].
3.3. Productive Momentum, Market Pressure, and Labor Structure
The economic indicators do not produce the same ordering as the housing indicators (Table 7). Mexico City accounts for 15.0% of national GDP—approximately MXN 5.03 trillion at current prices—and increased by 2.1% in real terms in 2024. Its tertiary GVA grew by 2.5%, while secondary GVA contracted by 1.0%. Yucatán is much smaller, at 1.6% of national GDP (approximately MXN 0.54 trillion), but recorded the strongest real growth (3.9%), with positive secondary and tertiary activity. Tabasco accounts for 2.1% (approximately MXN 0.70 trillion), yet its real GDP contracted by 6.5% and secondary GVA by 12.2%, illustrating the volatility of a hydrocarbon-exposed productive base [24].
Table 7.
Economic, investment, labor, and housing-market KPIs for industrial and bioclimatic housing potential development.
House price behavior adds a demand and affordability signal. In the first half of 2026, the national SHF index increased by 7.9% year on year. Yucatán exceeded that benchmark at 9.6%, Tabasco reached 6.6%, and Mexico City 3.9% [27]. Price acceleration is not evidence of social feasibility: it may reflect demand depth, supply constraints, land speculation, or a change in transaction mix. Its interpretation is paired with FDI and labor market structure. Mexico City attracted US$14.4 billion in FDI in 2024 and had the lowest informality among the three cases (44.2% in 2026-Q1). Tabasco and Yucatán received US$384 million and US$148 million, respectively, while informality remained 66.2% and 59.3% [28,29,30]. High informality weakens conventional mortgage eligibility even where economic activity and housing demand are strong.
Applying the ex-ante rule yields strong productive/market momentum for Yucatán because both real GDP growth and house price appreciation exceed the national benchmarks. Mexico City is mixed: output growth is above the national rate, but price appreciation is below it. Tabasco is weak under the stated rule because both are below the benchmark. The classification is diagnostic, not an assessment of social need. Tabasco exhibits the weakest current momentum and by far the greatest housing backlog; a conventional market-led solution is poorly matched to this risk profile.
3.4. Qualitative Climate Response Envelope
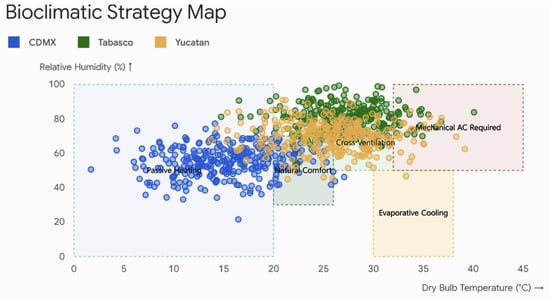
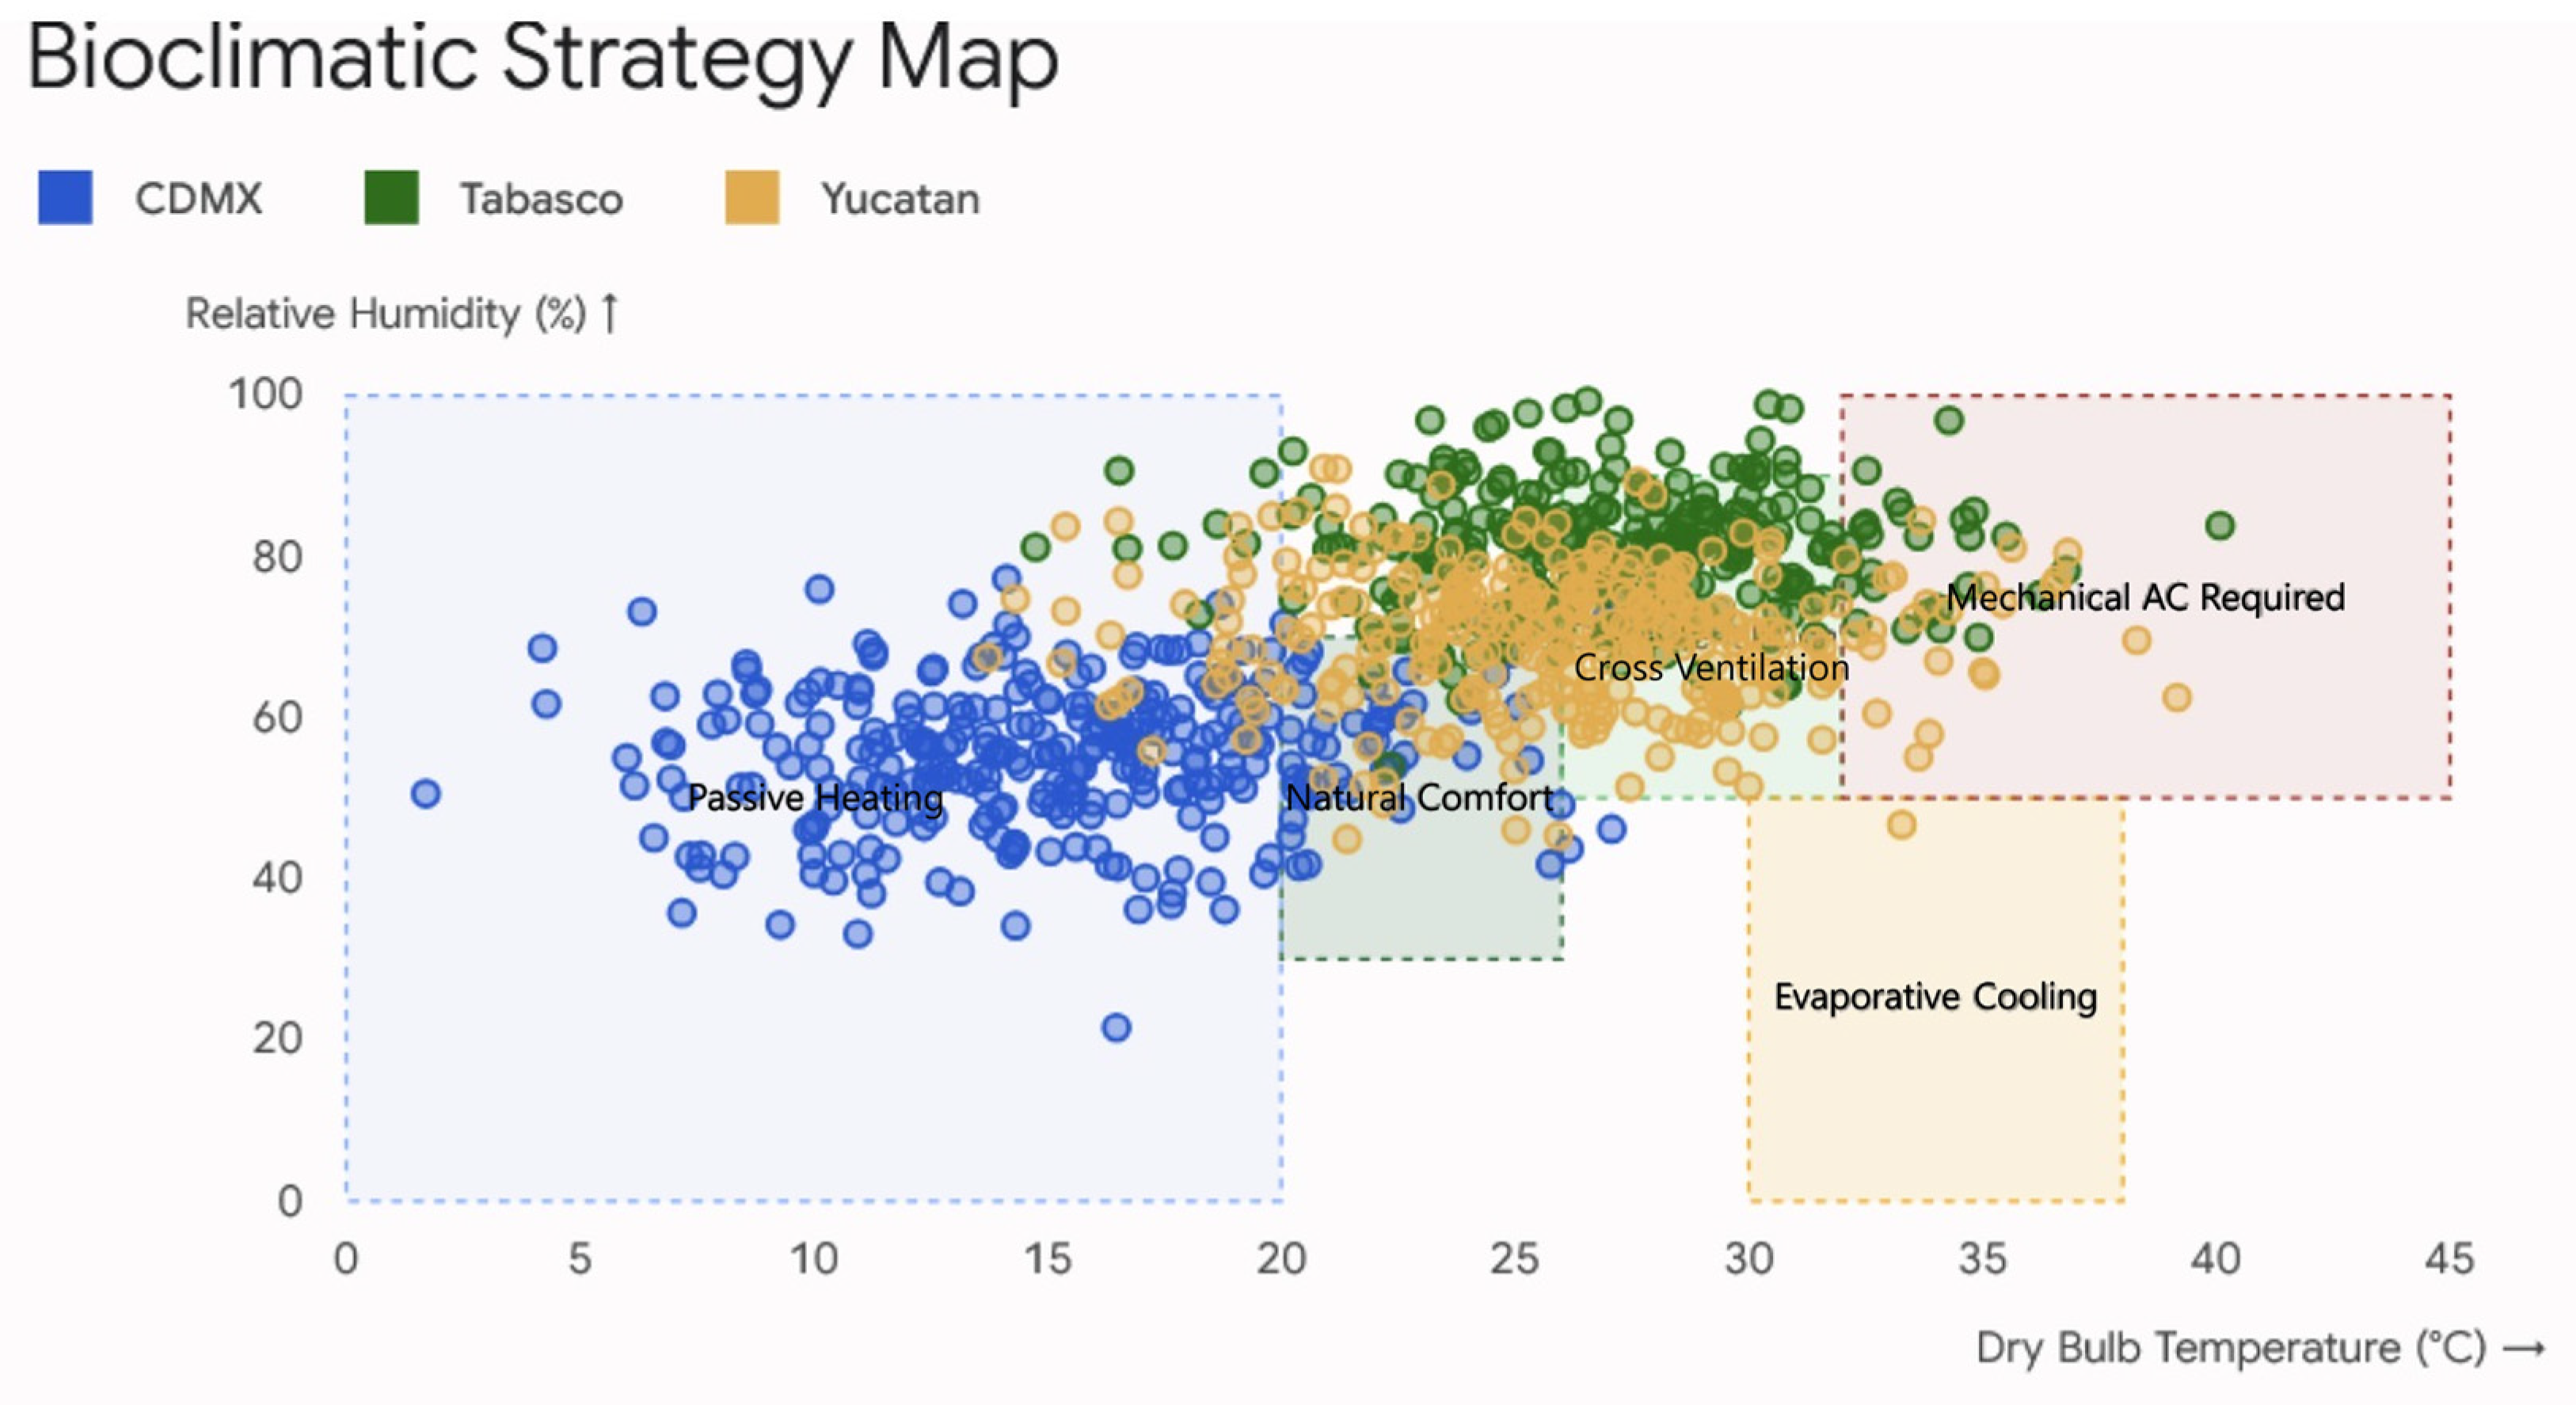
Figure 3 is shown only as a qualitative comparison of the temperature–humidity regimes The underlying weather file identity, year, time step, missing data treatment, occupancy, and calibration record were not preserved. The point clouds cannot be interpreted as hourly comfort, energy demand, or intervention performance, and the overlaid strategy regions are heuristic rather than code or simulation outputs.
Figure 3.
Qualitative temperature–humidity regime comparison and heuristic strategy overlay. The graphic is not a building simulation and is excluded from quantitative inference [35,36].
3.5. Industrial Corridors as Housing Implementation Geographies
State averages become actionable only when attached to specific employment geographies. Table 8 identifies corridor-scale propositions. In Mexico City, the Vallejo–Azcapotzalco master plan provides a brownfield and innovation setting in which housing can be coupled with regeneration and public transport rather than peripheral expansion [31]. In Tabasco, the Villahermosa–Nacajuca–Cunduacán axis and Paraíso/Dos Bocas connect service employment, agroindustry, chemicals, energy, and logistics. The state’s 2024–2044 industrial development process emphasizes agroindustry, chemicals, renewables, and automotive capabilities, but housing delivery must be insulated from single-project volatility and synchronized with drainage and services [32]. In Yucatán, the Umán–Mérida–Hunucmá–Progreso axis connects industrial estates, the metropolitan labor market, the port, and logistics; state planning also identifies an eastern Valladolid–Chichén Itzá corridor [33]. The 2025–2050 industrial strategy strengthens this geography through talent, sustainable productive infrastructure, innovation, value-chain integration, and investment attraction [34].
Table 8.
Industrial potential zones and green housing propositions.
3.6. Region-Specific Bioclimatic Design Packages
The design response follows a passive-first hierarchy, but each recommendation must be traceable to a screening trigger rather than imported from a generic climate checklist. The indicator-to-response matrix in Table 9 is grounded instead in the cited climate and building literature and in a project-level verification protocol. Table 9 links the measured regional condition to its mechanism, a conditional pre-design response, and the evidence required before tender. The responses are hypotheses for project testing; none is presented as a modeled energy or comfort result.
Table 9.
Traceable indicator-to-design-response matrix.
3.7. Integrated Feasibility and Portfolio Decision
The integrated results are deliberately presented as portfolio classifications rather than as a league table (Table 10). Mexico City is deployable for targeted infill, retrofit, and brownfield workforce housing because its service barrier and housing backlog are comparatively low, its economy is large, and employment accessibility can be improved through location. The priority is not extensive greenfield construction; it is decarbonizing and expanding useful housing within an already consolidated urban fabric while preventing displacement.
Table 10.
Non-compensatory feasibility synthesis.
Tabasco is a high-need but safeguarded pilot case. Its extraordinary housing backlog creates a strong social rationale, yet severe basic service deprivation, weak current productive momentum, and flood exposure make a rapid private market rollout vulnerable to failure. Public investment, concessional finance, community participation, verified drainage, and diversified demand must precede scale. Yucatán has the clearest growth-linked market opportunity, but it remains conditional because basic service deprivation is severe and cumulative growth can intensify aquifer contamination, urban heat, land speculation, and hurricane exposure. Even the region with the strongest headline growth requires the strictest resource capacity accounting.
3.8. Threshold Sensitivity
The ±20% test leaves every final portfolio class unchanged (Appendix A Table A2). Mexico City’s backlog and service conditions remain low, and its momentum remains mixed. Tabasco retains a high backlog and severe basic service deprivation under every threshold. Only the intermediate momentum label changes from weak to mixed when the national house price benchmark is relaxed from 7.9% to 6.32%, because Tabasco’s 6.6% appreciation then exceeds it. Yucatán retains a medium backlog, severe basic service deprivation, and strong momentum even under the strictest values: its 30.1% service deprivation remains above the upper severe threshold of 30.0%, and its 9.6% price increase remains above the upper benchmark of 9.48%. Hazard and service vetoes preserve the integrated result despite the one change in Tabasco’s enabling indicator.
This stability does not validate the thresholds as universal policy cut-offs. It shows only that the case interpretation is not an artifact of modest boundary movement. Recalibration with municipal distributions, stakeholder preferences, and observed project outcomes remain necessary before operational use.
The threshold exercise must not be read as normative validation. All cut-offs and KPI targets remain author-proposed screening hypotheses. The ±20% perturbation demonstrates only that the three case labels are locally stable within the tested range; it does not establish social legitimacy, legal authority, optimality, or external validity. Operational adoption requires stakeholder elicitation and recalibration against municipal distributions and observed project outcomes before any cut-off can guide procurement or policy.
4. Discussion
4.1. Why Climatic Fit and Market Potential Must Be Evaluated Together
The comparison separates three analytical objects that are often conflated. A GBRS asks how a specified asset performs against credits or weighted criteria [14]; building MCDA selects among defined technical alternatives [16,17]; the present screen asks whether a region–corridor proposition is sufficiently credible to justify those more data-intensive exercises. Mexico City advances because essential-service deprivation is low and location can improve access. Tabasco does not advance to scale because extreme housing need coexists with infrastructure and flood constraints. Yucatán advances conditionally because productive momentum is favorable, while water, heat, hurricane, and affordability capacities remain binding. The methods are complementary rather than interchangeable.
House price appreciation is retained as a market pressure signal, not proof of social feasibility. Yucatán’s 9.6% increase may indicate demand depth, supply constraints, speculation, or a shifting transaction mix; Mexico City’s lower increase coexists with much larger absolute GDP and FDI; and Tabasco’s 63.78% backlog does not imply mortgage-qualified demand. This distinction is consistent with resident-adoption research, which locates acceptance in perceived value, information, norms, and household constraints rather than in technical attributes alone [18].
4.2. Industrial Corridors, Accessibility, and a Just Housing Transition
Industrial policy can improve housing feasibility by concentrating employment, infrastructure, and fiscal attention, but only when housing is planned as part of the productive system. A corridor that attracts firms without delivering affordable homes near jobs transfers costs to workers through longer commutes, overcrowding, or informal peripheral settlement. A housing project built in anticipation of employment that does not materialize creates vacancies and stranded infrastructure. The corridor strategies require verified employer demand, multimodal travel time analysis, tenure diversity, and staged delivery rather than a one-time forecast.
The cases imply different industrial housing contracts. Vallejo can exchange land-value uplift for affordable units, retrofit, public realm, and energy upgrades. Tabasco requires risk-sharing instruments that survive commodity cycles and assign long-term drainage and maintenance responsibilities. Yucatán requires infrastructure concurrency; permits and unit delivery should be tied to demonstrable water, sanitation, mobility, and aquifer capacity. These conditions transform sustainability from a catalog of technologies into a governance arrangement that distributes benefits, risks, and maintenance obligations across developers, employers, governments, financiers, and residents.
4.3. Performance Baselines, Cost, and Financing
A credible procurement model must compare measured outcomes against a declared reference. For Table 11, the reference building is an otherwise identical, code-minimum conventional project on the same site, evaluated with the same geometry, orientation, weather file, occupancy, internal gains, infiltration, ventilation, HVAC efficiency and controls, tariffs, emission factors, and analysis period. Only the proposed intervention variables may differ. This controlled baseline prevents an efficient design from being credited for lighter occupancy, different weather, or a more efficient system that was already embedded in the comparator. Renewable systems remain downstream of demand reduction and require explicit financing, maintenance, and resident engagement plans [45].
Table 11.
Project validation protocol, baselines, and KPIs.
Financial screening must join incremental capital expenditure with energy, water, transport, maintenance, replacement, and financing cash flows. The KfW ex post evaluation of EcoCasa II provides an order-of-magnitude historical benchmark, not a current project price: the average supported floor area was 47.27 m2, modeled savings were 41 kWh/m2·y of electricity and 16 kWh/m2·y of gas, and energy-saving technologies added approximately EUR 500–5000 depending on the climate and package. Under the evaluation’s assumptions, a EUR 500 household investment amortized in the best case after five years and normally after ten years or more; carbon-value examples yielded 15–30 years for EUR 500–1000, while modeled public electricity subsidy savings implied about four years for EUR 500. Observed savings were lower than modeled because workmanship, operation, later modification, and rebound violated several assumptions [46]. These figures define a plausibility range and a warning against transferring modeled savings, not a cost estimate for the three study regions.
where NPV is the incremental net present value, ΔCAPEX is the incremental initial cost, ΔBt represents the verified energy, water, transport, and maintenance savings in year t, ΔCt represents the incremental operating and replacement costs, r is the real discount rate, and T is the analysis horizon. Every appraisal should disclose currency and price year, taxes and subsidies, financing terms, escalation, replacement lives, residual value, vacancy, and sensitivity to tariffs, discount rate, and realized performance. Payback, internal rate of return, and affordability should be reported alongside NPV, not used as substitutes for it.
NPV = −ΔCAPEX + Σt = 1T [(ΔBt − ΔCt)/(1 + r)t]
Equation (2) is a prospective appraisal template. This study does not provide region-specific capital costs, operating cash flows, discount rates, embodied-carbon inventories, hourly energy outputs, or numerical NPV results for Mexico City, Tabasco, or Yucatán. No claim of project profitability, payback, or carbon performance is therefore made.
4.4. Validation Pathway, Transferability, and Limitations
The framework remains unvalidated as a project decision instrument. Its evidence is public, aggregate, and secondary; no resident, developer, municipal, financier, or utility stakeholder participated in selecting criteria or thresholds. State indicators cannot resolve parcel suitability, household willingness to pay, network headroom, construction cost, embodied carbon, political acceptability, or hourly building performance. The national correlation strengthens construct plausibility at state scale but is ecological, cross-sectional, and non-causal. The sensitivity test establishes local classification stability, not universal validity.
Operational validation should proceed in four stages. Stage 1 is a two-round Delphi or structured workshop with residents, municipalities, developers, utilities, financiers, and independent climate, housing, and hazard experts to revise criteria, cut-offs, vetoes, and acceptable trade-offs. Stage 2 applies the revised framework retrospectively to completed projects with known delivery and performance outcomes. Stage 3 tests one pilot in each region using parcel data, life-cycle cost and carbon, current and future weather, and independently reviewed hazard studies. Stage 4 compares predicted and observed energy, water, comfort, maintenance, affordability, and resident acceptance for at least 12 months. Resident evidence is indispensable because technical performance does not establish adoption [18], while applied outranking studies show that criteria and preference structures must be co-defined with decision actors [17].
Transfer requires recalibration. The framework is usable where harmonized subnational data exists and where essential service and life safety vetoes can be stated transparently. It should not be transferred unchanged across countries, municipalities, tenure systems, or climates: indicator definitions, price and income segments, weather files, hazards, codes, service institutions, and stakeholder priorities must be reconstructed locally. Future climate performance remains unquantified in this study; SSP2-4.5 and SSP5-8.5 testing is a required next step, not a reported result. Scaling should follow demonstrated performance across relevant hot, wet, and dry seasons rather than construction completion alone.
The four-stage pathway specifies future work rather than completed study activities. No stakeholder elicitation or Delphi process, retrospective application, regional pilot, or post-occupancy comparison has yet been conducted. The proposed sequence is methodologically explicit, but its correctness and practical utility remain to be tested through the stages described above.
5. Conclusions
This study contributes a regional pre-feasibility screen that keeps economic opportunity, social need, climate, services, and hazards analytically distinct. The 32-entity audit identified a strong state-level association between housing backlog and basic service deprivation, while the ±20% sensitivity test preserved all three portfolio classes. These checks strengthen the internal logic of the screening result without converting it into causal evidence or project validation.
Mexico City supports parcel-screened infill, retrofit, and adaptive reuse near employment because measured backlog and service deprivation are low, subject to affordability, seismic, heat, air quality, and displacement controls. Tabasco supports only small, service-secured and flood-verified pilots until requirements for drainage, sanitation, access, maintenance, and demand are satisfied. Yucatán supports phased corridor housing, conditional on meeting the requirements for aquifer protection, sanitation and water capacity, future weather overheating risk, hurricane-resistant design, mobility, and affordability. Table 9 identifies the evidence chain from each trigger to each conditional response.
These regional labels are not parcel- or municipal-level recommendations. They identify propositions that may proceed to due diligence, not locations authorized for infill, pilots, or corridor housing. Any implementation claim must be reconstructed with municipal and parcel evidence on hazards, infrastructure capacity, tenure, accessibility, demand, costs, permits, and community preferences. Until those conditions are demonstrated, the terms “supports,” “deployable,” and “conditional” denote screening status only.
The framework’s practical value lies in what it refuses to infer. GDP, FDI, price appreciation, annual rainfall, and a qualitative climate graphic cannot validate an unsafe site, an unserved settlement, or an unmodeled building. Advancement requires a controlled reference building, hourly current and future weather analysis, parcel-level hazard and infrastructure evidence, transparent life-cycle finance, stakeholder revision of the rules, and post-occupancy measurement.
The framework should be treated as an auditable gateway to that work. Its claims end at regional screening; its scientific test will be whether independently evaluated pilots reproduce the predicted ordering of risks, pass the non-compensatory requirements, and deliver verified comfort, affordability, resilience, and resource outcomes.
Author Contributions
Conceptualization, L.H., I.F.-G. and J.J.V.-H.; methodology, L.H. and I.F.-G.; formal analysis, L.H. and J.J.V.-H.; investigation, L.H., I.F.-G. and J.J.V.-H.; data curation, J.J.V.-H.; writing—original draft preparation, L.H.; writing—review and editing, L.H., I.F.-G. and J.J.V.-H.; visualization, J.J.V.-H.; supervision, L.H. All authors have read and agreed to the published version of the manuscript.
Funding
This research was funded by Universidad Anáhuac México, grant number INNDIAHABL170215171.
Institutional Review Board Statement
Not applicable.
Informed Consent Statement
Not applicable.
Data Availability Statement
The original contributions presented in this study are included in the article. Further inquiries can be directed to the corresponding author. Appendix A provides the 32-entity audit dataset and the full threshold-sensitivity record. The source review cut-off was 7 October 2026.
Acknowledgments
The authors acknowledge the public institutions that maintain the statistical and planning datasets used in this study.
Conflicts of Interest
The authors declare no conflicts of interest.
Abbreviations
The following abbreviations are used in this manuscript:
| Abbreviation | Definition |
| CAGR | Compound annual growth rate |
| CONAPO | Consejo Nacional de Población |
| EUI | Energy use intensity |
| FDI | Foreign direct investment |
| GDP | Gross domestic product |
| GHG | Greenhouse gas |
| GIS | Geographic information system |
| GVA | Gross value added |
| INEGI | Instituto Nacional de Estadística y Geografía |
| MCDA | Multi-criteria decision analysis |
| NAMA | Nationally Appropriate Mitigation Action |
| O&M | Operation and maintenance |
| PIBE | Producto Interno Bruto por Entidad Federativa |
| RH | Relative humidity |
| SEDATU | Secretaría de Desarrollo Agrario, Territorial y Urbano |
| SHF | Sociedad Hipotecaria Federal |
Appendix A. National Audit, Sensitivity, and Methodological Positioning
Table A1 reports the complete cross-sectional audit used for the national association test. Backlog is expressed as a share of dwellings; basic service deprivation is expressed as a share of people. The table is supplied for reproducibility and charting, but the unit mismatch must remain visible in any reuse.
Table A1.
Housing backlog and basic service deprivation across Mexico’s 32 federal entities, 2024.
Table A2.
Threshold-sensitivity record for the three focal cases.
Table A3.
Position of the proposed screen relative to common assessment approaches.
The following tables are intentionally arranged for direct chart production. Table A4 uses long format for line charts. Table A5 uses long format for grouped housing backlog charts. Table A6 separates indicator, unit, year, and geography so economic variables can be filtered without mixing scales.
Table A4.
Chart-ready observed population series, long format.
Table A5.
Chart-ready housing backlog series, long format.
Table A6.
Chart-ready productive and market indicators, long format.
Appendix B. Rainwater Screening Calculation and Boundary
The gross annual rooftop volume in Table 6 is retained only to translate regional precipitation into a common catchment unit. It is calculated as:
where Ygross is the gross annual yield (m3/y), P is the annual precipitation (mm), A is the roof area (m2), and Cr is the screening runoff coefficient. The standardized assumptions A = 100 m2 and Cr = 0.80 yield 68, 204, and 88 m3/y for Mexico City, Tabasco, and Yucatán. A design value would require a daily rainfall series and explicit terms for first flush, roof and conveyance loss, treatment rejection, tank overflow, dry-period carryover, non-potable demand timing, pump energy, overflow routing, and water quality compliance. No storage volume or service reliability is inferred here. Distributional and institutional effects should also be evaluated [44].
Ygross = (P × A × Cr)/1000
References
- United Nations Environment Programme; Global Alliance for Buildings and Construction. Global Status Report for Buildings and Construction 2025–2026; UNEP: Nairobi, Kenya, 2026; Available online: https://www.unep.org/resources/report/global-status-report-buildings-and-construction-2025-2026 (accessed on 7 October 2026).
- World Meteorological Organization. State of the Global Climate 2024; WMO: Geneva, Switzerland, 2025; Available online: https://wmo.int/news/media-centre/wmo-confirms-2024-warmest-year-record-about-155degc-above-pre-industrial-level (accessed on 7 October 2026).
- Wei, J.; Li, H.X.; Sadick, A.-M.; Noguchi, M. A systematic review of key issues influencing environmental performance of social housing. Energy Build. 2024, 319, 114566. [Google Scholar] [CrossRef] [Scilit]
- Jayalath, A.; Vaz-Serra, P.; Hui, F.K.P.; Aye, L. Thermally comfortable energy efficient affordable houses: A review. Build. Environ. 2024, 256, 111495. [Google Scholar] [CrossRef] [Scilit]
- Vázquez-Torres, C.-E.; Ozawa-Meida, L.; Bienvenido-Huertas, D.; Bassam, A. Advancing sustainable housing in Latin America: A critical review of energy efficiency, indoor environmental quality, and policy. Sustainability 2025, 17, 6139. [Google Scholar] [CrossRef] [Scilit]
- Ospino, A.; Robles, J.; Tovar, I. Strategies to improve thermal comfort and energy efficiency of social interest housing in tropical areas. J. Sustain. Dev. Energy Water Environ. Syst. 2024, 12, 1120526. [Google Scholar] [CrossRef] [Scilit]
- Hernández, G.; Cetina-Quiñones, A.J.; Bassam, A.; Carrillo, J.G. Passive strategies towards energy efficient social housing: A parametric case study and decision-making framework in the Mexican tropical climate. J. Build. Eng. 2024, 82, 108282. [Google Scholar] [CrossRef] [Scilit]
- Méndez, J.I.; Ibarra-Moyers, L.; Ponce, P.; Meier, A.; Molina, A. A static rooftop shading system for year-round thermal comfort and energy savings in hot climates. Heliyon 2024, 10, e31599. [Google Scholar] [CrossRef] [Scilit] [PubMed]
- Romero, D.; Torres, K.A.; Gonzalez, J.; Cetina-Quiñones, A.J.; Acosta, C.; Sadoqi, M.; Bassam, A. Climate change and assessing thermal comfort in social housing of southeastern Mexico: A prospective study using machine learning and global sensitivity analysis. Sustainability 2025, 17, 9596. [Google Scholar] [CrossRef] [Scilit]
- Jiménez Torres, M.; Pérez-Fargallo, A.; May Tzuc, O.; Ricalde Castellanos, L.; Bassam, A.; Flota-Bañuelos, M.; Rubio-Bellido, C. Energy poverty under 2M indicator: Feasibility of decrease by using passive techniques in residential buildings of Southeast Mexico. Energy Build. 2024, 323, 114761. [Google Scholar] [CrossRef] [Scilit]
- Vargas, A.P.; Hamui, L. Thermal Energy Performance Simulation of a Residential Building Retrofitted with Passive Design Strategies: A Case Study in Mexico. Sustainability 2021, 13, 8064. [Google Scholar] [CrossRef] [Scilit]
- Aguilar Jiménez, J.A.; Ríos-Arriola, J.; Islas-Pereda, S.; Suástegui-Macías, J.A.; Zamora-Machado, M. Energy affordability and thermal comfort in Mexico: Analysis across 13 climatic zones. Renew. Energies 2026, 4, 27533735261421342. [Google Scholar] [CrossRef] [Scilit]
- Marmolejo Cervantes, M.A.; Solís, L.R. Energy poverty and social justice in Mexico: The rights of electricity consumers. Electr. J. 2024, 37, 107372. [Google Scholar] [CrossRef] [Scilit]
- Mao, J.; Yuan, H.; Xiong, L.; Huang, B. Research review of green building rating system under the background of carbon peak and carbon neutrality. Buildings 2024, 14, 1257. [Google Scholar] [CrossRef] [Scilit]
- Luque Castillo, X.; Yepes, V. Multi-criteria decision methods in the evaluation of social housing projects: A systematic review. J. Civ. Eng. Manag. 2025, 31, 608–630. [Google Scholar] [CrossRef] [Scilit]
- Liu, X.; Zuo, Y.; Yin, Z.; Liang, C.; Feng, G.; Yang, X. Research on an evaluation system of the application effect of ground source heat pump systems for green buildings in China. Energy 2023, 262, 125374. [Google Scholar] [CrossRef] [Scilit]
- Daniel, S.; Ghiaus, C. Multi-criteria decision analysis for energy retrofit of residential buildings: Methodology and feedback from real application. Energies 2023, 16, 902. [Google Scholar] [CrossRef] [Scilit]
- Liu, Y.; Li, X.; Feng, H.; Zhu, R. What drive residents to adopt the concept of green housing in Nanjing, China. Buildings 2026, 16, 335. [Google Scholar] [CrossRef] [Scilit]
- Instituto Nacional de Estadística y Geografía. Censo de Población y Vivienda 2020; Historical Census Series by Federal Entity; INEGI: Aguascalientes, Mexico, 2021. Available online: https://www.inegi.org.mx/programas/ccpv/2020/ (accessed on 7 October 2026).
- Consejo Nacional de Población. Conciliación Demográfica de México 1950–2019 y Proyecciones de la Población de México y de las Entidades Federativas 2020–2070; CONAPO: Mexico City, Mexico. Available online: https://www.gob.mx/conapo/acciones-y-programas/conciliacion-demografica-de-1950-a-2019-y-proyecciones-de-la-poblacion-de-mexico-y-de-las-entidades-federativas-2020-a-2070 (accessed on 7 October 2026).
- Instituto Nacional de Estadística y Geografía. Clima: Ciudad de México. Cuéntame de México. Available online: https://cuentame.inegi.org.mx/monografias/informacion/df/territorio/clima.aspx?tema=me&e=09 (accessed on 7 October 2026).
- Instituto Nacional de Estadística y Geografía. Clima: Tabasco. Cuéntame de México. Available online: https://cuentame.inegi.org.mx/monografias/informacion/tab/territorio/clima.aspx?tema=me&e=27 (accessed on 7 October 2026).
- Instituto Nacional de Estadística y Geografía. Clima: Yucatán. Cuéntame de México. Available online: https://cuentame.inegi.org.mx/monografias/informacion/yuc/territorio/clima.aspx?tema=me&e=31 (accessed on 7 October 2026).
- Instituto Nacional de Estadística y Geografía. Producto Interno Bruto por Entidad Federativa (PIBE) 2024: Reporte de Resultados; INEGI: Aguascalientes, Mexico, 2025. Available online: https://www.inegi.org.mx/programas/pibent/2018/ (accessed on 7 October 2026).
- Secretaría de Desarrollo Agrario; Territorial y Urbano. Sistema Nacional de Información e Indicadores de Vivienda: Rezago Habitacional Estatal 2024; SEDATU: Mexico City, Mexico, 2026. Available online: https://sniiv.sedatu.gob.mx/Demanda/Rezago (accessed on 7 October 2026).
- Instituto Nacional de Estadística y Geografía. Análisis de los Resultados de la Medición de la Pobreza Multidimensional, 2024; Reporte de Resultados 27/25; INEGI: Aguascalientes, Mexico, 2025. Available online: https://www.inegi.org.mx/contenidos/saladeprensa/boletines/2025/pm/pm2025_RR_08.pdf (accessed on 7 October 2026).
- Sociedad Hipotecaria Federal. Índice SHF de Precios de la Vivienda en México, Segundo Trimestre de 2026; SHF: Mexico City, Mexico, 2026; Available online: https://www.gob.mx/shf/articulos/indice-shf-de-precios-de-la-vivienda-en-mexico-segundo-trimestre-de-2026?idiom=es (accessed on 7 October 2026).
- Secretaría de Economía. Data México: Ciudad de México—Economy, Employment, Equity, Quality of Life, Education, Health and Public Safety. Available online: https://www.economia.gob.mx/datamexico/en/profile/geo/ciudad-de-mexico-cx?redirect=true (accessed on 7 October 2026).
- Secretaría de Economía. Data México: Tabasco—Economy, Employment, Equity, Quality of Life, Education, Health and Public Safety. Available online: https://www.economia.gob.mx/datamexico/en/profile/geo/tabasco-tb (accessed on 7 October 2026).
- Secretaría de Economía. Data México: Yucatán—Economy, Employment, Equity, Quality of Life, Education, Health and Public Safety. Available online: https://www.economia.gob.mx/datamexico/en/profile/geo/yucatan-yu (accessed on 7 October 2026).
- Secretaría de Desarrollo Económico de la Ciudad de México. Plan Maestro Vallejo-i; Gobierno de la Ciudad de México: Mexico City, Mexico. Available online: https://www.slideshare.net/slideshow/plan-maestro-vallejo-zona-industrialpdf/267168610 (accessed on 7 October 2026).
- Cambridge Industrial Innovation Policy. Making Nearshoring Work for Mexico: The Role of Industrial Innovation Policy—The Case of Tabasco; University of Cambridge: Cambridge, UK, 2024; Available online: https://www.ciip.group.cam.ac.uk/reports-and-articles/making-nearshoring-work-for-mexico-the-role-of-industrial-innovation-policy/ (accessed on 7 October 2026).
- Gobierno del Estado de Yucatán. Yucatán Impulsa Corredores Industriales Metropolitanos y del Oriente; Gobierno del Estado de Yucatán: Mérida, Mexico, 2023. Available online: https://www.yucatan.gob.mx/saladeprensa/ver_nota.php?id=8575 (accessed on 7 October 2026).
- Gobierno del Estado de Yucatán; Cambridge Industrial Innovation Policy. Plan Yucatán: Política Industrial 2025–2050; Gobierno del Estado de Yucatán: Mérida, Mexico, 2026. Available online: https://www.ciip.group.cam.ac.uk/wp-content/uploads/2026/08/Plan-Yucatan-Spanish.pdf (accessed on 7 October 2026).
- García Kerdan, I.; Morillón Gálvez, D.; Sousa, G.; Suárez de la Fuente, S.; Silva, R.; Hawkes, A. Thermodynamic and thermal comfort optimisation of a coastal social house considering the influence of the thermal breeze. Build. Environ. 2019, 155, 224–246. [Google Scholar] [CrossRef] [Scilit]
- Jiménez Torres, M.; Bienvenido-Huertas, D.; May Tzuc, O.; Bassam, A.; Ricalde Castellanos, L.J.; Flota-Bañuelos, M. Assessment of climate change’s impact on energy demand in Mexican buildings: Projection in single-family houses based on representative concentration pathways. Energy Sustain. Dev. 2023, 72, 185–201. [Google Scholar] [CrossRef] [Scilit]
- Diario Oficial de la Federación. Norma Oficial Mexicana NOM-020-ENER-2011, Eficiencia Energética en Edificaciones—Envolvente de Edificios para Uso Habitacional; DOF: Mexico City, Mexico, 9 August 2011. Available online: https://www.dof.gob.mx/nota_detalle.php?codigo=5203931&fecha=09/08/2011 (accessed on 7 October 2026).
- Castro-Bello, M.; Gómez-Muñoz, L.; Marmolejo-Vega, C.V.; Morales-Morales, C.; Valencia-Díaz, E.F.; Maldonado-Catalán, J.F.; Marmolejo-Duarte, C. Public policies for the energy efficiency of buildings in Mexico. Buildings 2024, 14, 3437. [Google Scholar] [CrossRef] [Scilit]
- International Energy Agency. Mexico New Housing Nationally Appropriate Mitigation Action. Energy Efficiency Policy Toolkit Case Study; IEA: Paris, France, 2025; Available online: https://iea.blob.core.windows.net/assets/ebbe4571-a6bd-4061-b979-94fb1661980f/Mexico_MexicoNewHousingNationallyAppropriateMitigationAction_IEAEnergyEfficiencyPolicyToolkit2025.pdf (accessed on 7 October 2026).
- Pesaresi, M.; Schiavina, M.; Politis, P.; Freire, S.; Krasnodębska, K.; Uhl, J.H.; Carioli, A.; Corbane, C.; Dijkstra, L.; Florio, P.; et al. Advances on the Global Human Settlement Layer by joint assessment of Earth Observation and population survey data. Int. J. Digit. Earth 2024, 17, 2390454. [Google Scholar] [CrossRef] [Scilit]
- Sánchez-Sánchez, F.A.; Vega-De-Lille, M.; Castillo-Atoche, A.A.; López-Maldonado, J.T.; Cruz-Fernandez, M.; Camacho-Pérez, E.; Rodríguez-Reséndiz, J. Geo-sensing-based analysis of urban heat island in metropolitan Mérida. Sensors 2024, 24, 6289. [Google Scholar] [CrossRef] [Scilit] [PubMed]
- Haer, T.; Botzen, W.J.W.; Zavala-Hidalgo, J.; Cusell, C.; Ward, P.J. Economic evaluation of climate risk adaptation strategies: Cost–benefit analysis of flood protection in Tabasco, Mexico. Atmósfera 2017, 30, 101–120. [Google Scholar] [CrossRef] [Scilit]
- Narvaez-Montoya, C.; Mondragón Bonilla, R.; Goldscheider, N.; Mahlknecht, J. Groundwater salinization patterns and their driving mechanisms in the coastal karst aquifer of the Yucatán Peninsula. Commun. Earth Environ. 2025, 6, 468. [Google Scholar] [CrossRef] [Scilit]
- Castelán-Cabañas, R.; Padilla-Rivera, A.; Muñoz-Villarreal, C.; Güereca-Hernández, L.P. Advancing urban water autonomy: A social life cycle assessment of rainwater harvesting systems in Mexico City. Clean. Environ. Syst. 2024, 13, 100193. [Google Scholar] [CrossRef] [Scilit]
- Ortega, J.A.; Asfour, O.S.; Wuni, I.Y. A systematic review of renewable energy integration in social housing and its impacts on affordability and community sustainability. Discov. Sustain. 2026, 7, 108. [Google Scholar] [CrossRef] [Scilit]
- KfW Development Bank. Ex Post Evaluation: Mexico—Renewable Energy, Energy Efficiency and Environmental Protection II (EcoCasa II); KfW: Frankfurt am Main, Germany, 2023; Available online: https://www.kfw-entwicklungsbank.de/PDF/Evaluierung/Ergebnisse-und-Publikationen/PDF-Dokumente-L-P_EN/Mexiko_EcoCasa_2023_E.pdf (accessed on 7 October 2026).

Disclaimer/Publisher’s Note: The statements, opinions and data contained in all publications are solely those of the individual author(s) and contributor(s) and not of MDPI and/or the editor(s). MDPI and/or the editor(s) disclaim responsibility for any injury to people or property resulting from any ideas, methods, instructions or products referred to in the content. |
© 2026 by the authors. Licensee MDPI, Basel, Switzerland. This article is an open access article distributed under the terms and conditions of the Creative Commons Attribution (CC BY) license.