


Abstract
This article presents Nuclear Energy Systems to Go (NES2Go), an hourly dispatch and multi-objective ranking model for assessing the integration of small modular reactors (SMRs) in industrial clusters across process heat, electricity and cogeneration operation. A harmonised database of SMR technologies is developed, covering technical, physical and operational characteristics from publicly available sources. The framework complements Renewable Energy Sources to Go (RES2Go), an open platform for matching energy demand and supply in European industry hubs. NES2Go compares economic performance, spatial footprint and annual fissile material requirement, with unmet heat retained as an additional objective in thermal modes. Annual grid export is reported descriptively and does not enter the ranking. Electricity reliability remains an acceptance criterion; unmet electricity is not an objective. Greenhouse gas emissions are reported alongside the ranking rather than entered as an objective. NES2Go simulates hourly SMR operation under varying industrial demand, renewable generation and storage configurations, with process heat demand resolved by temperature level to assess the thermodynamic compatibility of processes and reactors. Cogeneration mode represents the production of electricity and useful heat from the same reactor thermal output. The framework was tested in the port of Antwerp (Belgium) for process heat, electricity and cogeneration. The case study illustrated how temperature compatibility and operating mode constrain the ability of SMRs to supply industrial electricity and process heat. In cogeneration mode, fleets based on 19 designs passed screening and supplied approximately 31–77% of estimated heat demand, findings that apply to the case study for the port of Antwerp. NES2Go can be rolled out to other industrial clusters or individual companies using their demand profiles and assumptions. NES2Go is implemented in Python, providing a transparent and reproducible decision support tool for analysing the role of SMRs in future low emission industrial systems.
1. Introduction
1.1. Industrial Clusters Between the Low Carbon Transition and Competitiveness
European industry faces two challenges at once. On one side, the European Union’s commitment to climate neutrality by 2050 under the European Green Deal and the Paris Agreement requires a deep, coordinated transition across all economic sectors [1,2]. On the other, European industrial policy aims to keep that industry competitive and on the continent rather than let energy costs drive it abroad, a choice made central by the Union’s competitiveness agenda. The 2022 energy crisis that followed the Russian invasion of Ukraine exposed how tightly these two pressures are coupled: gas price shocks propagated directly into electricity prices and into the operating costs of energy intensive industry (EII), curtailing output in the chemical, metals and fertiliser sectors and accelerating the European Commission’s REPowerEU drive to cut fossil fuel dependency and expand domestic low emission energy [3,4]. Mario Draghi’s 2024 report on European competitiveness placed energy at the centre of the continent’s competitiveness gap, noting that EU industrial electricity prices are two to three times, and gas prices three to five times, those in the United States and China, and framing affordable, firm, low carbon energy as a prerequisite for reindustrialisation rather than a tradeoff against it [5]. The low carbon transition and competitiveness are therefore best treated as a joint objective: industry needs energy that is simultaneously low emission, firm and affordable.
This joint objective is hardest to meet in EIIs. Although the electricity system is steadily integrating variable renewables, heavy industry is difficult to transform because it requires continuous power, high temperature process heat, and stable energy inputs that intermittent supply alone cannot guarantee [6,7]. Process heat is the crux: roughly two thirds of industrial energy demand is thermal, much of it above the temperatures that heat pumps or electric boilers can economically reach, so cutting emissions from process heat, not only from power, is the binding constraint [6]. Industrial clusters are the natural unit of analysis for this challenge because they concentrate large process heat and electricity demands, shared infrastructure, and point source emissions within a limited area [8,9]. Building on the concept of industrial symbiosis [10], a growing body of work models such clusters as coherent multi node energy systems rather than isolated plants, so that candidate supply options can be assessed against the cluster wide balance of heat and electricity rather than a single site [8,9].
Belgium is an acute instance of this problem. The country combines high population density, strong industrial concentration, constraints on domestic renewable energy deployment, and a high dependence on imported fossil fuels. Belgian industry, including chemicals, steel, and nonmetallic minerals, accounts for a substantial share of national greenhouse gas emissions [11]. These activities are spatially concentrated in a few industrial nodes, above all the port of Antwerp (Belgium), which contains the largest integrated chemical cluster in Europe [12]. The energy crisis exposed the economic fragility of this fossil dependent structure, with high prices depressing activity and capacity utilisation in the chemical sector in particular [13]. This vulnerability shapes Belgian transition pathways to 2050, which combine electrification, efficiency, hydrogen and renewables, yet still leave open the question of how much firm, low emission capacity industrial clusters will require [14].
1.2. Small Modular Reactors and the Return of Nuclear to the Industrial Agenda
Against this backdrop, low carbon nuclear generation has returned to the European policy agenda after two decades at its margins. The International Energy Agency (IEA) now frames nuclear power as an enabler of secure clean energy transitions [15]. Qualifying nuclear activities were admitted to the EU sustainable finance taxonomy in 2022 [16]. The 2024 Net Zero Industry Act includes nuclear fission energy technologies, including nuclear fuel cycle technologies, among the net zero technologies within its scope [17]. In the same year, the European Commission launched a European Industrial Alliance on SMRs to accelerate their deployment in Europe by the early 2030s [18]. National policy has shifted in step: in May 2025 the Belgian federal parliament repealed the 2003 nuclear phase out act, removing both the mandated reactor closure dates and the ban on new nuclear construction and explicitly reopening the option of new build, including SMRs [19]. More recently, the Commission’s 2026 proposal for an Industrial Accelerator Act includes new nuclear power plants, such as SMRs, in Union origin requirements for public procurement and Member State support, further linking nuclear deployment to European industrial capacity and supply chain resilience [20]. This renewed visibility rests on a specific value proposition: firm, dispatchable, low carbon process heat and electricity that directly address the industrial problem of transition and competitiveness set out above.
SMRs are generally defined as nuclear reactors with an electrical output of up to 300 MWe per module [21]. Relative to conventional gigawatt scale plants they are designed around modularity, factory fabrication, standardised components and incremental deployment [22,23]. For industrial clusters this translates into several potential advantages. First, many concepts can deliver process heat directly, with the reachable temperature set by the reactor’s coolant and outlet conditions, from around 160–300 °C for water cooled designs to 700–800 °C for high temperature gas cooled and molten salt cooled designs [24]. Second, they supply continuous electricity at high availability, matching the baseload character of process industry. Third, cogeneration allows electricity and heat to be produced together from one unit, which suits clusters that combine electrical load, steam networks and high temperature thermal demand [25,26]. Fourth, modularity fits cluster scale deployment: a site can begin with a single module and add capacity as demand, infrastructure and financing mature [27], and some designs offer passive safety and reduced emergency planning zones that may ease colocation with industrial facilities [28].
These advantages are, however, prospective rather than proven. Most SMR concepts are not yet commercially demonstrated, and their economics depend strongly on first of a kind costs, the realisation of production learning, licensing, fuel supply, construction schedules and regulatory acceptance; reported cost figures carry wide uncertainty and, for European conditions specifically, remain contested [29,30]. Because SMR costs and technical performance remain uncertain, candidate designs need to be compared using transparent and consistent assumptions rather than preselected hypotheses.
1.3. Existing Modelling Approaches and Research Gaps
Existing studies examine nuclear integration at different scales. National and regional energy system studies assess nuclear generation within a broader supply mix, considering renewable integration, system operation and infrastructure. Jenkins et al. [31] represented nuclear flexibility within power system dispatch containing wind and solar generation. At the plant scale, Alhadhrami et al. [32] investigated flexible operation and coordinated refuelling of multiple SMR units. Open frameworks such as PyPSA support generation, storage, sector coupling and the optimisation of operation and investment [33]. NES2Go complements these approaches at the industrial cluster or company scale, where local electricity demand and process heat requirements determine the suitability of candidate reactor fleets. NES2Go screens SMR configurations to meet industrial energy demand rather than determining the optimal role of nuclear power in a national energy system.
A further challenge in energy modelling concerns the representation of industrial demand. System level models commonly aggregate industry to national or regional scale, whereas cluster level studies often omit wider system constraints, producing a scale mismatch between where industrial investment decisions are actually made and where infrastructure is planned [8,9]. This matters for SMRs because a reactor’s technical value is set by the local balance of electricity demand, heat demand at its required temperature levels, renewable generation, storage and grid exchange. The AIDRES project (2023) narrowed part of this gap by assembling a plant level European database of industrial production and transition pathways [34], and the RES2Go platform, released in 2025 and developed by the Ghent University Energy & Cluster Management (ECM) group with DG ENER, turned those data into an open tool that matches renewable supply and demand for European industrial sites and hubs [35]. RES2Go does not represent nuclear supply; NES2Go adds that capability to the demand workflow. Because the demand data come from the AIDRES plant-level database through RES2Go, the workflow can be applied to other European industrial clusters without constructing a synthetic one.
Published studies on nuclear reactors for industrial applications address heat supply, operating strategies and system design. Vanatta et al. [24] assessed the techno-economic potential of SMRs for industrial process heat, highlighting the importance of demand scale, temperature requirements and electricity sales. Novotný et al. [36] investigated nuclear cogeneration with thermal storage in industrial energy parks, including interaction with existing natural gas boilers. Cho et al. [37] examined reactor and storage sizing through Pareto trade-offs between electricity sales and onsite self-sufficiency. These studies demonstrate the value of detailed assessment for selected nuclear and industrial configurations.
NES2Go can be used at an early screening stage by comparing a broad catalogue of SMR designs against common industrial demand inputs and assumptions. Deterministic hourly dispatch evaluates candidate fleets under the stated operating and reliability criteria. Economic assessment and Pareto ranking then identify promising designs and their trade-offs. The resulting configurations can provide starting points for detailed thermodynamic analysis, site assessment and operational optimisation. This catalogue breadth requires simplified representations of reactor operation and industrial heat delivery. Table 1 compares selected modelling approaches; the comparison concerns their documented scope. Each value follows the published description of the study, and the last two columns show where the compared studies go beyond NES2Go.
Table 1.
Positioning of NES2Go against representative studies of SMRs for industry.
1.4. Research Objectives and Contributions
This article introduces NES2Go, an open-source decision support framework for assessing SMR integration in energy intensive industrial clusters under selected conditions. NES2Go complements the RES2Go demand platform [35] with a nuclear energy supply workflow. The model compares candidate reactor designs by dispatch performance and ability to meet industrial demand for heat and electricity, separately or in cogeneration. NES2Go links industrial energy demand with a harmonised SMR database and evaluates hourly operation under different configurations of renewable generation, storage and grid exchange.
The article makes four contributions. First, it introduces a harmonised, openly documented SMR technology database of 71 designs across six reactor families The six reactor families follow the IAEA SMR catalogue classes, which combine coolant, neutron spectrum and deployment characteristics. Microreactors are a size class that includes gas cooled and heat pipe designs; variants such as ACP100 and ACP100S are counted separately when their parameters differ. and 60 documented physical and operational fields, so that candidate reactors can be compared on a common basis [40]. Second, it couples this database to industrial cluster demand from the RES2Go platform [35], including process heat demand resolved by temperature level, thereby allowing the demand data from RES2Go to be assessed against nuclear supply options. Third, it develops an hourly dispatch model spanning heat only, electricity only and cogeneration operation, with a temperature matching gate, grid exchange and battery storage. Finally, it proposes a multi-objective decision support methodology that compares technical, economic and operational indicators, with greenhouse gas emissions reported as contextual information, and tests the workflow on the port of Antwerp.
The remainder of the article is structured as follows. Section 2 describes the NES2Go framework: its relationship to the RES2Go demand platform, the SMR database, the industrial cluster representation, the dispatch model, and the decision support methodology. Section 3 presents the case study and scenario definition. Section 4 presents the results. Section 5 discusses the implications, strengths, and limitations of the model. Section 6 concludes the article and identifies future developments.
SMR integration in industrial clusters also raises legal, economic, spatial, technical and social (LESTS) questions [41]. NES2Go quantifies selected technical, economic and spatial indicators; legal and social questions require separate assessment.
2. Materials and Methods
2.1. The NES2Go Framework: Architecture and Workflow
Hourly dispatch provides the operating results used in the subsequent assessment. The selected fleet size determines installed capacity and fleet spatial footprint, while simulated utilisation, fuel consumption and useful energy delivery feed the economic calculation. The cost metrics used for ranking apply the stated cost boundary and use energy delivered to demand. Each design that passes the model’s screening criteria is then described by the objectives defined for its operating mode. Pareto sorting identifies designs offering different trade-offs. Each objective is first scaled to the range from zero to one across retained designs in the case. The mean of these scaled values gives the compromise score, which is used to order designs within each Pareto front. Changing preferences in this final stage does not change saved hourly dispatch. NES2Go is an open, Python based (3.10+) nuclear supply workflow that complements RES2Go [35]. RES2Go projects predefined or user defined transition pathways for European industry hubs from the AIDRES industrial blueprints, and supplies the demand side here: clustered industrial production data and process heat demand split over temperature levels using the Hotmaps industry benchmarks [42,43]. Hourly renewable capacity factor profiles are taken from the EMHIRES dataset, which provides modelled wind and solar time series at NUTS2 resolution [44,45,46]. The AIDRES transition pathways provide projected industrial production and energy demand configurations for 2018, 2030, and 2050. They are based on a literature review and feedback from an industrial expert panel [34]. NES2Go adds the nuclear supply side: the harmonised SMR technology database (Section 2.2), load following dispatch kernels for electricity, heat and cogeneration (Section 2.6), a thermodynamic temperature matching gate, fuel and burnup accounting, a dispatch aware implementation of the G4ECONS cost model (Section 2.7), and the multi-objective ranking of candidate designs (Section 2.8).
NES2Go links four components in a single screening workflow: (i) an openly documented catalogue of SMR designs; (ii) cluster level electricity and temperature resolved process heat demand inherited from RES2Go; (iii) an hourly rule-based dispatch model coupling reactor modules, renewable generation, storage, heat delivery, and grid exchange; and (iv) a multi-objective ranking procedure. For each reactor design and scenario, the model applies the thermodynamic temperature gate, simulates annual hourly operation for increasing fleet sizes, records unmet heat, grid imports and exports, fuel use, emissions, footprint, and costs, and then ranks the feasible designs. RES2Go is cited for the construction of the inherited industrial demand data, whereas the present paper describes the nuclear supply side catalogue, dispatch, coupling, and ranking added by NES2Go.
NES2Go can also assess SMR integration for a single company by replacing the cluster inputs with the company’s electricity demand profile and process heat demand by temperature level.
The framework is organised as a staged pipeline (Figure 1). The user selects a target industrial cluster and demand scenario; an operating mode (heat only, electricity only or cogeneration); an optional renewable share for solar and wind; an optional battery energy storage configuration; a self-sufficiency target X, the share of annual electricity demand covered by onsite supply, with the grid supplying the remainder (Section 2.5); and a deployment scope year that limits the analysis to designs expected to be commercially available by that date. All remaining parameters (reliability thresholds, discount rates, thermal losses, search bounds) are exposed in a single configuration file, so that every run is reproducible.
Figure 1.
Overview of the NES2Go framework.
Given these choices, the framework runs the following workflow. Stages 1 to 4 prepare the inputs, including loading and enriching the database; Stage 5 performs the hourly simulation; and Stages 6 to 8 evaluate and export the results.
- Stage 1: load, normalise and enrich the SMR database (canonical field mapping, documented fallbacks for missing values, derived quantities such as the availability factor); missing values are filled using the documented derivations or defaults where available. If a required input remains missing, the design is excluded from the assessment that needs it. For example, a missing design life prevents economic ranking but does not by itself prevent a dispatch calculation;
- Stage 2: apply the deployment scope filter, removing designs whose commercial operation date lies beyond the scenario year, and precompute nameplate plant economics for the scoped catalogue;
- Stage 3: construct the hourly cluster demand: an electricity series and, for the thermal modes, a process heat series split over five temperature bins;
- Stage 4: if renewables are enabled, size solar and wind from the requested share and superimpose them, with the battery model, to form the net demand;
- Stage 5: for each remaining design, test candidate fleet sizes through hourly coupled dispatch, including scheduled refuelling outages, and identify a fleet passing the prescribed operating and reliability criteria;
- Stage 6: evaluate plant economics for every feasible design with the G4ECONS cost model, refreshing the precomputed nameplate figures with the realised, dispatch aware capacity factor;
- Stage 7: rank the feasible designs on a multi-objective Pareto front;
- Stage 8: export ranked tables and interactive dashboards reporting, per design, the hourly powers, thermal and electrical service, battery state of charge (SoC), grid exchange, unmet demand, heat service per temperature bin, and fuel balance.
Dispatch is resolved at hourly resolution. The RES2Go files for the port of Antwerp supply 8736 consecutive profile steps (1 January through 30 December); 31 December is absent and is not imputed. Annualised quantities (capacity factors, fuel balances, levelised costs and the energy balance sizing bound) use the mean Gregorian year of h as their common annualisation constant. Thus reported annualised flow quantities are 0.34% above the sums of the 8736 simulated hours; the source demand totals stated below remain the supplied input totals. Longer term evolution is captured by evaluating distinct pathway years (current reference scenario and 2050) rather than a continuous multiyear run, so each simulation characterises one snapshot of the industrial transition.
The three operating modes use the same dispatch heuristics, with a separate kernel for each mode. Cogeneration uses one hourly kernel to evaluate heat demand, electricity demand, renewable generation and storage together (Section 2.6.4).
2.2. SMR Technology Database
Generic values fill selected catalogue gaps, so not every parameter is design specific. Required inputs depend on the operating mode and economic calculation; an empty original cell does not cause exclusion where an implemented derivation or documented default provides that quantity. Dispatch feasibility and economic eligibility are separate checks. Automated parsing and consistency checks can identify structural errors but cannot establish the accuracy of every plausible published value. The supply side catalogue is a harmonised database characterising 71 current SMR designs across 60 documented physical and operational fields, compiled from publicly available sources (principally the IAEA Advanced Reactors Information System booklet [47], complemented by World Nuclear Association overviews [48], vendor documentation and additional information sourced online) and harmonised into a single machine readable dataset [40]. Source attribution follows a hierarchical policy: every value defaults to the IAEA SMR booklet and ARIS entries [47] unless a specific reference key assigns it to a dedicated design or vendor document, and the complete per value source matrix and reference list are distributed with the dataset itself [40]. Designs span six technology families: land based water cooled, marine/floating water cooled, high temperature gas cooled reactors (HTGR), liquid metal cooled fast reactors (sodium cooled, lead cooled and lead bismuth cooled), molten salt reactors (MSR), and microreactors. Electrical outputs range from 0.03 to 470 MWe and deliverable heat source temperatures from 160 to 800 °C, the parameter that governs process heat matching (Section 2.6.2).
The 60 fields group into six blocks: identity and family; power ratings (thermal and electrical output, net efficiency); temperatures (core inlet/outlet, heat source, and the derived deliverable temperature); operational parameters (ramp rate, minimum load, refuelling cycle, outage duration); fuel and neutronics (discharge burnup, enrichment, uranium/plutonium composition, heavy metal and fissile inventories, fuel form); and physical attributes (reactor pressure vessel geometry, plant and site spatial footprint, and land use intensity indicators). A design status field, populated for every entry, records the reported maturity of each concept: 31 designs are at the conceptual stage, 13 at basic and 17 at detailed design, 6 under construction or development, and 4 in operation. The catalogue’s maturity heterogeneity is thus explicit and traceable, although the ranking itself does not weight designs by maturity (Section 5). Table 2 summarises the families.
Table 2.
Distribution of the 71 SMR designs in the NES2Go database by reactor family.
On load, the raw catalogue is parsed with automatic header row detection and decimal comma normalisation, organised into technology families (family header rows are detected as rows carrying a category name but no technical fields), and mapped onto a single canonical scheme by substring and fuzzy matching against a configurable column dictionary, so that heterogeneous vendor and IAEA headers resolve consistently; cells flagged as placeholders (for example “NA”, “TBD”) are treated as missing. A set of documented, deterministic gap filling rules is then applied per design (Table 3). A technical availability factor (AF) is computed from the refuelling cycle and outage duration,
with continuously refuelled designs set to 100%; missing site footprints are estimated from a land use intensity indicator scaled by annual generation; textual commissioning dates are standardised to integer years; and every design is assigned a lifecycle emission intensity defaulting to 12 gCO2eq/kWhe, used as a reference IPCC median [49] (UNECE (2022) reports a narrower 5.1–6.4 gCO2/kWh for modern reactors [50]). Missing fuel and fissile inventories are filled from the family specific burnup mass balance of the dispatch model (Section 2.6). The footprint calculation records whether the input is a reported site area, a reported plant area, an estimate from land use intensity or results from missing data. Such flags identify the basis of the footprint calculation but do not verify the underlying catalogue values [40].
Table 3.
Deterministic enrichment and gap filling rules applied to the SMR database.
Applying these rules to the present catalogue (71 designs across six families), coverage is uneven: roughly one third of catalogue cells are blank, part of which is inapplicable by family (for example pebble or salt fields for water cooled designs) and part genuinely missing. Two points bear on the objectives. First, lifecycle emission intensity is not reported for any design, so the uniform 12 gCO2eq/kWhe reference intensity applies throughout; the emission indicator is therefore a technology level constant rather than a design discriminator (Section 2.8). Second, reported plant and site footprints are present for the full catalogue and feed the spatial footprint objective directly, with the land use intensity estimate (Table 3) used only where a reported footprint is absent. A further 22 of the 71 designs lack an explicit commissioning year and take the 2040 fallback, treated conservatively by the deployment scope filter (Section 3).
2.3. Industrial Cluster Demand Representation
The demand side is inherited from RES2Go [35] and is summarised here. Electricity demand profiles for the target cluster are taken directly from the RES2Go scenario workbooks. Process heat demand is built bottom up from two independent inputs: production volumes for each plant () and benchmarks for the thermal energy required per unit of each product (). Annual production per site and product (with its 2018/2030/2050 scenario projections) is supplied by the AIDRES plant level European industrial database [34], while the corresponding thermal intensity and its temperature profile come from the Hotmaps industry benchmark dataset [42,43]. For each site the annual thermal duty is calculated as:
and is distributed across five canonical temperature bins (<100, 100–200, 200–500, 500–1000, >1000 °C) using that product’s Hotmaps temperature shares, then summed over the cluster and normalised to cluster wide bin fractions. The thermal intensity () is computed from the benchmark’s final energy columns as
Fuel and electricity intensities are final energy quantities, with carrier specific process heat shares selecting the part assigned to process heat. No additional boiler, furnace or electric heater efficiency is applied; this screening formulation therefore treats selected final energy as useful heat with an implicit conversion efficiency of one. Under the adopted benchmark mappings for the products matched to the port of Antwerp, the electricity process heat shares are zero and the audited electricity assigned to heat is 0 MWh. Because the adopted Hotmaps benchmark assigns no electricity consumption to process heat for the products represented in the port of Antwerp, there is no double counting between the estimated heat demand and the reference electricity demand. This does not establish that actual industrial electricity use contains no heating. Alternative electrification assumptions would require a consistent transfer between the electricity and heat accounts. This extension is outside the scope of the present assessment.
In addition to the reference conversion efficiency of 1.0, we tested fuel conversion efficiencies of 0.9 and 0.8 for H30 and CHP30 with baseload heat demand. Production volumes, electricity demand and the shares of heat at different temperatures were held constant. Useful heat demand was multiplied by the selected efficiency. These values are illustrative assumptions, not measured efficiencies for the port of Antwerp. An EPA example describes an industrial boiler at 80% efficiency and improvements reaching 89% [51]. This provides context for boiler sensitivity assumptions; it does not establish efficiencies for furnaces or all industrial processes. About 38% of the constructed heat demand lies in the 500–1000 °C bin, where boiler evidence alone is insufficient.
This five bin decomposition is consistent with the peer reviewed quantification of European industrial heat demand by branch and temperature level [52,53]; the latter study also informed the Hotmaps benchmark data. Cluster products are matched to benchmark entries by normalised exact, then fuzzy, then synonym assisted matching; sites without a confident match are logged and excluded rather than estimated.
Annual process heat demand is estimated from industrial production and Hotmaps thermal intensity benchmarks, with hourly allocation specified separately. No measured hourly heat series is available for this application, so electricity consumption is used only as a proxy for hourly activity.
In the electricity linked reference mode (the NES2Go default), the thermal load follows a continuous linear ramp between a configurable floor, set to 50% of nominal heat in the present configuration, and full duty at the shutdown threshold, set to 20% of the electrical peak. The profile is rescaled so that the annual thermal total is preserved exactly. The linkage treats electricity consumption as a proxy for overall cluster activity: a deep electrical trough signals reduced cluster wide activity, while normal load variation leaves continuous processes near full heat duty. For the reference case for the port of Antwerp, the electrical profile never crosses the threshold, so the resulting heat profile is effectively constant over the year. A step option and a flat continuous baseload alternative (the annual duty spread uniformly over all hours) are also available for users to select. This profile is constructed for the selected set of sites: a whole cluster, a subset of the cluster, or one company when matching input data exist. The results for the port of Antwerp below use the full selected cluster. The heat profile sensitivity instead uses the Hotmaps chemical and petrochemical hourly profile for Belgium, normalised to exactly the same total heat demand and applied to the same temperature split [54]. The electricity linked reference profile and flat baseload coincide for the port of Antwerp, so they are represented by one reference run. This comparison changes hourly shape only; it does not introduce measured plant shutdown schedules. The case study demand scenarios are defined in Section 3.
2.4. Renewable Generation and Storage
Renewable generation is treated as an exogenous supply that reduces the residual demand seen by the reactor fleet, forming a nuclear and renewable hybrid whose value for combining firm and variable low carbon supply in industrial energy systems has been reviewed in detail [55]. Hourly solar PV and wind capacity factor profiles () are drawn from the EMHIRES dataset (average year 8760 h series at NUTS2 resolution [44,45,46]) and matched to the cluster’s NUTS2 region or regions (the port of Antwerp, for example, spans BE21 and BE23). Installed capacities are back solved from a user specified renewable share target using the resource yield per unit capacity, . The net demand profile is then passed to the dispatch kernel; renewable surplus first charges the battery and only the remainder is recorded as grid export. The battery energy storage system (BESS) is modelled as a single reservoir with SoC tracked in MWh, a round trip efficiency, power and energy limits, and a minimum SoC level.
2.5. Grid Exchange and the Self-Sufficiency Target
The reactor fleet need not serve the entire cluster demand. The target share of annual electricity demand supplied on site is a user input. The self-sufficiency target (X) is calculated as:
with the annual imported electricity and the annual cluster electricity demand. Fleet sizing tests the realised import against the selected target. At , the target is no grid import under the implemented import check. This does not imply uninterrupted demand service: the separate annual shortage energy and shortage hour criteria can still admit shortfalls. Users can vary X to change the permitted reliance on grid supply. The target applies to electricity only: process heat cannot be imported, so the heat reliability criterion is unchanged. The case study uses , for which no grid import is permitted. For , the code can either assign the allowed import share pro rata within the dispatch loop or use the grid as residual backup and evaluate X afterwards; the latter concentrates import in demand peaks and refuelling windows. In both cases the peak import is bounded by the specified cluster grid connection. The N–1 import capacity of the port of Antwerp (Belgium) is approximately 6 GVA. It is calculated from the 380 kV line ratings using , where S is the apparent electrical capacity, V is the line voltage, and I is the current rating. For each grid corridor, the capacity of its largest circuit is then removed to represent an condition, and the remaining capacities of the relevant corridors are summed. This gives approximately 6.16 GVA, rounded to 6 GVA in this paper [56]. The capacity is well above the residual electricity demand after nuclear fleet sizing and therefore does not constrain the case study. The economic cost of imported energy, and its sensitivity to X, are treated in Section 2.7.
2.6. Dispatch Model
2.6.1. Common Load Following Mechanics
All three operating modes use a deterministic hourly dispatch policy intended for rapid screening across the reactor catalogue. The first simulated step allows operation without a preceding cold startup or ramp from zero. In electricity and heat modes, available modules with more accumulated fuel use are loaded first. Before shutting a module down, these modes check demand during the restart lockout window, which is 24 h in the frozen configuration. These rules prescribe dispatch rather than solve for the least cost hourly schedule. Each SMR module retains its operating state, power setpoint and accumulated burnup. SMR modules already operating are prioritised, subject to the implemented loading, fuel and switching rules. The resulting schedule evaluates a candidate fleet against the stated operating and reliability criteria; it does not establish least cost operation or minimum annual cycling. Even with fixed electricity prices, alternative schedules can change fuel consumption, surplus generation and useful energy delivery. The load following context is discussed in [27]. Changes in module output are constrained by a per step ramp limit (, where r is the catalogued ramp rate in % of nominal power per minute), a minimum load level, , where m is the design minimum load fraction, and minimum up/down times (default 24 h) with start/stop hysteresis margins (1.05/0.90). Modules accumulate burnup in proportion to load and enter a fixed duration refuelling outage on reaching 99% of their design burnup. After the refuelling outage, the modules return with fresh fuel.
2.6.2. Heat Only Mode and the Thermodynamic Temperature Gate
Process heat can neither be exported nor stored in the battery, and a reactor cannot serve a process requiring a higher temperature than it can deliver. The heat only kernel therefore applies a thermodynamic gate before dispatch. The temperature available at the cluster connection point is estimated from the design’s core outlet temperature (COT) by subtracting an assumed temperature difference per heat exchanger and an assumed temperature drop during delivery,
with the number of exchangers in the heat path. Circuit counts are assigned by reactor family for this screening calculation, using the technology descriptions in [47]: one for BWRs (direct steam path), two for PWRs, LFRs and HTGRs (steam generator or intermediate heat transport loop), and three for MSRs and SFRs, where an intermediate loop separates the fuel salt or the primary sodium from the power cycle; two circuits are assumed where the technology cannot be resolved. The floor assumes at least one isolation exchanger between the reactor circuit and the industrial heat user, including for BWRs with a direct steam power cycle. The delivered temperature penalty is therefore 45 °C for designs with one or two circuits and 75 °C for three circuit designs. The same routing supplies the turbine inlet temperature of the power path, with , wherever the database reports none (Section 2.7). Each of the five temperature bins is then served by linear interpolation: 100% if , 0% if , otherwise . Demand above the reactor’s thermodynamic reach is recorded separately as unmet high grade heat rather than causing outright failure, and only the satisfiable duty enters the dispatch kernel.
The delivery temperature drop of 15 °C is selected as a test value without a supporting measurement or literature reference. The 30 °C difference per exchanger is also a fixed screening assumption. Both values are applied to all designs without calculating exchanger performance or heat transport conditions. These deductions affect the temperature matching calculation; no separate heat delivery efficiency is applied to the energy balance. Linear interpolation assumes that heat demand is uniformly distributed over the temperature range of each bin. Heat coverage is therefore conditional on these temperature and demand assumptions.
2.6.3. Electricity Only Mode
The electricity only kernel dispatches the fleet plus ESS against the (net) electrical demand, with no thermal constraint. Battery discharge covers deficits (accounting for round trip efficiency) and opportunistic charging absorbs renewable and nuclear surplus at minimum load; residual surplus is recorded as grid export.
2.6.4. Cogeneration Mode
The cogeneration kernel uses two dispatch stages per hour (Figure 2). The first allocates thermal power to heat demand supported by the temperature gate. The minimum load constraint applies to total core output. A module also supplying electricity can therefore provide process heat below the standalone minimum thermal output, provided the combined loading satisfies the constraint. The second stage meets residual electricity demand from the thermal capacity remaining after heat extraction. For each module, the available electrical output is
Figure 2.
Hourly cogeneration dispatch. Pink denotes start and end points, blue denotes inputs, yellow denotes decisions, gray denotes process steps, and purple denotes recorded outputs. The temperature gate defines supported heat demand; direct heat allocation and electricity generation share core thermal output. Rejected energy is credited only against residual demand reachable at its assigned delivered temperature. Renewables, storage and grid exchange close the remaining balances.
The design net electrical efficiency is held constant with load and extraction in this screening representation. Each unit of direct process heat displaces units of electrical potential under this assumption; this calculation allocates energy between heat and electricity. It does not model steam extraction at individual turbine stages. After electrical setpoints are fixed, rejected energy is calculated as . Recovery is credited only where residual process heat demand is compatible with the assigned delivery temperature of the rejected heat. This temperature is an input assumption rather than an output from a resolved power cycle. The energy balance alone does not establish how much rejected heat is usable. In the first simulated hour of reference CHP30, the ThorCon fleet supplied 6433.59 MWh of direct heat and generated 386.86 MWh of electricity. At the assumed electrical efficiency of 0.4488, core output was 7295.51 MWh, equal to direct heat plus electricity divided by efficiency. Rejected energy was 475.06 MWh. Its assigned delivery temperature was 100 °C. The constructed demand contains no heat below 100 °C, so recovered reject heat was zero. This checks the encoded energy balance; it does not validate a detailed extraction cycle.
A turbine bypass gate forbids sub minimum turbine output (default 10% of nominal electrical power) with start/stop margins.
2.6.5. Module Count Sizing and Reliability Gate
Fleet sizing consists of repeated evaluations under the prescribed dispatch policy. Downward checks stop when the next smaller fleet fails and do not establish a global minimum when feasibility varies irregularly with module count. Termination at a search limit is distinct from demonstrating physical infeasibility.
In electricity mode, the search starts from the larger of two estimates based on peak power and annual energy demand,
The electricity kernel increments N until feasibility is reached, whereas the cogeneration kernel uses a binary search between the start estimate and an auto scaled ceiling, followed by an oversizing headroom check against synchronised outages; applicable downward checks test smaller candidate fleets until the next candidate fails under the prescribed policy. Heat mode starts from the larger of the ceiling of peak supported heat divided by nominal thermal power and an annual energy estimate. It increases the module count until the heat gate passes and checks smaller fleets when the starting estimate already passes. The frozen configuration caps the search at 100 modules. Reliability is evaluated separately for electricity and supported heat in each calendar year, using the hours supplied for that year. Under baseline settings, unmet energy must not exceed 0.1% of the corresponding carrier demand and no more than 180 hourly deficits may exceed 5 MW. Every positive deficit contributes to unmet energy, including deficits at or below 5 MW. There is no absolute unmet energy floor or proportional shortage hour allowance in this campaign. Where renewable generation is included, electricity demand refers to the residual demand after subtracting renewable generation. Thermally inaccessible heat is reported separately and does not enter the supported heat gate. A numerical tolerance of 1 Wh ( MWh) is used for the energy comparison. A key reported quantity is the effective capacity factor, a realised dispatch metric rather than a design assumption:
2.6.6. Fuel and Burnup Accounting
Annual fuel use is computed from a macroscopic burnup mass balance for all fuel forms,
where is the design discharge burnup (MWd per tonne of heavy metal) and e the fissile fraction of heavy metal. The resulting is annual heavy metal throughput or reload, not fissioned mass or fabricated assembly mass. For uranium based fuel (e.g., UO2), the fissile fraction corresponds to the U-235 enrichment. For mixed oxide and other plutonium bearing fuels, the composition vector distinguishes the uranium and plutonium shares, uranium matrix U-235 assay and fissile plutonium fraction, so that when these inputs are resolved. Pebble bed and molten salt relations determine the initial core inventory; the same annual throughput balance applies to their continuous refuelling operation. Load following stretches the cycle, , with a turndown feasibility check; in hybrid configurations the check is waived, because a fleet supplying residual demand after renewable generation may operate below the utilisation threshold applied in the standalone screening check. Annual fissile material requirement is reported for every design and enters the ranking (Section 2.8). It is derived from heavy metal throughput and the catalogue fissile fraction; it does not quantify enrichment capacity, HALEU availability, fabrication capability or other fuel supply constraints. A sensitivity check for the 2030 cogeneration case compared the orderings obtained from annual heavy metal and fissile consumption. Their rank correlation was only (), and the leading designs differed. Annual fissile material requirement is retained as the ranking metric, while heavy metal throughput is reported separately. This comparison does not establish which fuel cycle offers greater security of supply.
2.7. Economic Assessment
The economic assessment uses fleet size and operating results from dispatch, so costs reflect simulated utilisation and useful energy delivery as well as installed capacity. Dispatch adjusted LCOE is calculated with an account-based model from the Generation IV International Forum. A documented adapter maps the physical design inputs to the required accounts using engineering relations and fallbacks [57].
The input costs are expressed in 2026 US dollars, and the reported results are converted to euros using a rate of EUR 0.875 per US dollar, dated 6 July 2026. The results depend on the assumed costs, electricity prices and financing rate. They should therefore be used to compare options, not as predictions of actual project costs.
The account structure combines capital recovery with annual operation and maintenance, fuel and decommissioning terms.
The total capital investment cost (TCIC), capital recovery factor (CRF) and plant levelised cost of energy () are calculated as:
where, in this context, r is the discount rate and N the plant life in years. The plant energy denominator is derived from the simulated module outputs. In electricity mode it includes generated electricity that may subsequently be exported. In heat mode it uses thermal output. In cogeneration it combines electricity and useful heat, with the heat contribution reduced where thermal output exceeds heat delivered to demand. The plant metric is therefore distinct from the cost per unit of energy delivered to industrial demand. Economics are evaluated at discount rates of 3%, 5% and 10% (default 5%) over each design’s catalogued design life, which sets the capital recovery horizon; designs without a published design life are excluded from the comparative economic analysis rather than assigned a default. Because construction, financing, fuel and electricity prices may change, LCOE is used to compare designs under stated assumptions, not as a price forecast. The plant LCOE uses the simulated plant energy denominator defined above and excludes grid purchases. After the hourly simulation determines the fleet output and any grid imports, the grid connected plant LCOE adds the cost of those imports using the central assumed price. For electricity supply, this metric is the cost per MWh delivered to demand, including the cost of grid imports. Plant LCOE instead uses electricity generated by the fleet.
Here is the annual energy delivered by the SMR fleet and grid imports to meet demand after any renewable supply. Electricity exports, storage losses and unused thermal output are excluded from this denominator. In cogeneration, delivered electricity and useful heat are added without allocating cost between them; the resulting metric is the levelised cost of useful energy (LCUE). Heat mode uses the levelised cost of heat (LCOH). The numerator includes the modelled annual SMR plant cost and grid purchases. The grid connected plant LCOE based on the central price is used as the cost measure in the Pareto ranking. Low and high grid prices are tested separately to show how the cost changes. They do not change reactor operation or fleet size.
Sweeping the self-sufficiency target X (Equation (4)), with the grid supplying the complementary share , shows how grid reliance changes grid connected plant LCOE.
Exports receive no financial credit in this calculation. Investment in renewable energy sources, storage and site-specific infrastructure outside the stated SMR cost accounts is excluded from this metric. Renewable and storage capacities are fixed across SMR designs within each configuration, so the assessment compares modelled SMR fleet costs under a common external supply configuration. This does not represent complete integrated system cost. Cost comparisons remain conditional on the boundary, particularly when delivered energy differs between designs.
Turbine islands are costed by cycle. For designs with a turbine inlet temperature below 873.15 K (600 °C), a Rankine cycle correlation is used, whereas the Brayton cycle economics of the INL HTGR cost model are used for designs at or above this temperature [58], applied consistently across coolant types. Cycle specific turbine correlations and reference reactor scaling are applied consistently, but microreactor LCOE values are extrapolative and should be treated as indicative (Section 5).
2.8. Multi-Objective Decision Support Methodology
NES2Go uses economic cost, spatial footprint and annual fissile material requirement as ranking objectives. Costs are calculated after dispatch and affect the ranking of designs; they do not guide the hourly dispatch rules. Heat supply and cogeneration also include total unmet heat demand as a heat service objective. Electricity reliability is enforced through the acceptance gate rather than an additional ranking objective. Grid export and greenhouse gas emissions are descriptive indicators. Each mode uses one economic objective: grid connected plant LCOE for electricity, LCOH for heat supply and LCUE for cogeneration. The cost calculation in Section 2.7 aggregates fleet capital, operating, fuel and decommissioning costs, together with any grid purchases. Carrying those components as additional objectives would enter the same information several times and let economics dominate the ranking, so they are reported alongside the ranking as descriptive cost structure indicators rather than entering it as objectives. The reactor cost estimates are adapted from the G4ECONS guidelines [57] and use the input values and scaling assumptions adopted in this study. They include estimated land, permits, plant electrical equipment, heat rejection equipment, operating costs, fuel costs and an allowance for decommissioning. The model does not separately estimate a project specific grid connection or process heat distribution network. Investment in added renewables and batteries is also excluded from the grid connected plant LCOE. These excluded costs require assessment for a specific project before an investment decision. Spatial footprint is represented by the total spatial footprint of the sized fleet. For most designs this is the per module footprint times the number of modules; for designs the database identifies as multi module integrated plants, the first module carries the full site footprint and each additional module adds only a fraction of it (default 25%), reflecting shared site infrastructure. The land use of any renewable capacity is added. Total unmet heat measures the residual heat service requirement, including thermally inaccessible demand and operational shortfalls on supported heat. It is distinct from the supported heat reliability gate and is not a measure of energy independence. Greenhouse gas emissions are the most important consideration for industrial decarbonisation. However, the catalogue does not support a consistent technology specific lifecycle comparison. Emissions are reported only as contextual information and do not enter the Pareto ranking. The common reference intensity does not establish differences in environmental performance between reactor designs. Further research on the lifecycle assessment of SMRs is needed to provide reliable data for comparing the environmental performance of different reactor designs. These data will be integrated into NES2Go as they become available. Annual fissile material requirement is included as a separate screening objective.
Feasible designs are ranked by nondominated (Pareto) sorting. The four objectives for heat supply and cogeneration are total unmet heat demand, annual fissile material requirement, total spatial footprint and the carrier specific levelised cost. Electricity supply uses the same set without unmet heat, retaining three objectives. All objectives are minimised. Annual grid export and unmet electricity are excluded from the ranking objectives. Each objective is scaled to the range from zero to one using its minimum and maximum across the retained designs in that case. Within each Pareto front, designs are ordered by the mean of these normalised values, giving a weight of one quarter per objective in thermal modes and one third in electricity mode. Ties are resolved using the raw objective values. This multi-objective treatment generalises single cycle SMR optimisation [38,39] to a fleet screening setting.
The Pareto representation supports user selection by displaying trade-offs among nondominated designs. The compromise score provides an illustrative ordering under the selected objectives, each scaled to the range from zero to one and given equal weight. This ordering, however, does not prescribe a universally preferred technology; users may favour other designs according to specific priorities. Alternative weights, normalisations and decision rules have not been assessed.
Annual grid export is retained as a descriptive measure of surplus after dispatch. Neither export nor the ranking score establishes energy independence, backup adequacy or fuel security of supply.
3. Case Study and Scenario Definition
3.1. The Industrial Cluster in the Port of Antwerp
The framework is demonstrated for an industrial cluster in the Antwerp port area, managed by Port of Antwerp-Bruges (PoAB), Belgium. The study area lies within the NUTS2 regions BE21 and BE23. The area contains the largest integrated chemical cluster in Europe [12,46]. Interest in SMRs in the port of Antwerp may arise from the cluster as a whole, a group of companies, or an individual company. The framework can assess potential SMR supply at each of these scales. In the RES2Go representation [35], the cluster is constructed using density based spatial clustering of applications with noise (DBSCAN) (minimum five industrial sites per cluster; 25 km neighbourhood) and comprises 22 industrial sites covering 33 production entries, each carrying plant level annual production volumes (Figure 3). Process heat demand is derived from these production volumes and the Hotmaps SEC benchmarks as described in Section 2. The four refinery sites are retained through the product-based SEC calculation. Electricity demand is taken from the RES2Go workbook for the port of Antwerp, so the heat and electricity inputs cover the same industrial cluster scope.
Figure 3.
Industrial cluster in the port of Antwerp used in the case study. Markers identify the included industrial sites, and colours denote the sector groups used to construct demand. Site data correspond to the AIDRES 2018/2030/2050 scenarios exported through RES2Go [34,35].
The original RES2Go heat export did not provide a matched temperature profile for the four refinery sites. Their heat is therefore represented by an explicit literature informed approximation: 20% is assigned to 100–200 °C and 80% to 200–500 °C. These shares are modelling assumptions. Published refinery assessments discuss the temperature requirements of refinery processes [59,60]. They do not establish the adopted 20%/80% split, which remains an approximation without temperature resolved measurements for these sites.
3.2. Selected Scenarios
Four configurations are selected for the application to the port of Antwerp. H30, E30 and CHP30 represent heat supply, electricity supply and cogeneration using the reference industrial demand dataset and a 2030 reactor availability cutoff (Table 4). The suffix denotes the technology cutoff, not the demand year. Reference heat demand is constructed from the 2018 production census and Hotmaps benchmarks, while electricity demand uses the reference RES2Go profile [34,35,42]. These configurations assess candidate technologies against a common demand basis; they are not complete forecasts of industrial energy demand in the port of Antwerp in 2030. E50R combines the AIDRES 2050 electricity pathway, a 2050 reactor availability cutoff and medium ENSPRESO renewable potential [61]. Differences between E30 and E50R therefore reflect changes in demand, renewable supply and the reactor catalogue rather than the effect of renewables alone.
Table 4.
The four retained scenarios of the results matrix for the port of Antwerp.
The ENSPRESO potentials cover the wider BE21 and BE23 regions, not only the port of Antwerp. E50R therefore tests a regional resource bound against cluster demand; it does not establish that these capacities can be sited within the cluster.
The medium renewable potential is selected to represent a balanced mix of nuclear and renewable generation. This choice is conceptually consistent with the coexistence of nuclear generation and renewable energy in the PATHS2050 REACTOR pathway [14], but E50R is neither calibrated to nor derived from that scenario. A high renewables case would represent a different system emphasis and is therefore not retained alongside the nuclear fleet. E50R remains a combined electrification and renewable case, not a single variable sensitivity.
The reference heat estimate allows designs to be screened against the same production data and heat demand at each temperature level. Projected industrial pathways may change production routes, electrification and temperature requirements; the reference heat estimate should not be interpreted as projected heat demand in 2030 or 2050.
3.3. Simulation Matrix and Parameters
Cases H30, E30 and CHP30 use a no grid import target () without added renewables and screen the 34 SMR designs available by 2030 (Table 4). E50R screens all 71 SMR designs available by 2050 and converts the workbook’s medium ENSPRESO annual potentials into 20,934 MW solar and 1,156 MW wind using the same EMHIRES capacity factors used in dispatch (Table 4). No battery is included in E50R. The operational and reliability screens determine which designs yield feasible fleets. All key parameters are listed in Table 5; the code and database are provided in the study source package (see Data Availability Statement).
Table 5.
Key model parameters.
4. Results
The supplied profiles contain 8736 h, and annualised quantities use 8766 h per year. This section presents the technical, economic and multi-objective performance of candidate SMR fleets for the port of Antwerp. Reported ranking files exclude designs that fail the operational or reliability screens.
A fleet is considered feasible within the model when it passes the implemented operating and reliability criteria. This does not establish licensing, safety, siting, fuel procurement or investment feasibility. Reported module counts require further assessment of reserves, maintenance, infrastructure and site constraints before project use. The cost metrics used for ranking divide the included annual costs by energy delivered to demand; uncredited electricity exports and dumped thermal overload are excluded from this denominator. Production based plant metrics are retained separately for comparison.
4.1. Demand Characterisation
The reference inputs for the port of Antwerp represented a process heat duty of 79.1 TWhth and electricity demand of 6.32 TWh, making heat approximately 12.5 times greater in energy terms. Heat demand was distributed as 26% at 100–200 °C, 35% at 200–500 °C, 38% at 500–1000 °C and 1% above 1000 °C (Figure 4). The small >1000 °C contribution arose from the ammonia benchmark, while heat demand for refineries was assigned to the 100–200 and 200–500 °C bins. The AIDRES pathways projected annual electricity demand of 25.93 TWh in 2030 and 106.10 TWh in 2050. E30 and CHP30 used the 6.32 TWh reference profile; E50R used the 106.10 TWh AIDRES 2050 profile.
Figure 4.
Demand characterisation for the port of Antwerp: electricity load duration curves for the AIDRES trajectories and reference process heat duty by temperature bin. The reference cases H30, E30 and CHP30 use the reference configuration and E50R uses AIDRES 2050 electricity.
4.2. Feasibility and Fleet Sizing
Nineteen SMR designs were retained for cogeneration after operational and economic screening with the 2030 catalogue. Selected fleets ranged from 5 modules for the Rolls-Royce SMR to 98 for HTMR-100, with a median of 17 modules. The ranked fleets served almost all reference electricity demand: maximum annualised unmet electricity was 3.395 GWh, approximately 0.0536% of annualised electricity demand, and annualised shortfalls during operation for heat within the reactors’ temperature range did not exceed 1.31 GWh. Grid export was negligible, below 0.00015 Wh/year, at the no grid import target (). The representative ThorCon week in Figure 5 showed the fleet following electricity demand while delivering a stable supported heat load.
Figure 5.
Representative one week cogeneration dispatch for the ThorCon fleet in the 2030 catalogue case. ThorCon was selected because it achieved the lowest compromise score in the reported results under the selected objectives, each scaled to the range from zero to one and given equal weight.
Natrium used nine modules in CHP30 and recorded 157 h with electricity deficits above 5 MW, against the allowance of 180 h. This fleet passed the adopted criterion, but the margin should be considered when interpreting its performance.
The corrected carrier specific reliability gate selected eight BWRX-300 modules, with LCUE of 56.61 EUR/MWh. Operational unmet electricity was 0.9236 MWh over the 8736 simulated hours, equivalent to 0.9268 MWh on the annualised basis. Each accepted fleet passed the electricity and supported heat gates separately.
Heat coverage depended mainly on delivery temperature. Water cooled designs served approximately 31–37% of heat demand, while Natrium (a sodium cooled fast reactor) served 57% and SEALER-55 (a lead cooled fast reactor) served 62%. HTMR-100 (a high temperature gas cooled reactor) achieved the largest share in the 2030 catalogue, 77% or 60.7 TWhth over the 8736 simulated hours. ThorCon (a molten salt reactor) served 71% (Figure 6). The remaining demand consisted predominantly of thermally inaccessible high-grade heat; operational shortfalls on supported heat were recorded separately. The 1% of demand above 1000 °C was therefore not the main limitation for the 2030 catalogue. The larger constraint was the 29.7 TWhth in the 500–1000 °C band and each reactor’s delivery temperature after the heat exchanger and transport deductions.
Figure 6.
Process heat coverage for ranked 2030 cogeneration fleets over the 8736 simulated hours. Blue denotes useful heat delivered and orange denotes demand beyond the reactors’ temperature range. Demand and supply use the same time basis.
4.3. Economic Performance
For the cogeneration fleets retained from the 2030 catalogue, estimated LCUE ranged from 39.84 to 124.99 EUR per combined useful MWh, with a median of 64.20 EUR/MWh. ThorCon (39.84 EUR/MWh), Rolls-Royce SMR (41.86 EUR/MWh) and Natrium (43.99 EUR/MWh) were the lowest cost modelled options (Figure 7). Annualised capital recovery was the largest cost component for all 19 retained designs. Operating costs were lower than capital recovery in every case. Fuel costs were nonzero and smaller than capital recovery, but were not negligible for every design.
Figure 7.
Scenario based composition of dispatch adjusted LCUE for feasible cogeneration fleets. Values are comparative model outputs, not forecast market prices. Fuel combines Accounts 55 and 80; operation and maintenance combines Accounts 70 and 90.
Module size was strongly associated with LCUE in this retained set: nominal module electrical capacity and LCUE had a Spearman rank correlation of (), so LCUE generally increased as nominal module capacity decreased. This association is descriptive rather than causal because reactor technology, fleet size and cost assumptions vary together. Because the result depends on construction, financing and fuel assumptions, LCUE is used as a comparative screening indicator rather than a forecast price.
Levelised metrics varied widely across operating modes and scenarios. LCOE, LCOH and LCUE used different delivered energy denominators and the stated financial assumptions; they supported comparisons within a consistent mode and scenario, but their numerical levels were not directly comparable across energy carriers.
4.4. Multi-Objective Ranking
The Pareto analysis retained multiple nondominated designs because low cost, small footprint, low annual fissile material requirement and high heat coverage did not coincide (Figure 8). Fleet footprints ranged from 5500 to 4,050,000 m2 (0.55–405 ha), and annual fissile material requirements ranged from 1.595 to 7.520 tonnes per year. Eight of the 19 designs have no nominal capacity factor in the fuel data (ACP100S, BREST-OD-300, CAREM, HTMR-100, KP-FHR, Natrium, SEALER-55 and SSR-W). Their fissile requirement remains the catalogue value times the number of modules and does not follow core thermal output. Missing consumption values are filled at a utilisation of 0.90; SSR-W retains its reported fissile value. LFR-AS-200 had the smallest footprint, ThorCon had the lowest modelled LCUE, and HTMR-100 delivered the most heat.
Figure 8.
Tradeoff between cost and footprint for retained 2030 cogeneration fleets. Marker colour gives annual fissile material requirement and marker shape gives Pareto rank.
ThorCon achieved the lowest compromise score in CHP30 (0.113) under the four equally weighted objectives. This result is conditional on the adopted inputs and scoring convention. The Pareto representation allows users to select other candidates according to their preferred trade-offs.
4.5. Comparison Across Scenarios
Screening retained 20 designs for heat supply (H30), 21 for electricity supply (E30), 19 for cogeneration (CHP30), and 16 for electricity supply with renewables (E50R) (Figure 9). E50R combined a much larger electricity load, a later catalogue and substantial variable renewable capacity. Fewer designs were retained than in E30 despite the larger technology catalogue. Median grid connected plant LCOE was 147.98 EUR/MWhe in E50R and 201.00 EUR/MWhe in E30. This difference cannot be attributed to one factor because demand scale, renewable supply and catalogue scope changed together. E50R therefore provides a contrasting configuration rather than a causal sensitivity.
Figure 9.
Retained design counts and median carrier specific levelised costs for the four retained matrix cells: H30 uses LCOH per MWhth, E30 and E50R use LCOE per MWhe, and CHP30 uses LCUE per combined useful MWh. The values are not directly comparable across cost bases.
ThorCon achieved the lowest equal weight compromise score in each case: 0.148 in H30, 0.091 in E30, 0.113 in CHP30 and 0.092 in E50R. Rolls-Royce remained the minimum cost design in H30 and E50R, illustrating that the compromise ordering differed from the cost only ordering. These scores use case specific normalisation and are not cross case performance measures.
4.6. Sensitivity to Conversion Efficiency, Heat Profiles and Reliability
4.6.1. Conversion Efficiency
Lower useful heat demand generally reduced fleet sizes (Table 6). In CHP30, ThorCon had the lowest cost at efficiencies of 1.0 and 0.9; in H30, Rolls-Royce and SMR-300 had the lowest costs at 1.0 and 0.9, respectively. At 0.8, Rolls-Royce became the cheapest design in both H30 and CHP30 after its fleet decreased by one module. ThorCon retained the lowest compromise score. Costs must be interpreted alongside heat coverage, which differs between designs.
Table 6.
Fuel conversion efficiency sensitivity for Rolls-Royce and ThorCon in the reference cases for the port of Antwerp. H30 costs are LCOH per useful MWh of heat. CHP30 costs are LCUE per combined useful MWh of heat and electricity. All eligible designs were tested; these rows illustrate the change in cost ordering.
BWRX-300 in H30 was an exception: its fleet increased from four to five modules at efficiencies of 0.9 and 0.8. Two modules reached their refuelling trigger in the same hour near the end of the year, and the extra module was needed for approximately the last 56 h. This reflects overlapping refuelling outages with initially fresh cores in a single year. It should not be interpreted as a general response to lower heat demand. The full results retain this design.
On the 20 H30 designs common to all three efficiencies, median LCOH was 49.30, 54.46 and 54.39 EUR/MWh at efficiencies of 1.0, 0.9 and 0.8. Excluding BWRX-300 from this common set gives medians of 49.46, 54.60 and 54.16 EUR/MWh. The maximum increases in LCOH were 32.59% and 48.03% with BWRX-300 included, and 11.16% and 10.40% without it (Figure 10). STAR became eligible at 0.9; STAR and Flex Reactor were eligible at 0.8 in addition to the reference set. Medians over all eligible designs therefore compare different populations. The 19 CHP30 designs were unchanged, with median LCUE of 64.20, 64.90 and 67.02 EUR/MWh.
Figure 10.
Range of cost changes on designs common to efficiencies of 1.0, 0.9 and 0.8. H30 is shown with and without BWRX-300 to expose the effect of overlapping refuelling outages. CHP30 includes all 19 common designs.
In heat mode, fuel cost follows simulated heat output for designs whose fuel data support a dispatch balance. It is not a fixed annual charge per module. KP-FHR, SSR-W, HTMR-100 and RITM-200M remain on the catalogue fuel charge. The rise in LCOH when useful heat demand falls is therefore not a uniform reciprocal scaling of a fixed fuel component.
4.6.2. Heat Profiles and Reliability
Replacing the baseload reference with the Hotmaps chemical and petrochemical profile preserved total heat and retained all 19 ranked CHP30 and 20 ranked H30 designs (Figure 11). The variable profile had a coefficient of variation of 1.91%. Nine CHP30 fleets required one or two additional modules; ten H30 fleets required one to three additional modules. LCUE increased by up to 10.27% in CHP30, and LCOH by up to 11.70% in H30. Median capacity factor remained 48.52% in CHP30 and decreased from 96.42% to 93.94% in H30; individual changes for some SMR designs were larger. Relative changes in heat coverage were below 0.02%. The first Pareto front remained unchanged at 12 designs in CHP30, while CAREM moved to a later Pareto front in H30. ThorCon retained the lowest reported compromise score in both profile comparisons. These results describe the response to a profile with limited hourly variation; production shutdowns were not tested.
Figure 11.
Matched heat profile sensitivity for H30 and CHP30. The dashed comparison lines indicate unchanged values. The same annual heat and temperature split are used in both runs.
Three additional tests reduced the energy allowance to 0.01%, reduced it to zero subject to numerical tolerance, or reduced the allowance for hourly deficits above 5 MW to three hours (Figure 12). Each test changed only its stated gate parameter. The three-hour allowance counts total deficit hours and does not constrain the length of consecutive interruptions. The numbers of retained H30 and CHP30 designs remained 20 and 19, respectively, although stricter settings increased some fleet sizes and costs. Under the zero-energy test, E30 retained 20 designs rather than 21; E50R retained 15 rather than 16. The three-hour test also reduced E50R to 15 designs. Search limit exclusions describe failure to find an accepted fleet within the configured search, rather than proof that the technology is physically infeasible.
Figure 12.
Reliability gate sensitivity. The energy tests retain the baseline 180-h allowance, and the three-hour test retains the baseline 0.1% energy allowance. Counts refer to SMR designs retained after operational and economic screening.
5. Discussion
5.1. Matching SMR Technologies to Industrial Temperature Demand
The temperature gate (Section 2.6.2) makes the thermodynamic compatibility between reactor families and cluster demand explicit. Water cooled SMRs, with heat source temperatures of roughly 160–300 °C, can in principle serve the two lowest temperature bins that dominate steam based chemical processing, while high temperature gas cooled and molten salt designs (700–800 °C) additionally reach into the 500–1000 °C bin. Demand above 1000 °C is beyond every catalogued design and may be met by electrification, hydrogen or another route. For the port of Antwerp, however, this extreme temperature tail was only 1% of annual heat. The practical screening constraint was the much larger 500–1000 °C band: 2030 catalogue designs served 31–77% of total heat in CHP30. Temperature compatibility must therefore be evaluated against the full demand distribution rather than a single maximum process temperature.
5.2. Cogeneration and Economic Viability
Prior techno-economic work indicates that revenue from heat and electricity is often what makes SMRs economically viable for industrial applications [24,25,26]. The coupled kernel of Section 2.6.4 represents the heat and electricity allocation at hourly resolution using a constant efficiency energy balance. It supports comparative screening of heat service and electrical output, while dedicated cycle studies resolve extraction behaviour in more detail [38]. In the reference cases for the port of Antwerp, cogeneration retained a similar number of designs to the modes supplying one energy carrier (19 in CHP30, 21 in E30 and 20 in H30), but a different cost denominator. The median LCUE for cogeneration was 64.20 EUR per combined useful MWh, while the E30 median grid connected plant LCOE was 201.00 EUR/MWhe. Most useful energy in cogeneration was heat, so these figures had different bases and cannot establish the cost of cogenerated electricity alone. Heat is nevertheless central to the utilisation and economics of an industrial SMR fleet, but electricity and useful heat cost metrics must remain explicitly distinguished.
5.3. Interpretation and Uncertainty of the LCOE Results
The account based economic model follows established bottom-up cost estimation methods for nuclear systems and is consistent with the methodological approaches reviewed in the SMR literature [29,30,62].
Published SMR estimates vary substantially because studies apply different assumptions concerning construction maturity, financing, reference year, capacity factor and system boundaries. Direct numerical comparison is therefore limited.
NES2Go calculates levelised metrics using useful energy delivered by the hourly dispatch simulation rather than generation at a fixed design capacity factor. This can produce different values for load following fleets and small modular configurations. Cogeneration LCUE is not directly comparable with electricity only LCOE because its denominator combines useful electricity and heat.
These LCOE values are conditional model outputs under the stated cost, financing and electricity price assumptions; they are not project quotations or forecasts. They are interpreted alongside temperature compatibility, reliability, spatial footprint, fissile consumption and grid dependence.
5.4. Interpreting the E50R Configuration
E50R tested a different system scale, combining 106.10 TWh of annual electricity demand, medium ENSPRESO renewable potential and the 2050 catalogue. Sixteen SMR designs were retained. Renewable supply reduced residual energy demand but did not remove the need to serve a high residual peak. Renewable land use enters the footprint objective, while renewable and battery investment remain outside the grid connected plant LCOE boundary. In E50R, renewable generation affects this cost metric by changing the residual electricity demand served by the SMR fleet and any grid purchases. No battery is included in this case. The median grid connected plant LCOE of 147.98 EUR/MWhe was a conditional result for this configuration; it does not establish that renewable integration alone reduced nuclear cost. Separate controls would be needed to distinguish the effects of demand growth, catalogue maturity and renewable deployment.
5.5. Land Use, Fuel and Siting Considerations
The spatial footprint objective reflects a binding constraint in dense industrial areas such as the port of Antwerp, where available land competes with industrial expansion [63]. Passive safety features and reduced emergency planning zones may be enabling factors for colocation with industrial facilities [28], but siting near dense petrochemical infrastructure remains subject to regulatory frameworks that this model does not represent. Annual fissile material requirement is a screening indicator derived from the adopted fuel and burnup inputs. It does not by itself quantify fuel security of supply across dissimilar nuclear fuel cycles; enrichment, fabrication and other supply chain constraints require separate assessment.
Existing nuclear sites may offer grid connections, cooling water and licensing advantages, but the present footprint metric does not represent site availability or suitability. Public Belgian screening has identified potential SMR areas near industrial clusters without disclosing detailed locations [64]. The demand census for the port of Antwerp itself includes an industrial site at Doel, illustrating why industrial and nuclear siting questions can overlap without establishing that location as feasible.
5.6. Policy Relevance for European Industrial Clusters
For European industrial clusters, the analysis complements studies of energy systems in industrial clusters [8,9] and European SMR assessments [30] by providing a reproducible, design resolved evaluation layer that can inform early stage screening before detailed feasibility studies. In the Belgian context, where firm low carbon capacity, land scarcity and industrial competitiveness intersect [13,14], such screening can support the option value discussion around SMR deployment that policy in the REPowerEU era has reopened [4].
5.7. Social Considerations for Industrial Siting
Research on industrial clusters suggests that trust and acceptance matter for successful cooperation. Siting an SMR near industrial users also requires early engagement with workers, neighbouring communities and public authorities, since local concerns about risk and acceptance could affect implementation [9,65]. These social factors are not represented in the present ranking and need assessment for each proposed site alongside the technical, economic, spatial and legal criteria.
5.8. Limitations
NES2Go provides catalogue screening under the stated technical and economic assumptions. It is not a full power system optimiser or a detailed thermodynamic model of the power cycle. The representative dispatch week illustrates operating behaviour, while fleet acceptance uses the implemented operating and reliability tests over the simulated horizon. These checks establish consistency with the encoded assumptions rather than validation against measured SMR operation. Fleet sizing tests candidate module counts using the prescribed dispatch rules. It does not examine every possible operating schedule. A different schedule might meet the criteria with fewer modules, fewer starts or lower cost; these possibilities are not ruled out by this screening calculation.
Annual heat is estimated from production and process heat shares of final energy, with an implicit useful heat conversion efficiency of one. Efficiencies of 0.9 and 0.8 were tested by scaling only the heat demand (Table 6 and Figure 10); production volumes, electricity demand and temperature shares were unchanged. The reported reference heat profile is effectively constant for the port of Antwerp. The reference profile does not represent measured production shutdowns. The fixed temperature deductions, including the assumed 15 °C delivery test value, and uniform within bin interpolation are screening assumptions. The 500–1000 °C bin is particularly broad. The present results do not establish robustness to alternative temperature margins or within bin distributions; a systematic assessment of these assumptions remains future work. The Hotmaps profile varies hourly demand but does not represent measured plant turnarounds. Such turnarounds are planned in advance. Lower demand during a planned shutdown may allow reactor output to be reduced or refuelling to be coordinated with the shutdown. Under EU outage-coordination rules, the availability of relevant generating units is planned a year ahead [56] (Art. 94). This advance notice may help coordinate refuelling. The effects on fleet size, reliability and operating constraints require a dedicated dispatch assessment. Reduced heat sales may increase the levelised cost, depending on the resulting operation and costs. Cogeneration assumes constant electrical efficiency and checks whether heat can be delivered at the required temperature. It does not resolve the pressures at which steam is extracted.
Other simplifications include a single reservoir battery without degradation, instantaneous unit startup, power proportional burnup rather than neutronics, sequential dispatch, and shortage allowances that can admit supply interruptions. Annual shortage energy and shortage hour limits do not specify acceptable interruption durations for individual industrial processes. Project assessment requires process specific continuity criteria, backup arrangements and maintenance coordination. Thermally inaccessible heat remains an additional service requirement outside the operational reliability gate. Simplifications may favour modelled fleet performance, but they do not establish mathematical lower bounds on fleet size or upper bounds on utilisation.
The reported cases are single year snapshots with all modules initially loaded with fresh fuel and no requirement to restore the initial amount of usable fuel at the end of the simulated year. The reported module counts therefore depend on the assumed initial fuel state. Operation in a following year would start with partly used fuel and potentially different refuelling dates. Since that continuation was not simulated, these results do not establish how many modules would be needed over successive years.
Results inherit uncertainty from precommercial technology, cost and demand inputs [21,29,40]. Completeness and consistency checks cannot establish the accuracy of every published catalogue value, and generic default values limit design specific interpretation. The catalogue mixes operating designs and early concepts; the availability cutoff does not establish licensing or delivery readiness. Microreactor economics are particularly sensitive to fixed costs and extrapolation outside the cost model’s calibrated range. Economic outputs are estimates under the stated accounts, financing and utilisation assumptions, not observed commercial project costs. The multi-objective representation exposes trade-offs but does not quantify or remove input uncertainty.
The quantitative findings apply to the port of Antwerp, the stated data sources, selected scenarios and assumed technical and economic system boundary. Other clusters or companies require corresponding local inputs and further assessment. NES2Go compares SMR options with one another; a complete decarbonisation assessment also requires comparison with electrification, hydrogen and other supply routes. Emissions are contextual and do not provide a technology specific lifecycle comparison.
6. Conclusions
NES2Go provides a common workflow for screening SMR designs against industrial electricity and temperature resolved heat demand. It connects a harmonised reactor catalogue with hourly fleet dispatch, economic assessment and Pareto ranking at the industrial cluster or company scale.
In the case study for the port of Antwerp, the temperatures required by industrial processes strongly influenced how much heat the candidate reactors could supply. The screened designs exhibited trade-offs among modelled cost, footprint, annual fissile material requirement and heat coverage. In the reported reference cogeneration case for the port of Antwerp, ThorCon achieved the lowest modelled LCUE and compromise score under the selected objectives, each scaled to the range from zero to one and given equal weight. These findings identify candidates for further assessment rather than establish investment requirements or a universally preferred technology.
The results remain conditional on catalogue quality, demand construction, operating assumptions and the economic boundary. Future work should improve useful heat estimates and hourly profiles, refine cogeneration and heat delivery representations, assess fleet cost scaling and ranking sensitivity, and examine additional industrial clusters. The economic boundary should be extended to renewable generation, storage and site-specific infrastructure. A consistent lifecycle assessment requires technology specific data and explicit accounting for electricity and useful heat. Selected configurations can subsequently support detailed site assessment and price responsive operational optimisation.
Author Contributions
Conceptualisation, T.D., L.D.B., L.M., L.V., R.R. and G.V.E.; methodology, L.M., T.D. and L.D.B.; software, L.M.; validation, L.D.B. and L.M.; formal analysis, T.D. and L.D.B.; data curation, L.M. and T.D.; writing: original draft preparation, T.D., L.D.B. and L.M.; writing: review and editing, all authors; visualisation, L.M. and L.D.B.; supervision, L.V., R.R. and G.V.E.; project administration, G.V.E. All authors have read and agreed to the published version of the manuscript.
Funding
Part of this research received financial support from SCK CEN under the LFR-SMR research activities.
Institutional Review Board Statement
Not applicable.
Informed Consent Statement
Not applicable.
Data Availability Statement
The harmonised SMR technology database is available from Zenodo [40]. The analysis code is included in the accompanying source package. The RES2Go platform and its datasets are available via Zenodo [35]. Demand and renewable inputs derive from AIDRES [34], Hotmaps [42], ENSPRESO [61] and EMHIRES [44,45].
Acknowledgments
The authors thank the Energy & Cluster Management research group at Ghent University and the NES2Go development team.
Conflicts of Interest
The authors declare no conflicts of interest.
Abbreviations
The following abbreviations are used in this manuscript:
| AIDRES | Advancing Industrial Decarbonisation by Assessing the Future Use of Renewable Energies in Industrial Processes |
| BESS | Battery energy storage system |
| CF | Capacity factor |
| CHP | Combined heat and power |
| CRF | Capital recovery factor |
| DBSCAN | Density based spatial clustering of applications with noise |
| ECM | Energy & Cluster Management |
| EMHIRES | European Meteorological derived High resolution RES generation time series |
| ESS | Energy storage system |
| G4ECONS | Generation IV Excel based Calculation of Nuclear Systems cost model |
| GHG | Greenhouse gas |
| HTGR | High temperature gas cooled reactor |
| IEA NZE | International Energy Agency Net Zero Emissions scenario |
| LCOE | Levelised cost of electricity |
| LCOH | Levelised cost of heat |
| LCUE | Levelised cost of useful energy (combined electricity and heat) |
| MSR | Molten salt reactor |
| MOX | Mixed oxide fuel |
| NES2Go | Nuclear Energy Systems to Go |
| NUTS | Nomenclature of Territorial Units for Statistics |
| RES | Renewable energy sources |
| RES2Go | Renewable Energy Sources to Go |
| SEC | Specific energy consumption |
| SMR | Small modular reactor |
| SoC | State of charge |
| TCIC | Total capital investment cost |
References
- European Commission. The European Green Deal. Communication COM(2019) 640 Final, Brussels, 11 December 2019. Available online: https://eur-lex.europa.eu/legal-content/EN/TXT/?uri=CELEX:52019DC0640 (accessed on 23 October 2026).
- United Nations Framework Convention on Climate Change. Paris Agreement. United Nations Treaty Collection, Chapter XXVII 7.d, Paris, 12 December 2015. Available online: https://treaties.un.org/pages/viewdetails.aspx?chapter=27&mtdsg_no=xxvii-7-d&src=treaty (accessed on 23 October 2026).
- International Energy Agency. World Energy Outlook 2022; Technical Report; International Energy Agency (IEA): Paris, France, 2022. [Google Scholar] [CrossRef] [Scilit]
- European Commission. REPowerEU Plan. Communication COM(2022) 230 Final, Brussels, 18 May 2022. Available online: https://eur-lex.europa.eu/legal-content/EN/TXT/?uri=COM:2022:230:FIN (accessed on 23 October 2026).
- Draghi, M. The Future of European Competitiveness—Part A: A Competitiveness Strategy for Europe; Part B: In-Depth Analysis and Recommendations; Technical Report; European Commission: Brussels, Belgium, 2024; Available online: https://commission.europa.eu/topics/competitiveness/draghi-report_en (accessed on 23 October 2026).
- Thiel, G.P.; Stark, A.K. To Decarbonize Industry, We Must Decarbonize Heat. Joule 2021, 5, 531–550. [Google Scholar] [CrossRef] [Scilit]
- Madeddu, S.; Ueckerdt, F.; Pehl, M.; Peterseim, J.; Lord, M.; Kumar, K.A.; Krüger, C.; Luderer, G. The CO2 Reduction Potential for the European Industry via Direct Electrification of Heat Supply (Power-to-Heat). Environ. Res. Lett. 2020, 15, 124004. [Google Scholar] [CrossRef] [Scilit]
- Dhondt, N.; Mendez Alva, F.; Van Eetvelde, G. Introducing Industrial Clusters in Multi-Node Energy System Modelling by the Application of the Industry–Infrastructure Quadrant. Sustainability 2024, 16, 2585. [Google Scholar] [CrossRef] [Scilit]
- Dhondt, N.; Vandevelde, L.; Van Eetvelde, G. A European Review of the Potential Role of Industrial Clusters in the Energy System When Leveraging Energy Synergies. Energy Rep. 2025, 14, 3298–3309. [Google Scholar] [CrossRef] [Scilit]
- Chertow, M.R. Industrial Symbiosis. In Encyclopedia of Energy; Elsevier: Amsterdam, The Netherlands, 2004; pp. 407–415. [Google Scholar] [CrossRef] [Scilit]
- National Climate Commission (Belgium). Belgium’s Greenhouse Gas Inventory (1990–2023): National Inventory Document. Technical report, Federal Public Service Health, Food Chain Safety and Environment/National Climate Commission, Brussels, 2025. Available online: https://unfccc.int/documents/646467 (accessed on 23 October 2026).
- Business in Antwerp. Europe’s Largest Integrated Chemical Cluster Is a Hub of Innovation and Sustainability. 2024. Available online: https://www.businessinantwerp.eu/en/europes-largest-integrated-chemical-cluster-hub-innovation-and-sustainability (accessed on 23 October 2026).
- Swartenbroekx, C.; Verdini, D. The Competitiveness and Decarbonisation Challenges Facing Energy-Intensive Industries. NBB Economic Review, No. 2, 5 May, 2025. Available online: https://www.nbb.be/doc/ts/publications/economicreview/2025/ecorevi2025_h02.pdf (accessed on 23 October 2026).
- PATHS2050 Coalition. Belgian Energy System Pathways 2025: Executive Summary. Technical report, VITO/EnergyVille, Genk, 2025. Available online: https://perspective2050.energyville.be/sites/paths2050/files/2025-04/PATHS2050%20Coalition_2025_ExecutiveSummary.pdf (accessed on 23 October 2026).
- International Energy Agency. Nuclear Power and Secure Energy Transitions: From Today’s Challenges to Tomorrow’s Clean Energy Systems; Technical Report; International Energy Agency (IEA): Paris, France, 2022. [Google Scholar] [CrossRef] [Scilit]
- European Commission. Commission Delegated Regulation (EU) 2022/1214 of 9 March 2022 Amending Delegated Regulation (EU) 2021/2139 as Regards Economic Activities in Certain Energy Sectors and Delegated Regulation (EU) 2021/2178 as Regards Specific Public Disclosures for Those Economic Activities. Official Journal of the European Union, L 188, 15 July, 2022. Available online: https://eur-lex.europa.eu/legal-content/EN/TXT/?uri=CELEX:32022R1214 (accessed on 23 October 2026).
- European Parliament and Council of the European Union. Regulation (EU) 2024/1735 of the European Parliament and of the Council of 13 June 2024 on Establishing a Framework of Measures for Strengthening Europe’s Net-Zero Technology Manufacturing Ecosystem and Amending Regulation (EU) 2018/1724. Official Journal of the European Union, L 2024/1735, 28 June 2024. Available online: https://eur-lex.europa.eu/legal-content/EN/TXT/?uri=CELEX:32024R1735 (accessed on 23 October 2026).
- European Commission. European Industrial Alliance on Small Modular Reactors. European Commission, Launched 9 February; First General Assembly 29 May 2024. Available online: https://single-market-economy.ec.europa.eu/industry/industrial-alliances/european-industrial-alliance-small-modular-reactors_en (accessed on 23 October 2026).
- Belgium. Wet Van 17 Mei 2025 Houdende Diverse Bepalingen Inzake Kernenergie, Teneinde de Elektriciteitsbevoorradingszekerheid te Waarborgen en de Energiemixkosten in de Hand te Houden. Belgisch Staatsblad, 26 May, Numac 2025003894, 2025. Available online: https://www.ejustice.just.fgov.be/cgi/article_body.pl?language=nl&caller=summary&pub_date=25-05-26&numac=2025003894 (accessed on 23 October 2026).
- European Commission. Proposal for a Regulation of the European Parliament and of the Council Establishing a Framework of Measures for the Acceleration of Industrial Capacity and Decarbonisation in Strategic Sectors and Amending Regulations (EU) 2018/1724, (EU) 2024/1735 and (EU) 2024/3110. COM(2026) 100 final, 2026/0068 (COD), 4 March 2026. Available online: https://single-market-economy.ec.europa.eu/document/download/9bc8eb85-4d43-4025-be7b-c86b9f3648ec_en (accessed on 23 October 2026).
- International Atomic Energy Agency. Small Modular Reactors: Advances in SMR Developments 2024; Technical Report; International Atomic Energy Agency (IAEA), Advanced Reactors Information System (ARIS): Vienna, Austria, 2024. [Google Scholar] [CrossRef] [Scilit]
- Ingersoll, D.T. Deliberately Small Reactors and the Second Nuclear Era. Prog. Nucl. Energy 2009, 51, 589–603. [Google Scholar] [CrossRef] [Scilit]
- Locatelli, G.; Bingham, C.; Mancini, M. Small Modular Reactors: A Comprehensive Overview of Their Economics and Strategic Aspects. Prog. Nucl. Energy 2014, 73, 75–85. [Google Scholar] [CrossRef] [Scilit]
- Vanatta, M.; Patel, D.; Allen, T.; Cooper, D.; Craig, M.T. Technoeconomic Analysis of Small Modular Reactors Decarbonizing Industrial Process Heat. Joule 2023, 7, 713–737. [Google Scholar] [CrossRef] [Scilit]
- International Atomic Energy Agency. Guidance on Nuclear Energy Cogeneration; Technical Report IAEA Nuclear Energy Series No. NP-T-1.17; International Atomic Energy Agency (IAEA): Vienna, Austria, 2019; Available online: https://www-pub.iaea.org/MTCD/publications/PDF/P1862_web.pdf (accessed on 23 October 2026).
- Leurent, M.; Da Costa, P.; Rämä, M.; Persson, U.; Jasserand, F. Cost-Benefit Analysis of District Heating Systems Using Heat from Nuclear Plants in Seven European Countries. Energy 2018, 149, 454–472. [Google Scholar] [CrossRef] [Scilit]
- Locatelli, G.; Boarin, S.; Pellegrino, F.; Ricotti, M.E. Load Following with Small Modular Reactors (SMR): A Real Options Analysis. Energy 2015, 80, 41–54. [Google Scholar] [CrossRef] [Scilit]
- Hummel, D.W.; Chouhan, S.; Lebel, L.; Morreale, A.C. Radiation Dose Consequences of Postulated Limiting Accidents in Small Modular Reactors to Inform Emergency Planning Zone Size Requirements. Ann. Nucl. Energy 2020, 137, 107062. [Google Scholar] [CrossRef] [Scilit]
- Mignacca, B.; Locatelli, G. Economics and Finance of Small Modular Reactors: A Systematic Review and Research Agenda. Renew. Sustain. Energy Rev. 2020, 118, 109519. [Google Scholar] [CrossRef] [Scilit]
- Van Hee, N.; Peremans, H.; Nimmegeers, P. Economic Potential and Barriers of Small Modular Reactors in Europe. Renew. Sustain. Energy Rev. 2024, 203, 114743. [Google Scholar] [CrossRef] [Scilit]
- Jenkins, J.D.; Zhou, Z.; Ponciroli, R.; Vilim, R.B.; Ganda, F.; de Sisternes, F.; Botterud, A. The benefits of nuclear flexibility in power system operations with renewable energy. Appl. Energy 2018, 222, 872–884. [Google Scholar] [CrossRef] [Scilit]
- Alhadhrami, S.; Soto, G.J.; Lindley, B. Dispatch analysis of flexible power operation with multi-unit small modular reactors. Energy 2023, 280, 128107. [Google Scholar] [CrossRef] [Scilit]
- Brown, T.; Hörsch, J.; Schlachtberger, D. PyPSA: Python for Power System Analysis. J. Open Res. Softw. 2018, 6, 4. [Google Scholar] [CrossRef] [Scilit]
- Girardin, L.; Valee, J.; Correa Laguna, J. AIDRES: Advancing Industrial Decarbonization by Assessing the Future Use of Renewable Energies in Industrial Processes: Assessment and Geo-Mapping of Renewable Energy Demand for Technological Paths towards Carbon Neutrality of EU Energy-Intensive Industries; Technical Report; European Commission, Directorate-General for Energy: Luxembourg, 2023. [Google Scholar] [CrossRef] [PubMed]
- Duvillard, T.; Dhondt, N.; Van Eetvelde, G. RES2Go: Matching Energy Demand and Supply in Industry Hubs in Europe. Software, Zenodo, 2025. Available online: https://zenodo.org/records/17549998 (accessed on 23 October 2026).
- Novotný, V.; Kim, J.; Cho, S.B.; Rigby, A.; Saeed, R.M. Nuclear-based combined heat and power industrial energy parks – application of high temperature small modular reactors. Energy Convers. Manag. X 2025, 26, 101012. [Google Scholar] [CrossRef] [Scilit]
- Cho, S.B.; Kim, J.; Novotný, V.; Saeed, R.M.; Allen, T.R.; Sun, X. Multi-objective decision-making for nuclear-integrated energy hub planning and operation for industrial heat and power supply. Energy Strategy Rev. 2025, 62, 101954. [Google Scholar] [CrossRef] [Scilit]
- Kang, S.W.; Yim, M.S. Multi-Objective Optimization Application for a Coupled Light Water Small Modular Reactor–Combined Heat and Power Cycle (Cogeneration) Systems. Nucl. Eng. Technol. 2024, 56, 1654–1666. [Google Scholar] [CrossRef] [Scilit]
- Bayomy, A.M.; Pettigrew, T.; Moore, M.; Lumsden, R. Small Modular Reactors for Green Remote Mining: A Multi-Objective Optimization from a Sustainability Perspective. Energy Convers. Manag. X 2023, 19, 100397. [Google Scholar] [CrossRef] [Scilit]
- Mastrandrea, L.; Rossa, R. NES2Go: SMR Catalogue. Dataset, Zenodo, 2026. Available online: https://zenodo.org/records/22945042 (accessed on 23 October 2026).
- Maqbool, A.S.; Piccolo, G.E.; Zwaenepoel, B.; Van Eetvelde, G. A Heuristic Approach to Cultivate Symbiosis in Industrial Clusters Led by Process Industry. In Sustainable Design and Manufacturing 2017; Springer International Publishing: Cham, Switzerland, 2017; Volume 68, pp. 579–588. [Google Scholar] [CrossRef] [Scilit]
- Fleiter, T.; Manz, P. Industrial Sites. Dataset, Zenodo, 2018. Available online: https://zenodo.org/records/4687151 (accessed on 23 October 2026).
- Pezzutto, S.; Zambotti, S.; Croce, S.; Zambelli, P.; Garegnani, G.; Scaramuzzino, C.; Pascuas, R.P.; Haas, F.; Exner, D.; Lucchi, E.; et al. D2.3 WP2 Report: Open Data Set for the EU28. Technical Report, Hotmaps Project, 2019. Revised Version of 4 September 2019. Available online: https://www.hotmaps-project.eu/wp-content/uploads/2018/03/D2.3-Hotmaps_for-upload_revised-final_.pdf (accessed on 23 October 2026).
- González Aparicio, I.; Zucker, A.; Careri, F.; Monforti-Ferrario, F.; Huld, T.; Badger, J. EMHIRES Dataset Part I: Wind Power Generation; Technical Report EUR 28171 EN; European Commission, Joint Research Centre (JRC): Brussels, Belgium, 2016. [Google Scholar] [CrossRef] [PubMed]
- González Aparicio, I.; Huld, T.; Careri, F.; Monforti-Ferrario, F.; Zucker, A. EMHIRES Dataset Part II: Solar Power Generation; Technical Report EUR 28629 EN; European Commission, Joint Research Centre (JRC): Brussels, Belgium, 2017. [Google Scholar] [CrossRef]
- Eurostat. NUTS—Nomenclature of Territorial Units for Statistics. Regulation (EC) No 1059/2003. 2021. Available online: https://ec.europa.eu/eurostat/web/nuts (accessed on 23 October 2026).
- International Atomic Energy Agency. Small Modular Reactor Technology Catalogue: 2024 Edition. Technical Report, IAEA Advanced Reactors Information System, 2025. Third Edition, June 2025. Supplement to ARIS; Not an Official IAEA Publication. Available online: https://aris.iaea.org/publications/SMR_catalogue_2024.pdf (accessed on 23 October 2026).
- World Nuclear Association. Small Modular Reactors. 2024. Available online: https://world-nuclear.org/information-library/nuclear-power-reactors/small-modular-reactors/small-modular-reactors (accessed on 23 October 2026).
- Schlömer, S.; Bruckner, T.; Fulton, L.; Hertwich, E.; McKinnon, A.; Perczyk, D.; Roy, J.; Schaeffer, R.; Sims, R.; Smith, P.; et al. Annex III: Technology-Specific Cost and Performance Parameters. In Climate Change 2014: Mitigation of Climate Change. Contribution of Working Group III to the Fifth Assessment Report of the IPCC; Cambridge University Press: Cambridge, UK, 2014; pp. 1329–1356. Available online: https://www.ipcc.ch/site/assets/uploads/2018/02/ipcc_wg3_ar5_annex-iii.pdf (accessed on 23 October 2026).
- United Nations Economic Commission for Europe. Carbon Neutrality in the UNECE Region: Integrated Life-cycle Assessment of Electricity Sources; Technical Report; UNECE: Geneva, Switzerland, 2022. [Google Scholar] [CrossRef] [Scilit]
- U.S. Environmental Protection Agency. Climate Leaders Greenhouse Gas Inventory Protocol: Offset Project Methodology for Project Type Industrial Boiler Efficiency (Industrial Process Applications), Version 1.3; Technical Report; Office of Atmospheric Programs: Washington, DC, USA, 2008. Available online: https://nepis.epa.gov/Exe/ZyPDF.cgi?Dockey=P10017FQ.PDF (accessed on 23 October 2026).
- Naegler, T.; Simon, S.; Klein, M.; Gils, H.C. Quantification of the European Industrial Heat Demand by Branch and Temperature Level. Int. J. Energy Res. 2015, 39, 2019–2030. [Google Scholar] [CrossRef] [Scilit]
- Rehfeldt, M.; Fleiter, T.; Toro, F. A Bottom-Up Estimation of the Heating and Cooling Demand in European Industry. Energy Effic. 2018, 11, 1057–1082. [Google Scholar] [CrossRef] [Scilit]
- Fleiter, T.; Kuehnbach, M.; Klingler, A.L. Load_profile_industry_chemicals_and_petrochemicals_yearlong_2018. Dataset, Version 0.1.0, Zenodo, 2018. Available online: https://zenodo.org/records/4687203 (accessed on 23 October 2026).
- El-Emam, R.S.; Constantin, A.; Bhattacharyya, R.; Ishaq, H.; Ricotti, M.E. Nuclear and Renewables in Multipurpose Integrated Energy Systems: A Critical Review. Renew. Sustain. Energy Rev. 2024, 192, 114157. [Google Scholar] [CrossRef] [Scilit]
- European Commission. Commission Regulation (EU) 2017/1485 of 2 August 2017 Establishing a Guideline on Electricity Transmission System Operation. Official Journal of the European Union, L 220, 25 August 2017. pp. 1–120. Available online: https://eur-lex.europa.eu/legal-content/EN/TXT/?uri=CELEX:32017R1485 (accessed on 23 October 2026).
- Generation IV International Forum, Economic Modeling Working Group. Cost Estimating Guidelines for Generation IV Nuclear Energy Systems; Technical Report GIF/EMWG/2007/004; OECD Nuclear Energy Agency/Generation IV International Forum (GIF/EMWG): Paris, France, 2007; Available online: https://www.gen-4.org/gif/upload/docs/application/pdf/2013-09/emwg_guidelines.pdf (accessed on 23 October 2026).
- Gandrik, A.M. HTGR Cost Model Users’ Manual; Technical Report INL/EXT-11-23833; Rev. 1; Idaho National Laboratory, Next Generation Nuclear Plant Project: Idaho Falls, ID, USA, 2012. [Google Scholar] [CrossRef] [Scilit]
- Safa, H.; Borgard, J.M. Non-electric Applications of Fast Reactors. In Proceedings of the Fast Reactors and Related Fuel Cycles: Safe Technologies and Sustainable Scenarios (FR13), 2015. Available online: https://www-pub.iaea.org/MTCD/Publications/PDF/SupplementaryMaterials/P1665CD/Track8_Deployment_and_Scenarios.pdf (accessed on 23 October 2026).
- International Atomic Energy Agency. Opportunities for Cogeneration with Nuclear Energy; Technical Report IAEA Nuclear Energy Series No. NP-T-4.1; International Atomic Energy Agency (IAEA): Vienna, Austria, 2017; Available online: https://www-pub.iaea.org/MTCD/Publications/PDF/P1749_web.pdf (accessed on 23 October 2026).
- Ruiz, P.; Nijs, W.; Tarvydas, D.; Sgobbi, A.; Zucker, A.; Pilli, R.; Jonsson, R.; Camia, A.; Thiel, C.; Hoyer-Klick, C.; et al. ENSPRESO—An open, EU-28 wide, transparent and coherent database of wind, solar and biomass energy potentials. Energy Strategy Rev. 2019, 26, 100379. [Google Scholar] [CrossRef] [Scilit]
- Stewart, W.R.; Shirvan, K. Capital Cost Estimation for Advanced Nuclear Power Plants. Renew. Sustain. Energy Rev. 2022, 155, 111880. [Google Scholar] [CrossRef] [Scilit]
- Rossa, R.; Dupré, L.; Hemelsoet, K.; Maenhout, G.; Vanderhaegen, M. The Role of Small Modular Reactors in the Belgian Industrial Energy Transition; Technical Report; Ghent University: Ghent, Belgium, 2025; Available online: https://www.ugent.be/ea/emsme/en/research/ensy/energy-systems-clusters/nuclear-energy-technology/smr_white_paper_ugent_final.pdf (accessed on 23 October 2026).
- Tractebel Engineering. Nuclear Deployment Options for Belgium: Technical Summary for Stakeholder Consultation. Technical Report ELIANUC/4NT/0905968/000/00, Tractebel Engineering S.A., 2025. 30 October 2025. Available online: https://www.fluxys.com/-/media/project/fluxys/public/corporate/fluxyscom/documents/public-consultation_hydrogen-infrastructure/updates/public_report_tractebel_nuclear.pdf (accessed on 23 October 2026).
- Tuler, S.P.; Webler, T. The Challenge of Community Acceptance of Small Nuclear Reactors. Energy Res. Soc. Sci. 2024, 118, 103831. [Google Scholar] [CrossRef] [Scilit]
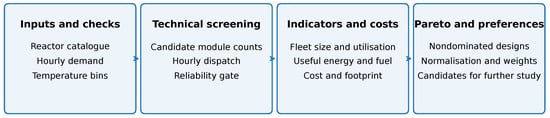
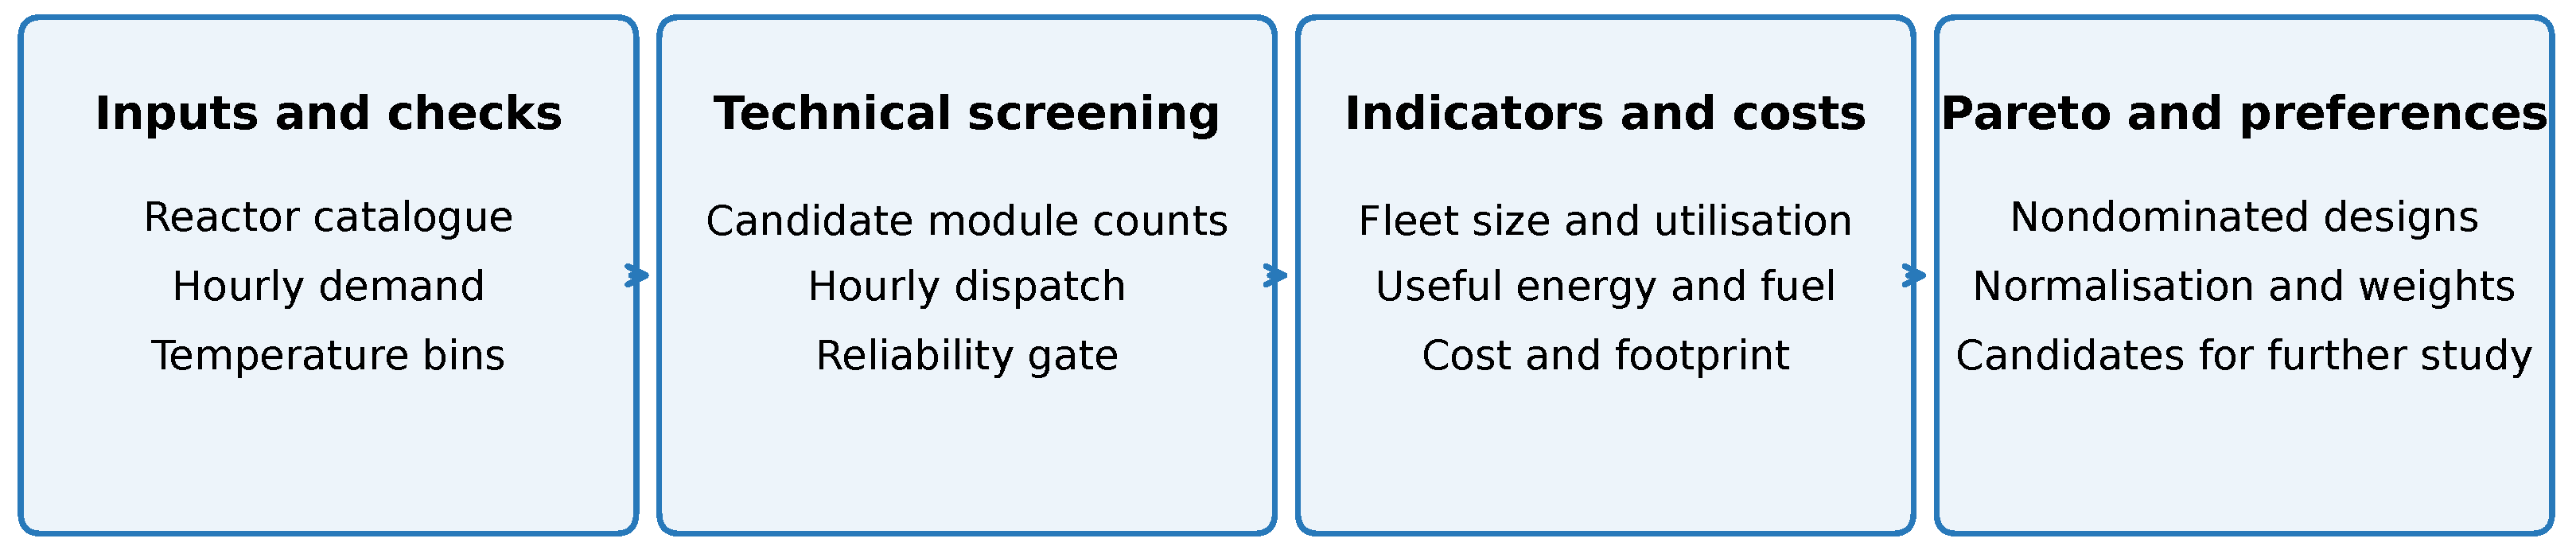
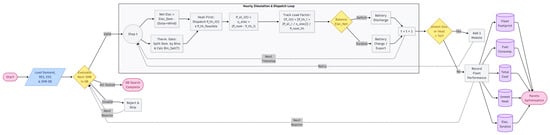
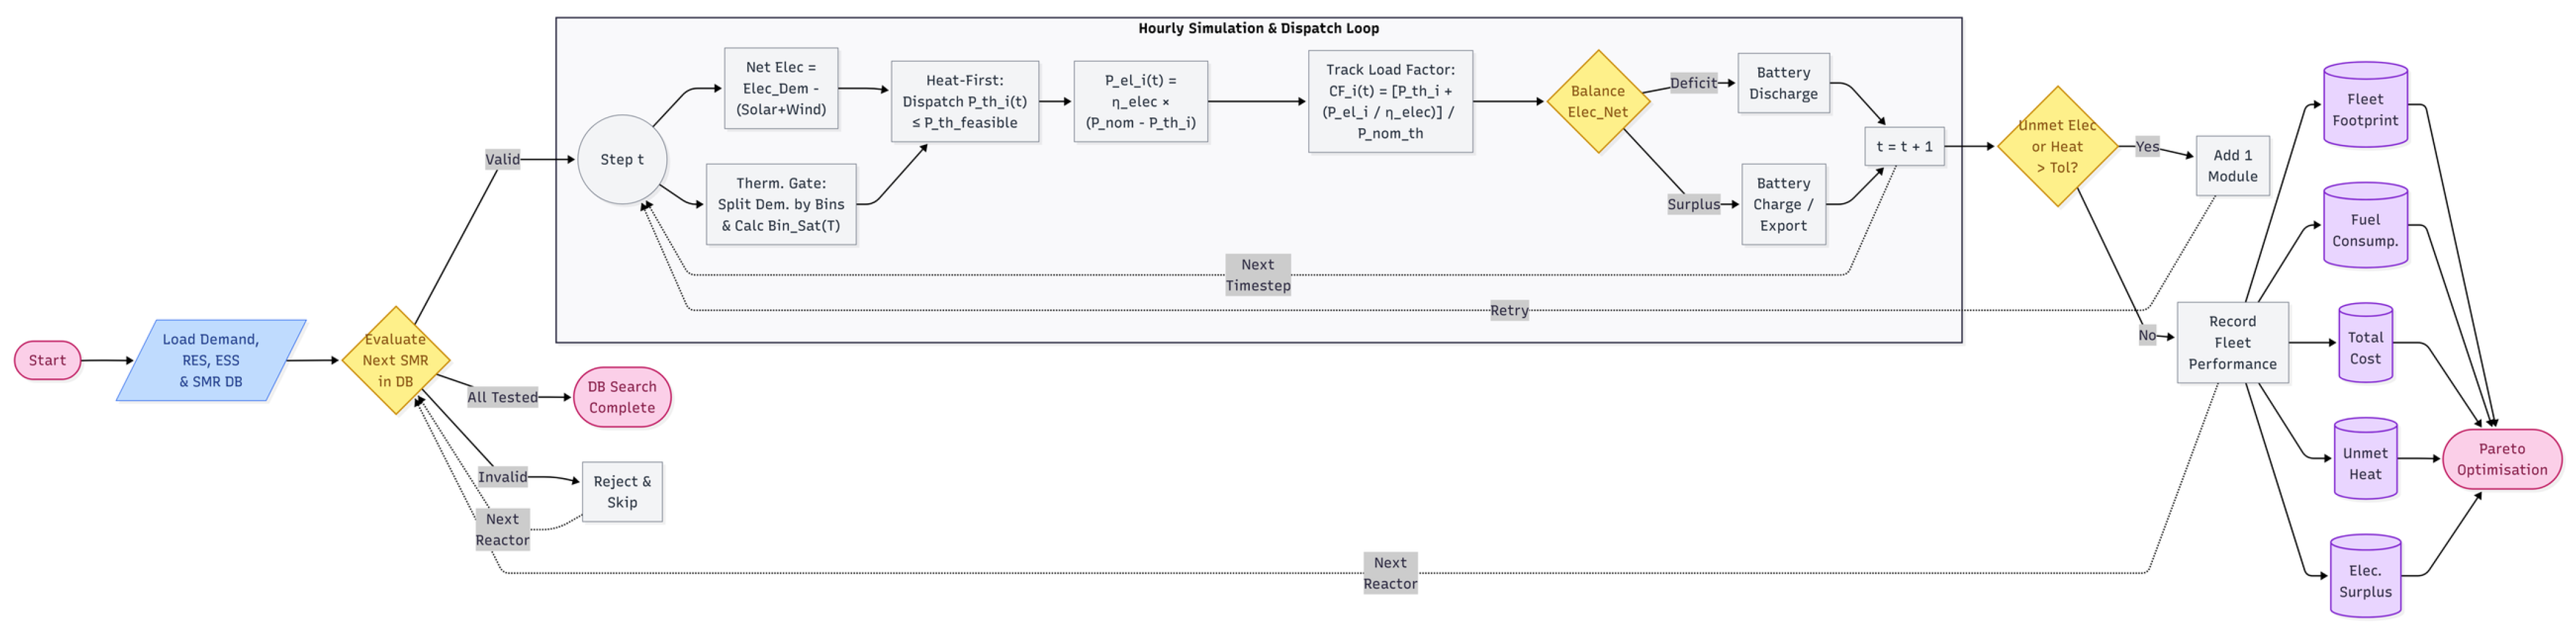
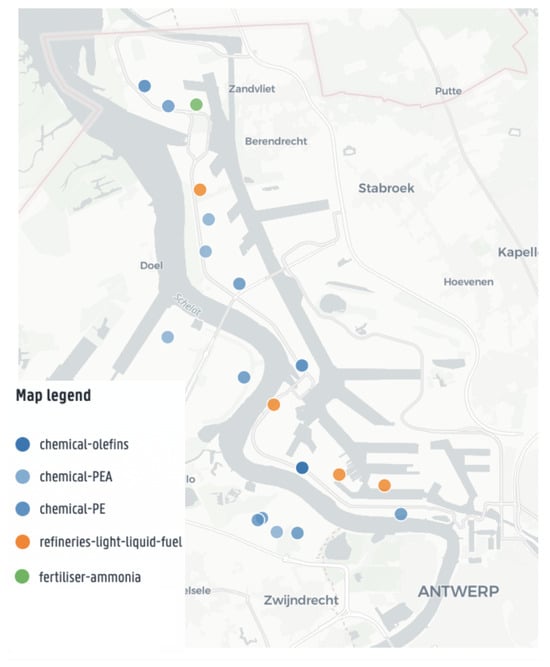
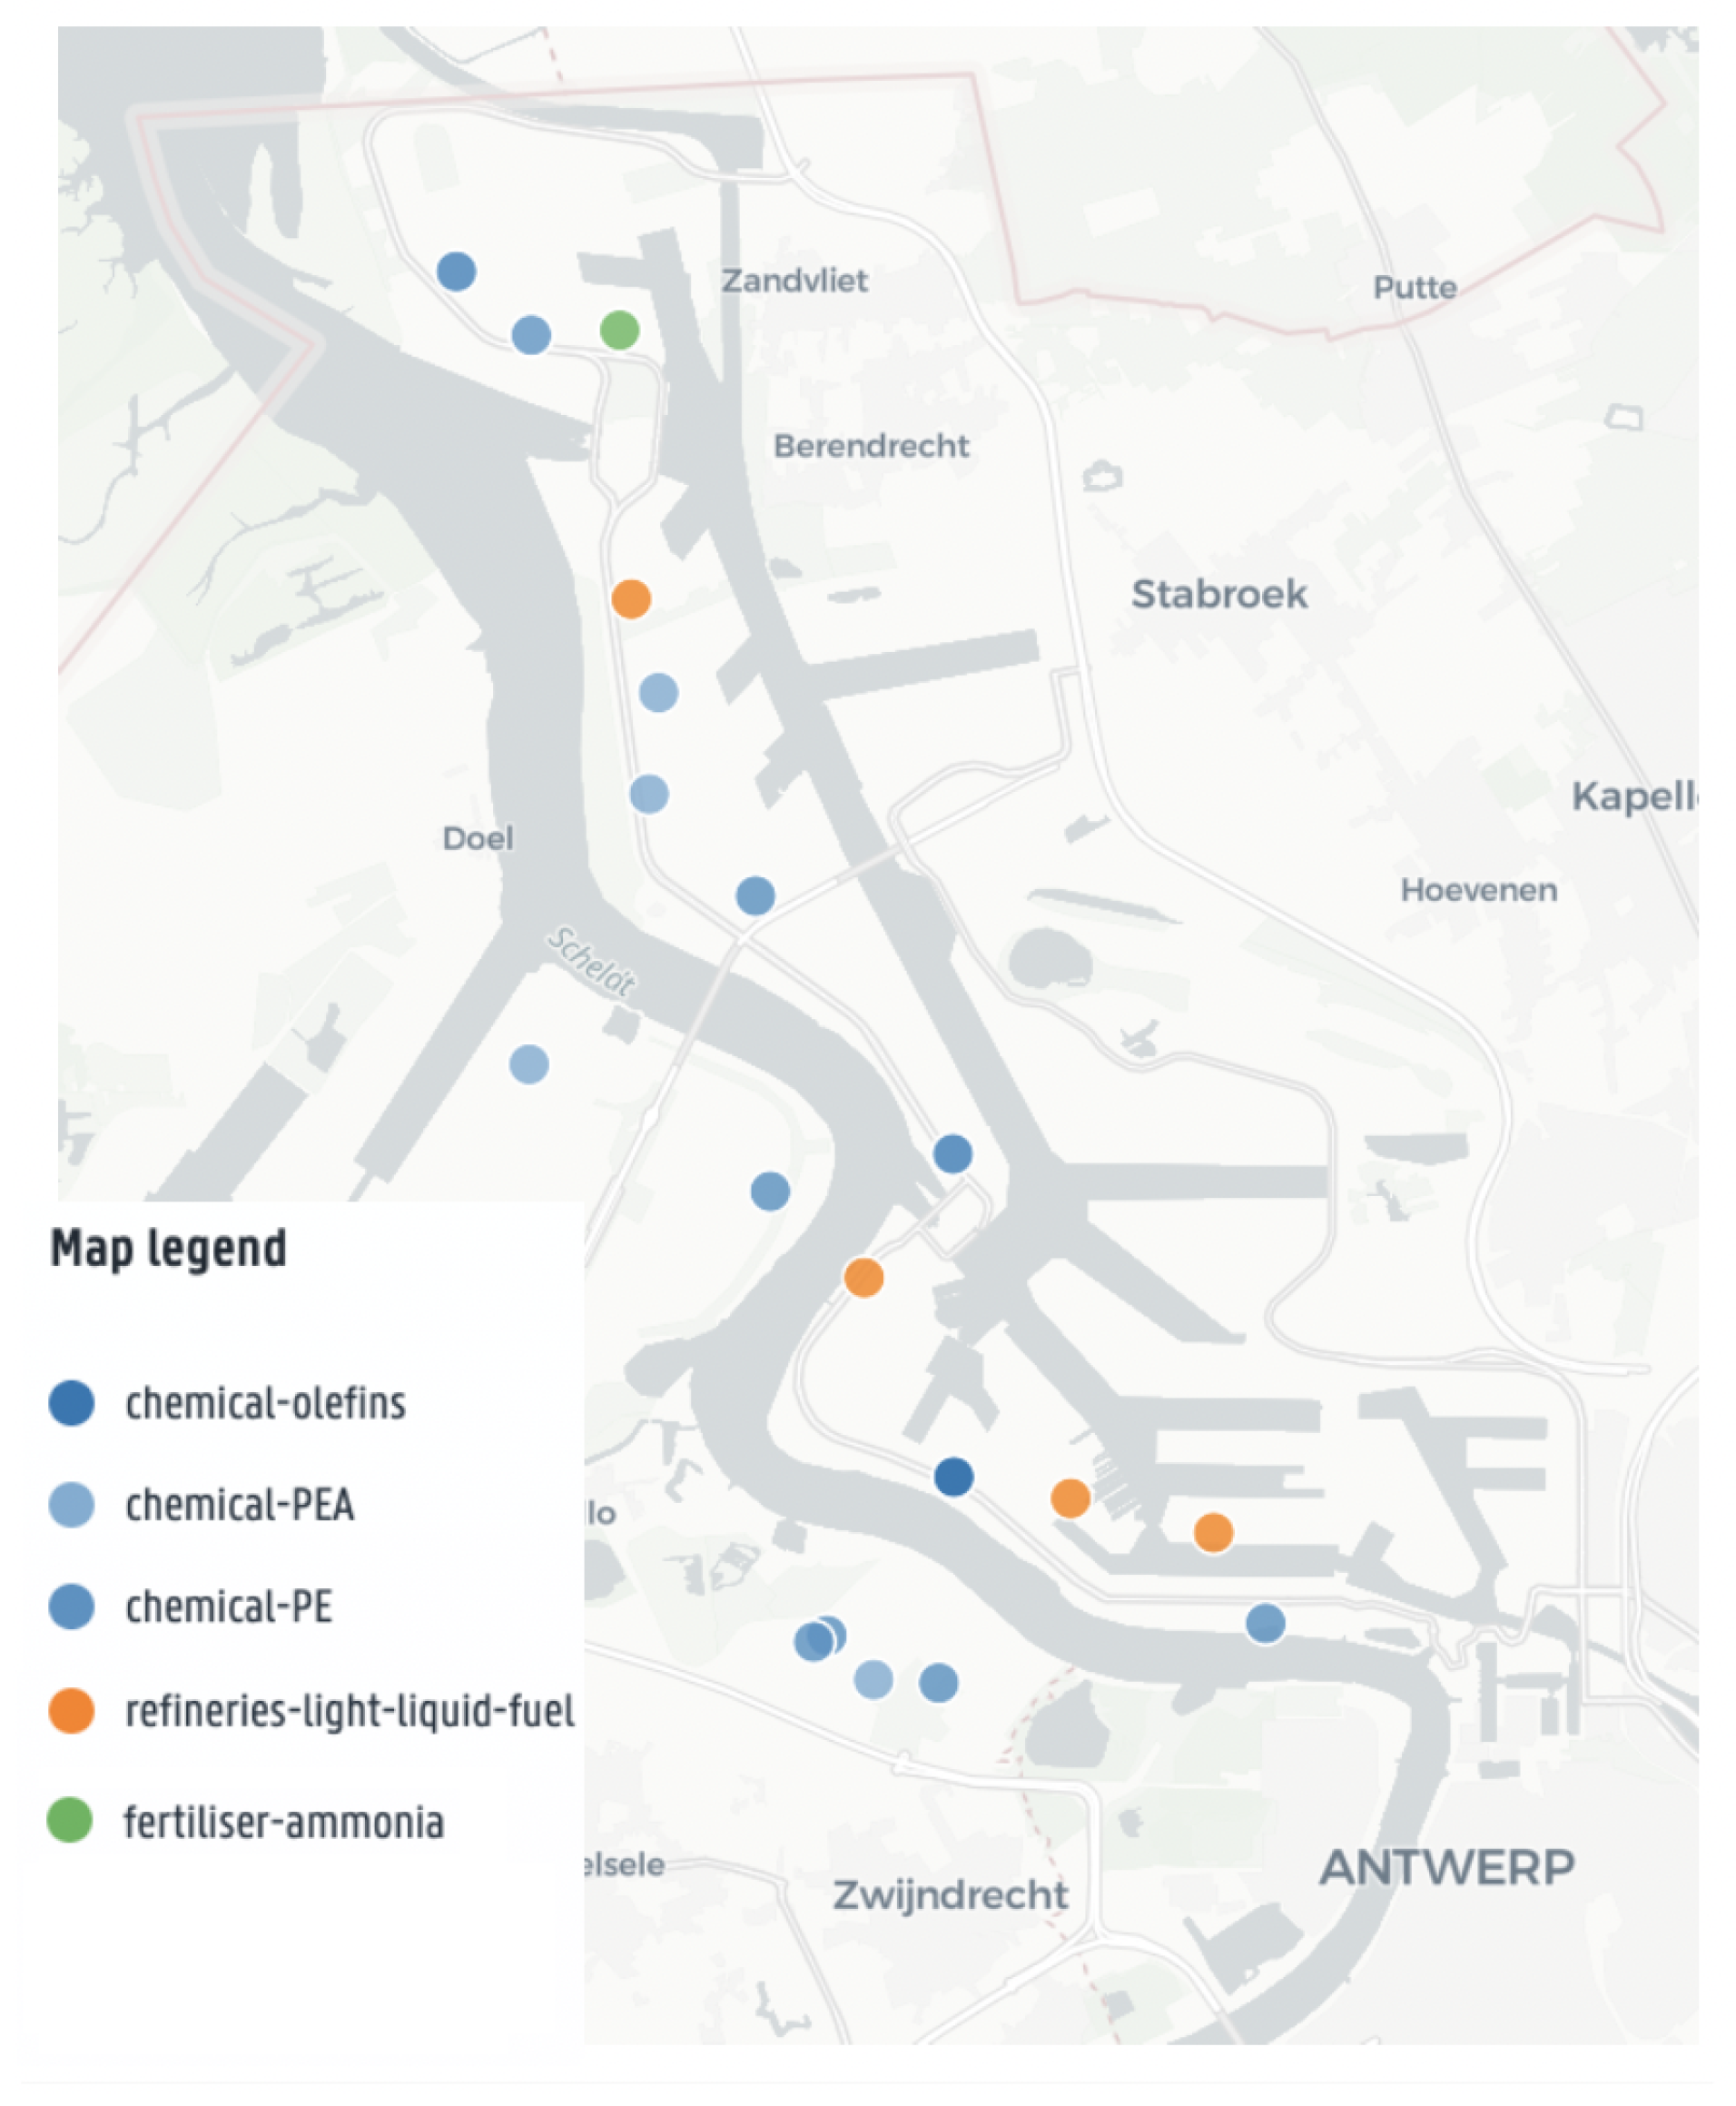
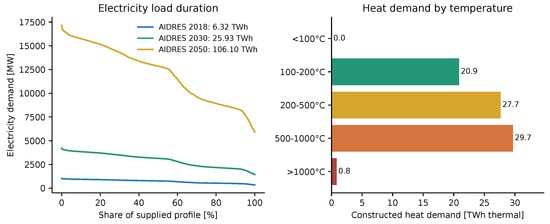
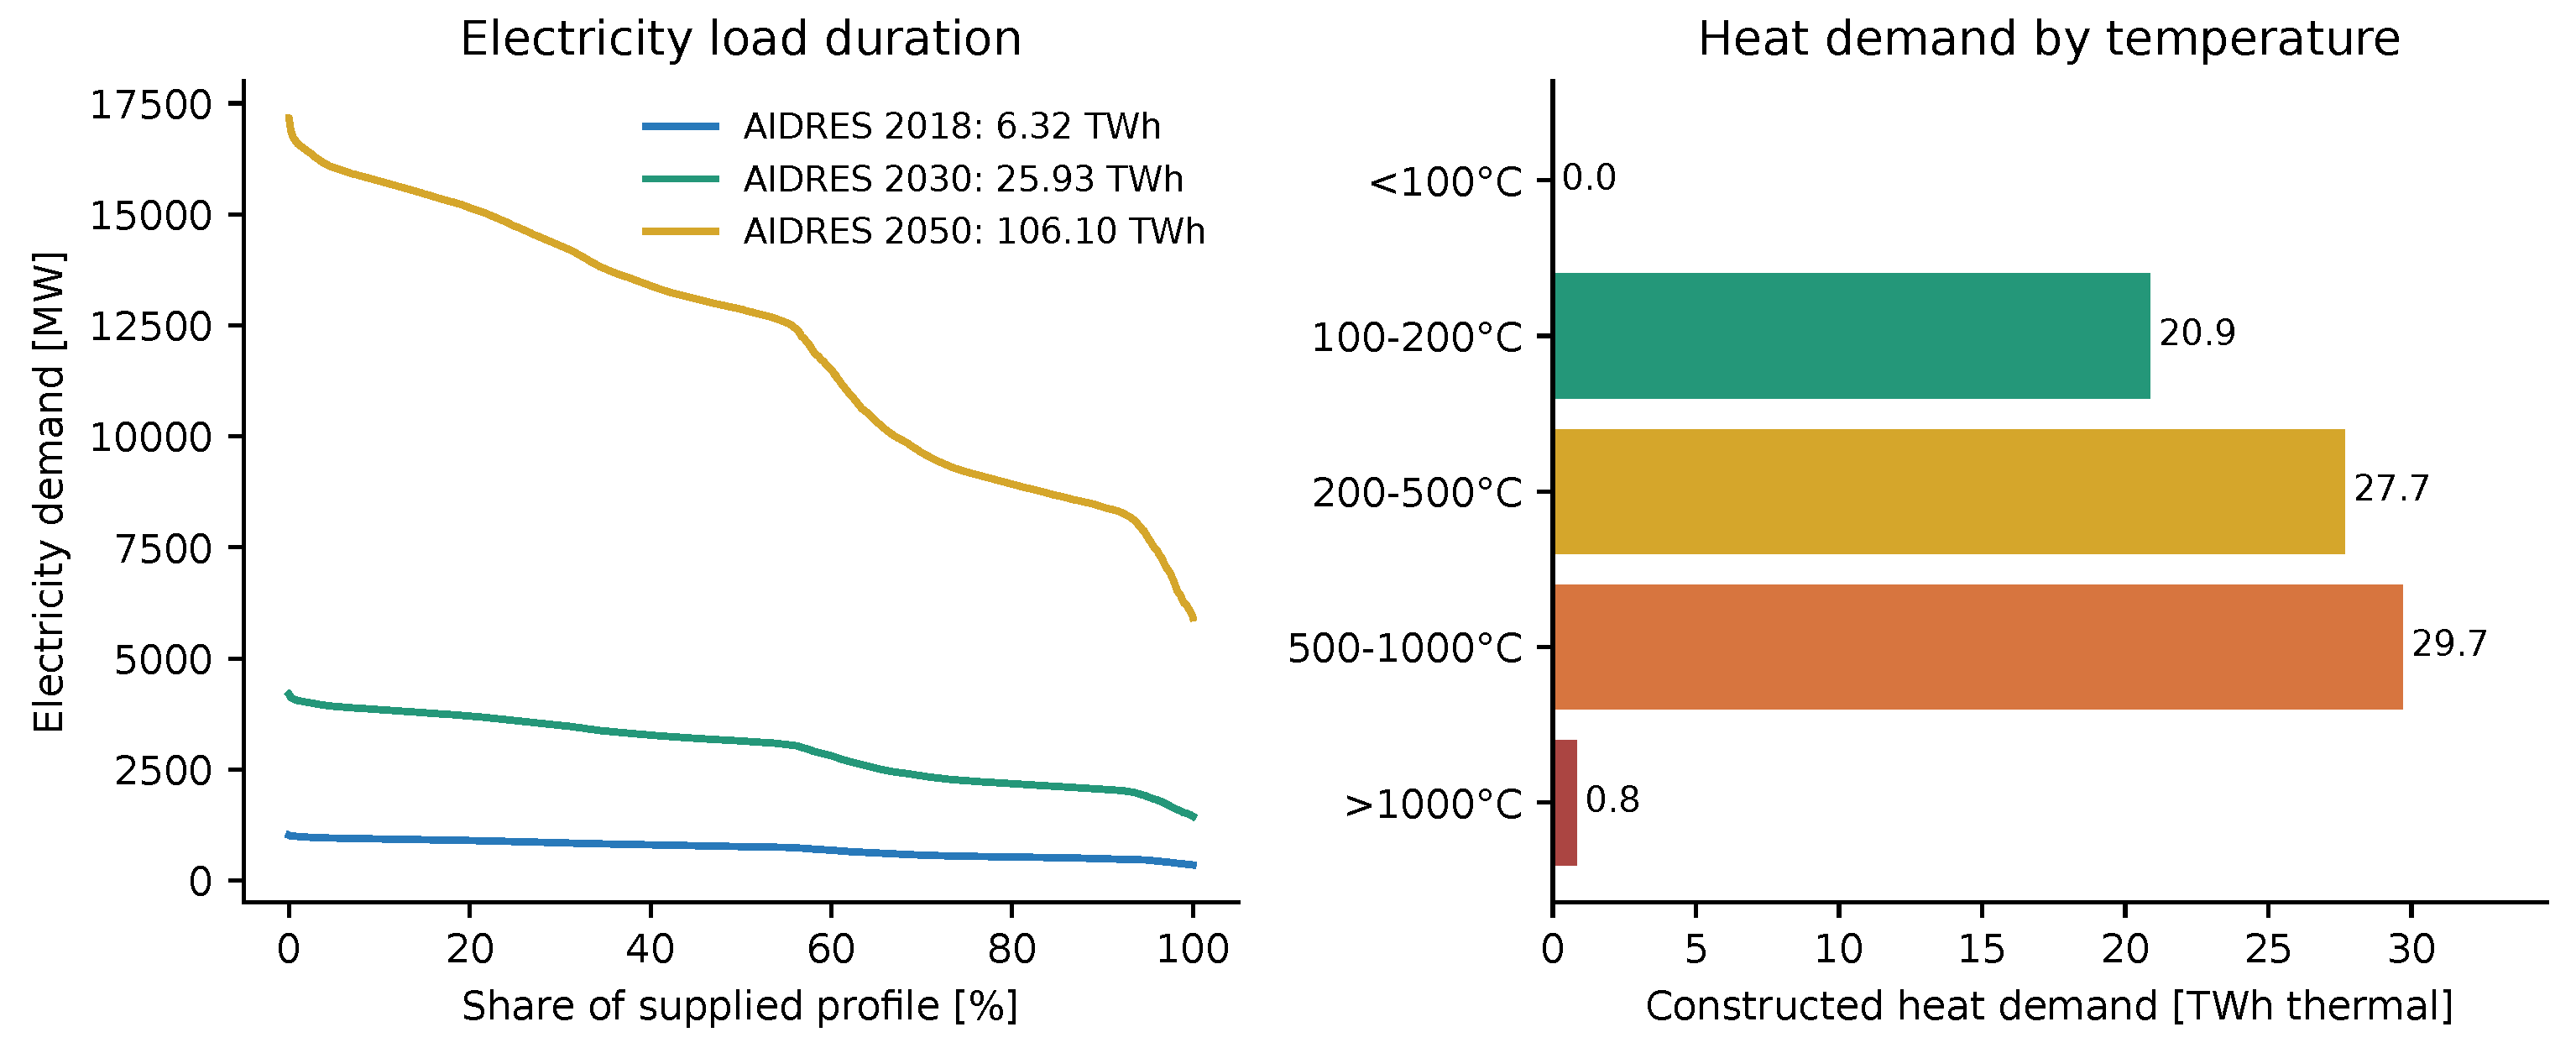
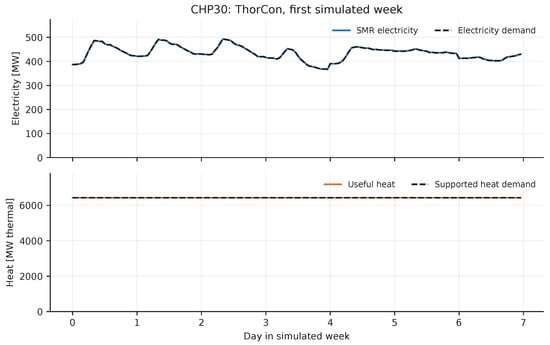
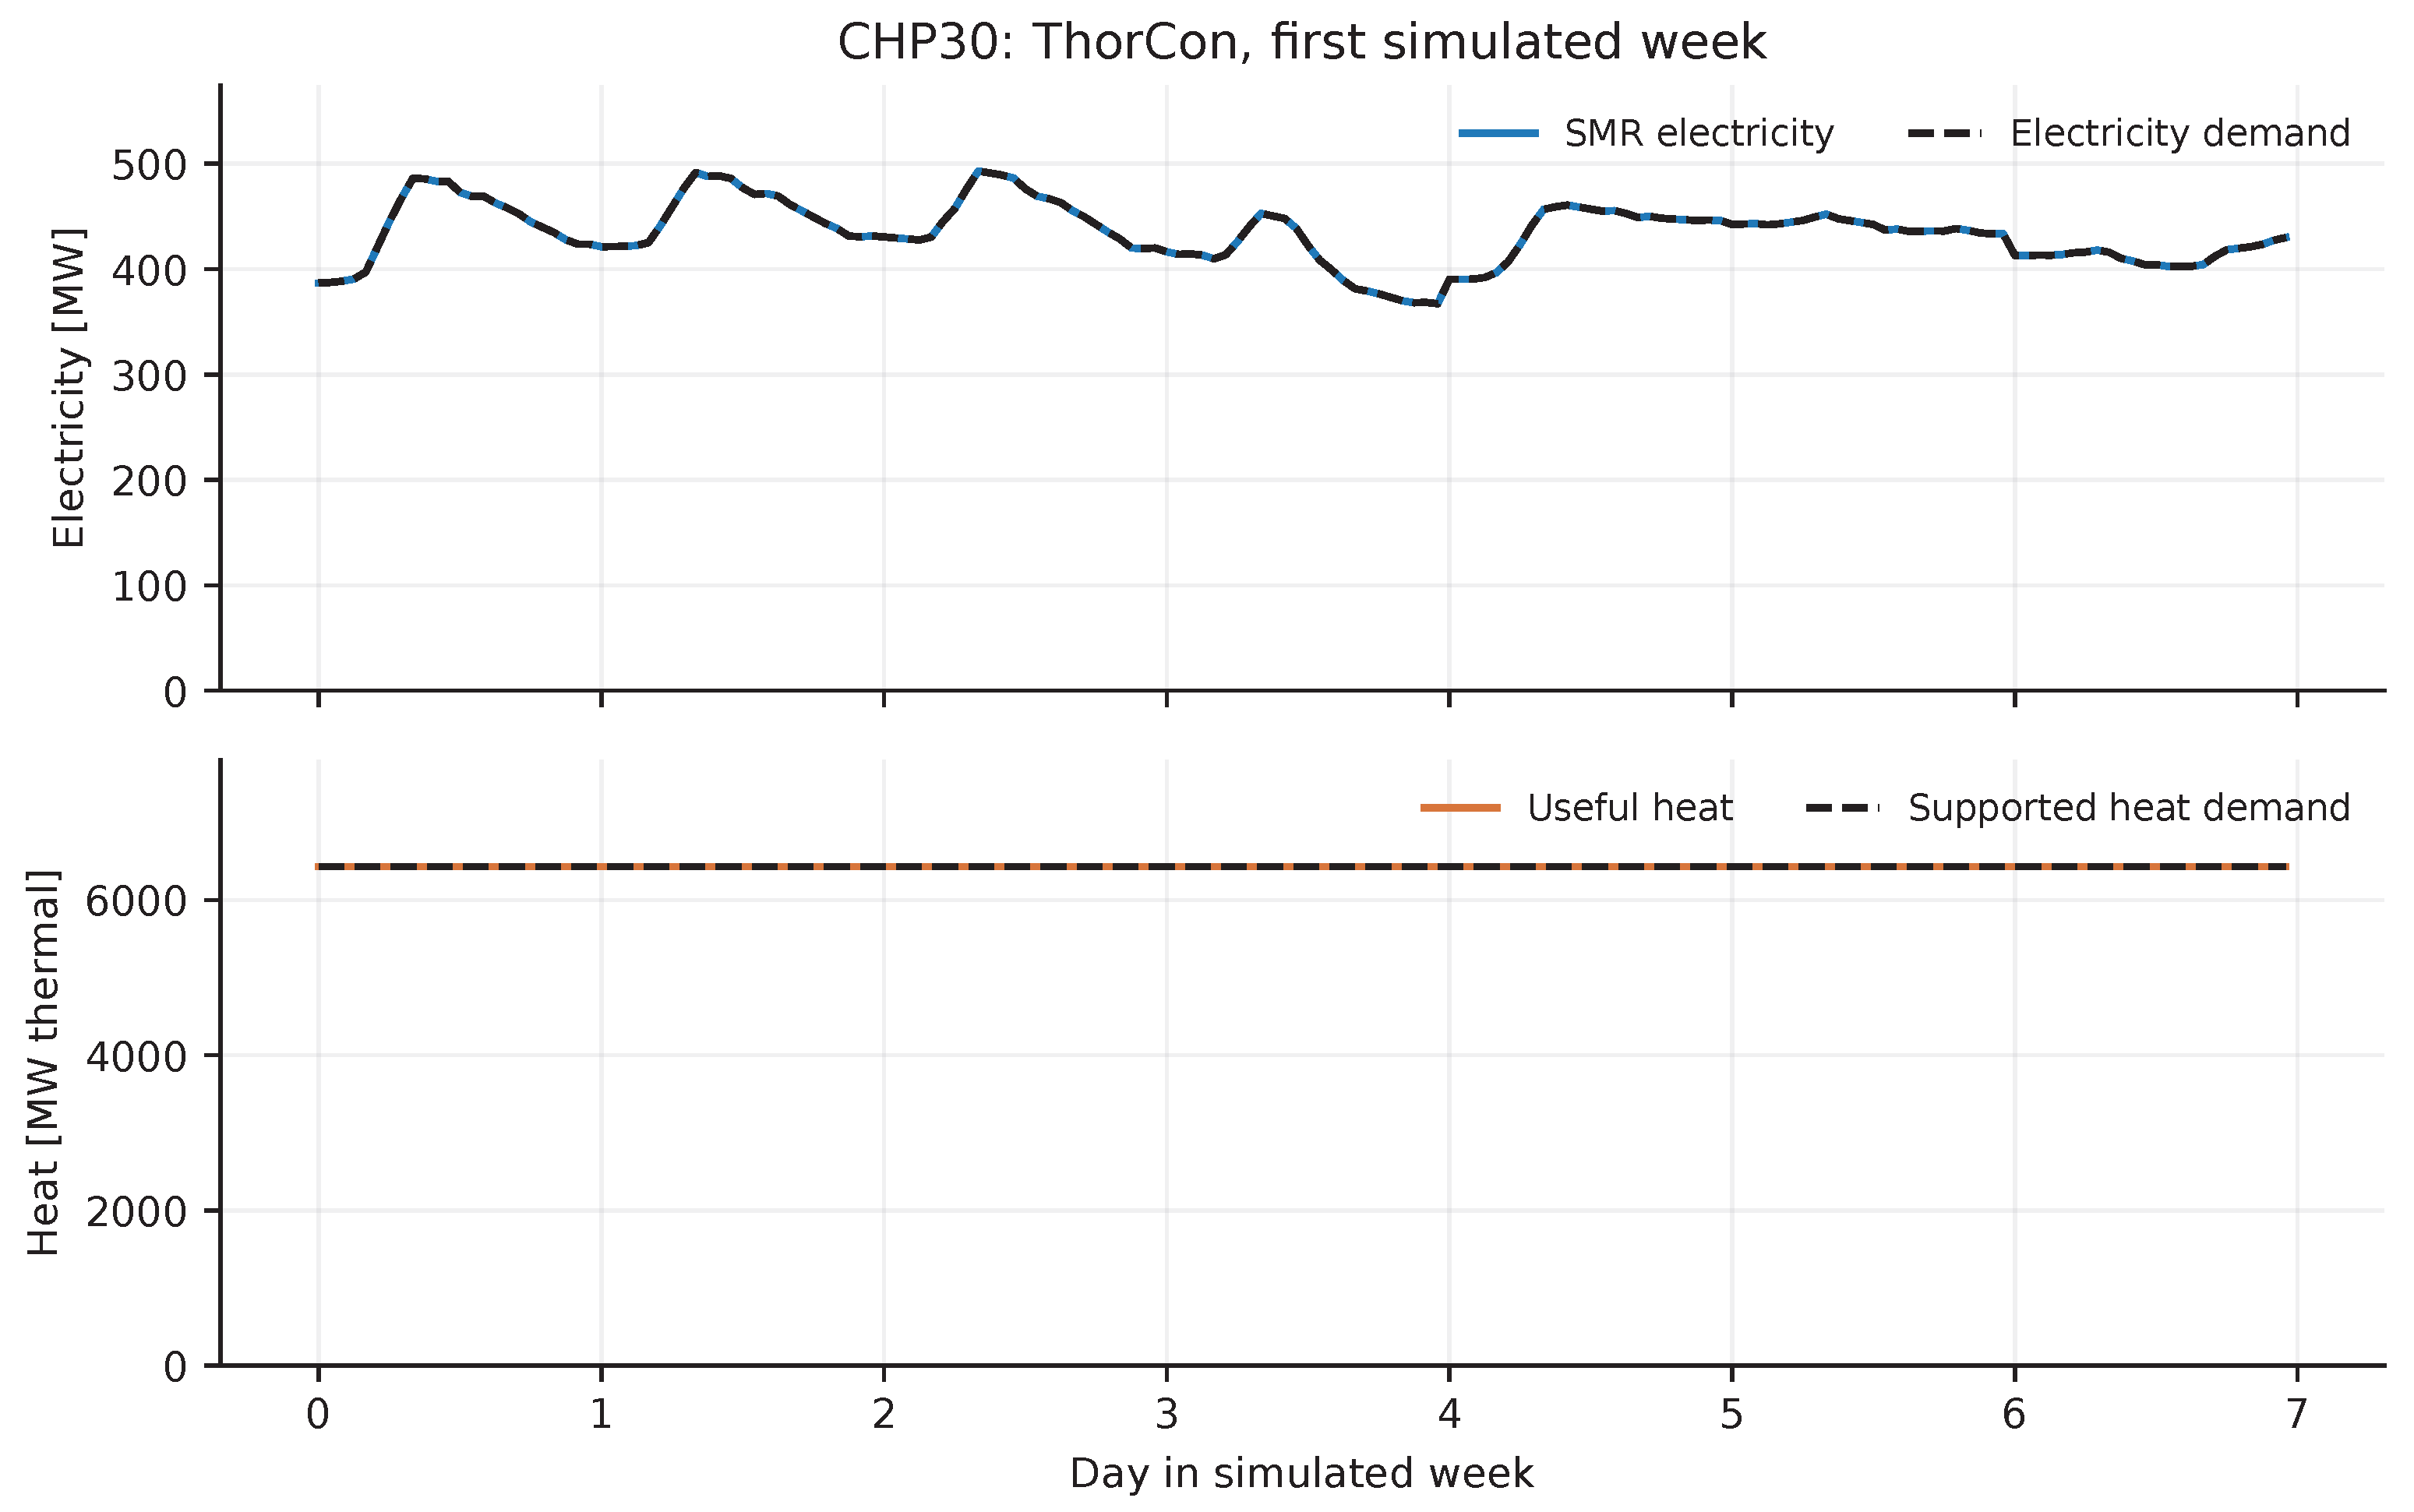
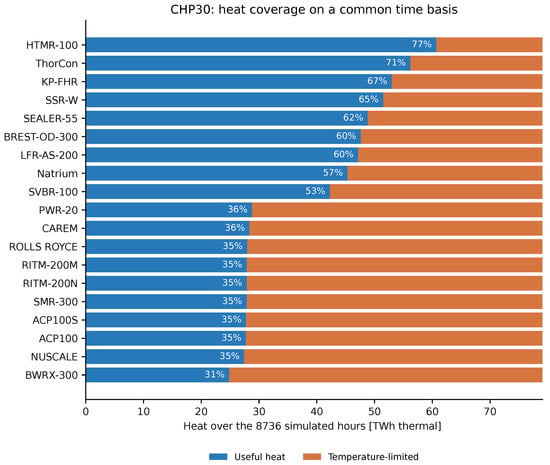
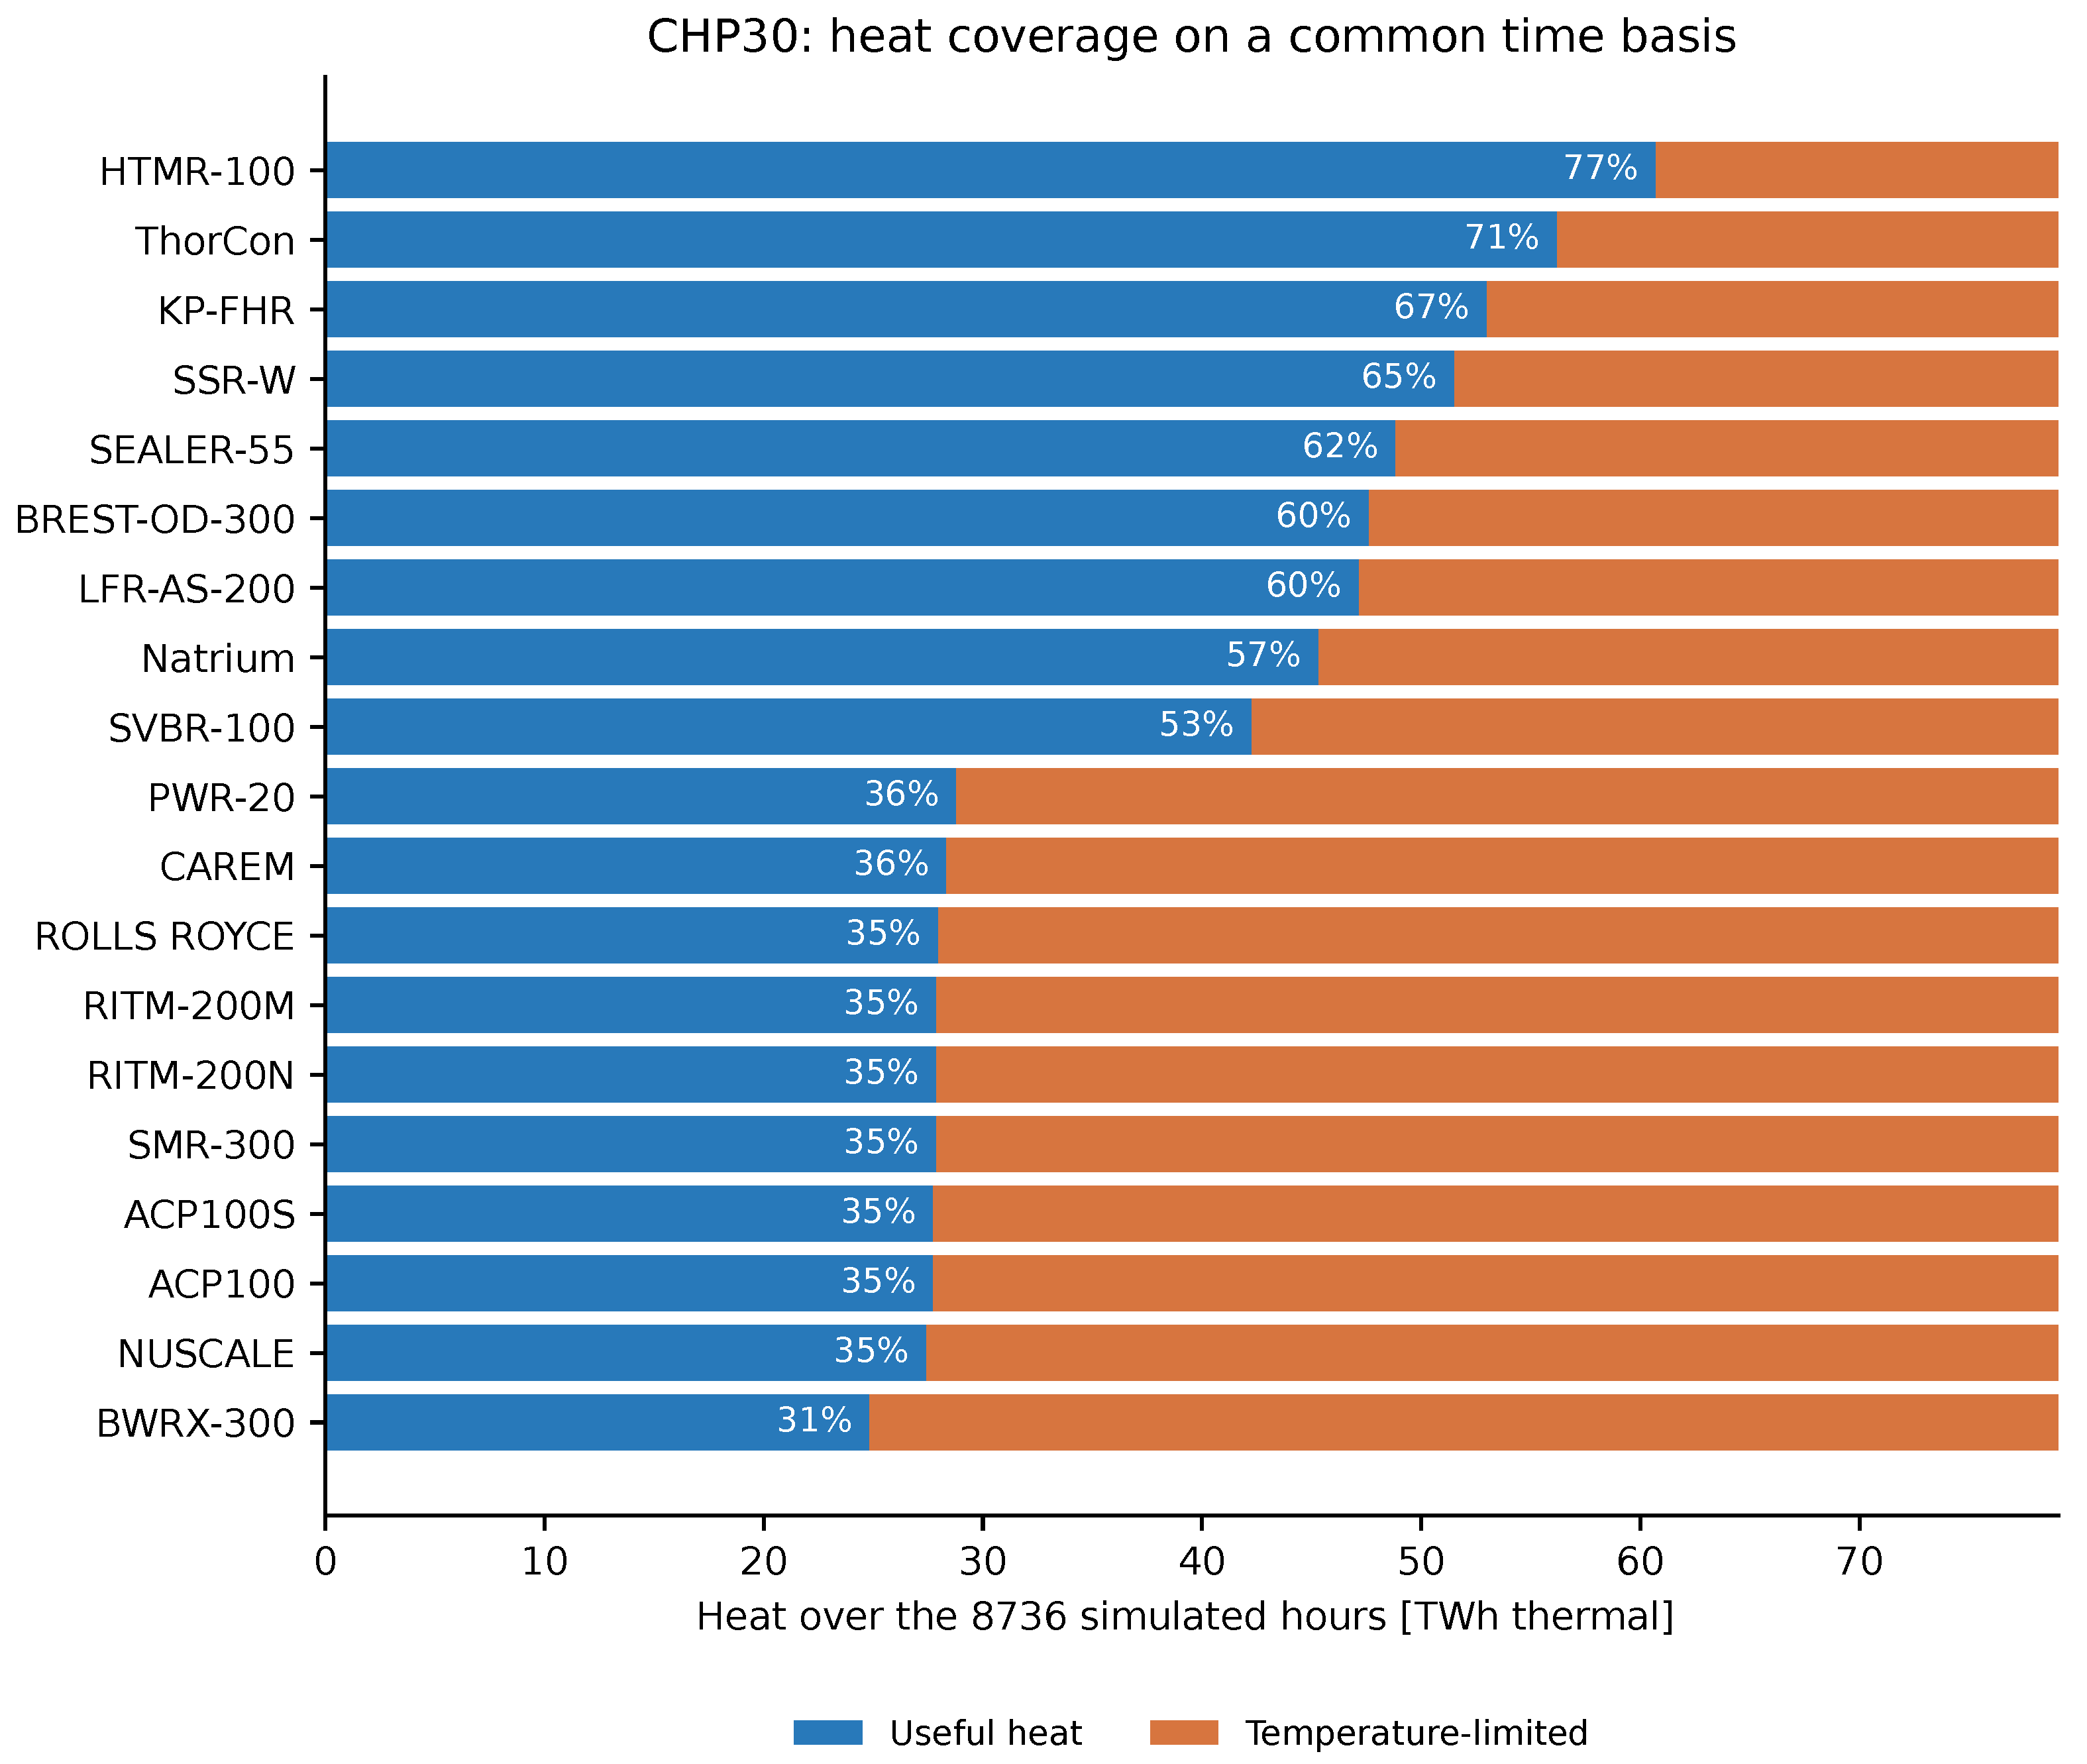
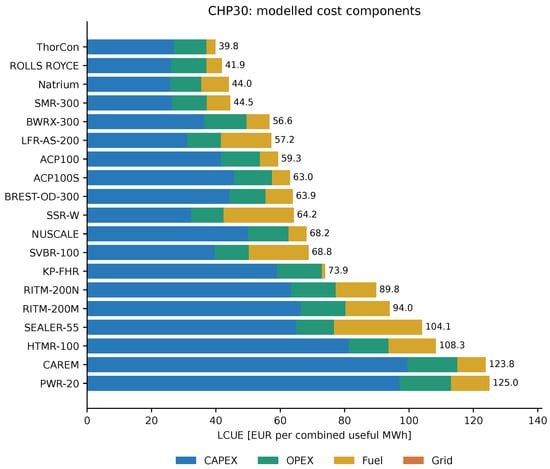
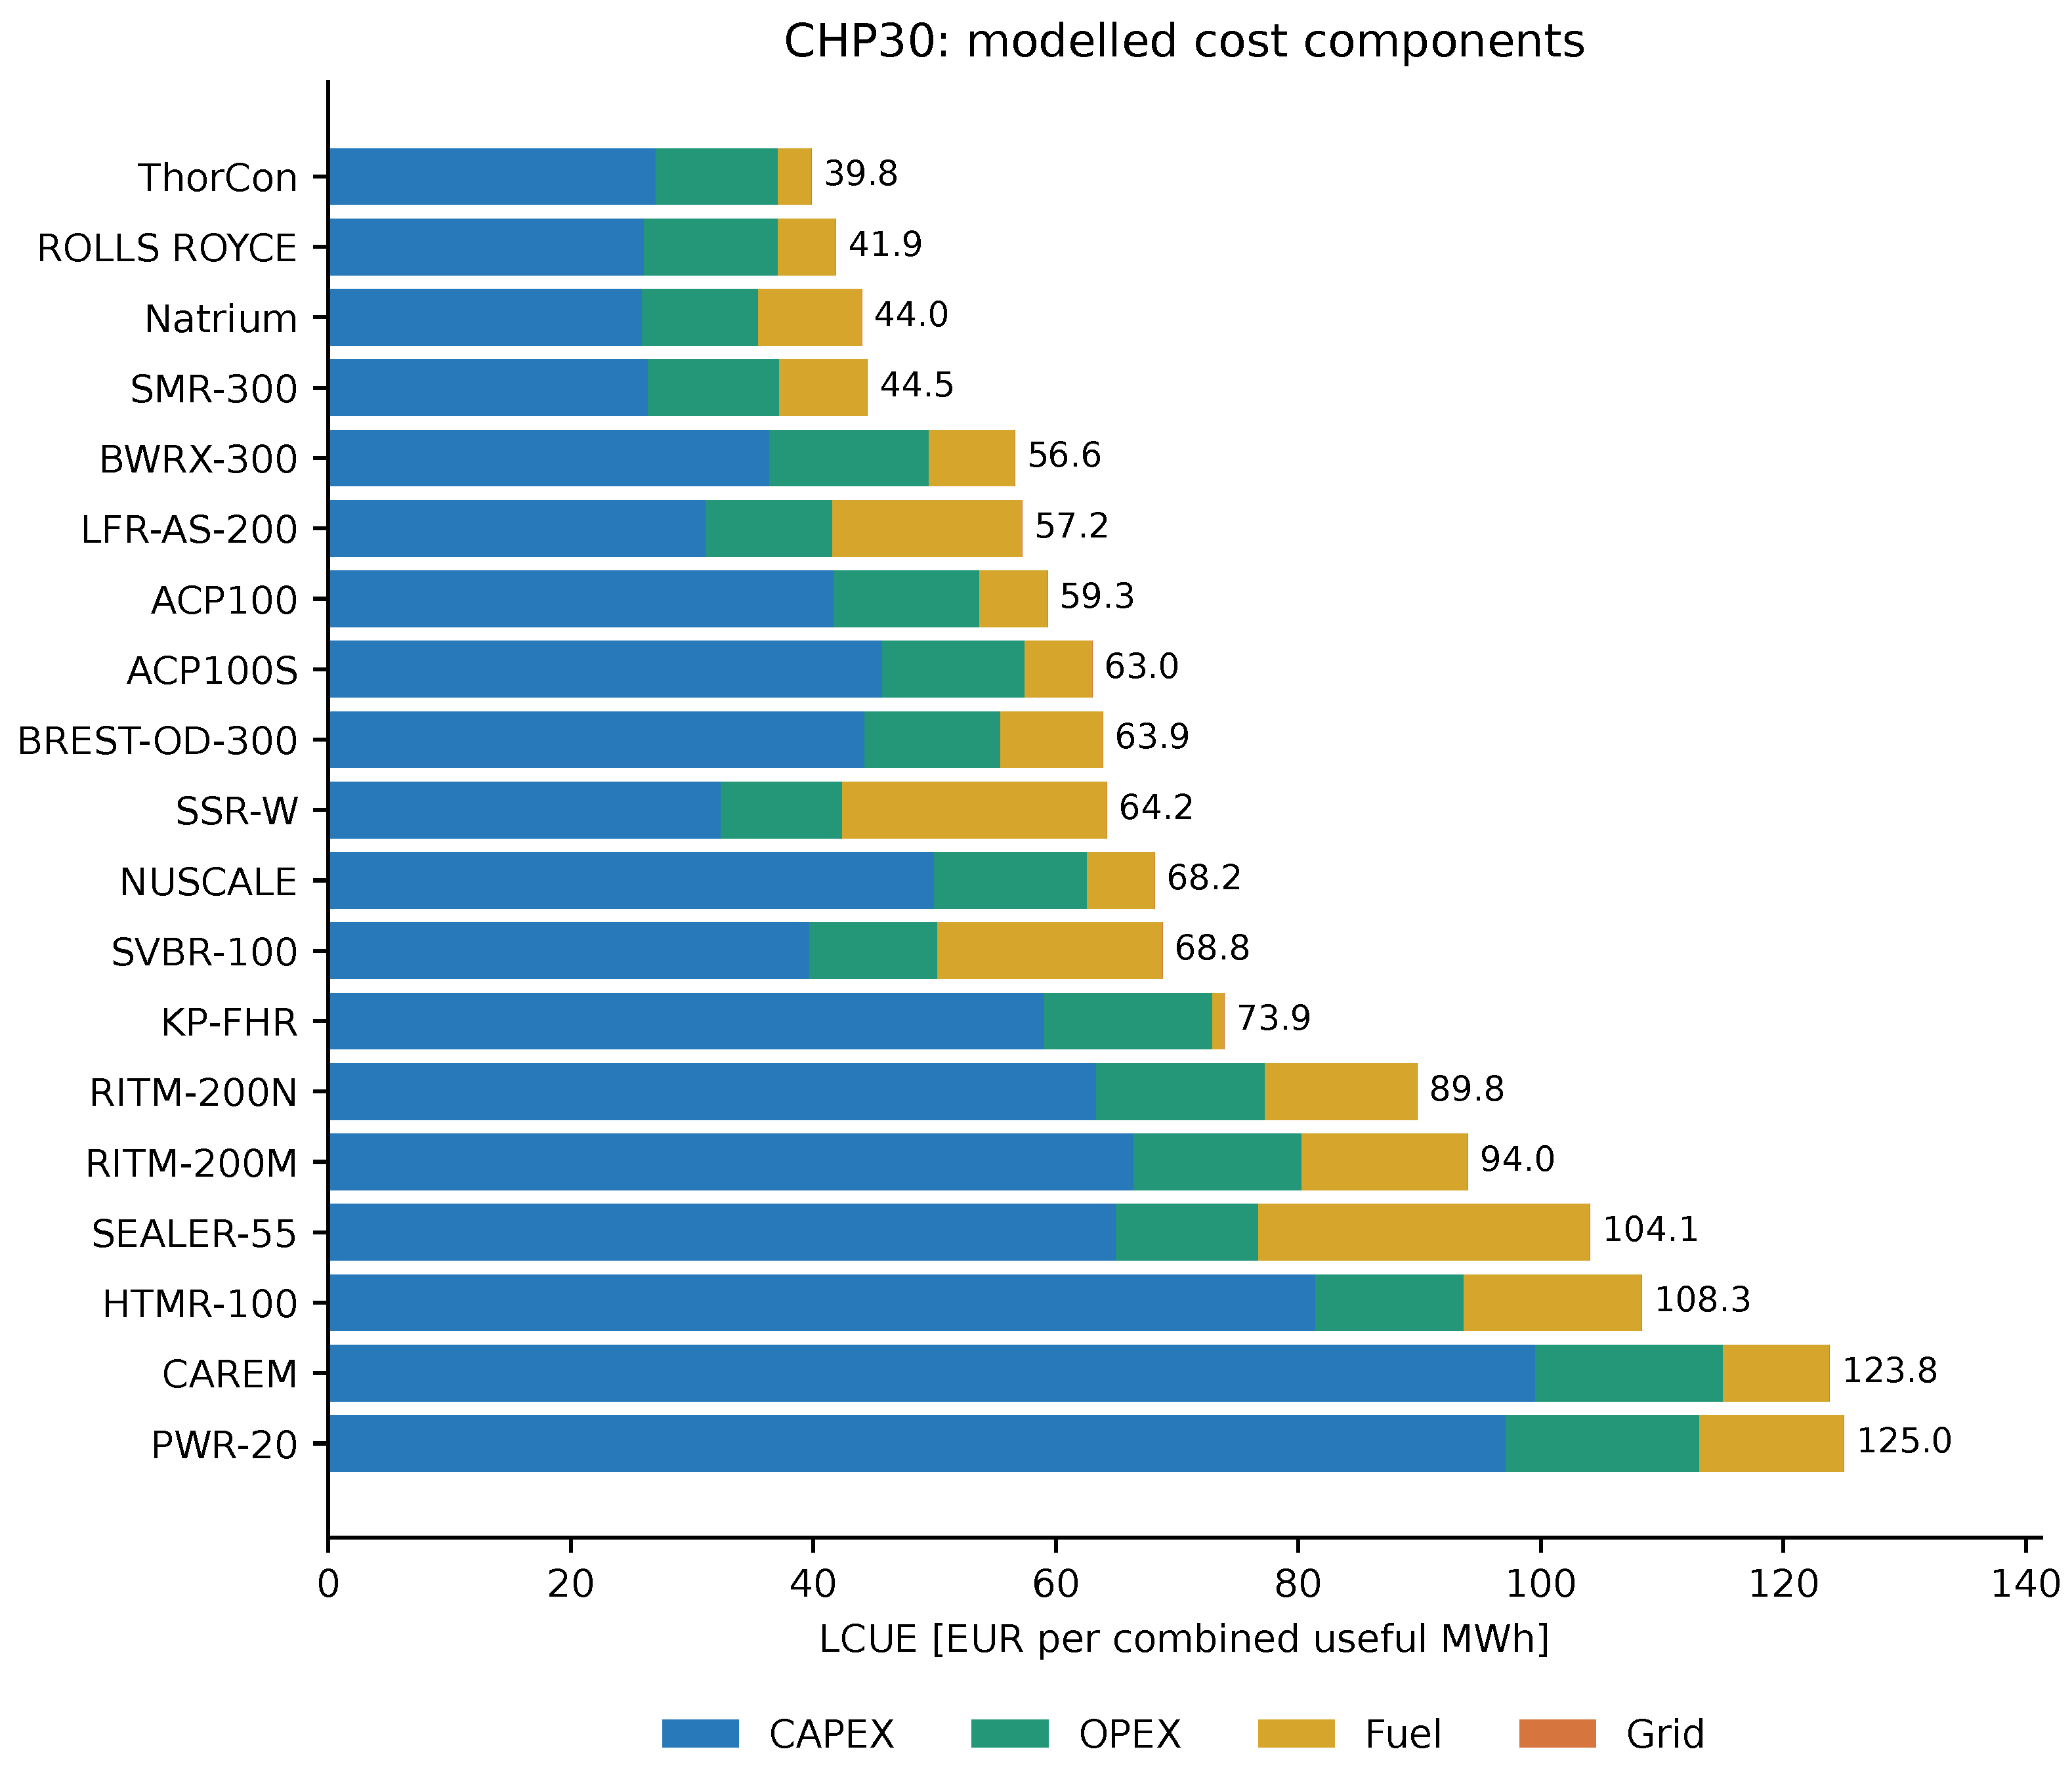
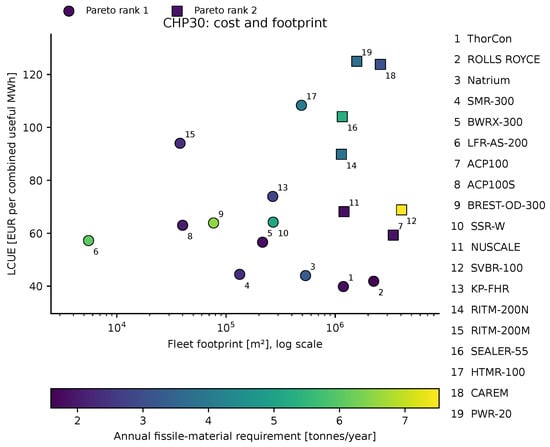
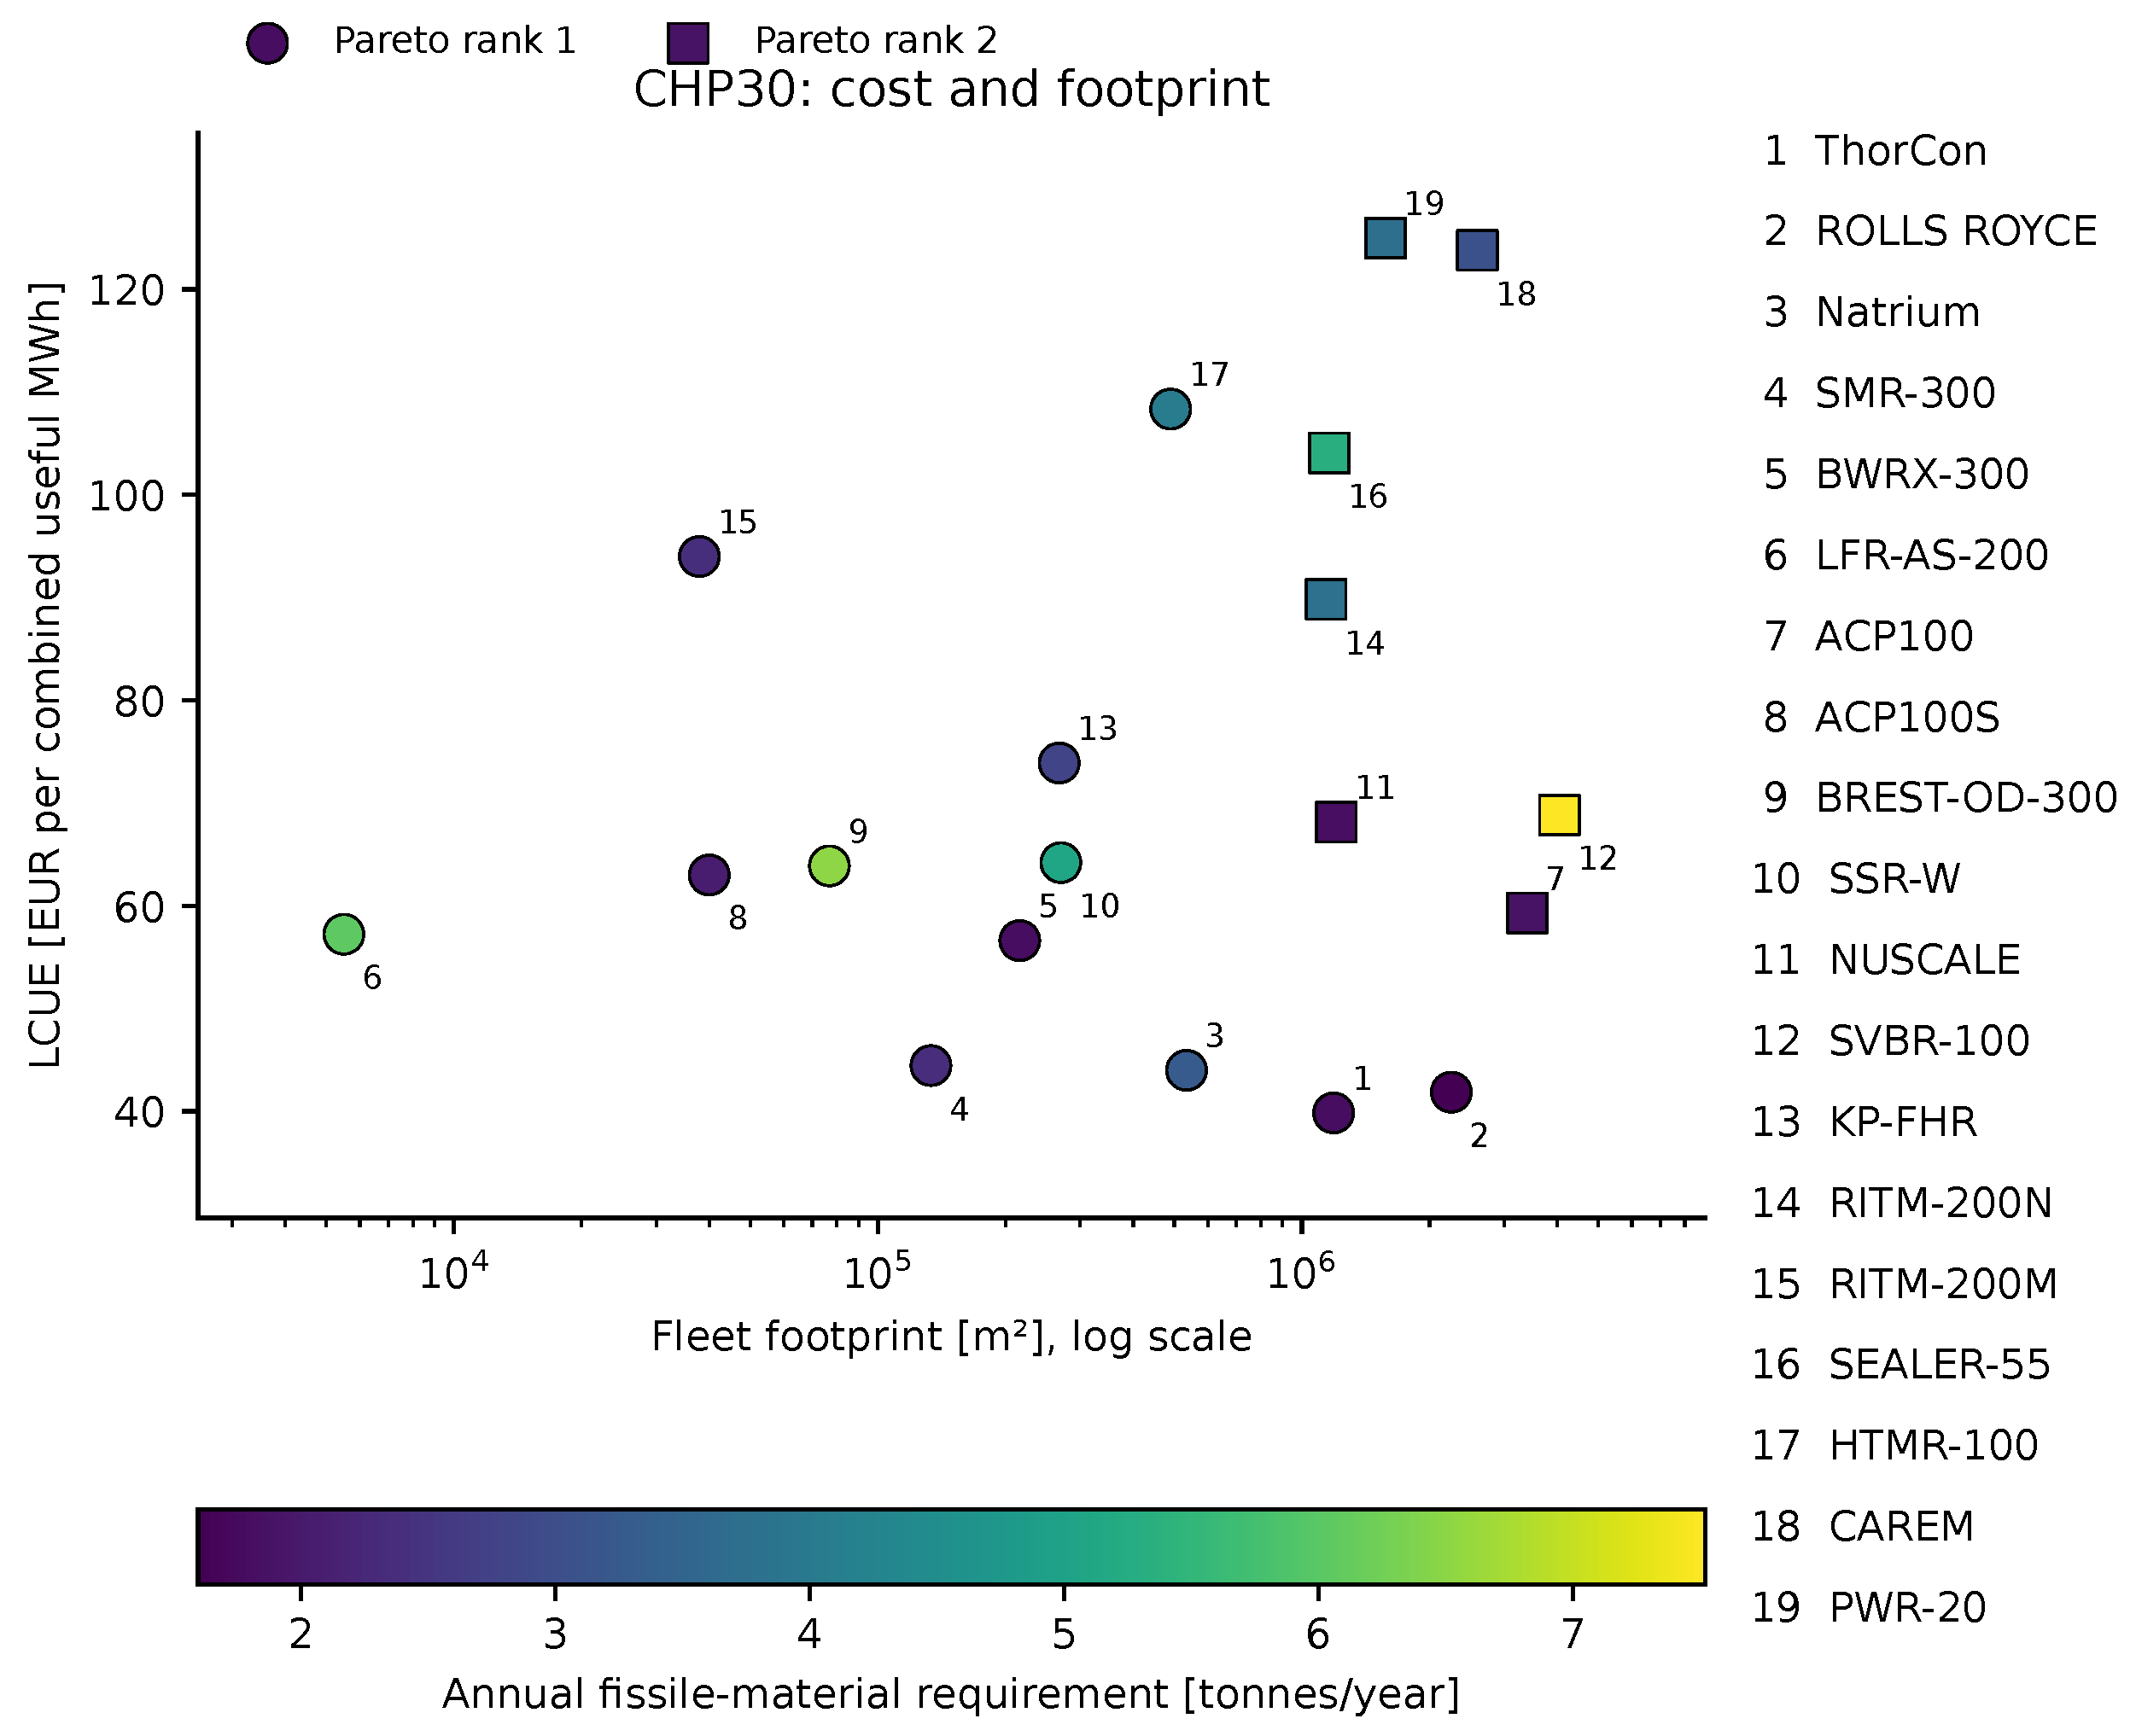
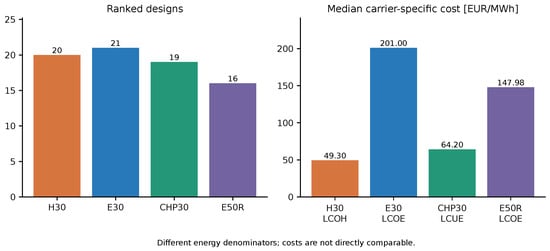
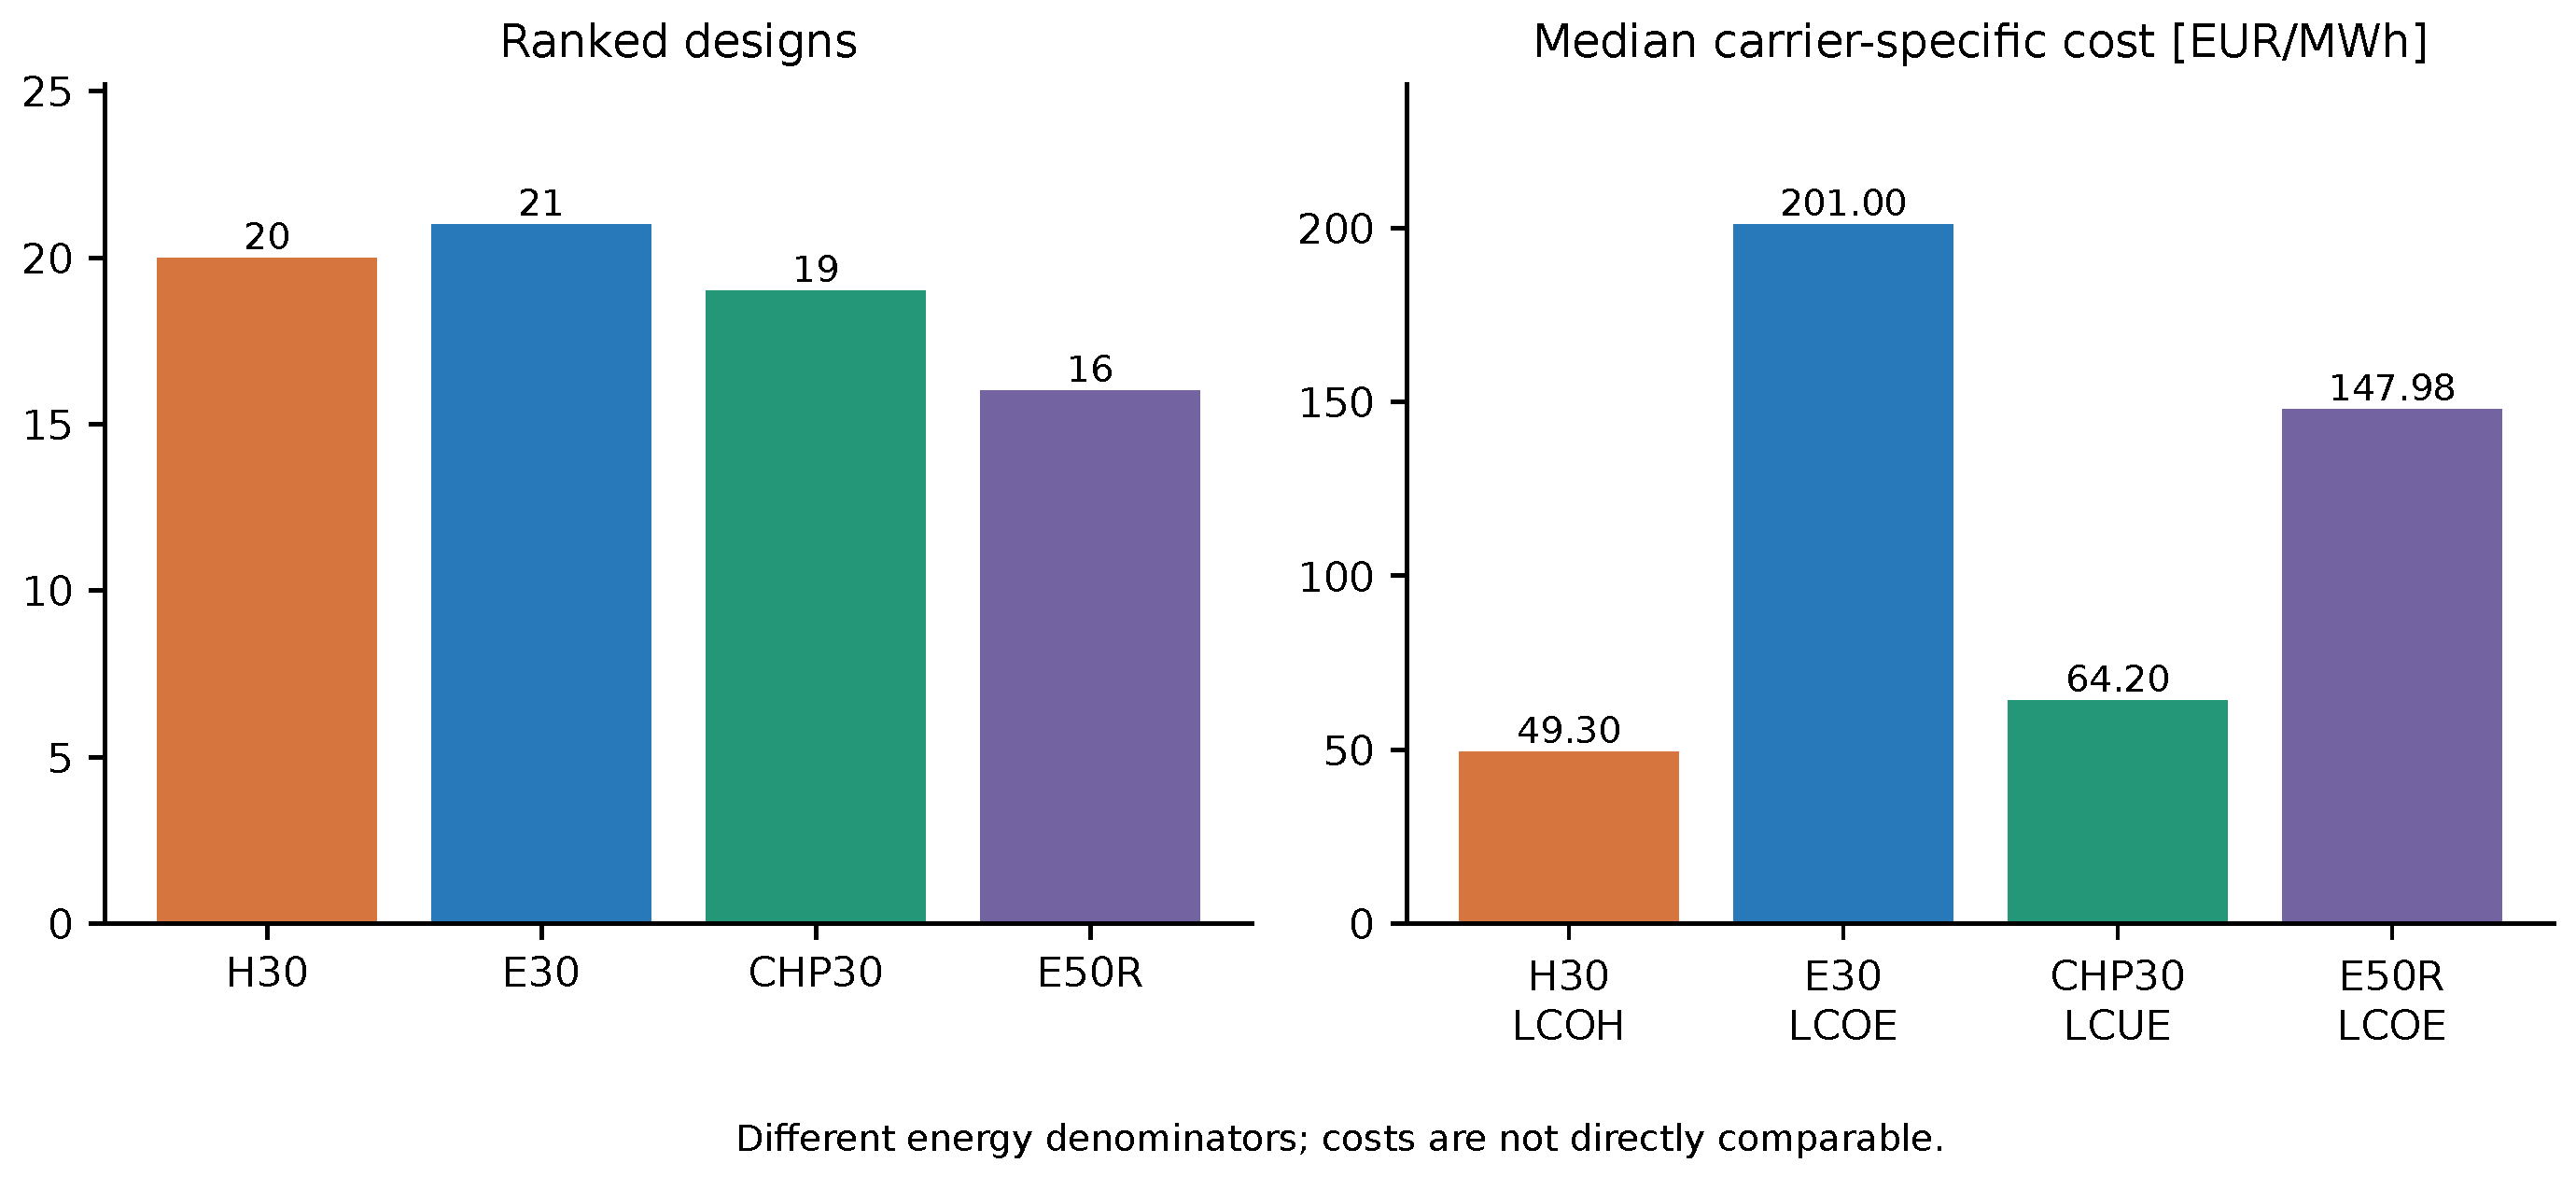
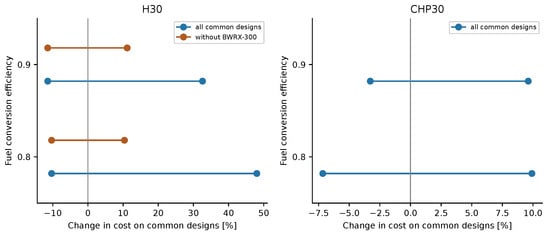
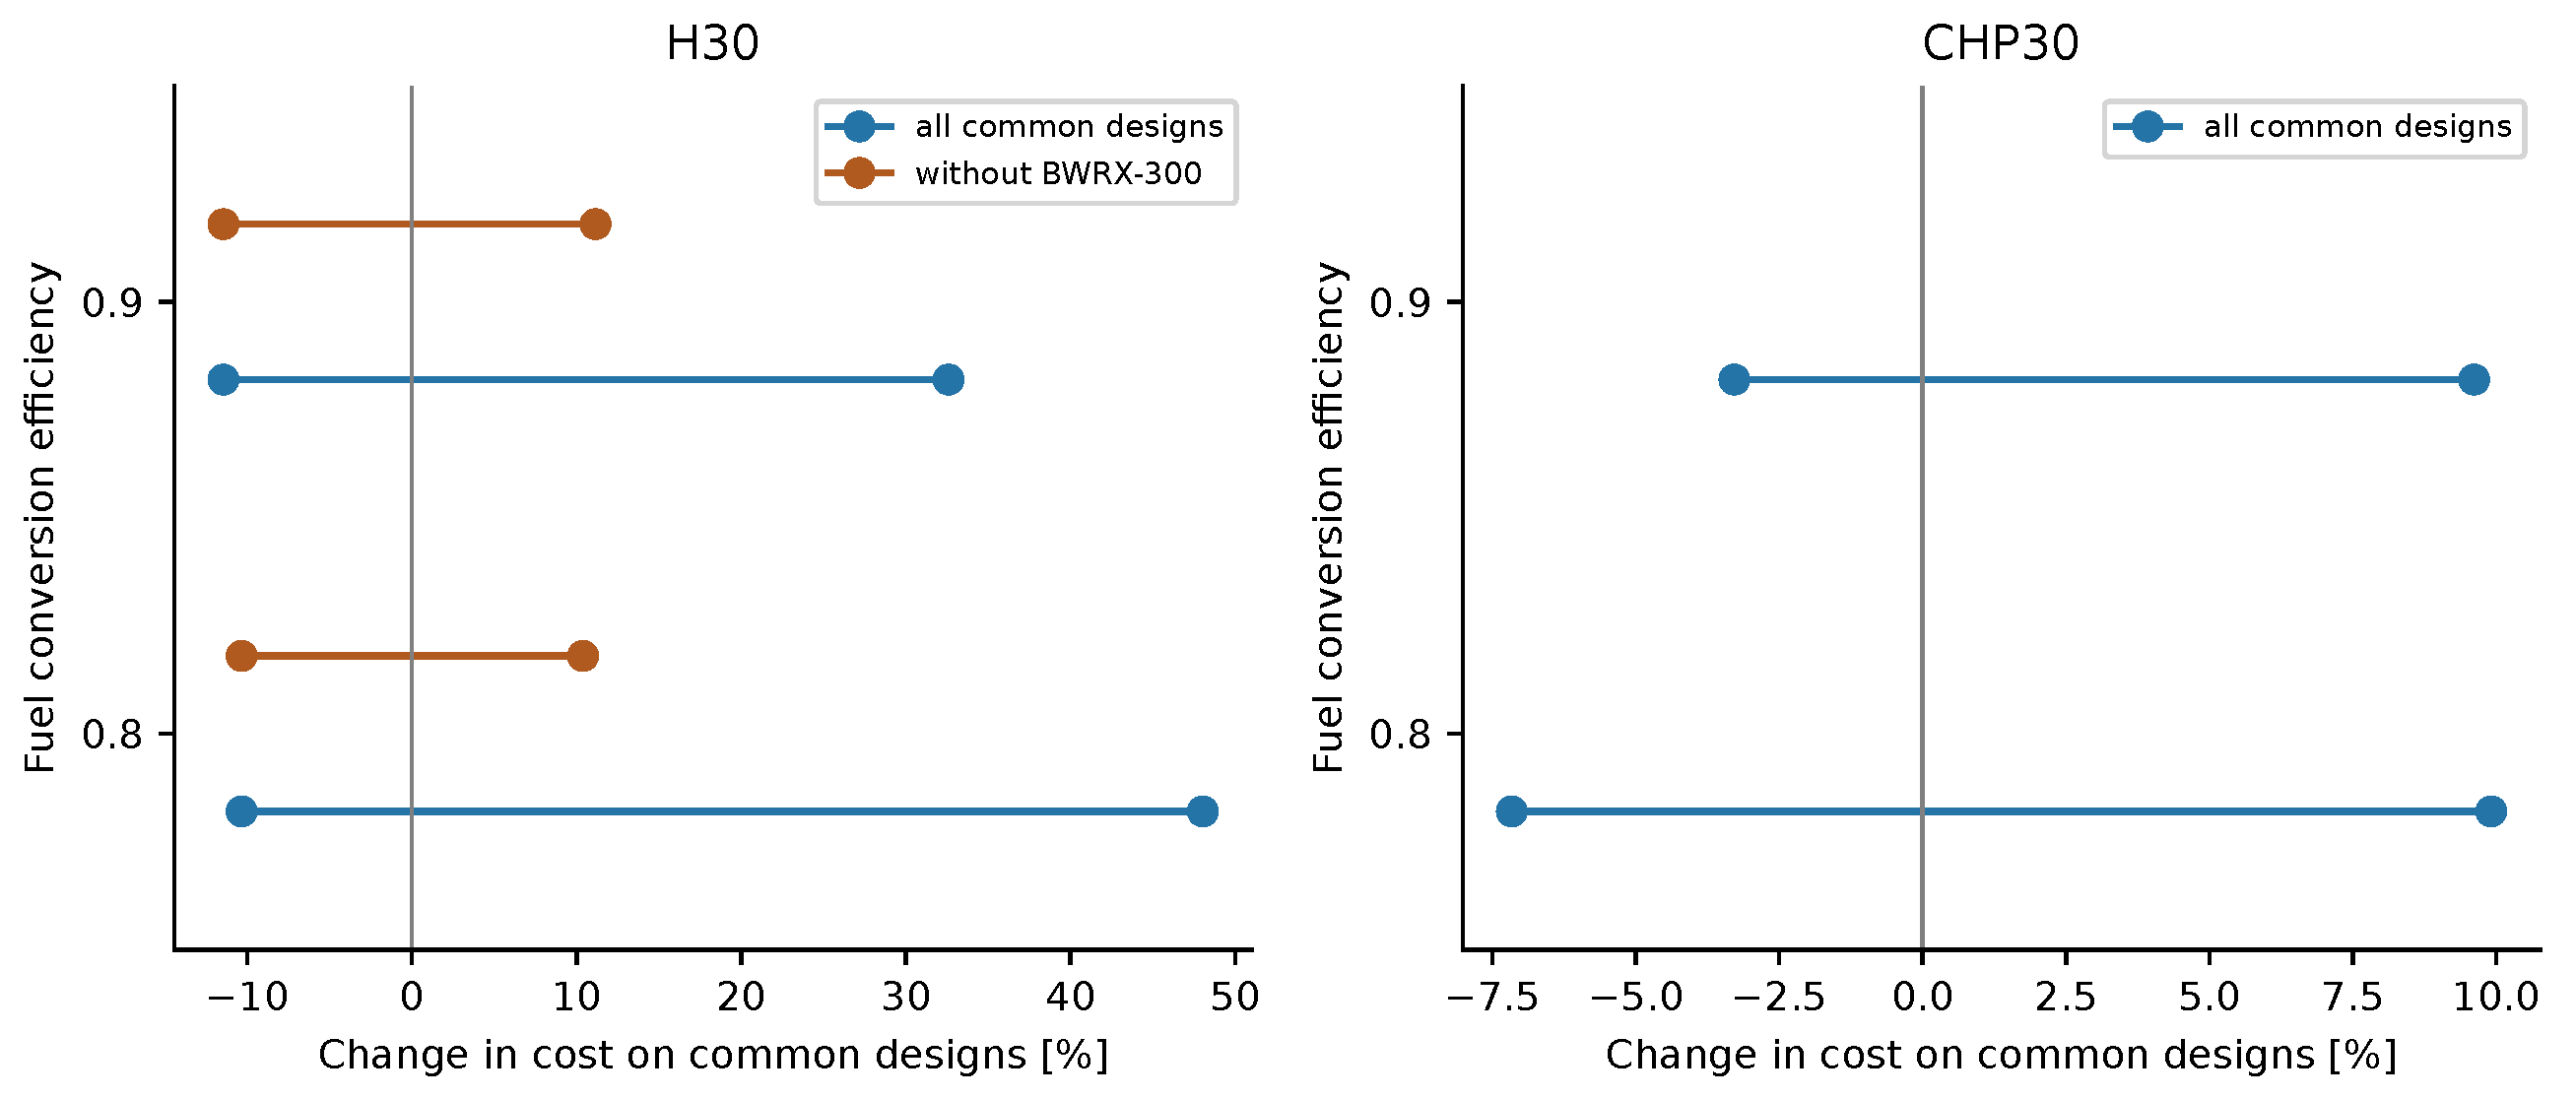
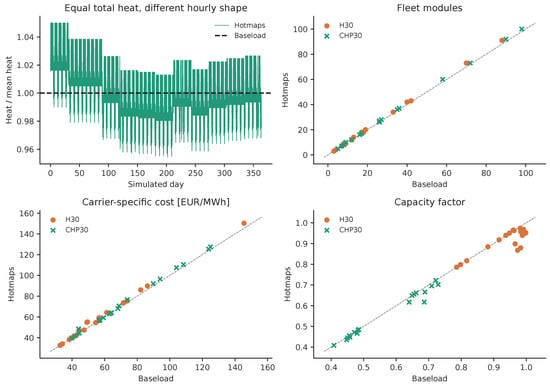
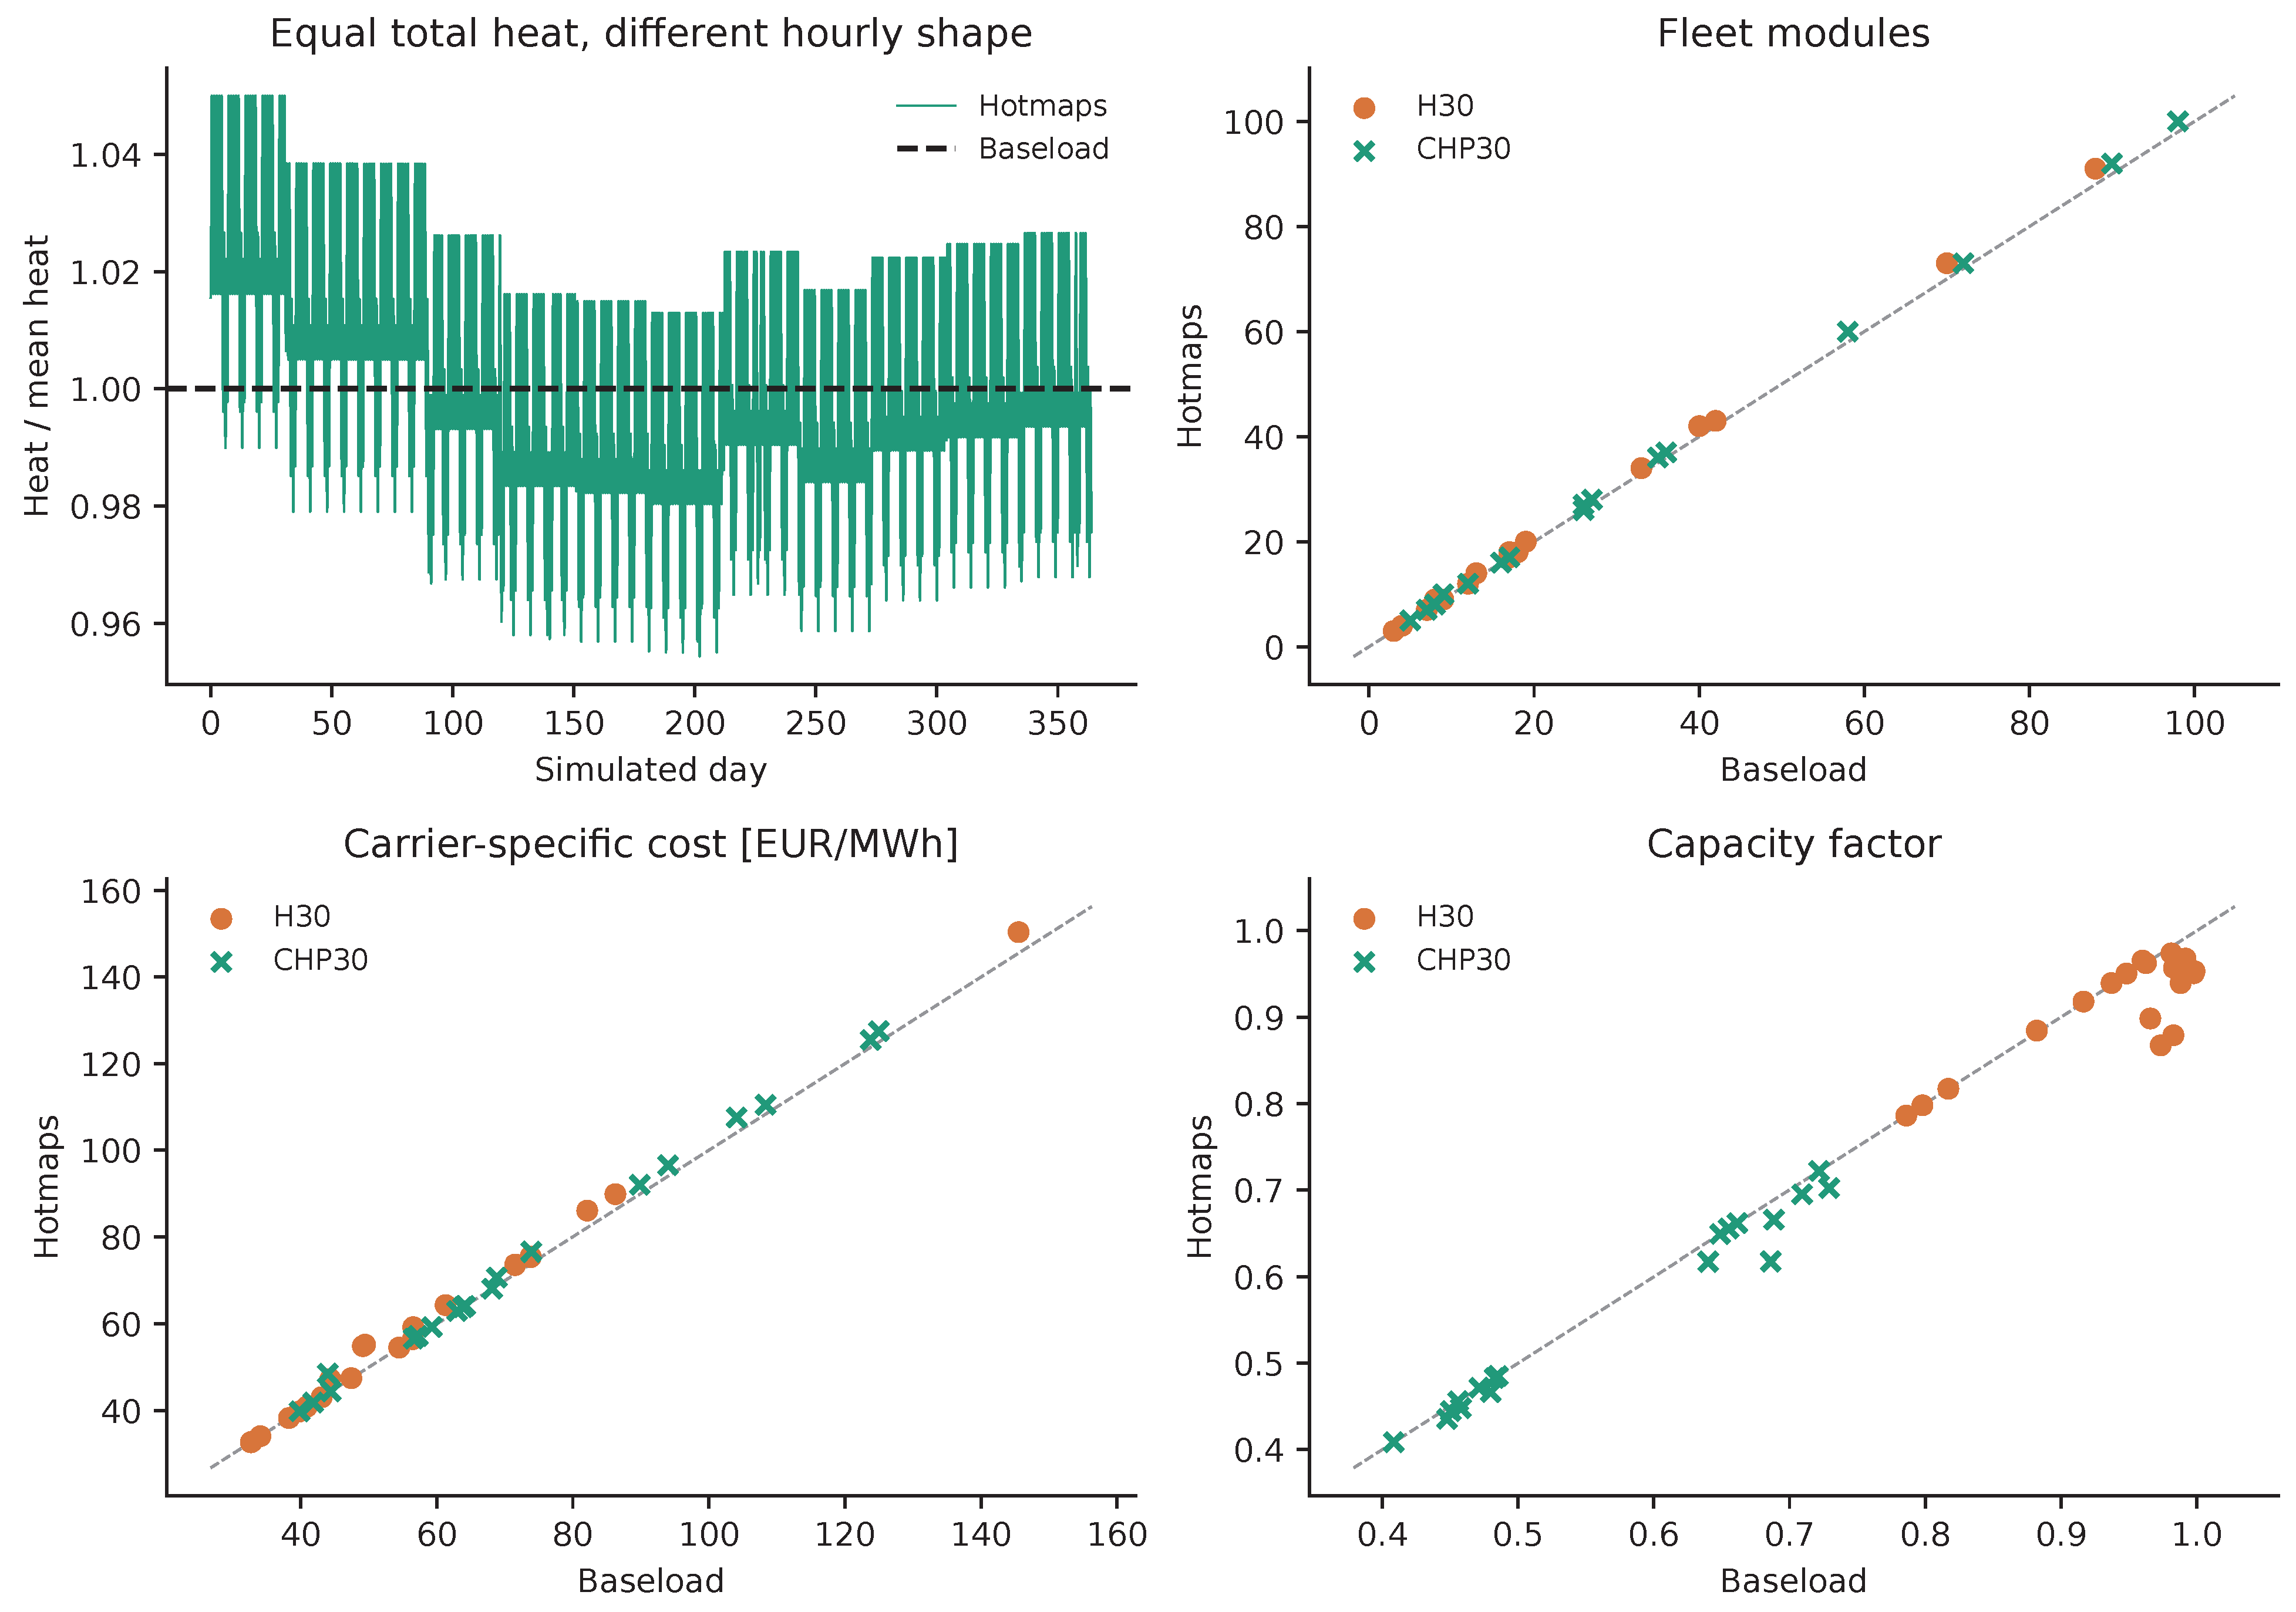
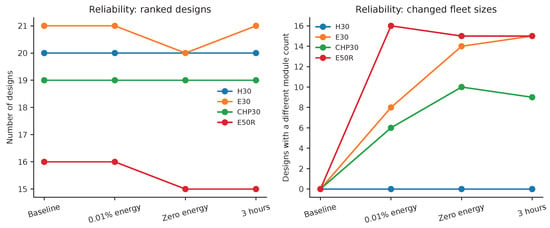
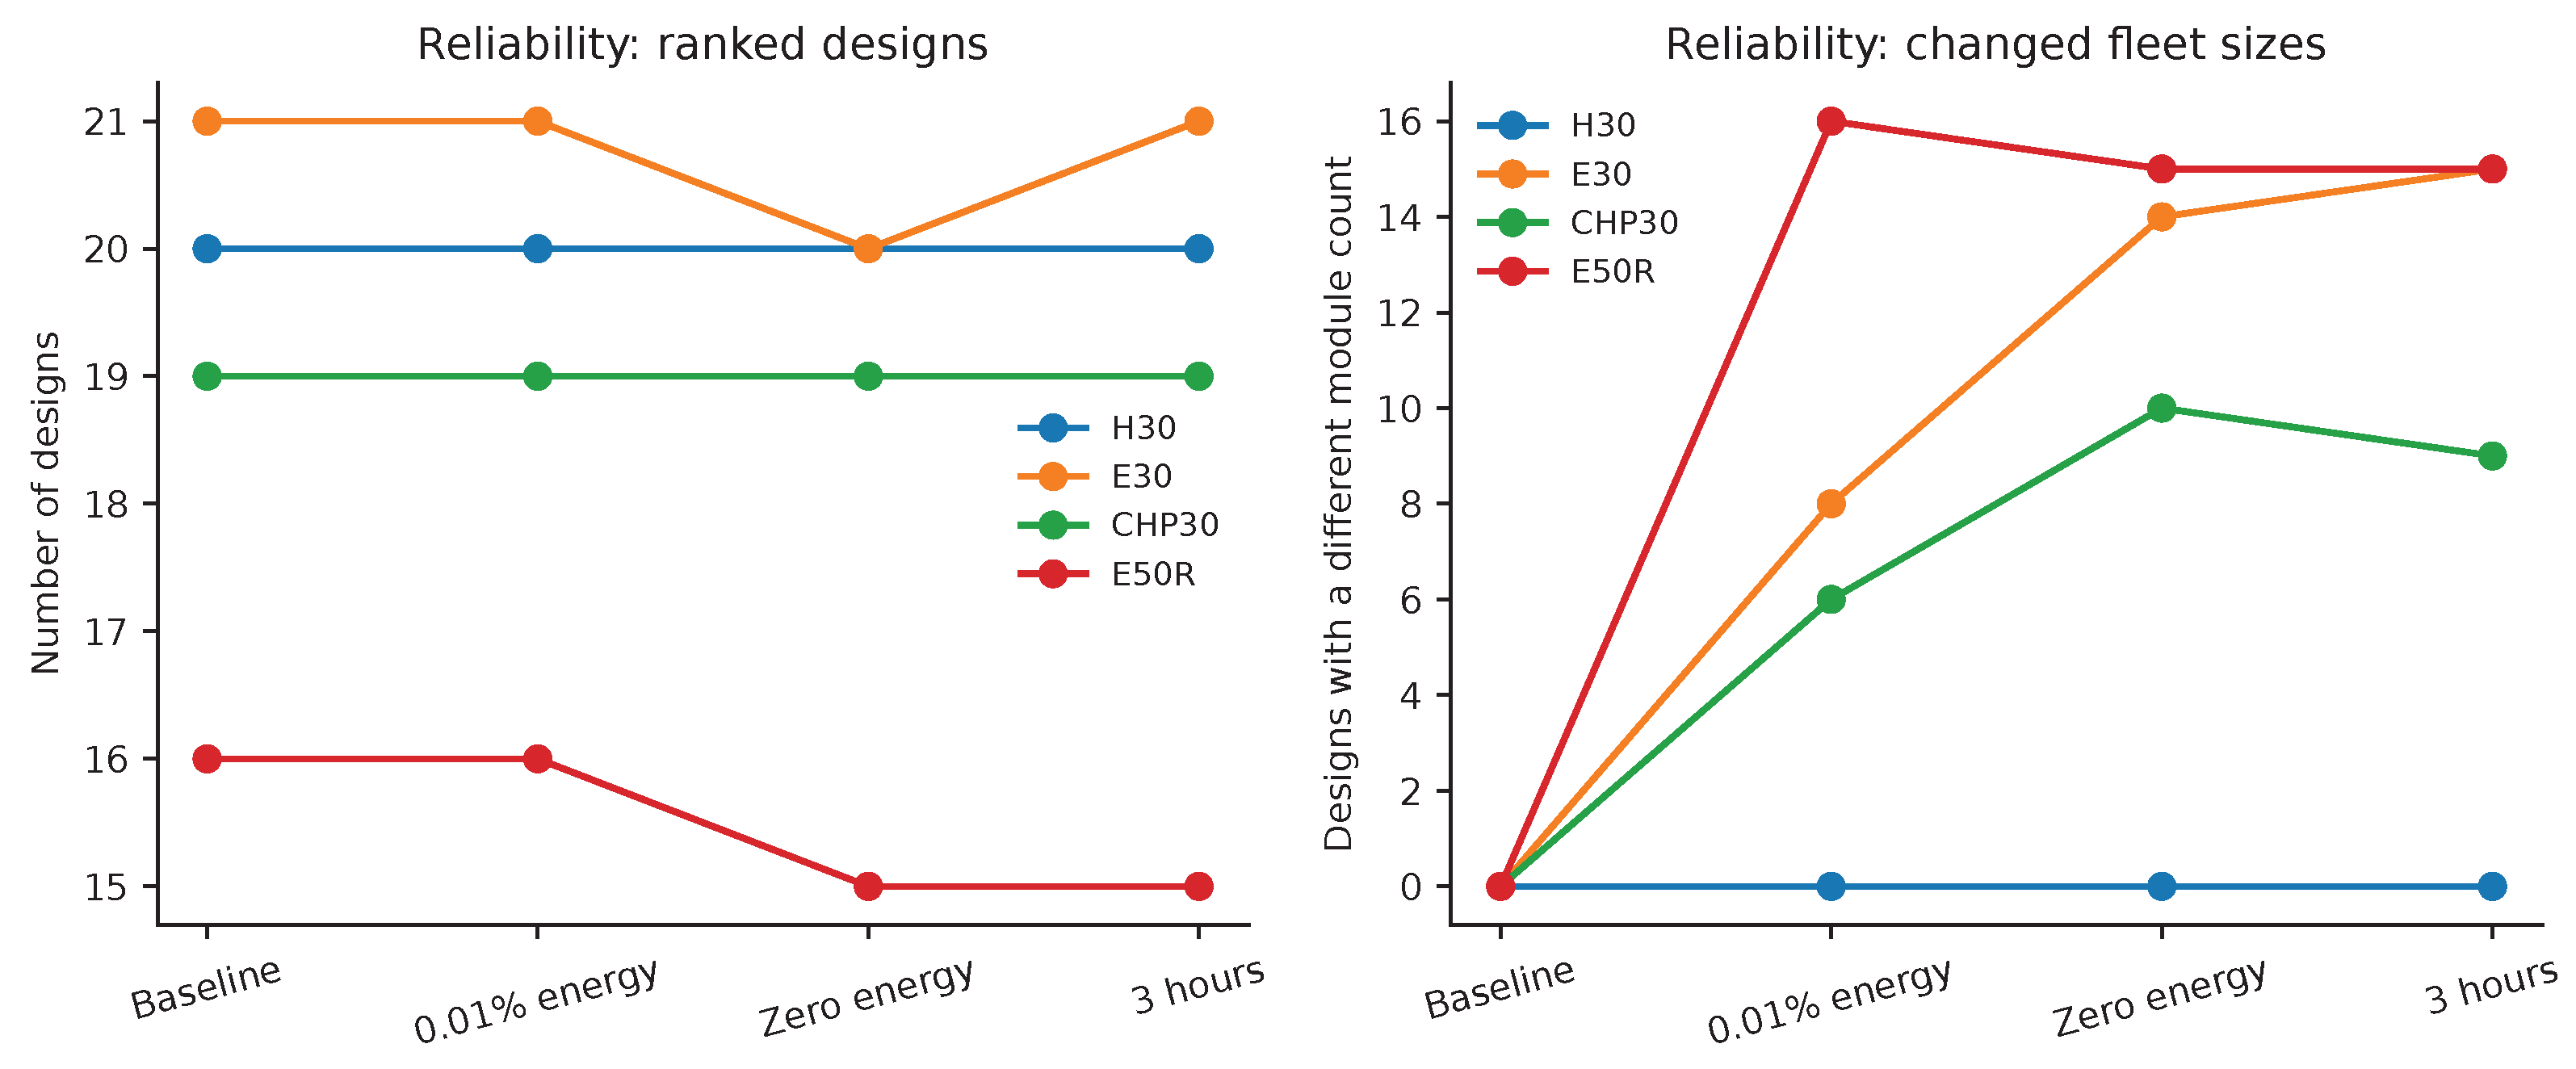

Disclaimer/Publisher’s Note: The statements, opinions and data contained in all publications are solely those of the individual author(s) and contributor(s) and not of MDPI and/or the editor(s). MDPI and/or the editor(s) disclaim responsibility for any injury to people or property resulting from any ideas, methods, instructions or products referred to in the content. |
© 2026 by the authors. Licensee MDPI, Basel, Switzerland. This article is an open access article distributed under the terms and conditions of the Creative Commons Attribution (CC BY) license.