


Abstract
Extreme climate disasters have become a major challenge to economic and social development worldwide. As a major agricultural country, China’s agricultural sector is particularly vulnerable to climate change. This study constructs an Agricultural Industrial Resilience (AIR) index from three dimensions—resistance, adaptation, and transformation—and uses panel data for 180 prefecture-level cities in China from 2006 to 2023 to examine the impact of climate risk on AIR and its underlying mechanisms. From the perspective of the agricultural value chain, we identify three key transmission channels—production efficiency, transport capacity, and market linkages—and further investigate the buffering role of digital infrastructure and regional heterogeneity. The results show that climate shocks significantly weaken AIR, and the mechanism tests provide empirical evidence consistent with the proposed production-efficiency, transport, and market-linkage channels, as reflected in agricultural total factor productivity (ATFP), transport infrastructure, and agricultural trade linkages. The moderated mediation analysis further shows that the negative indirect associations along the production-efficiency, transport-infrastructure, and agricultural-trade-linkage channels are significantly weaker at higher levels of digital infrastructure, providing further evidence of its buffering role. Heterogeneity analysis shows that the negative effect of climate shocks on AIR is more pronounced in non-major grain-producing regions. These findings suggest that building an intelligent and coordinated climate adaptation system covering the entire agricultural value chain can help strengthen the climate resilience of agricultural industrial systems and provide Chinese evidence and a theoretical basis for enhancing AIR under increasing global climate risks.
1. Introduction
Agriculture is a fundamental sector of the national economy, with extensive linkages to the secondary and tertiary industries [1]. Despite a decreasing share in the world GDP, agriculture has remained the economic foundation of most less developed nations and still forms the largest job sector globally as it continues to support close to 40 percent of all the people in the world [2]. The 2030 Agenda for Sustainable Development by the United Nations clearly points to resilience as the primary means of attaining sustainability in societies [3]. In this context, resilience science has become a useful analytical tool for facilitating sustainable agricultural development in complex conditions.
Agriculture is inherently vulnerable to natural and climatic shocks because agricultural production is highly dependent on temperature, precipitation, land, and other natural conditions. Nevertheless, rising global CO2 emissions and the resulting climate warming have contributed to more frequent extreme weather events, changing precipitation patterns, and increasing pest and disease risks [4]. Climate risk [3] has therefore become an increasingly important challenge to stable agricultural production and farmers’ incomes. It is therefore important, both theoretically and practically, to understand how climate risk affects AIR and how agricultural systems respond to such risks.
According to the existing literature, the effects of climate risk on AIR are realized in three primary ways. To start with, direct physical shocks on agricultural production. Many studies have indicated that increased temperatures, droughts, floods, and typhoons not only lower crop yields but also decrease the quality of soil as well as increasing the area covered by pests and diseases. Such alterations eventually decrease the output-to-unit-of-input ratio and lower the recovery ability of agricultural systems [5,6,7,8,9]. The same effect was reported by Argyroudis S A et al., but the authors pointed out that negative effects can be alleviated by use of digital infrastructure [10].
Second, climate risk has economic transmission effects. As one of the most devastating natural events, climate shocks not only inhibit agricultural production but also raise its cost, limit arable land and decrease the quality of production—all of which destroy farm income and the profitability of the industry [11]. At the macro level, empirical studies indicate that high temperatures are a major impediment to the growth of the economy, especially in underdeveloped and agriculturally intensive areas [5]. At the micro level, farmers and agribusinesses are not passive recipients of climate shocks; they may respond by adjusting production decisions, adopting new technologies, purchasing insurance, or reallocating production factors. However, the success of such responses is limited by access to technology, financial resources, and social capital. Furthermore, heterogeneous adaptation can contribute to the further increase in income inequality in rural areas [11]. Such results highlight that market structure, institutional support, and factor allocation are also important factors influencing AIR besides natural exposure.
Third, disruption in agri-food supply chain. Climate change impacts water supply, soil systems, and pest interactions, which have the ability to increase the risks of post-harvest and cascade through the logistics and market ends of the chain and disrupt supply chain stability [12]. Past literature has determined that these chain disruptions tend to lead to increased production and transaction costs, decreased arable land, and diminished crop and livestock production and quality-eventually causing a drop in agricultural producers’ incomes [11]. Moreover, global price volatility can be provoked by extreme weather conditions, as well as temporary trade restrictions can be introduced that re-organize trade flows and cause new threats to national food security [13,14]. The adverse consequences are more acute in economies that are less organized in the supply chain [15]. Storms and typhoons have destroyed production capacity, grain storage, and cold-chain infrastructure in China- leading to stock losses, logistical bottlenecks, and reduced cross-regional adjustment efficiency [16]. The impacts of climate risk are not confined to the production stage; rather, they can propagate along the agricultural value chain into distribution and market segments, thereby affecting the stable operation of the agricultural industrial system through changes in production efficiency, transportation reliability, and trade linkages. Given the seasonal, regional, and biological characteristics of agricultural production, an agricultural value-chain perspective is particularly useful for capturing how climate shocks originating at the production stage may subsequently propagate through circulation and market linkages.
China is one of the biggest agricultural economies and producers of agricultural products in the world, as it is projected to yield 690 million tonnes of grain in 2023, which is among the top agricultural powers in the world. The size of the Chinese agriculture is such that its resilience is not only of critical global food security but also has global implications [17]. Moreover, China is a large agricultural nation besides being very sensitive and vulnerable to climate change. China has always been among the countries with the most agricultural losses because of extreme weather conditions and climate-related disasters over the last decade [18]. Nevertheless, agricultural production in China has shown an overall increase (see Figure 1 and Figure 2 in detail). The question posed by this paradox is the following: How does climate risk influence AIR? What are the adaptation strategies and policy incentives that have been implemented in China? Within the framework of the sustainable development of the UN and the dual-carbon transition of China, it is timely and necessary to conduct a deep study of the climate risk and AIR in the Chinese context.
Figure 1.
Changes in China’s Climate Risk Index, 2000–2023.
Figure 2.
Changes in China’s agricultural development, 2000–2023.
The Chinese government in its 2025 No.1 Central Document stressed the necessity to enhance meteorological services to agriculture and enhance the disaster risk monitoring and early warning systems. This strategic path is quite consistent with the adaptation objectives of the Paris Agreement, which emphasize the reduction in climate risks, productivity, and food security. These combined bring out the urgency of technological empowerment of agriculture to improve climate resilience. Digital infrastructure is becoming more and more important in contemporary agriculture in this regard [19]. According to the existing literature, communication technologies and internet connectivity can streamline the natural and ecological environment to grow crops, reduce the impact of climate-related disasters, and increase yields and product quality while reducing losses [20]. From this perspective, digital infrastructure has the potential to mitigate the adverse effects of climate risks on agricultural sector resilience by improving agricultural production conditions, enhancing information accessibility, and strengthening industrial operational synergy; however, whether such effects actually exist, and whether they further influence the resilience, adaptability, and transformation capabilities of agricultural industrial systems, remains to be verified. Nevertheless, two important gaps remain in the existing literature. First, previous studies have predominantly focused on the direct effects of climate risk on the agricultural production stage, while paying insufficient attention to how climate shocks propagate along the agricultural value chain into circulation and market linkages. Second, there remains a lack of systematic evidence on whether digital infrastructure can buffer the adverse effects of climate risk on agricultural industrial resilience and whether such buffering effects extend to different stages of the agricultural value chain.
Accordingly, using panel data from 180 prefecture-level cities in China from 2006 to 2023, this paper examines the impact of climate risk on agricultural industrial resilience and its underlying mechanisms from an agricultural value-chain perspective. This paper addresses three key questions. First, does climate risk significantly affect AIR, and does this effect vary across regions with different agricultural production characteristics? Second, do agricultural total factor productivity, transport infrastructure, and agricultural trade linkages provide empirical support for the proposed channels linking climate risk to AIR? Third, does digital infrastructure alter the strength of the relationships along these channels? Addressing these questions is important for understanding how agricultural systems can strengthen climate adaptation capacity under increasing climate risks.
This research contributes to the literature in three ways. First, this study extends research on the impact of climate risk on agricultural industrial resilience from the production stage to the agricultural value chain. By incorporating production efficiency, circulation support, and market linkages into a unified analytical framework, it provides a more comprehensive examination of how climate shocks are transmitted across different stages of the agricultural industry. Second, this study introduces digital infrastructure into the analytical framework linking climate risk and agricultural industrial resilience. It not only examines the buffering effect of digital infrastructure on the overall impact of climate shocks, but also further investigates whether it alters the transmission of climate risk through the production, circulation, and market stages, thereby extending the role of digitalization in research on agricultural climate adaptation. Third, using panel data from 180 prefecture-level cities in China from 2006 to 2023, this study examines regional differences in the effects of climate risk from the perspective of major grain-producing-region status. It provides city-level empirical evidence for understanding the formation of agricultural industrial resilience and climate adaptation under different agricultural production conditions.
The rest of this paper will be structured in the following way. Section 2 gives the theoretical framework and research hypotheses. Section 3 outlines the empirical model, variables and data sources. The primary findings are reported in Section 4, which contains baseline regressions, endogeneity discussion, robustness tests, mechanism tests, and heterogeneity tests, mechanism tests, and heterogeneity tests. Section 5 explores the moderating effect of digital infrastructure. Section 6 addresses theoretical and practical contributions of the study. Policy implications are provided in Section 7.
2. Research Analysis and Hypotheses
2.1. Direct Impacts of Climate Risk on AIR
According to social-ecological systems (SES) resilience theory, Agricultural Industrial Resilience (AIR) is not a unidimensional measure of system stability. Rather, it refers to the capacity of the agricultural industrial system to maintain its core functions, restore production and operational activities, and undertake adaptive adjustments and transformations when confronted with external shocks [21]. Agricultural industries rely both on the natural environment and on the coordination of production, circulation, and trade processes; however, escalating climate risks may disrupt these processes and weaken this capacity. As a typical complex social-ecological system, China’s agricultural sector is therefore exposed to multidimensional direct impacts from climate change.
To begin with, climate risks interfere with the agricultural production cycles and endanger the ecological basis of AIR. For example, studies of the karst regions of southern China show that extreme heat directly affects crop growth cycles and production conditions [22]. These disturbances, may advance or prolong crop growth and development periods and increase the exposure of agricultural production to unexpected weather events, thereby adversely affecting crop yields and quality [23]. Consequently, climate variability increases fluctuations in agricultural production and raises production risks, thereby weakening the stability of agricultural industries and undermining the natural foundation of resilience.
Second, climate risks increase system operating costs and constrain the socioeconomic conditions that support adaptation. Following the occurrence of climatic shocks, agricultural producers have to invest in preventive and post-disaster recovery to maintain the stable operation of agricultural production [24]. As extreme weather events become more frequent, the costs of adaptation and recovery rise considerably. This not only compresses the profit margins of farmers and agribusinesses but also their ability to invest in long-term innovations like technological upgrades and market expansion. Persistently high costs therefore deplete the resources available for buffering shocks and supporting proactive transformation, weakening the socioeconomic foundations of agricultural resilience and, ultimately, the transformation capacity of agricultural industries.
Third, climate risks can compromise the ecological conditions essential for agricultural production. Events such as prolonged high temperatures, droughts, and heavy precipitation may adversely affect soil quality, water availability, and crop growth environments, thereby increasing the inputs required to sustain normal production operations. Compared with short-term yield losses, degradation of ecological conditions can also prolong post-disaster recovery processes, exposing agricultural stakeholders to sustained production pressures. Consequently, climate risks may simultaneously undermine both the stable operation of agricultural industries and their capacity for recovery, adjustment, and transformation, exerting an adverse effect on Agricultural Industrial Resilience (AIR).
H1.
Climate risk is negatively associated with Agricultural Industrial Resilience (AIR).
2.2. Indirect Impact of Climate Risk on AIR
Extreme weather events and environmental fluctuations induced by climate change have become important external shocks to agricultural industries. Agricultural production is seasonal, certain agricultural products are perishable, and there is a geographical separation between production areas and consumer markets; consequently, production efficiency, transportation conditions, and trade linkages collectively influence the operation of the agricultural sector. Accordingly, this study examines three proposed channels—agricultural total factor productivity, transport infrastructure, and agricultural trade linkages—that may link climate risk to Agricultural Industrial Resilience (AIR), based on the operational logic of production, distribution, and market linkage within the agricultural value chain, and incorporating analysis of production efficiency derived from neoclassical growth theory.
First, according to the neoclassical growth theory, agricultural total factor productivity (ATFP) is an important measure of technological progress and resource allocation efficiency and represents an important production-efficiency channel through which climate risk may affect AIR. The external shock of climate risk limits the enhancement of ATFP in two ways. On the one hand, extreme weather has a direct negative effect on the physiological processes of crops, which reduces the efficiency of output under certain input conditions [25]. Conversely, climate volatility has a major effect on the agricultural innovation process, including seed breeding and precision farming [11]. As a result, prolonged climate stress may constrain productivity improvements and limit the ability of agricultural systems to adapt and transform in response to external shocks.
Second, transport infrastructure serves as a critical link between agricultural production and markets, providing the essential infrastructure for the supply of agricultural inputs and the transportation of agricultural products. Extreme climate events can disrupt roads, bridges, and other transport infrastructure, leading to serious logistics network disruptions. These shocks cause a series of effects- agricultural inputs do not arrive at the production sites on time, and outputs are stuck at the source and do not reach the markets effectively [16]. For agricultural producers whose production schedules are time-sensitive and whose products are difficult to store for long periods, transport delays may further lead to insufficient production inputs, product losses, and reduced sales revenues. These losses increase the difficulty of restoring normal operations and may prolong the recovery period of agricultural industries. Therefore, deterioration in transport infrastructure conditions may weaken the connection between production and markets and thereby exert an adverse effect on AIR.
Third, agricultural trade linkages play an important role in balancing regional supply and demand and facilitating market adjustment in response to external shocks. Climate risks can affect these linkages through changes in agricultural production, trade flows, and policy responses. Production losses caused by extreme weather may reduce export supply, while affected regions may increase imports to compensate for local supply shortages. At the same time, export restrictions and other trade-policy responses may constrain cross-regional and cross-border market adjustment and amplify price volatility [14]. These changes may disrupt price signals, increase uncertainty in agricultural markets, and weaken the efficiency of resource allocation. When market linkages and cross-regional adjustment mechanisms are impaired, subnational and national agricultural systems may become less able to absorb supply-side shocks, thereby weakening their overall resilience.
H2.
Agricultural total factor productivity constitutes a production-efficiency channel linking climate risk to AIR.
H3.
Transport-infrastructure conditions constitute a circulation-support channel linking climate risk to AIR.
H4.
Agricultural trade linkages constitute a market-linkage channel linking climate risk to AIR.
2.3. The Moderating Role of Digital Infrastructure
In agricultural production, circulation, and trade, digital infrastructure can provide agricultural actors with informational and technological support to cope with climate risks. Farmers and agricultural enterprises can make timely adjustments to their production and operational arrangements based on meteorological early-warning information and market signals, thereby reducing the losses caused by climate shocks. Therefore, digital infrastructure may moderate the effect of climate risk on AIR by mitigating the adverse impacts transmitted through the aforementioned processes.
To begin with, at the production stage, digital infrastructure is an important support for mitigating climate-risk shocks and enhancing AIR. In particular, digital infrastructure can facilitate the timely monitoring and early warning of potential climate risks, thereby reducing risk exposure [10]. Improved climate early-warning and information-access capabilities enable agricultural producers to shift from experience-based passive responses toward data-driven proactive adaptation. For example, farmers can adjust their production plans based on accurate short-term weather forecasts, thereby avoiding or reducing losses caused by climate disasters and stabilizing agricultural output [26]. Therefore, the higher the level of digital infrastructure, the stronger the capacity of agricultural systems to offset production uncertainty through refined management and forward-looking decision-making. This can mitigate the adverse effect of climate risk on agricultural total factor productivity (ATFP), thereby reducing its negative impact on AIR.
Second, during the circulation stage, digital infrastructure can enhance the efficiency of information dissemination and transportation coordination, thereby mitigating the adverse effects of climate risks on agricultural distribution. Transport infrastructure provides the basic conditions for the supply of agricultural inputs and the transportation of agricultural products. When extreme weather events disrupt the normal operation of certain roads, timely access to road condition data and the adjustment of transportation arrangements can help minimize losses caused by distribution disruptions. Digital infrastructure supports road condition monitoring, information sharing, and logistics scheduling, thereby enhancing the adaptive capacity of logistics systems [27]. Agricultural enterprises and logistics operators can adjust transportation routes and schedules based on real-time road conditions and transport demand, thereby reducing delays in the supply of agricultural inputs and minimizing product spoilage during transport. Consequently, digital infrastructure helps agricultural actors use existing transport conditions more effectively to cope with climate shocks, mitigating the effects of circulation disruptions on agricultural production and operations and thereby reducing their adverse impacts on AIR.
Third, at the agricultural trade stage, digital infrastructure can enhance market information dissemination and transaction coordination, thereby providing support for agricultural actors to mitigate the impacts of climate shocks. Existing research has demonstrated that digital technologies help reduce the costs associated with identifying trading opportunities, conducting negotiations, and organizing deliveries in agricultural and food trade [28]. Under the pressure of climate risks, these improvements in information and transaction conditions enable agricultural actors to adjust their procurement and sales strategies in response to shifts in supply and demand. On one hand, when existing sales channels are disrupted, agricultural actors can leverage digital platforms to access demand information from alternative markets, connect with buyers, and—where transportation conditions permit—reduce product inventory buildup; on the other hand, when local supply falls short, they can utilize digital platforms to source external supplies and optimize procurement arrangements, thereby alleviating supply shortages. Consequently, digital infrastructure facilitates agricultural actors in maintaining and adapting their trade relationships, mitigating the transactional challenges posed by climate shocks, and thereby reducing the adverse effect of climate risk on AIR transmitted through agricultural trade linkages.
In summary, digital infrastructure—by improving access to information and facilitating resource coordination—enables agricultural actors to optimize production inputs, transportation arrangements, and market transactions, thereby helping to mitigate the adverse impacts of climate risk across the stages of agricultural production, distribution, and trade. Accordingly, this paper proposes the following hypotheses.
H5.
Digital infrastructure weakens the adverse relationship between climate risk and AIR along the production-efficiency channel.
H6.
Digital infrastructure weakens the adverse relationship between climate risk and AIR along the circulation-support channel.
H7.
Digital infrastructure weakens the adverse relationship between climate risk and AIR along the market-linkage channel.
The analytical framework of this study is presented in Figure 3.
Figure 3.
Analytical Framework.
3. Study Design and Variable Descriptions
3.1. Modeling
3.1.1. Benchmark Regression Model
To accurately demonstrate the effect of CRS on the AIR, the following regression model was set:
AIRit = α0 + β1CRSit + γTXit + μi + λt + εit
AIRit denotes the level of AIR of city i in period t; and CRSit denotes the level of CRS of city i in period t. Xit denotes the control variables, α0 denotes the constant term, β1 denotes the estimated coefficients of the core explanatory variables, γ denotes the coefficients of the control variables, μi denotes the area fixed effect, λt denotes the time fixed effect, and εit denotes the random disturbance term.
3.1.2. Mediation Effect Model
To further explore the mechanism of the effect of CRS on the AIR, this study constructed the following mediating effect model based on the regression model in Equation (1):
Mit = α2 + β2CRSit + γTXit + μi + λt + εit
AIRit = α3 + β3CRSit + b1Mit + γTXit + μi + λt + εit
In Equations (2) and (3), Mit denotes the mechanism variable of region i in period t; and α2 and α3 are constant terms; β2, β3, and γ, b1 and are the estimated coefficients; and the remaining variables are set up in the same manner as in Equation (1).
3.1.3. Moderated Mediation Effect
To examine whether digital infrastructure moderates the indirect effects of climate risk on Agricultural Industrial Resilience (AIR), this study further specifies the following models:
AIRit = α4 + β4CRSit + π1RDIit + b2Mit + φ1(CRSit × RDIit) + γTXit + μi + λt + εit
Mit = α5 + β5CRSit + π2RDIit + φ2(CRSit × RDIit) + γTXit + μi + λt + εit
AIRit = α6 + β6CRSit + π3RDIit + b3Mit + φ3(CRSit × RDIit + ω1(RDIit × Mit) + γTXit + μi + λt + εit
Here, RDIit denotes the level of digital infrastructure in region i at time t; Mit denotes the mediating variable, including agricultural total factor productivity (ATFP), transport infrastructure (ROAD), and agricultural trade linkages (ATD). CRSit × RDIit captures the moderating effect of digital infrastructure on the relationship between climate risk and the corresponding dependent variable, while RDIit × Mit captures the moderating effect of digital infrastructure on the relationship between the mediator and AIR. The remaining variables are defined as above.
3.2. Variables
3.2.1. Dependent Variable
“Resilience” refers to a system’s capacity to maintain its fundamental functions under external shocks and to achieve sustained operation through adaptive adjustments or structural transformations [29]. Research on the resilience of agricultural and food systems is typically framed within three interrelated capabilities: robustness, adaptability, and transformability. Based on this framework, this study defines Agricultural Industrial Resilience (AIR) as the ability of an agricultural industrial system to preserve its core production and operational functions in the face of internal and external shocks and to achieve sustainable development through production adjustments and technological transformations [22]. Accordingly, this paper constructs an AIR evaluation indicator system from three dimensions: resistance, adaptability, and transformability. Resistance reflects the system’s ability to maintain stable agricultural production and absorb losses following a shock; it is measured by grain production stability and agricultural insurance depth. Adaptability reflects the ability of agricultural actors to adjust their production structures and allocate resources within existing production systems; it is measured by the degree of concentration of the crop planting structure and the income level of rural residents. Transformability reflects the ability to establish new development pathways through technological innovation and public support when existing production models become unsustainable; it is measured by the number of agricultural patent grants and the extent of fiscal support for agriculture. Specific indicators are presented in Table 1. The six indicators are standardized over the pooled 2006–2023 city-year sample, and the entropy weights are held constant across cities and years. The weighted indicators are then aggregated to obtain the AIR index. Detailed calculation procedures are provided in the Appendix A.2.
Table 1.
Evaluation Indicator System for Agricultural Industrial Resilience (AIR).
3.2.2. Core Explanatory Variable
Drawing on the climate physical risk framework of Guo et al. [30], this study constructs a city-level composite climate risk index to measure the physical climate-risk exposure faced by cities. First, daily meteorological data from 1974 to 2003, covering a 30-year historical reference period, are used to determine city-specific thresholds for extreme climate events at the prefecture level. Specifically, the threshold for extreme heat is defined as the 90th percentile of the distribution of daily maximum temperature; the threshold for extreme cold is defined as the 10th percentile of the distribution of daily minimum temperature; the threshold for extreme precipitation is defined as the 95th percentile of the distribution of precipitation on wet days; and the threshold for extreme wind is defined as the 95th percentile of the distribution of daily maximum wind speed. These thresholds are held constant over the study period from 2006 to 2023. Daily observations from meteorological stations are first spatially interpolated using the inverse distance weighting (IDW) method to construct city-level daily meteorological series. Based on these data, four city-year climate risk indicators are constructed: extreme heat days (HTD), extreme low-temperature days (LTD), extreme precipitation days (ERD), and extreme wind days (EED). The annual extreme-climate measures are transformed into component risk indices relative to the fixed historical reference period. The historical benchmark is held constant when the component indices are calculated for the 2006–2023 study period; therefore, a component index may exceed 100 when the corresponding annual extreme-event frequency exceeds its historical benchmark range. The four component indices are then assigned equal weights of 0.25 and aggregated to construct the Climate Risk Shock Index (CRS). A higher CRS indicates greater overall exposure to physical climate risk. Detailed definitions of the indicators, threshold settings, and aggregation procedures are provided in Appendix Table A1.
3.2.3. Mechanism Variables
Agricultural Total Factor Productivity (ATFP). Agricultural total factor productivity reflects the utilization efficiency of composite factor inputs in the agricultural production process and is an important variable for capturing the production-efficiency channel through which climate risk affects Agricultural Industrial Resilience (AIR). Following existing studies, this study employs the DEA–Malmquist index method to measure agricultural total factor productivity [31,32]. The input variables comprise five categories of production factors—land, labor, machinery, fertilizer, and water resources, which are measured by total crop sown area, employment in agriculture, forestry, animal husbandry and fishery, total power of agricultural machinery, agricultural fertilizer application in nutrient-equivalent terms, and effective irrigated area, respectively. The output variable is measured by the price-deflated Gross Output Value of Agriculture, Forestry, Animal Husbandry and Fishery.
Transport Infrastructure (ROAD). Transport infrastructure reduces the transportation costs of agricultural inputs and the cross-regional circulation of agricultural products, while strengthening spatial linkages across different stages of the agricultural value chain. Following Gao and Tong (2026), this study measures transport infrastructure by the ratio of total road mileage to administrative area at the prefecture-city level and applies a logarithmic transformation [33]. This measure is intended to capture the structural density and accessibility of the local transport network, which provide the basic circulation conditions through which agricultural inputs and products move between production areas and markets.
Agricultural Trade Linkages (ATD). Agricultural Trade Linkages reflect the strength of linkages between regional agriculture and external markets. Such linkages can alleviate local supply–demand mismatches caused by climate shocks through cross-regional and cross-border flows of agricultural products and enhance the adjustment capacity of agricultural industries. Following Zhang et al., this study measures agricultural trade linkages by the ratio of total agricultural imports and exports to the value added of the primary industry [34]. Import and export values are converted using the annual average RMB–USD exchange rate to ensure consistency in measurement units. A higher value indicates stronger linkages between the regional agricultural sector and external markets. As ATD combines both imports and exports, it captures the overall intensity of external market linkages rather than the direction of individual trade flows.
3.2.4. Moderating Variable
The level of digital infrastructure is captured by the logarithm of the number of rural internet users in each prefecture-level city. Communication technologies and internet access are widely regarded as key enablers of rural development, and internet penetration is commonly used as a proxy for the level of digital infrastructure [35].
3.2.5. Control Variables
To mitigate omitted variable bias and ensure robust estimation, we include a series of control variables to account for the socioeconomic conditions that may also influence AIR. ① Population size (POP): Population size not only affects the supply of agricultural labor but also has a close relationship with regional resource allocation and the demand for public services; this study employs the natural logarithm of the total population in the region as a measure. ② Urbanization level (URB): Urbanization influences agricultural production and operations through labor transfer, factor reallocation, and the integration of urban and rural markets; this study uses the proportion of the permanent urban resident population relative to the total permanent population in the region as a measure. ③ Urban-rural income gap (UIG): This study employs the ratio of per capita disposable income of urban residents to that of rural residents as a measure; a higher ratio indicates a larger urban-rural income gap. ④ Regional agricultural economic level (ECO): This is measured by the proportion of the output value of the primary industry relative to GDP in the region. ⑤ Industrial structure sophistication (ISU): Industrial structure upgrading can influence agricultural development conditions through labor allocation, capital flow, and industrial linkages; this study uses the ratio of the value added of the tertiary industry to that of the secondary industry as a measure of industrial structure sophistication. Table 2 gives detailed definitions and descriptive statistics of all variables.
Table 2.
Descriptive Statistics of Variables.
3.3. Data Sources
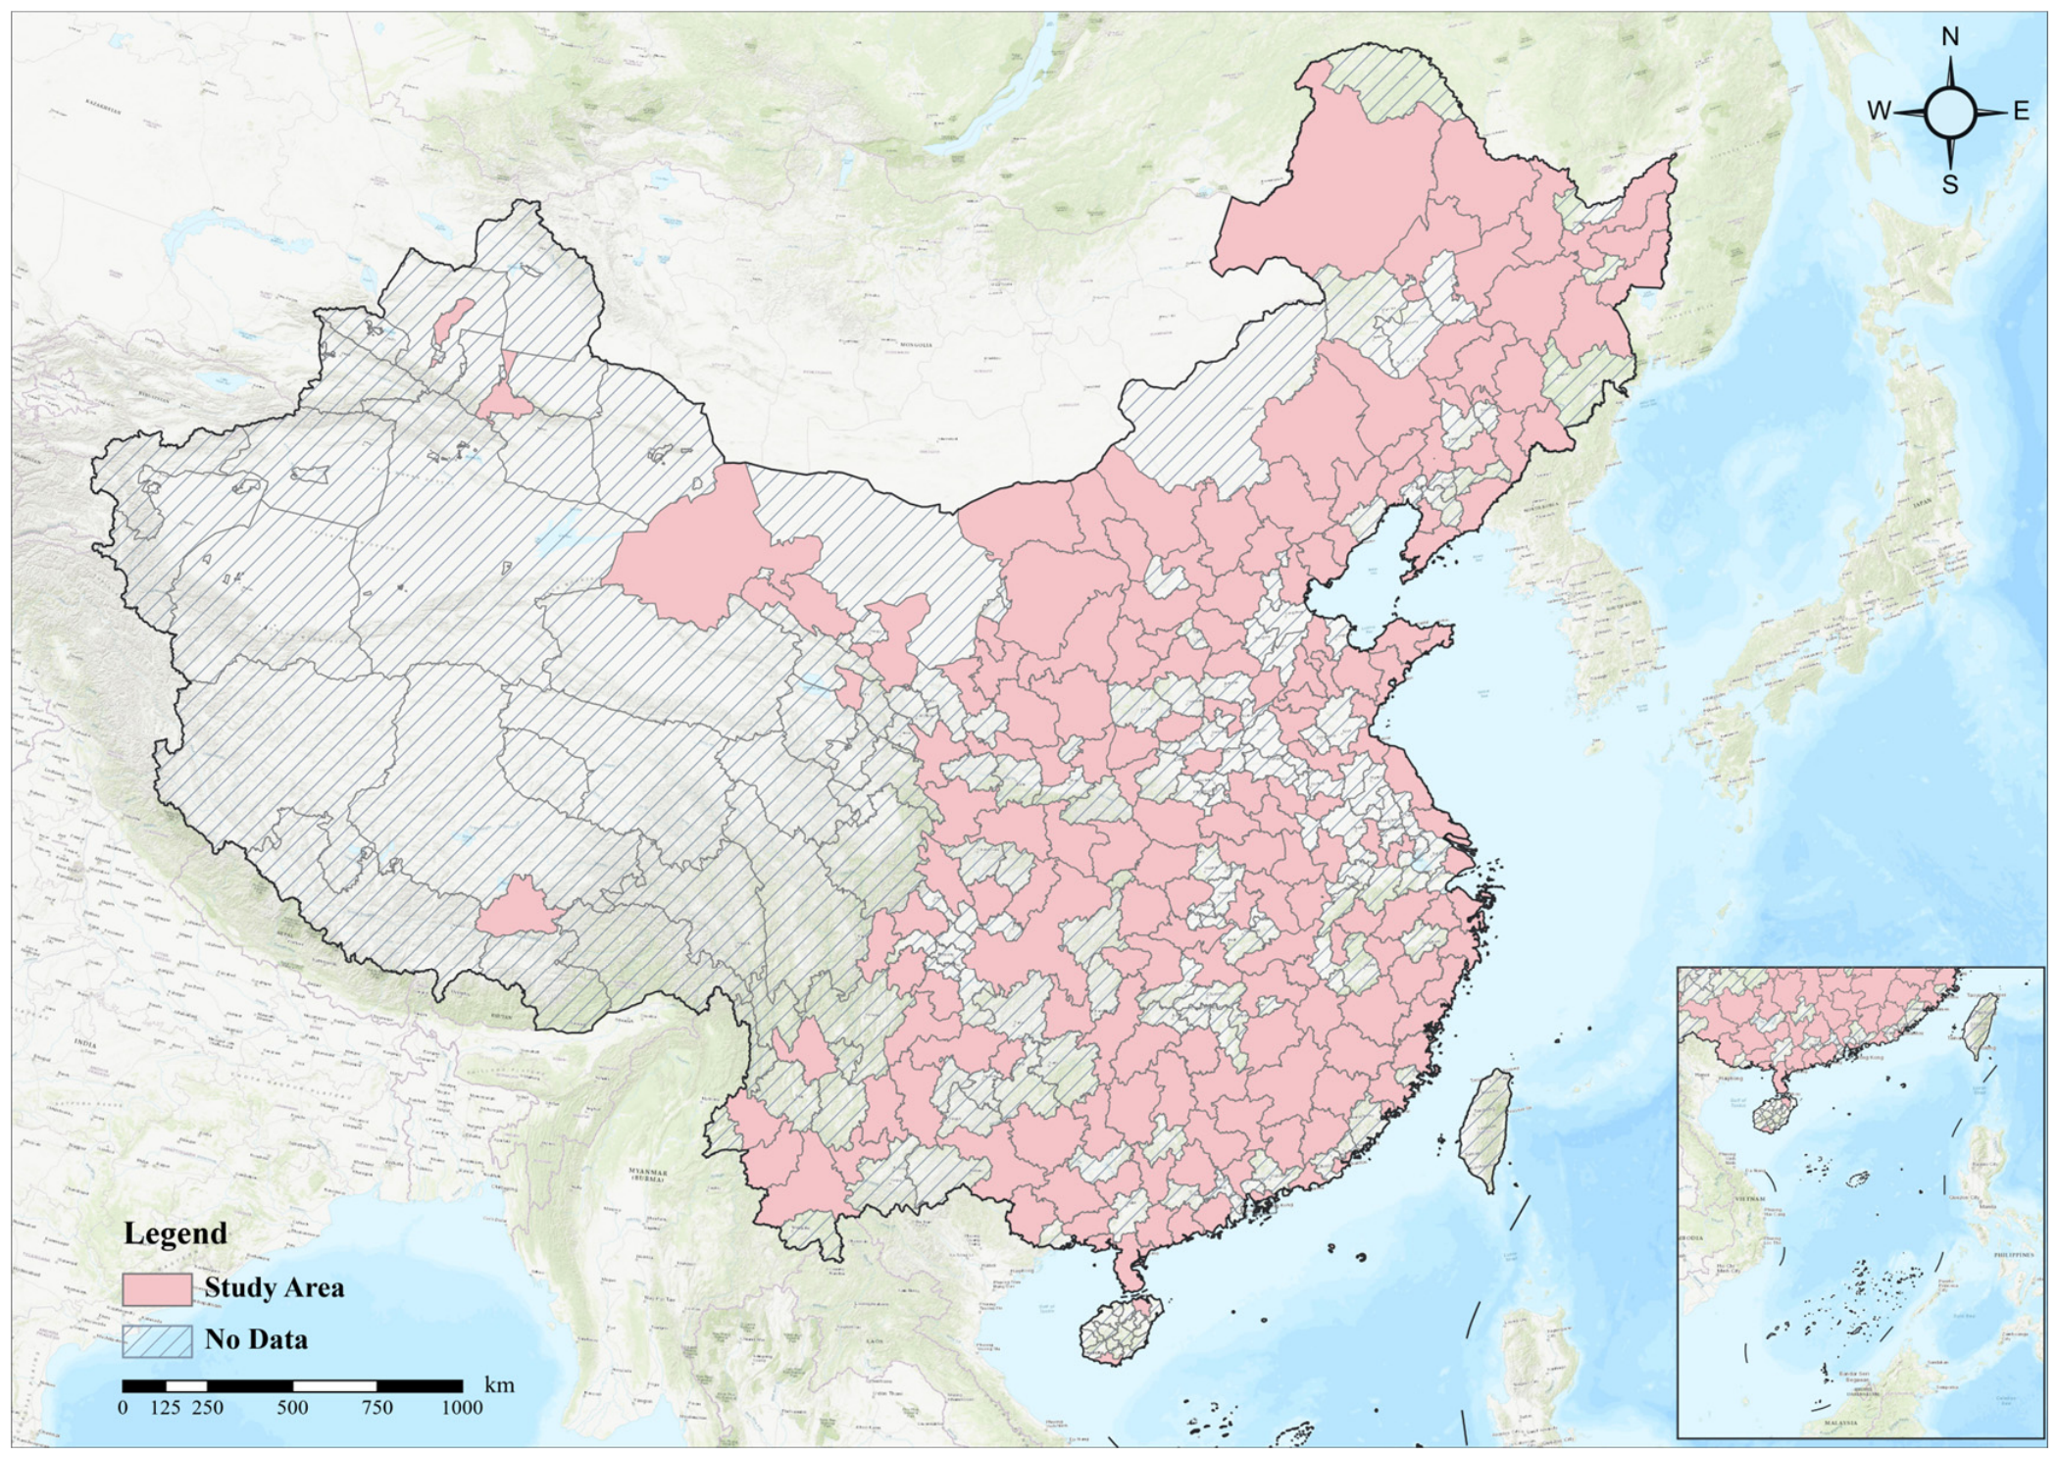
The paper uses panel data of 180 prefecture-level cities in 31 provinces in China (excluding Taiwan, Hong Kong, and Macao because of the severe data constraints) in the years 2006–2023 to examine how climate risk affects local levels of Agricultural Industrial Resilience (AIR). The study area is shown in Figure A1. The year of the beginning, 2006, is selected since it is the year when China fully eliminated the agricultural tax and significantly expanded rural subsidies and minimum livelihood protection schemes, which was a structural policy change in agricultural support. Also, the study period is limited to 2023 due to the availability of data. The sample also excludes newly formed or administratively merged prefecture-level cities between 2006 and 2023 and cities with a large amount of missing data, only including the cities that can be consistently matched with the data of the China City Statistical Yearbook and the China Rural Statistical Yearbook. The basic indicators related to agricultural industrial resilience are primarily drawn from the China Urban Statistical Yearbook, the China Rural Statistical Yearbook, and statistical yearbooks of various prefecture-level cities; data on agricultural insurance premium income are sourced from the China Insurance Yearbook. Extreme climate data are obtained from the National Meteorological Science Data Center, including daily maximum temperature, daily minimum temperature, daily precipitation, and daily maximum wind speed [36]. Based on the latitude and longitude information of meteorological stations, this study employs the inverse distance weighting (IDW) method for spatial interpolation, combined with the administrative boundaries of prefecture-level cities, to derive daily meteorological sequences at the city level. Using these sequences, four types of climate risk indicators—extreme high temperature, extreme low temperature, extreme precipitation, and extreme wind speed—are constructed. Other macroeconomic and institutional variables are primarily sourced from the Guotai’an Database, relevant statistical yearbooks, and publicly available materials from local governments. For individual missing observations, this study prioritizes supplementary data from official websites of relevant government departments, statistical bulletins, and local statistical yearbooks; for the remaining small number of consecutive missing values, linear interpolation is applied. To minimize the impact of sample selection and data imputation on estimation results, such treatments are restricted to individual missing observations, while striving to preserve the continuity and comparability of the original data as much as possible.
4. Empirical Analysis
4.1. Baseline Regression Results
Table 3 presents the baseline estimation results of the impact of climate risk shocks on Agricultural Industrial Resilience. Column (1) includes neither control variables nor city and year fixed effects. Column (2) adds city and year fixed effects without controls. Column (3) introduces the full set of control variables without fixed effects, while Column (4) includes both the controls and two-way fixed effects. The estimated coefficient of CRS remains negative and statistically significant at the 1% level across all four specifications. In Column (4), which provides the most comprehensive specification, the CRS coefficient remains significantly negative, supporting H1.
Table 3.
Baseline Regression Results.
4.2. Robustness Tests
4.2.1. Endogenous Discussion
Although climate risk is primarily driven by natural meteorological processes and exhibits strong exogenous shock characteristics, baseline estimates may still be affected by measurement errors in climate risk assessment, region-specific adaptive behaviors, and other unobservable time-varying factors. To further strengthen causal identification, this paper employs adjusted time trend specifications, and placebo tests as supplementary validation approaches.
First, we use both linear and quadratic time trends in the model to explain unobservable time-varying factors that otherwise can bias estimates. This methodology is based on Chen and Zhang, and it seeks to further deal with the possibility of omitted variable bias [37]. Table 4 in Column I contains both a region and year fixed effect and a linear time trend. Column II contains the linear time trend only and not the quadratic time trend or the year fixed effects. Column III contains linear and quadratic time trends but does not have year fixed effects. The results indicate that, under different time trend specifications, the estimated coefficients of climate risk remain stable in both direction and statistical significance, demonstrating that the baseline conclusions are not driven by specific time effect specifications.
Table 4.
Endogeneity Discussion.
Second, to further rule out the influence of random factors and sample matching on the baseline results, this study conducts a placebo test following Pei et al. [38]. While keeping the sample size, control variables, and two-way fixed-effects specification unchanged, the correspondence of CRS across sample observations is randomly permuted and the model is re-estimated 1000 times to obtain the coefficient distribution under pseudo climate-risk assignments. As shown in Figure 4, the estimated coefficients from the random permutations are concentrated around zero, whereas the actual CRS coefficient from the baseline regression lies clearly outside the main range of the placebo distribution. This suggests that the identified negative effect is unlikely to be driven by random matching or chance factors.
Figure 4.
Placebo Distribution of Estimated CRS Coefficients.
4.2.2. Other Robustness Tests
(1) Excluding municipalities. In light of the demonstration effects and systematically superior agricultural environments of China’s four municipalities, we re-estimate the model after excluding Beijing, Shanghai, Tianjin, and Chongqing. The results confirm that Hypothesis 1 remains valid, with climate risk continuing to exert a significantly negative impact on AIR.
(2) Winsorization. To mitigate the potential impact of extreme values on the model estimation results, this study applies a 1% two-sided winsorization procedure to AIR: observations below the 1st percentile and above the 99th percentile are respectively adjusted to the corresponding percentiles, after which the two-way fixed-effects model is re-estimated. This winsorization procedure replaces only the extreme values without altering the sample size. As reported in Column (2) of Table 5, climate risk still reduces AIR at the 1% significance level, reinforcing the robustness of the baseline findings.
Table 5.
Other robustness tests.
(3) Province–year interactions. To further absorb unobserved heterogeneity varying jointly across provinces and years, we include province-by-year interaction terms. Our main conclusions remain unchanged.
(4) Alternative measure of the dependent variable. In the baseline, AIR is constructed via the entropy-weight method. As a robustness check, we follow Lin and Miao and reconstruct AIR using principal component analysis [39]. The re-estimation (Table 5, Column (4)) yields coefficients that are consistent in sign and significance with the baseline, indicating that our results are not sensitive to the specific AIR metric.
(5) Alternative Measure of AIR. Given that AIR reflects an agricultural industrial system’s ability to recover from external shocks, this study follows Luo et al. and Li et al. to construct a counterfactual agricultural labor productivity index as an alternative measure of AIR [29,40]. Agricultural labor productivity is measured by the price-deflated gross output value of agriculture, forestry, animal husbandry and fishery per agricultural worker. The index compares each city’s actual productivity change with that expected under the national average growth rate.
In Equation (7), denotes the counterfactual measure of i in year t; LPit denotes agricultural labor productivity, measured as the price-deflated gross output value of agriculture, forestry, animal husbandry and fishery divided by employment in agriculture, forestry, animal husbandry and fishery. represents the actual change in agricultural labor productivity from year t − 1 to year t, while represents the expected change in agricultural labor productivity based on the national average growth rate. Specifically, the expected change is calculated using the previous year’s agricultural labor productivity and the national average growth rate of agricultural labor productivity. A higher value of indicates a more favorable deviation of actual agricultural labor productivity from its counterfactual benchmark, reflecting relatively stronger resilience.
4.3. Mechanism Testing
To further examine the proposed mechanisms, this section assesses whether the empirical relationships among climate risk, the three mechanism variables, and AIR provide support for the production-efficiency, circulation-support, and market-linkage channels developed above.
4.3.1. Agricultural Total Factor Productivity (ATFP) as a Mediator
Table 6 reports the mechanism-test results for ATFP. Column (1) shows that CRS is significantly negatively associated with ATFP. Column (2) includes both CRS and ATFP in the AIR equation. The coefficient of ATFP is significantly positive, while the coefficient of CRS remains significantly negative. Taken together, these results provide empirical support for the proposed production-efficiency channel and are consistent with Hypothesis 2. A plausible mechanism is that climate risk reduces the marginal productivity of production factors, inhibits technology diffusion and the efficiency of large-scale agricultural operations, thereby weakening the system’s “endogenous buffer” and reducing the agricultural sector’s capacity to resist and recover from external shocks.
Table 6.
Mechanism Analysis.
4.3.2. Transport Infrastructure (ROAD) as a Mediator
Columns (3) and (4) of Table 6 report the mechanism-test results for transport infrastructure. The coefficient of climate risk in Column (3) is significantly negative, indicating that higher climate risk is associated with less favorable transport-infrastructure conditions. Column (4) shows that transport infrastructure is significantly positively associated with AIR, while the coefficient of climate risk remains significantly negative. Taken together, these results are consistent with the proposed circulation-support channel and provide empirical support for Hypothesis 3. One possible explanation is that extreme weather can disrupt the normal operation of transport networks and reduce their accessibility and reliability, thereby increasing the difficulty of transporting agricultural inputs and products and weakening the connection between production areas and markets. Existing studies show that flooding, heatwaves, and other extreme weather events can adversely affect roads and railway infrastructure and disrupt transport services [41]. Because ROAD captures the structural density and accessibility of the road network rather than event-specific transport disruption, the results indicate the role of transport conditions in the proposed circulation channel.
4.3.3. Agricultural Trade Linkages (ATD) as a Mediator
The theoretical analysis suggests that climate risk may affect AIR by altering agricultural market linkages and the capacity for cross-regional market adjustment. Climate shocks can disrupt local production and delivery conditions, generate uncertainty in agricultural transactions, and induce adjustments in cross-regional and cross-border trade flows. As shown in Columns (5) and (6) of Table 6, CRS is significantly negatively associated with ATD, while ATD is significantly positively associated with AIR after controlling for CRS. These results are consistent with the proposed market-linkage channel and provide empirical support for Hypothesis 4.
Further supporting these mechanism results, the bootstrap estimates reported in Table A2 indicate negative indirect effects through ATFP, ROAD, and ATD, with all 95% confidence intervals excluding zero.
4.4. Heterogeneity Analysis
Given the differences in agricultural production functional positioning, policy support foundations, and risk response capabilities across various regions, this paper further examines the heterogeneity between major grain-producing regions and non-grain-producing regions. Based on the national classification of major grain-producing regions, the provinces where the samples are located are divided into 13 major grain-producing regions and 18 non-grain-producing regions, and regression analyses are then conducted for each group. As shown in Table 7, climate risk has a significantly negative effect on AIR in both groups. The estimated coefficient is larger in absolute value for non-major grain-producing regions. Consistent with the subgroup estimates, the interaction term in the fully interacted fixed-effects model is negative and significant (see Table A3), indicating that the adverse effect of climate risk on AIR is more pronounced in non-major grain-producing regions. One possible reason is that, Compared with non-major grain-producing regions, agriculture plays a relatively more important role in major grain-producing regions, where the policy system is correspondingly more agriculture-oriented. Policy instruments such as central and local fiscal subsidies, agricultural disaster insurance, and grain procurement and reserve systems are generally more developed in these regions and can help buffer the short-term impacts of climate risk. By contrast, agricultural policy support is relatively weaker in non-major grain-producing regions, making climate shocks more likely to be transmitted directly to the agricultural economic system.
Table 7.
Heterogeneity Analysis.
5. Further Analysis: Testing the Moderated Mediation Model
5.1. Test of the Moderating Effect of Digital Infrastructure
This study further examines the moderating role of digital infrastructure in the relationship between climate risk and Agricultural Industrial Resilience (AIR), as well as in the underlying transmission mechanisms. Before constructing the interaction terms, RDI is mean-centered, and low and high levels of digital infrastructure are defined as one standard deviation below and above the sample mean, respectively. The sample mean and standard deviation of RDI are 13.3030 and 1.2110, corresponding to values of 12.0920 and 14.5140 on the original logarithmic scale. After mean-centering, the coefficient of CRS represents the conditional effect of climate risk when digital infrastructure is at its average level, while the coefficient of CRS × RDI captures how this effect changes with the level of digital infrastructure. The results reported in Table 8 show that the interaction term between climate risk and digital infrastructure is significantly positive in the AIR, ATFP, ROAD, and ATD equations. To facilitate interpretation of these interactions, we further estimate the conditional marginal effects of CRS on AIR at low (−1 SD) and high (+1 SD) levels of RDI. As reported in Table A4, the marginal effects remain significantly negative at both RDI levels in all three specifications, with the 95% confidence intervals excluding zero. However, their absolute magnitudes consistently decline as RDI increases. These results suggest that higher levels of digital infrastructure significantly weaken the negative effect of climate risk on AIR, indicating a clear buffering role of digital infrastructure.
Table 8.
Moderated Mediation Test of Digital Infrastructure.
In terms of the underlying mechanisms, digital infrastructure can mitigate the disruptive effects of climate shocks on agricultural production, transportation, and market circulation by improving information access, resource allocation, and cross-regional coordination. On the one hand, digital information platforms and meteorological early-warning systems can enhance the efficiency of risk identification and information transmission, enabling agricultural operators to obtain disaster-related information at an earlier stage and to adjust production arrangements, input structures, and operational decisions accordingly. This helps reduce the adverse effects of climate shocks on agricultural production efficiency. On the other hand, improved digital connectivity can facilitate access to financial services and risk-sharing instruments, thereby strengthening the ability of agricultural operators to respond to and recover from climate shocks. At the same time, digital platforms can expand channels for agricultural product sales, input procurement, and cross-regional matching of supply and demand, providing alternative forms of connection when conventional transportation and market networks are disrupted and thereby reducing disturbances to the operation of the agricultural value chain.
Overall, the results provide further evidence of the buffering role of digital infrastructure, with weaker adverse relationships observed along the production-efficiency, transport infrastructure, and agricultural trade linkage channels at higher levels of RDI. The conditional indirect effects are examined further in Table 9.
Table 9.
Bootstrap Test of Moderated Mediation Effects.
5.2. Bootstrap Test of the Moderated Mediation
To assess the robustness of the moderated mediation effects, this study follows the path-analytic approach of Edwards and Lambert and applies a bootstrap procedure to the three indirect paths: climate risk → ATFP → AIR, climate risk → ROAD → AIR, and climate risk → ATD → AIR [42]. Using 5000 bootstrap replications, 95% confidence intervals are constructed for the conditional indirect effects at low (−1 SD) and high (+1 SD) levels of digital infrastructure (RDI). RDI is mean-centered before constructing the interaction terms, and low and high levels of RDI are defined as one standard deviation below and above the mean, respectively. As reported in Table 9, the 95% confidence intervals for all three indirect effects exclude zero at both low and high levels of RDI, indicating that the estimated conditional indirect effects remain statistically significant across different levels of digital infrastructure.
The results further show that the negative indirect effects of climate risk on AIR through ATFP, ROAD, and ATD all decrease in absolute magnitude as the level of digital infrastructure increases. Moreover, the bootstrap confidence intervals for the differences between the high- and low-RDI conditional indirect effects do not include zero, indicating that these differences are statistically significant (see Figure 5 and Figure 6). Taken together, these results indicate that the negative conditional indirect effects associated with the production-efficiency, transport-infrastructure, and agricultural-trade-linkage channels are weaker at higher levels of digital infrastructure, providing further support for its buffering role.
Figure 5.
Simple Slopes of Stage I (CRS → Mediators).
Figure 6.
DI-Moderated Indirect Effects (High vs. Low DI). Note: Dots denote point estimates; horizontal lines indicate 95% bootstrap confidence intervals; the vertical dashed line marks zero.
6. Discussion
This study makes contributions on three fronts. First, existing studies have focused predominantly on the agricultural production stage with relatively limited attention to circulation and trade [5,6,7,8,9,16]. Agricultural Industrial Resilience extends beyond production stability to encompass the capacity of agricultural industrial systems to maintain core functions, adjust, and recover from external shocks. From an agricultural value-chain perspective, this study therefore examines three theoretically proposed channels—production efficiency, circulation support, and market linkages—using agricultural total factor productivity, transport infrastructure, and agricultural trade linkages, respectively. The empirical results show that climate risk is negatively associated with AIR, while the relationships among CRS, ATFP, ROAD, ATD, and AIR provide evidence consistent with these proposed channels. By extending the analysis from the production stage to the broader agricultural value chain, this study provides a more comprehensive understanding of the relationships between climate risk and agricultural industrial resilience.
Second, the heterogeneity analysis indicates that the adverse effect of climate risk on AIR is stronger in non-grain-producing regions. This is consistent with the previous evidence that weaker regions, with more limited resources and weaker policy backing, are less capable of responding to climate shocks [43,44]. This study also finds substantial regional heterogeneity in the effect of climate risk on Agricultural Industrial Resilience. Compared with major grain-producing regions, non-major grain-producing regions experience a more pronounced negative effect. This suggests that existing agricultural production foundations, public investment, and risk-response conditions shape the capacity of agricultural industries to withstand climate shocks. Major grain-producing regions generally benefit from more stable agricultural policy support and better infrastructure conditions, whereas non-major grain-producing regions may face greater constraints in agricultural investment, risk protection, and adaptive capacity. Therefore, the effect of climate risk on Agricultural Industrial Resilience is not homogeneous across regions but is jointly shaped by regional agricultural foundations and resource-allocation conditions.
Third, this study further finds that the indirect effects of climate risk on AIR through ATFP, ROAD, and ATD are moderated by digital infrastructure. A review of the existing literature suggests that relatively few studies have examined, from the perspective of different stages of the agricultural industrial chain, how digital infrastructure alters the strength of the transmission of climate risk to AIR. By incorporating digital infrastructure into the three transmission pathways, this study finds that it can, to some extent, mitigate the negative indirect effects of climate risk on AIR. These findings therefore extend and complement the existing literature.
Finally, in terms of policy implications, this study argues that promoting climate-adaptive agricultural development requires the establishment of a coordinated climate adaptation system covering the entire agricultural chain, including production, storage, transportation, and trade. Existing policies have focused primarily on the production stage, but improvements confined to production alone are unlikely to sufficiently enhance the overall resilience of agricultural industries [45]. It is therefore necessary to strengthen coordination across production, circulation, and market allocation in order to improve the overall capacity of agricultural industries to cope with climate shocks. For major grain-producing regions, continued efforts should be made to improve infrastructure such as farmland water conservancy facilities and to strengthen agricultural science and technology as well as the development of stress-resistant crop varieties. For non-major grain-producing regions, greater attention should be given to addressing infrastructure deficiencies, improving risk-protection capacity, and strengthening digital infrastructure, thereby enhancing their capacity to respond to climate risks.
This study has limitations. The empirical study is limited to China; despite the significant advancement of China in climate-adaptive agriculture, a cross-country comparison would be useful to evaluate the external validity of our findings [46]. Moreover, the data are based mostly on local statistical yearbooks and national meteorological records. Future research may combine multi-source data, e.g., satellite remote sensing and more frequent administrative or transaction data, to enhance the accuracy of measurement and further clarify the mechanisms found here. In addition, the mechanism variables and AIR are observed at the same annual frequency, which limits the ability to establish the precise temporal ordering of the proposed channels and to fully rule out unobserved confounding in the CRS-mediator and mediator-AIR relationships or potential reverse causality. Future research using higher-frequency or temporally ordered data, together with more direct measures of transport disruption and disaggregated trade flows, could provide stronger evidence on the dynamic operation of these mechanisms.
7. Policy Implications
To begin with, a coordinated climate adaptation system covering the entire agricultural value chain should be established to enhance AIR. Climate risk affects not only agricultural production but also storage, transportation, circulation, and trade. Therefore, policy interventions should move beyond the production stage and strengthen coordination across production, circulation, and market linkages. On the production side, greater attention should be paid to improving agricultural production efficiency, strengthening farmland water-conservancy facilities, and promoting the development and adoption of climate-resilient agricultural technologies and crop varieties. During the storage and transportation stages, transport infrastructure, warehousing, and cold-chain facilities should be improved to reduce post-harvest losses and maintain the continuity of cross-regional circulation under extreme weather conditions. At the trade stage, closer alignment with China’s dual-circulation strategy, which promotes coordinated domestic and international market integration, can help diversify procurement and sales channels, stabilize market operations, and enhance the agricultural system’s capacity to absorb external shocks.
Second, regional differentiation should be incorporated into climate adaptation policies because the effects of climate risk on AIR vary across regions. For major grain-producing regions, priority should be given to improving modern water-conservancy systems, strengthening agricultural disaster-prevention capacity, and promoting the development of drought- and climate-resilient crop varieties to support stable agricultural production. International experience in water-resource management and the development of stress-resistant varieties, including practices in major agricultural economies such as the United States and Brazil, may provide useful references for further improving climate adaptation in these regions. For non-major grain-producing regions, greater attention should be paid to addressing infrastructure deficiencies, strengthening agricultural risk-protection mechanisms, and improving digital infrastructure and resource-allocation capacity so as to enhance their ability to cope with climate shocks.
Third, given the long-term and cumulative nature of climate shocks, digital infrastructure should be incorporated into agricultural climate-risk management as a long-term and system-wide adaptation strategy. To improve responses to increasingly frequent extreme events, production methods, crop structures, and technological applications should be adjusted to enhance coordination across production, logistics, and marketing and strengthen real-time response capacity. Governments at all levels must increase investment in rural digital infrastructure as a key component of agricultural resilience-building: expand broadband and mobile coverage in rural regions; deploy agricultural IoT sensor networks; develop agricultural big-data platforms and meteorological early-warning systems; and monitor weather, pests, and other risks in real time to provide timely and actionable advice. By improving information access, coordination, and market connectivity across the agricultural value chain, digital infrastructure can strengthen the capacity of agricultural systems to respond and adapt to climate shocks, making it an important component of future climate-resilience policies.
Author Contributions
Conceptualization, L.L., Y.Z., X.Z. and Q.B.; Methodology, L.L., Y.Z., X.Z. and Q.B.; Software, L.L., Y.Z., X.Z. and Q.B.; Validation, L.L., Y.Z., X.Z. and Q.B.; Formal analysis, L.L., Y.Z., X.Z. and Q.B.; Investigation, L.L., Y.Z., X.Z. and Q.B.; Resources, L.L., Y.Z., X.Z. and Q.B.; Data curation, L.L., Y.Z., X.Z. and Q.B.; Writing—original draft, L.L., Y.Z., X.Z. and Q.B.; Writing—review and editing, L.L., Y.Z., X.Z. and Q.B.; Visualization, L.L., Y.Z., X.Z. and Q.B.; Supervision, L.L., Y.Z., X.Z. and Q.B.; Project administration, L.L., Y.Z., X.Z. and Q.B. All authors have read and agreed to the published version of the manuscript.
Funding
This research received no external funding.
Institutional Review Board Statement
Not applicable.
Informed Consent Statement
Not applicable.
Data Availability Statement
The data used in this study were compiled from official statistical yearbooks, the National Meteorological Science Data Center, CSMAR, and other cited sources. Access to some data is subject to the terms and conditions of the original data providers.
Conflicts of Interest
The authors declare no conflicts of interest.
Appendix A
Appendix A.1. The Study Area
Figure A1.
Study area.
Appendix A.2. Construction of the Agricultural Industrial Resilience Index
The Agricultural Industrial Resilience (AIR) index is constructed using the entropy-weighting method. The six indicators reported in Table 1 are processed over the pooled city-year sample for 2006–2023 to maintain a common measurement scale across cities and years.
(1) Normalization
For positive indicators,
and for negative indicators,
where xijt is the original value of indicator j for city i in year t, and and are calculated from the full 2006–2023 sample.
(2) Entropy weights
Here, N and T denote the numbers of cities and years, respectively. When pijt = 0, pijt lnpijt is defined as zero. The resulting weights are held constant across cities and years.
(3) AIR aggregation
A higher AIRit indicates stronger agricultural industrial resilience.
Appendix A.3. Construction of Climate Risk Indicators
Table A1.
Definitions and threshold criteria for climate-risk components.
Notes:
- The historical reference period is 1974–2003, covering 30 years of daily meteorological observations. City-specific percentile thresholds are calculated separately for each city using the pooled daily observations over the entire reference period. Specifically, HTD is identified using the 90th percentile of daily maximum temperature, LTD using the 10th percentile of daily minimum temperature, ERD using the 95th percentile of positive daily precipitation, and EED using the 95th percentile of daily maximum wind speed. Zero-precipitation observations are excluded when calculating the precipitation threshold.
- Once determined, the city-specific thresholds are held fixed throughout the 2006–2023 study period. For each city-year, exposure to the four types of extreme climate events is first measured according to the corresponding threshold criteria and then transformed into the respective climate-risk component indices (HTD, LTD, ERD, and EED).
- Daily meteorological observations are obtained from the National Meteorological Science Data Center. Station-level observations are spatially interpolated using inverse distance weighting (IDW), and city-level daily meteorological series are derived by spatially averaging the corresponding grid cells within prefecture-level administrative boundaries.
- After the annual frequencies of the four types of extreme climate events are obtained, each component is standardized relative to the fixed 1974–2003 historical benchmark:
- 5.
- The four baseline-standardized climate-risk components are assigned equal weights of 0.25 and aggregated as follows:
CRSit = 0.25HTDit + 0.25LTDit + 0.25ERDit + 0.25EEDit
Appendix A.4. Bootstrap Tests of Mediation Effects
Table A2.
Bootstrap estimates of indirect effects.
Notes:
- The indirect effects are estimated using 5000 bootstrap replications.
- The 95% confidence intervals for all three mediation pathways do not include zero, indicating statistically significant indirect effects.
- CRS denotes climate risk shocks; ATFP denotes agricultural total factor productivity; ROAD denotes transport infrastructure; ATD denotes agricultural trade linkages; and AIR denotes agricultural industrial resilience.
Appendix A.5. Formal Test of Cross-Group Differences
Table A3.
Formal Test of the Difference in the CRS Coefficient between Major and Non-Major Grain-Producing Areas.
Notes:
The cross-group difference is estimated using a fully interacted fixed-effects model based on the full sample (N = 3240). Major grain-producing areas are coded as 0 and non-major grain-producing areas as 1. The reported difference corresponds to the coefficient on the interaction between CRS and the group indicator and is defined as the CRS coefficient for non-major grain-producing areas minus that for major grain-producing areas. The model includes city fixed effects and allows the coefficients of the control variables and year effects to vary across the two groups.
Appendix A.6. Conditional Marginal Effects of Climate Risk at Different Levels of Digital Infrastructure
Table A4.
Conditional Marginal Effects of Climate Risk on AIR at Low and High Levels of Digital Infrastructure.
Notes:
RDI is mean-centered before constructing the interaction terms. Low and high RDI are defined as one standard deviation below and above the sample mean, respectively. Given a sample mean of 13.3030 and a standard deviation of 1.2110, these levels correspond to uncentered RDI values of 12.0920 and 14.5140. The reported conditional marginal effects and 95% confidence intervals are based on Model 3 of the corresponding mediator specifications in Table 8.
References
- Guo, H.; Xia, Y.; Jin, J.; Pan, C. The impact of climate change on the efficiency of agricultural production in the world’s main agricultural regions. Environ. Impact Assess. Rev. 2022, 97, 106891. [Google Scholar] [CrossRef] [Scilit]
- The World Bank. AADAPT: Agricultural Adaptations and Natural Resource Management. 2024. Available online: https://web.archive.org/web/20240218065858/https://www.worldbank.org/en/research/dime/brief/agriculture (accessed on 4 March 2024).
- Wang, X.; Zhao, C.; Müller, C.; Wang, C.; Ciais, P.; Janssens, I.; Peñuelas, J.; Asseng, S.; Li, T.; Elliott, J.; et al. Emergent constraint on crop yield response to warmer temperature from field experiments. Nat. Sustain. 2020, 3, 908–916. [Google Scholar] [CrossRef] [Scilit]
- Li, Q.; Chen, H.; Long, R.; Sun, Q.; Huang, Z. The impact of climate change on China’s food security considering artificial intelligence level: Based on XGBoost and RIME-CNN-LSTM-ATT models. Resour. Conserv. Recycl. 2026, 224, 108539. [Google Scholar] [CrossRef] [Scilit]
- Dell, M.; Jones, B.F.; Olken, B.A. Temperature Shocks and Economic Growth: Evidence from the Last Half Century. Am. Econ. J. Macroecon. 2012, 4, 66–95. [Google Scholar] [CrossRef] [Scilit]
- Parolini, G. Weather, climate, and agriculture: Historical contributions and perspectives from agricultural meteorology. Wiley Interdiscip. Rev. Clim. Change 2022, 13, e766. [Google Scholar] [CrossRef] [Scilit]
- Schmitt, J.; Offermann, F.; Söder, M.; Frühauf, C.; Finger, R. Extreme weather events cause significant crop yield losses at the farm level in German agriculture. Food Policy 2022, 112, 102359. [Google Scholar] [CrossRef] [Scilit]
- Yang, Y.; Tilman, D.; Jin, Z.; Smith, P.; Barrett, C.B.; Zhu, Y.-G.; Burney, J.; D’odorico, P.; Fantke, P.; Fargione, J.; et al. Climate change exacerbates the environmental impacts of agriculture. Science 2024, 385, eadn3747. [Google Scholar] [CrossRef] [Scilit] [PubMed]
- Potopova, V.; Polakova, J.; Kristkova, Z.S.; Weststrate, J.; van Zeist, W.-J.; Oosterwijk, A.; KolářOvá, M.; Viera, M.D.; Zahradníček, P.; Štěpánek, P.; et al. From local to global and from global to local: Designing the protocol to model agriculture and climate resilience. Environ. Sustain. Indic. 2025, 27, 100855. [Google Scholar] [CrossRef] [Scilit]
- Argyroudis, S.A.; Mitoulis, S.A.; Chatzi, E.; Baker, J.W.; Brilakis, I.; Gkoumas, K.; Vousdoukas, M.; Hynes, W.; Carluccio, S.; Keou, O.; et al. Digital technologies can enhance climate resilience of critical infrastructure. Clim. Risk Manag. 2022, 35, 100387. [Google Scholar] [CrossRef] [Scilit]
- Jin, H.; Chen, D.; Xu, S. Climate change and rural income inequality: Evidence from China. Energy Econ. 2025, 149, 108722. [Google Scholar] [CrossRef] [Scilit]
- Malik, A.; Li, M.; Lenzen, M.; Fry, J.; Liyanapathirana, N.; Beyer, K.; Boylan, S.; Lee, A.; Raubenheimer, D.; Geschke, A.; et al. Impacts of climate change and extreme weather on food supply chains cascade across sectors and regions in Australia. Nat. Food 2022, 3, 631–643. [Google Scholar] [CrossRef] [Scilit] [PubMed]
- Gu, X.; Zhu, J. Climate physical risks and technological innovation in the grain industry chain: An empirical analysis based on machine learning of patent texts in China. Agric. Syst. 2026, 231, 104507. [Google Scholar] [CrossRef] [Scilit]
- Andrianarimanana, M.H.; Yongjian, P.; Tanteliniaina, M.F.R. Assessment of the importance of climate, land, and soil on the global supply for agricultural products and global food security: Evidence from Madagascar. Food Policy 2023, 115, 102403. [Google Scholar] [CrossRef] [Scilit]
- Asghar, A.J.; Cheema, A.M.; Hameed, M.I.; Abbas, S.Q.; Fatima, U. The Critical Junction between CPEC, Agriculture and Climate Change; Center for Chinese Legal Studies: Lahore, Pakistan, 2021. [Google Scholar]
- Chen, S.; Yang, X.Y. Building a Food Security Guarantee System Adapted to Climate Change. J. Nanjing Agric. Univ. (Soc. Sci. Ed.) 2025, 25, 81–90. [Google Scholar]
- Cui, Q. China’s Rural Communities Are Adapting to Climate Change. Dialogue Earth/PreventionWeb. 2025. Available online: https://www.preventionweb.net/news/chinas-rural-communities-are-adapting-climate-change (accessed on 8 October 2026).
- Bo-Wen, W.; Yi, H.E.; Fei, T. Attribution and assessment of direct and indirect economic losses from extreme weather events in China. Adv. Clim. Change Res. 2025, 21, 502. [Google Scholar]
- Deichmann, U.; Goyal, A.; Mishra, D. Will digital technologies transform agriculture in developing countries? Agric. Econ. 2016, 47, 21–33. [Google Scholar] [CrossRef] [Scilit]
- Getahun, S.; Kefale, H.; Gelaye, Y. Application of precision agriculture technologies for sustainable crop production and environmental sustainability: A systematic review. Sci. World J. 2024, 2024, 2126734. [Google Scholar] [CrossRef] [Scilit] [PubMed]
- Cheng, W.; Li, Y.; Zuo, W.; Du, G.; Stanny, M. Spatio-temporal detection of agricultural disaster vulnerability in the world and implications for developing climate-resilient agriculture. Sci. Total Environ. 2024, 928, 172412. [Google Scholar] [CrossRef] [Scilit] [PubMed]
- Li, Y. A systematic review of rural resilience. China Agric. Econ. Rev. 2023, 15, 66–77. [Google Scholar] [CrossRef] [Scilit]
- Verma, K.K.; Song, X.P.; Kumari, A.; Jagadesh, M.; Singh, S.K.; Bhatt, R.; Singh, M.; Seth, C.S.; Li, Y. Climate change adaptation: Challenges for agricultural sustainability. Plant Cell Environ. 2025, 48, 2522–2533. [Google Scholar] [CrossRef] [Scilit] [PubMed]
- Heydari, M. Cultivating sustainable global food supply chains: A multifaceted approach to mitigating food loss and waste for climate resilience. J. Clean. Prod. 2024, 442, 141037. [Google Scholar] [CrossRef] [Scilit]
- Acar, S.; Kizilkaya, S. Agricultural TFP Under a Changing Climate: Evidence from High, Middle, and Low-Income Countries. In Climate and Development; World Scientific Publishing: Singapore, 2022; pp. 177–218. [Google Scholar]
- Choi, T.M.; Lam, H.K.S.; Sarkis, J.; Zhan, Y.; Zhu, Q. Extreme weather and production economics: Insights, challenges, and future directions. Int. J. Prod. Econ. 2025, 281, 109504. [Google Scholar] [CrossRef] [Scilit]
- Belhadi, A.; Kamble, S.; Subramanian, N.; Singh, R.K.; Venkatesh, M. Digital capabilities to manage agri-food supply chain uncertainties and build supply chain resilience during compounding geopolitical disruptions. Int. J. Oper. Prod. Manag. 2024, 44, 1914–1950. [Google Scholar] [CrossRef] [Scilit]
- Jouanjean, M.A. Digital Opportunities for Trade in the Agriculture and Food Sectors; OECD Food, Agriculture and Fisheries Papers, No. 122; OECD Publishing: Paris, France, 2019. [Google Scholar]
- Li, Y.; Gao, G.; Wen, J.; Zhao, N.; Du, G.; Stanny, M. The measurement of agricultural disaster vulnerability in China and implications for land-supported agricultural resilience building. Land Use Policy 2025, 148, 107400. [Google Scholar] [CrossRef] [Scilit]
- Guo, K.; Ji, Q.; Zhang, D. A dataset to measure global climate physical risk. Data Brief. 2024, 54, 110502. [Google Scholar] [CrossRef] [Scilit] [PubMed]
- Liang, X.Z.; Wu, Y.; Chambers, R.G.; Schmoldt, D.L.; Gao, W.; Liu, C.; Liu, Y.-A.; Sun, C.; Kennedy, J.A. Determining climate effects on US total agricultural productivity. Proc. Natl. Acad. Sci. USA 2017, 114, E2285–E2292. [Google Scholar] [CrossRef] [Scilit] [PubMed]
- Ortiz-bobea, A.; Knippenberg, E.; Chambers, R.G. Growing climatic sensitivity of U.S. agriculture linked to technological change and regional specialization. Sci. Adv. 2018, 4, eaat4343. [Google Scholar] [CrossRef] [Scilit] [PubMed]
- Gao, H.; Tong, G. Can Rural Road Network Density Promote Inclusive Regional Growth? Evidence from China’s County-Level Panel Data. Sustainability 2026, 18, 6811. [Google Scholar] [CrossRef] [Scilit]
- Zhang, D.; Sun, Z. The impact of agricultural global value chain participation on agricultural total factor productivity. Agriculture 2023, 13, 2151. [Google Scholar] [CrossRef] [Scilit]
- Aldashev, A.; Batkeyev, B. Broadband infrastructure and economic growth in rural areas. Inf. Econ. Policy 2021, 57, 100936. [Google Scholar] [CrossRef] [Scilit]
- Ly, Y.B.; Guo, Y.C.; Gu, H.Y. Extreme climate shocks, infrastructure adaptability, and local fiscal risk. Financ. Trade Res. 2025, 36, 11–26. [Google Scholar]
- Chen, S.; Zhang, B. Estimating and improving dynamic treatment regimes with a time-varying instrumental variable. J. R. Stat. Soc. Ser. B Stat. Methodol. 2023, 85, 427–453. [Google Scholar] [CrossRef] [Scilit]
- Pei, X.; Wang, J.; Qi, T.; Shi, R.; Liu, W.; Zhao, M. How does climate risk affect the grain production resilience: An analysis of mechanism pathways and mitigation strategies. Clim. Change 2026, 179, 160. [Google Scholar] [CrossRef] [Scilit]
- Lin, S.; Miao, S. The Enhancing Effect and Role Path of Digital Finance on the Resilience of Agricultural Industry Chain. Finance Res. Lett. 2025, 83, 107697. [Google Scholar] [CrossRef] [Scilit]
- Luo, Y.; Liu, S.; Zhang, Y.; Zeng, M.; Zhao, D. Digital pathways to resilience: Assessing the impact of digitalization on agricultural production resilience in China. China Econ. Rev. 2025, 90, 102375. [Google Scholar] [CrossRef] [Scilit]
- Palin, E.J.; Stipanovic Oslakovic, I.; Gavin, K.; Quinn, A. Implications of climate change for railway infrastructure. Wiley Interdiscip. Rev. Clim. Change 2021, 12, e728. [Google Scholar] [CrossRef] [Scilit]
- Edwards, J.R.; Lambert, L.S. Methods for integrating moderation and mediation: A general analytical framework using moderated path analysis. Psychol. Methods 2007, 12, 1. [Google Scholar] [CrossRef] [Scilit] [PubMed]
- Masud, M.M.; Azam, M.N.; Mohiuddin, M.; Banna, H.; Akhtar, R.; Alam, A.F.; Begum, H. Adaptation barriers and strategies towards climate change: Challenges in the agricultural sector. J. Clean. Prod. 2017, 156, 698–706. [Google Scholar] [CrossRef] [Scilit]
- Khatri, P.; Kumar, P.; Shakya, K.S.; Kirlas, M.C.; Tiwari, K.K. Understanding the intertwined nature of rising multiple risks in modern agriculture and food system. Environ. Dev. Sustain. 2024, 26, 24107–24150. [Google Scholar] [CrossRef] [Scilit]
- Pulwarty, R.S.; Sivakumar, M.V.K. Information systems in a changing climate: Early warnings and drought risk management. Weather Clim. Extrem. 2014, 3, 14–21. [Google Scholar] [CrossRef] [Scilit]
- Zhang, J.; Fan, H.; Chen, M.; Zhang, P.; Imran, M. Climate risk shocks and corporate outsourcing. Clim. Policy 2025, 1–13. [Google Scholar] [CrossRef] [Scilit]
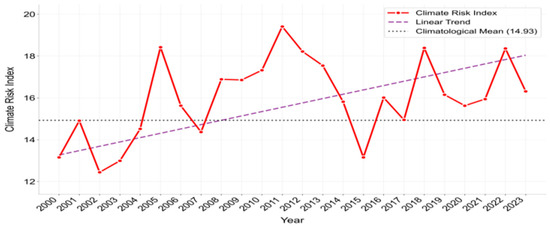
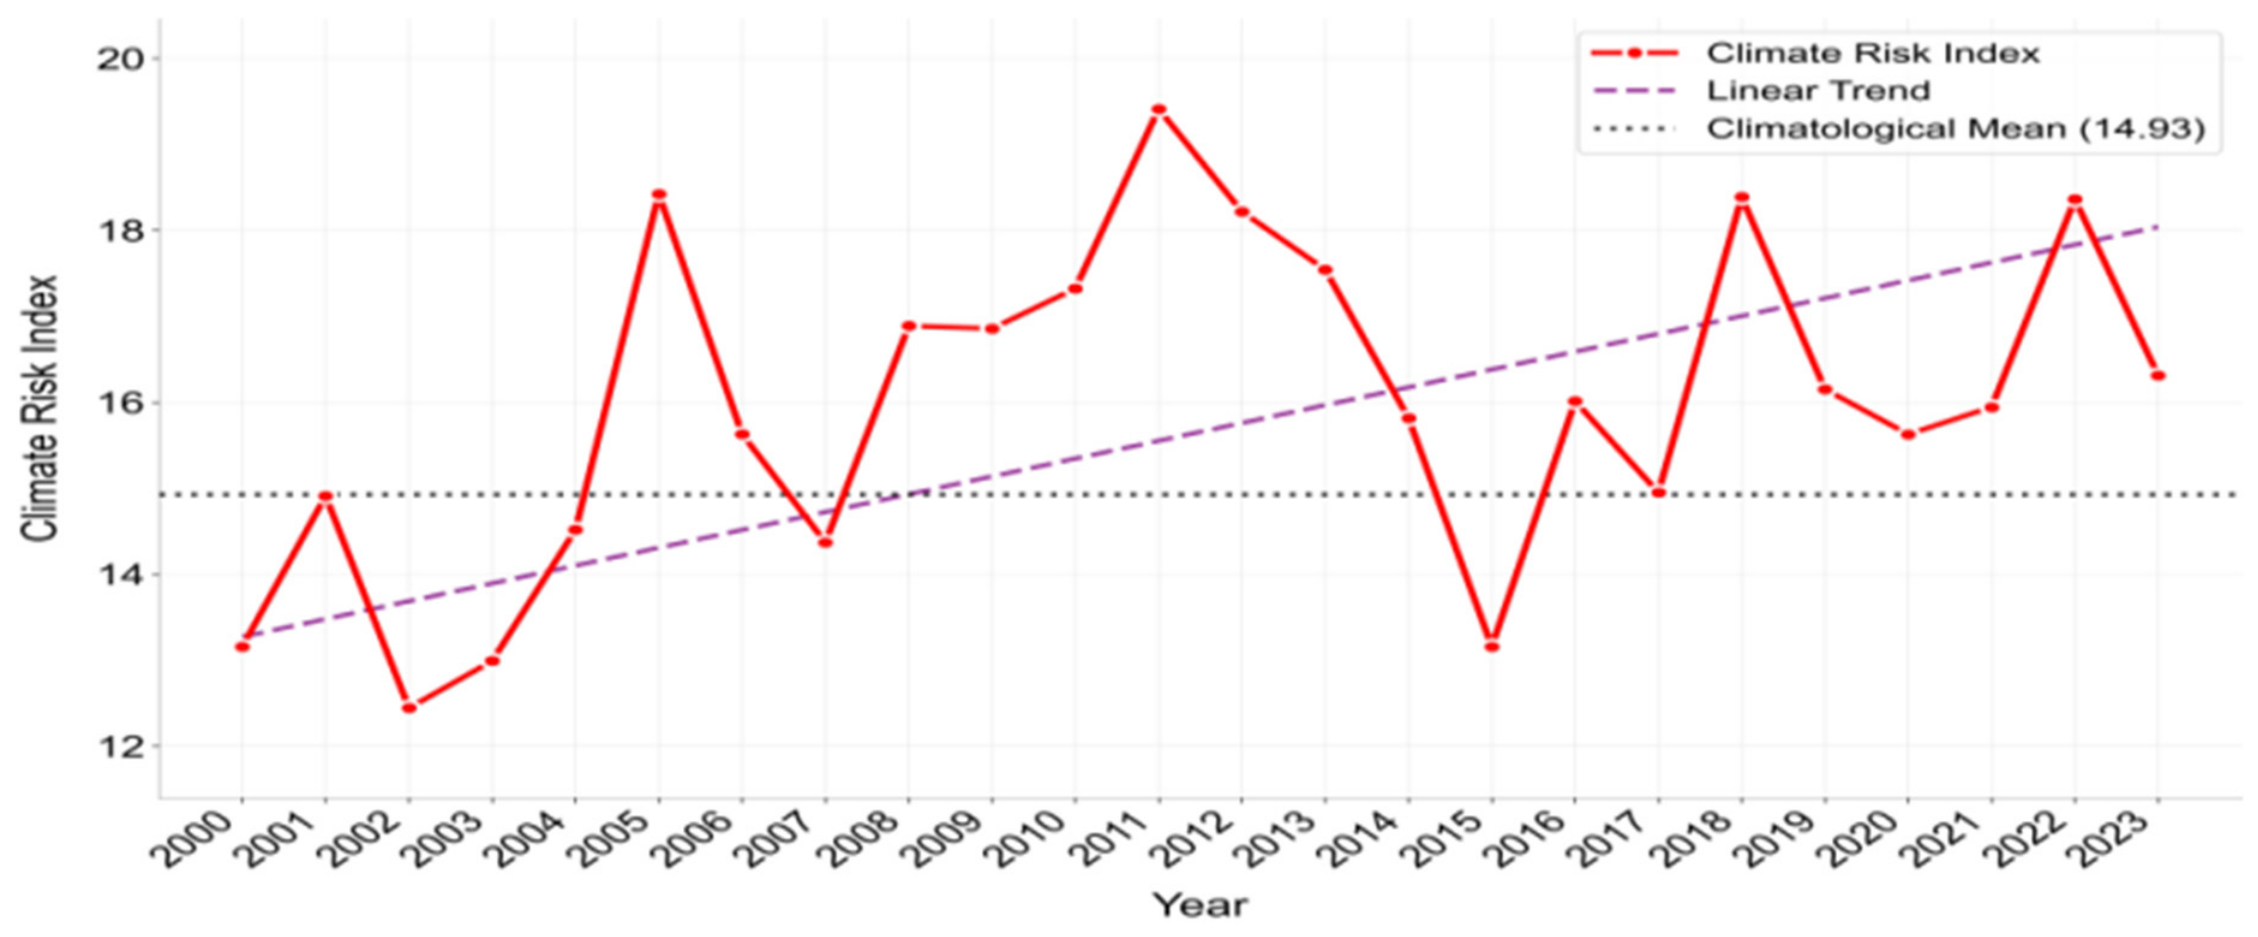
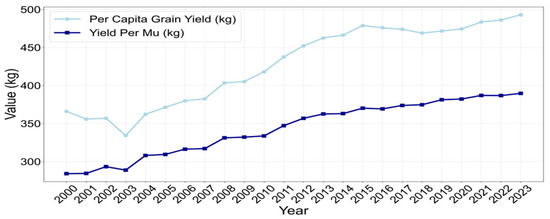
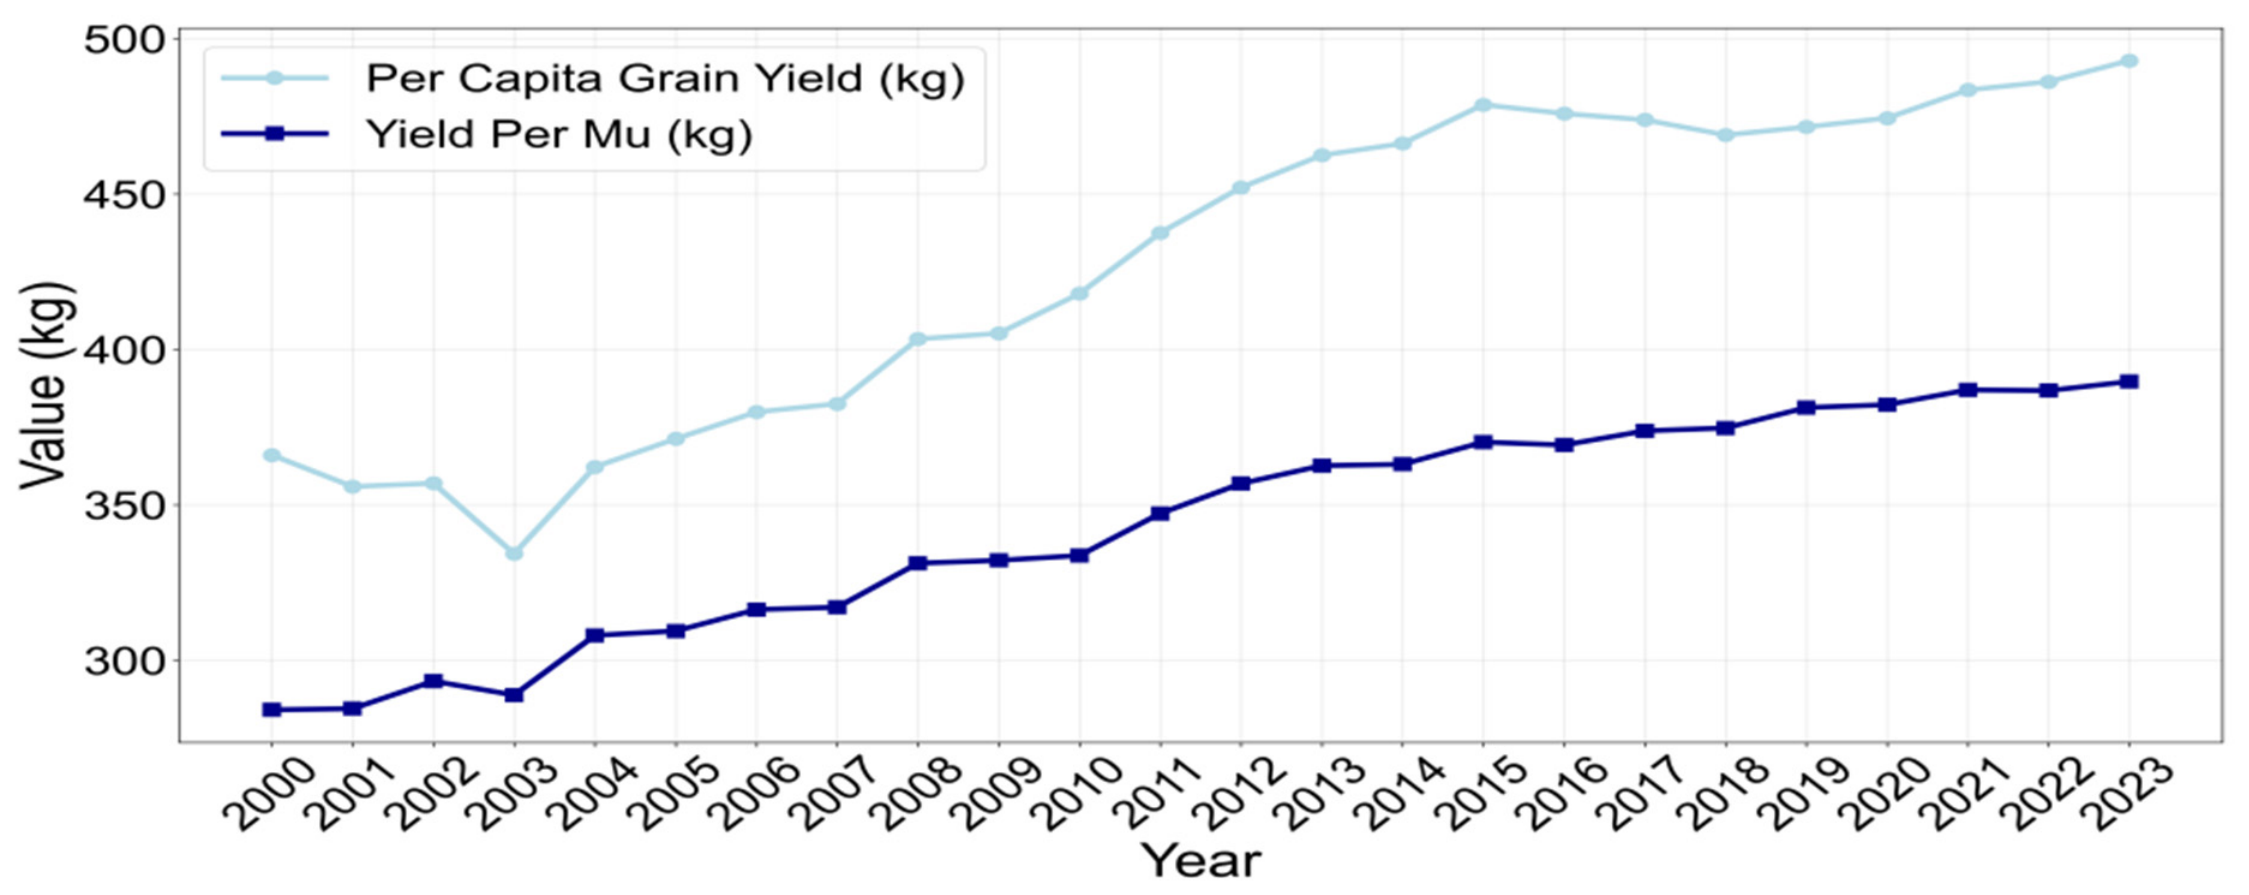
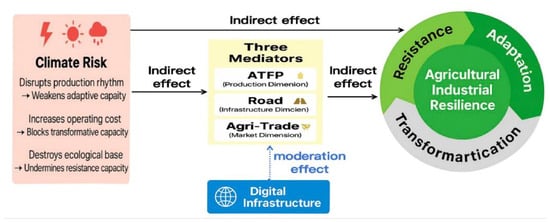
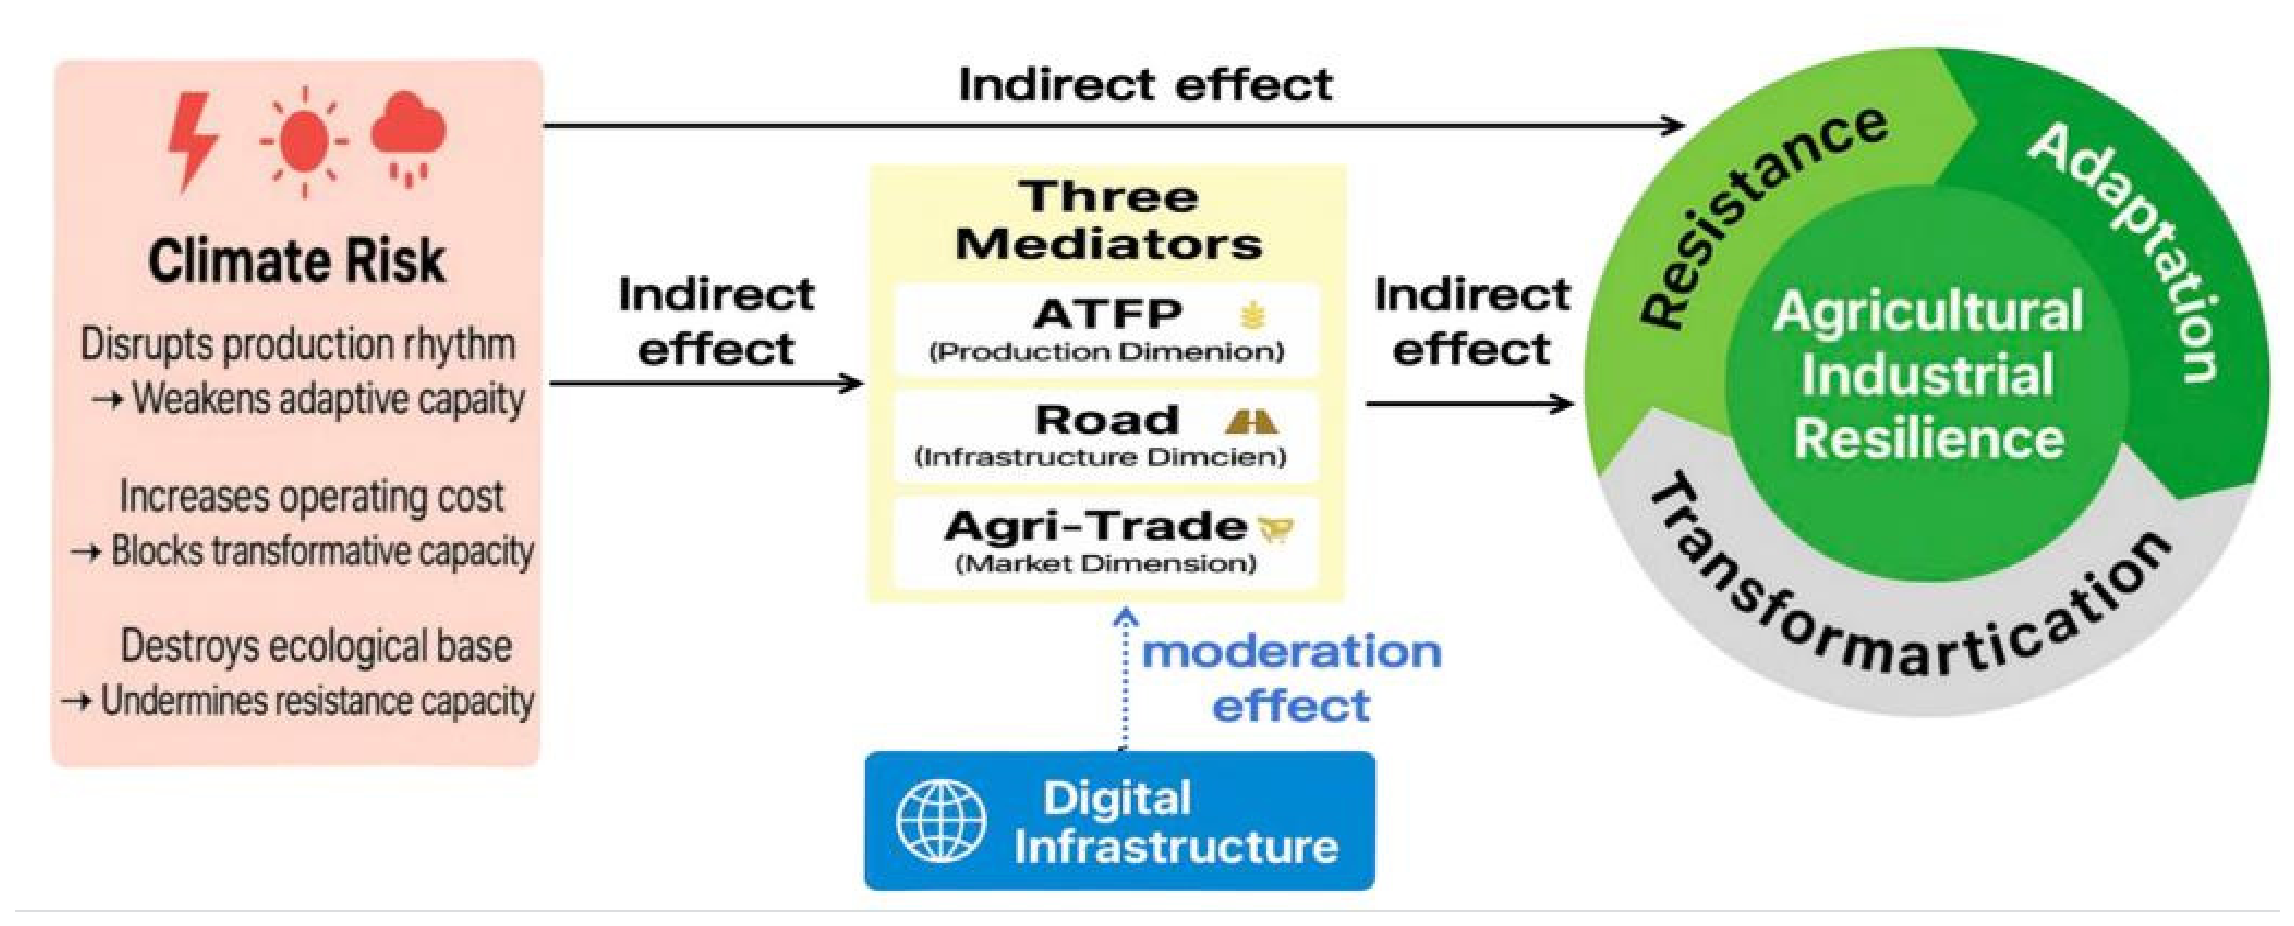
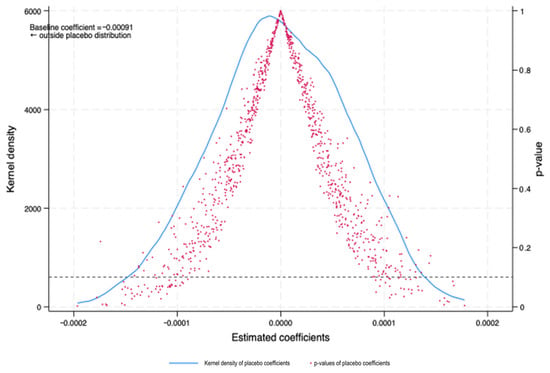
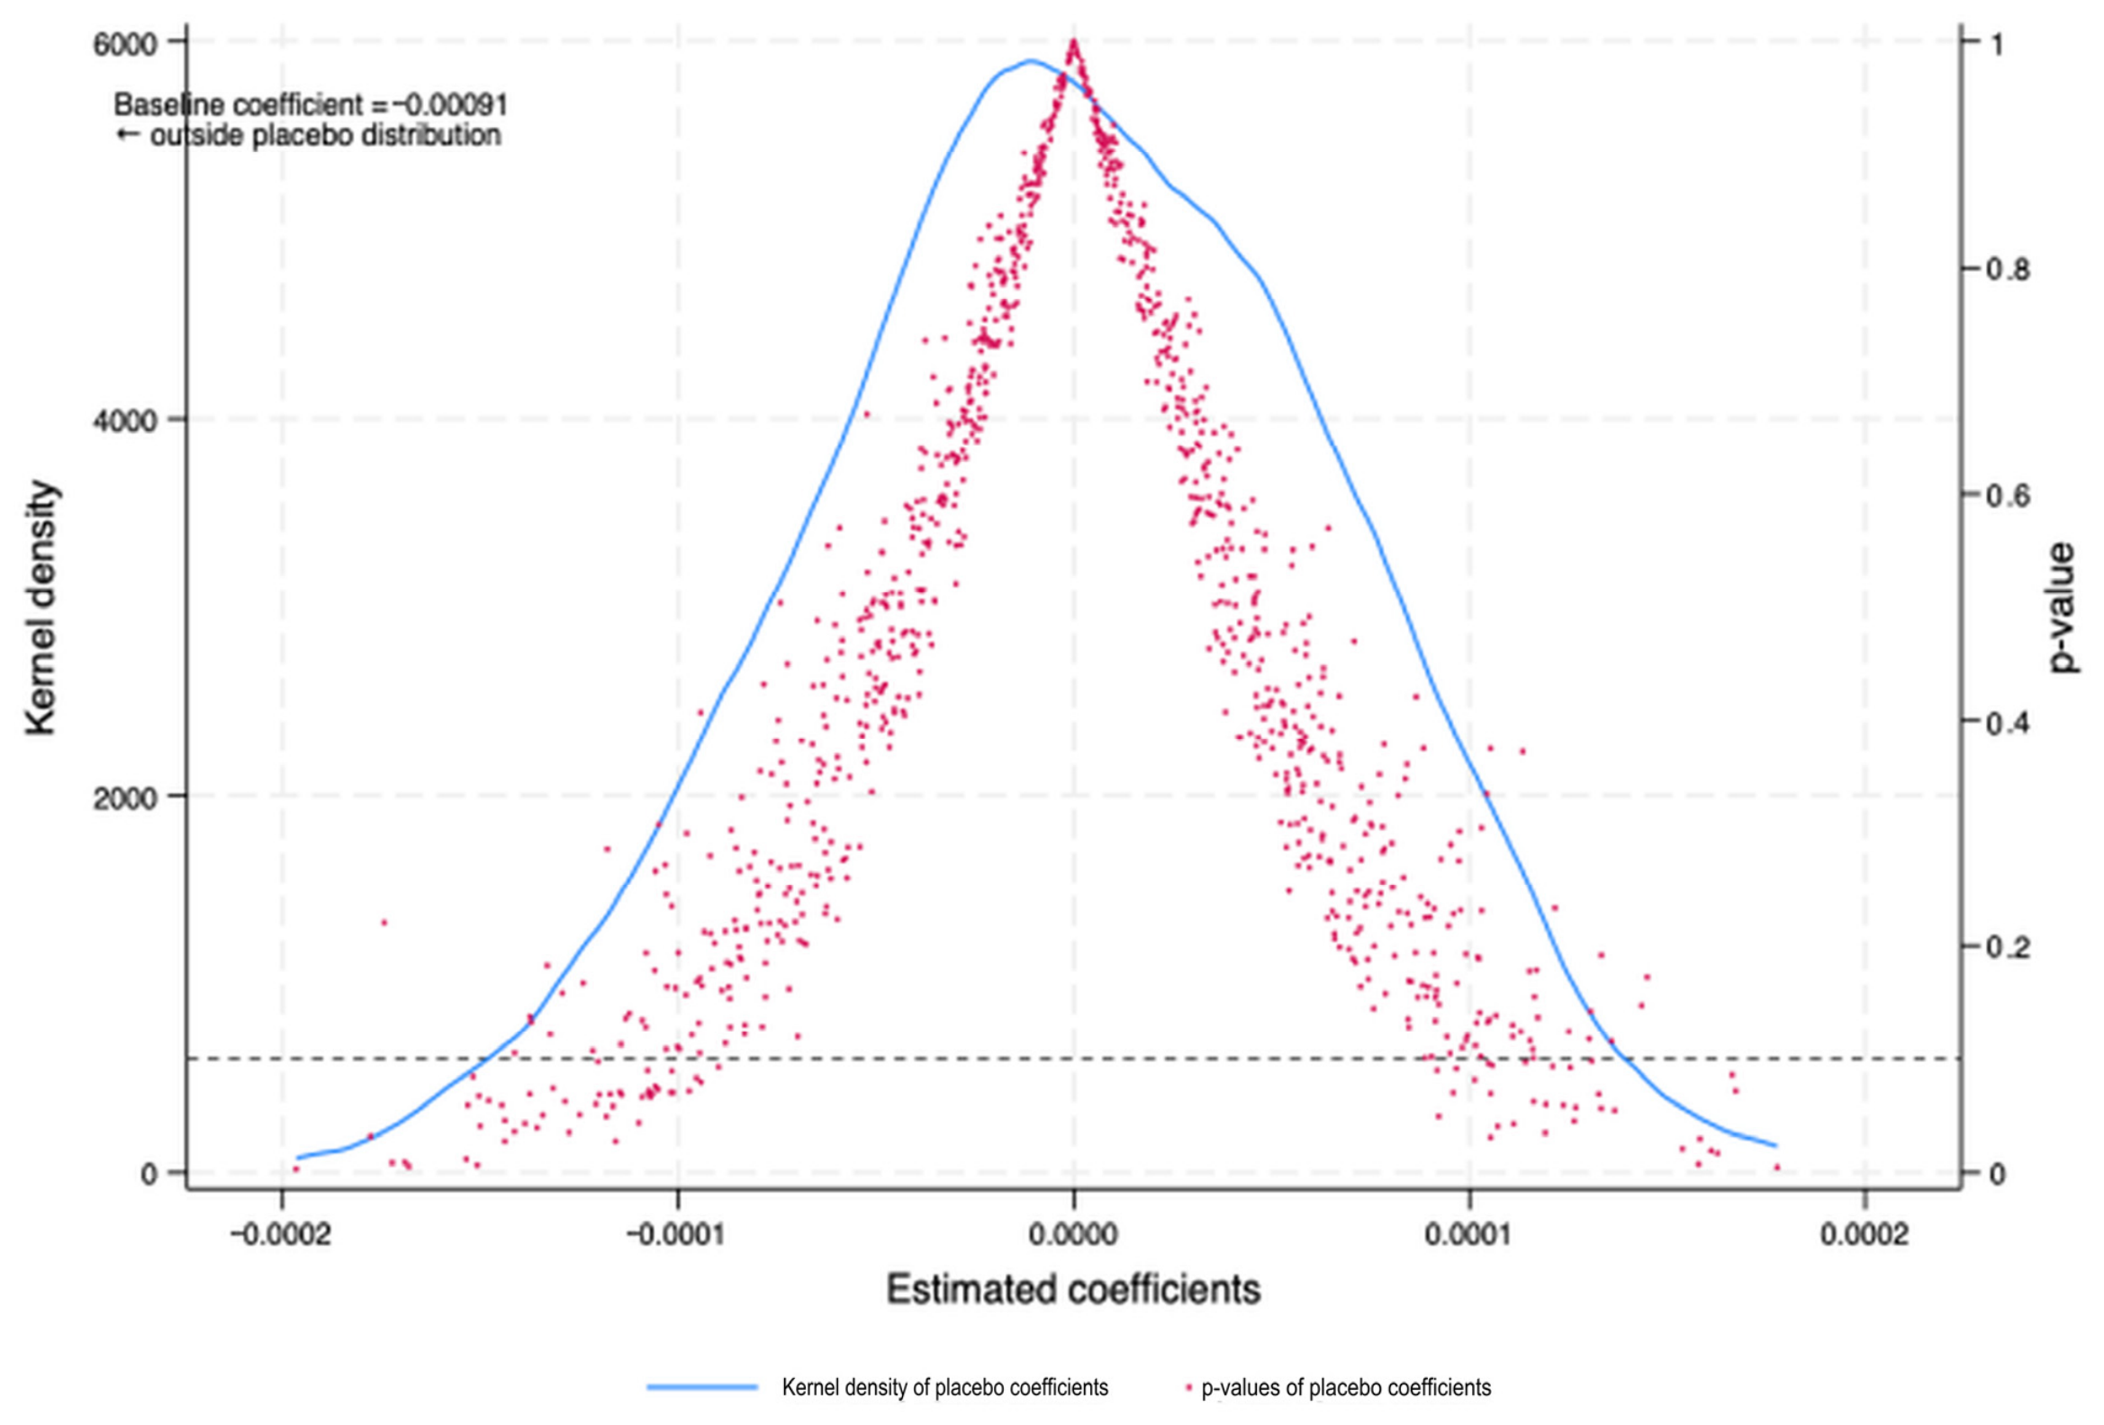
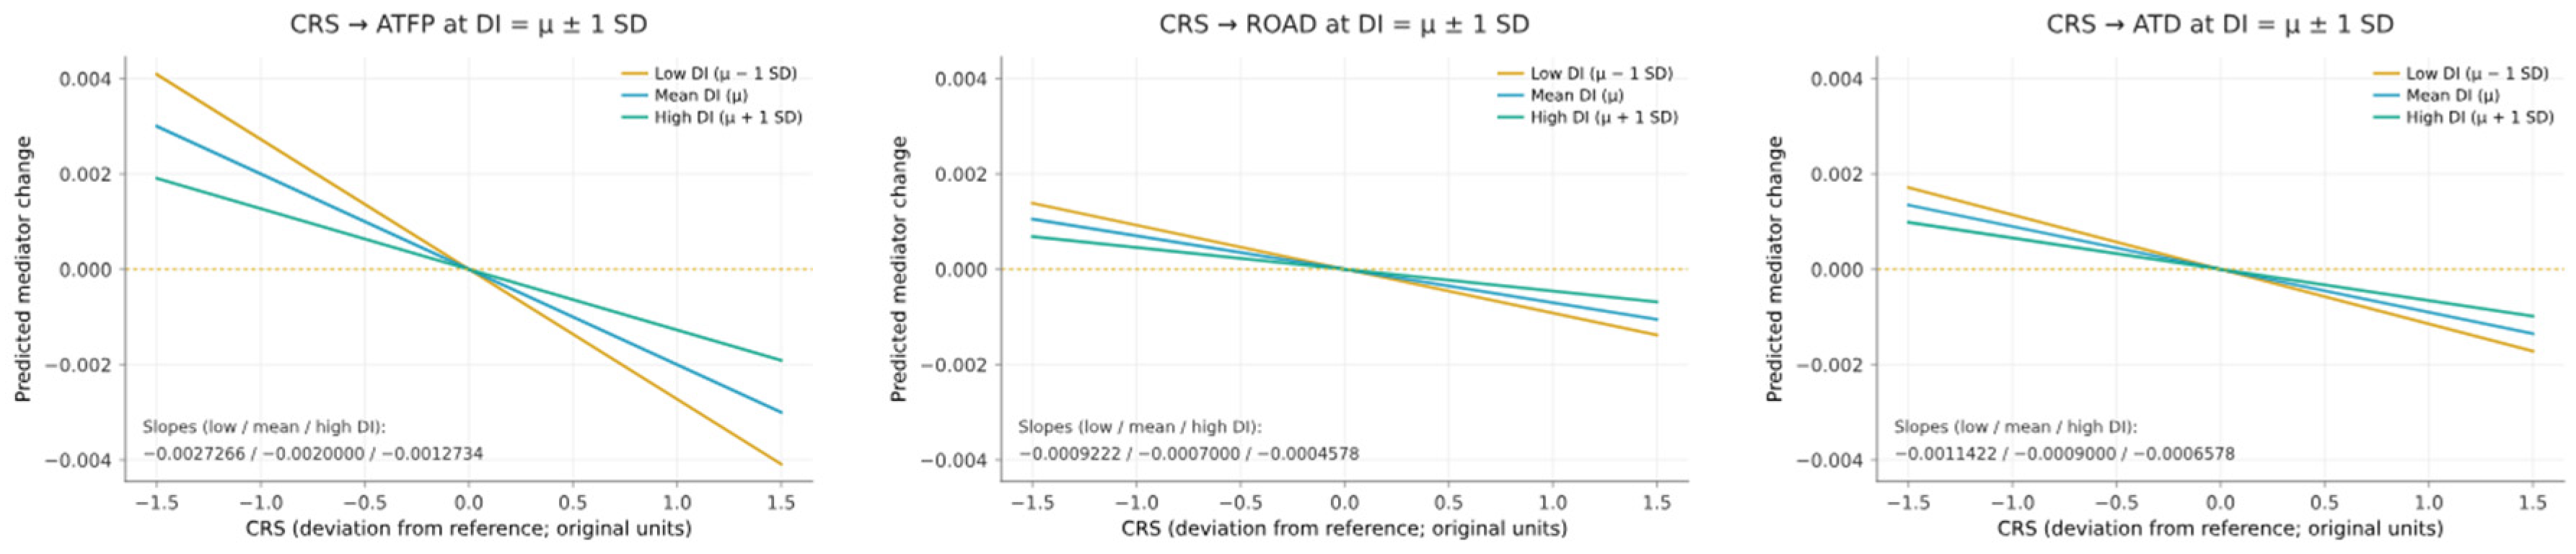
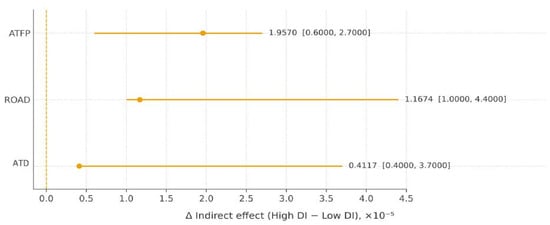
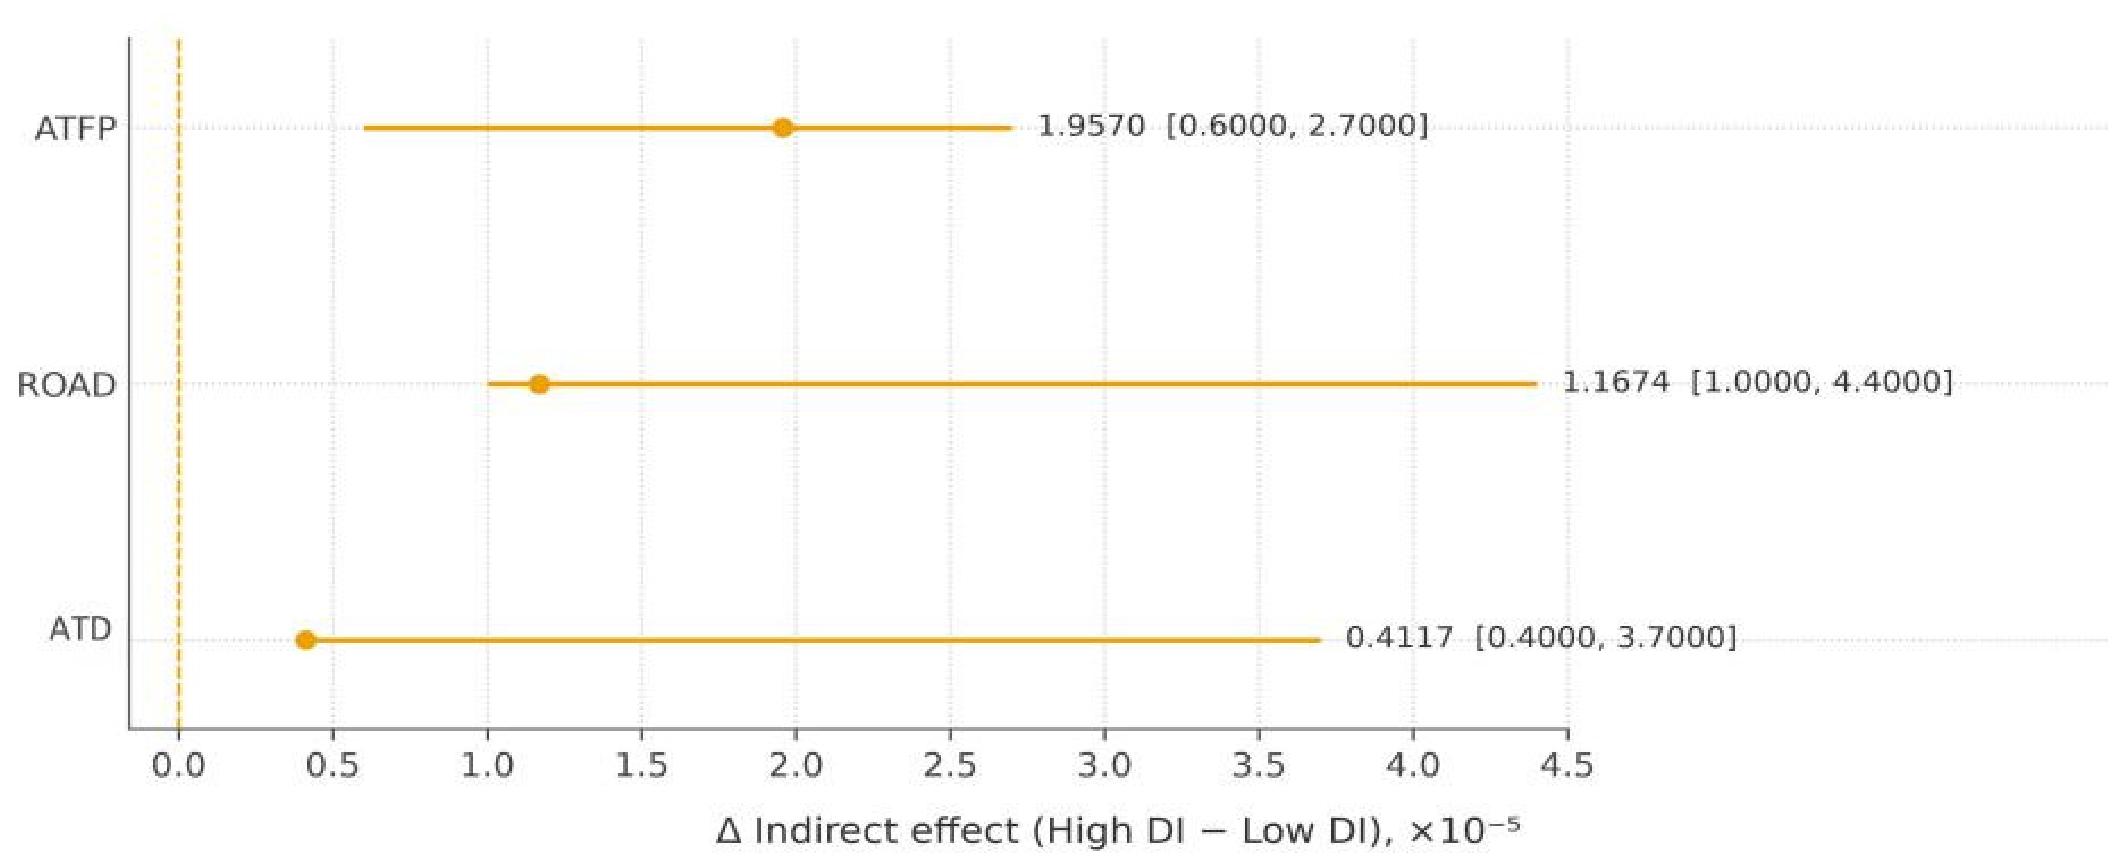

Disclaimer/Publisher’s Note: The statements, opinions and data contained in all publications are solely those of the individual author(s) and contributor(s) and not of MDPI and/or the editor(s). MDPI and/or the editor(s) disclaim responsibility for any injury to people or property resulting from any ideas, methods, instructions or products referred to in the content. |
© 2026 by the authors. Licensee MDPI, Basel, Switzerland. This article is an open access article distributed under the terms and conditions of the Creative Commons Attribution (CC BY) license.