


Abstract
Evidence on progress in AI-based electricity-demand forecasting is considerable but remains far from integrated, as it is spread across the domains of model accuracy, explainability and resilience. This structured retrospective narrative review synthesises the recoverable archived evidence corpus of a wider doctoral project, reconstructing and critically appraising the evidence without claiming full systematic-review reproducibility. A total of 759 DOI-level records were included in the historical search matrices, 236 remained after DOI/title normalisation, 109 underwent structured evidence extraction, and 31 were included in the focused synthesis and classified by the evidence role reported here. Because full database-specific search strings, exact search dates, and some historical screening details are non-recoverable, PRISMA 2020 is used as a transparency framework for the recoverable selection pathway rather than as a claim of full systematic-review compliance. The recoverable evidence was coded by forecasting architecture, data environment, forecasting horizon, validation metrics, explainability, uncertainty treatment, data-quality risks, and governance relevance. The comparative synthesis reveals that deep and hybrid models tend to perform better in data-rich predictive tasks, but the assessment of transferability, interpretability, uncertainty calibration, and robustness to data missingness, temporal misalignment, sensor anomalies, or distribution shift is inconsistent. The specific contribution of this paper is the operationalised Integrated Explainable-Resilient Forecasting Framework, which explicitly links multi-source data governance, hybrid forecasting, model explanation, stress testing, and decision support. Rather than focusing exclusively on accuracy, the framework evaluates forecast quality in terms of error, epistemic transparency, uncertainty calibration, resilience and institutional usability.
1. Introduction
Electricity-demand forecasting is not merely a technical exercise in time-series extrapolation but a critical service of modern electricity systems. In an increasingly digitalised energy system, the ability to predict demand underpins generation planning, reserve allocation, pricing, decarbonisation strategies and system stability. Under earlier system conditions, demand was assumed to follow a relatively stable seasonal pattern that could be captured by linear statistical models. Under current conditions, however, this assumption has become risky. Non-linear, spatial and institutional (co)dependencies of demand patterns [1,2,3] have emerged as a result of climate variability, distributed renewable energy production, electric vehicles, building electrification, demand-side management, smart metering and market liberalisation. Forecasting is no longer merely the prediction of the next observation in a series; it is a matter of making complex socio-technical systems intelligible for governance.
Our review shows a rapid diversification from autoregressive and smoothing methods towards machine learning, deep learning, hybrid learning and optimisation approaches. Complex relationships between load, weather, the economy, behaviour, and the state of infrastructure have been modelled using long short-term memory (LSTM) networks, gated recurrent units (GRUs), convolutional neural networks (CNNs), temporal convolutional networks (TCNs), support-vector regression (SVR), adaptive neuro-fuzzy inference systems (ANFISs) and grey models (GMs) [1,4,5,6,7,8]. These innovations have yielded performance improvements, particularly when high-resolution data and sophisticated data-pre-processing pipelines are used. However, these improvements have also created an epistemic difficulty. Several of the most effective systems are black boxes that are difficult to audit and not easily understood by system operators, regulators, or policymakers. This is problematic because electricity forecasts are not “innocent forecasts”. They are commonly used to inform and manage dispatch, capacity planning, tariff determination, and emergency response. In such applications, a black-box forecast may be impressive but of limited practical value.
A further issue is that the literature has been structured largely around accuracy. Widely used metrics, such as the mean absolute error (MAE), root mean square error (RMSE) and mean absolute percentage error (MAPE), remain important, but they do not fully reflect model performance under shocks, structural changes, data corruption, extreme weather, cyber–physical attacks, or policy change [2,9,10]. A model may perform satisfactorily on a historical test segment but fail when the system enters a new regime. This is particularly true of power systems undergoing a rapid transition towards electrification and decarbonisation, where the past may not reflect future system stress. The issue also affects small and isolated energy networks, such as island systems and microgrids in the Mediterranean region, where data availability is low, renewable intermittency can be high and resilience may be constrained.
In this context, the review shifts the focus from the problem that has dominated the literature—how to minimise forecasting errors—to the problem of keeping forecasts interpretable, uncertainty-aware and reliable during data and system shocks. Three objectives follow. First, the review compares statistical, machine-learning, deep-learning and hybrid approaches with respect to data requirements, forecasting horizon, performance, interpretability and robustness. Second, it identifies common gaps in the literature regarding data governance, XAI, uncertainty quantification, and transferability. Third, it translates these gaps into a testable decision-support architecture that defines how data, predictive models, explanations, and stress tests interact. The distinction is therefore clear: the literature synthesis establishes what is known, whereas the proposed framework specifies what an operational forecasting system should do.
The review makes four distinct contributions. First, it offers a structured comparative synthesis of the 31 core studies and separates direct electricity-demand forecasting evidence from contextual studies that describe determinants, digital infrastructure, or policy. Second, it compares forecasting methods using criteria that extend beyond point-prediction accuracy, namely data richness, interpretability, uncertainty treatment, resilience and transferability. Third, it addresses the methodological gap between high-performing predictive models and the information needs of system operators, regulators and policymakers. Fourth, it operationalises this gap through an Integrated Explainable-Resilient Forecasting Framework that explicitly specifies inputs, transformations, outputs, stress tests and decision criteria, thereby enabling a falsifiable research agenda.
2. Review Method and Evidence Base
The review was conducted as a structured retrospective narrative review of evidence on artificial-intelligence-based electricity-demand forecasting and related energy demand. PRISMA 2020 [11] is used as a reporting and transparency framework for the recoverable historical selection pathway, not as a claim that the review is a fully reproducible systematic review. The completed PRISMA 2020 checklist is provided in Table S1 of the Supplementary Materials. Under the November 2025 review protocol, the archived searches covered Scopus, Web of Science, IEEE Xplore, and PubMed for the period 2014–2025. The present synthesis emphasises the most recent evidence (2022–2025) while retaining earlier methodological baselines that remain applicable. Because the original screening was performed before the present manuscript was prepared, the method was reconstructed from the archived DOI lists, deduplication files, structured evidence-extraction matrix, and model/factor matrix rather than from the native export histories of the databases. Database-level record counts, full database-specific search strings and exact search dates could not be recovered; these elements are therefore explicitly reported as unavailable and have not been retrospectively inferred.
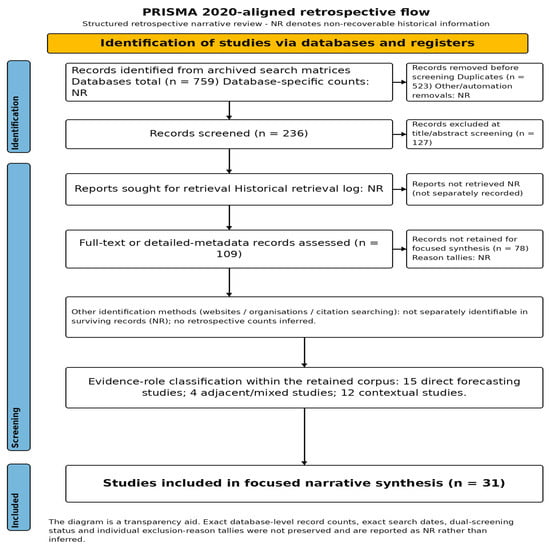
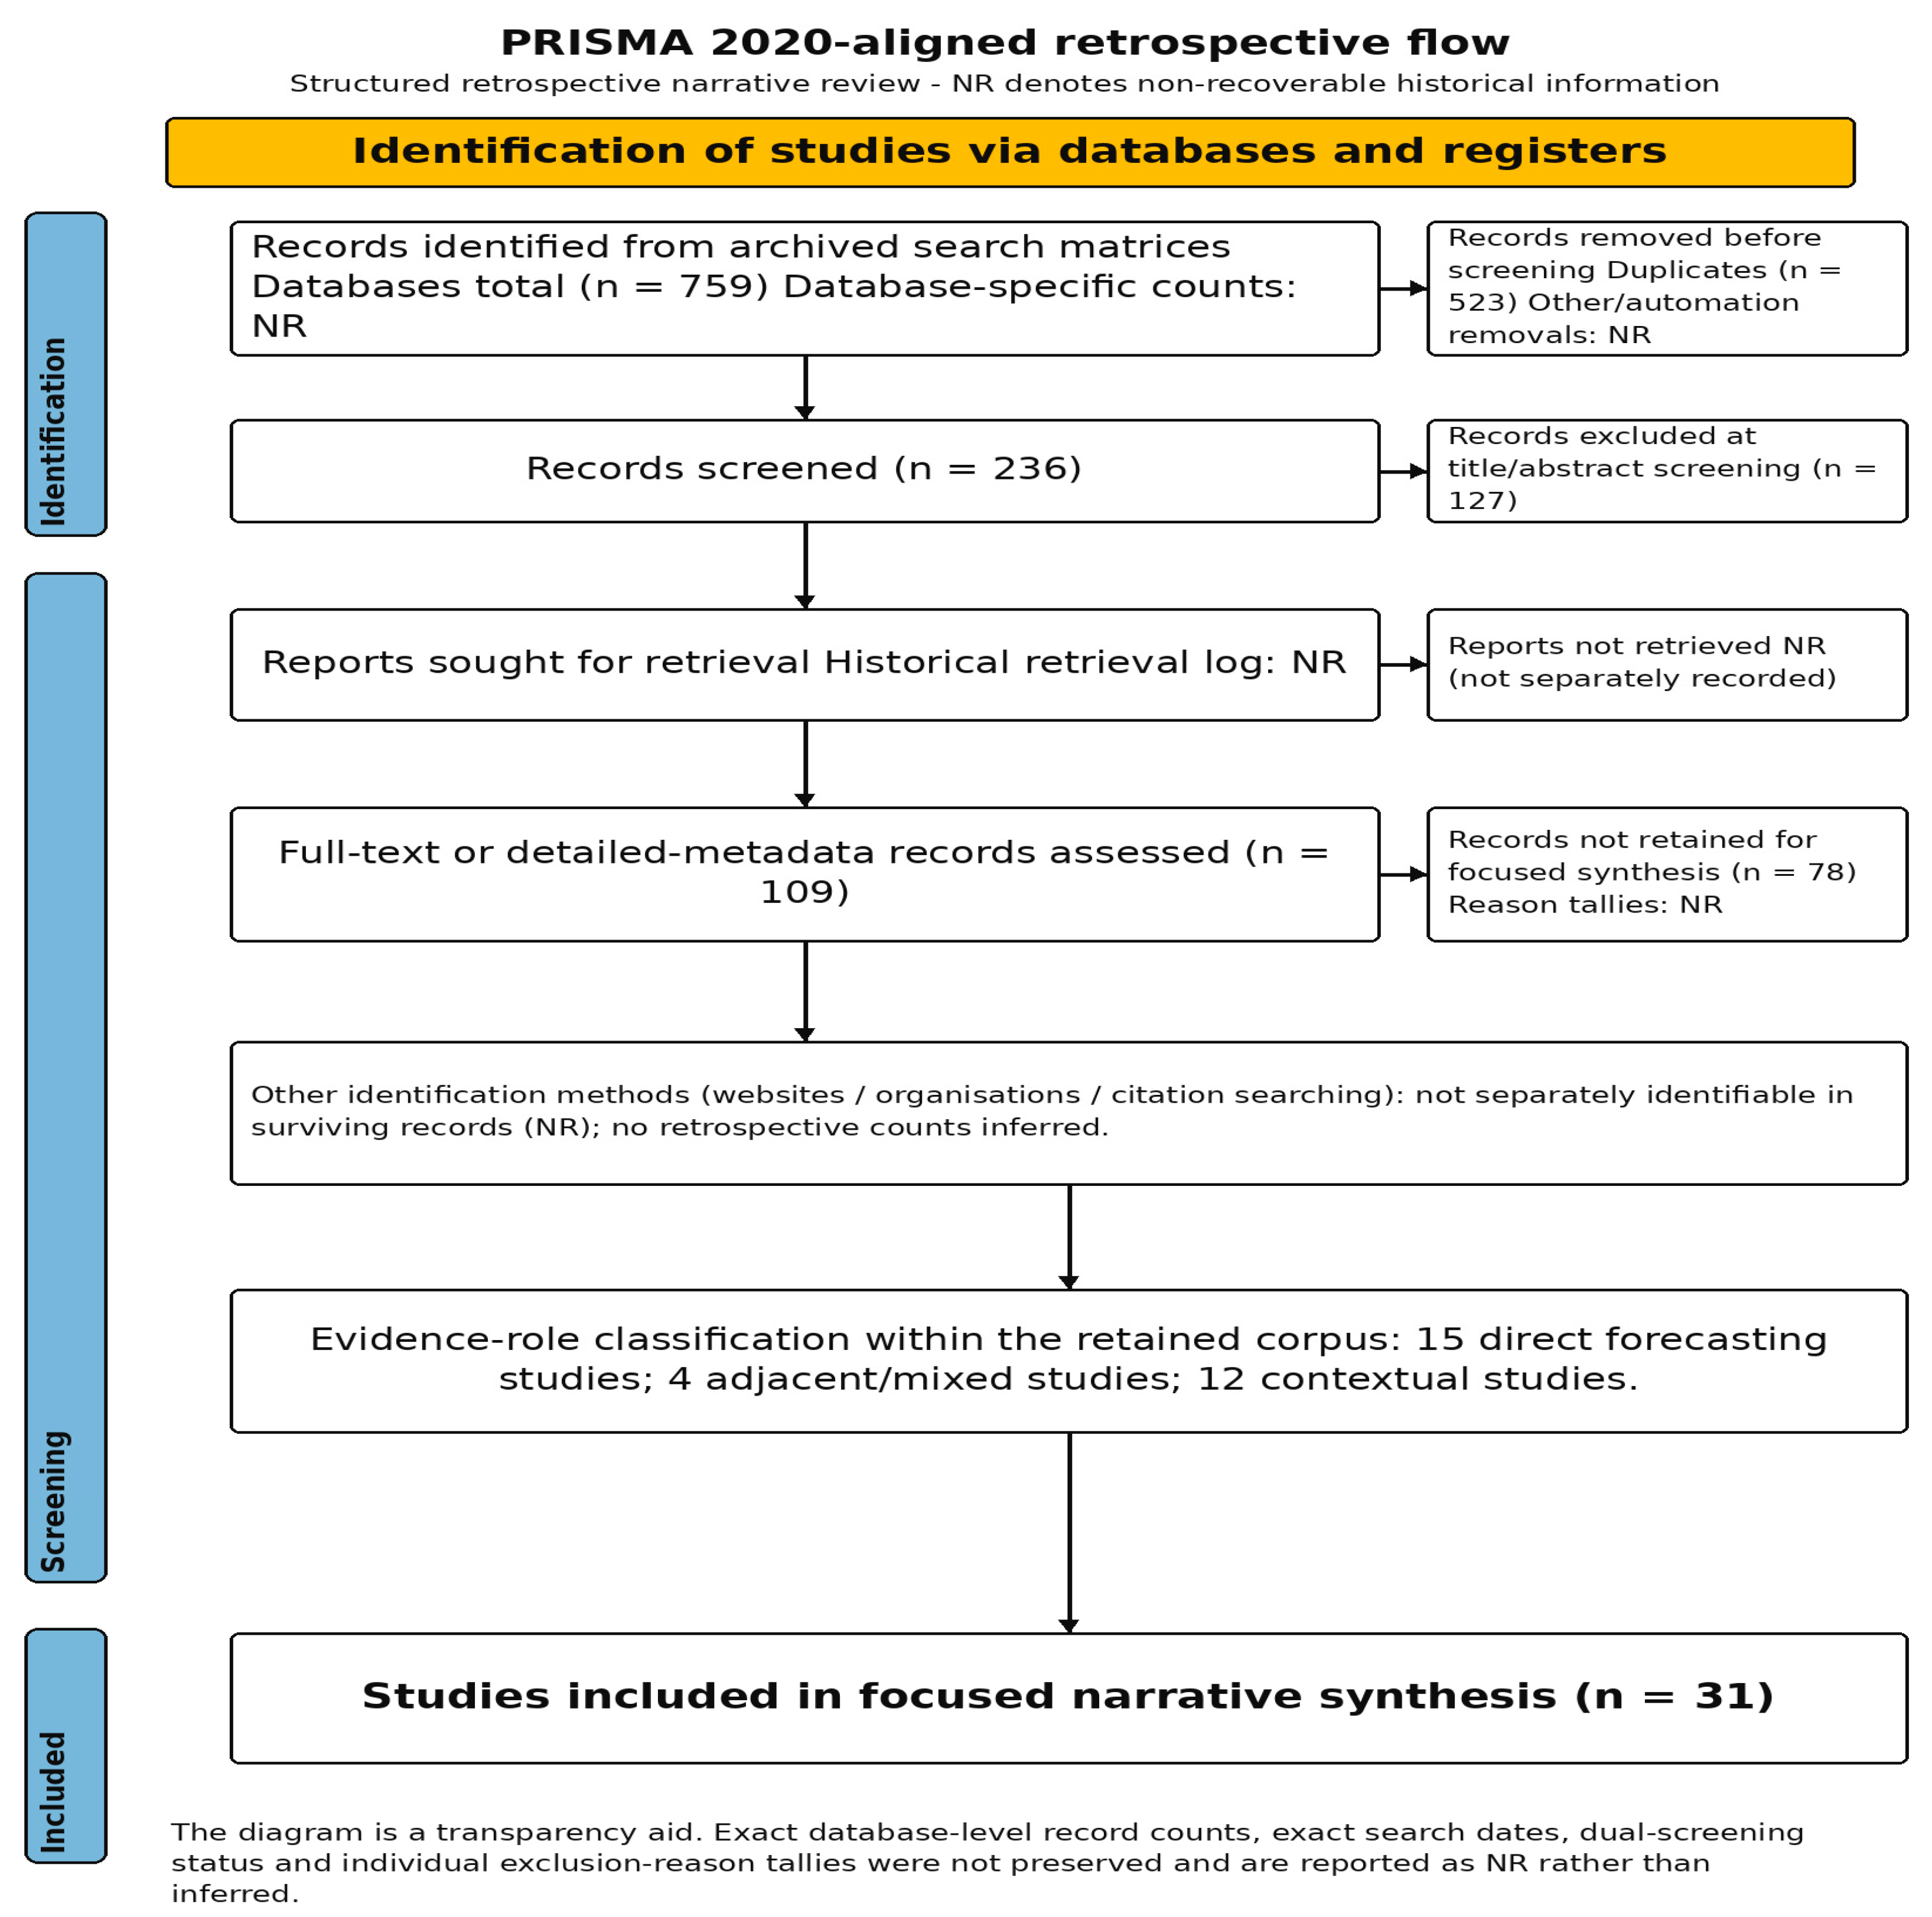
The archived search corpus contains 759 DOI-level records. During DOI and title normalisation, 523 duplicates were removed, leaving 236 records for relevance screening. Of these, 127 were excluded at the title/abstract level because they did not address an issue directly relevant to electricity- or energy-demand forecasting or a methodological issue relevant to forecasting-system design. The remaining 109 records underwent full-text or detailed-metadata extraction. The 78 records not selected for the focused synthesis were excluded primarily because of weak relevance, duplication at the synthesis level, insufficient comparability, or because they provided background information rather than study-level forecasting evidence. The final focused synthesis therefore comprised 31 studies: 15 were classified as direct forecasting evidence, 4 as adjacent/mixed evidence, and 12 as contextual evidence, as detailed in Table 1. Because the historical records do not include a reason code for every exclusion, no reason-specific exclusion tallies are reported. The recoverable selection flow and evidence-role structure are shown in Figure 1.
Table 1.
Structured comparison and evidence-role classification of the 31 studies retained in the focused synthesis.
Figure 1.
PRISMA 2020-aligned retrospective reconstruction of the recoverable evidence-selection pathway. The diagram is used as a transparency aid for this structured retrospective narrative review; unavailable historical elements are not retrospectively inferred.
2.1. Search Logic, Eligibility, and Reproducibility
Because parts of the original protocol may have been lost during archiving, the search logic was cross-checked for consistency against the surviving project files. Concepts relating to electricity, electric load, and energy consumption were combined with concepts relating to demand forecasting, load forecasting, consumption forecasting, machine learning, deep learning, neural networks, hybrid models, artificial intelligence, explainable AI (XAI), uncertainty, resilience, and smart grids. The historical search covered the period 2014–2025, and the focused synthesis placed greater emphasis on the most recent years (2022–2025). Eligible documents were peer-reviewed research or review articles written in English that contributed to at least one of the following areas relevant to electricity-demand systems: forecasting, demand modelling, data governance, interpretability, uncertainty, or resilience. Non-English records, non-scholarly records, duplicates, and records without a methodological connection to demand forecasting were excluded. The complete DOI corpus is stored in the project spreadsheets and can therefore be screened independently. No dual-reviewer screening is claimed retrospectively because the surviving files do not indicate that title/abstract screening was performed by more than one reviewer or how disagreements were resolved.
2.2. Screening and Evidence Hierarchy
A two-level evidence hierarchy was applied. The comparative synthesis was guided by core studies that modelled electricity demand or closely related energy demand, evaluated forecasting architectures, or quantified uncertainty/resilience in a manner transferable to demand forecasting. Contextual studies were included only to support the discussion of exogenous determinants, digital infrastructures, policy-adjacent forecasting or digital contexts. This hierarchy addresses a shortcoming of the previous version of the manuscript, in which adjacent studies could appear to carry the same weight as demand-forecasting studies. Conclusions on forecasting performance are therefore based primarily on the 15 direct studies, whereas adjacent/mixed and contextual studies provide only methodological or contextual support.
2.3. Data Extraction, Coding and Quality Appraisal
Where available, the archived evidence-extraction matrix recorded the study aim, study design, model architecture, input variables, data source, geographical and temporal context, forecasting horizon, performance metrics, principal findings and limitations, and relevance to the doctoral forecasting system. The present revision extends this scheme with new fields for XAI, uncertainty treatment, and resilience testing. Forecasting architectures were classified as statistical, machine learning, deep learning, or other/hybrid optimisation, and data environments as climatic, behavioural, socio-economic, infrastructural, market/policy, or other/multi-source; governance relevance was coded using explicit rules based on reported evidence of explainability, auditability, uncertainty communication, transferability, or scenario use. A narrative, non-formal quality appraisal (not a formal risk-of-bias or certainty-of-evidence assessment) covered five areas: (i) transparency of data sources, (ii) clarity of model specification, (iii) validation design, (iv) reporting of standard performance metrics and comparators, and (v) reproducibility/transferability information. No formal reporting-bias assessment was undertaken. Quality ratings informed, but did not mechanically determine, the weight given to each study in the synthesis, and quality was not used as the sole exclusion criterion. Of the 31 studies, 15 were direct forecasting studies, 4 were adjacent/mixed studies, and 12 were contextual studies; the direct forecasting studies were the most auditable. The architecture, data-environment and governance-relevance fields were designed as multi-label fields, so their totals are not mutually exclusive. Coding was verified against the original structured project matrix, and unclear cases were coded conservatively rather than inferentially.
2.4. Synthesis Strategy
A meta-analysis was not appropriate because the studies differed materially in geography, sampling frequency, forecast horizon, target variable, validation protocol, and error metric. The synthesis is therefore comparative and mechanism-based. It asks not only which model achieves the lowest error, but also which types of data enable a model to perform well, what is lost in terms of interpretability, how uncertainty is represented, whether robustness is assessed under distributional change, and whether the model output is usable for operational or policy decision-making. The narrative synthesis is based on the structured study-level comparison in Table 1.
The synthesis was organised along six analytical dimensions: forecasting architecture; forecasting horizon and validation design; data environment; reported predictive performance; explainability and uncertainty treatment; and governance/resilience relevance. These dimensions enable a direct comparison between models that optimise accuracy under normal historical conditions and models that also reveal drivers, quantify uncertainty, or assess performance under stress. They also prevent conceptually distinct terms, such as robustness, resilience, sensitivity and transferability, from being used interchangeably.
The methodological strength of each study was used as a criterion for interpreting its findings. When external validation, uncertainty reporting, baseline comparison or data provenance was weak, a low reported error was not considered evidence of superiority. Conversely, simpler models were not downgraded for their lower complexity when they were more interpretable, reproducible or transferable. The review is therefore strongly governance-oriented and treats model quality as a multi-criterion property rather than as a single leaderboard ranking based on MAE, RMSE, or MAPE.
3. Evolution of Forecasting Models
Electricity-load forecasting began with statistical time-series models, whose main advantage was their interpretability. Autoregressive integrated moving average models, seasonal autoregressive models, exponential smoothing and econometric models allowed demand to be represented in terms of trend, seasonality, autocorrelation and error. Such models are inexpensive, fast and interpretable, and they serve as useful baselines and as components of hybrid models. They therefore remain in use, although their applicability is limited. They typically assume stable relationships, moderate seasonality and low-dimensional interactions. However, distributed renewables, dynamic tariffs, electric-vehicle charging, extreme temperatures, adaptation and control strategies alter load dynamics in ways that static linear frameworks cannot adequately capture [31].
The adoption of machine learning marked a shift from assumed functional forms to relationships inferred from data. Support-vector regression, random forests, gradient boosting and other ensemble learners can model non-linear relationships without requiring the analyst to specify every interaction [14,17,32]. These methods proved particularly useful for modelling demand when numerous heterogeneous factors were involved, such as temperature, humidity, calendar effects, economic factors and operational conditions. Decision trees and ensemble learners also allowed diverse predictors to be included with minimal pre-processing. However, machine learning introduced a new challenge: high predictive power was accompanied by lower causal interpretability. A model may identify influential variables, but the process by which their weights are obtained may be difficult to explain in a form that is useful for regulatory or policy purposes.
Deep learning further increased both predictive potential and the interpretability challenge. Recurrent neural networks (RNNs), LSTM networks, and GRUs were designed to capture temporal dependence, sequence memory, and non-linearity. These properties suit load forecasting because historical loads, weather, and behavioural patterns interact across multiple temporal resolutions [3,7,8]. CNNs and TCNs have also been applied to demand series to extract hierarchical features from temporal correlations [1,27]. Attention mechanisms have improved the modelling of variable relevance over time, but they have not resolved the black-box problem. Deep learning generally performs well in short- to medium-term forecasting tasks when large amounts of data are available, but it can be computationally expensive and prone to overfitting when data are scarce.
Because single-method models have several limitations, hybrid and optimisation-based models have emerged as a promising alternative. Hybrid systems may use statistical methods to capture temporally stable linear relationships, while machine-learning or deep-learning components capture the residual non-linear relationships. Optimisers such as genetic algorithms, particle swarm optimisation and Bayesian optimisation can be used for hyperparameter tuning, feature selection, or improved convergence [4,6,19]. Such systems are attractive because they combine methodological diversity with strong performance. They also promise greater transparency than black-box deep networks when their components can be examined separately. In a hybrid system, for example, the trend, seasonal, climatic, and non-linear residual components can be explored individually. This decomposition benefits policymaking because the sources of a forecast can be traced.
However, hybridisation does not guarantee trustworthiness. A hybrid of two or more models may be more complex than any single model and, if poorly documented, may make the input–output relationship less transparent. The trustworthiness of hybrid models therefore depends on the transparency of the modelling pipeline. For this reason, the search for the next generation of methods cannot be reduced to a search for lower errors. Rather, it should be understood as a pursuit of models that are as accurate as operational purposes require, as interpretable as institutional accountability requires and as robust as uncertain futures require. The evolution reported in the literature is thus not a simple replacement of old models with new ones, but a gradual shift towards hybrid architectures that combine the rigour of statistical methods, the flexibility of machine learning, the memory of deep learning, and the efficiency of optimisation.
No architectural approach is consistently the strongest across all key evaluation criteria. Statistical methods remain strong baselines in stable, low-dimensional settings, but they are less flexible when non-linear interactions are present. Tree-based machine-learning models offer an appealing middle ground: they can accommodate diverse predictors and support feature-attribution analysis without the computational cost of deep networks. Recurrent, convolutional, and attention-based deep-learning models perform very well on large volumes of high-frequency temporal data, but only when the data are properly pre-processed and the models are carefully tuned and validated. Hybrid systems can reduce bias and exploit complementary signal structures, but their additional components increase the risk of opaque pipelines and overfitting. Methods should therefore be compared conditionally—by forecasting horizon, data richness, interpretability requirements, computational budget, and robustness objectives—rather than through a universal ranking.
4. Determinants of Electricity Demand and Data Architectures
Electricity demand is shaped by interacting climatic, socio-economic, technological, and regulatory determinants. Temperature remains one of the most influential predictors because heating and cooling requirements produce strong load responses, especially during extreme heat and cold. However, the relationship between temperature and load is not linear. It is mediated by the building stock, income, appliance penetration, cultural practices, tariff design, and adaptation measures such as insulation or distributed solar generation [2,16,23,30]. Humidity, wind speed, and solar radiation can further affect both consumption and distributed generation, particularly in local energy systems that incorporate photovoltaic installations. Climate change complicates these relationships further, because past weather–demand correlations may no longer hold as consumers adapt their behaviour and technologies.
Socio-economic variables add a second layer of complexity. Industrial output, urbanisation, population density, income, demographic structure and mobility patterns can affect the level, timing and spatial concentration of electricity demand [5,13,20]. Industrial added value may serve as a proxy for electricity consumption, and urban residential patterns may reshape daily and seasonal load profiles. Electrification maturity also determines the relationship between economic growth and demand. In mature systems, efficiency improvements can reduce the elasticity of demand with respect to growth, whereas in developing or energy-deficient systems, demand is constrained by limited supply, infrastructure, and affordability [14,18]. Forecasting frameworks that ignore socio-economic structure may be reasonably accurate in the short term but unreliable when used for planning.
Technological change, a third determinant, has turned electricity demand into a cyber-physical data process. Smart meters, IoT devices, building-management systems, distributed generation, electric vehicles, heat pumps and storage increase observability, but they can also introduce heterogeneous sampling, device drift and synchronisation dependencies [22,24,28]. The surveyed evidence suggests that forecasting errors can originate in data-pipeline failures rather than in the algorithm itself. Missing load data can under-sample true transitions and lead to underestimated peaks; temporal misalignment of load, weather and price signals can create spurious lead–lag relationships; sensor faults or variability can distort peaks and plateaus; and distribution shift can invalidate relationships learned under one behavioural, climatic, or tariff regime when another regime applies. A governance-ready pipeline should therefore document imputation rules, time-zone and daylight-saving alignment, anomaly thresholds, feature latency, retraining triggers and data provenance. Without these controls, noise, leakage and systematic missingness may be amplified by AI models.
Regulation and market design constitute a fourth determinant. Carbon pricing, subsidies, dynamic tariffs, demand-response incentives and renewable-energy targets can alter consumption behaviour and investment [20,25,26]. Their effects can be discontinuous, because a policy change can alter how prices shape behaviour across time and technologies. Regulatory variables therefore cannot be treated as a fixed external context; instead, they should be viewed as an integral component of the demand system. During the energy transition, policy influences forecasts and forecasts influence policy. This two-way relationship requires forecasting systems that can evaluate scenarios rather than merely extrapolate historical data.
The resulting data architecture is therefore multi-source and multi-scale. It must combine weather, load, market, demographic, infrastructure, and policy information while maintaining temporal consistency and interpretability. This integration can be facilitated by real-time analytics and edge–cloud infrastructures that pre-process local data and transmit aggregated signals to central models [9,22]. However, the governance of these systems remains unresolved. Interoperability standards, cybersecurity measures, privacy-preserving analytics, and reproducibility protocols are required if data-rich forecasting is to become institutionally credible. Without them, smart grids may become technologically advanced but epistemologically fragmented structures.
5. Explainable Artificial Intelligence in Forecasting
Explainable artificial intelligence is becoming increasingly important in electricity-demand forecasting because forecasts that are not understood cannot reliably support critical energy decisions. In a laboratory setting, it may be sufficient to show that one model produces smaller errors than another. In a grid-control or policy context, however, it is also important to know why a forecast was produced, which factors influenced it, how stable it is, and what action it supports. This is not merely an academic requirement, because forecasts affect dispatch, procurement, investment planning, tariff setting and emergency planning. A lack of transparency in forecasts obscures accountability and hinders learning from errors.
Explainability can be intrinsic or post hoc. Linear models, decision trees and some rule-based systems allow direct inspection, but they may underfit non-linear demand processes. Post hoc methods can interrogate more complex models, although each has limitations. SHapley Additive exPlanations (SHAP) provide an elegant solution to the additive attribution problem and a valuable summary of global and local feature importance, but they can be computationally expensive and are sensitive to background distributions and correlated predictors. Local Interpretable Model-agnostic Explanations (LIME) are easy to apply for local explanation, but the resulting explanations are sensitive to the neighbourhood definition, sampling, and random seed. Attention mechanisms show where a network places its “attention”, but attention weights do not necessarily indicate causal effects. Counterfactual explanations can be operationally useful because they state which changes would alter a forecast, but they must respect feasibility constraints; otherwise, they risk suggesting physically or institutionally impossible interventions. XAI outputs should therefore be triangulated across methods and validated for stability rather than presented as a decorative add-on [28].
A trade-off between accuracy and interpretability persists. Highly interpretable models may fail to capture the complexity of demand, whereas highly accurate deep models may be too complex to interpret. This trade-off should not be resolved by choosing one end of the spectrum over the other. Rather, the reviewed evidence suggests that interpretability should be built at multiple levels. At the data level, data sources, quality, and pre-processing should be reported. At the model level, the design and hyperparameters of individual components should be explained. At the forecast level, accuracy, uncertainty, and key drivers should be stated. At the governance level, the implications of the forecast should be framed in terms that operators and policymakers can use.
Explainability is particularly critical when forecasts are used under uncertainty. For example, if a model predicts an abnormal peak load, it should indicate whether the peak is attributable to weather, industrial activity, holidays, electric-vehicle charging, data errors, or a behavioural shift following a policy change. Without such information, operators may over-react, under-react, or respond inappropriately. Reda et al. [28] demonstrated the usefulness of explainable data-driven load-profile models for measurement and verification, and broader work on digital energy systems highlights the growing need for interpretability to build trust [22,30]. This is especially important when forecasts support investment or demand-response strategies that affect consumers.
Furthermore, explainability should not be viewed as the “icing on the cake”. If it is introduced only after model development, it may merely describe design choices rather than explain them. Explainability should instead be embedded in the design from the outset through model and feature selection, validation planning and reporting. The framework proposed in this article therefore treats XAI as an integral part of the modelling process. This design philosophy reflects a broader shift from algorithmic forecasting towards governance-oriented forecasting, in which the value of a forecast is judged not merely by its closeness to realised demand but by how well it informs human decision-making.
6. Resilience, Sensitivity, and Uncertainty
This section distinguishes four related concepts. Robustness is the ability of predictive performance to withstand bounded perturbations of the inputs or model assumptions. Resilience is the ability of a forecasting system to maintain performance, recover, or degrade gracefully when disruptive events affect demand, data, or infrastructure. Sensitivity is the measured response of outputs to controlled changes in specified inputs. Transferability is the extent to which a model, calibration method, or explanation can be applied outside its original geographical, customer, temporal, or infrastructural context. Uncertainty is treated separately as the quantified dispersion of, or confidence in, predictions and model knowledge. Using these terms consistently means that a model that is insensitive to a single parameter is not considered ‘resilient’ in the operational sense.
Sensitivity analysis is one way of examining resilience. By varying climatic, behavioural, economic or technological factors, it is possible to determine which factors most strongly influence the forecast and where the model is most sensitive. Scenario-based sensitivity analysis goes a step further by defining a set of scenarios and evaluating the model under each one. For electricity demand, such scenarios might include more frequent heatwaves, faster adoption of electric vehicles, wider use of heat pumps, industrial contraction, the introduction of dynamic tariffs, intermittent renewable generation, or supply constraints. Scenarios are not used to predict a single future, but to assess how plausible forecasts vary across alternative futures.
Resilience should be evaluated using measurable stress-test indicators rather than qualitative claims. Potential tests include the percentage degradation in MAE/RMSE/MAPE on data with controlled missingness; the change in error under timestamp misalignment; tolerance to injected sensor spikes and stuck-value faults; performance under out-of-distribution extreme temperatures or demand levels; calibration loss after retraining; performance under covariate or concept shift; recovery time after retraining; and interval coverage under out-of-distribution conditions. A resilience profile can thus be represented as a vector of relative error degradation, change in uncertainty calibration and recovery properties, rather than as a single unvalidated label.
Quantifying uncertainty is equally important. Point forecasts can be misleading because system operators need to know the plausible range of outcomes. Probabilistic forecasts, prediction intervals, ensemble forecasts, Bayesian forecasts and quantile forecasts convey uncertainty better than single-point forecasts. Approaches to demand-uncertainty forecasting based on temporal convolutional networks, hybrid probabilistic forecasting, and grey models all reflect this trend towards more uncertainty-aware forecasting [1,5,8]. These approaches are valuable because they separate expected demand from forecast uncertainty. A high expected load with high uncertainty may require more cautious operation than a low expected load with low uncertainty.
Resilience also concerns data. Forecasting infrastructure may be affected by data loss (due to sensor failure or smart-meter malfunction), cyberattacks, network delays, or metadata inconsistencies. A resilient model should therefore withstand shocks to both demand and data. This requires anomaly detection, backup models, redundancy, monitoring, and alerting. Real-time analytics and digital twins could help by enabling pre-emptive virtual testing [30]. However, these tools must be managed carefully because they may increase cyber-physical vulnerability.
Resilience also changes how model transferability should be understood. A model that is valid in one national, regional or infrastructural system may not be valid in another. This is especially important for small-state or Mediterranean systems, where demand may be shaped by tourism, island grids, heat stress, cooling loads and renewable generation. Transferability therefore needs to be tested explicitly. Contextual scalability, as defined in the proposed framework, is the capacity of a forecasting system to be transferred from one data environment to another while maintaining transparency and accountability.
In light of these considerations, resilience should be an integral part of the evaluation of electricity-demand forecasting rather than a retrospective discussion of limitations. Models should be evaluated under plausible shocks, tested for sensitivity to key drivers, accompanied by uncertainty measures and assessed for their governance relevance. In this way, forecasting systems can move from historical accuracy towards future reliability.
7. An Integrated Explainable-Resilient Forecasting Framework
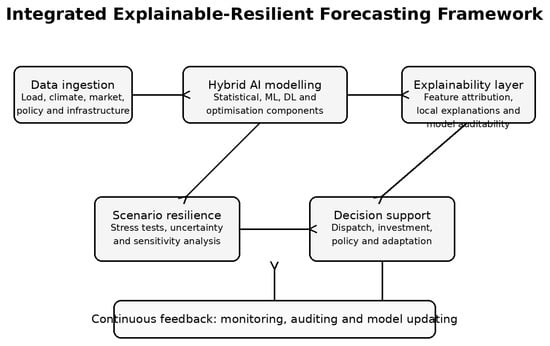
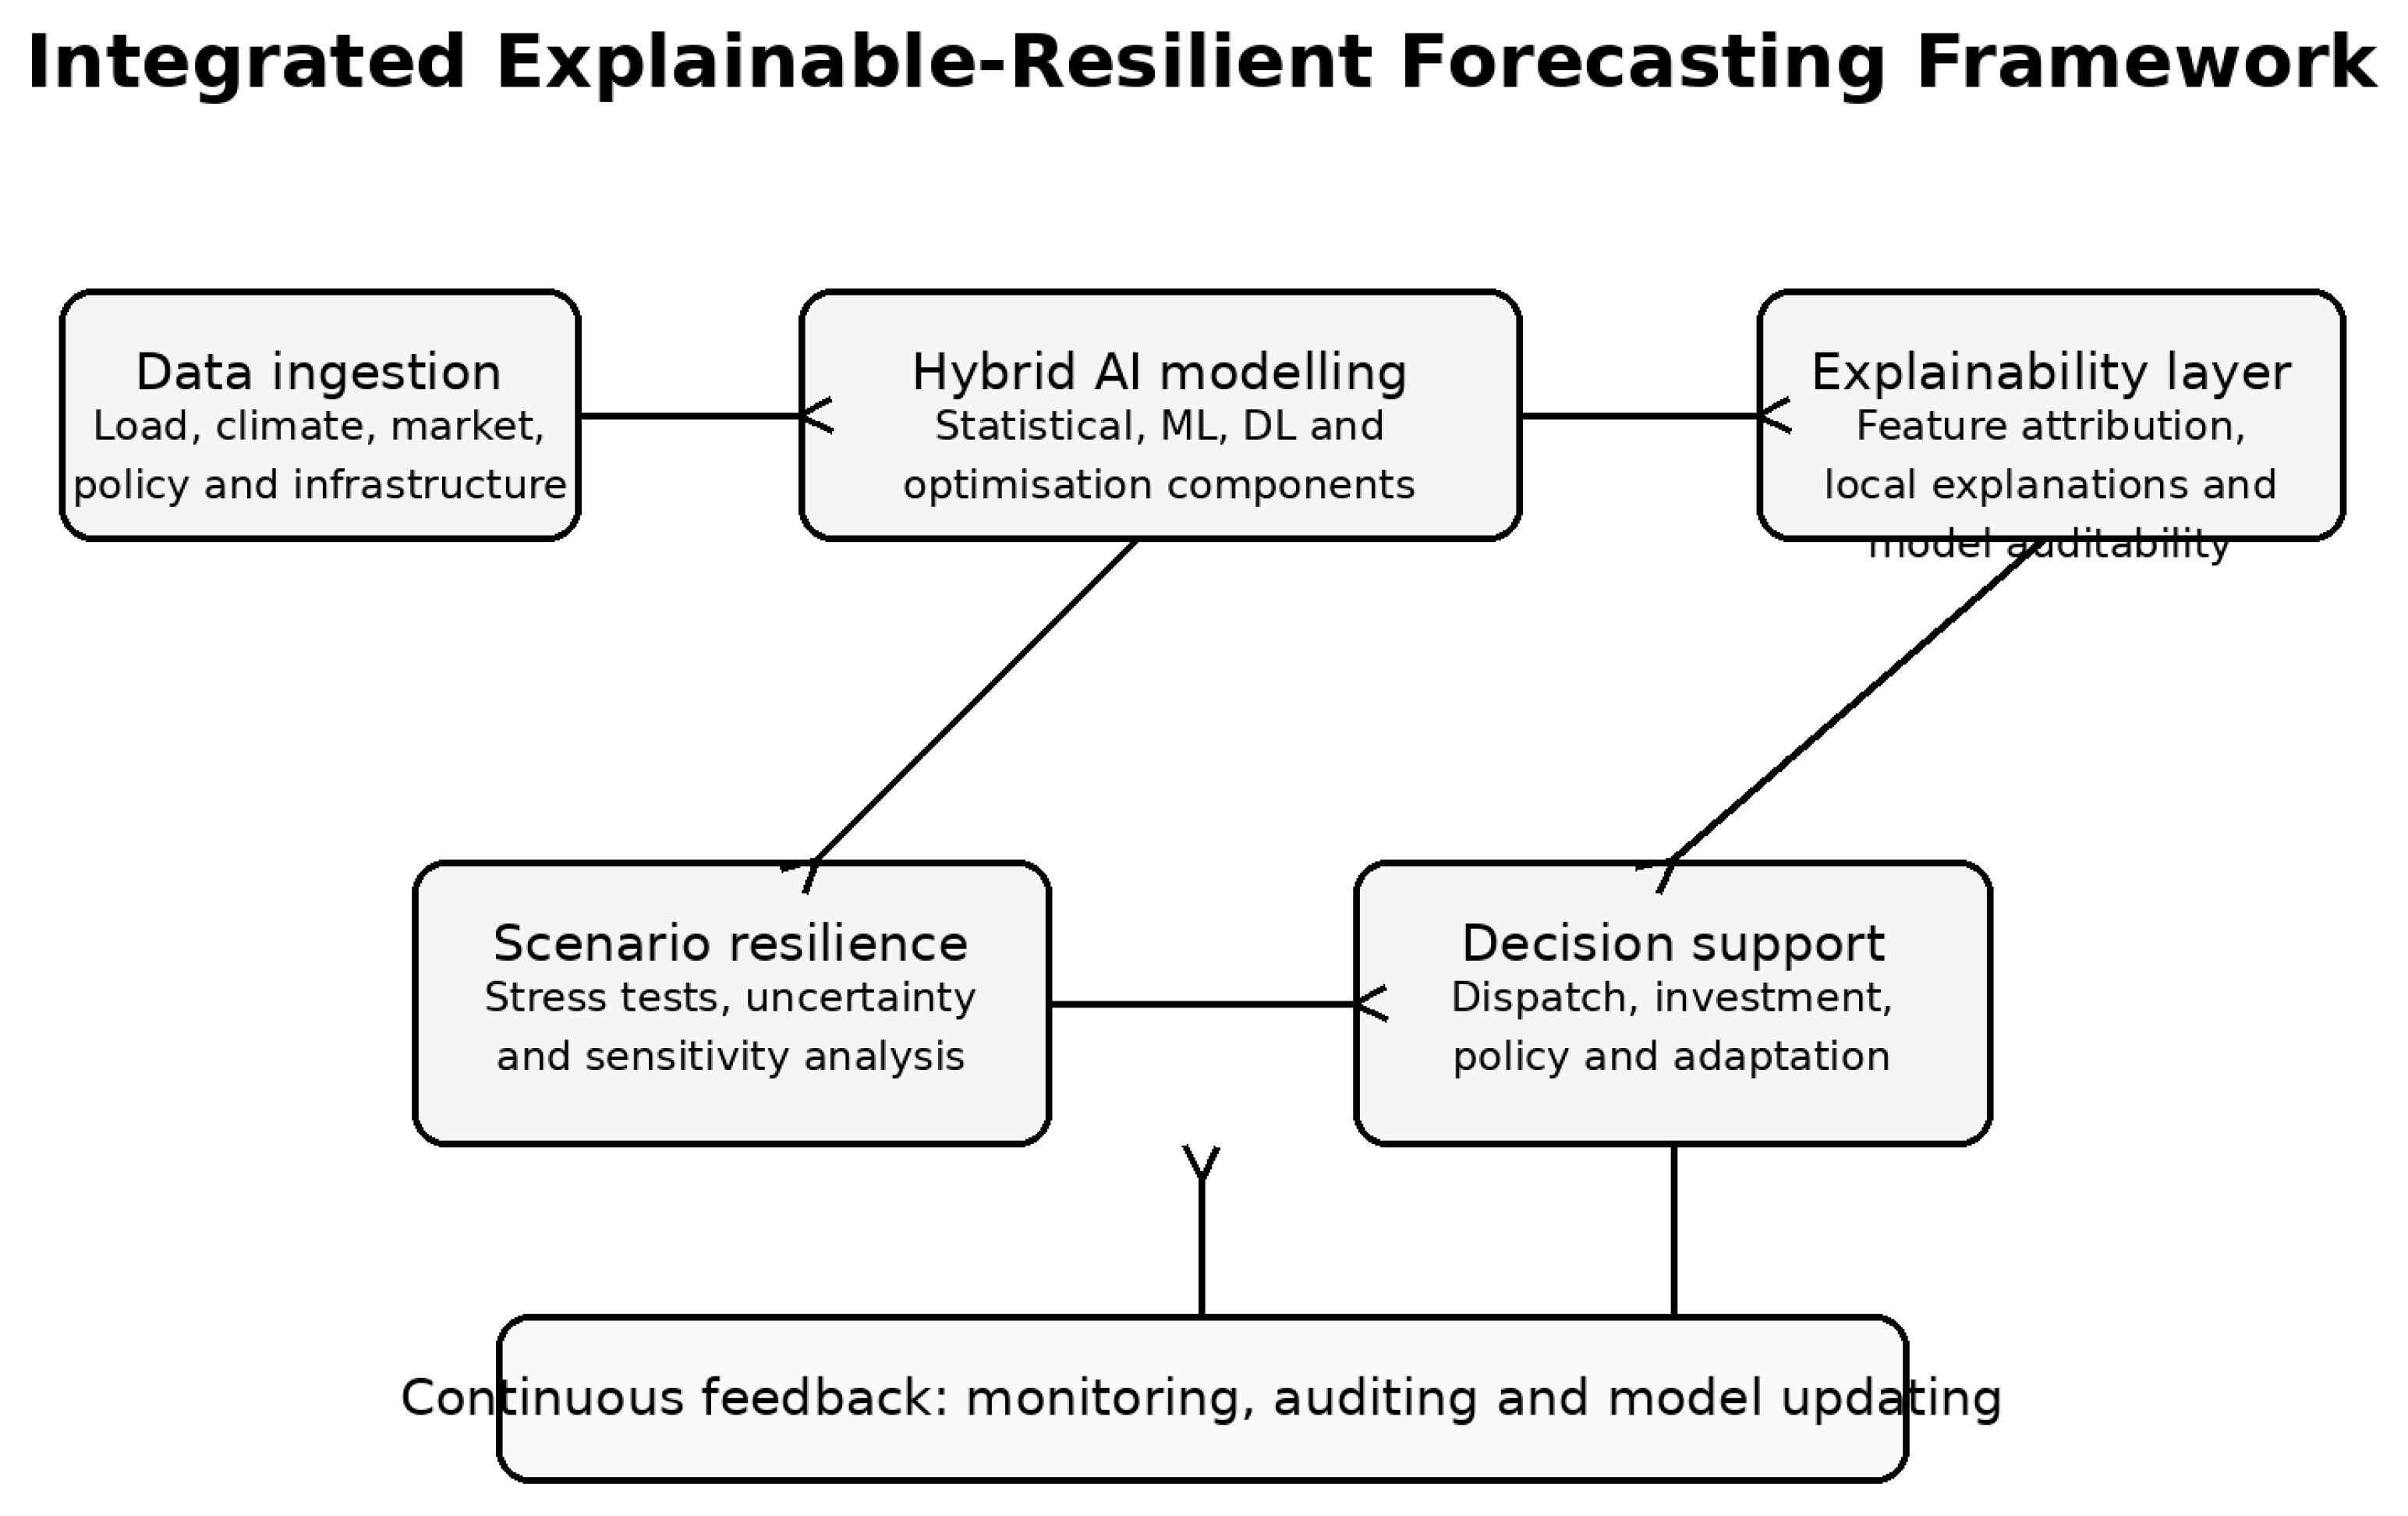
The reviewed evidence supports an Integrated Explainable-Resilient Forecasting Framework (Figure 2). The framework is not a new forecasting algorithm but a governance framework that specifies how data, models, explanations, stress tests, and decisions should interact. Its testable proposition is that a forecasting system evaluated jointly on accuracy, uncertainty calibration, explanation stability, and stress-test degradation provides more decision-relevant information than an accuracy-only pipeline, especially under unstable operating regimes.
Figure 2.
Conceptual architecture of the Integrated Explainable-Resilient Forecasting Framework.
Layer 1—Data ingestion and governance. The inputs are load histories and weather, calendar, socio-economic, price/market, infrastructure and policy variables, each with explicit timestamps. Processing includes validation of units and sampling frequency, missing-data diagnostics, temporal alignment, anomaly screening, provenance logging and feature-latency checks. The outputs are versioned modelling datasets and data-quality indicators that accompany each forecast.
Layer 2—Forecast generation. The inputs are the governed datasets and the declared forecast horizon. Candidate models include transparent statistical baselines, tree-based machine learning, recurrent/convolutional deep learning and hybrid ensembles. Models are selected on the basis of out-of-sample performance, calibration, computational cost and stability rather than training error. The outputs are point forecasts, prediction intervals or quantiles, model diagnostics and benchmark-relative performance.
Layer 3—Explanation and audit. The inputs are fitted models, forecast instances, and governed features. The outputs are global and local feature attributions, partial-dependence or sensitivity profiles, counterfactuals (where feasible) and explanation-stability diagnostics. SHAP/LIME-style explanations are interpreted as evidence of model behaviour, not of causality, and differences between explanations trigger manual review only when they amount to substantive conflicts.
Layer 4—Resilience and uncertainty testing. The inputs are forecasts, prediction intervals, and predefined stress scenarios. This layer introduces sensor anomalies, temporal misalignment, weather extremes, alternative tariff/policy assumptions, and distributional regime shifts. The outputs include relative error degradation, change in interval coverage, explanation drift, recovery requirements, and a scenario-specific resilience profile.
Layer 5—Decision support. The inputs are the forecast, uncertainty envelope, explanation summary, data-quality flags, and resilience profile. These are translated into operational or strategic actions, such as reserve allocation, demand response, procurement, tariff analysis, or investment planning. This layer should report both the “recommended action” and the “evidence” and conditions under which that action remains valid, so that human override and audit are possible.
Although the framework may be useful for smaller-scale, “islanded” or Mediterranean systems, the reviewed evidence does not establish these systems as a specifically validated application class. Their relevance is instead hypothesis-driven: explicit uncertainty and stress testing may be more valuable where seasonal tourism, renewable variability, interconnection constraints and limited data volumes coexist. These propositions should be tested on Mediterranean-type systems before any region-specific advantage is claimed.
The framework also calls for a different reporting format. Forecasting studies should report not only the selected algorithm and error metrics, but also data provenance, pre-processing, the approach to handling uncertainty, the approach to interpreting the forecast, scenario tests, and the governance use case. Such reporting would improve comparability across studies, enhance usability and strengthen engagement with practitioners. It would also reduce the risk of AI-based forecasting becoming a theoretical model-ranking exercise rather than a practical tool.
The operational evaluation has two phases. Phase A consists of retrospective testing against transparent statistical and machine-learning baselines using rolling-origin or blocked time-series validation. Phase B consists of prospective stress testing, in which data and system conditions are perturbed while the evaluation rules remain fixed. Beyond achieving lower or comparable MAE/RMSE/MAPE values, the framework must demonstrate calibrated uncertainty, stable explanations, bounded degradation under stress, and documented recovery procedures. This design makes the framework falsifiable: if the additional explainability and resilience layers do not improve decision-relevant diagnostics, or add complexity without measurable gain, the framework should not be preferred.
Illustrative use case. The protocol can be demonstrated using a reproducible half-hourly electricity-load dataset, such as the Energex data used in [1]. Historical load and weather/calendar variables are split into training, validation, and held-out test windows. A seasonal statistical baseline, a tree-based model and a temporal deep-learning model are estimated on the same folds. The best-performing candidate is explained using global and local attribution, probabilistic intervals are produced, and illustrative stress settings (rather than general thresholds) are applied: 5–20% missingness, a one-interval time shift, synthetic sensor spikes and an extreme-temperature subset. The framework is considered acceptable only if it achieves a competitive forecast error without loss of interval coverage, instability after retraining, or unbounded error degradation. This example does not introduce new empirical results; rather, it describes an evaluation protocol for the conceptual architecture that can be implemented with open data.
The framework also requires a clear distinction between explanation and causation. XAI methods can identify important features and local decision patterns, but they do not necessarily demonstrate causality. For instance, the importance of temperature in a given forecast may reflect direct cooling demand, correlated tourist activity, or a seasonal artefact in the data. Explainable forecasting should therefore be complemented by engineering, physical, economic and policy expertise on power and building systems. Accordingly, the proposed framework assumes human-in-the-loop interpretation rather than reliance on machine explanation alone. Contextual knowledge strengthens algorithmic evidence and enhances forecasting intelligence.
A further benefit is that the framework supports modular deployment. A utility with low data maturity may start with statistical baselines, simple machine-learning models and simple scenarios. A more advanced system can extend the pipeline with deep learning, digital twins, probabilistic ensembles and real-time anomaly detection. In both cases, the governance logic is the same: the system should document the data, the model, the reasons for the prediction, its uncertainty, and how the forecast changes under stress scenarios. This flexibility is necessary because energy systems differ in computational capacity, regulatory frameworks and data practices.
The design principles that follow from this framework are straightforward. Hybrid artificial intelligence addresses underfitting and weak generalisation by combining structural and non-linear modelling. Explainable artificial intelligence addresses black-box risk by making drivers and local behaviour inspectable. Scenario-based resilience testing addresses fragility by testing forecasts under plausible disruptions. Finally, governance feedback addresses institutional detachment by ensuring that model outputs are linked to learning, accountability and decision revision.
8. Discussion: Implications for Sustainability-Oriented Energy Systems Research
This review has implications for energy-system research, smart-grid design, and artificial-intelligence policy. The first implication is that contributions should not be assessed solely on the basis of algorithmic novelty. Novel architectures remain important, but they must solve real problems in energy systems. A small improvement in MAPE may be less valuable than enhanced interpretability, robustness to extreme events or better transferability to data-scarce environments. This is particularly relevant for sustainability-oriented energy-systems research, in which methodological rigour should be linked to repeatability, engineering applicability and system impact.
The second implication concerns evaluation. The proposed framework should be compared with conventional AI forecasting on at least four dimensions: predictive accuracy, interpretability, adaptability to changing regimes and resilience to uncertainty and data failure. The framework does not guarantee a lower point error; its intended benefit is informational. It reveals how a forecast changed, how much confidence can be placed in it, how far its performance deteriorates under stress, and whether it remains valid. Experts can then apply the same rubric (forecast error, interval coverage, explanation stability, stress-test degradation, auditability and decision usefulness) to an accuracy-only model and to the integrated framework, so that the two are compared on evidence rather than on architecture alone.
The third implication concerns data governance and implementation challenges. Technical barriers include heterogeneous sampling rates, missing data, sensor drift, model drift, cybersecurity exposure, computational requirements, and poor interoperability between forecasting and operational systems. Organisational barriers include unclear responsibility for automated recommendations, fragmented data ownership, limited ability to validate black-box models and reluctance to change existing dispatch or planning processes. Informational barriers include undocumented pre-processing, inconsistent metadata, uncertain feature latency, privacy restrictions and the lack of common reporting standards for uncertainty and model failure. These barriers are interdependent: even technically sound models become usable only when data provenance is robust, operators can interrogate model explanations, and decision rights are clearly defined. Model governance, data governance and organisational governance must therefore be considered together when deploying forecasting in smart grids.
The fourth implication concerns policy integration. Forecasting should not be an external technical service provided to policymakers but an integral part of the policy-development process. Load forecasts inform carbon-reduction strategies, electrification targets, time-based tariffs and demand-response policies. Such forecasts cannot be meaningfully debated unless the underlying forecasting models are understood. Explainable forecasting can thus strengthen democratic and institutional accountability by making the evidence used to inform energy decisions more transparent.
The fifth implication concerns staged implementation and validation. The framework should be implemented gradually rather than as a single wholesale replacement of existing forecasting systems. Implementation could begin with transparent baselines, followed by data-quality monitoring and uncertainty-reporting modules, and then XAI and stress-testing modules where these are shown to improve diagnosis or decision quality. Each more complex pipeline should be compared with the simpler pipeline using the same folds and operating conditions. This staged design avoids unnecessary computation, clarifies the marginal utility of each module and enables auditable model governance.
This review has several limitations. It is not an empirical study and does not demonstrate the superiority of the proposed architecture; it synthesises secondary evidence only. The historical screening log allows precise reconstruction of corpus counts and DOI-level evidence, but not of source-database record counts or reason-specific exclusion counts; these are therefore reported transparently without speculation. The core studies are heterogeneous in geography, target variables, forecasting horizons, study design, and validation, which precludes a defensible meta-analysis. Moreover, several adjacent studies provide contextual determinants rather than direct evidence on electricity-demand forecasting performance. Making these boundaries explicit strengthens rather than undermines the interpretation, because it prevents contextual evidence from being mistaken for direct comparative validation evidence. These non-recoverable historical elements preclude a claim of full systematic-review reproducibility; accordingly, the present article is reported as a structured retrospective narrative review, with PRISMA 2020 used only to map the recoverable review process transparently.
Several priorities for future research follow. Graph neural networks should be tested where network topology is substantively relevant, and consumption nodes interact. Federated learning offers a route to multi-utility or multi-building learning without centralising raw data, although its usefulness depends on robustness to non-IID data, communication cost and privacy accounting. Digital twins can provide an environment in which stress-test scenarios and forecast–control interactions can be explored, and large language models (LLMs) can help document, retrieve and explain scenarios for operators, but they should not serve as the definitive source of operational truth or numerical forecasts. In all four areas, the key research question is whether the technology improves validated decision quality, resilience and auditability, not merely whether it increases model complexity.
9. Conclusions
Although artificial intelligence has clearly advanced electricity-demand forecasting, the comparative evidence remains asymmetric: predictive accuracy is measured far more consistently than explanation quality, uncertainty calibration, transferability and resilience. The focused synthesis of 31 studies suggests that deep and hybrid models can perform strongly in data-rich environments, but only when supported by sustained data governance, clear validation procedures, and robust performance beyond the historical test distribution.
The key contribution of this review is therefore the operationalised Integrated Explainable-Resilient Forecasting Framework. The framework integrates governed multi-source data, benchmarked forecast generation, stable model explanation, uncertainty quantification, scenario-based stress testing and auditable decision support. Its added value lies not simply in improved point accuracy, but in a more comprehensive evidence package that shows what the model predicts, why it makes those predictions, how uncertain the predictions are, and how the system behaves under degraded data and operating conditions.
Future research should apply the framework to open operational datasets, compare it with accuracy-only pipelines using equivalent validation folds and jointly report forecast error, interval coverage, explanation stability and stress-test degradation. Context-specific claims, such as those concerning “Mediterranean” or “island” systems, must be directly tested and validated. Future extensions could explore digital twins, federated learning, graph neural networks and carefully controlled LLM-based operator interfaces.
The framework is intended to discipline expert judgement, not to replace it. In energy systems, forecasts should be contestable, traceable, and revisable. A forecasting architecture that is only marginally more accurate but cannot communicate uncertainty, withstand plausible data failures or be audited by human decision-makers is not necessarily the best operational choice.
Supplementary Materials
The following supporting information can be downloaded at: https://www.mdpi.com/article/10.3390/su182110976/s1, Table S1: PRISMA 2020 checklist. The archived DOI corpus, screening lists and structured evidence-extraction matrices used in this review are available from the authors upon request and can be provided as supplementary spreadsheets.
Author Contributions
Conceptualization, C.D., E.P. and M.P.; methodology, C.D. and C.P.; investigation, C.P.; validation, A.C. and M.P.; writing, original draft preparation, C.D. and C.P.; writing, review and editing, C.D., E.P., M.P. and A.C.; supervision, C.D. and M.P.; project administration, C.D. All authors have read and agreed to the published version of the manuscript.
Funding
This research received no external funding. The APC was funded by the Special Account for Research Grants of the University of West Attica.
Institutional Review Board Statement
Not applicable.
Informed Consent Statement
Not applicable.
Data Availability Statement
No new empirical energy data were generated. The review is based on published studies and on archived DOI and evidence-extraction matrices created for the doctoral project. These matrices contain the screening corpus and the study-level coding used in the present synthesis and are available from the authors upon reasonable request.
Conflicts of Interest
The authors declare no conflicts of interest.
References
- Ghimire, S.; Deo, R.C.; Casillas-Pérez, D.; Salcedo-Sanz, S.; Acharya, R.; Dinh, T. Electricity demand uncertainty modeling with Temporal Convolution Neural Network models. Renew. Sustain. Energy Rev. 2025, 185, 115097. [Google Scholar] [CrossRef] [Scilit]
- Almeida, V.R.; Soares, R.B.S. Extreme event counterfactual analysis of electricity consumption in Brazil: Historical impacts and future outlook under climate change. Energy 2023, 280, 128101. [Google Scholar] [CrossRef] [Scilit]
- Liu, X.; Zhang, X.; Liu, W.; Yang, F.; Chen, X.; Zhou, X. Energy consumption forecasting based on spatio-temporal behavioral analysis for demand-side management. Appl. Energy 2024, 359, 124027. [Google Scholar] [CrossRef] [Scilit]
- Alizadeh, M.; Mohammadi-Ivatloo, E.; Marzband, M.; Goudarzi, H. A hybrid long-term industrial electrical load forecasting model using optimized ANFIS with gene expression programming. Energy Rep. 2024, 10, 1283–1294. [Google Scholar] [CrossRef] [Scilit]
- Wang, M.; Wang, J.; Wang, X. A novel conformable fractional logistic grey model and its application to natural gas and electricity consumption in China. Renew. Energy 2025, 222, 122591. [Google Scholar] [CrossRef] [Scilit]
- Pahlavan, S.; Akgül, Y.; Akgun, O.T.; Welling, D.; Koepke, E.; Wagner, A. Deep learning hyperparameter optimization: Application to electricity and heat demand prediction for buildings. Energy Build. 2023, 281, 113036. [Google Scholar] [CrossRef] [Scilit]
- Almaharmeh, A.H.; Zhou, Y.; Yang, L.; El-Shafie, A. Deep neural network with empirical mode decomposition and Bayesian optimisation for residential load forecasting. Expert Syst. Appl. 2023, 234, 121355. [Google Scholar] [CrossRef] [Scilit]
- Salehi, A.; Fathi, M.; Hosseini, S.H. Global control of electrical supply: A variational-mode-decomposition-aided deep learning model for energy consumption prediction. Energy Rep. 2023, 9, 1987–2002. [Google Scholar] [CrossRef] [Scilit]
- Fonseca, J.P.; Bessa, R.J. A comparative framework for evaluating machine learning models in forecasting electricity demand for port microgrids. Energy AI 2025, 14, 100494. [Google Scholar] [CrossRef] [Scilit]
- Dan, Z.; Song, A.; Yu, X.; Zhou, Y. Electrification-driven circular economy with machine-learning-based multi-scale and cross-scale modelling approach. Energy 2024, 285, 131469. [Google Scholar] [CrossRef] [Scilit]
- Page, M.J.; McKenzie, J.E.; Bossuyt, P.M.; Boutron, I.; Hoffmann, T.C.; Mulrow, C.D.; Shamseer, L.; Tetzlaff, J.M.; Akl, E.A.; Brennan, S.E.; et al. The PRISMA 2020 statement: An updated guideline for reporting systematic reviews. BMJ 2021, 372, n71. [Google Scholar] [CrossRef] [Scilit] [PubMed]
- Zhang, S.; Zhang, Y.; Xu, X.; He, L.; Luo, X. A hybrid prediction model for heating load of buildings within residential communities considering occupancy rates. Energy Build. 2024, 313, 115220. [Google Scholar] [CrossRef] [Scilit]
- Zhang, R.; Feng, J.; Zhang, L.; Xu, W.; Li, G. Industrial added value prediction based on multi-source data from the perspective of electricity consumption. Procedia Comput. Sci. 2024, 234, 1075–1083. [Google Scholar] [CrossRef] [Scilit]
- Hussein, Z.A.; Kadhim, H.J.; Hussein, H.A.; Thajeel, H.M.; Al-Khayyat, R.R. Addressing energy challenges in Iraq: Forecasting power supply and demand using artificial intelligence models. Heliyon 2024, 10, e25821. [Google Scholar] [CrossRef] [Scilit] [PubMed]
- Nagaraj, R.; Vigneshwari, H.; Geethanjali, B.; Kumarappan, N.; Venkatesh, B. A systematic survey on demand response management schemes for electric vehicles. Renew. Sustain. Energy Rev. 2024, 182, 114748. [Google Scholar] [CrossRef] [Scilit]
- Hosseini, S.M.; Gholami, M.; Rajabi, S.; Ameli, M.T.; Arabzadeh, A. Predicting surface solar radiation using a hybrid radiative-transfer–machine-learning model. Renew. Sustain. Energy Rev. 2022, 167, 113105. [Google Scholar] [CrossRef] [Scilit]
- Malek, S.; Wan, K.; Li, X.; Cao, L.; Benatallah, B. A comparison study of predictive models for electricity demand in a diverse urban environment. Energy 2023, 263, 129142. [Google Scholar] [CrossRef] [Scilit]
- Khan, M.U.; Hassan, H.; Asim, M.; Iqbal, A.; Hussain, W. Optimization and loss estimation in energy-deficient polygeneration systems: A case study of Pakistan’s utilities with integrated renewable energy. Results Eng. 2025, 21, 104001. [Google Scholar] [CrossRef] [Scilit]
- Wang, L.; Chen, Z.; Rezaei, S. AI-enhanced automation of building energy optimization using a hybrid stacked model and genetic algorithms. Results Eng. 2025, 23, 104994. [Google Scholar] [CrossRef] [Scilit]
- Li, Y.; Liu, Y.; Shu, Y.; Li, C.; Wu, J. Exploring carbon dioxide emissions forecasting in China: A policy-oriented perspective using projection-pursuit regression and machine-learning models. Technol. Forecast. Soc. Change 2023, 191, 122872. [Google Scholar] [CrossRef] [Scilit]
- Moroni, F.; Mariscotti, A.; Facchini, A.; Spagnuolo, G. Energy demand prediction and scenario analysis for vehicle traction: A bottom-up approach applied to the Italian railway system. Energy Rep. 2025, 11, 1722–1738. [Google Scholar] [CrossRef] [Scilit]
- Kamal, M.A.; Ahmad, F.; Haq, M.Z. Advances in emerging digital technologies for energy efficiency and energy integration in smart cities. Energy Build. 2024, 300, 114289. [Google Scholar] [CrossRef] [Scilit]
- Tian, W.; Liu, X.; Yang, Z. Developing a bottom-up approach to assess energy challenges in urban residential buildings of China. Front. Archit. Res. 2025, 14, 03006. [Google Scholar] [CrossRef] [Scilit]
- Salehi, A.; Hosseini, S.H.; Malmir, B.; Fathi, M. Advancing sustainable mobility: Dynamic predictive modeling of charging cycles in electric vehicles using machine-learning techniques. Sci. Afr. 2024, 17, 200157. [Google Scholar] [CrossRef] [Scilit]
- Zhang, C.; Zhang, X.; Huang, Z.; Xie, Q.; Li, G. Investigating the impact of climate change and policy orientation on the energy–carbon–water nexus under multi-criteria analysis. Renew. Sustain. Energy Rev. 2023, 179, 114032. [Google Scholar] [CrossRef] [Scilit]
- Chen, H.; Wang, Z.; Zhang, X.; Gu, W.; Dong, Z.; Sun, M. Exploration of low-cost green transition opportunities for China’s power system under dual-carbon goals. J. Clean. Prod. 2023, 421, 137590. [Google Scholar] [CrossRef] [Scilit]
- Asaduzzaman, M.; Arifuzzaman, M.; Rahman, M.A.; Roy, R.B. Short-term load forecasting for microgrid energy management system using hybrid SPM-LSTM. Sustain. Cities Soc. 2023, 104, 104775. [Google Scholar] [CrossRef] [Scilit]
- Reda, F.; Liu, M.; Lien, K.H.; Østergård, T.; Hestnes, A.G. Interpretable data-driven building load profiles modelling for Measurement and Verification 2.0. Energy 2023, 284, 128490. [Google Scholar] [CrossRef] [Scilit]
- Zhang, X.; Cao, Y.; Jiang, Y.; Li, L.; Li, J. A multi-variable hybrid system for port container throughput deterministic and uncertain forecasting. Expert Syst. Appl. 2023, 238, 121546. [Google Scholar] [CrossRef] [Scilit]
- Meier, F.; Krayenhoff, M.; Middel, A.; Robinson, D. Advancements in coupling strategies for urban microclimate and building energy models. Renew. Sustain. Energy Rev. 2025, 188, 115790. [Google Scholar] [CrossRef] [Scilit]
- Zhang, W.; Zhao, Z.; Liu, Y.; Zhang, Y. Energy demand forecasting in China: A support-vector-regression–compositional-data second-exponential-smoothing model. Energy 2022, 255, 125955. [Google Scholar] [CrossRef] [Scilit]
- Keypour, R.; Rezvani, A.; Mardani, F. Prediction of electricity load generated by combined-cycle power plants using integration of machine-learning methods and HGS algorithm. Comput. Electr. Eng. 2024, 116, 109644. [Google Scholar] [CrossRef] [Scilit]

Disclaimer/Publisher’s Note: The statements, opinions and data contained in all publications are solely those of the individual author(s) and contributor(s) and not of MDPI and/or the editor(s). MDPI and/or the editor(s) disclaim responsibility for any injury to people or property resulting from any ideas, methods, instructions or products referred to in the content. |
© 2026 by the authors. Licensee MDPI, Basel, Switzerland. This article is an open access article distributed under the terms and conditions of the Creative Commons Attribution (CC BY) license.