


Abstract
Biomass-based energy transitions depend not only on resource availability but also on whether regional capabilities match the material and organisational requirements of different feedstocks. Using a balanced panel of 30 Chinese provinces during 2012–2022, this study treats New Quality Productive Forces (NQPF) as a proxy for regional productive and innovative capabilities and examines their association with five theoretical biomass resource potentials. Two-way fixed effects, a stacked province–resource–year model, a Mundlak Within–Between decomposition, province-specific trend checks, small-cluster inference, multiplicity adjustment, and a provincial diagnostic typology are combined to distinguish aggregate relationships, resource-specific heterogeneity, and persistent cross-provincial structure. Under the baseline entropy-weighted specification, aggregate NQPF is positively associated with theoretical carbon-mitigation potential, but the association is attenuated by province-specific trends and is not reproduced by equal-weight or PCA re-aggregations. At the resource level, New Modes–agricultural residues and New Industries–livestock manure retain nominal support under wild-cluster inference but not family-level multiplicity adjustment. The strongest multiplicity-adjusted evidence concerns overall cross-resource differentiation for New Drivers and is persistent between structural sorting for New Industries, whose long-term provincial mean is negatively associated with agricultural residues, forestry and orchard residues, livestock manure, and wastewater biomass and positively associated with municipal solid waste. Component-level patterns are therefore treated as exploratory. A 2022 four-quadrant typology further shows that capability–resource configurations are resource-specific, with livestock manure displaying the most gap-type configurations and municipal solid waste showing the strongest tendency toward same-direction capability–resource configurations. Capability–resource alignment is thus best treated as an ex ante screening condition rather than a causal or project-readiness measure; ecological retention, competing uses, lifecycle performance, circularity, logistics, finance, and governance remain necessary sustainability filters.
1. Introduction
Sustainable bioenergy transitions require more than identifying where biomass resources are abundant. Biomass can contribute to renewable energy supply, waste valorisation, and fossil energy substitution, but feedstocks differ sharply in their material properties, spatial concentration, collection requirements, and competing uses. Agricultural residues are dispersed and seasonal; forestry and orchard residues are sensitive to transport distance; livestock manure requires continuous treatment and nutrient management linkages; and wastewater and municipal solid waste depend on urban collection and treatment networks. These differences mean that the development value of a resource depends partly on whether local productive, organisational, technological, and infrastructural capabilities fit its requirements. Sustainability adds a further constraint: greater mobilisation is not inherently preferable if it undermines soil retention, nutrient cycling, lifecycle performance, or other resource uses.
Research on sustainability transitions increasingly treats regions as more than passive locations of technological change. Green-development pathways are shaped by inherited industrial structures, knowledge bases, institutions, labour skills, infrastructure, and cross-scalar linkages, so regions differ in both their transition opportunities and their capacity to act on them [1,2,3,4,5]. This perspective builds on the geography of sustainability transitions [6,7] and evolutionary accounts of regional assets and path dependence [8,9,10]. Regional capability is therefore better understood as a configuration of productive and innovative conditions than as a single measure of income or R&D intensity.
Bioenergy research has developed a complementary but largely separate line of inquiry around resource potential and supply chain feasibility. Resource assessments document pronounced geographical differences in agricultural, forestry, livestock, and urban waste streams [11,12,13,14,15,16], while supply chain studies show how feedstock density, seasonality, storage, transport, preprocessing, and facility location affect cost, resilience, and environmental performance [17,18,19,20]. These studies establish why biomass cannot be treated as a homogeneous resource, but they usually say less about whether the regional capabilities surrounding different feedstocks are equally favourable for mobilisation.
China’s bioenergy transition is also embedded in a heterogeneous policy and governance environment. Recent evidence shows that renewable energy outcomes depend not only on policy intensity but also on the combination of policy instruments across provinces and the degree of coordination between central and local governments [21,22]. For biomass specifically, subsidy design can reshape incentives along feedstock supply chains, while the gradual withdrawal of fiscal support raises questions about local fiscal capacity, enterprise adaptation, and market self-sustainability [23,24]. These findings reinforce the distinction between physical resource potential and the wider regional capabilities and institutional conditions required to mobilise biomass resources effectively.
Bringing these strands together raises a set of related empirical questions. A region may possess strong innovation or organisational capacity without having abundant land-based biomass, while urban infrastructure may coincide with wastewater and municipal waste rather than agricultural or forestry resources. Aggregate relationships can therefore conceal resource-specific patterns. They can also mix two statistically distinct sources of variation: persistent cross-regional co-location created by long-term resource, industrial, and urban structures, and within-province co-movement during the sample period. Finally, even a favourable resource–capability combination should be interpreted as an enabling condition rather than as proof of sustainability, because ecological retention, competing uses, transport requirements, and lifecycle emissions may alter the desirability of resource mobilisation. Resource type, territorial structure, and sustainability boundaries therefore need to be considered together.
China provides a useful setting in which to examine these issues because provinces differ markedly in agricultural and forestry production, livestock systems, population concentration, urban waste streams, and productive structures. New Quality Productive Forces (NQPFs) span the digital economy, rural industrial integration, production organisation, energy and materials, data factors, R&D and innovation, new types of workers, and infrastructure and production tools [25]. We do not treat NQPF as a direct measure of biomass-development capability. Instead, it is used as an empirical proxy for provincial productive and innovative capabilities, allowing us to ask how multidimensional regional capabilities are associated with heterogeneous biomass resource bases and whether those relationships reflect persistent territorial structure or within-region change.
The empirical strategy follows this question in linked stages. Two-way fixed-effects models first relate aggregate NQPF and its three first-level dimensions to overall carbon-mitigation potential (CMP). A stacked province–resource–year model then estimates directly comparable slopes across five bioenergy potentials (BEPs). A Mundlak correlated-random-effects specification separates within-province deviations from persistent between-province structure, while eight second-level capability components provide exploratory diagnostics. Province-specific and province–resource-specific trends, wild-cluster bootstrap inference, multiplicity adjustments, lagged specifications, wastewater exclusion, flexible control slopes, and alternative re-aggregation are used to define the sensitivity and measurement boundaries of the main evidence. Finally, a four-quadrant provincial typology operationalizes capability–resource alignment as an ex ante screening device.
This paper connects two studies that are often treated separately: the geography of regional transitions and the material geography of biomass resources. Its central contribution is the concept of capability–resource alignment, which shifts attention from whether a region is generally ‘advanced’ to whether particular productive and innovative capabilities are compatible with the biomass resources actually present there. Empirically, the resource-specific panel design and Within–Between decomposition show that capability–resource associations vary across feedstocks and across sources of variation, while stricter small-cluster and multiplicity-adjusted inference distinguishes evidence retained under stricter inference from localized or exploratory patterns. For planning, the framework functions as an ex ante diagnostic for differentiated regional bioenergy pathways, and the revised analysis further translates it into a resource-specific provincial typology. The empirical analysis focuses on province-level capability–resource relationships; cross-provincial network interactions and spillover processes are outside the scope of the present design. Ecological retention, circular resource use, lifecycle performance, competing uses, and governance constraints remain outside the estimated alignment measure and therefore require separate sustainability assessment.
2. Theoretical Background and Research Questions
2.1. Place-Based Sustainability Transitions and Regional Capabilities
Sustainability transitions are inherently place-embedded. Green development paths depend on regional knowledge bases, industrial structures, firm networks, labour skills, infrastructure, and institutions [6,7]. Recent work further shows that regional transitions emerge from interactions among inherited assets, actor capabilities, and cross-scalar linkages, while rural transitions require alignment with local resources and policy mixes [1,2,3,26]. For bioenergy, similar resource quantities therefore need not imply similar development readiness: dispersed feedstocks must be connected to production organisation, technology absorption, infrastructure, and cross-actor coordination.
Regional capabilities are also cumulative and path-dependent. Industrial structures, skills, infrastructure, and institutions form durable assets that shape the emergence and recombination of green activities [4,8]. Capability–resource relationships may therefore contain two statistically distinct sources of variation: persistent cross-provincial structure shaped by resource endowments, industrial systems, and urbanisation, and deviations within the same province during the sample period. Separating these sources distinguishes durable territorial context from within-province co-variation without assigning a causal time-scale interpretation to either component.
2.2. Material Heterogeneity of Biomass Resources and Resource-Specific Supply Chain Requirements
Biomass resources are materially heterogeneous: many have low energy density or high moisture content and are spatially dispersed, seasonal, or perishable. Their energy use depends on collection radius, transport and storage, preprocessing, treatment facilities, and organisational coordination. Feedstock quantity and quality, inventory decisions, transport networks, and facility location jointly influence supply chain stability and sustainability [17,18]. The constraints also vary by resource: agricultural residues require seasonal collection and storage; forestry and orchard residues are transport-sensitive; manure requires continuous treatment; and wastewater and municipal solid waste depend more strongly on urban collection and treatment networks.
No single directional relationship between capability and resource potential should therefore be assumed. Industrialised and urbanised regions may possess stronger organisational and infrastructural capabilities without having more land-based resources, while population concentration may co-locate with urban waste streams. The same capability can thus relate differently to different resources, and the same resource can require several capabilities. We term these jointly conditioned relationships resource-contingent associations and treat them as empirical manifestations of capability–resource alignment. The corresponding material attributes, major supply-chain requirements, and theoretically relevant regional capabilities of the five biomass resource types are summarized in Table 1.
Table 1.
Material attributes, major supply chain requirements, and theoretically relevant regional capabilities of five biomass resource types.
2.3. Capability–Resource Alignment and Resource-Contingent Associations
Resource-specific collection, storage, transport, processing, and organisational requirements provide the theoretical basis for variation in capability–resource relationships. These supply chain stages are not directly observed and are not treated as identified mediators. BEP and CMP represent theoretical resource and substitution potential rather than realised collection, logistics efficiency, project output, or lifecycle mitigation. The estimated coefficients therefore describe conditional associations between capabilities and resource bases. They diagnose the starting conditions for local bioenergy development but do not identify how theoretical resources are converted into realised energy output.
The three first-level NQPF dimensions capture different combinations of industrial foundations, production organisation, factor allocation, innovation, and infrastructure. If NQPF represented only general development, their slopes should be broadly similar across the five resources. Resource-contingent relationships instead imply different directions or magnitudes. We therefore estimate both aggregate and resource-specific relationships and formally test cross-resource equality.
These considerations motivate the first two research questions.
Research Question 1: Is aggregate regional capability associated with aggregate theoretical bioenergy carbon mitigation potential after accounting for province and year fixed effects?
Research Question 2: Do capability–resource associations differ across biomass resource types?
Figure 1 summarises the analytical logic, empirical evidence chain, and interpretive boundaries of the study. Heterogeneous biomass resources are first distinguished by their material attributes and supply chain requirements, while regional productive and innovative capabilities are proxied by NQPF and its three dimensions. The empirical evidence proceeds from descriptive capability evolution (Figure 2) to the spatial evolution and resource composition of biomass carbon mitigation potential (Figure 3), then to the diagnostic typology and its empirical distribution in 2022 (Figure 4), and finally to resource-specific provincial alignment patterns (Figure A1). Robustness and inference are further supported by a series of sensitivity analyses, including alternative fixed-effects specifications, Mundlak/CRE decomposition, wild bootstrap inference, multiplicity adjustment, re-aggregation, lag specification, wastewater exclusion, and flexible-slope tests. The framework also clarifies that capability–resource alignment is an ex ante descriptive screening tool rather than a causal classification or project readiness assessment, and that sustainability and implementation conditions must be evaluated separately.
Figure 1.
Analytical framework and evidence chain of regional capability–resource alignment and heterogeneous biomass resources.
Figure 2.
(a). Three-dimensional kernel density evolution of aggregate NQPF. (b). Long-term average provincial capability structures.
Figure 3.
Provincial spatiotemporal evolution and national resource composition of biomass carbon-mitigation potential.
Figure 4.
Provincial capability–resource alignment diagnostic typology and its empirical distribution in 2022. (a) Four-quadrant diagnostic framework. (b) Distribution of provincial configurations across five biomass resource types.
2.4. Sources of Variation in Capability–Resource Relationships
We distinguish persistent between-province structural association from within-province temporal co-variation. The former refers to co-location, in long-term provincial means, among resource endowments, industrial systems, urban structures, and regional capabilities; the latter captures deviations from each province’s own long-term mean during the sample period. Both are statistical associations rather than causal effects, and neither should be interpreted as a spatial spillover effect.
This distinction follows the Within–Between logic of Mundlak [27] and related random-effects formulations that explicitly model contextual heterogeneity [28]. The Between component captures relationships among long-term provincial means, whereas the Within component captures deviations from each province’s own long-term mean. Divergent coefficients imply that a single average relationship may not adequately represent both sources of variation, but the comparison does not identify causal effects at distinct horizons.
This distinction motivates the third research question.
Research Question 3: Do capability–resource associations based on within-province variation differ from those observed across provinces’ long-term means? Empirically, we address this question by formally testing whether the corresponding resource-specific Within and Between coefficients are equal.
3. Data, Variables, and Methods
3.1. Sample and Data Sources
We construct a balanced panel of 30 Chinese provincial-level regions for 2012–2022, yielding 330 province–year observations. Hong Kong, Macao, and Taiwan are excluded because of incompatible statistical coverage, and Tibet because key socioeconomic variables are continuously missing. Resource and socioeconomic data are drawn mainly from the China Statistical Yearbook, China Agriculture Statistical Yearbook, China Energy Statistical Yearbook, and related official sectoral sources. A common period and harmonised resource conversion conventions are used across provinces to preserve comparability, particularly for the Within–Between decomposition.
The province is the unit of analysis because both the capability indicators and the harmonised biomass resource series are consistently available at this level over 2012–2022. The resulting estimates therefore characterise province-level capability–resource relationships. They do not resolve sub-provincial variation in feedstock density, transport accessibility, facility location, competing uses, or environmental constraints.
Aggregate models use theoretical biomass carbon-mitigation potential (CMP), that is, the CO2 reduction implied by substituting fossil-based electricity with five biomass resources under a common coal-power benchmark and specified conversion parameters. Resource heterogeneity models use resource-specific bioenergy potential (BEP), obtained by converting utilisable quantities into standard-coal equivalents (104 tce). CMP captures aggregate resource–environment potential, whereas BEP preserves differences among agricultural residues, forestry and orchard residues, livestock manure, wastewater biomass, and municipal solid waste.
3.2. Variable Measurement
3.2.1. Outcome Variables: BEP and CMP
Resource accounting follows a common sequence from raw quantity to utilisable quantity, standard-coal equivalent, and substitution-based mitigation potential. Each resource is quantified using resource-specific statistical bases and collection/utilisation and conversion parameters and converted to standard-coal equivalents to obtain BEP; aggregate CMP is derived from potential electricity output under a common coal-power substitution boundary. The complete parameter set is reported in Appendix A (Table A1, Table A2, Table A3, Table A4 and Table A5), including crop- and residue-specific generation ratios, collection coefficients, standard-coal conversion coefficients, livestock manure and biogas parameters, wastewater and municipal solid waste parameters, power generation efficiencies, and emission factors. These coefficients are applied uniformly across provinces and years. Both measures are theoretical potentials and exclude realised collection, installed capacity, project efficiency, and market realisability. Regression coefficients therefore describe conditional capability–resource associations rather than realised conversion effects.
3.2.2. Core Explanatory Variable: NQPF and Capability Dimensions
NQPF characterises provincial productive and innovative capabilities through an aggregate index, three first-level dimensions, and eight second-level components. The term New Industries comprises the digital economy and rural industrial integration; New Modes comprises production organisation, energy and materials, and data factors; and New Drivers comprises R&D and innovation, new types of workers, and infrastructure and production tools (Table 2). The aggregate index is used in the baseline model, the three dimensions in resource and Within–Between analyses, and the eight components in diagnostic analysis.
Table 2.
Hierarchical structure of the NQPF-based regional capability indicators.
The NQPF measure is organised hierarchically into three capability dimensions, eight second-level components, and 34 underlying indicators. Appendix B reports the complete indicator list, definitions, data sources, directions, and the eight component entropy weights. All 34 underlying indicators are benefit-type indicators. For each indicator, min–max normalization is conducted over the common 2012–2022 province–year sample as z = (x − min x)/(max x − min x). The normalized indicators are combined into the eight second-level component scores following the stated indicator hierarchy; the entropy-weight procedure is then applied to these component scores by calculating each observation’s relative share, information entropy, the corresponding information divergence coefficient, and finally normalized component weights that sum to one. The eight final component weights are 0.07169 (digital economy), 0.04920 (rural industrial integration), 0.07292 (production organisation), 0.08242 (energy and materials), 0.18420 (data factors), 0.25005 (R&D and innovation), 0.07735 (new types of workers), and 0.21217 (infrastructure and production tools). These are component-level weights rather than raw indicator-level final weights. A common full-sample weighting structure is applied across years to preserve intertemporal comparability. No NQPF indicator directly reuses the crop production tonnage or livestock headcounts that mechanically determine corresponding BEP quantities; however, several rural industrial integration indicators reflect agricultural structure, land use, or rural population scale, so mechanical overlap is reduced but conceptual correlation cannot be ruled out. Descriptive statistics use the original 0–1 indices; regressions use pooled-sample z-standardised capability measures. Because fixed-effects estimates are identified from within-province variation, substantive effect size interpretations are additionally expressed on the within-province standard deviation scale.
3.2.3. Control Variables
Controls include the log of regional GDP per capita, log population, energy consumption structure, environmental regulation, industrial structure, urbanisation, and openness (Table 3). Their definitions are held constant across models unless stated otherwise.
Table 3.
Definitions and analytical roles of the main variables.
3.3. Econometric Specifications
The present empirical design focuses on province-level capability–resource associations and the distinction between within-province variation and persistent between-province differences. It does not explicitly estimate interprovincial spillover effects. Potential cross-regional processes, such as knowledge diffusion, production linkages, and biomass movements, are not directly observed and may operate through different spatial or network structures; accordingly, no single spatial weighting structure is imposed. The empirical strategy is designed to estimate conditional associations rather than causal effects. Province fixed effects absorb time-invariant provincial heterogeneity, year fixed effects account for common shocks, and observed controls capture several time-varying socioeconomic factors, but unobserved time-varying factors, joint regional development processes, and feedback between regional development and capability formation cannot be ruled out.
3.3.1. Aggregate Fixed-Effects Baseline
The aggregate baseline is a two-way fixed-effects model with province and year effects (Equation (1)). We first estimate the association between aggregate NQPF and CMP and then jointly enter the three first-level dimensions to examine internal differentiation.
ln(CMPit) = α + βCit + γ′Xit + μi + λt + εit
In Equation (1), i and t index province and year, respectively; CMPit denotes theoretical biomass carbon-mitigation potential; Cit is the standardised capability measure, defined as either aggregate NQPF or one of the three first-level capability dimensions; Xit is the vector of control variables; μi and λt denote province and year fixed effects, respectively; and εit is the idiosyncratic error term. The coefficient β measures the conditional association between regional capability and CMP after province and year effects and observed controls are accounted for.
3.3.2. Resource-Type Heterogeneity and Cross-Resource Equality Tests
To test resource heterogeneity, the five BEP series are stacked into a province–resource–year panel (Equation (2)), yielding 1650 observations. Interactions between capability dimensions and resource indicators estimate directly comparable resource-specific slopes within one model and permit formal equality tests across resources.
In Equation (2), r indexes resource type, k indexes the three first-level capability dimensions, s indexes the five resource categories, and m indexes the M control variables. Dsr is an indicator equal to 1 when resource observation r belongs to category s. The coefficients βks are the resource-specific capability slopes, while γms allow the slope of each control variable to vary by resource type. ηir denotes province-by-resource fixed effects, τrt denotes resource-by-year fixed effects, and εirt is the error term. Standard errors are clustered at the province level.
3.3.3. Mundlak/CRE Within–Between Decomposition
We use a Mundlak correlated random-effects (CRE) decomposition to separate within-province deviations from persistent between-province structure. The specification follows the Mundlak approach of representing the correlation between observed regressors and unobserved unit heterogeneity through unit-level means, while retaining a random-effects representation for estimation and Within–Between comparison [27,29,30]. We use the CRE framework primarily as a decomposition rather than as an independent replication of the fixed-effects estimates.
In Equation (3), Ckit is the observed value of capability dimension k for province i in year t, and is province i’s 2012–2022 mean for that capability dimension. The Within component is , whereas the Between component is . These two components are then entered into Equation (4).
In Equation (4), the resource-specific Within and Between capability slopes capture, respectively, associations based on deviations from provincial long-term means and differences across provincial long-term means. The corresponding Within and Between terms for the controls are included, together with a province-by-resource random intercept and resource-by-year fixed effects. For each capability–resource combination, we formally test equality of the Within and Between coefficients. Importantly, the Between component captures persistent differences across provinces but does not represent spatial dependence or spillover effects between provinces.
3.3.4. Second-Level Capability Component Diagnostics
The three first-level dimensions are further decomposed into eight components—digital economy, rural industrial integration, production organisation, energy and materials, data factors, R&D and innovation, new types of workers, and infrastructure and production tools. Resource-specific slopes and cross-resource joint tests are used as exploratory diagnostics for whether first-level patterns can be localised to narrower capability elements. Because the component analysis involves many related hypotheses, individual component coefficients are not treated as confirmed pathways unless they remain supported after the multiplicity adjustments described below. The analysis is diagnostic rather than a mediation analysis because the components are not identified transmission mechanisms.
3.3.5. Provincial Capability–Resource Diagnostic Typology
To operationalize capability–resource alignment as an ex-ante planning diagnostic, we construct a four-quadrant provincial typology for 2022. Provinces are classified according to whether their NQPF level is above or below the 2022 national median and whether the corresponding theoretical BEP is above or below the resource-specific provincial median. This yields four relative configurations: co-advantage, capability gap, resource gap, and dual constraint. The median thresholds provide a transparent and outlier-resistant relative classification. The typology is descriptive and is not interpreted as a project-readiness score, a causal classification, or a measure of realised bioenergy utilisation.
3.4. Inference and Sensitivity Strategy
Robustness and sensitivity checks address six issues. First, because inference is based on only 30 province clusters, conventional province-clustered standard errors are supplemented with 9999-repetition wild-cluster bootstrap inference for the 15 first-level capability–resource slopes and the three cross-resource joint equality tests, following recent guidance on finite-cluster inference [31,32,33,34]. Second, multiplicity is addressed using Holm family-wise error adjustment and Benjamini–Hochberg false-discovery-rate adjustment within pre-specified hypothesis families covering first-level slopes, component slopes, CRE Within slopes, CRE Between slopes, Within–Between equality tests, and first- and second-level joint resource-equality tests. Third, capability variables are lagged one year. Fourth, the aggregate model is re-estimated with province-specific linear trends and the stacked model with province–resource-specific linear trends to assess sensitivity to persistent medium-term trajectories. Fifth, key models are re-estimated after excluding wastewater and under alternative control-slope structures. Sixth, equal-weight and PCA re-aggregations of the eight component scores test sensitivity to internal index composition. These checks define robustness boundaries; none is interpreted as a causal identification strategy. Statistical analyses were conducted using Stata/MP 17 (64-bit) (StataCorp LLC, College Station, TX, USA), while spatial mapping and figure preparation were performed using ArcGIS Pro 3.4.2 (Esri, Redlands, CA, USA), MATLAB R2024b (The MathWorks, Inc., Natick, MA, USA), and PyCharm Community Edition 2023.3.7 (JetBrains s.r.o., Prague, Czech Republic).
4. Empirical Results
4.1. Evolution of NQPF and Regional Capability Differences
Figure 2a describes the joint distribution of NQPF and year over 2012–2022. The high-density region shifts generally from lower toward medium and higher NQPF values, while peak height, tails, and distributional width also change. The figure is therefore descriptive rather than a test of pairwise temporal differences.
Figure 2b shows long-term provincial means for the three standardised capability dimensions. Several eastern regions score highly on multiple dimensions, but capability structures remain uneven. Between-province variation dominates within-province variation: between standard deviations for New Industries, New Modes, and New Drivers are 0.966, 0.957, and 1.001, compared with within standard deviations of 0.310, 0.336, and 0.168. The especially limited within variation of New Drivers foreshadows lower precision in its Within estimates and motivates both dimensional analysis and the Within–Between decomposition.
Table 4 confirms substantial variation in both capabilities and resources. Aggregate NQPF averages 0.218; New Industries and New Modes have higher means than New Drivers. Agricultural residue BEP is by far the largest resource component, while CMP averages 3780.40 × 104 t CO2 and is highly dispersed across provinces. This variation supports analysis beyond aggregate measures.
Table 4.
Descriptive statistics of the main variables (N = 330).
4.2. Spatiotemporal Evolution and Resource Composition of Biomass Carbon Mitigation Potential
Figure 3 shows provincial spatial patterns and national resource composition. Total theoretical biomass CMP increases from approximately 1040.18 million tonnes of CO2 in 2012 to 1230.26 million tonnes in 2022, representing an 18.3% increase. The spatial pattern is persistent: Heilongjiang, Henan, and Shandong remain in the high-value group, and major agricultural provinces in Northeast China and the Huang–Huai–Hai region form a stable high-potential belt. More visible increases in Inner Mongolia, Guangxi, and several other regions indicate local reordering within this persistent structure.
Agricultural residues remain dominant, although their share falls from 73.6% to 71.1% between 2012 and 2022. Forestry/orchard residues rise from 11.7% to 14.2%, wastewater plus municipal solid waste from 6.6% to 7.9%, and livestock manure falls from 8.2% to 6.8%. In absolute terms, forestry/orchard and urban water/waste components grow much faster than agricultural residues. Aggregate growth therefore reflects changing resource composition rather than proportional expansion across feedstocks.
These patterns motivate the subsequent models: persistent high-CMP regions indicate an important historical and resource endowment component, while divergent resource trajectories show why aggregate totals can mask heterogeneity. We therefore retain CMP for the baseline and use five resource-specific BEPs plus Within–Between decomposition for the main heterogeneity analysis.
4.3. Aggregate Capability–Potential Association
Table 5 shows a positive aggregate association under the baseline fixed-effects specification. The NQPF coefficient is 0.0682 without controls and 0.0772 after controls (SE = 0.0257, conventional p = 0.005), and the point estimate is not materially altered by the observed socioeconomic controls. Because NQPF is standardised using the pooled province–year sample, 0.0772 corresponds to an approximately 8.0% conditional difference in CMP for a one pooled-sample standard deviation increase. Fixed-effects identification, however, relies on substantially smaller within-province variation. The within-province standard deviation of the standardised NQPF measure is 0.179, implying that a one within-province standard-deviation change corresponds to an approximately 1.4% conditional difference in CMP. We therefore use the within-standard-deviation scale for substantive interpretation of the fixed-effects magnitude.
Table 5.
Aggregate fixed-effects regression results.
When the three capability dimensions are entered jointly, only New Modes is individually significant (β = 0.0323, SE = 0.0089, p < 0.01); confidence intervals for New Industries and New Drivers include zero. This does not constitute a formal test of coefficient differences, but it indicates that the aggregate NQPF relationship is not expressed uniformly across dimensions and motivates the resource-specific analysis.
4.4. Three Capability Dimensions and Five Resources: Resource-Specific Associations
The stacked fixed-effects model yields 15 resource-specific point estimates (Table 6). Small-cluster and multiplicity-adjusted inference narrows the set of individually supported slopes. The New Modes–agricultural residue and New Industries–livestock manure slopes remain nominally supported under wild-cluster inference, whereas the New Drivers–agricultural residue slope does not. At the dimension level, only the New Drivers cross-resource joint test remains significant under wild-cluster inference and family-level multiplicity adjustment. We therefore distinguish localized point estimates from evidence of overall resource differentiation.
Table 6.
Resource-type heterogeneity results (dependent variable: ln BEP).
4.4.1. New Industries and Livestock-Manure Potential
New Industries is positively associated with livestock-manure potential in the main specification (β = 0.0754, SE = 0.0297, conventional p = 0.017), and the association remains nominally supported under wild-cluster inference (p = 0.0465). However, it does not survive correction across the 15 first-level capability–resource slopes. Moreover, the conventional cross-resource equality test (p = 0.0177) is not retained under wild-cluster bootstrap inference (p = 0.1348). We therefore interpret the livestock manure coefficient as a localized association rather than as statistically retained dimension-wide resource heterogeneity.
4.4.2. New Modes and Agricultural Residue Potential
For New Modes, the agricultural residue slope remains positive under wild-cluster inference (β = 0.0437, conventional p = 0.008, wild-bootstrap p = 0.0176). This coefficient does not survive family-level multiplicity adjustment, and the dimension-level cross-resource equality test is not supported under wild-cluster inference (p = 0.3186). The Within–Between equality test for this relationship is also not significant (p = 0.191), so the evidence does not support a claim of Within-component predominance. Moreover, no single second-level New Modes component reproduces the first-level agricultural residue association after multiplicity adjustment. We therefore treat this as a localized, model-dependent association whose mechanism remains unverified.
4.4.3. New Drivers and Agricultural Residue Potential
New Drivers exhibits the clearest evidence of overall cross-resource differentiation. Although the agricultural residue point estimate is comparatively large (β = 0.2426), its individual wild-cluster bootstrap p-value is 0.1279. By contrast, the joint null of equal slopes across the five resources remains rejected under wild-cluster inference (p = 0.0096) and after both Holm and BH-FDR adjustment (adjusted p = 0.0288). We therefore interpret New Drivers as displaying resource-dependent association patterns overall, without attributing this evidence to a statistically confirmed agricultural residue slope in isolation.
4.5. Structural Sorting and Within-Province Co-Variation: Within–Between Decomposition
Table 7 places Within and Between coefficients side by side. The clearest structural contrast concerns New Industries: its Between coefficients are negative for agricultural residues, forestry and orchard residues, livestock manure, and wastewater biomass, and positive for municipal solid waste, whereas the corresponding Within coefficients are much smaller. Multiplicity-adjusted evidence is concentrated in the Between component. For New Modes and agricultural residues, the Within estimate is positive, but the formal Within–Between equality test does not reject equality (p = 0.191); the association is therefore not interpreted as showing a statistically greater Within than Between association.
Table 7.
Resource-specific Within and Between slopes for the three capability dimensions.
4.5.1. Within-Province Capability–Resource Associations
Under the parsimonious CRE specification with common control slopes, the Within estimate for the New Modes–agricultural residue relationship is 0.0454. When resource-specific control slopes are allowed, the Within coefficient is 0.0437, matching the main fixed-effects estimate. This equivalence is expected because both specifications then rely on the same within-province identifying variation and a comparable resource-specific slope structure. The CRE framework is therefore used to place the Within association alongside the corresponding Between estimate rather than as an independent replication of the fixed-effects result. More generally, no individual Within slope remains significant after family-level multiplicity adjustment, so the Within estimates are interpreted as descriptive within-province co-variation rather than confirmed dynamic effects.
4.5.2. Between-Province Structural Sorting
The Between component indicates the clearest persistent structural contrast for New Industries: its provincial long-term mean is negatively associated with agricultural residues, forestry/orchard residues, livestock manure, and wastewater biomass but positively associated with municipal solid waste. Because the Between estimates are identified from 150 province–resource long-term means corresponding to only 30 independent province clusters, and several long-term covariates are relatively collinear, we evaluated this pattern using substantially more parsimonious alternatives. In the New Industries-only model with Between controls, the slopes are −0.544 for agricultural residues (p = 0.0009), −0.213 for forestry/orchard residues (p = 0.052), −0.669 for livestock manure (p < 0.001), −0.175 for wastewater biomass (p = 0.024), and +0.376 for municipal solid waste (p < 0.001), with a joint cross-resource test of F(4,29) = 30.09 (p < 0.001). The highest VIFs are 8.95 for New Industries and 8.85 for openness (mean VIF = 3.54). An even more minimal no-control specification preserves all five signs, although the forestry and wastewater slopes are less precise (p = 0.054 and p = 0.076). Appendix C Table A9 reports the three specifications. We therefore interpret this pattern as persistent descriptive structural sorting whose magnitude and precision remain parameterisation-sensitive, not as a causal long-term effect.
Multiplicity adjustment further concentrates the strongest evidence in the New Industries Between pattern. Its Between slopes for agricultural residues, forestry/orchard residues, livestock manure, and municipal solid waste remain significant under both Holm and BH-FDR adjustment, while the wastewater coefficient is retained under BH-FDR but not Holm. Between results for the other dimensions are more localised and are interpreted more cautiously. Here, ‘territorial structure’ refers to persistent cross-provincial differences in capability–resource configurations; it should not be interpreted as evidence of interprovincial spatial spillovers.
4.5.3. Within–Between Contrasts Across Resource Types
Formal Within–Between equality tests assess whether associations based on within-province temporal variation differ from associations across provinces’ long-term means. After multiplicity adjustment, the strongest New Industries contrasts are for forestry/orchard residues, livestock manure, and municipal solid waste; the agricultural residue contrast is retained under BH-FDR only, while the wastewater contrast does not survive either adjustment. For New Modes–agricultural residues, equality is not rejected (p = 0.191). These contrasts are interpreted as differences between sources of variation, not as causal effects operating at different horizons.
4.6. Exploratory Capability Component Diagnostics
To examine whether first-level patterns can be localised to narrower capability elements, we estimate resource-specific slopes for eight second-level components. Full numerical results are reported in Appendix C Table A7. A total of 4 component–resource slopes have conventional p-values below 0.05, but none remains significant after correction across the 40 component–resource tests. The component analysis is therefore treated as exploratory diagnostic evidence rather than as confirmation of component-specific pathways.
Nominal component-level signals include rural industrial integration with livestock manure, the digital economy with wastewater biomass, production organisation with municipal solid waste, and infrastructure and production tools with livestock manure. Because none survives family-level multiplicity adjustment, these coefficients are interpreted as candidate patterns for further investigation. At the joint-test level, rural industrial integration retains cross-resource heterogeneity after Holm and BH-FDR adjustment. The remaining component-level joint tests do not survive the 5% adjusted threshold. Importantly, no individual New Modes component reproduces the first-level New Modes–agricultural residue association.
4.6.1. Component Structure of New Industries
Within New Industries, rural industrial integration provides the clearest nominally localised signal for livestock manure, but the individual slope does not survive correction across the component–resource family. Its cross-resource joint heterogeneity test does survive family-level adjustment, so the component is retained as an exploratory source of differentiation rather than a confirmed pathway. The digital-economy–wastewater coefficient is likewise treated as a nominal signal only.
4.6.2. Component Structure of New Modes
The first-level New Modes–agricultural residue relationship cannot be localised to a single component in the present data. Production organisation, energy and materials, and data factors do not individually reproduce the first-level pattern after the stricter inferential checks. We therefore avoid interpreting the relationship as a demonstrated component-level mechanism or capability bundle.
4.6.3. Component Structure of New Drivers
Signals within New Drivers are dispersed across components and resources, and no individual component–resource slope remains significant after family-level correction. The component results therefore do not identify a unique mechanism underlying the dimension-level cross-resource heterogeneity documented above.
4.7. Operationalizing Capability–Resource Alignment: A Provincial Diagnostic Typology
The 2022 diagnostic typology reveals marked resource-specific differences in provincial alignment patterns. Agricultural residues are distributed relatively evenly across the four configurations (eight co-advantage, seven capability-gap, seven resource-gap, and eight dual-constraint provinces). Forest/orchard residues and wastewater biomass each place 18 of 30 provinces in the two same-direction configurations. Livestock manure exhibits the strongest mismatch pattern, with 18 of 30 provinces falling into the two given gap configurations. By contrast, municipal solid waste shows the strongest tendency toward same-direction capability–resource configurations: 28 of 30 provinces fall into either the co-advantage or dual-constraint category, with only one province in each gap category. These contrasts show that alignment is resource-specific rather than a single province-level ranking.
5. Robustness and Measurement Boundaries
5.1. Main Robustness Checks
Table 8 compares four focal relationships—aggregate NQPF–CMP, New Modes–agricultural residues, New Industries–livestock manure, and New Drivers–agricultural residues—across alternative timing, sample, control, trend, and small-cluster inference specifications.
Table 8.
Main robustness checks for the aggregate model and key resource relationships.
Aggregate NQPF remains positive when lagged one year (β = 0.0679, SE = 0.0280, p = 0.022). This indicates that the baseline association is not driven solely by contemporaneous covariance, but the lagged specification is a temporal-ordering robustness check rather than a causal identification strategy. Small-cluster inference retains the baseline aggregate coefficient (wild-bootstrap p = 0.0081). At the resource level, New Modes–agricultural residues and New Industries–livestock manure retain nominal wild-bootstrap support, whereas New Drivers–agricultural residues does not. The additional trend controls are more consequential: the aggregate NQPF–CMP coefficient declines from 0.0772 (p = 0.005) to 0.0047 (p = 0.898), New Modes–agricultural residues declines from 0.0437 (p = 0.008) to 0.0041 (p = 0.804), and New Industries–livestock manure changes from 0.0754 (p = 0.017) to −0.0162 (p = 0.527). New Drivers–agricultural residues remains positive but less precise (0.1729, p = 0.119). These results indicate that part of the baseline within-province association is not distinguishable from medium-term provincial trajectories; the trend-adjusted estimates are therefore treated as an important robustness boundary rather than as a replacement for the baseline specification.
5.2. Capability-Composition Sensitivity
Table 9 compares the original entropy-weighted NQPF measure with equal-weight and PCA re-aggregations under the same fixed-effects specification. The original coefficient is 0.0772 (SE = 0.0257, p = 0.005), compared with 0.0228 (p = 0.116) for equal weights and 0.0113 (p = 0.550) for PCA. The alternative indices remain highly correlated with the original NQPF measure (0.933 and 0.904), indicating that they capture broadly similar overall capability structure even though the fixed-effects association differs.
Table 9.
Fixed-effects comparison of NQPF composition sensitivity.
Although the alternative indices remain highly correlated with the original NQPF measure, this does not imply that their fixed-effects coefficients must be identical. The correlations mainly reflect similarity in overall index levels and rankings, whereas the fixed-effects estimator is identified from within-province changes over time. Equal weighting and PCA alter the relative contribution of the underlying components to this within variation and may therefore change both the estimated coefficient and its precision. We thus interpret the aggregate NQPF–CMP association as sensitive to index composition rather than as a relationship invariant to the measurement scheme.
6. Discussion
6.1. Regional Capabilities and Place-Based Bioenergy Transitions
The empirical results reinforce a place-based interpretation of regional transition capacity. Higher productive and innovative capability is not associated with every biomass resource in the same way, which suggests that capability cannot be read simply as a generic development advantage. Its relevance depends on the resource base with which it is combined. In this sense, regional bioenergy transitions emerge from the interaction of productive capabilities, inherited resource endowments, industrial trajectories, and spatial organisation rather than from any one of these elements in isolation. This interpretation is consistent with work on spatial embeddedness and differentiated regional transition pathways [1,7,35].
The Within–Between decomposition makes the territorial character of these relationships more explicit, but the revised robustness evidence also narrows its interpretation. Between-province associations capture relatively durable configurations formed through agricultural and livestock geographies, urban systems, industrial structures, and resource endowments; Within associations capture co-variation as provinces move relative to their own long-term means. Province-specific trend controls show that several baseline Within relationships are sensitive to underlying medium-term trajectories, so they should not be interpreted as trend-independent dynamic effects. Here, territorial structure refers to persistent cross-provincial differences in capability–resource configurations and not to interprovincial spatial spillovers.
This distinction sharpens the idea of place-based pathways without turning the coefficients into intervention effects. Regional strategies should begin from the specific resource system and identify capability domains that warrant further assessment, while recognising which observed patterns mainly reflect long-standing territorial organisation. The ‘place’ identified in the present analysis is the province as an analytical unit; finer-scale alignment within provinces remains unresolved. One plausible interpretation is that regional capabilities and resource-producing systems co-evolve: productive structures, agricultural and livestock systems, urbanisation, infrastructure, and innovation capacity may develop jointly within broader regional trajectories. The observed associations should therefore be read as features of joint regional configurations rather than as evidence that changes in NQPF independently cause changes in theoretical biomass potential.
6.2. Resource Heterogeneity and Capability–Resource Alignment in Sustainable Bioenergy Transitions
Capability–resource alignment brings resource potential and regional transition capacity into the same empirical frame. Resource assessment identifies where biomass exists; research on regional transitions identifies the productive and institutional conditions under which change can occur. The present results show that these two geographies do not simply overlap. The three first-level capability dimensions have different relationships with the five BEPs, so an aggregate capability score can conceal which kinds of resources are actually associated with particular regional strengths.
The differentiation is consistent with the material organisation of biomass supply. Agricultural residues require seasonal collection, storage, equipment scheduling, and coordination across dispersed actors; manure requires continuous treatment and links between waste management and subsequent utilisation; wastewater and municipal solid waste depend more heavily on urban networks, collection systems, and centralised treatment. Supply chain research similarly shows that feedstock density, transport distance, inventory, facility location, and uncertainty shape both economic and environmental performance [17,18,19,36]. These mechanisms are not observed directly in our data, so the estimated slopes should not be read as identified supply chain channels. They instead indicate where theoretical resource availability coexists with regional conditions that are plausibly more or less compatible with mobilisation.
The component analysis further shows why broad capability indices should be interpreted cautiously. Component-level coefficients provide exploratory diagnostic clues, but none of the 40 individual component–resource slopes remains significant after family-level multiplicity adjustment, and the first-level New Modes–agricultural residue association cannot be localised to a single component. These results, together with the sensitivity of re-aggregated NQPF measures, suggest that composite capability indices are useful for describing broad regional configurations but cannot by themselves identify causal bottlenecks or specific mechanisms. The provincial typology illustrates how the same province can occupy different alignment configurations across biomass resources, reinforcing the value of resource-specific screening rather than uniform province-level prioritisation.
6.3. Regional Innovation and Differentiated Capability Building for Bioenergy Transitions
The results herein have implications for how regional innovation is interpreted in a sustainable bioenergy transition, but not as a causal policy recipe. Innovation capacity includes organisational, infrastructural, digital, technical, and coordination conditions that may coexist differently with particular resource systems. A region may therefore be high-capability in aggregate terms yet have limited local availability of a specific biomass resource, while a resource-rich region may exhibit capability domains that warrant closer project-level assessment. The policy question is thus not how to raise a single regional capability score but which candidate capability domains should be evaluated for the resource system actually present. This differentiated perspective is consistent with regional innovation policy arguments against one-size-fits-all strategies [37].
The contrast between New Modes and New Industries illustrates this point. The New Modes–agricultural residue Within estimate is positive, but the formal Within–Between equality test does not reject equality (p = 0.191), the individual association does not survive family-level multiplicity adjustment, and province–resource-specific trends substantially attenuate it. It should therefore not be described as concentrated in within-province change. By contrast, the persistent New Industries Between pattern is the clearest adjusted structural evidence, with negative associations for several rural resources and a positive association for municipal solid waste. These differences identify candidate domains and structural constraints for further evaluation; they do not establish that changing a particular capability would causally change biomass potential or mitigation outcomes.
A place-based transition strategy should therefore connect capability building with governance. Regional innovation policies need to be coordinated with resource planning, infrastructure provision, rural and urban service systems, and the institutions that organise collection and treatment. The same logic is compatible with the implementation of SDGs 7, 12, and 13, but the contribution here is more specific: global sustainability objectives become actionable only when they are translated into resource-specific capability requirements and regional governance arrangements. In a broader sustainable bioeconomy, this is also the point at which circularity becomes operational rather than rhetorical, because the value of residual biomass depends on how effectively local systems can organise its recovery without displacing higher-value or ecologically necessary uses.
6.4. Sustainability Conditions and the Limits of Capability–Resource Alignment
Capability–resource alignment is a necessary enabling condition for sustainable bioenergy transitions, but it is not a sufficient condition for sustainability. BEP and CMP measure theoretical resource and substitution potential; they do not incorporate ecological thresholds, lifecycle emissions, competing uses, or realised project performance. A favourable alignment result should therefore be interpreted as evidence that resource availability and regional capabilities are mutually compatible at an ex-ante planning stage, not as evidence that a region or project is intrinsically sustainable. Sustainable mobilisation also requires that the resulting pathway preserve ecological functions, perform favourably over the lifecycle, and fit within wider circular-resource and governance objectives [38,39,40].
Agricultural residues illustrate this distinction clearly. Their use for energy can contribute to fossil energy substitution, yet excessive removal may reduce soil organic matter and nutrients and affect long-term productivity, with the magnitude depending on soil, climate, and management conditions [41,42]. Forestry residues raise related questions through nutrient export, carbon storage, and biodiversity [39]. In both cases, the technically or organisationally feasible level of mobilisation may exceed the ecologically desirable level. Capability building therefore needs to be paired with resource retention rules and competing use assessments rather than treated as a mandate to maximise extraction.
Manure, wastewater, and urban organic waste introduce a different set of sustainability conditions because energy recovery is intertwined with nutrient cycling, water governance, sanitation, and waste management objectives [43,44]. Transport also matters: long haulage distances for low-density feedstocks can erode part of the mitigation advantage expected from substitution [36,45,46]. The subsequent practical steps are twofold. Capability–resource alignment can identify promising regional starting points, after which ecological retention thresholds, lifecycle performance, circularity, competing uses, and project-level governance need to be assessed before a pathway is considered sustainable.
7. Policy and Planning Implications
For regional screening and project planning, theoretical resource volume should not be treated as a sufficient basis for prioritisation. The four-quadrant typology can be used as an initial screening device to identify where further assessment of collection systems, logistics, infrastructure, technology, finance, realised utilisation, ecological constraints, and competing uses is warranted. Because the empirical design is associational, these configurations should guide diagnostic prioritisation rather than be treated as direct investment rankings or causal policy prescriptions. At the province scale, the results are best used for strategic screening and regional prioritisation rather than direct project siting or local feedstock allocation decisions, which require finer-scale information on resource density, transport networks, existing facilities, competing uses, and environmental constraints [47,48,49].
Planning should also distinguish candidate capability domains from persistent territorial structures without assuming that either category is a demonstrated policy lever. Land use, agricultural and livestock geographies, historical industrial systems, and urban form provide part of the structural background captured by Between relationships. Organisational, digital, technical service, equipment, and infrastructure conditions constitute policy-relevant domains for further assessment rather than empirically identified intervention levers. Regional innovation policy can therefore use the alignment diagnostic to identify domains warranting further evaluation rather than to prescribe uniform intervention packages [50].
Resource-specific planning follows from the same logic, but the supply chain mechanisms remain theory-consistent interpretations rather than identified mediators. Agricultural residue regions may require seasonal collection and storage, equipment scheduling, and coordination services; manure-rich regions may require livestock organisation, continuous treatment, and links between treatment and subsequent utilisation; forestry and orchard resources depend on viable harvesting, transport, and processing networks; and wastewater and municipal waste rely on collection, pipe, treatment, and digital operation systems. These requirements should be treated as candidate domains for project-level diagnosis, not as mechanisms demonstrated by the regressions [51,52]. For agricultural and forestry residues in particular, lifecycle-based assessment further underscores that energetic valorisation should be evaluated alongside competing management options and their soil and agro-ecosystem consequences [53,54].
Governance remains essential because resource mobilisation crosses administrative and sectoral boundaries. Recent Chinese evidence similarly suggests that renewable energy deployment depends on the coordination and combination of policy instruments across jurisdictions, while biomass-specific subsidy design affects incentives along the supply chain [21,22,23]. Resource-rich but capability-constrained regions may therefore warrant assessment of shared services, equipment, technical platforms, or interregional value chain linkages, subject to transport cost and lifecycle emission constraints. The present data do not observe interprovincial logistics, project networks, or actual environmental performance, so these implications are region-level guidance requiring project-scale validation rather than identified causal prescriptions.
8. Conclusions and Limitations
This study develops a capability–resource alignment perspective on sustainable bioenergy transitions using a balanced panel of 30 Chinese provinces from 2012–2022. Under the baseline entropy-weighted specification, aggregate NQPF is positively associated with theoretical CMP, but equal-weight and PCA re-aggregations do not reproduce the same statistical significance and province-specific trends substantially attenuate the association. At the resource level, New Modes–agricultural residues and New Industries–livestock manure retain nominal support under wild-cluster inference but not family-level multiplicity adjustment, while New Drivers retains statistically supported overall cross-resource differentiation (wild p = 0.0096; family-adjusted p = 0.0288) without a separately confirmed agricultural residue slope. The strongest adjusted evidence is the persistent New Industries Between structure: long-term capability means are negatively associated with agricultural residues, forestry and orchard residues, livestock manure, and wastewater biomass and positively associated with municipal solid waste. Component-level results are exploratory and do not identify unique mechanisms. The 2022 diagnostic typology further shows that alignment configurations vary sharply by resource, with livestock manure exhibiting the most gap-type configurations and municipal solid waste showing the strongest tendency toward same-direction capability–resource configurations. These findings are interpreted as conditional capability–resource associations and structural patterns rather than causal effects of NQPF on biomass potential.
Taken together, the results suggest that regional bioenergy pathways should be organised around the fit between heterogeneous resources and territorial capabilities rather than around resource abundance or aggregate capability alone. The revised typology makes this idea operational as a descriptive screening tool, but it does not rank project readiness or policy effectiveness. Alignment also does not establish sustainability by itself. Ecological retention, nutrient and water management, circular resource use, transport emissions, competing uses, financing, governance, and lifecycle performance remain necessary filters before theoretical potential is translated into investment or deployment. This framing supports differentiated regional pathways while keeping the evidence boundary explicit: province-level screening can identify configurations and candidate domains for further assessment, not causal intervention effects or local project feasibility.
Several limitations define the boundary of these conclusions. First, BEP and CMP measure theoretical potential rather than realised utilisation; installed capacity, biogas output, project operation, and actual lifecycle mitigation occur further downstream and are jointly shaped by siting, finance, infrastructure, policy incentives, logistics, and plant performance. Second, the province-level unit of analysis necessarily aggregates substantial within-province heterogeneity. Local feedstock density, transport accessibility, infrastructure, project location, ecological constraints, and competing resource uses may differ markedly within the same province, so province-level associations should not be interpreted as evidence of local spatial coincidence or project-level feasibility. Third, the analysis does not explicitly model interprovincial spatial dependence. Knowledge diffusion, production linkages, and biomass movements may connect provinces through different geographical or economic networks; future research could combine spatial-panel or network approaches with observed relational data on trade, transport, innovation linkages, or biomass flows. Fourth, the observational design leaves open potential endogeneity from time-varying omitted factors, joint regional development processes, and feedback between capability formation and resource-producing systems. Fixed effects, observed controls, lags, and trend checks reduce some alternative explanations but do not establish causal identification. Fifth, the aggregate NQPF–CMP association is sensitive to the internal weighting scheme and is not reproduced under equal-weight or PCA re-aggregation; independently constructed capability measures and raw indicator-based alternatives are therefore needed. Finally, the Between estimates rely on only 30 independent province clusters and relatively collinear long-term means, so they are interpreted as structural descriptive evidence rather than precise causal effects. Future work should link finer-scale resources and capabilities to realised utilisation, environmental performance, and credible sources of exogenous capability variation.
Author Contributions
Y.Z.: Conceptualization; Methodology; Formal analysis; Data curation; Visualization; Writing—original draft. Y.H.: Conceptualization; Methodology; Supervision; Validation; Writing—review and editing; Project administration; Funding acquisition. D.W.: Methodology; Validation; Writing—review and editing. All authors have read and agreed to the published version of the manuscript.
Funding
This research was funded by the Fundamental Research Funds for the Central Universities, grant number N26ZLL024.
Institutional Review Board Statement
Not applicable.
Informed Consent Statement
Not applicable.
Data Availability Statement
The processed analytical dataset and Stata/MP 17 (64-bit) replication code supporting the reported results are available from the corresponding author upon reasonable request. If required for peer-review verification, these materials can be provided confidentially to the Editor and Reviewer.
Acknowledgments
During manuscript preparation, ChatGPT (OpenAI, GPT-5.6) was used solely for language editing and grammatical refinement. All scientific content, analyses, interpretations, and conclusions were developed and verified by the authors.
Conflicts of Interest
The authors declare no conflicts of interest.
Appendix A. Biomass Energy Conversion Parameters
Appendix A reports the parameter values used to harmonise the five biomass resource series into theoretical bioenergy potential (BEP) and to derive aggregate carbon-mitigation potential (CMP), corresponding to the resource-accounting sequence described in Section 3.2.1. The parameters define theoretical resource quantities and a common substitution boundary; they are not estimates of realised collection, installed capacity, project operation, or actual lifecycle mitigation. Collection/utilisation and conversion coefficients are applied uniformly across provinces and years. Standard-coal conversion follows the Chinese national standard GB/T 2589-2020 [55], while the collection/utilisation and biogas parameters draw on the cited national statistical and administrative sources.
Table A1.
Biomass conversion parameters for agricultural residues.
Table A2.
Biomass conversion parameters for forestry and orchard residues.
Table A3.
Biomass conversion parameters for livestock manure.
Table A4.
Biomass conversion parameters for wastewater biomass and municipal solid waste.
Table A5.
CO2 emission and power generation parameters used in CMP construction.
Appendix B. Complete NQPF Indicator System, Sources, Direction, and Entropy Weights
Appendix B reports all 34 underlying indicators used to construct the NQPF-based regional capability measures, together with indicator definitions and data sources, direction, and the entropy weights applied to the eight second-level component scores. The tables are part of the manuscript’s reproducibility documentation and should be read together with the construction algorithm in Section 3.2.2.
Table A6.
Complete indicator system for NQPF: New Industries.
Appendix C. Supplementary Results and Inference Diagnostics
Table A7 reports the complete resource-specific slopes and standard errors for the eight second-level capability components across five resource types. These estimates are retained for transparency, but the component-level analysis is exploratory because none of the 40 individual component–resource slopes survives family-level Holm or BH-FDR adjustment. Table A8 summarizes family-level multiplicity-adjusted inference, and Table A9 reports the parsimonious sensitivity analysis for the New Industries Between pattern. Small-cluster wild-bootstrap results for focal first-level estimates and cross-resource joint tests are reported in Table 8, Panel D.
Table A7.
Resource-specific slopes between eight second-level capability components and five biomass resource potentials.
Figure A1.
Provincial capability–resource alignment by biomass resource, 2022.
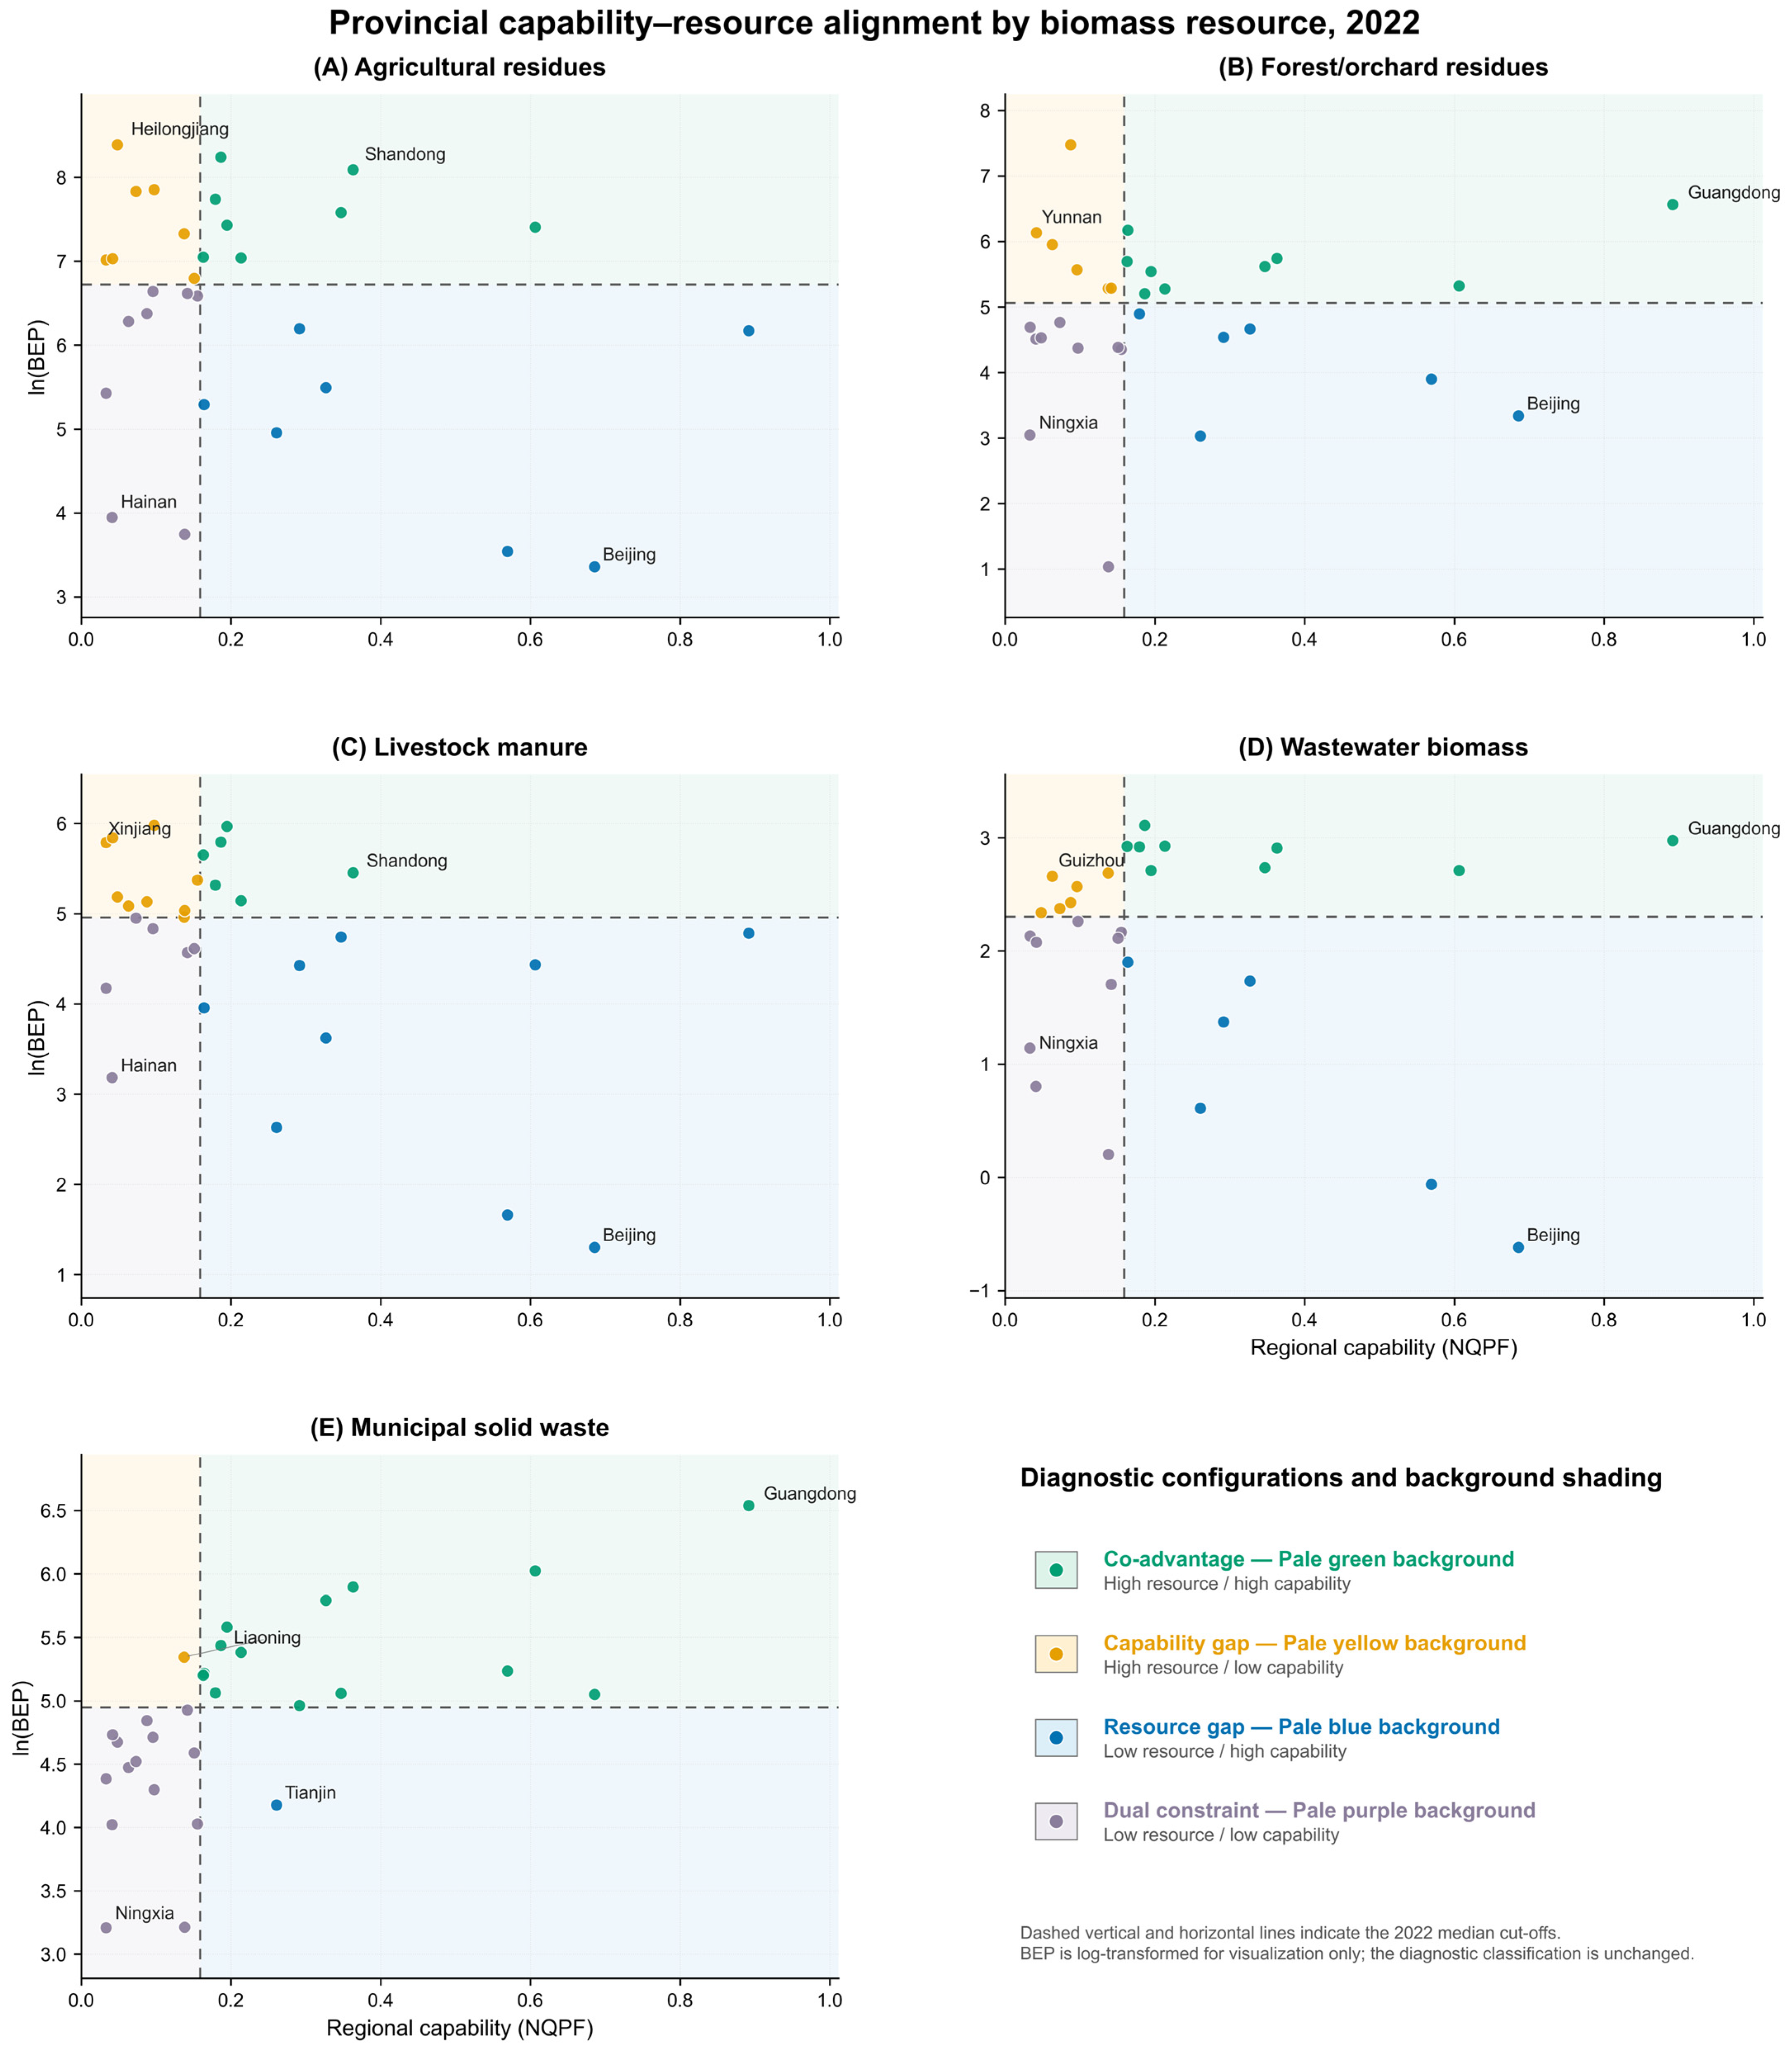
Table A8.
Summary of family-level multiplicity adjustment.
Table A9.
Sensitivity of New Industries Between slopes to parsimonious parameterisation.
References
- Chlebna, C.; Martin, H.; Mattes, J. Grasping transformative regional development: Exploring intersections between industrial paths and sustainability transitions. Environ. Plan. A Econ. Space 2023, 55, 222–234. [Google Scholar] [CrossRef] [Scilit]
- Demeterova, B. Assessing regional capabilities-oriented approaches for European just and sustainable transitions. Reg. Stud. 2024, 58, 1530–1542. [Google Scholar] [CrossRef] [Scilit]
- Østergaard, C.R.; Park, E.; Hain, D.S.; Tanner, A.N. Understanding green regional path development: A systematic study of the Nordic regions. Reg. Stud. 2024, 58, 2158–2174. [Google Scholar] [CrossRef] [Scilit]
- Vale, M.; Peponi, A.; Carvalho, L.; Veloso, A.P.; Queirós, M.; Morgado, P. Are peripheral regions in troubled waters for sustainability transitions? A systematic analysis of the literature. Eur. Urban Reg. Stud. 2024, 31, 116–131. [Google Scholar] [CrossRef] [Scilit]
- Barca, F.; McCann, P.; Rodríguez-Pose, A. The case for regional development intervention: Place-based versus place-neutral approaches. J. Reg. Sci. 2012, 52, 134–152. [Google Scholar] [CrossRef] [Scilit]
- Truffer, B.; Coenen, L. Environmental innovation and sustainability transitions in regional studies. Reg. Stud. 2012, 46, 1–21. [Google Scholar] [CrossRef] [Scilit]
- Hansen, T.; Coenen, L. The geography of sustainability transitions: Review, synthesis and reflections on an emergent research field. Environ. Innov. Soc. Transit. 2015, 17, 92–109. [Google Scholar] [CrossRef] [Scilit]
- Trippl, M.; Baumgartinger-Seiringer, S.; Frangenheim, A.; Isaksen, A.; Rypestøl, J.O. Unravelling green regional industrial path development: Regional preconditions, asset modification and agency. Geoforum 2020, 111, 189–197. [Google Scholar] [CrossRef] [Scilit]
- Boschma, R. Proximity and innovation: A critical assessment. Reg. Stud. 2005, 39, 61–74. [Google Scholar] [CrossRef] [Scilit]
- Martin, R.; Sunley, P. Path dependence and regional economic evolution. J. Econ. Geogr. 2006, 6, 395–437. [Google Scholar] [CrossRef] [Scilit]
- Zhang, J.; Wei, J.; Guo, C.L.; Tang, Q.; Guo, H. The spatial distribution characteristics of the biomass residual potential in China. J. Environ. Manag. 2023, 338, 117777. [Google Scholar] [CrossRef] [Scilit]
- Shi, Z.; Ferrari, G.; Ai, P.; Marinello, F.; Pezzuolo, A. Bioenergy potential from agricultural by-product in 2030: An AI-based spatial analysis and climate change scenarios in a Chinese region. J. Clean. Prod. 2024, 436, 140621. [Google Scholar] [CrossRef] [Scilit]
- Shi, Z.; Liang, F.; Marinello, F.; Pezzuolo, A. Integrating building footprints and bioenergy potential to support effective decentralised energy planning: A scalable framework based on open data. Sustain. Dev. 2026, 34, 1309–1325. [Google Scholar] [CrossRef] [Scilit]
- Nie, Y.; Chang, S.; Cai, W.; Wang, C.; Zhang, J.; Yang, Y. Spatial distribution of usable biomass feedstock and technical bioenergy potential in China. GCB Bioenergy 2020, 12, 54–70. [Google Scholar] [CrossRef] [Scilit]
- Qin, Z.; Zhuang, Q.; Cai, X.; He, Y.; Huang, Y.; Jiang, D.; Lin, E.; Liu, Y.; Tang, Y.; Wang, M.Q. Biomass and biofuels in China: Toward bioenergy resource potentials and their impacts on the environment. Renew. Sustain. Energy Rev. 2018, 82, 2387–2400. [Google Scholar] [CrossRef] [Scilit]
- Zhu, Y.; Han, Y.; Li, B.; Qi, X. Spatiotemporal evolution and driving mechanisms of biomass energy carbon reduction in China. Biomass Bioenergy 2027, 217, 109957. [Google Scholar] [CrossRef] [Scilit]
- Valipour, M.; Mafakheri, F.; Gagnon, B.; Prinz, R.; Bergström, D.; Brown, M.; Wang, C. Integrating bio-hubs in biomass supply chains: Insights from a systematic literature review. J. Clean. Prod. 2024, 467, 142930. [Google Scholar] [CrossRef] [Scilit]
- Gital, Y.; Bilgen, B. Biomass supply chain network design under uncertainty, risk and resilience: A systematic literature review. Comput. Ind. Eng. 2024, 193, 110270. [Google Scholar] [CrossRef] [Scilit]
- Shahidi, A.; Rönnqvist, M.; Lehoux, N. Transportation planning in multiple bioenergy value chains: A literature review. J. Clean. Prod. 2025, 508, 145552. [Google Scholar] [CrossRef] [Scilit]
- Wolfsmayr, U.J.; Rauch, P. The primary forest fuel supply chain: A literature review. Biomass Bioenergy 2014, 60, 203–221. [Google Scholar] [CrossRef] [Scilit]
- Hu, X.; Yu, S.; Fang, X.; Ovaere, M. Which combinations of renewable energy policies work better? Insights from policy text synergies in China. Energy Econ. 2023, 127, 107104. [Google Scholar] [CrossRef] [Scilit]
- Yu, S.; Guo, Y.; Geng, H.; Hu, X. The impact and path of influence of central–local government policy synergy on renewable energy development: Evidence from China. Energy Econ. 2025, 150, 108846. [Google Scholar] [CrossRef] [Scilit]
- Zhang, H.; Duan, X.; Jiang, J. Fixed rebate subsidy vs. unit price subsidy: Incentive effect on the biomass power supply chain. Energy Policy 2024, 187, 114031. [Google Scholar] [CrossRef] [Scilit]
- Fan, R.; Liu, H.; Yu, Z. An evolutionary game approach to subsidy phase-out for biomass power generation in China: Analyzing central and total subsidy phase-out strategies. Renew. Energy 2026, 257, 124773. [Google Scholar] [CrossRef] [Scilit]
- Zhang, L. Understanding the new quality productive forces in the energy sector. Energy Nexus 2024, 16, 100352. [Google Scholar] [CrossRef] [Scilit]
- Di Santo, N.; Yazdani, M.; Lopolito, A.; Sica, E.; Sisto, R. Towards policy mixes formulation to support green transitions in rural areas: A methodological approach. Sustain. Dev. 2025, 33, 6378–6398. [Google Scholar] [CrossRef] [Scilit]
- Mundlak, Y. On the pooling of time series and cross section data. Econometrica 1978, 46, 69–85. [Google Scholar] [CrossRef] [Scilit]
- Bell, A.; Jones, K. Explaining fixed effects: Random effects modeling of time-series cross-sectional and panel data. Political Sci. Res. Methods 2015, 3, 133–153. [Google Scholar] [CrossRef] [Scilit]
- Hsu, Y.-C.; Shiu, J.-L. Nonlinear panel data models with distribution-free correlated random effects. Econom. Theory 2021, 37, 1075–1099. [Google Scholar] [CrossRef] [Scilit]
- Baltagi, B.H. The multidimensional Mundlak estimator. Econ. Lett. 2024, 236, 111607. [Google Scholar] [CrossRef] [Scilit]
- MacKinnon, J.G.; Webb, M.D. The wild bootstrap for few (treated) clusters. Econom. J. 2018, 21, 114–135. [Google Scholar] [CrossRef] [Scilit]
- Roodman, D.; Nielsen, M.Ø.; MacKinnon, J.G.; Webb, M.D. Fast and wild: Bootstrap inference in Stata using boottest. Stata J. 2019, 19, 4–60. [Google Scholar] [CrossRef] [Scilit]
- Canay, I.A.; Santos, A.; Shaikh, A.M. The Wild Bootstrap with a “Small” Number of “Large” Clusters. Rev. Econ. Stat. 2021, 103, 346–363. [Google Scholar] [CrossRef] [Scilit]
- Webb, M.D. Reworking wild bootstrap-based inference for clustered errors. Can. J. Econ./Rev. Can. D’économique 2023, 56, 839–858. [Google Scholar] [CrossRef] [Scilit]
- Olmedo, L.; Holloway, P.; Barimo, J.; O’Shaughnessy, M. Localising the Sustainable Development Goals: A place-based analysis of sustainable development in rural and urban areas. Sustain. Dev. 2026, 1–24. [Google Scholar] [CrossRef] [Scilit]
- Zahraee, S.M.; Shiwakoti, N.; Stasinopoulos, P. Biomass supply chain environmental and socio-economic analysis: A 40-year comprehensive review. Biomass Bioenergy 2020, 142, 105777. [Google Scholar] [CrossRef] [Scilit]
- Tödtling, F.; Trippl, M. One size fits all? Towards a differentiated regional innovation policy approach. Res. Policy 2005, 34, 1203–1219. [Google Scholar] [CrossRef] [Scilit]
- Gottenhuber, S.; Carlsen, H.; Linnér, B.-O.; Weitz, N. Operationalizing indivisibility—Synergies and trade-offs in six Swedish municipalities’ work with the 2030 Agenda. Sustain. Dev. 2025, 33, 5642–5660. [Google Scholar] [CrossRef] [Scilit]
- Ahrens, D.; Benedikter, S.; Giessen, L. Rethinking synergies and trade-offs at the forest-Sustainable Development Goals (SDGs) nexus—A systematic review. Sustain. Dev. 2025, 33, 5069–5090. [Google Scholar] [CrossRef] [Scilit]
- Tsagkari, M.; Roca, J.; Stephanides, P. Sustainability of local renewable energy projects: A comprehensive framework and an empirical analysis on two islands. Sustain. Dev. 2022, 30, 1155–1168. [Google Scholar] [CrossRef] [Scilit]
- Raffa, D.W.; Bogdanski, A.; Tittonell, P. How does crop residue removal affect soil organic carbon and yield? A hierarchical analysis of management and environmental factors. Biomass Bioenergy 2015, 81, 345–355. [Google Scholar] [CrossRef] [Scilit]
- Battaglia, M.; Thomason, W.; Fike, J.H.; Evanylo, G.K.; von Cossel, M.; Babur, E.; Iqbal, Y.; Diatta, A.A. The broad impacts of corn stover and wheat straw removal for biofuel production on crop productivity, soil health and greenhouse gas emissions: A review. GCB Bioenergy 2021, 13, 45–57. [Google Scholar] [CrossRef] [Scilit]
- Jha, S.; Nanda, S.; Zapata, O.; Acharya, B.; Dalai, A.K. A Review of Systems Thinking Perspectives on Sustainability in Bioresource Waste Management and Circular Economy. Sustainability 2024, 16, 10157. [Google Scholar] [CrossRef] [Scilit]
- Nguyen, T.Q.; Luu, L.Q.; Martínez-Ramón, N.; Longo, S.; Cellura, M.; Dufour, J. Sustainability and circularity assessment of biomass-based energy supply chain. Heliyon 2024, 10, e38557. [Google Scholar] [CrossRef] [Scilit]
- Zhao, G.; Jiang, P.; Zhang, H.; Li, L.; Ji, T.; Mu, L.; Lu, X.; Zhu, J. Mapping out the regional low-carbon and economic biomass supply chain by aligning geographic information systems and life cycle assessment models. Appl. Energy 2024, 369, 123599. [Google Scholar] [CrossRef] [Scilit]
- Osman, A.I.; Fang, B.; Zhang, Y.; Liu, Y.; Yu, J.; Farghali, M.; Rashwan, A.K.; Chen, Z.; Chen, L.; Ihara, I.; et al. Life cycle assessment and techno-economic analysis of sustainable bioenergy production: A review. Environ. Chem. Lett. 2024, 22, 1115–1154. [Google Scholar] [CrossRef] [Scilit]
- Huang, X.; Ji, L.; Xie, Y.; Luo, Z. Robust optimization of regional biomass supply chain system design and operation with data-driven uncertainties. Food Bioprod. Process. 2025, 149, 176–189. [Google Scholar] [CrossRef] [Scilit]
- Fang, Z.; Wang, M.; Ji, L.; Xie, Y.; Zhen, J. Multi-objective inexact optimization of the biomass supply chain from an energy-land-carbon nexus perspective. Energy Nexus 2025, 17, 100358. [Google Scholar] [CrossRef] [Scilit]
- Zhang, Y.; Bin, D. Optimizing economic and environmental sustainability in biomass-based energy supply chains: A multi-criteria decision-making approach. Energy 2025, 316, 134208. [Google Scholar] [CrossRef] [Scilit]
- Loeber, A.M.C.; Kok, K.P.W. Exploring the functions of place-based intermediation in the governance of sustainability transitions. Environ. Innov. Soc. Transit. 2024, 52, 100869. [Google Scholar] [CrossRef] [Scilit]
- Mola-Yudego, B.; Dimitriou, I.; Gagnon, B.; Schweinle, J.; Kulišić, B. Priorities for the sustainability criteria of biomass supply chains for energy. J. Clean. Prod. 2024, 434, 140075. [Google Scholar] [CrossRef] [Scilit]
- Longo, S.; Cellura, M.; Luu, L.Q.; Nguyen, T.Q.; Rincione, R.; Guarino, F. Circular economy and life cycle thinking applied to the biomass supply chain: A review. Renew. Energy 2024, 220, 119598. [Google Scholar] [CrossRef] [Scilit]
- Brás, I.; Silva, E.; Raimondo, R.; Saetta, R.; Mignano, V.; Fabbricino, M.; Ferreira, J. Valorisation of Forest and Agriculture Residual Biomass—The Application of Life Cycle Assessment to Analyse Composting, Mulching, and Energetic Valorisation Strategies. Sustainability 2024, 16, 630. [Google Scholar] [CrossRef] [Scilit]
- Siol, C.; Majer, S.; Thrän, D. Integrating soil- and agro-ecosystem models into life cycle assessments of sustainable management of agricultural residues: A review in the context of Sustainable Development Goals and planetary boundaries. Int. J. Life Cycle Assess. 2025, 30, 2908–2924. [Google Scholar] [CrossRef] [Scilit]
- GB/T 2589-2020; General Rules for Calculation of the Comprehensive Energy Consumption. State Administration for Market Regulation and Standardization Administration of China: Beijing, China, 2020.
- Han, W.; Zhang, R.; Zhao, F. Measurement of New Quality Productive Forces and New Drivers of China’s Economic Growth. J. Quant. Technol. Econ. 2024, 41, 5–25. (In Chinese) [Google Scholar] [CrossRef]
- Zou, X.; He, P. The Enrichment Effect and Mechanism of New Forms of Rural Industrial Integration under the Digital Economy. J. Chongqing Univ. (Soc. Sci. Ed.) 2025, 31, 279–294. (In Chinese) [Google Scholar]
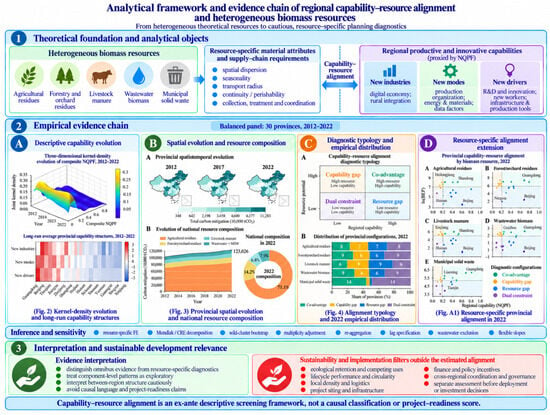
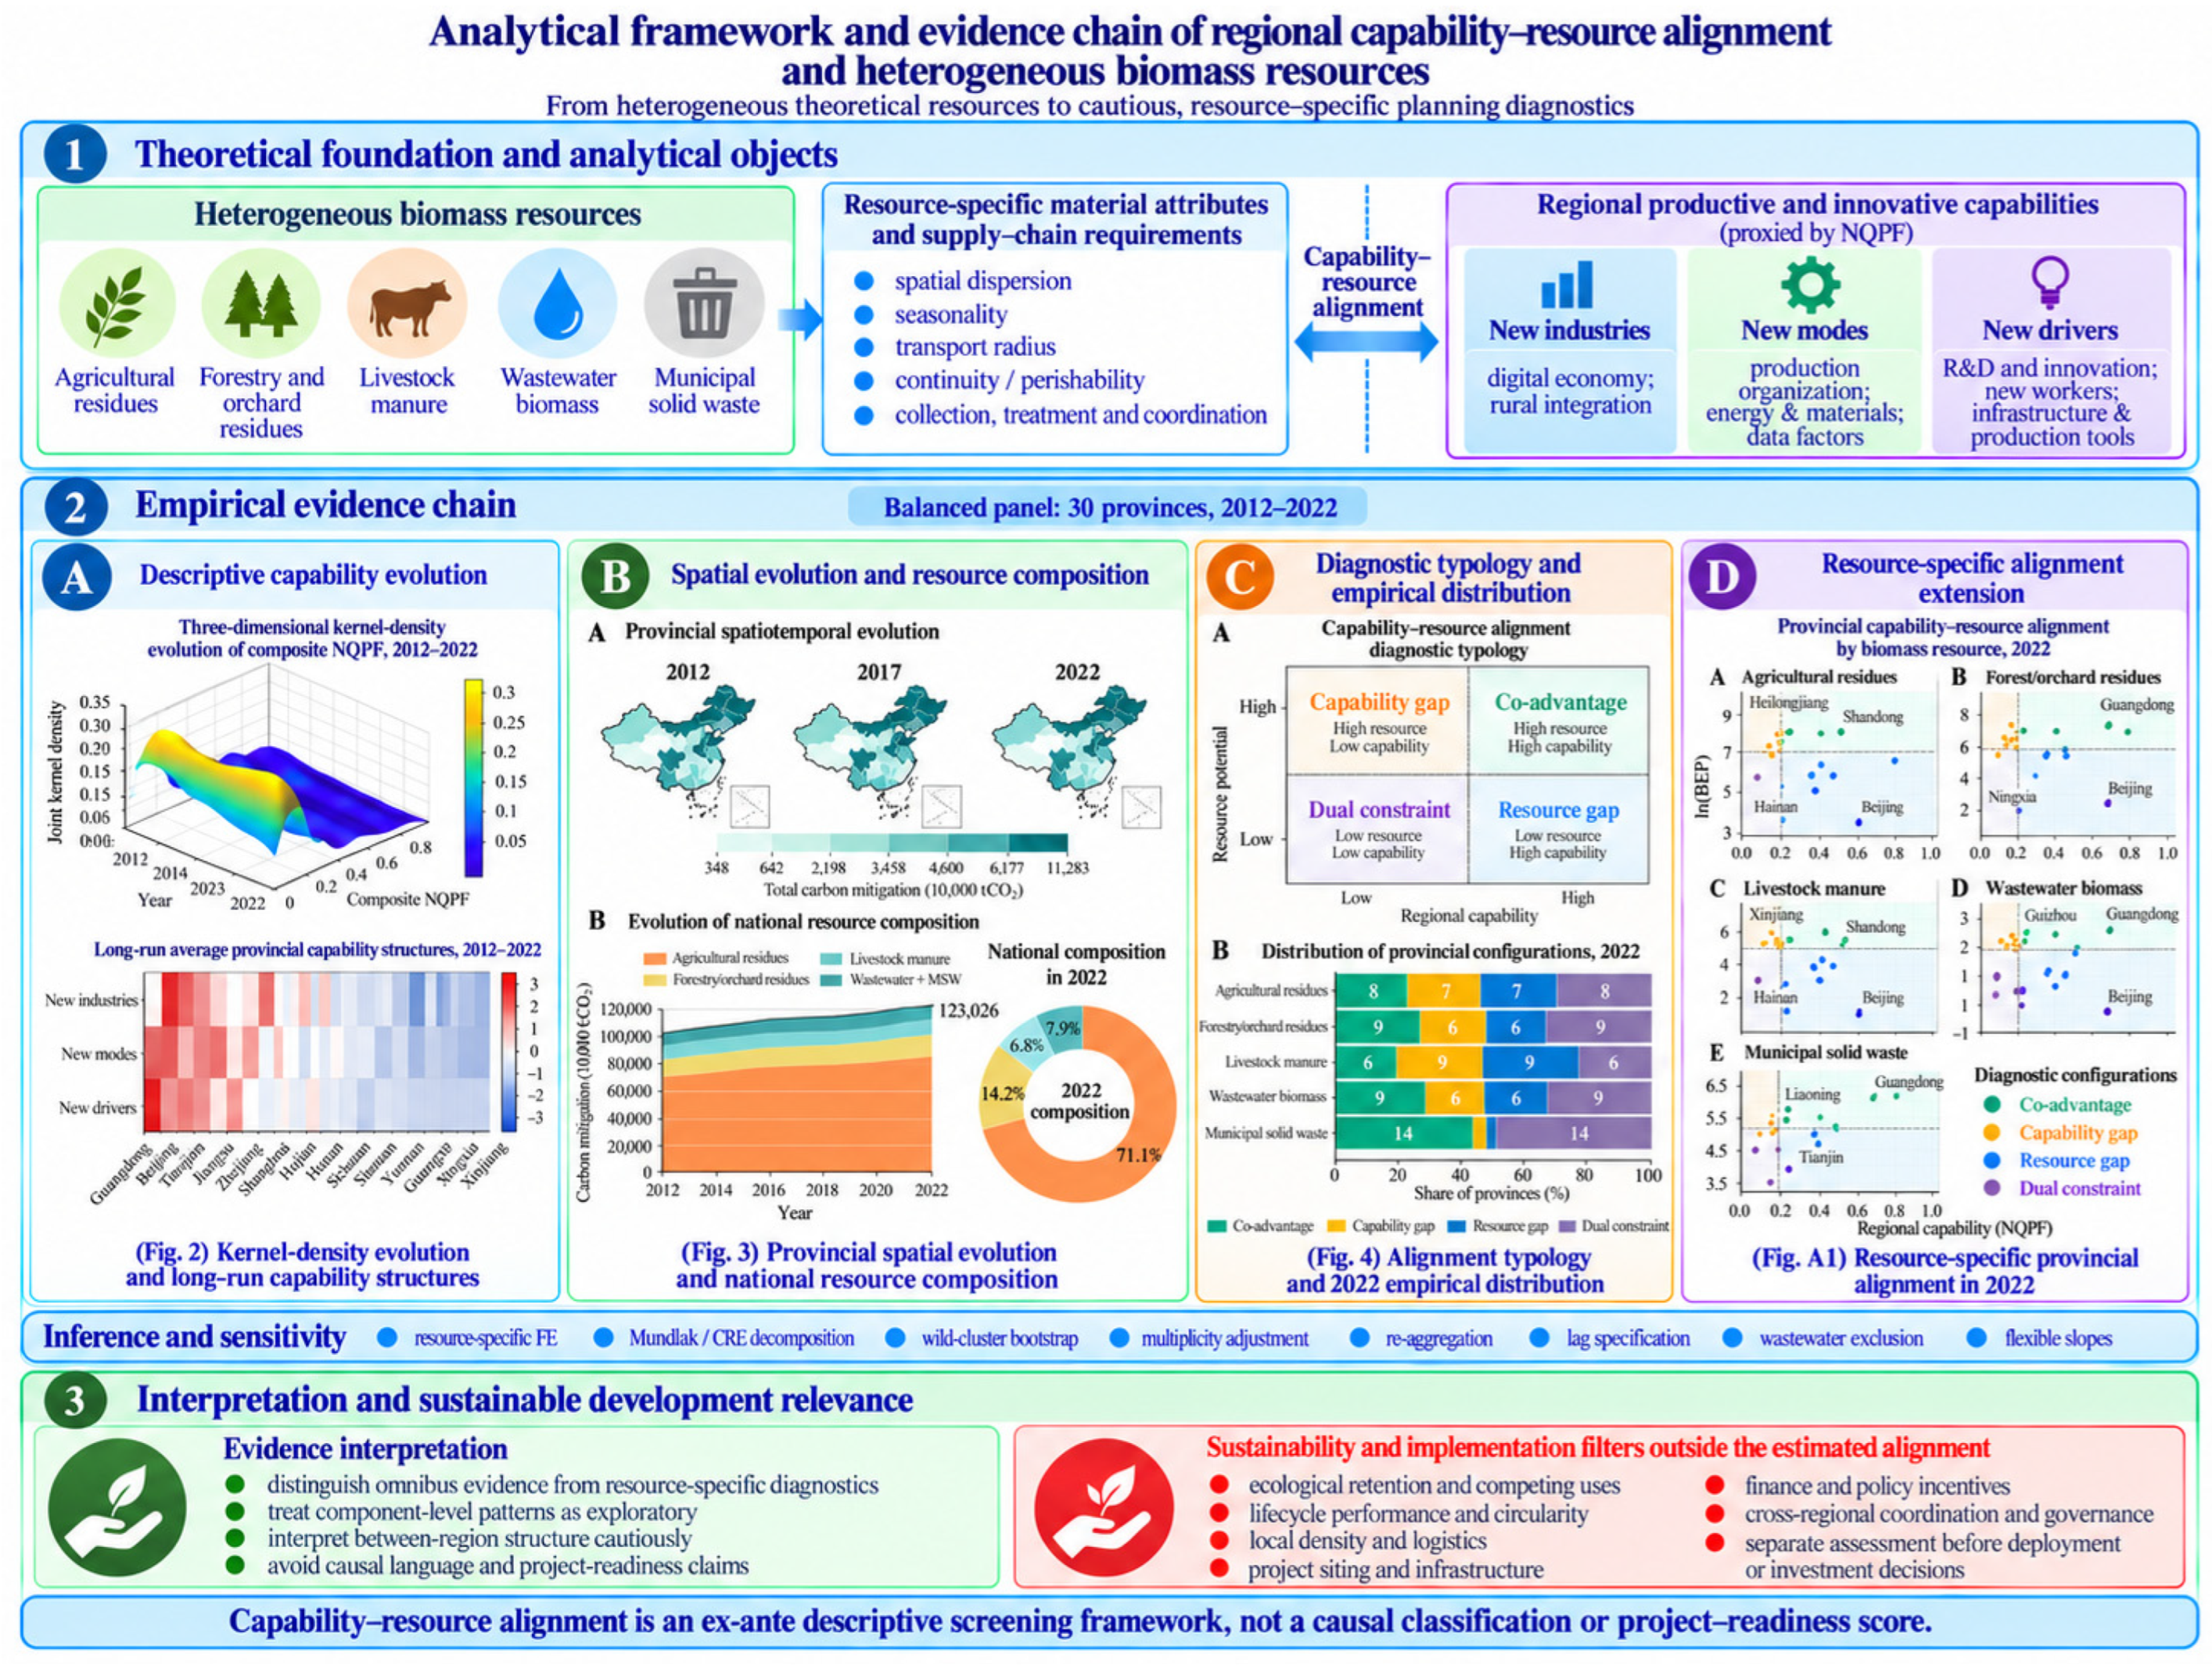
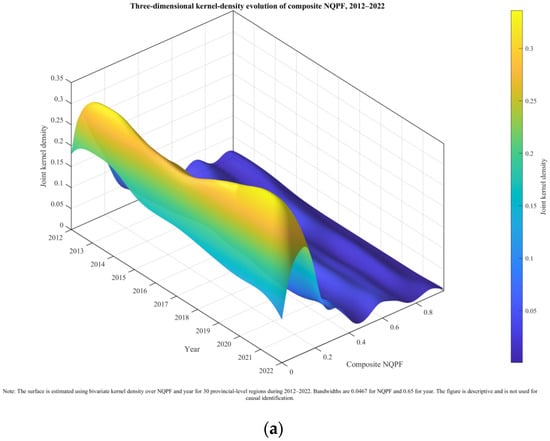
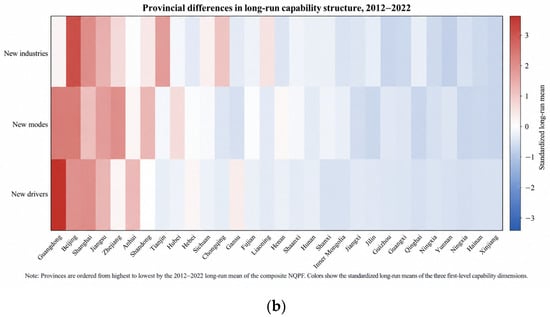
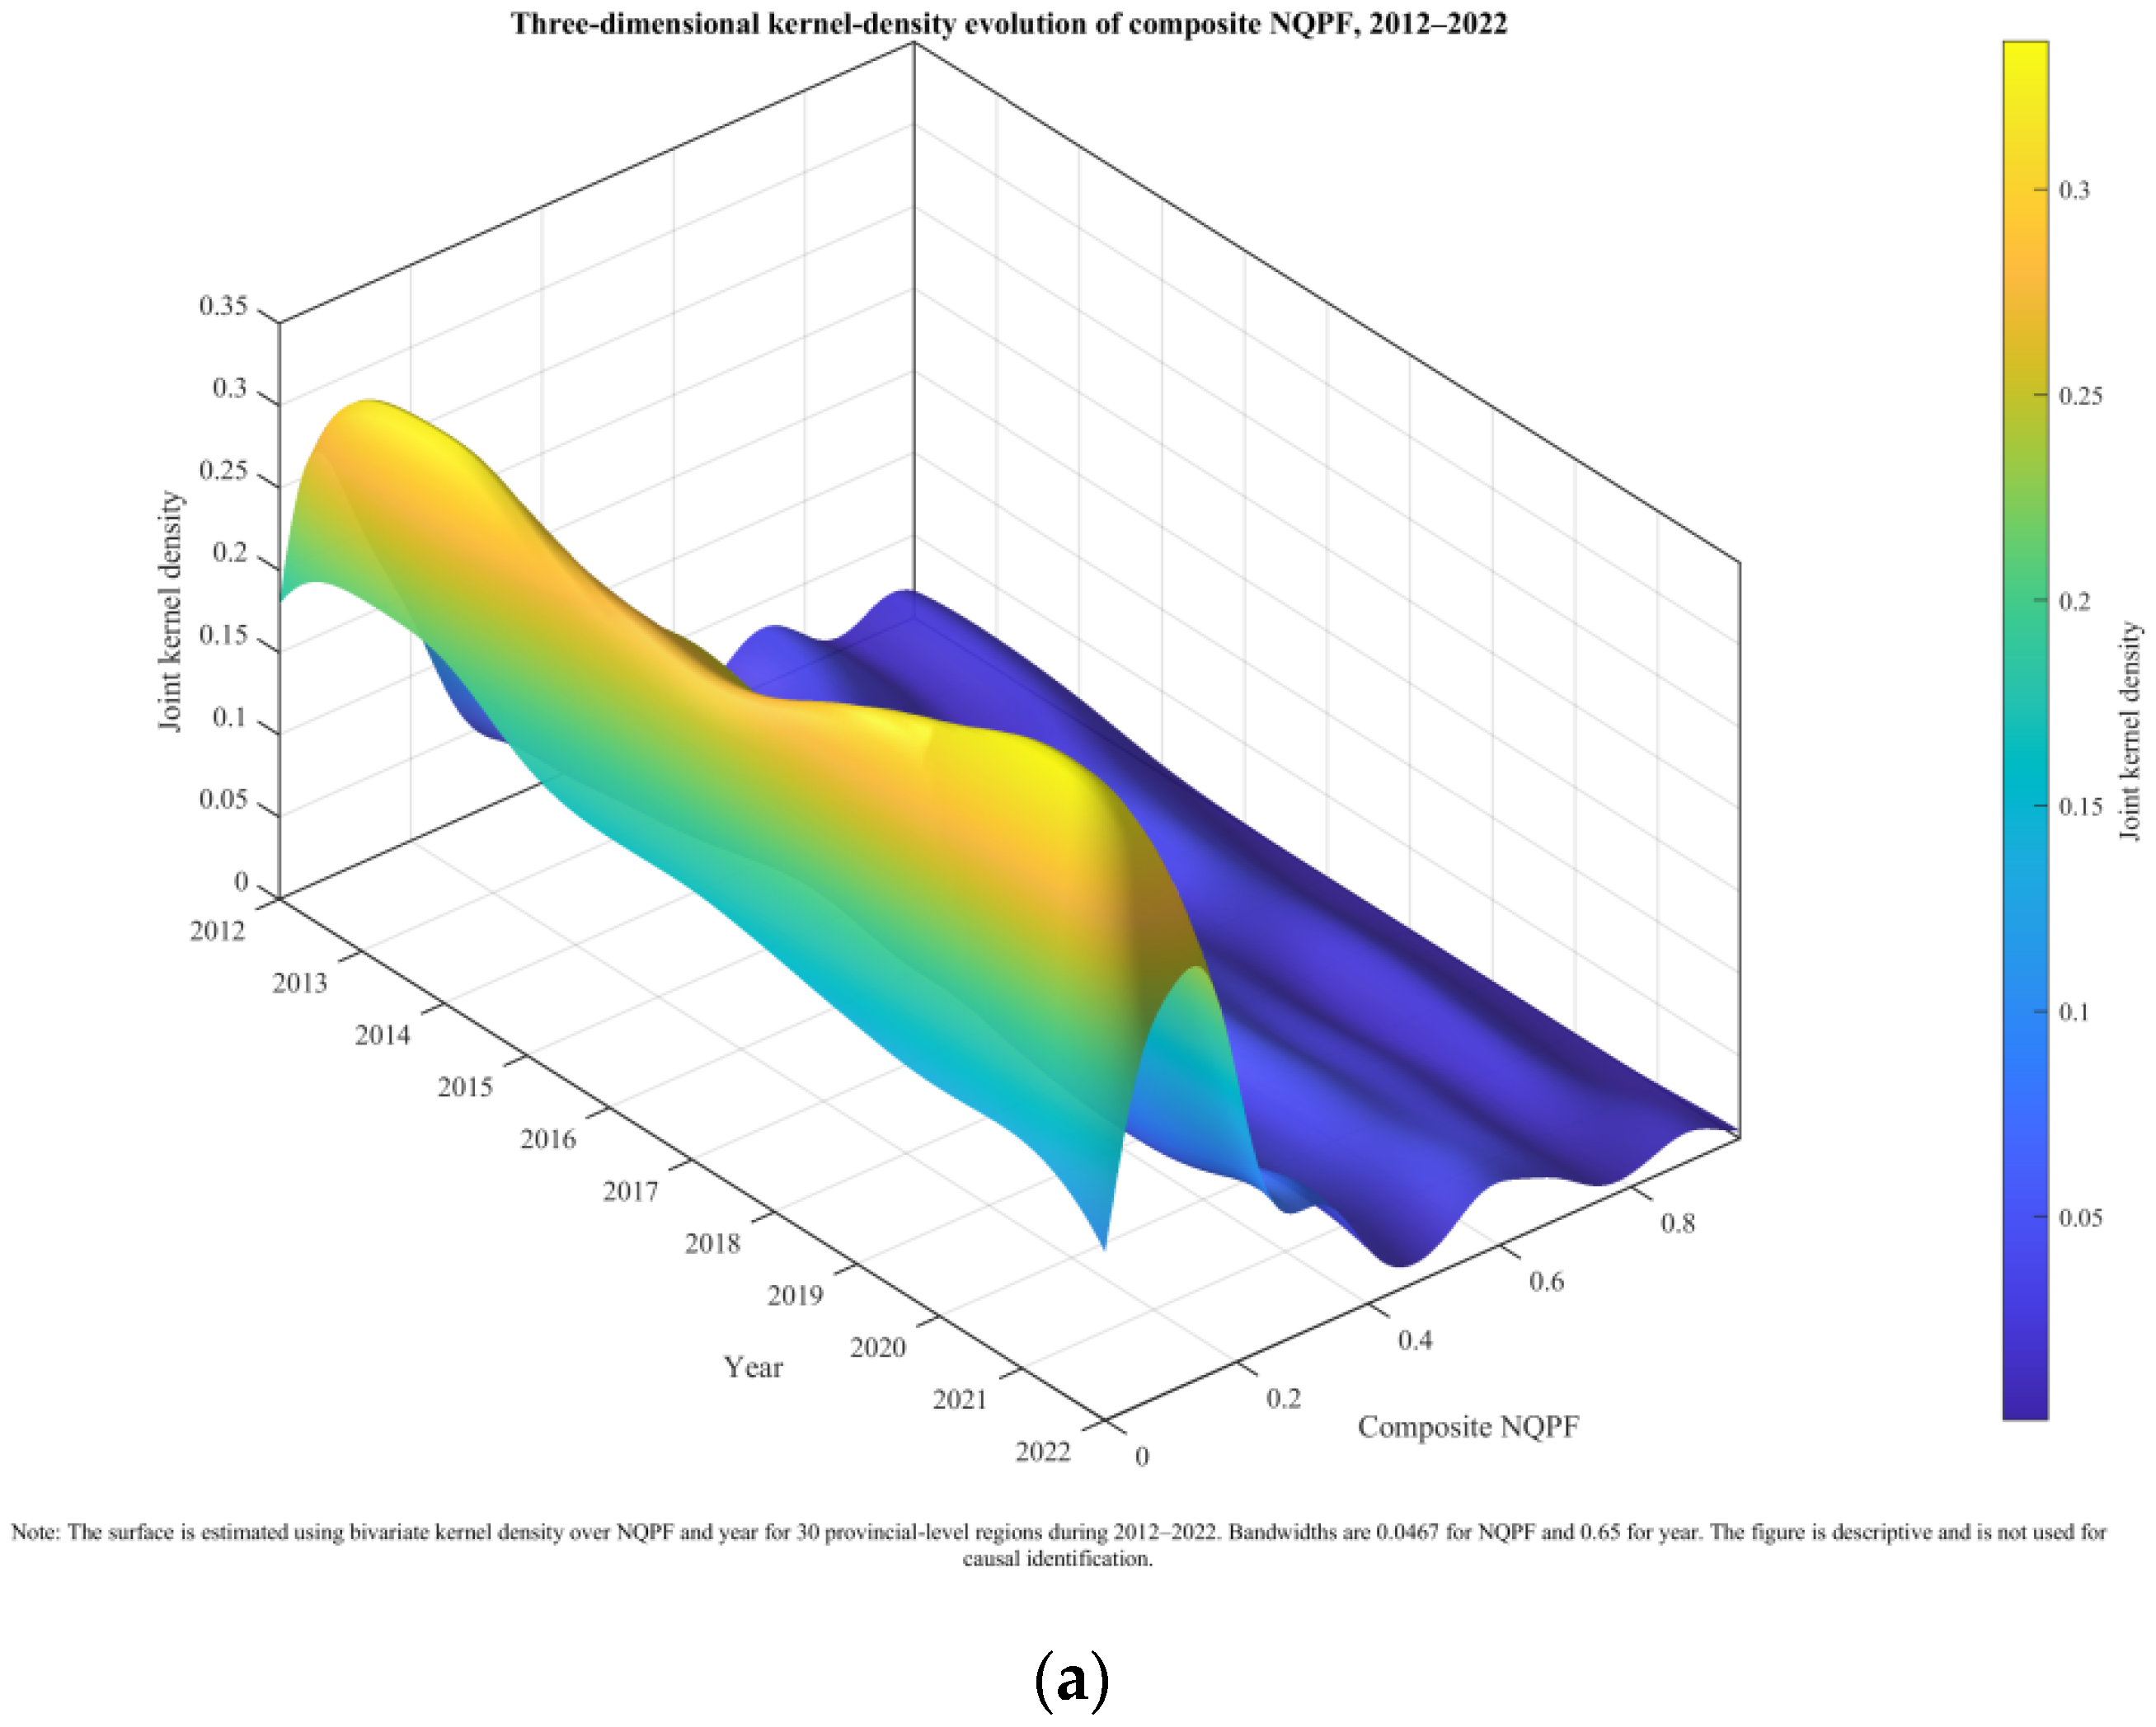
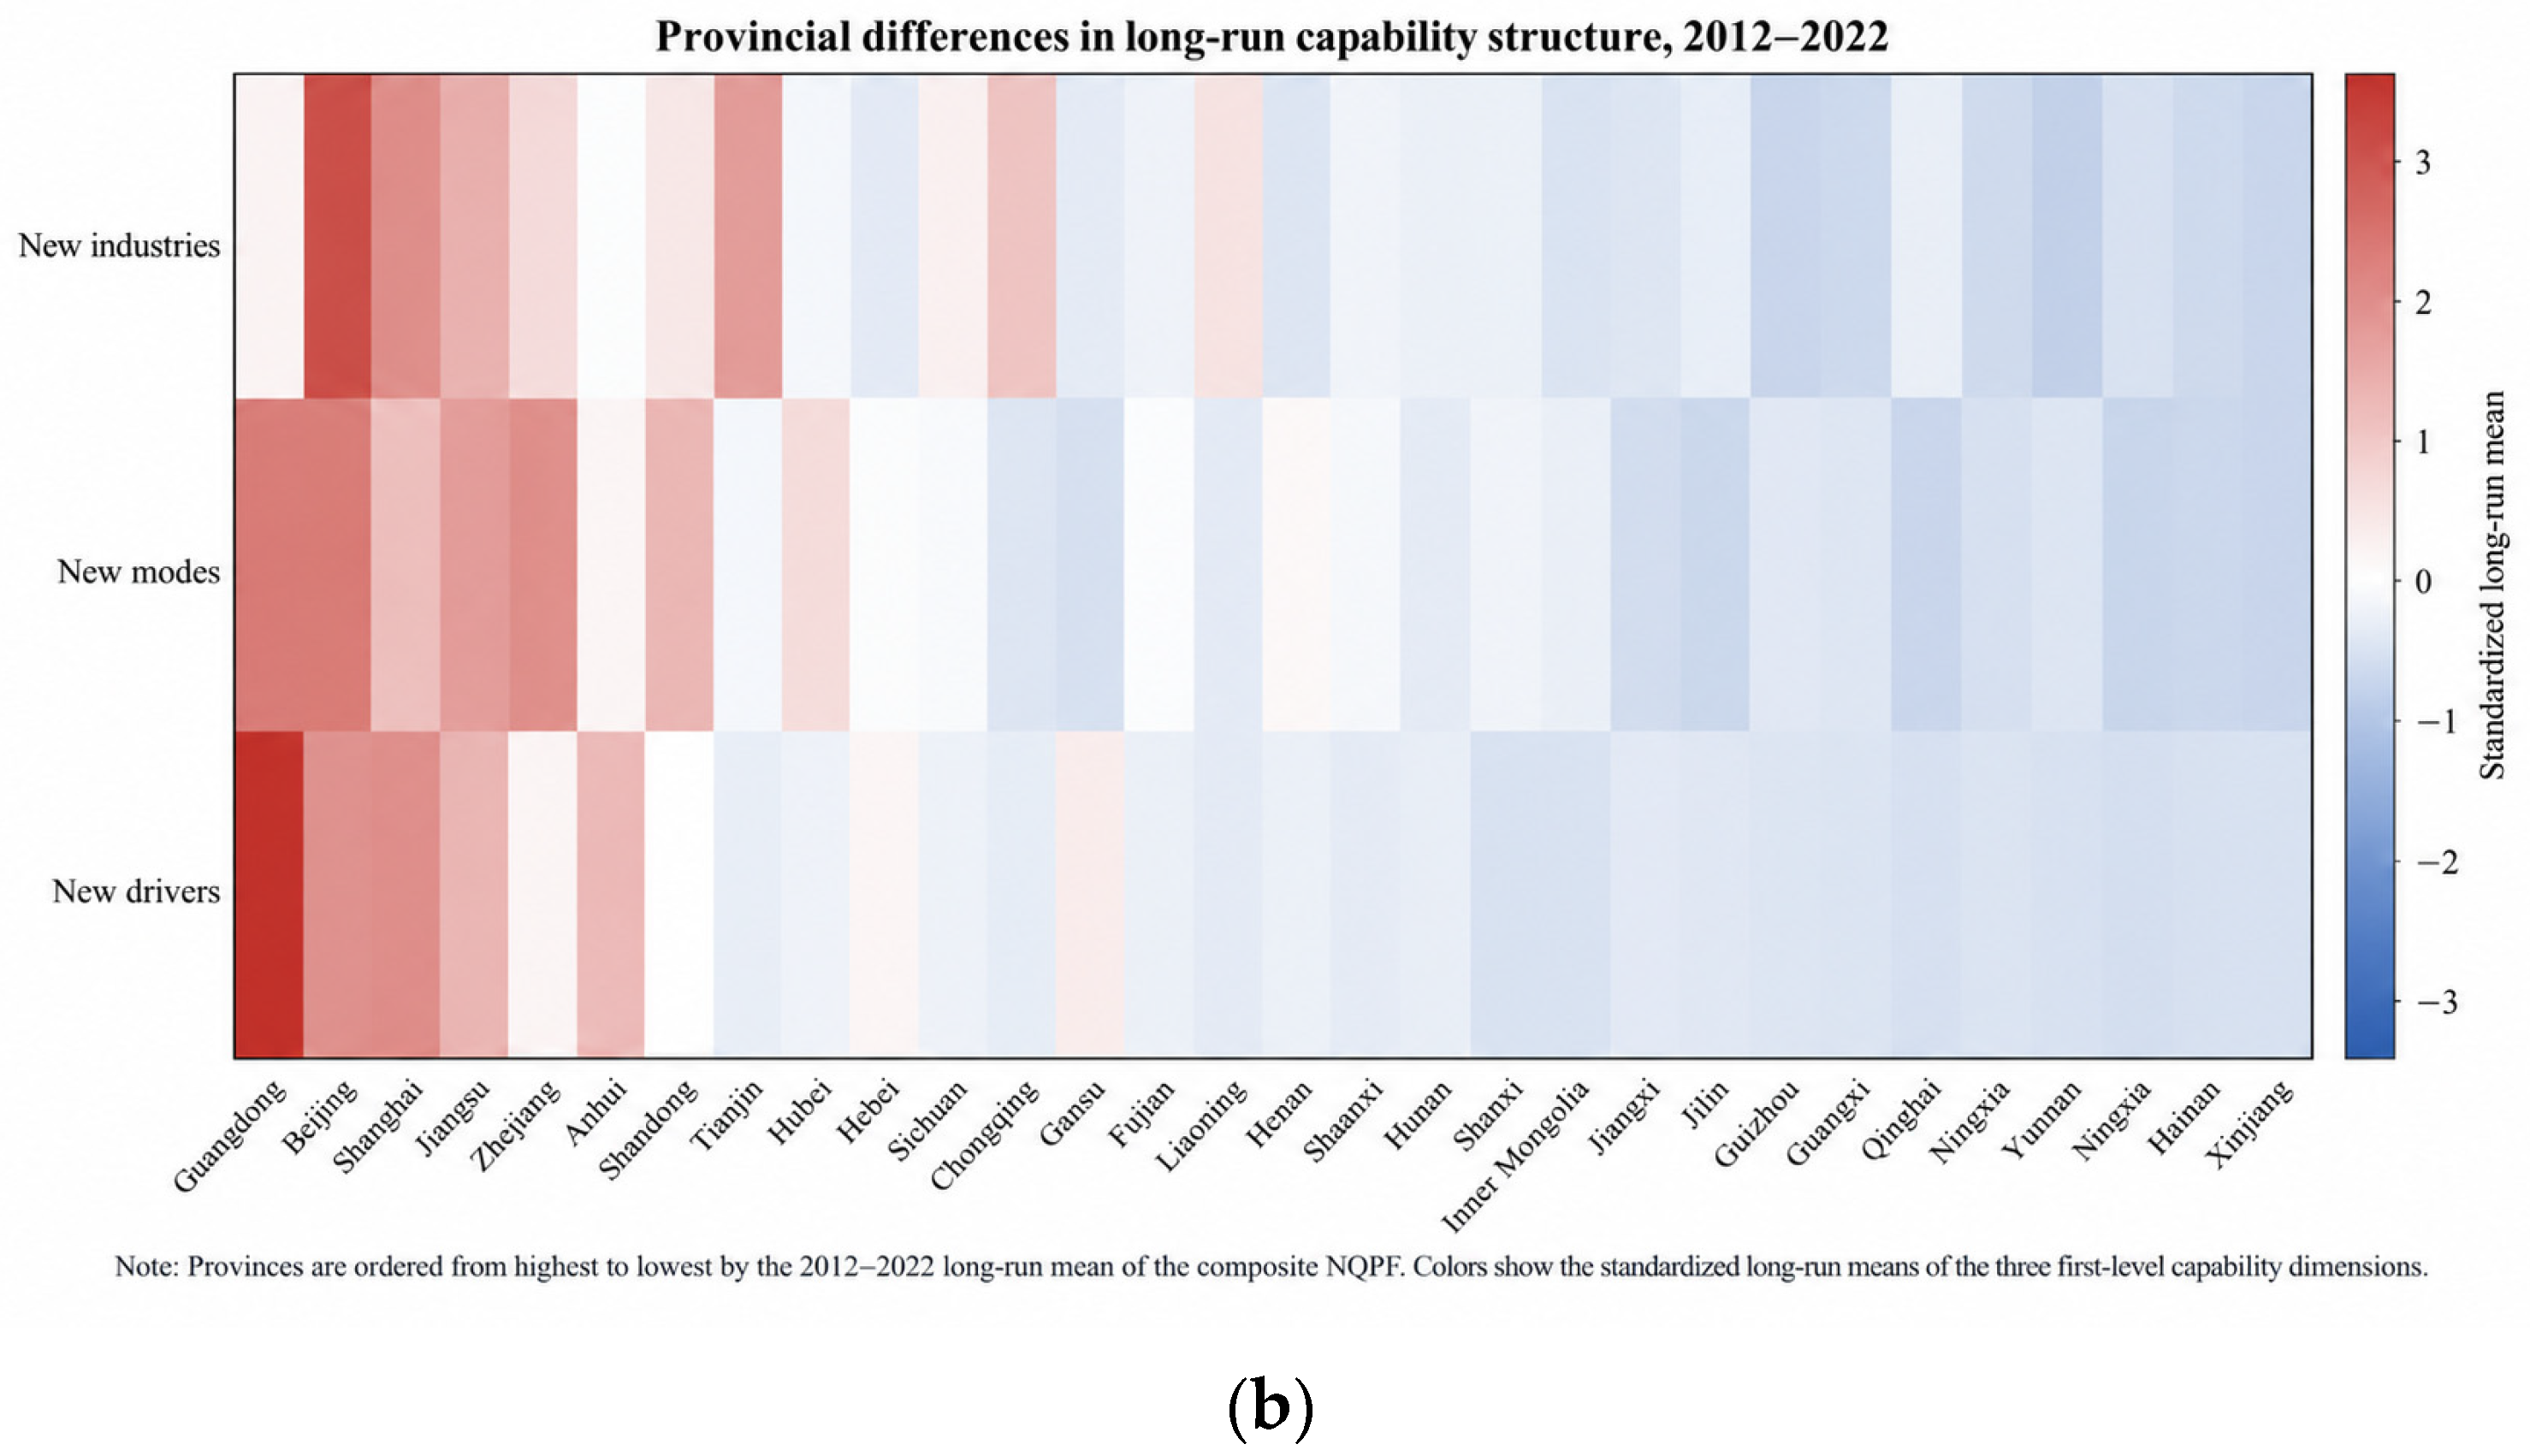
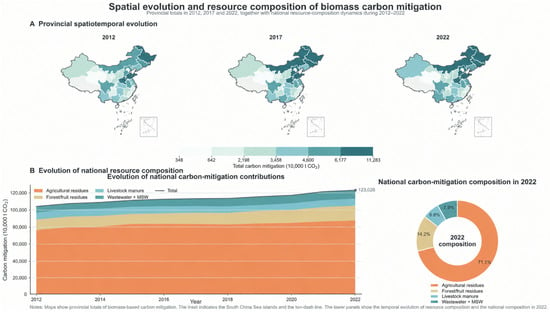
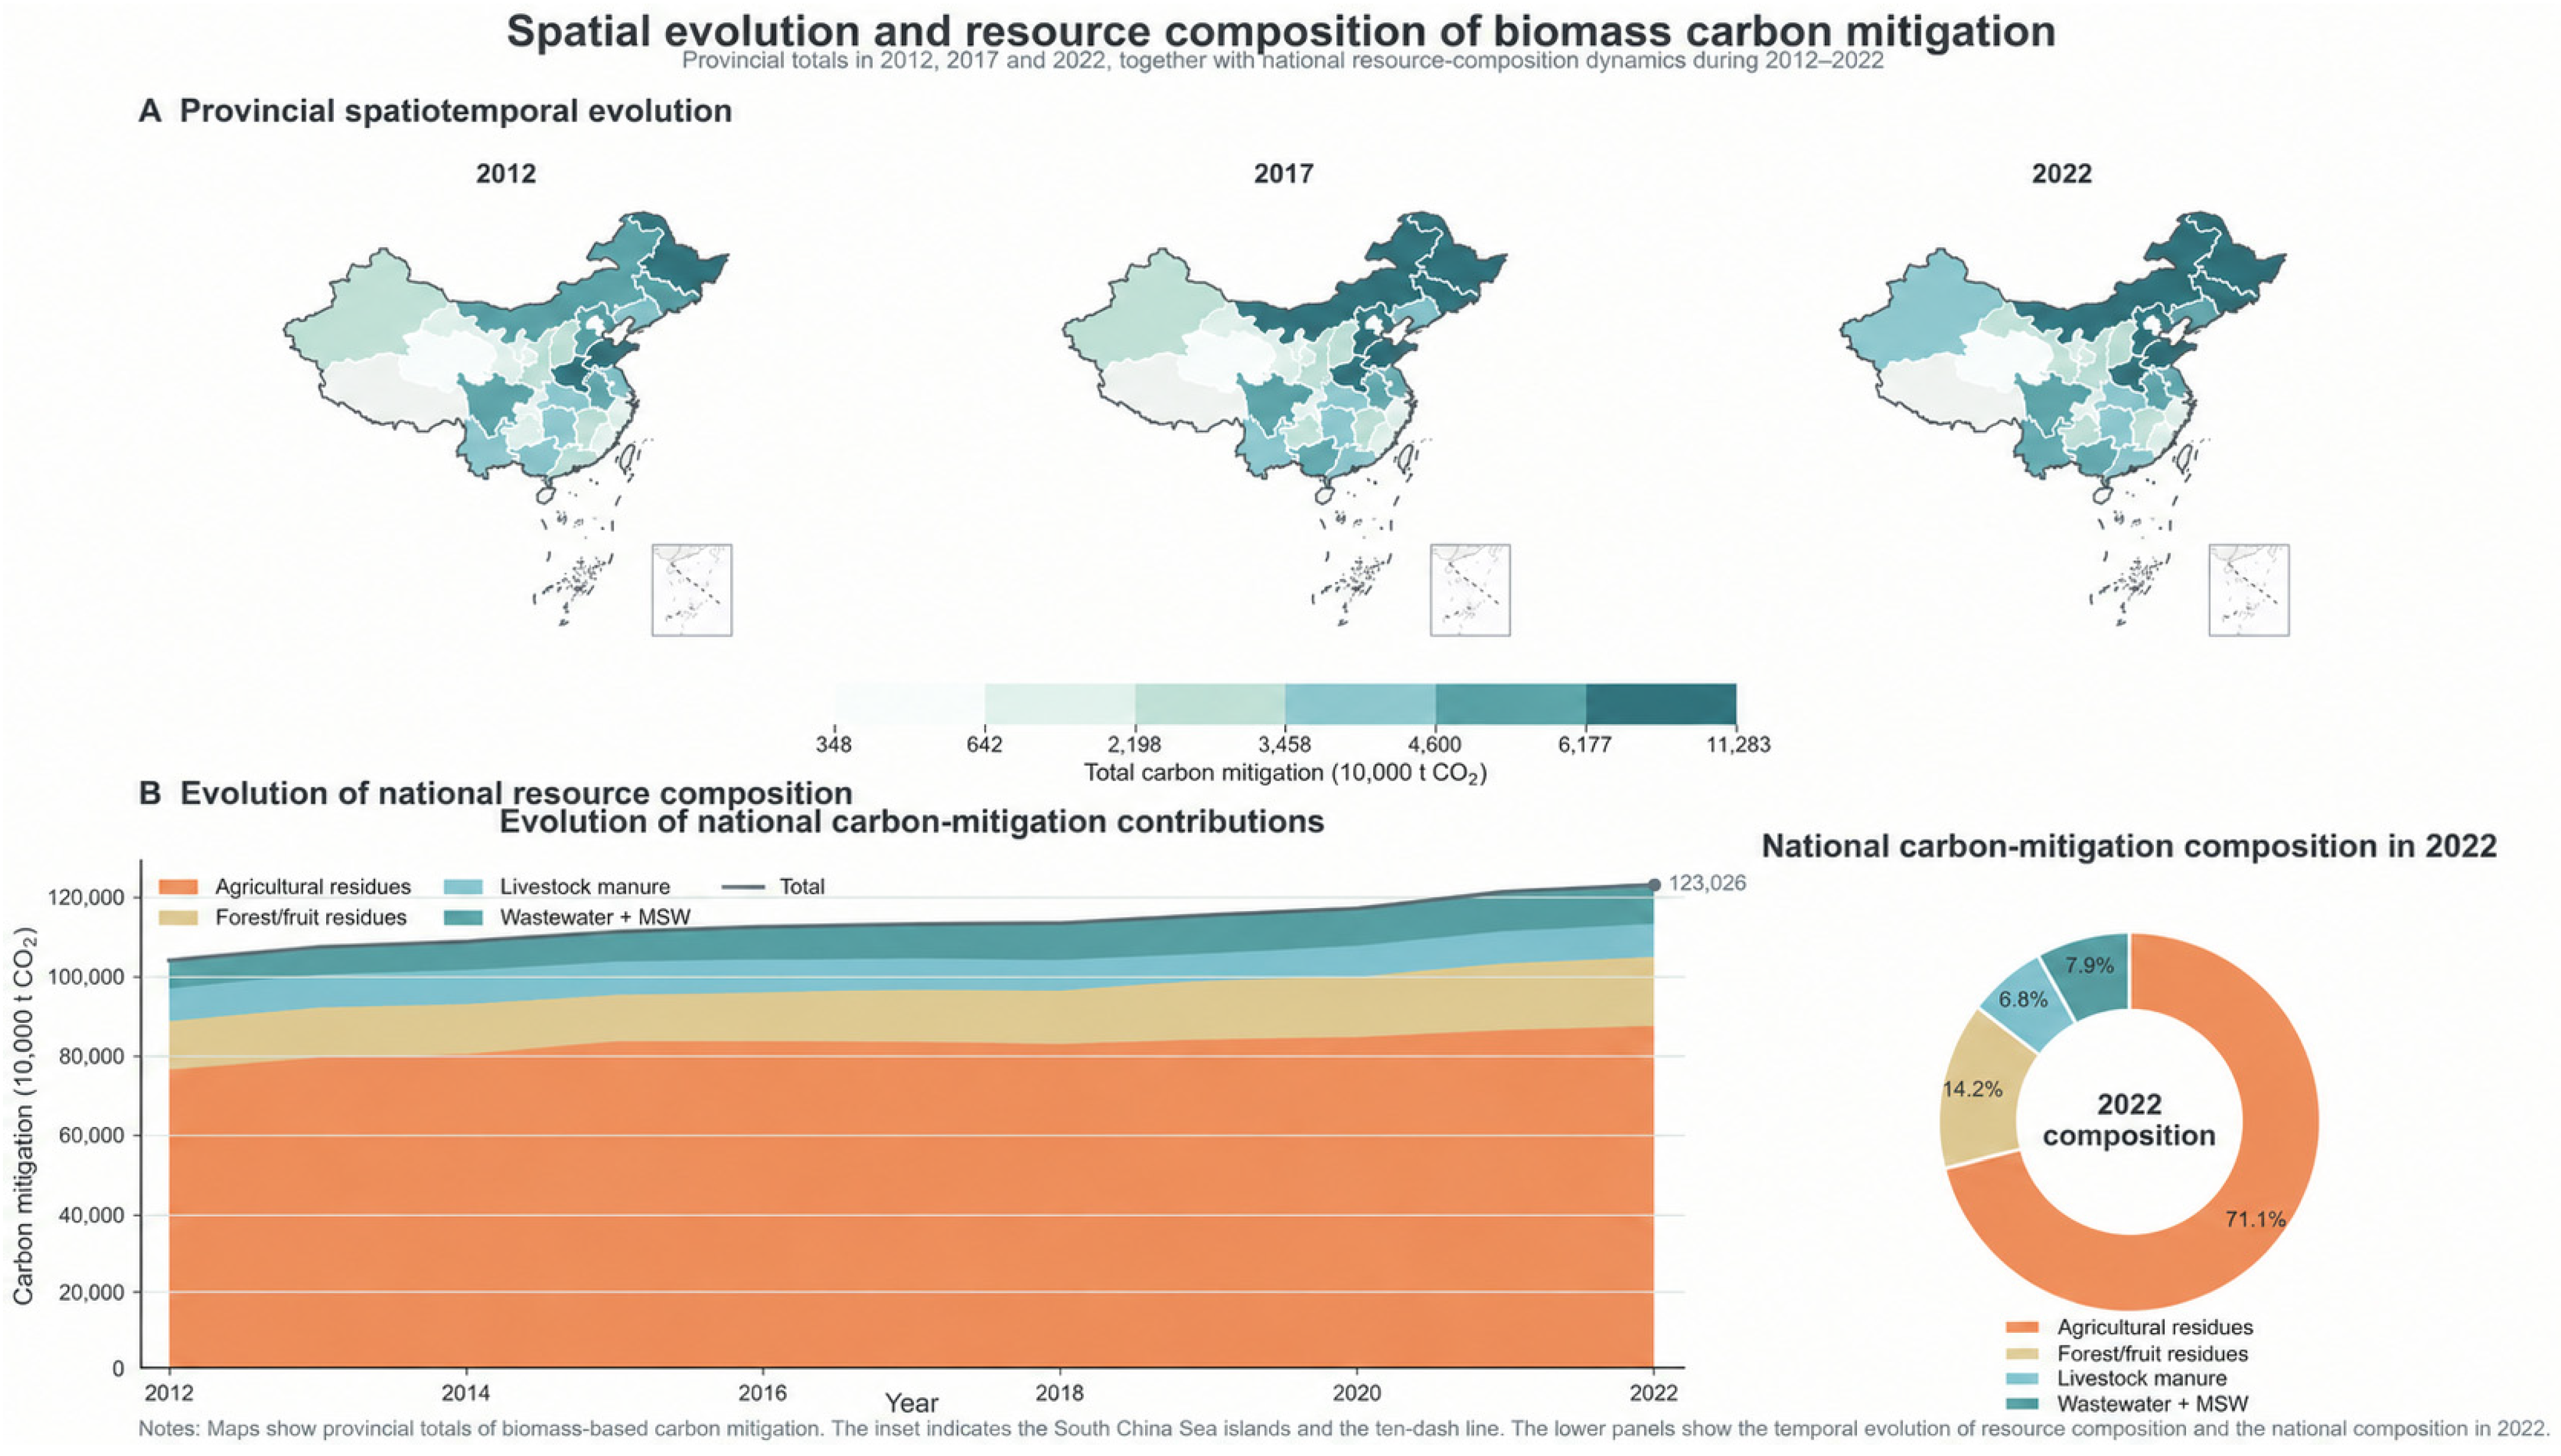
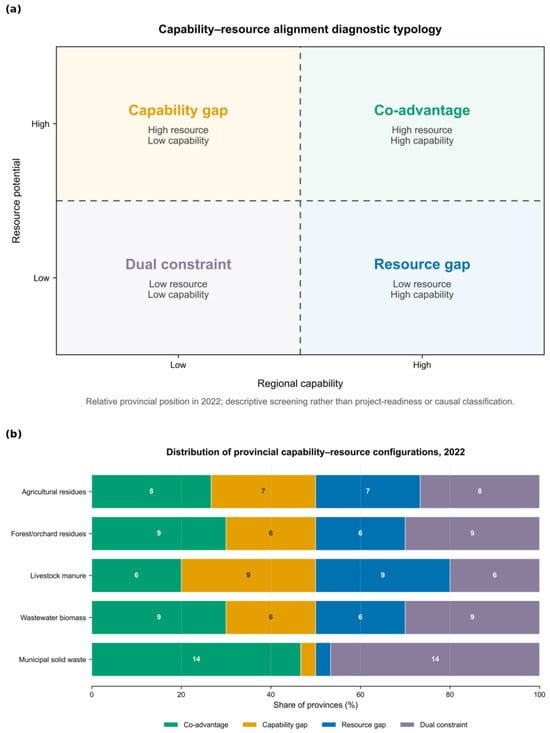

Disclaimer/Publisher’s Note: The statements, opinions and data contained in all publications are solely those of the individual author(s) and contributor(s) and not of MDPI and/or the editor(s). MDPI and/or the editor(s) disclaim responsibility for any injury to people or property resulting from any ideas, methods, instructions or products referred to in the content. |
© 2026 by the authors. Licensee MDPI, Basel, Switzerland. This article is an open access article distributed under the terms and conditions of the Creative Commons Attribution (CC BY) license.