


Abstract
Governments must choose among mitigation policies whose costs fall unevenly across the economy. We link long-term energy system scenarios to sectoral cost impacts and rank mitigation measures with a transparent multi-criteria method. Outputs from OSeMOSYS-CR, Costa Rica’s energy system model (2018–2050), are passed through the national 2017 input–output matrix to estimate cost effects on prioritized industries. Each measure group is scored on four normalized metrics: emission reductions, economic benefits, investment costs, and cost reductions for prioritized firms. Under equal weights, the top measures are road freight electrification, passenger mode shift with rail, and freight electrification with hydrogen. Across 10,000 sampled weightings, these measures rank in the top three in 100%, 81%, and 80% of cases, respectively. No other measure exceeds 19%. The ranking is robust to power-system integration cost increases of up to 50% and to externality values ranging from 50% to 130% of their central estimates.
1. Introduction
Comprehensive long-term transformations toward resilient, low-emission economies can be economically beneficial [1]. For example, several Latin American countries have recently conducted cost–benefit analyses of their decarbonization strategies, estimating economic benefits of USD 41 billion in Costa Rica [2,3], USD 140 billion in Peru [3], and an additional 0.8% of Gross Domestic Product (GDP) growth in Chile [4]. Such strategies depend largely on the transition from fossil to renewable energy [1]. Whether a 100% renewable energy system is necessary, desirable, and feasible for a country depends on its resources, its context [5,6], and the technological challenges it faces [7]. Beyond individual cases, several studies have found that renewable energy production, combined with more sophisticated production structures (i.e., higher economic complexity [8,9]), reduces environmental degradation [10,11,12], including the greenhouse gas (GHG) emissions that drive climate change.
The literature has explored the econometric relationships among growth, economic complexity, renewable energy, and emissions. European panel evidence shows that renewable energy consumption is a more reliable driver of growth than fossil fuel consumption with the effect moderated by a country’s economic complexity, openness, and institutions [13]. In turn, economic complexity and renewable energy reduce emissions [10]. However, countries whose economic complexity is lower but still growing may need more stringent renewable energy policies to avoid high pollution risks [14]. In G7 countries, economic policy uncertainty can amplify the effect of high energy intensity on pollution [15]. In the BRICS economies (Brazil, Russia, India, China, and South Africa) [11] and the sixteen largest exporting economies [12], higher economic complexity and greater use of renewable energy strengthen climate change mitigation. Moreover, a country’s readiness to export low-emission products competitively can predict lower national emissions [16]. Readiness for a low-carbon transition varies across countries [17].
Implementing decarbonization successfully requires overcoming political and economic challenges [18]: managing the jobs transition, avoiding rising inequality, securing adequate investment, and sustaining political and public support [19]. Ideally, decarbonization will create jobs in new sectors faster than jobs are lost in fossil-based activities [20], and it has even been proposed as a COVID-19 recovery measure [21]. There is, however, another way to view holistic low-carbon development: governments can prioritize the decarbonization policies that both drive emissions to zero and strengthen the industries targeted by their development strategies. The literature associates more sophisticated production structures with more high-value exports, growth, and prosperity [8].
Under this paradigm, policymakers and firms will advance decarbonization if it makes the value chain of a high-value product (i.e., an economically complex structure) more cost-efficient, for example, through low-cost renewables [22]. Avoided costs of environmental damage and natural resource depletion further increase the benefits of decarbonization and renewables [23].
Although most of the literature focuses on end-state analyses, highly renewable energy systems also require planning of the transition itself [5]. Such systems must balance supply and demand despite the intermittency of renewable sources [24] and cope with their decentralized [25] and digital [26] nature. The elements involved in deploying a highly renewable energy system include demand-side management, energy storage, and variable renewable energy resource control, among others [27]. Moreover, different policies and operational features suit the initial, intermediate, and final stages of a high-renewable transition [27]. For example, coordinating the electricity, heating, and transport systems [28], while accounting for other resources such as water [29] and land [30], could create synergies that help meet energy independence objectives [31] and address social and market concerns about the energy transition [32].
The outlook for highly renewable systems varies with resources and context. Assessments cover North America [33], the European Union [34,35,36,37,38,39], Africa [40,41,42,43,44], South and East Asia [45,46,47,48,49], and Latin America [50,51]. Three findings recur: renewable potential generally exceeds demand; storage, interconnection, and workforce readiness determine the cost of the transition; and highly renewable systems can be cheaper and less risky than carbon-based ones.
Multi-criteria decision analysis (MCDA) ranks options against several objectives. Established methods include the analytic hierarchy process, TOPSIS, PROMETHEE, and ELECTRE, and several reviews cover their use in energy planning [52,53,54,55]. We use a weighted sum of normalized metrics. This approach is simple and transparent: every score can be traced to a metric value and a stated weight. Its drawback is sensitivity to the weights, which we address by following composite-indicator practice [56] and reporting robustness across the full weight space.
In this paper, we bring together two research streams that have developed largely in isolation: climate change mitigation and national productive priorities [57]. Using scenario analysis, we develop a methodology that identifies which policies best combine emission reductions, economic benefits, positive effects on the value chains of high-value products, and financial affordability. We apply this methodology to the energy transition in Costa Rica. This middle-income country capped its 2030 emissions in the Nationally Determined Contribution (NDC) it updated in December 2020 [58], and its National Decarbonization Plan (NDP) charts an economy-wide net-zero target for 2050 [59]. Although multiple economic complexity metrics have emerged [9,13,60], we build on a previous analysis by Costa Rica’s Ministry of National Planning and Economic Policy (MIDEPLAN) [61], which identifies the value chains the government prioritizes for development.
Measures are commonly prioritized using marginal abatement cost curves (MACCs). Used alone, MACCs can lead to under-investment in expensive, large-potential options that take a long time to implement (e.g., clean transportation) [62], because they do not consider the role of capital accumulation [63]. They can also lead to over-investment in cheap options with limited potential [62]. Instead, we use scenario analysis with OSeMOSYS-CR, Costa Rica’s energy system model, which is detailed for the electricity and transport sectors [64]; we expand it to represent the energy transformation chain for industrial demand. This bottom–up model is well suited to analyzing technology regulations [65], but it relies on exogenous demand and does not predict household or firm behavior. Top–down computable general equilibrium (CGE) models are better suited to economy-wide analysis but do not assess technology regulations or stock turnover accurately [65]. Nevertheless, we exploit the model’s rich technical and economic detail to identify key policies that stakeholders cannot abandon without making the NDC and Paris Agreement goals hard to meet and forgoing cost advantages for nationally prioritized industries.
The paper is organized as follows. Section 2 presents the methodology linking bottom–up scenario analysis to the sectoral pass-through of policy costs. It also describes the scenarios analyzed in the case study (i.e., Costa Rica’s NDC and NDP energy sector measures). Section 3 applies the methodology and presents the results for the case study. Section 4 discusses the results in light of the literature, and Section 5 concludes the paper.
2. Materials and Methods
2.1. Modeling Approach
We produce long-term energy system scenarios for 2018–2050 using a bottom–up energy system optimization model (ESOM) with detailed technology cost and emission accounting. The business-as-usual (BAU) scenario holds today’s carrier mix fixed for each end use while activity scales with GDP; it describes an energy system that grows without changing its fuel shares. Other scenarios represent policy interventions that transform components of the energy system, e.g., transport electrification. Crucially, all scenarios share the same GDP growth assumptions so that energy use can be compared consistently. The OSeMOSYS-CR model [64] informed the cost–benefit analysis [2] of Costa Rica’s National Decarbonization Plan [59]. We extend this model with a detailed bottom–up representation of the industry subsector and use it to generate multiple scenarios. The online documentation (https://osemosys-cr-v2.readthedocs.io/en/latest/, accessed on 3 February 2026) lists every input and assumption, and the accompanying code is released under an open-source license (https://github.com/EPERLab/osemosys-cr-v2, accessed on 3 February 2026).
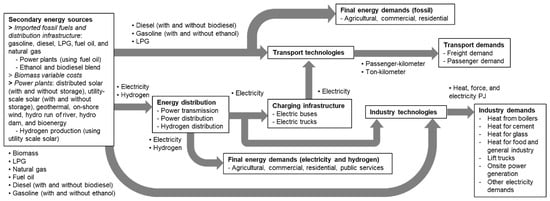
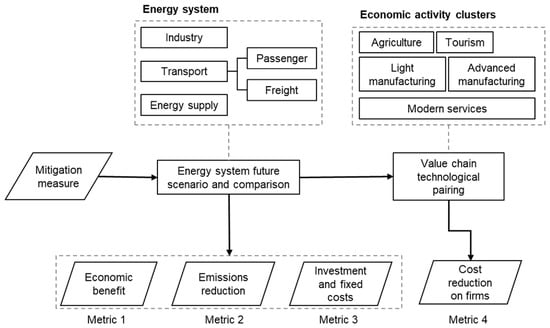
Figure 1 shows how the industry sector connects to the rest of the energy system. Secondary energy supplies all demand sectors: Costa Rica imports its fossil fuel products and generates its electricity mainly from renewable resources. The industrial subsector is represented by seven end-use services: steam from boilers; process heat for cement, glass, and food and general manufacturing; mechanical force for lift trucks; self-generated electricity; and residual electricity uses. Industrial technology capacities are expressed in kW of heat, electricity (for on-site power generation), or mechanical power (for lift trucks). To parameterize the industrial sector, we build on previous studies that characterized energy consumption by end use and economic sector [66,67]. The modeled energy system also supplies final energy demand for the agricultural, commercial, residential, and public sectors, but we do not model their end-use technologies in detail (e.g., stoves or lighting).
Figure 1.
Energy supply chain modeled in OSeMOSYS-CR for this analysis.
The basic representation of the energy and transport subsectors in OSeMOSYS-CR has been documented previously [64]; here, we expand the energy-transport interface. Passenger and freight demands are expressed in passenger-kilometers and ton-kilometers, respectively. These demands are supplied by vehicles, each of which travels an average yearly distance that depends on the vehicle type (e.g., truck or sedan). Each vehicle type has technology options that vary by fuel (e.g., electric or gasoline), and each option has a specific energy consumption per kilometer that determines final energy use. Off-road transport, domestic aviation, and shipping are outside the model’s scope.
Furthermore, the share of demand supplied by each vehicle type can differ between scenarios. For example, passenger demand can be split differently between private and public transport. Because public transport carries more passengers per trip, a scenario with a higher public transport share requires fewer private vehicles, reducing energy consumption and costs. Similarly, freight rail can reduce the number of trucks needed to move a fixed ton-kilometer demand.
Investment and production for each power plant are endogenous model results that depend on each option’s capacity constraints, relative costs, and capacity factors. The OSeMOSYS-CR version used here has an annual time resolution and therefore lacks the detailed hourly dispatch offered by other modeling tools. Hence, we assume that the model solution is always technically feasible, i.e., that solar and wind power, combined with existing hydropower and geothermal supply, can always meet demand provided that battery storage costs are accounted for.
We define demand using three methods. First, the final energy demand (by energy carrier) of the agricultural, commercial, residential, and public sectors is taken from [64]. Second, to compute transport demand, we use GDP elasticities of demand of 1.015 for freight and 0.916 for passenger transport, which were derived from vehicle fleet databases of Costa Rica’s Ministry of Finance. Several variables link mobility demand to energy consumption. For passenger transport, the number of vehicles (V) is an endogenous output that depends on the occupancy rate (OR), the average yearly distance (d), and the demand (D) supplied by a particular vehicle type k, in a given year y, following Equation (1).
Vk,y = Dk,y/(dk,y × ORk,y)
The kilometers traveled per vehicle type equal the number of vehicles multiplied by their average yearly distance. The total yearly energy consumption per vehicle type (ECk,y) equals its energy consumption per unit of distance (ECUDk,y) times the total kilometers traveled, as in Equation (2). To complete the energy-transport interface, we use the occupancy rate per vehicle type, i.e., the average number of passengers or amount of cargo carried per vehicle. Therefore, the model endogenously calculates the energy consumption required for a given distribution of passenger and freight transport demand.
ECk,y = ECUDk,y × Vk,y × dk,y
We use the elasticity (ε) to relate growth in passenger trip demand to GDP growth. Telework and other digitalization strategies can decouple GDP growth from passenger demand. Equation (3) shows how we project demand (before distance adjustments) as a function of GDP. Successfully decoupling growth in passenger trips (across both private and public vehicle classes) from GDP growth reduces ε∆%GDP.
Investments in rail and urban interventions encourage passengers to switch from private to public modes or to cycling and walking (i.e., non-motorized transport). Equations (4) and (5) reallocate passenger demand among private, public, and non-motorized classes using two scenario factors: the share moved to public transit (MSPT) and the share moved to walking and cycling (MSNMT). Applying the MSPT and MSNMT factors changes demand between scenarios for the private and public vehicle classes: Kprivate and Kpublic, respectively. The split among the specific vehicle types that provide private or public transport trips remains constant; e.g., we do not change the shares of buses, minibuses, and taxis in public transport.
In the BAU scenario, the modal split is held at its base-year value in every year: 24% of motorized passenger-kilometers on public modes and 76% on private vehicles. A lack of urban densification (e.g., urban sprawl) increases travel distances and, thus, demand. Equation (6) shows how distance affects demand.
Dk,y,with distance adjustments = Dk,y, without distance adjustments × dk,y/dk,2018
Freight demand projections follow Equation (3) for the heavy and light truck vehicle classes: Kheavy truck and Klight truck, respectively. The same average distance adjustment applied to passenger vehicles also affects freight demand (see Equation (6)). In addition, rail investments drive a modal shift in heavy freight. However, whether logistics firms prefer freight rail over trucks is uncertain. Hence, the model estimates freight rail investment requirements as a function of the unit cost of rail services, which is also uncertain. Equation (7) shows the impact of the freight modal shift to rail (FMSR) on the freight demand supplied by heavy trucks.
Third, Equation (8) projects industrial demand: for each end-use activity A in Figure 1, energy demand (ED) in year y equals its energy intensity (EI) multiplied by that year’s GDP. We obtain base-year industrial energy demand and intensities from [67] and assume that intensities decrease by 20% by 2050. GDP and GDP growth are taken from [68] up to 2022; thereafter, GDP growth gradually reaches 3% by 2024 and remains constant for the rest of the period.
EDA,y = EIA,y × GDPy
Finally, for all scenarios, we assume a 1.9% annual increase in fossil fuel import costs, following the crude oil price trajectory of the Stated Policies Scenario in [69]. We do not analyze the implications of deep uncertainty in fuel prices, as seen in [2], where all technology and fuel costs were treated as uncertainties.
Table 1 lists each data source, its vintage, and its access date. The model horizon is 2018–2050, and economic results are reported as yearly averages over 2021–2050. Table 2 reports the externality unit values as implemented in the model inputs.
Table 1.
Data sources, vintages, and calculation conventions.
Table 2.
Externality unit values as implemented in the OSeMOSYS-CR model inputs. Method as in [64].
2.2. Linking Decarbonization Scenario Analysis and Sectoral Cost Pass-Through
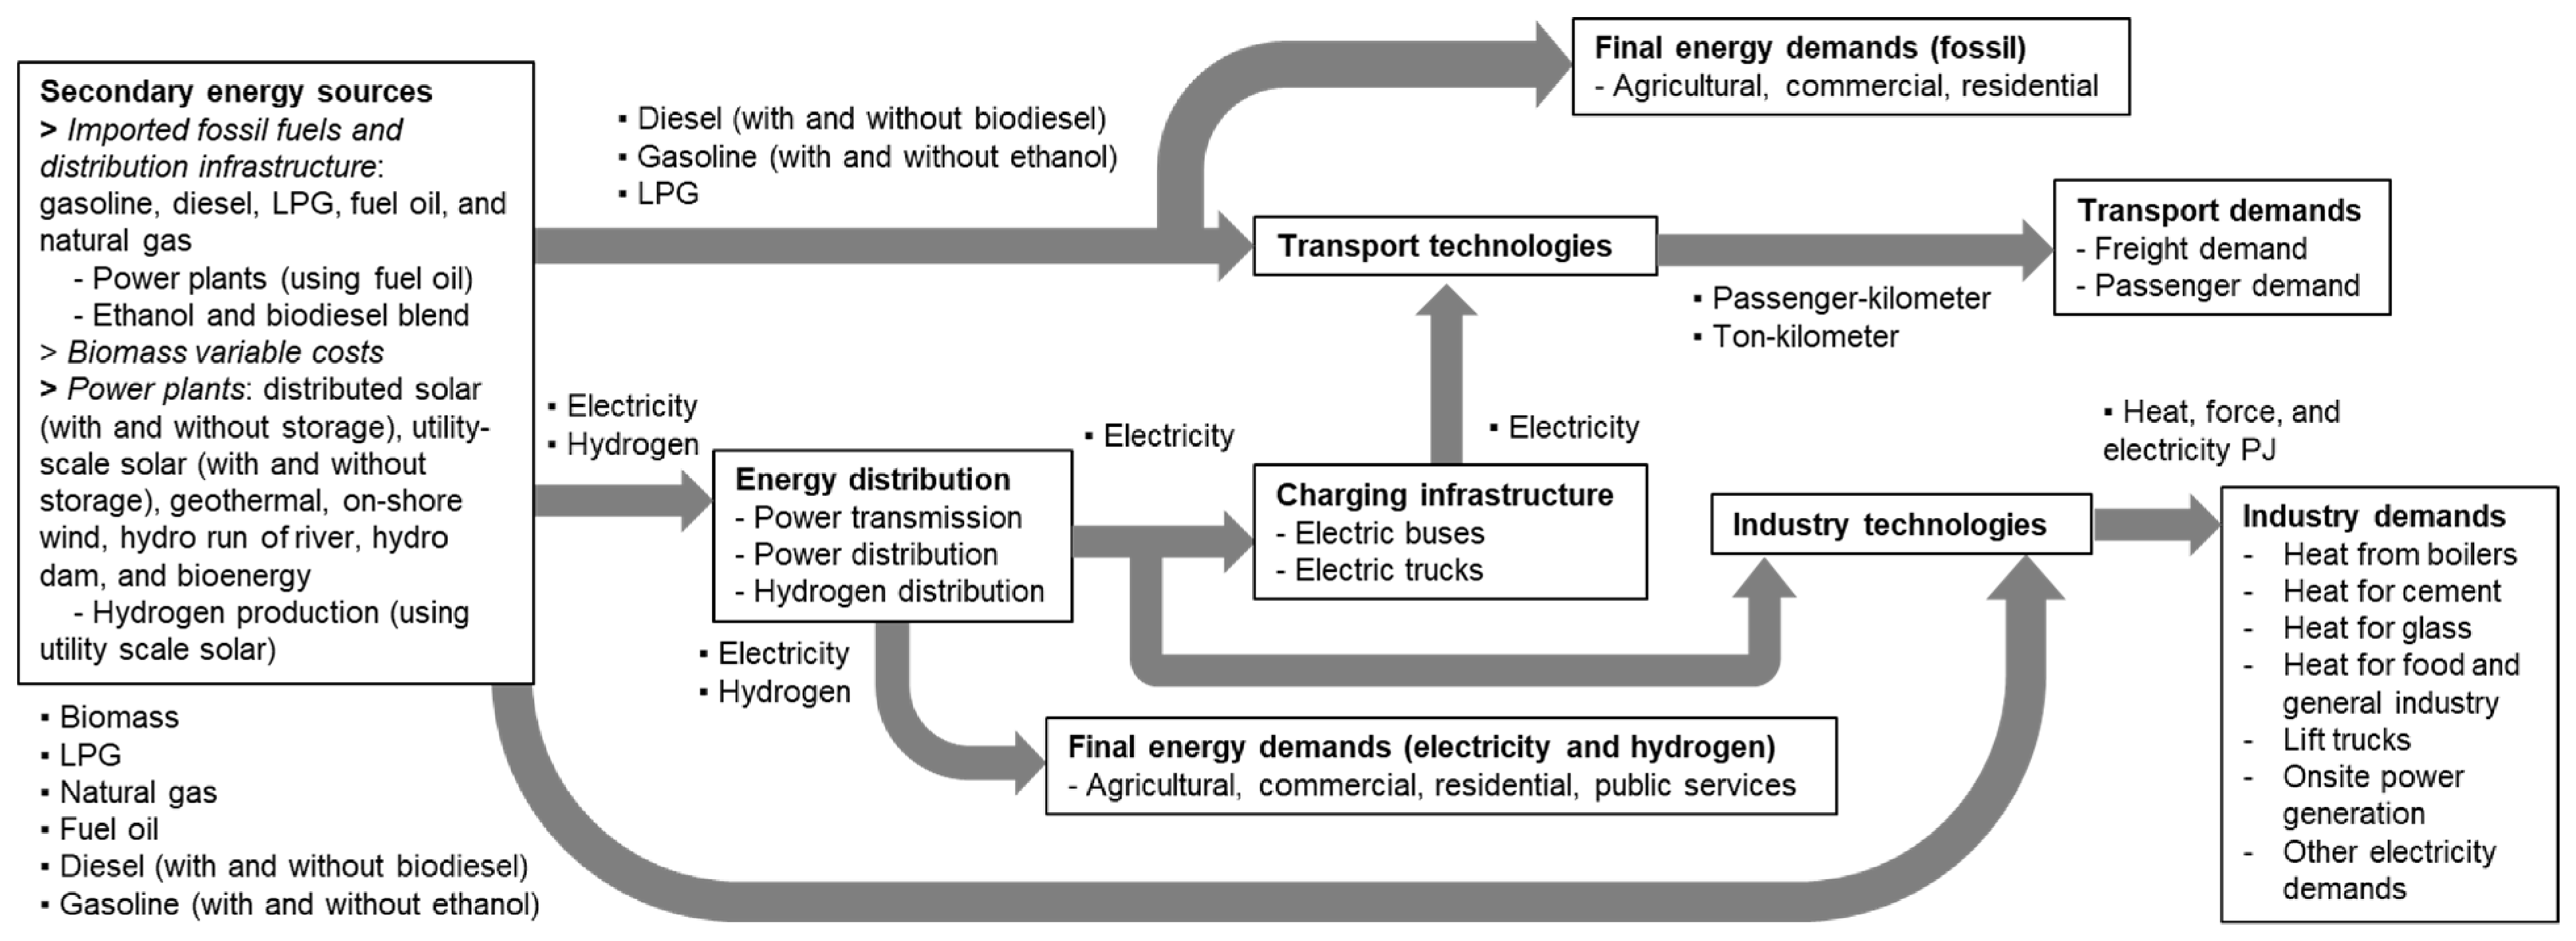
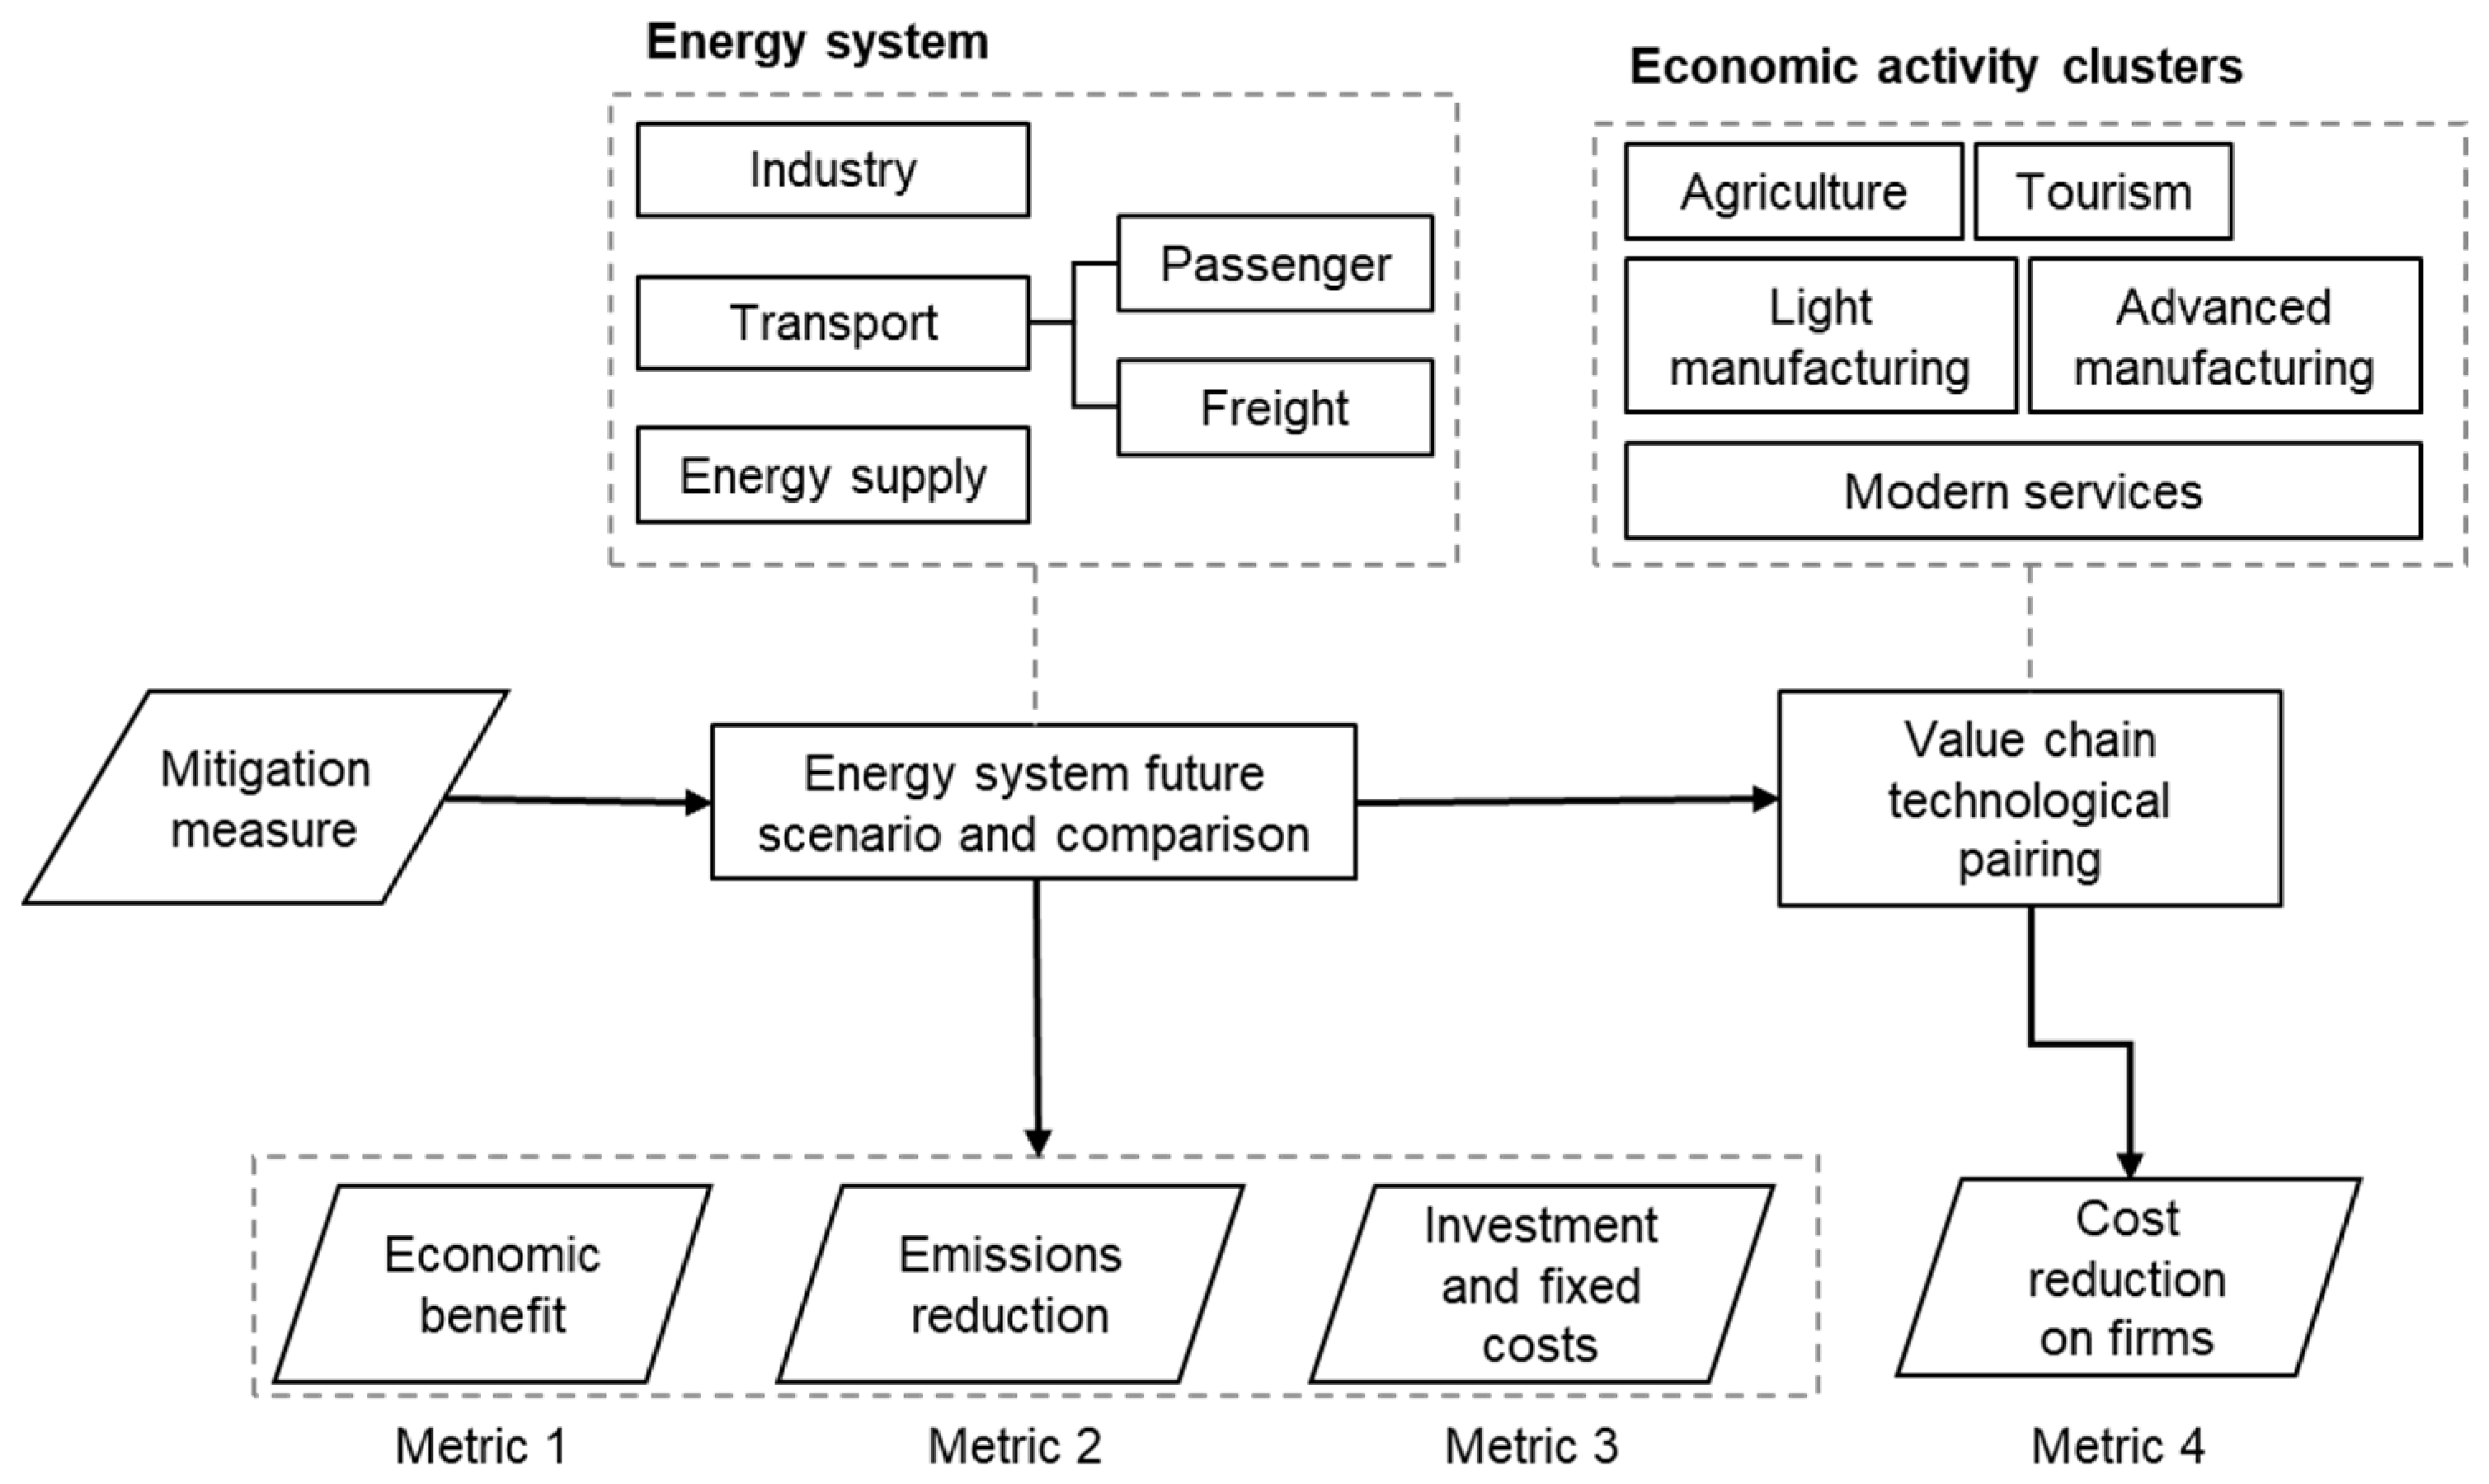
The structure of OSeMOSYS-CR makes it easy to create multiple deterministic scenarios and test plausible mitigation measures. We use Costa Rica’s input–output matrix [70] to understand how technical changes in the energy system affect economic activities. Figure 2 shows the methodological link between mitigation measures, energy system scenario comparison, and value chain technological pairing, i.e., the link between the technology modeling in OSeMOSYS-CR and the changes in economic activity values in the input–output matrix. MIDEPLAN’s Territorial Economic Strategy [61] identifies the activities that the government prioritizes for promotion (see Table 3). Alternatively, countries can use the Atlas of Economic Complexity [71] to identify the economic activities to prioritize.
Figure 2.
The process to calculate the metrics of merit of every mitigation measure.
Table 3.
Economic activity clusters prioritized in Costa Rica’s Territorial Economic Strategy (MIDEPLAN). Source: authors’ elaboration based on [61].
Following Figure 2, the evaluation of each scenario (S) yields four metrics. The first three metrics come directly from OSeMOSYS-CR outputs: the economic benefit (EB), the emission reduction (ER), and the investment plus fixed cost (IFC). Equation (9) defines the economic benefit, i.e., the cost difference between a benchmark scenario (B) and the scenario of interest (S). If costs are higher in the benchmark scenario than in the scenario of interest, the economic benefit is positive. The costs are capital (CAPEX), operational (OPEX, variable and fixed), and externalities (linked to congestion, health, and accidents in the transport sector [64]). Emission reductions follow the same logic, using cumulative emissions instead of costs (Equation (10)).
The fourth metric, the cost reduction in firms (CRF), assesses the impact of decarbonization on the costs of the economic activities prioritized by the national industrial strategy. It is the cost change, or reduction in intermediate demand, of the economic activities in Table 3, computed as the sum of the effects of shocks (k) on the economic activities of interest (EA) in a scenario (S), as in Equation (11).
The cost reduction in firms is the change in intermediate demand caused by each measure’s cost shocks, which is expressed as a share of GDP. We compute two variants of this metric: a use-side variant, which underlies the main ranking, and a production-minus-use variant, which is the only one that can be reproduced at the shock level. Section 3.4 states which variant each test uses. The top four measures are the same under both variants.
A shock (k) reduces the consumption of a specific economic activity, such as fossil fuel imports, across the economy (see Section 2.3). The impact on the economic activities in Table 3 depends on how much of the shocked activity they consume, particularly relative to other consumers. We derive these consumption shares from the input–output matrix (see Section 2.3).
The third metric, IFC, captures the funds that actors must raise to finance the transformation. A measure with a smaller IFC is more affordable nationally regardless of its other merits.
EBs = Total CAPEXB + Total OPEXB + Total ExternalitiesB − Total CAPEXS − Total OPEXS − Total ExternalitiesS
ERs = Cumulative EmissionsB − Cumulative EmissionsS
Each metric is normalized with min–max scaling, as in Equations (12)–(15). The minima and maxima are taken over the scenarios that share the business-as-usual benchmark (Group 1). This bounds every normalized metric to the interval [0, 1], following composite-indicator practice [56]. Equation (14) is inverted so that cheaper measures score higher. The metric of merit (mm) in Equation (16) is the weighted sum of the four normalized metrics with one weight per metric: wEB, wER, wIFC and wCRF. We explore several weightings of the metric of merit: (i) emissions only; (ii) emissions and economic benefits, which are weighted equally; (iii) emissions, economic benefits, and cost reduction in firms, which are weighted equally; and (iv) all four metrics, which are weighted equally (25% each).
EB_norms = EBs/EB100% renewable decarbonization
2.3. Value Chain and Technological Pairing
In the input–output matrix, economic activities consume the outputs of other economic activities. For example, Table A1 shows how economic activities consumed fossil fuel imports, vehicle imports, and electricity supply, in monetary terms, in 2017 [70]. Consumption by productive activities makes up the intermediate demand: 69.3% of fossil fuel imports, 5.7% of vehicle imports, and 66% of electricity (Table A1). Households consume 21.7% of fossil fuel imports, 44.5% of vehicle imports, and 32.6% of electricity. Notably, 45.8% of vehicle imports are recorded in the gross capital formation account, reflecting their nature as durable goods.
Knowing how much of an activity is consumed by each other activity allows cost changes to be distributed among the consuming activities. Table 4 shows how we associate OSeMOSYS-CR outputs with economic activities for a total of 10 cost changes or shocks. Cost changes are measured relative to a benchmark scenario (see Section 2.4). The total cost change results from changes in several accounts: capital, fixed, and variable costs by sector (i.e., industry, transport, fossil fuels, and civil infrastructure). Hence, each OSeMOSYS-CR account (or cost component) causes a distinct shock with direct and indirect effects on the value chain (Table 4). The direct and indirect effect columns list the consumed economic activity associated with each shock. To select the consuming (or impacted) economic activities, some of which appear in Table 3, we apply the following criteria:
Table 4.
Association between OSeMOSYS-CR cost modeling and the input–output matrix.
- Freight-related economic activities that consume fossil fuels, besides freight itself, are crop cultivation, forestry, livestock, trade, vehicle maintenance, construction, extractive activities, and chemical and fuel production and transportation;
- Industry-related economic activities that consume fossil fuels are fabrication (of any good), manufacturing, and food and beverage processing;
- Passenger-related economic activities that consume fossil fuels are car rentals, accommodation, recreational, and knowledge economy activities;
- Freight-related economic activities that require vehicle maintenance, besides freight itself, are trade, construction, quarrying, dairy, and livestock;
- Passenger-related economic activities that import vehicles, besides transport activities, are health, accounting, car rentals, and administrative support;
- All other relationships between consumed and impacted economic activities are derived endogenously from the input–output matrix, i.e., the shocks with only direct effects.
In reality, cost changes in the power sector will be distributed among economic activities differently from the pattern in the 2017 input–output matrix. Hence, the main analysis does not include power cost increases as a shock; otherwise, the firms that consume the most electricity today would bear the largest impact. Section 3.4 tests the effect of including them. Understanding the new cost structure of electricity consumers is left for future work.
2.4. The Scenario Set up for Energy Sector Mitigation Measures in Costa Rica
This section describes the scenarios. First, Table 5 lists the measures of the National Decarbonization Plan (NDP) scenario, which combines measures across all sectors, based on [2,64]. Second, Table 6 describes the scenarios that each represent a single measure implemented at three levels of climate ambition; most measures relate to an NDC contribution. The NDP does not include all of the listed measures. For example, the elasticity of passenger and freight transport to GDP is difficult to define. Unlike zero-emission vehicle (ZEV) penetration, elasticities depend on exogenous variables that the government cannot directly influence. These variables are therefore uncertainties from a policy perspective and are not included in Table 5. Table S1 lists each scenario with its benchmark scenario, i.e., the scenario against which economic variables (benefits, investment and fixed costs, and cost reduction in firms) and emissions are compared. Table S2 maps each measure to its strategy identifier, scenario codes, and benchmark.
Table 5.
Parameter settings used to represent each NDP measure in OSeMOSYS-CR.
Table 6.
Description of energy sector mitigation measures by ambition level.
The main ranking compares only the scenarios benchmarked against BAU (Group 1). Strategies 13 and 14 are built against decarbonized power-system baselines, and results measured against different baselines are not comparable. These two strategies therefore appear in the scenario descriptions but not in the cross-measure ranking presented in Section 3.
3. Results and Analysis
3.1. Techno-Economic Performance
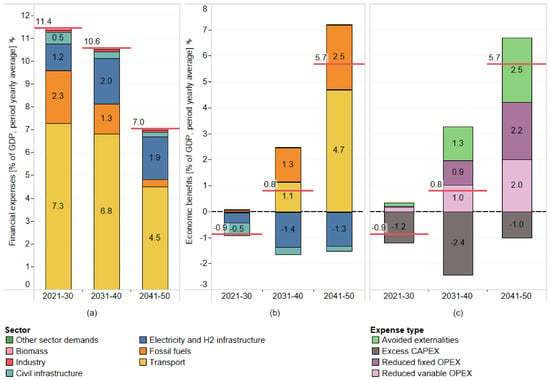
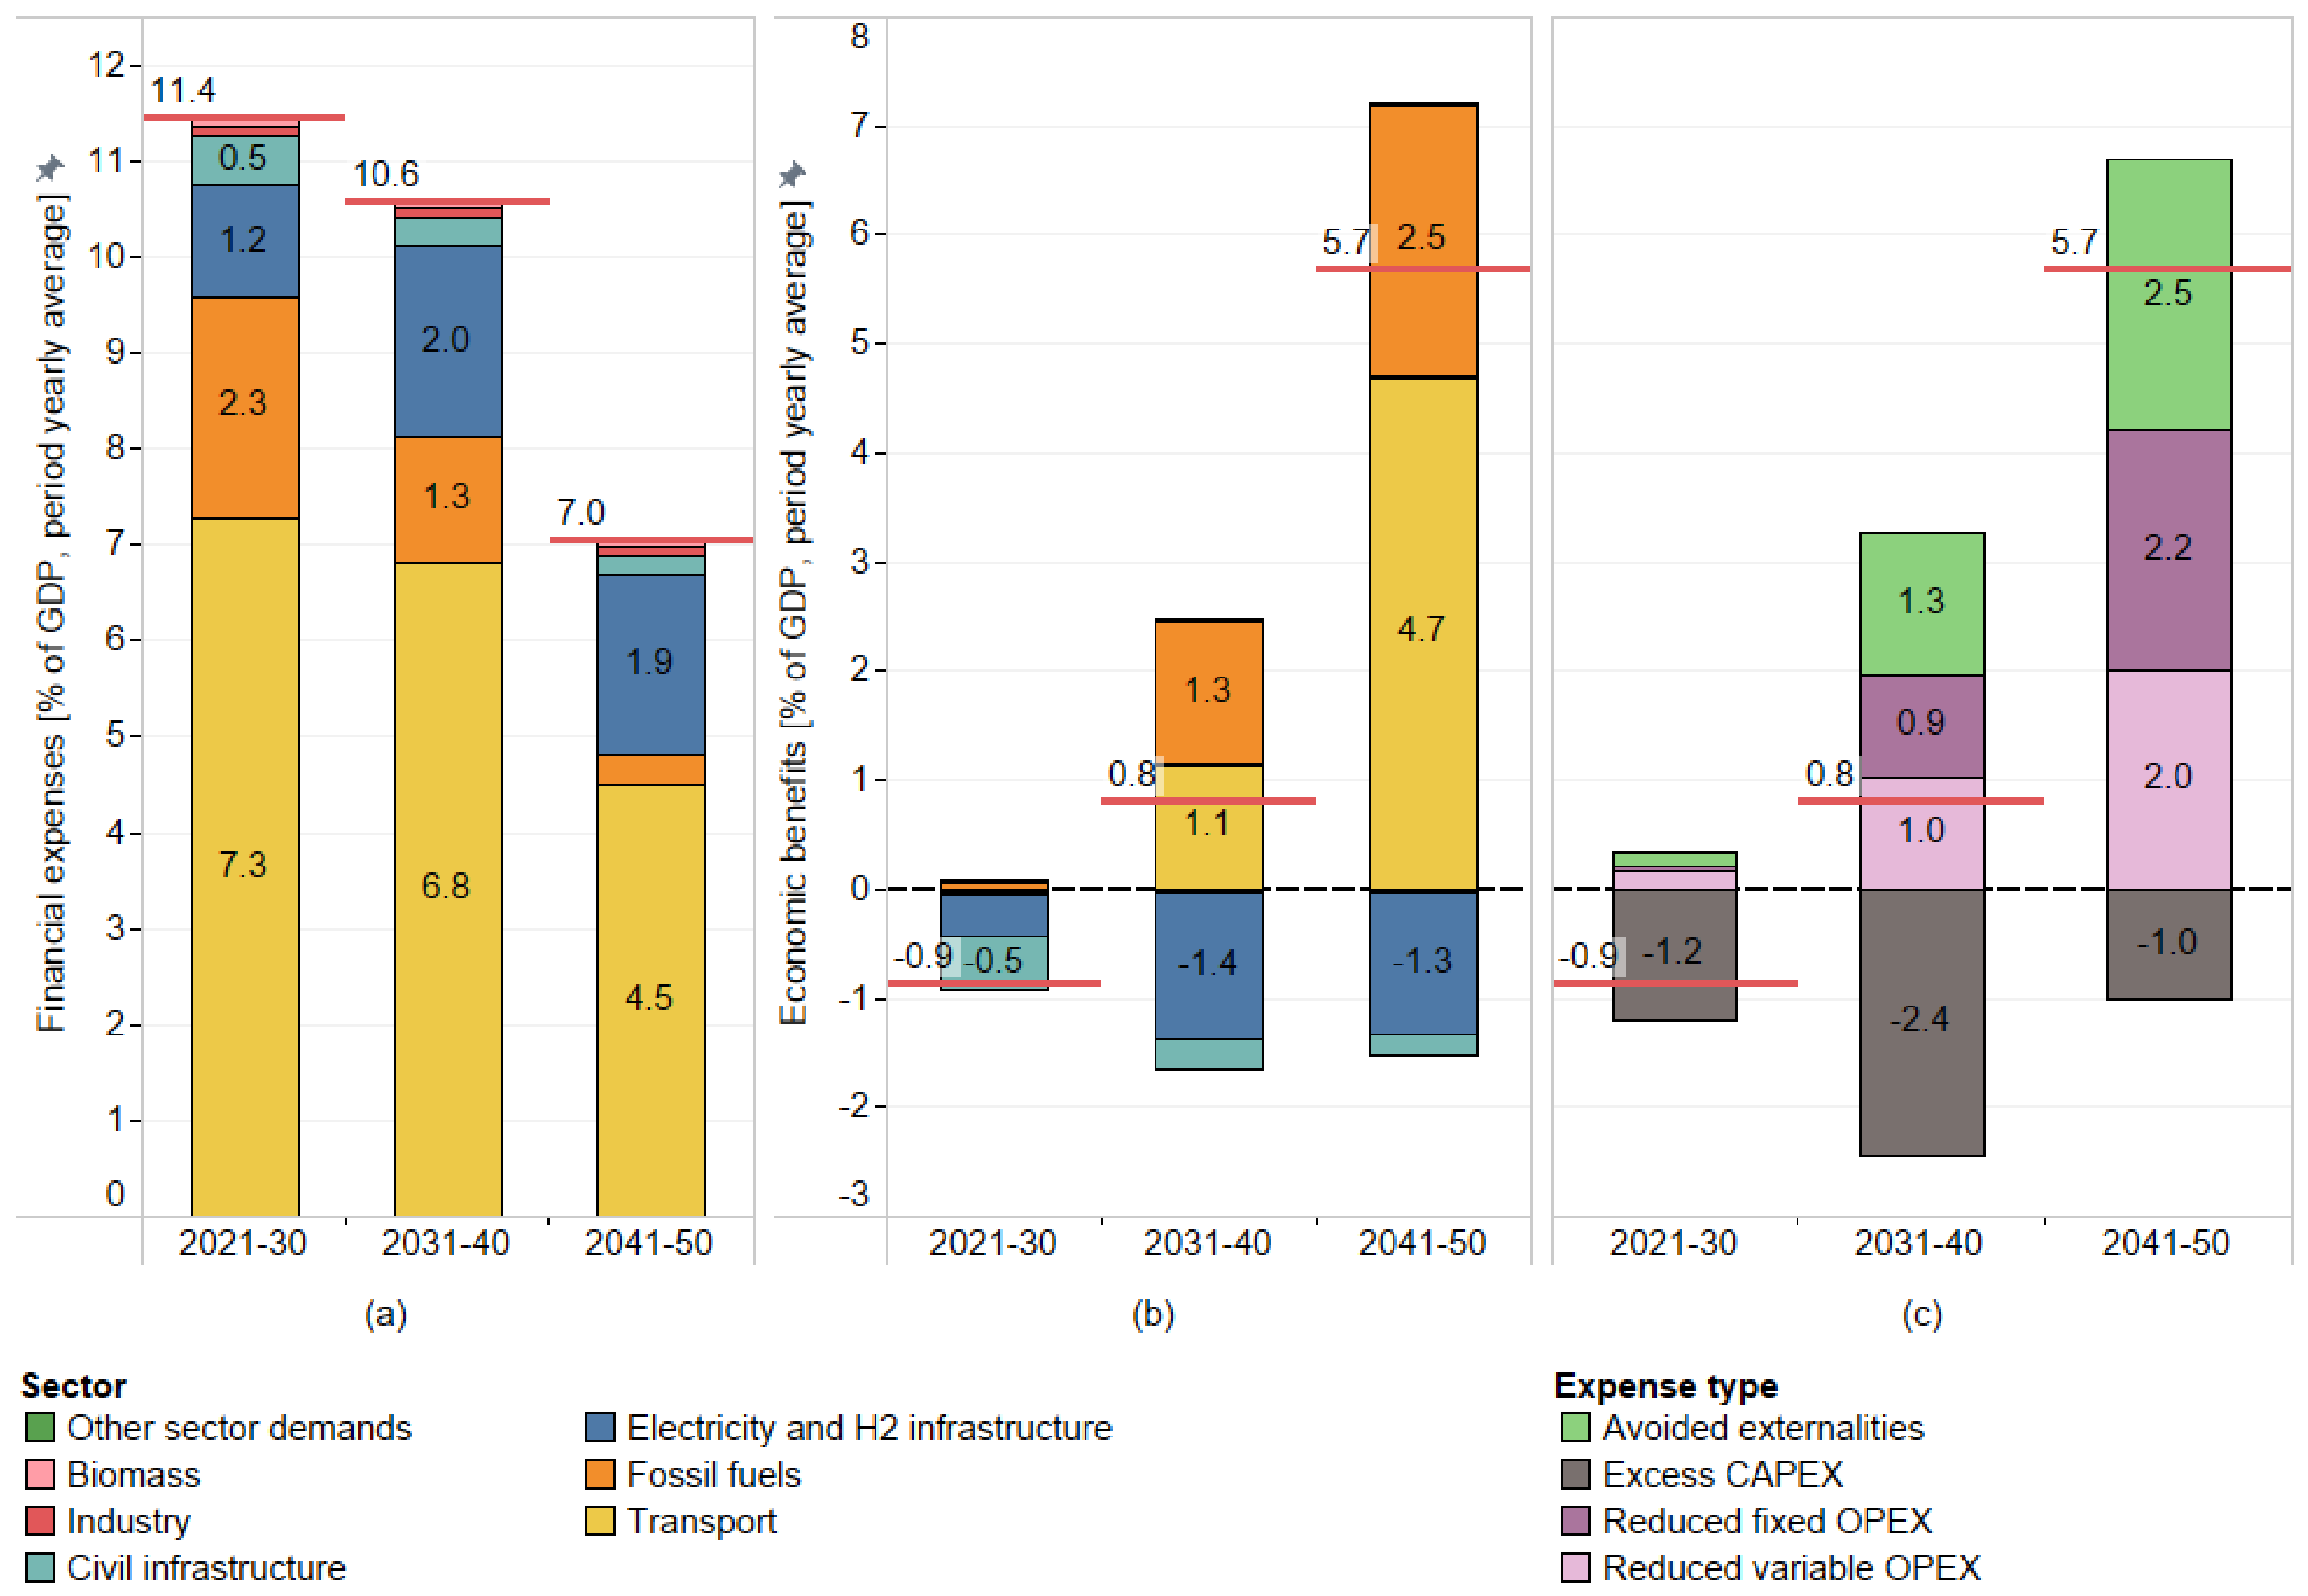
Financial expenses are the sum of CAPEX and OPEX, whereas economic benefits are defined in Equation (9). Figure 3 shows the results for the NDP scenario described in Table 5. The energy system’s costs decrease in the last decade of the horizon (Figure 3a). Transport costs remain the highest but decrease by 2.8 percentage points of GDP between the first and last decades of the analysis. In turn, economic benefits, i.e., the costs avoided relative to BAU, are highest in the last decade (Figure 3b). Avoided fossil fuel and transport costs yield the largest benefits, which is mainly because of avoided externalities (Figure 3c). Evidence from the United States similarly shows that electrifying long-haul freight raises private costs but substantially lowers external costs, yielding net societal savings as the transition advances [72]. Additional capital spending peaks during 2031–2040, when the electricity and hydrogen (H2) networks must expand fastest.
Figure 3.
NDP scenario, decadal averages 2021–2050: (a) financial outlays by sector; (b) net economic benefit relative to BAU by sector; (c) net economic benefit by expense type.
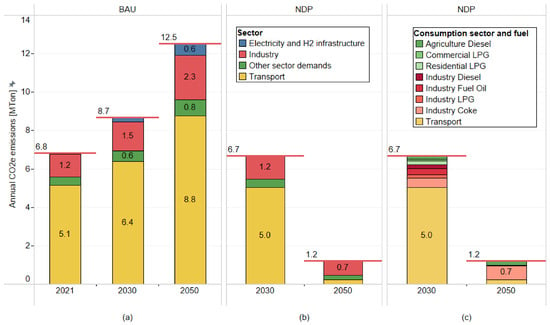
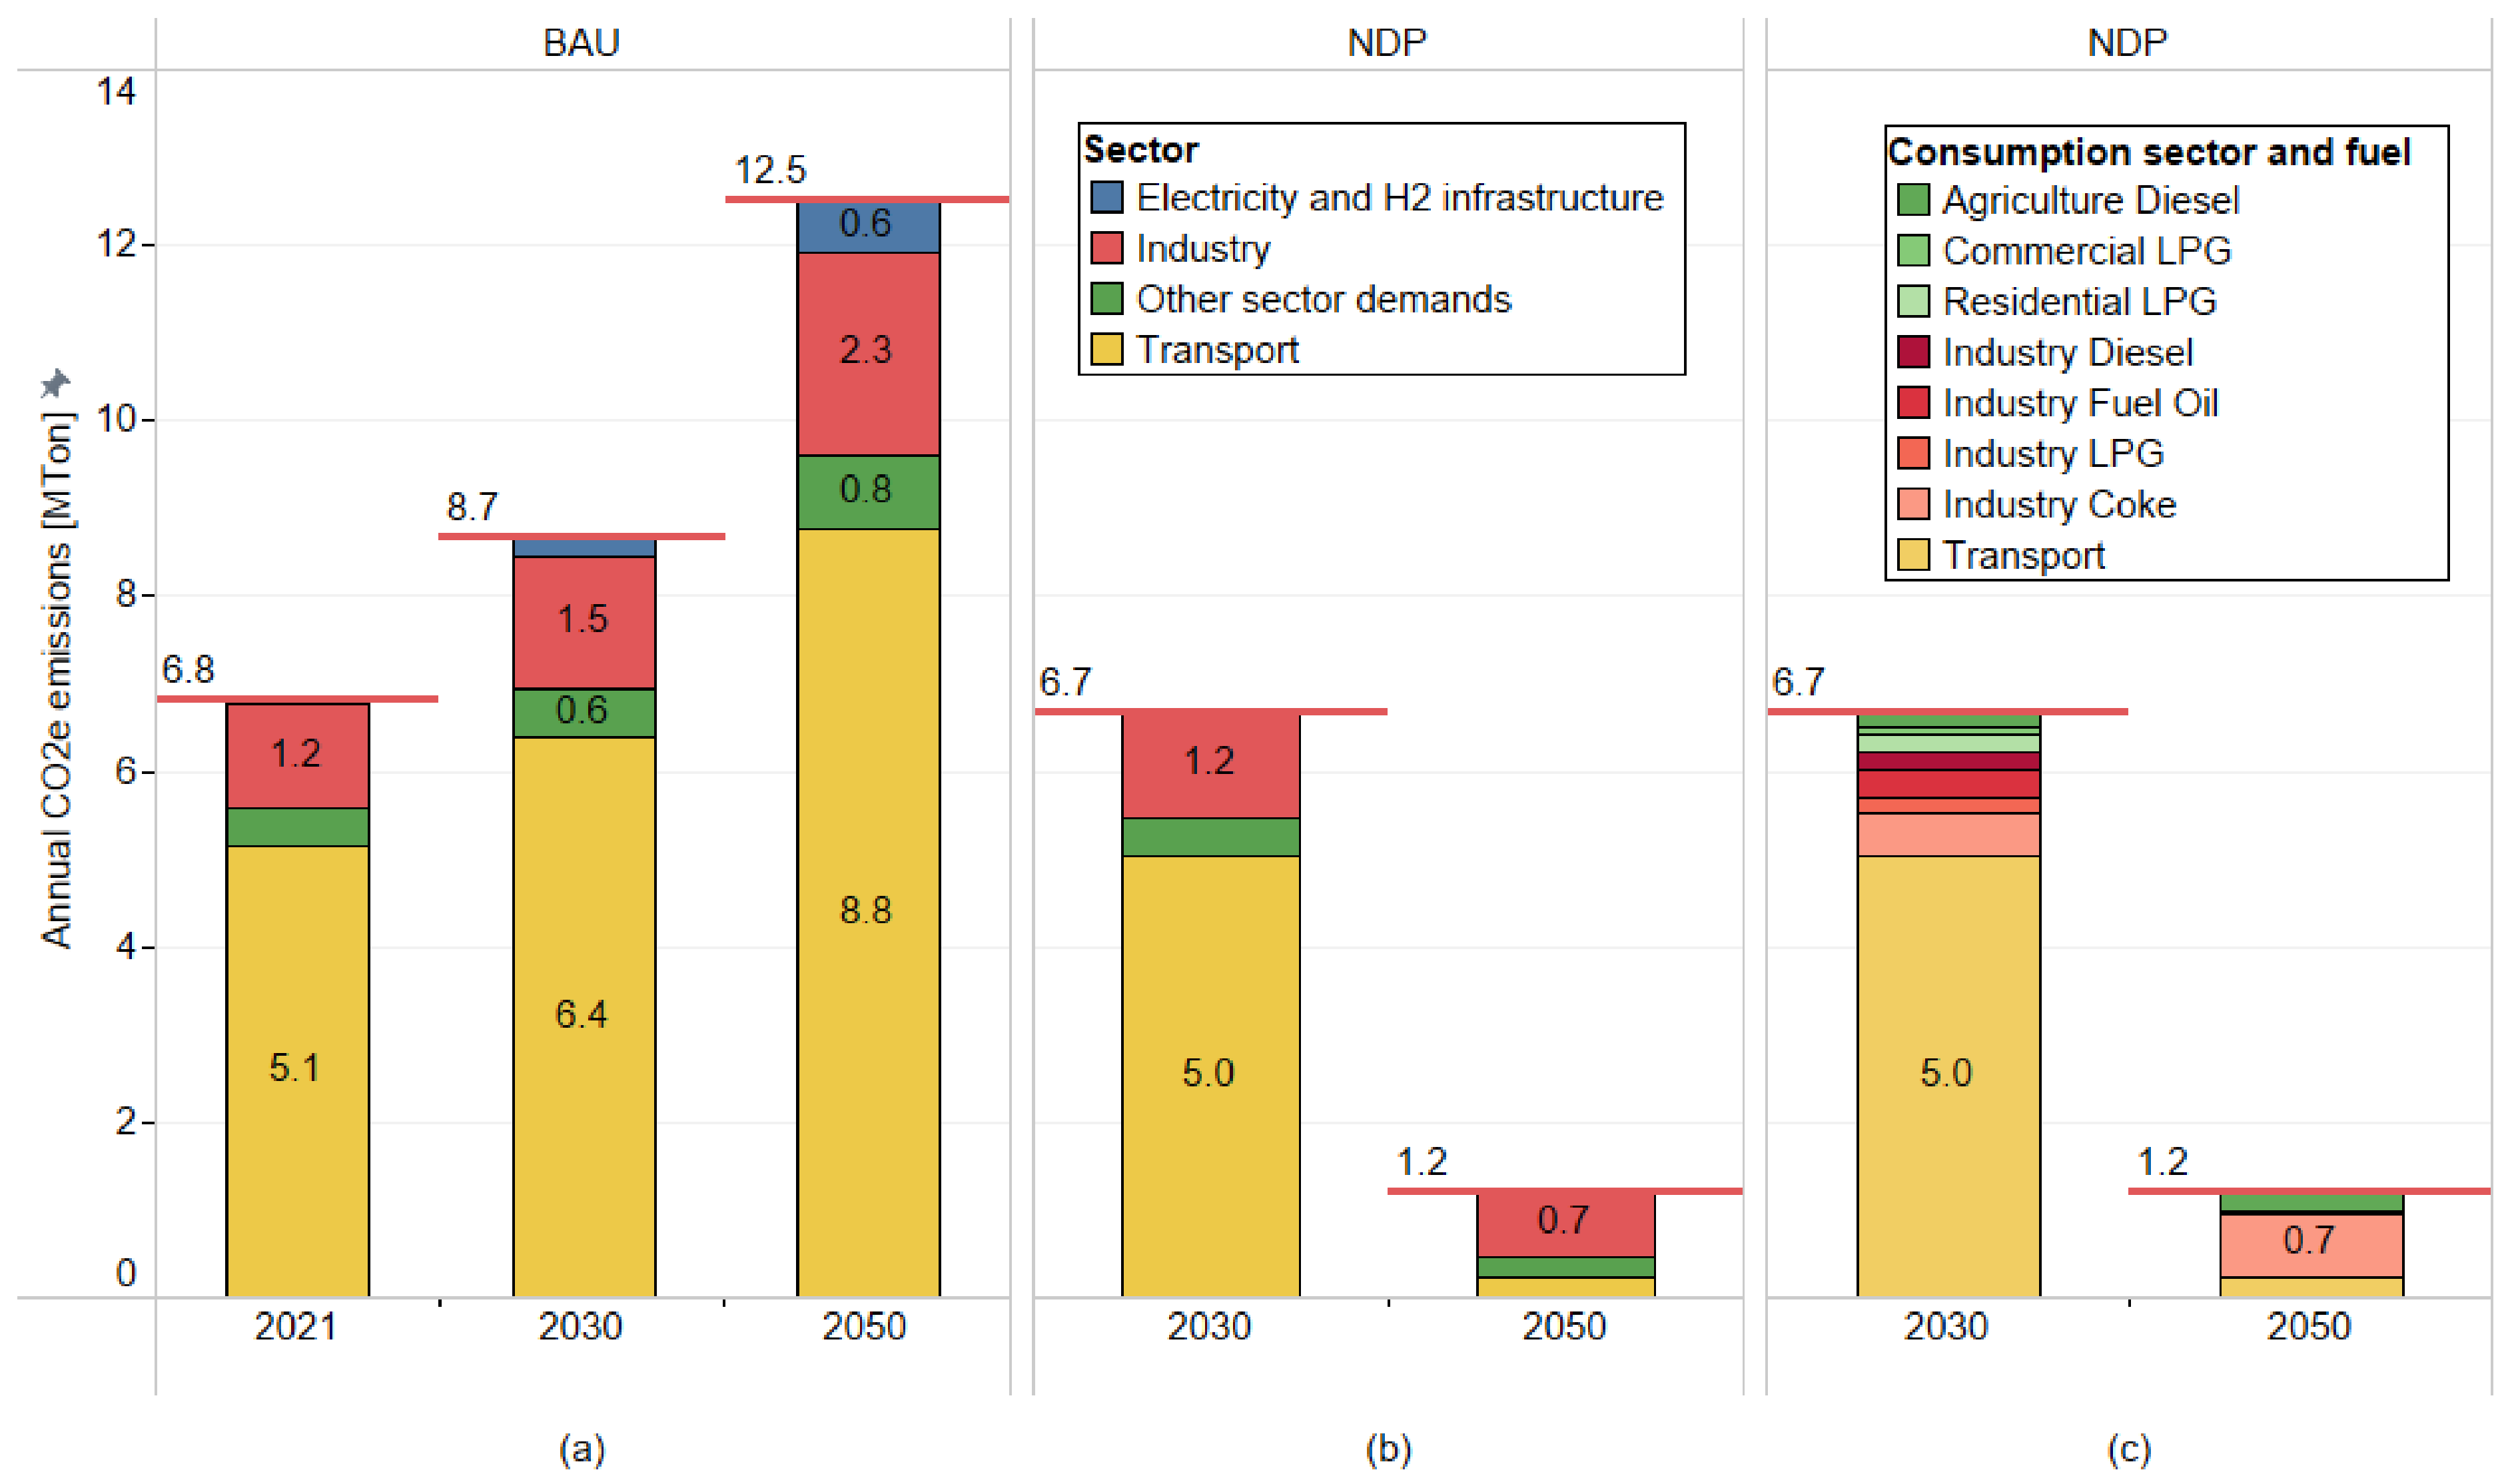
Figure 4 shows the corresponding emission trajectories. Without policy, 2050 emissions are 84% above the 2021 level. Under the NDP assumptions, emissions in 2030 remain almost unchanged relative to 2021 despite higher economic activity. By 2050, energy sector emissions amount to 1.2 MTon, which would need to be offset by forestry. Notably, 0.7 MTon of the 2050 emissions come from industry, particularly from petroleum coke consumption in cement production. The remaining emissions come from transport and agricultural diesel; we do not consider alternatives for the latter.
Figure 4.
Annual carbon dioxide equivalent (CO2e) emissions: (a) BAU by sector; (b) NDP by sector; (c) NDP by consuming sector and fuel.
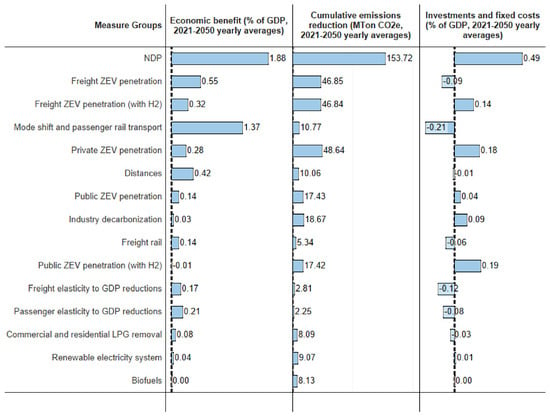
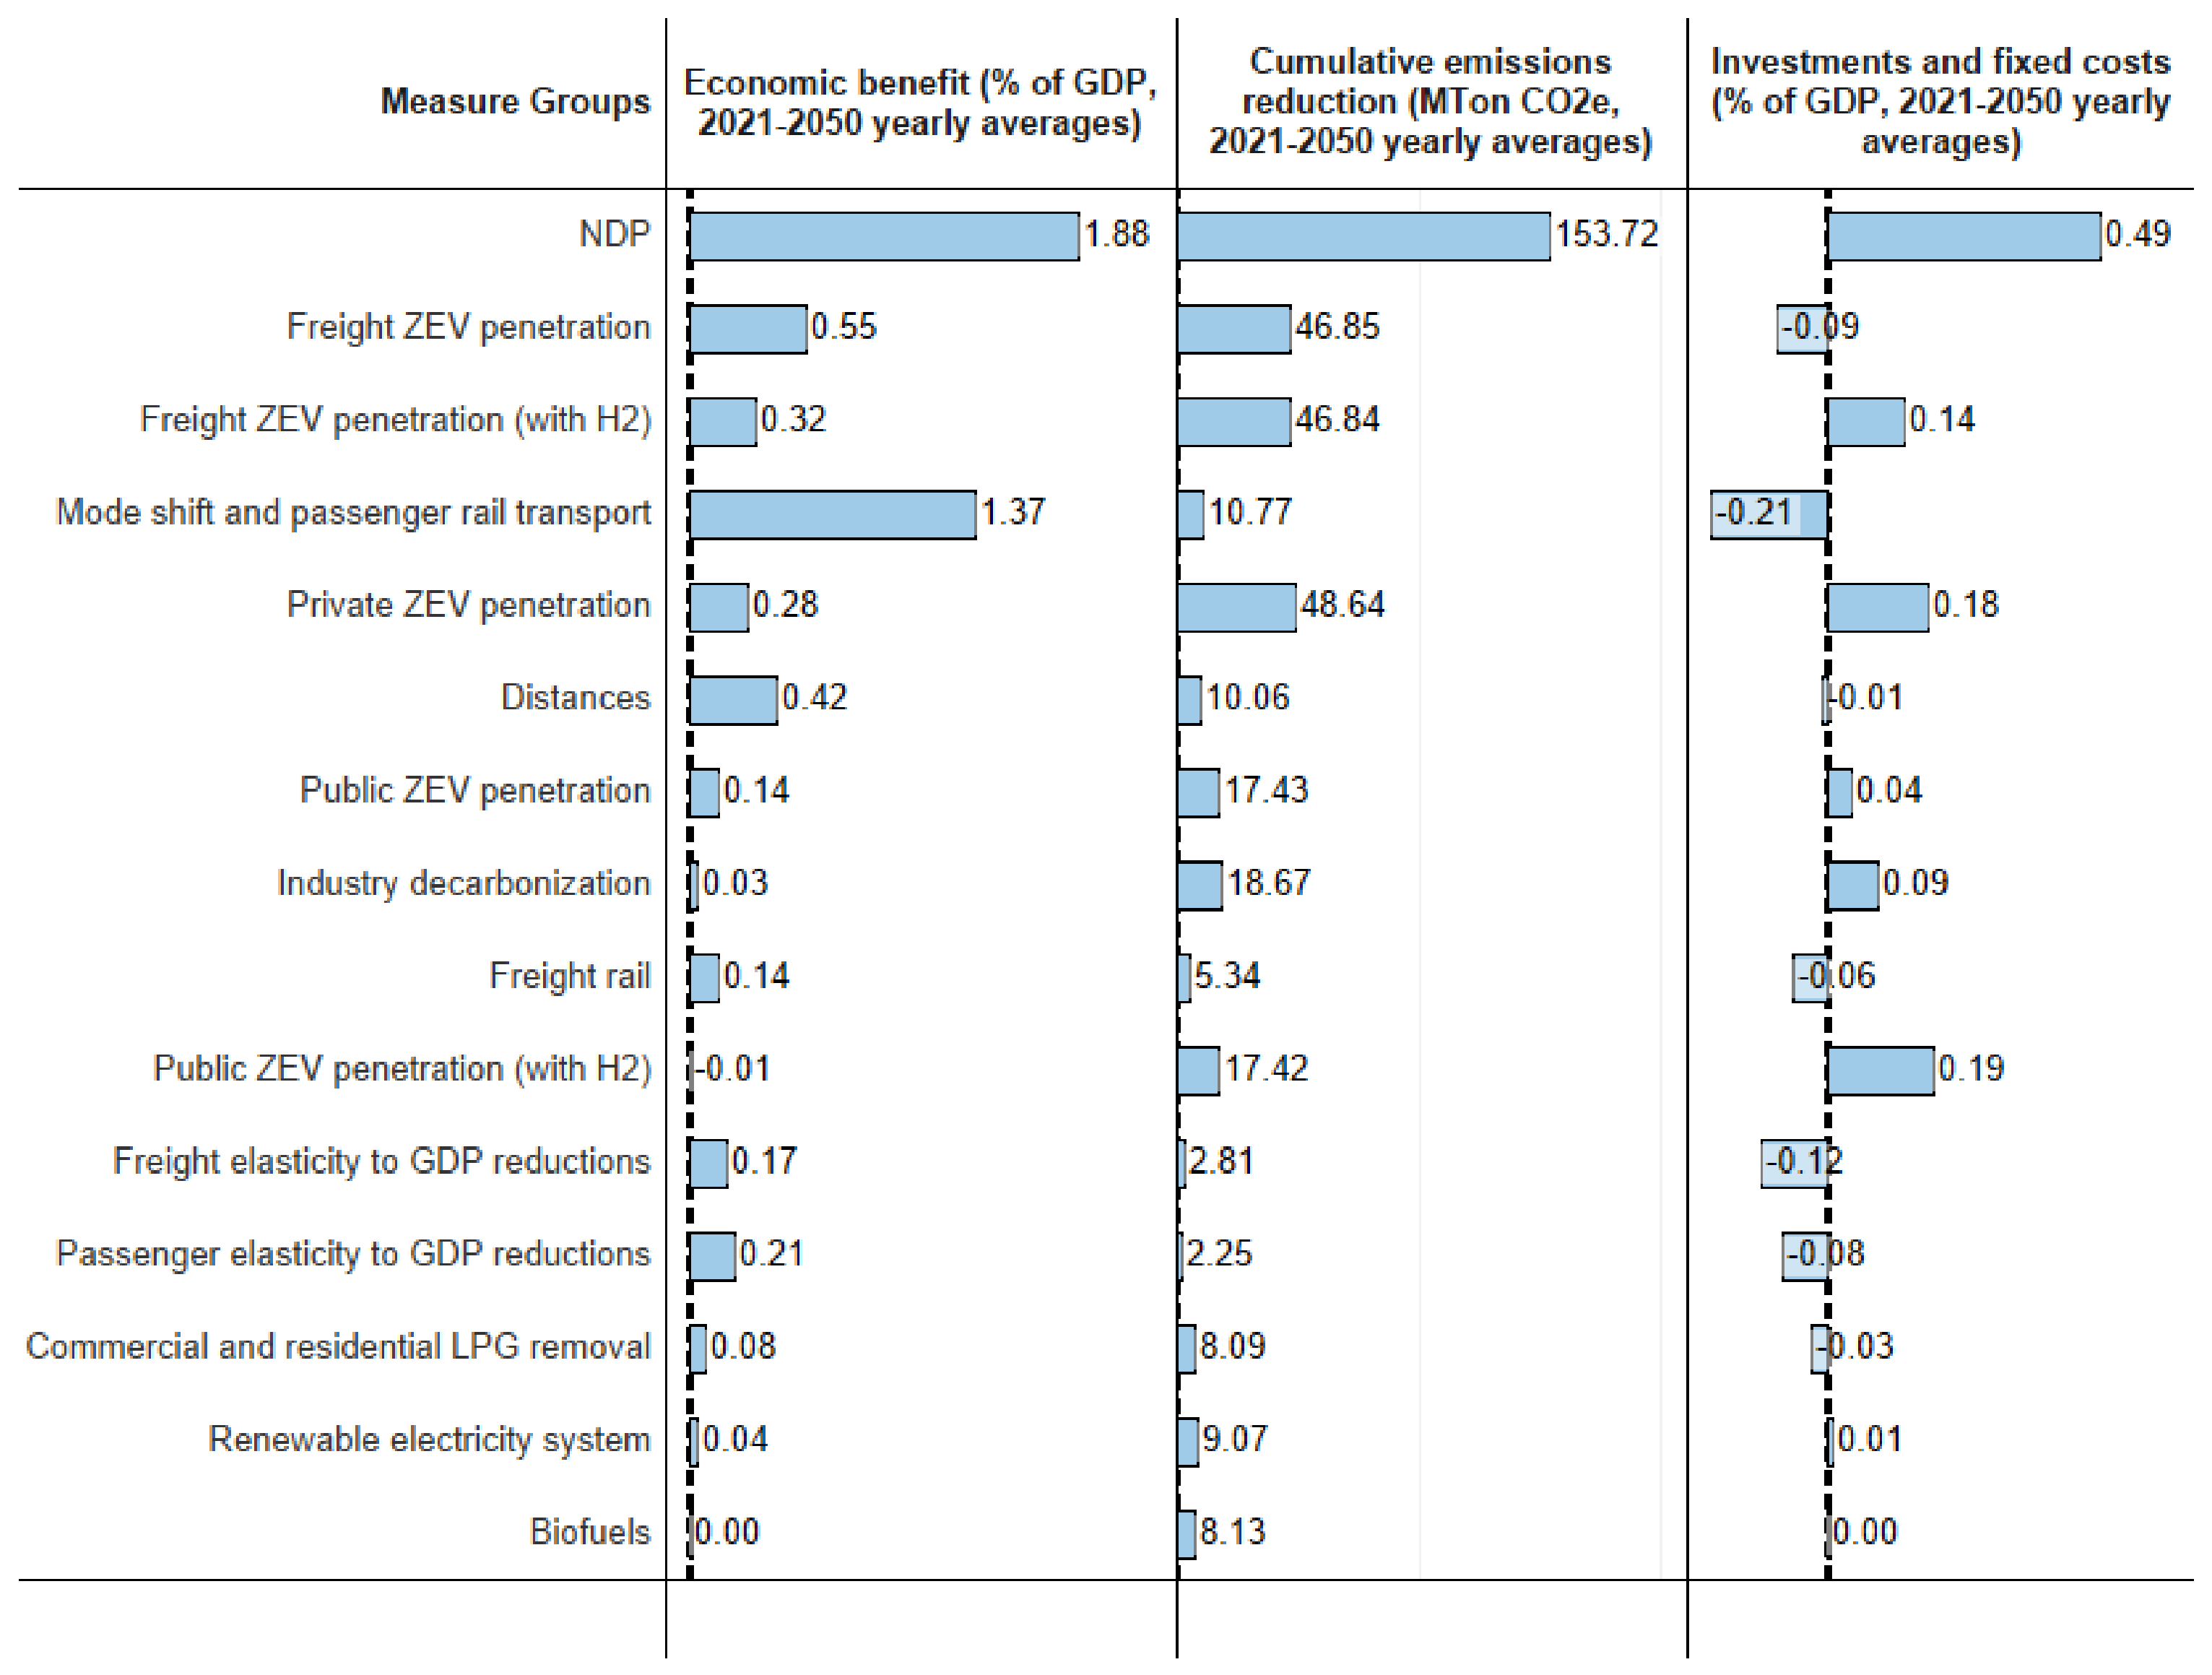
Figure 5 shows the techno-economic performance of each scenario. The results of individual measures do not add up to those of the NDP scenario because measures interact non-linearly. For example, the cost reduction from increased transport use differs substantially with and without electrification. Furthermore, some measures both reduce costs and avoid cost increases. For example, mode shift with passenger rail alone delivers 73% of the NDP’s economic benefit because it requires little new electricity infrastructure. However, this measure alone would achieve only 7% of the NDP scenario’s avoided emissions. Table 7 reports the performance of the scenarios built against special benchmarks.
Figure 5.
Techno-economic performance for every measure group scenario with central ambition.
Table 7.
Techno-economic performance of special benchmark scenarios.
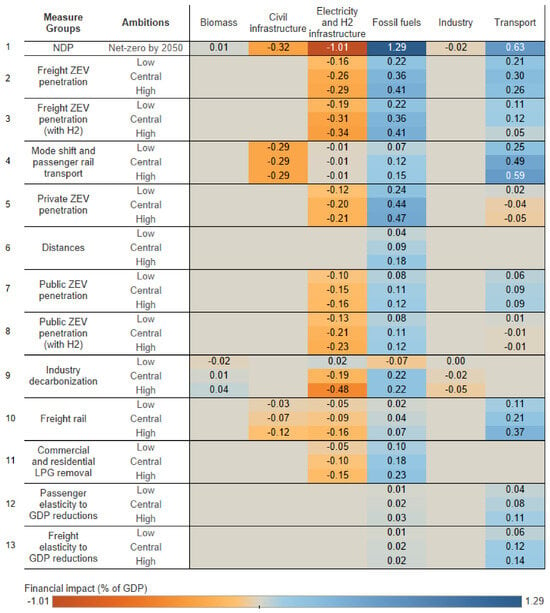
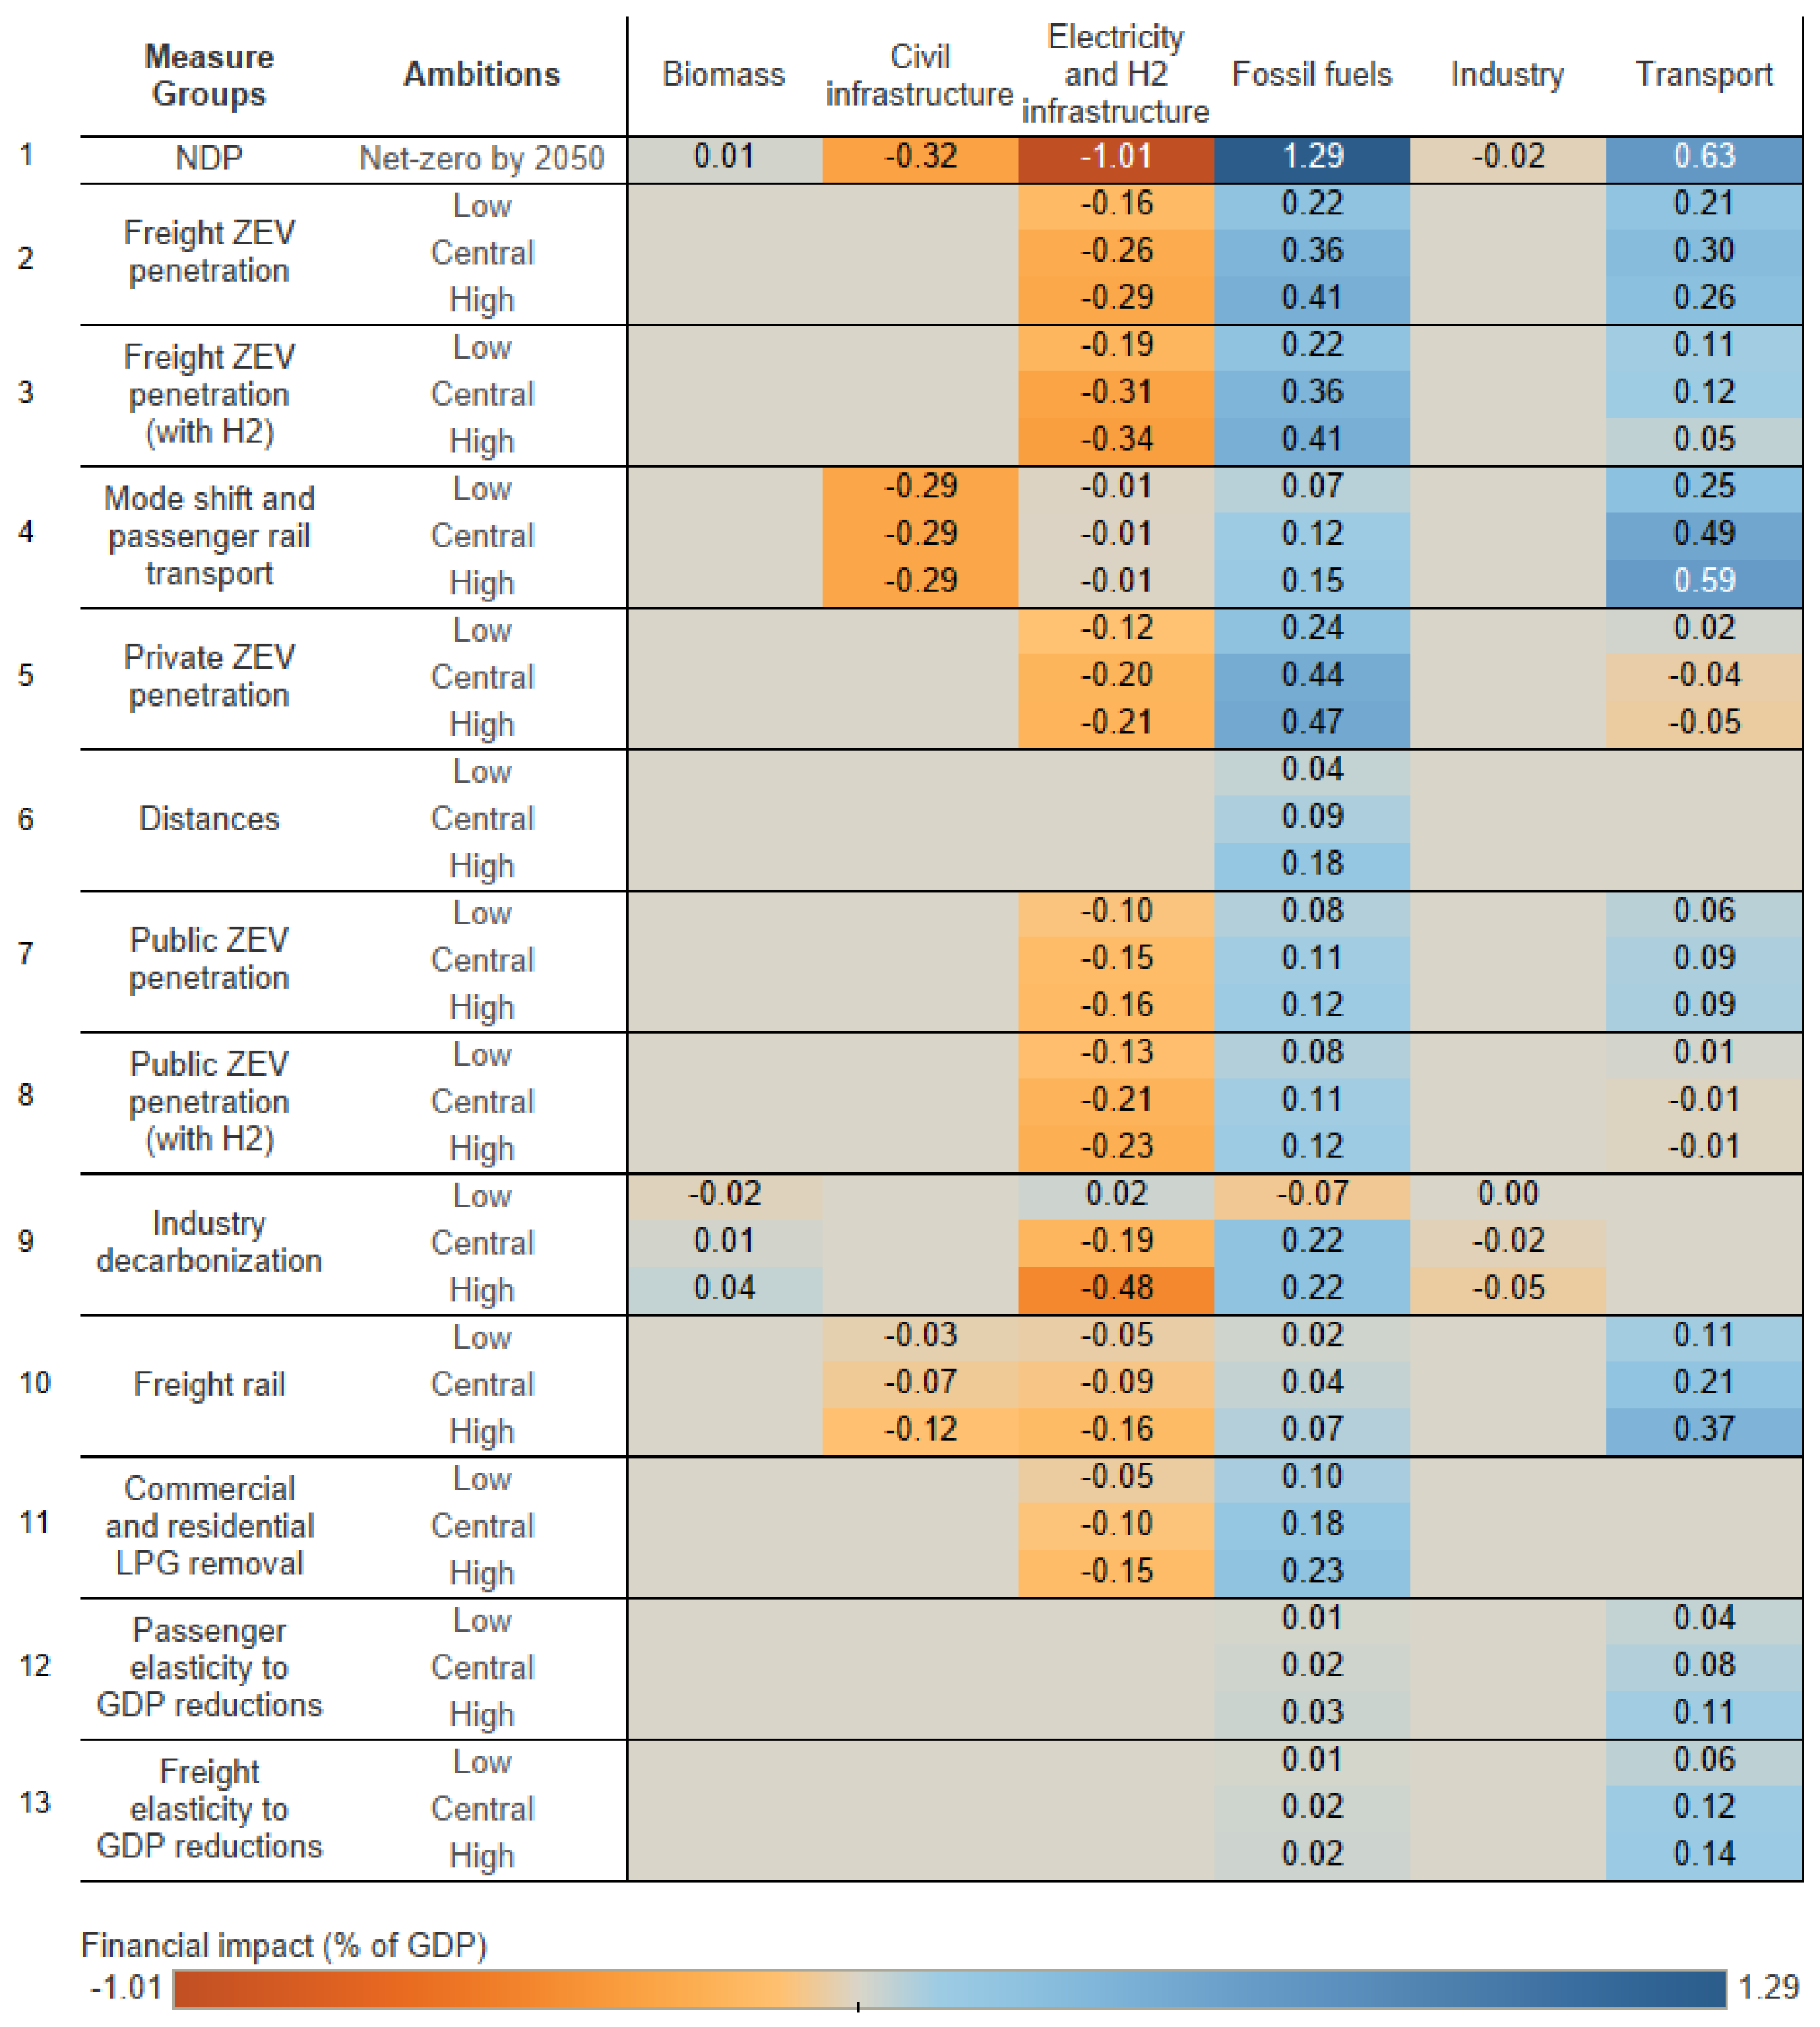
Figure 6 shows the financial impacts by sector (or energy system component) and measure, including variations in ambition. Financial impacts are the economic benefits excluding the externality component (see Equation (9)) and are used to calculate the cost reduction in firms. The higher the electrification ambition, i.e., through ZEV penetration and industry decarbonization, the greater the financial impact on electricity and hydrogen infrastructure. We do not model how electricity firms recover their investments through sales; higher costs for these firms are not harmful, as they also gain more customers. Likewise, higher ambition leads to larger avoided fossil fuel costs. In the NDP scenario, avoided fossil fuel costs exceed the additional electricity costs, and avoided transport costs exceed civil infrastructure costs.
Figure 6.
Financial impacts by sector and measure group scenario (% of GDP, yearly average 2021–2050).
Notably, only industry decarbonization changes biomass consumption. Furthermore, the changes in industrial technology costs are smaller than those in other cost accounts, which is consistent with the relatively low costs of the industry sector in Figure 3a. However, Figure 6 shows that high electrification ambition in industry has the largest impact on electricity and hydrogen infrastructure. At central ambition, industry decarbonization (which keeps a high biomass share, as in Table 5) has as large a financial impact on electricity and hydrogen infrastructure as ZEV penetration.
Table 7 evaluates alternatives to the central electricity sector assumptions (see Table 5 and Table 6). First, making electricity generation 100% renewable avoids 9.1 MTon of CO2e if achieved by 2050 or 9.9 MTon of CO2e if achieved by 2030. These reductions equal 5.9% and 6.4% of those in the NDP scenario (Figure 5). Their economic benefits are about 0.04% of GDP with additional costs of 0.02% of GDP. Meeting growing electricity demand with hydro and geothermal is economically disadvantageous, causing an economic loss of 0.343% of GDP because of their higher unit costs. Choosing distributed generation over wind and utility-scale installations yields a slight economic benefit of 0.04% of GDP because of reduced losses. Finally, holding electrical energy intensity constant would increase costs by 0.15% of GDP. As expected, therefore, increasing efficiency reduces costs.
3.2. Competitiveness of Key Economic Sectors
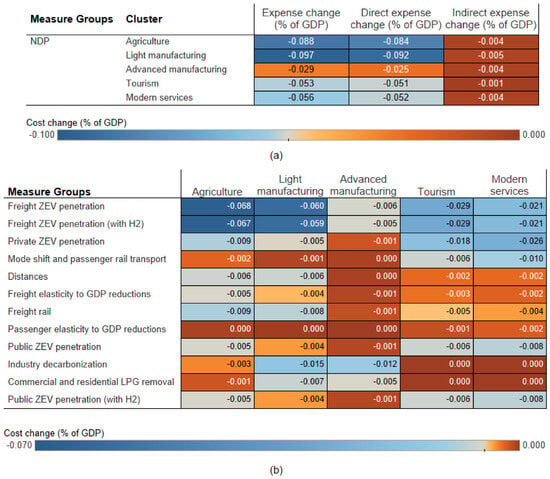
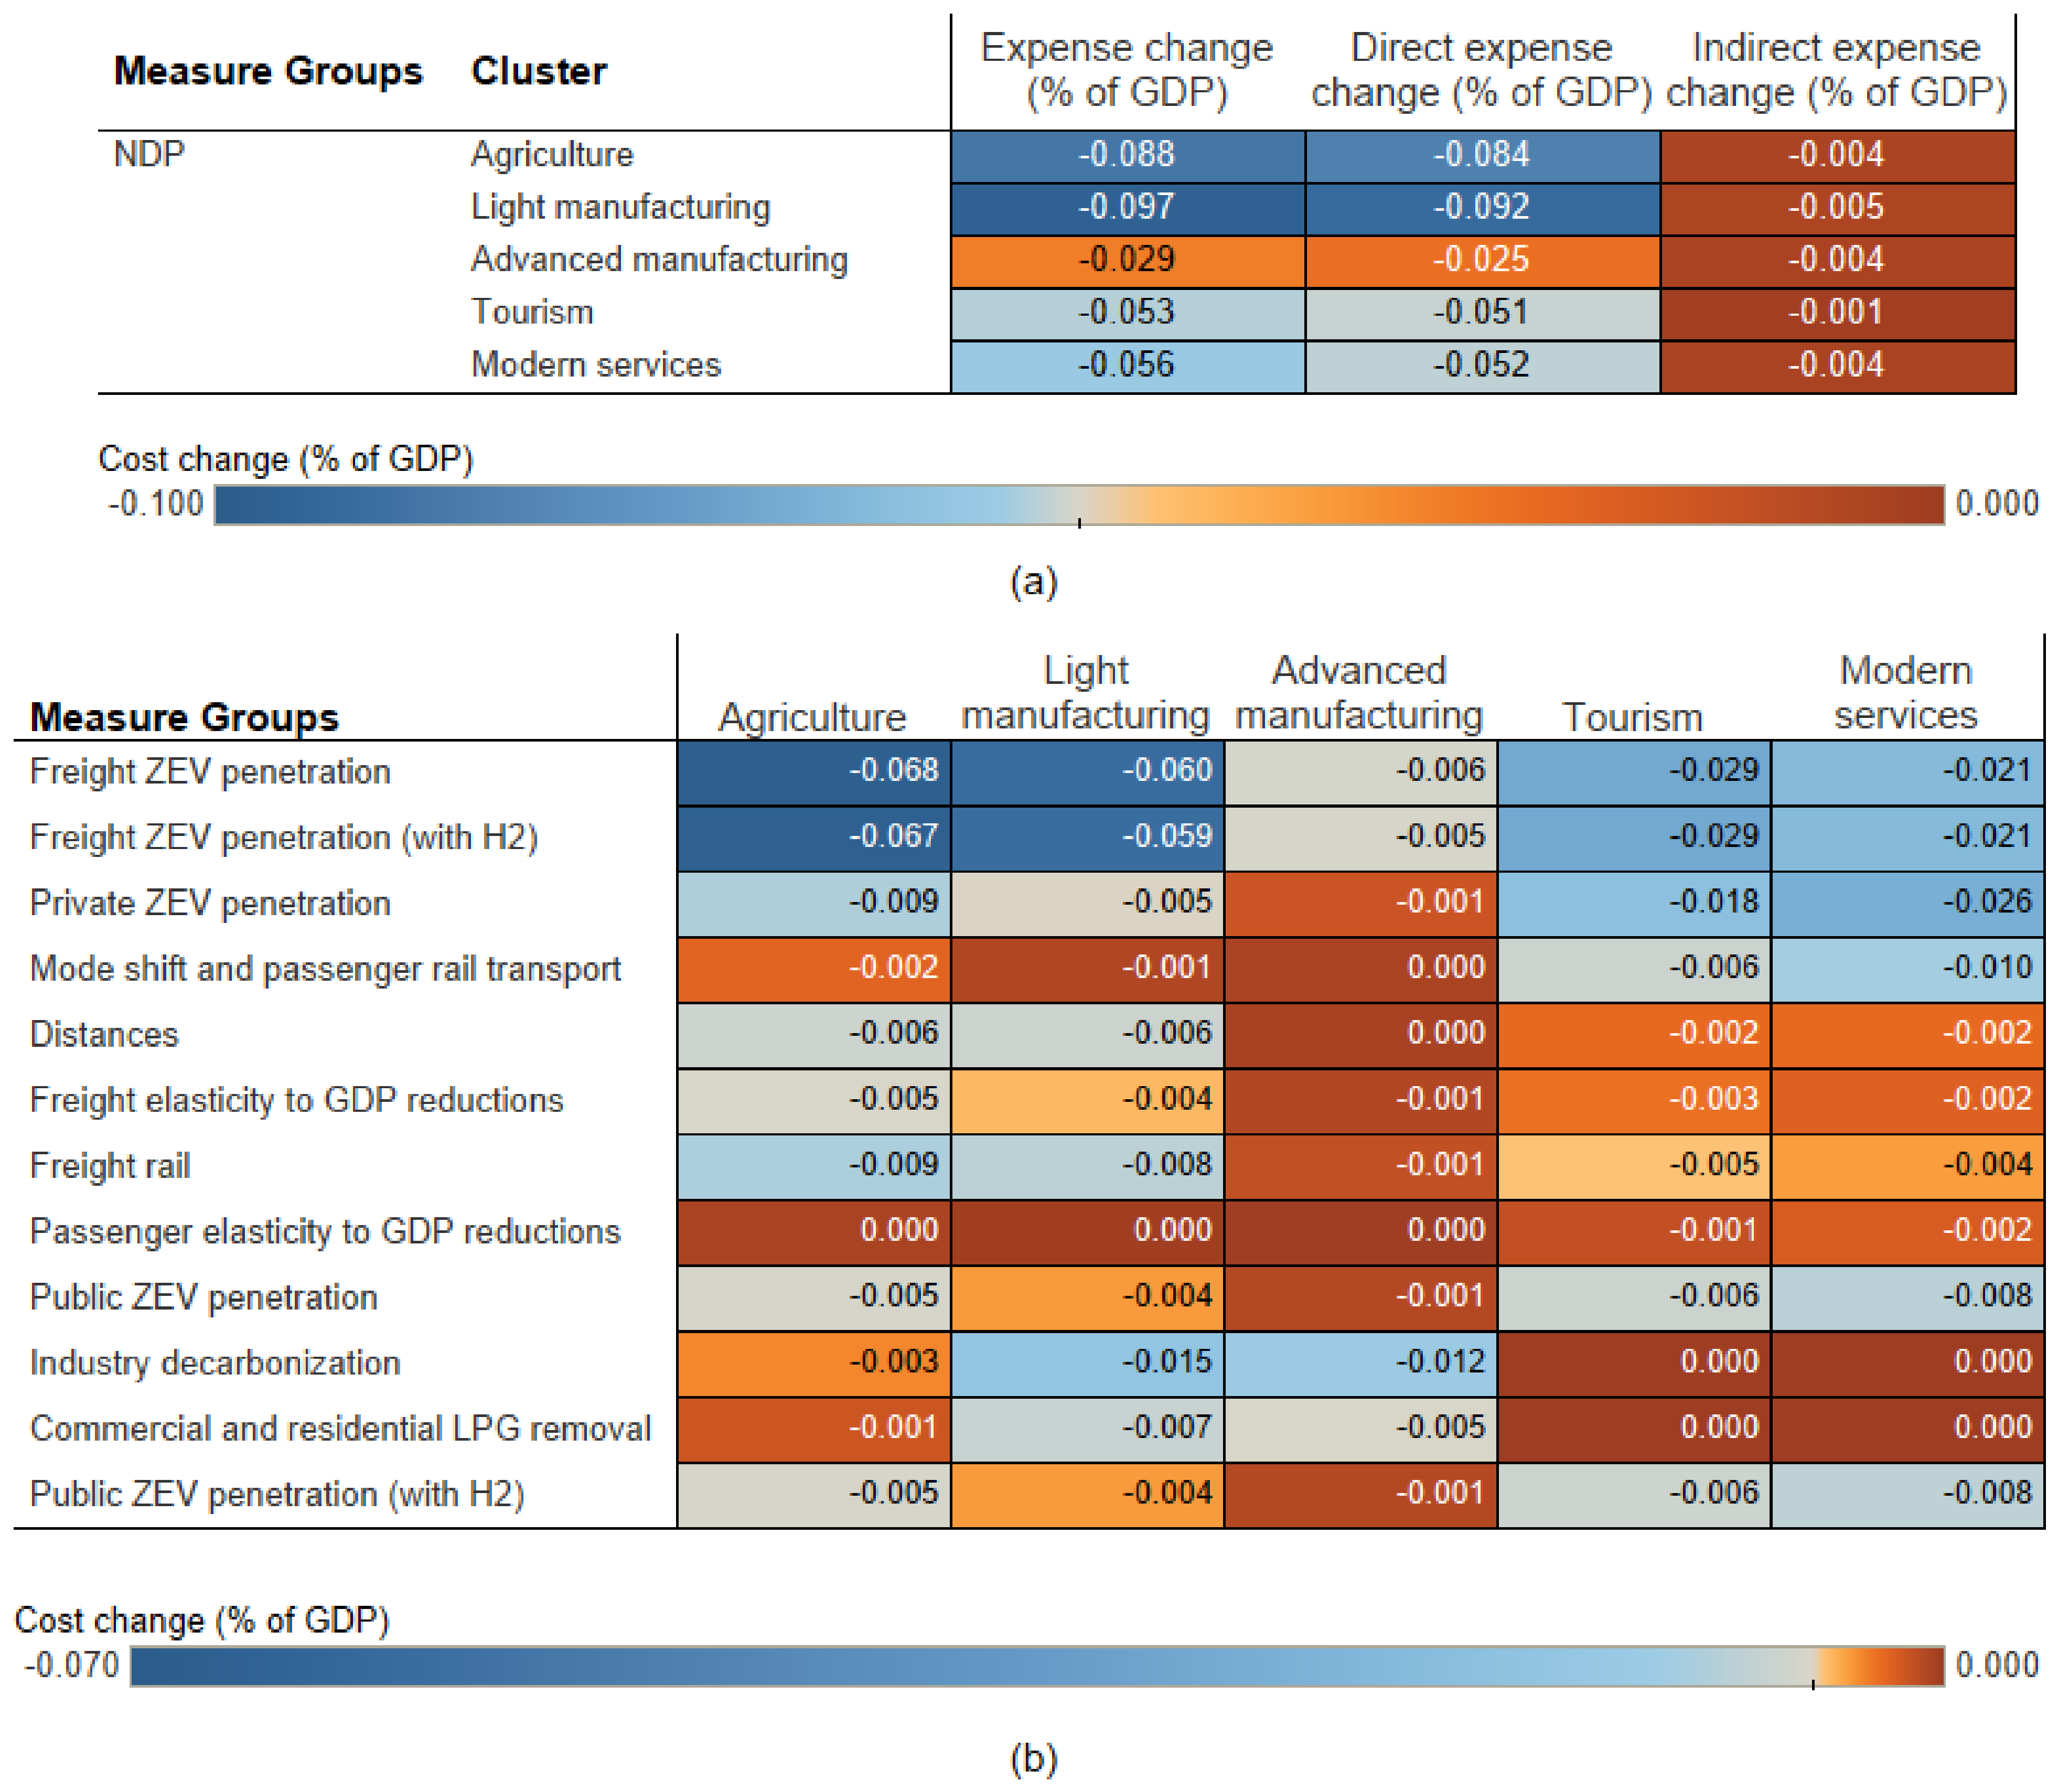
Figure 7 shows the cost reduction in firms. Under the NDP scenario, the priority cluster that benefits most is light manufacturing with a cost reduction of 0.097% of GDP. Indirect impacts are minimal compared with direct impacts (Figure 7a). Advanced manufacturing has the smallest cost reduction, although it remains positive at 0.03% of GDP (Figure 7a). Figure 7b disaggregates the impact on each cluster for each measure. Freight measures produce the largest cost reductions. Because advanced manufacturing uses freight only indirectly (by consuming freight-intensive activities), its freight-related impacts are smaller than those of agriculture and light manufacturing. The link between food and beverage transport and tourism also explains the relatively high freight impact on tourism. Industry decarbonization, in turn, benefits the manufacturing clusters. Passenger transport measures affect tourism and modern services more, because these activities revolve around people rather than goods. These firm-level cost reductions are consistent with the broader literature linking economic complexity and renewable energy to lower emissions, although recent panel evidence for the European Union finds that this mitigating effect becomes negligible in high-emission economies [73].
Figure 7.
Cost reduction by economic cluster (a) for the NDP scenario and (b) per measure group scenario. Values are 2021–2050 yearly averages.
3.3. Priorities: Safely Meeting the NDC and Strengthening Prioritized Sectors
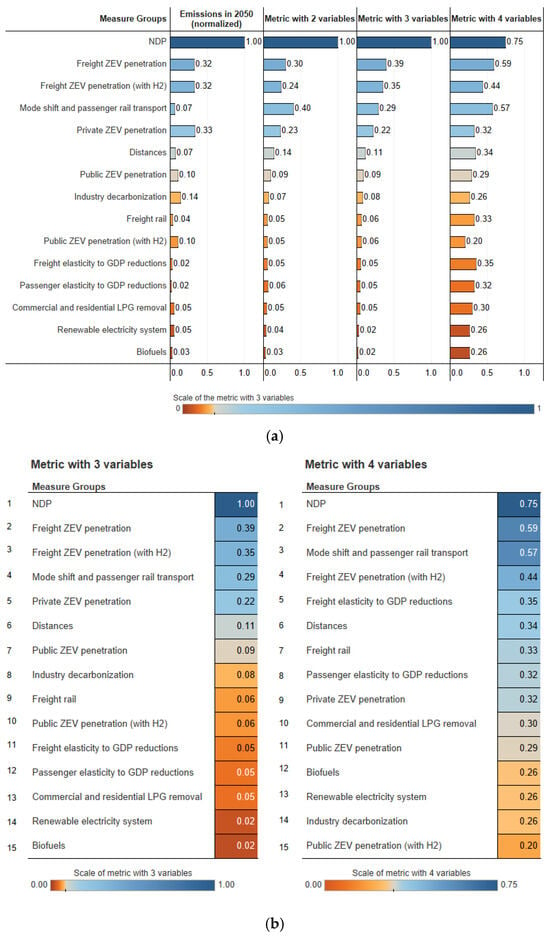
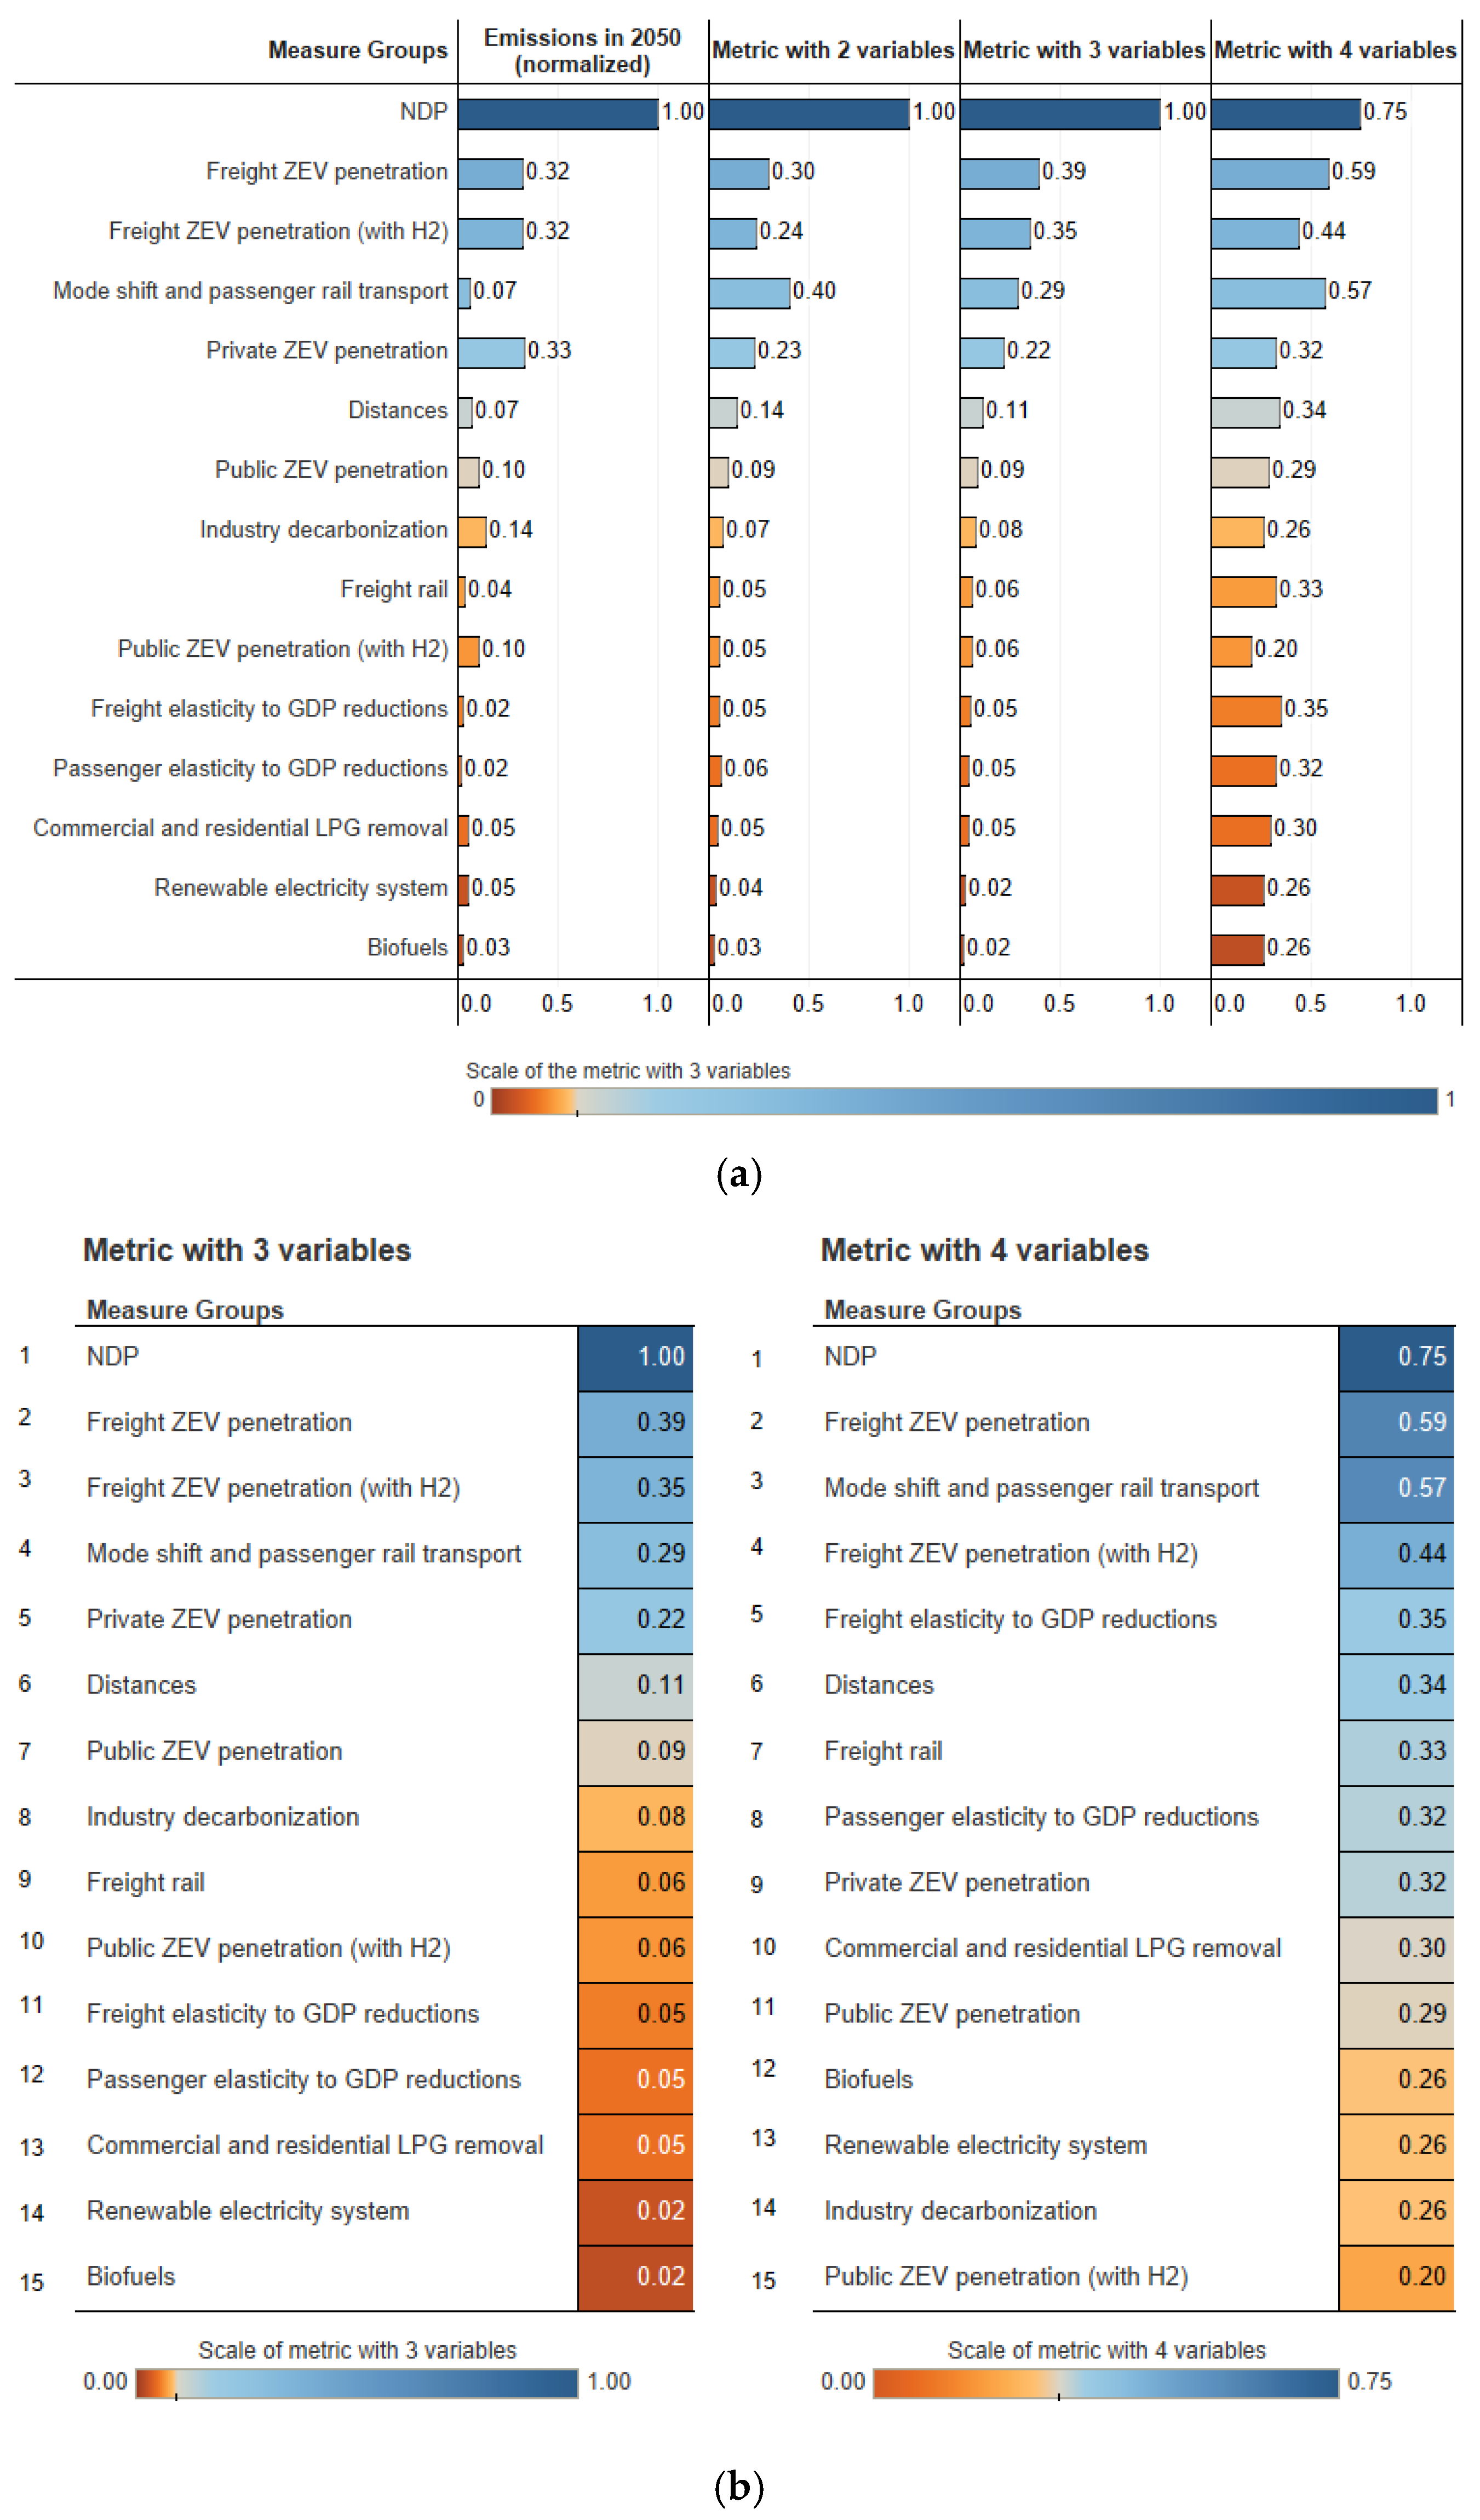
Here, we combine the findings of Section 3.1 and Section 3.2 through Equation (16). Figure 8a shows the policy ranking for metrics with one, two, three, or four variables. If only emissions are considered, ZEV penetration measures rank highest. When economic benefits are added (with a weight equal to that of emissions), mode shift with passenger rail takes the lead (two-variable metric, Figure 8a). When firm competitiveness is included (three-variable metric, Figure 8a), freight ZEV penetration overtakes mode shift as the most important measure. As shown in Figure 7, this measure reduces transport costs for agriculture and light manufacturing. Finally, when affordability is also considered, mode shift and passenger rail ranks second—ahead of freight ZEV penetration with hydrogen (Figure 8b).
Figure 8.
Policy ranking by metric (a) comparing the number of variables in the metric and (b) comparing the ranking change.
Without the affordability variable, central-ambition industry decarbonization ranks seventh among the thirteen central measures. With it, industry decarbonization falls to eleventh because of its high demand for electricity and hydrogen infrastructure (Figure 5).
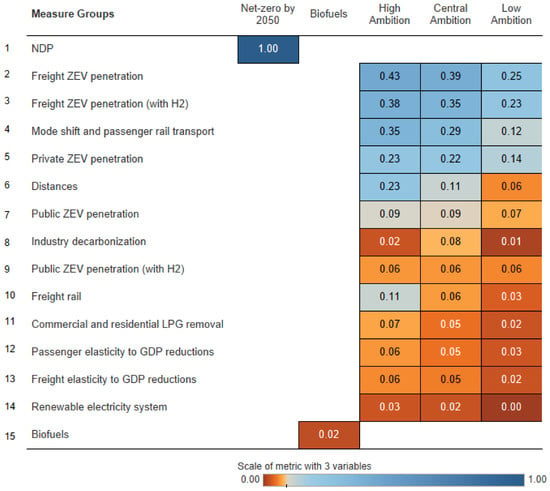
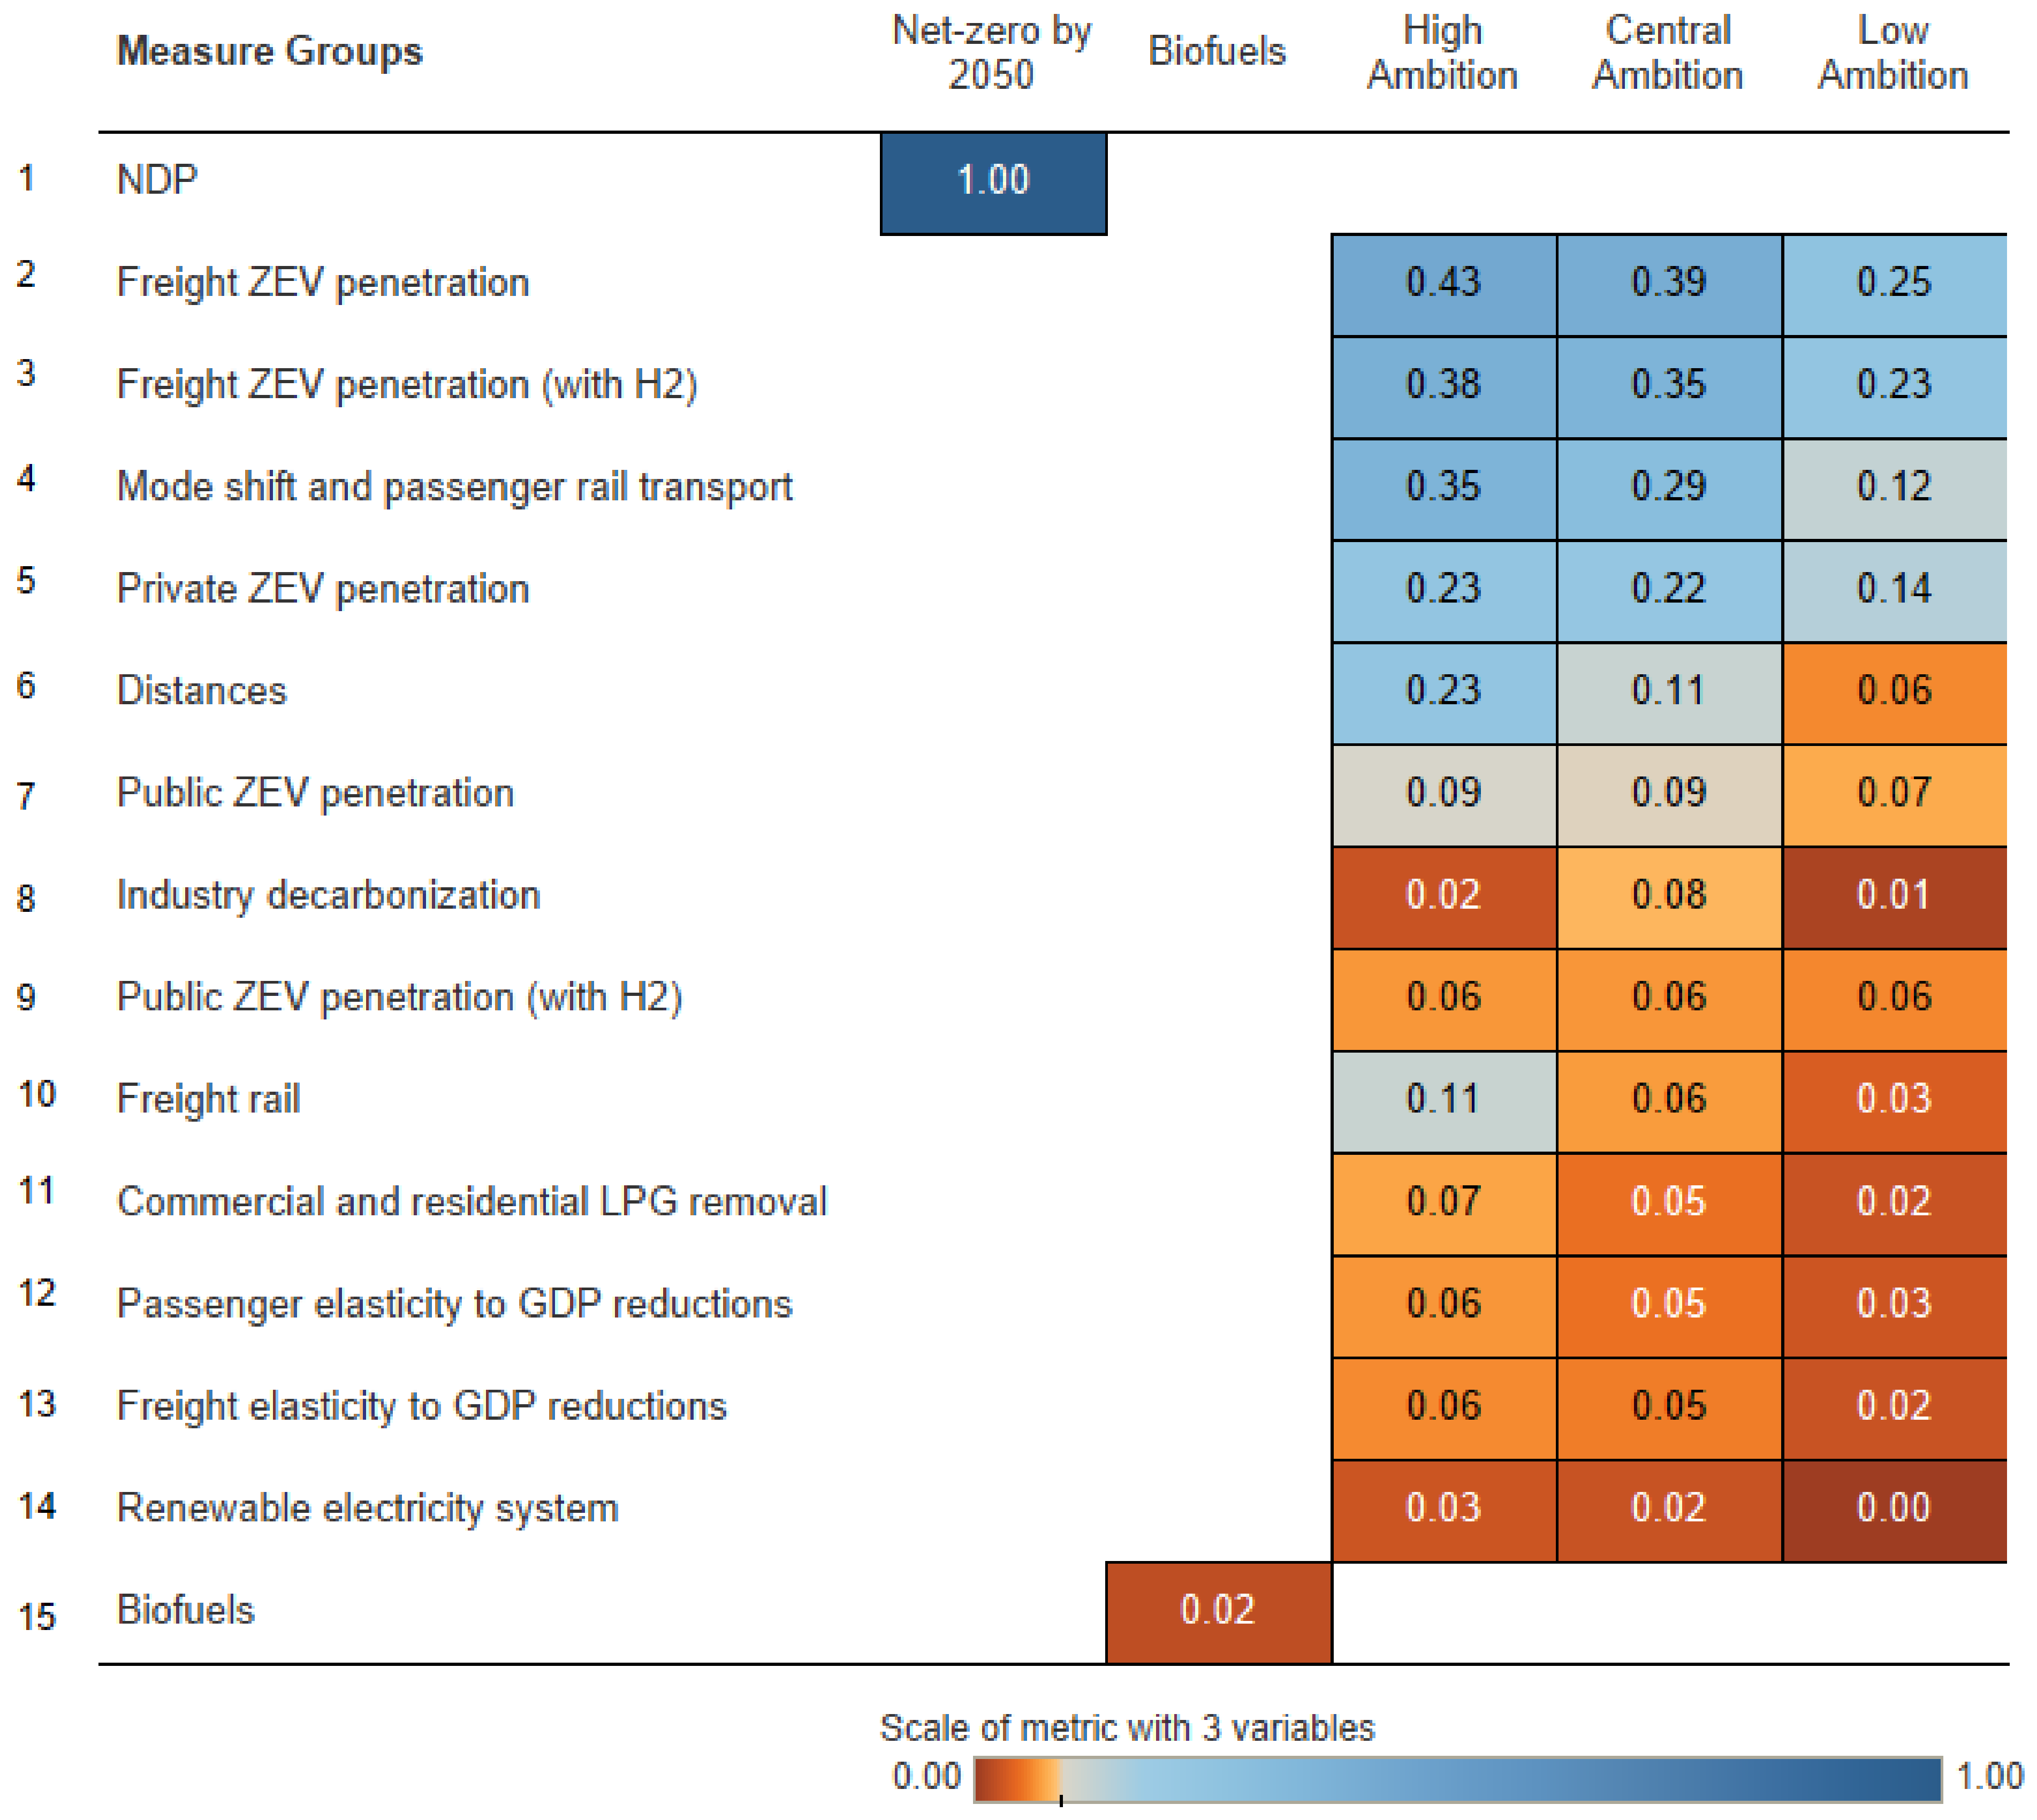
The ranking depends on what governments and firms value. If governments can finance any measure, the three-variable metric (Figure 9) identifies the focus set: (i) road freight electrification, (ii) mode shift and passenger rail transport, and (iii) private passenger transport electrification. Item (i) covers both freight variants: the battery and hydrogen variants rank first and second, mode shift ranks third, and private passenger electrification follows. This ordering is identical under a ratio-based normalization and the min–max index used here. We report each measure’s contribution individually (Figure 5 and Figure 6) and do not sum contributions across measures because, as Section 3.1 shows, measures interact non-linearly, so single-measure results are not additive. Quantifying the combined effect of the top measures requires a combined scenario run, which we leave for future work.
Figure 9.
Policy ranking by measure group and ambition with a metric with three variables (without considering the investment and fixed costs). The order is according to central ambition.
Under the min–max index, the reference NDP scenario scores 0.742 with four equal weights. A ratio-based normalization would fix this score at 0.75 by construction; the min–max score is instead data-determined and therefore informative.
Compared with a ratio-based normalization, the min–max index changes one position in the four-variable top four. Private passenger electrification rises to fourth, displacing freight elasticity to GDP. The mechanism is the normalization. A ratio-based affordability metric is unbounded and rewards measures with near-zero or negative investment. Bounded min–max scaling removes that advantage. The elasticity, distance, and freight-rail measures each fall three to four positions across the full scenario set for the same reason. The top three are unaffected.
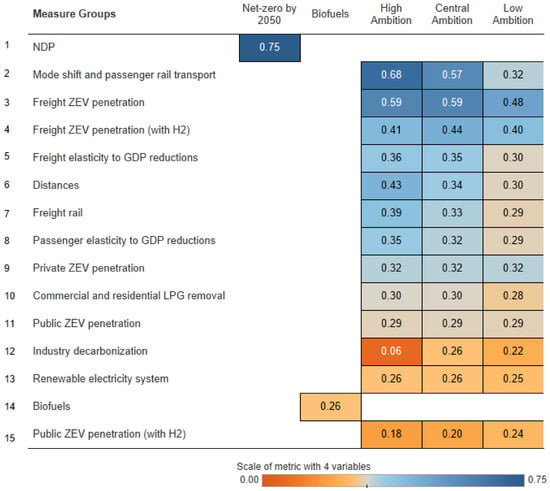
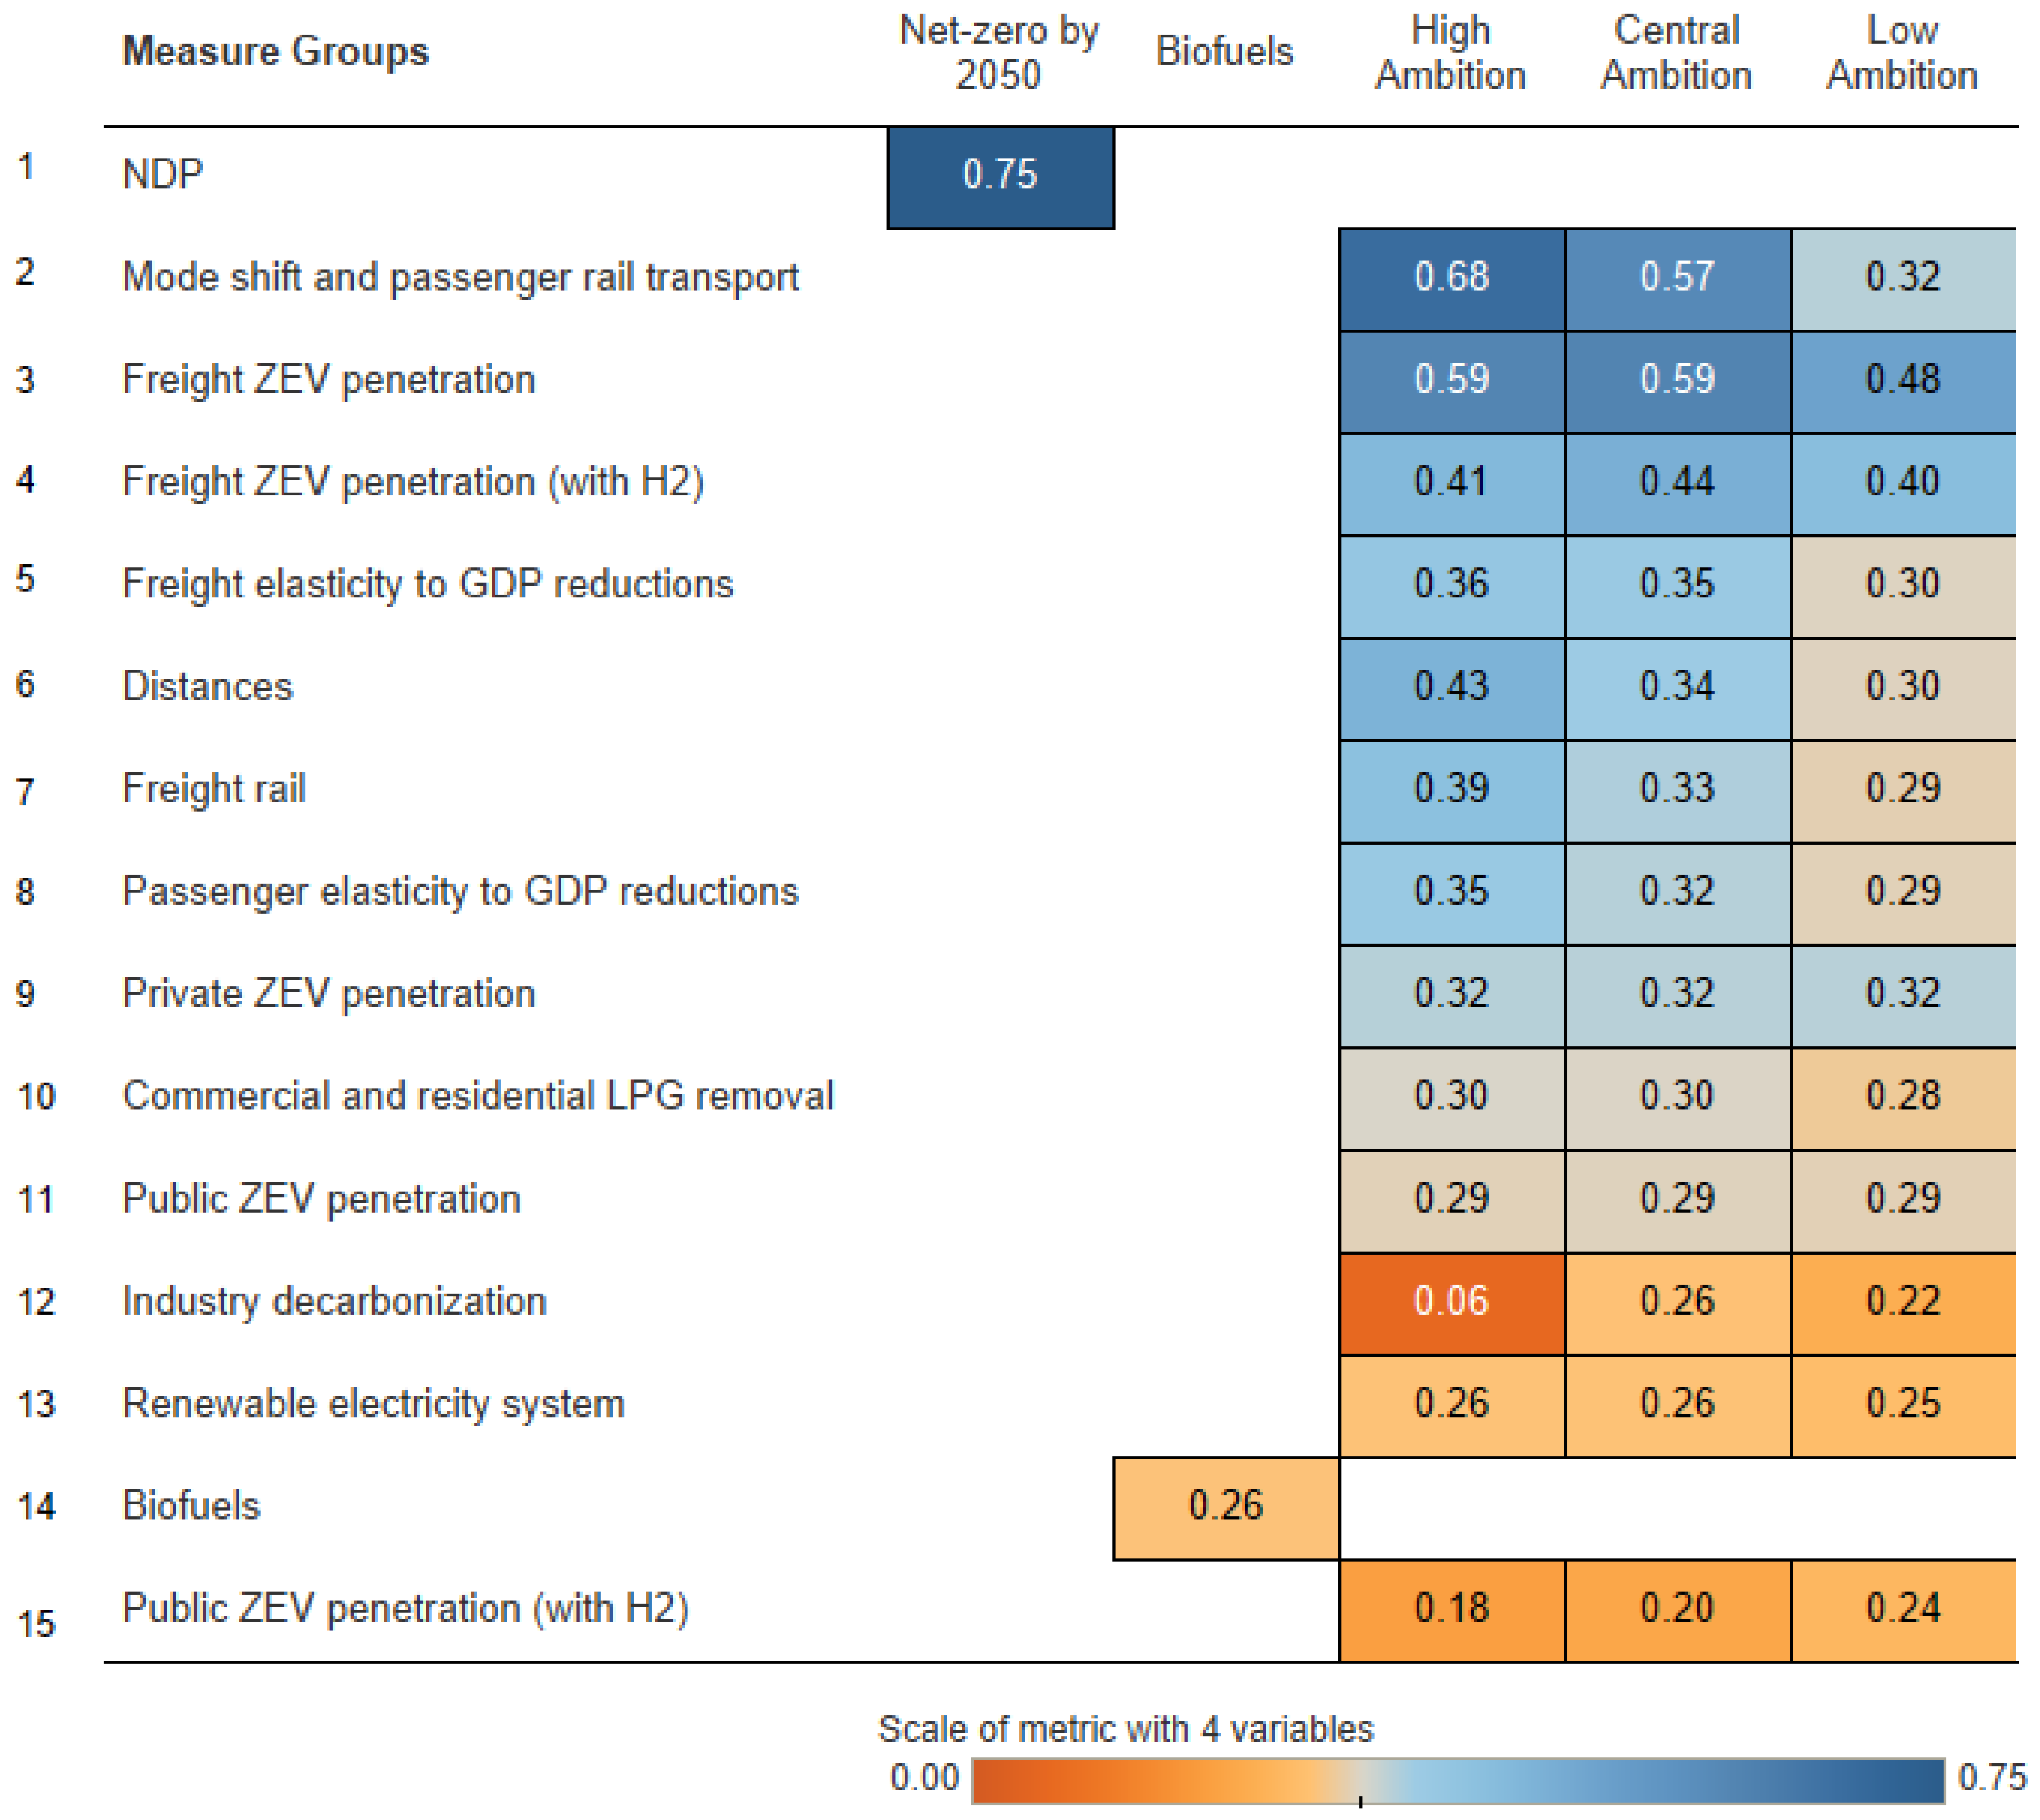
Figure 9 shows that low-ambition industry decarbonization, i.e., based on gas instead of liquid petroleum products, is the lowest-ranking measure with economic implications under the three-variable metric (the low-ambition renewable electricity system is a benchmark). Moreover, biofuels rank last because they have no economic implications in our modeling. High-ambition industry decarbonization scores lowest under the four-variable metric (Figure 10). As Figure 6 shows, this is due to its high electricity sector demand. Hence, biomass remains relevant for industry in 2050 because of its relative cost-effectiveness.
Figure 10.
Policy ranking by measure group and ambition with a metric with the four variables. The order is according to central ambition.
Figure 10 also shows the low ranking of public ZEV penetration with hydrogen, owing to its relatively small emission reductions (11.33% of the NDP’s potential; Figure 5) and its low impact on firm competitiveness (Figure 7). It is therefore more important for the government to encourage public transport use (the top-ranked passenger measure in Figure 10) by improving safety and speed than to purchase electric or hydrogen buses. In general, hydrogen options rank lower than battery-electric options because hydrogen is expected to be relatively more expensive. Recent cost projections support this ordering, finding that battery-electric trucks can already achieve total cost of ownership benefits over diesel, whereas fuel-cell trucks are unlikely to reach cost parity in the 2030s while green hydrogen remains expensive [74]. Nonetheless, costs and technical performance are uncertain and could change this ranking. Furthermore, the hydrogen options assume a 50–50 split between battery and hydrogen technologies by 2050. Hence, our results bracket the attractiveness of hydrogen penetration between 0% and 50%.
Finally, some measures, such as reducing kilometers traveled and the elasticity of transport demand to GDP, make the overall transport system more efficient. These efficiency gains are not necessarily cost-free, but our modeling does not include their implementation costs. As a result, these measures rank higher under the four-variable metric than under the three-variable metric. However, just as there are unaccounted costs, there are also unaccounted benefits. For example, distance reduction goes hand in hand with more compact and healthier cities. Changes in the elasticity to GDP are possible through productivity-boosting technologies, such as automation, driverless vehicles, and other logistics-enhancing technologies. We leave a more detailed analysis of these measures for future work.
3.4. Robustness of the Ranking
The ranking is the paper’s central claim. We therefore test it against the assumptions a reader could reasonably contest. All tests are post-processing sensitivities. They hold the optimized activities fixed and do not re-solve the model. Each test recomputes all four normalized metrics over the full Group 1 scenario set before ranking. Most tests use the cost-reduction values behind the main ranking. The electricity-channel and sector-mapping tests require shock-level detail and use the reproducible production-minus-use variant. The top four measures are the same under both.
- Weights. We drew 10,000 weight vectors uniformly from the four-weight simplex. Freight electrification appears in the top three in 100% of draws. Mode shift with passenger rail appears in the top three in 81% of draws, and the hydrogen freight variant appears in the top three in 80%. No other measure exceeds 19%. One-at-a-time weight sweeps confirm the pattern: freight electrification stays in the top three at every breakpoint.
- Electricity cost channel. The main analysis excludes power-sector cost increases from the cost pass-through while retaining avoided fossil fuel costs (Section 2.3). As a test, we add the power-sector variable-cost channel. Its effect is small: it changes the cost reduction in firms by less than 0.001 percentage points of GDP for every central measure. The civil infrastructure shock is assigned to rail operations; an alternative assignment moves mode shift’s cost reduction in firms from +0.02 to −0.03 percentage points of GDP, which is a larger effect than the electricity channel. The top four composite positions are unchanged in both cases.
- Implementation costs. We priced a representative 10 km corridor [75] at the Latin American median cost of a full segregated busway, USD 14.7 million per km [76], and at a light bus-priority retrofit cost of USD 0.4 million per km [77,78]. The retrofit adds 0.006% of GDP to investment and leaves mode shift’s rank unchanged. The full busway adds 0.23% of GDP and moves mode shift from second to third among central measures. The top-three set is unchanged; only its internal order moves. The prominence of mode shift in the main ranking therefore depends in part on the omission of its implementation costs.
- Integration costs. The annual time resolution understates storage, reserve, and balancing costs. We therefore marked up the capital and fixed costs of the nineteen electricity and hydrogen infrastructure technologies by 20% and 50%. At +20%, no central measure changes rank. At +50%, the top three hold; only adjacent lower positions swap.
- Externality values. Avoided externalities dominate the economic benefits. Table 2 reports all ten unit-value groups for health, accidents, and congestion with sources [64]. We scaled all externality values simultaneously to 50%, 70%, and 130% of their central values. The top three and their order hold in every case. Mode shift keeps second place even at half the central externality values.
- Fuel prices. The 1.9% annual fossil-fuel price growth assumption enters through six fossil distribution cost streams. We varied growth from 0% to 5% per year. The top-three set holds across the range. Its internal order flips above approximately 4.7% per year: the hydrogen freight variant rises to second and mode shift falls to third. Higher fuel prices favor deeper freight decarbonization; they do not change what the top measures are.
- Discount rate. The uniform 5% rate enters the optimization objective and therefore shapes the capacity decisions themselves. Re-discounting cost streams in post-processing would misrepresent a model that would have made different choices at another rate. We therefore report the rate and treat alternative rates as re-optimization work.
- Sector mapping. The shock-to-sector mapping contains judgment calls. We perturbed four borderline assignments one at a time, preserving each shock’s magnitude and sign. One perturbation is immaterial. Three are material. Reassigning freight fixed-cost maintenance raises the freight measures’ cost pass-through by up to 0.16 percentage points of GDP. Reassigning civil infrastructure from rail operations to construction changes the sign of mode shift’s cost effect. Reassigning electricity and hydrogen construction spending lowers the cost pass-through of the electrification measures by up to 0.15 percentage points. These are uncertainty bounds on the cost metric, not preferred remappings; we did not recompute composite ranks under them.
- Untested assumptions. Two assumptions remain untested: the transport demand elasticities and the 20% industrial energy-intensity reduction by 2050. Both enter the optimization, so varying them requires re-solved scenario ensembles, such as those produced with robust decision-making workflows for OSeMOSYS models [79,80]. We state the expected direction of each effect. Higher elasticities increase transport activity and would strengthen the transport measures that already lead the ranking. A weaker industrial-intensity assumption would strengthen industry decarbonization, which ranks mid-field under both indices.
The identity of the top three measures survives every test. Their internal order is conditional. It responds to implementation-cost scope and to fuel-price growth above 4.7% per year. We report this conditionality as a finding: the choice among the top measures depends on what the decision-maker values, while the top set itself does not.
4. Discussion
Our findings are consistent with other national assessments. Cost–benefit studies under deep uncertainty find net benefits of USD 41 billion for Costa Rica [2,3], USD 140 billion for Peru [3], and an additional 0.8% of GDP growth for Chile [4]. In those studies, benefits arise from several transformations; in Costa Rica, transport measures dominate both abatement and benefits [2]. One feature sets Costa Rica apart: because its power sector is almost entirely renewable, transport electrification cuts emissions immediately rather than depending on grid decarbonization. The prominence of freight electrification is consistent with United States evidence that electrifying long-haul trucks reduces societal costs [72] and with rapidly declining truck battery and fuel-cell costs [74]. The hydrogen variant ranks third despite its higher investment costs because the emission and cost pass-through benefits of freight decarbonization dominate; further declines in fuel-cell costs [74] would strengthen this result. Our method differs from most MCDA applications in energy planning [52,53,54,55], which rank options using expert-elicited scores. Here, a national energy model coupled to the input–output structure generates the criteria values. The ranking therefore benefits from scenario-consistent physics and cost accounting, but it also inherits the model’s assumptions, which is why we report robustness across weights, externalities, integration costs, implementation scope, and fuel prices as primary results.
5. Conclusions
We developed a pragmatic methodology that links detailed bottom–up techno-economic modeling (disaggregated by energy sector component) to impacts on economic activities through a national input–output matrix. We prioritized measures using four metrics: emission reductions (avoided emissions relative to BAU), economic benefits (avoided costs relative to BAU, including transport externalities), investment and fixed costs (reflecting how affordable each measure is), and the cost reduction in firms. We propose that the higher a measure’s priority, the more necessary it is for decarbonization, which can guide implementation by government and the private sector.
Furthermore, we disentangled the effect of each climate mitigation measure in Costa Rica’s energy system at different levels of ambition. We focused on the economic activities that the government prioritizes for development: activities that increase the country’s economic complexity and thus its economic growth. For Costa Rica, these activities cluster in agriculture, light manufacturing, advanced manufacturing, tourism, and modern services.
Three findings are robust to the sensitivity analysis. First, road freight electrification is the most robust priority. It ranks in the top three under every weighting sampled, every externality value tested, and integration-cost markups up to 50%. Second, passenger mode shift with rail is strong but conditional. Its rank depends on the scale of its supporting infrastructure: full busway costs push it from second to third. Its second place also requires fuel price growth below about 4.7% per year. Third, the robust output of the method is the prioritization itself rather than a single ranking. We report the thresholds where the top set changes, so decision-makers can place their own weightings against them. Single-measure results are not additive. Quantifying combined portfolios and their interactions under uncertainty, for example with the OSeMOSYS-RDM workflow [80], and recalibrating to post-2024 growth are the next steps of this work.
Contribution to sustainable development: The method joins two agendas that governments usually pursue separately: emission reduction and productive development. By passing energy-system scenario costs through the national input–output matrix, it measures whether a mitigation measure lowers or raises the input costs of the sectors a country has chosen to promote—a quantitative tool for the economic pillar of sustainability that complements the environmental accounting energy models already provide. For Costa Rica, the measures with the largest emission cuts, road freight electrification and passenger mode shift, also reduce costs for agriculture and light manufacturing, so the low-carbon path and the industrial path reinforce rather than compete. The composite index and the 10,000-draw weight analysis make explicit how far that conclusion depends on stated priorities, which supports transparent NDC and long-term strategy deliberation. Because the pipeline is open and relies on data most middle-income countries already hold—a national energy model, an input–output table, and a list of priority sectors—it transfers to other national processes with direct relevance to SDG 7, SDG 9, and SDG 13.
Our work offers new prioritization criteria to inform future decision-making processes, such as climate financing programs or NDC updates. However, it has five main limitations that future work can address. First, the link between the techno-economic modeling in OSeMOSYS-CR (the underlying mitigation model) and the economic activities of the input–output matrix is based on expert criteria. It could be improved through national accounts modeling by national economic authorities using additional information sources. Second, for reductions in distance driven and in the elasticity to GDP, we account only for their effects on energy consumption and vehicle requirements. Future work can expand the modeling of cities and production to include additional technology and infrastructure costs.
Third, our analysis assumes that renewables can meet demand without operational limitations, although distributed generation is constrained by the hosting capacity of distribution circuits [81]. Future work should consider the implications for system reliability, and the trade-offs, of choosing one generation option over another. Fourth, costs and benefits will be unevenly distributed across the decades to 2050; future work should examine the trade-offs of decarbonization as the process unfolds. Our approach can also be adapted to other countries or subnational regions and expanded to non-energy sectors.
Fifth, the shock-to-sector mapping follows documented expert criteria, and a perturbation test shows that the cost metric can move by 0.06 to 0.16 percentage points of GDP under alternative plausible assignments. The sign of mode shift’s cost effect depends on whether civil infrastructure is assigned to transport or construction. The shock-to-sector assignments are listed in Table 4; the full activity-level mapping is available in the public deposit.
Supplementary Materials
The following supporting information can be downloaded at https://www.mdpi.com/article/10.3390/su182110954/s1, Table S1: Benchmark scenarios per mitigation measure scenario; Table S2: Measures, strategy identifiers, scenario codes, and benchmarks.
Author Contributions
Conceptualization, J.Q.-T.; methodology, L.V.-G.; software, L.V.-G.; validation, L.V.-G.; formal analysis, L.V.-G.; investigation, L.V.-G.; resources, L.V.-G.; data curation, L.V.-G.; writing—original draft preparation, L.V.-G.; writing—review and editing, J.Q.-T.; visualization, L.V.-G.; supervision, J.Q.-T.; project administration, L.V.-G. All authors have read and agreed to the published version of the manuscript.
Funding
This research received no external funding.
Institutional Review Board Statement
Not applicable.
Informed Consent Statement
Not applicable.
Data Availability Statement
The OSeMOSYS-CR model documentation is available at https://osemosys-cr-v2.readthedocs.io/en/latest/ (accessed on 3 February 2026), and the associated software is openly available at https://github.com/EPERLab/osemosys-cr-v2 (accessed on 3 February 2026). The scenario configuration, the 2017 input–output matrix and shock-to-sector mappings, the committed scenario results, the post-processing pipeline that regenerates every table and sensitivity figure, and the externality values are openly available at https://doi.org/10.5281/zenodo.22020259. The pipeline reproduces every value reported in this article.
Conflicts of Interest
Author Luis Victor-Gallardo was employed by the company Climate Lead Group. The remaining author declares that the research was conducted in the absence of any commercial or financial relationships that could be construed as a potential conflict of interest.
Appendix A
Table A1.
Consumption distribution by economic activity [70].
References
- IDB; DDPLAC. Getting to Net-Zero Emissions: Lessons from Latin America and the Caribbean. 2019. Available online: https://publications.iadb.org/en/getting-net-zero-emissions-lessons-latin-america-and-caribbean (accessed on 13 July 2021).
- Groves, D.G.; Syme, J.; Molina-Pérez, E.; Calvo, C.; Víctor-Gallardo, L.; Godinez, G.; Quirós-Tortos, J.; De León, F.; Meza Murillo, A.; Saavedra, V.; et al. The Benefits and Costs Of Decarbonizing Costa Rica’s Economy: Informing the Implementation of Costa Rica’s National Decarbonization Plan Under Uncertainty; Inter-American Development Bank: Washington, DC, USA, 2020. [Google Scholar] [CrossRef] [Scilit]
- Quirós-Tortós, J.; Godinez, G.; Ugarte, D.D.L.T.; Heros, C.; Lazo, J.G.L.; Ruiz, E.; Quispe, B.; Canseco, D.D.; Garro, F.; Mora, J.; et al. Costos y Beneficios de la Carbono Neutralidad en Perú: Una Evaluación Robusta; Inter-American Development Bank: Washington, DC, USA, 2021. [Google Scholar] [CrossRef] [Scilit]
- Benavides, C.; Cifuentes, L.A.; Díaz, M.; Gilabert, H.; Carrasco, L.G.; González, D.; Groves, D.G.; Jaramillo, M.; Marinkovic, C.; Menares, L.; et al. Opciones Para Lograr la Carbono-Neutralidad en Chile: Una Evaluación Bajo Incertidumbre; Inter-American Development Bank: Washington, DC, USA, 2021. [Google Scholar] [CrossRef] [Scilit]
- Hansen, K.; Breyer, C.; Lund, H. Status and perspectives on 100% renewable energy systems. Energy 2019, 175, 471–480. [Google Scholar] [CrossRef] [Scilit]
- Timilsina, G.R.; Shah, K.U. Filling the gaps: Policy supports and interventions for scaling up renewable energy development in Small Island Developing States. Energy Policy 2016, 98, 653–662. [Google Scholar] [CrossRef] [Scilit]
- Dominković, D.F.; Bačeković, I.; Pedersen, A.S.; Krajačić, G. The future of transportation in sustainable energy systems: Opportunities and barriers in a clean energy transition. Renew. Sustain. Energy Rev. 2018, 82, 1823–1838. [Google Scholar] [CrossRef] [Scilit]
- Hidalgo, C.A.; Hausmann, R. The building blocks of economic complexity. Proc. Natl. Acad. Sci. USA 2009, 106, 10570–10575. [Google Scholar] [CrossRef] [Scilit] [PubMed]
- Hidalgo, C.A. Economic complexity theory and applications. Nat. Rev. Phys. 2021, 3, 92–113. [Google Scholar] [CrossRef] [Scilit]
- Doğan, B.; Driha, O.M.; Balsalobre Lorente, D.; Shahzad, U. The mitigating effects of economic complexity and renewable energy on carbon emissions in developed countries. Sustain. Dev. 2021, 29, 1–12. [Google Scholar] [CrossRef] [Scilit]
- Leitão, N.C.; Balsalobre-Lorente, D.; Cantos-Cantos, J.M. The impact of renewable energy and economic complexity on carbon emissions in brics countries under the ekc scheme. Energies 2021, 14, 4908. [Google Scholar] [CrossRef] [Scilit]
- Zheng, F.; Zhou, X.; Rahat, B.; Rubbaniy, G. Carbon neutrality target for leading exporting countries: On the role of economic complexity index and renewable energy electricity. J. Environ. Manag. 2021, 299, 113558. [Google Scholar] [CrossRef] [Scilit] [PubMed]
- Dogan, B.; Lorente, D.B.; Ali Nasir, M. European commitment to COP21 and the role of energy consumption, FDI, trade and economic complexity in sustaining economic growth. J. Environ. Manag. 2020, 273, 111146. [Google Scholar] [CrossRef] [Scilit] [PubMed]
- Neagu, O.; Teodoru, M.C. The relationship between economic complexity, energy consumption structure and greenhouse gas emission: Heterogeneous panel evidence from the EU countries. Sustainability 2019, 11, 497. [Google Scholar] [CrossRef] [Scilit]
- Chu, L.K.; Le, N.T.M. Environmental quality and the role of economic policy uncertainty, economic complexity, renewable energy, and energy intensity: The case of G7 countries. Environ. Sci. Pollut. Res. 2022, 29, 2866–2882. [Google Scholar] [CrossRef] [Scilit] [PubMed]
- Mealy, P.; Teytelboym, A. Economic complexity and the green economy. Res. Policy 2020, 51, 103948. [Google Scholar] [CrossRef] [Scilit]
- Peszko, G.; van der Mensbrugghe, D.; Golub, A.; Ward, J.; Zenghelis, D.; Marijs, C.; Schopp, A.; Rogers, J.A.; Midgley, A. Diversification and Cooperation in a Decarbonizing World; World Bank: Washington, DC, USA, 2020. [Google Scholar] [CrossRef] [Scilit]
- Williams, J.H.; Jones, R.A.; Torn, M.S. Observations on the transition to a net-zero energy system in the United States. Energy Clim. Change 2021, 2, 100050. [Google Scholar] [CrossRef] [Scilit]
- Upham, P.; Oltra, C.; Boso, À. Towards a cross-paradigmatic framework of the social acceptance of energy systems. Energy Res. Soc. Sci. 2015, 8, 100–112. [Google Scholar] [CrossRef] [Scilit]
- Mertins-Kirkwood, H. Making Decarbonization Work for Workers Policies for a just Transition to a Zero-Carbon Economy in Canada. 2018. Available online: https://www.policyalternatives.ca/wp-content/uploads/attachments/Making%20Decarbonization%20Work.pdf (accessed on 29 September 2026).
- IEA. Sustainable Recovery. Paris, 2020. Available online: https://www.iea.org/reports/sustainable-recovery (accessed on 9 September 2021).
- He, G.; Lin, J.; Sifuentes, F.; Liu, X.; Abhyankar, N.; Phadke, A. Rapid cost decrease of renewables and storage accelerates the decarbonization of China’s power system. Nat. Commun. 2020, 11, 2486, Correction in Nat. Commun. 2020, 11, 3780. https://doi.org/10.1038/s41467-020-17706-3.. [Google Scholar] [CrossRef] [Scilit] [PubMed]
- Afonso, T.L.; Marques, A.C.; Fuinhas, J.A. Energy-growth nexus and economic development: A quantile regression for panel data. In The Extended Energy-Growth Nexus: Theory and Empirical Applications; Elsevier: Amsterdam, The Netherlands, 2019; pp. 1–25. [Google Scholar] [CrossRef] [Scilit]
- Anjo, J.; Neves, D.; Silva, C.; Shivakumar, A.; Howells, M. Modeling the long-term impact of demand response in energy planning: The Portuguese electric system case study. Energy 2018, 165, 456–468. [Google Scholar] [CrossRef] [Scilit]
- Jenniches, S. Assessing the regional economic impacts of renewable energy sources—A literature review. Renew. Sustain. Energy Rev. 2018, 93, 35–51. [Google Scholar] [CrossRef] [Scilit]
- Ahl, A.; Yarime, M.; Goto, M.; Chopra, S.S.; Kumar, N.M.; Tanaka, K.; Sagawa, D. Exploring blockchain for the energy transition: Opportunities and challenges based on a case study in Japan. Renew. Sustain. Energy Rev. 2020, 117, 109488. [Google Scholar] [CrossRef] [Scilit]
- Papaefthymiou, G.; Dragoon, K. Towards 100% renewable energy systems: Uncapping power system flexibility. Energy Policy 2016, 92, 69–82. [Google Scholar] [CrossRef] [Scilit]
- Mathiesen, B.v.; Lund, H.; Connolly, D.; Wenzel, H.; Østergaard, P.A.; Möller, B.; Nielsen, S.; Ridjan, I.; Karnøe, P.; Sperling, K.; et al. Smart Energy Systems for coherent 100% renewable energy and transport solutions. Appl. Energy 2015, 145, 139–154. [Google Scholar] [CrossRef] [Scilit]
- Papadis, E.; Tsatsaronis, G. Challenges in the decarbonization of the energy sector. Energy 2020, 205, 118025. [Google Scholar] [CrossRef] [Scilit]
- Lund, H.; Mathiesen, B.V. Energy system analysis of 100% renewable energy systems-The case of Denmark in years 2030 and 2050. Energy 2009, 34, 524–531. [Google Scholar] [CrossRef] [Scilit]
- Nanaki, E.A.; Xydis, G.A. Deployment of Renewable Energy Systems: Barriers, Challenges, and Opportunities. In Advances in Renewable Energies and Power Technologies; Elsevier: Amsterdam, The Netherlands, 2018; Volume 2, pp. 207–229. [Google Scholar] [CrossRef] [Scilit]
- Pinson, P.; Mitridati, L.; Ordoudis, C.; Ostergaard, J. Towards fully renewable energy systems: Experience and trends in Denmark. CSEE J. Power Energy Syst. 2017, 3, 26–35. [Google Scholar] [CrossRef] [Scilit]
- Zozmann, E.; Göke, L.; Kendziorski, M.; del Angel, C.R.; von Hirschhausen, C.; Winkler, J. 100% renewable energy scenarios for north america—Spatial distribution and network constraints. Energies 2021, 14, 658. [Google Scholar] [CrossRef] [Scilit]
- Rehfeldt, M.; Fleiter, T.; Herbst, A.; Eidelloth, S. Fuel switching as an option for medium-term emission reduction—A model-based analysis of reactions to price signals and regulatory action in German industry. Energy Policy 2020, 147, 111889. [Google Scholar] [CrossRef] [Scilit]
- Pietrzak, M.B.; Igliński, B.; Kujawski, W.; Iwański, P. Energy transition in poland—Assessment of the renewable energy sector. Energies 2021, 14, 2046. [Google Scholar] [CrossRef] [Scilit]
- Koltsaklis, N.E.; Dagoumas, A.S.; Seritan, G.; Porumb, R. Energy transition in the South East Europe: The case of the Romanian power system. Energy Rep. 2020, 6, 2376–2393. [Google Scholar] [CrossRef] [Scilit]
- Capros, P.; Zazias, G.; Evangelopoulou, S.; Kannavou, M.; Fotiou, T.; Siskos, P.; De Vita, A.; Sakellaris, K. Energy-system modelling of the EU strategy towards climate-neutrality. Energy Policy 2019, 134, 110960. [Google Scholar] [CrossRef] [Scilit]
- Hansen, K.; Mathiesen, B.V.; Skov, I.R. Full energy system transition towards 100% renewable energy in Germany in 2050. Renew. Sustain. Energy Rev. 2019, 102, 1–13. [Google Scholar] [CrossRef] [Scilit]
- Millot, A.; Krook-Riekkola, A.; Maïzi, N. Guiding the future energy transition to net-zero emissions: Lessons from exploring the differences between France and Sweden. Energy Policy 2020, 139, 111358. [Google Scholar] [CrossRef] [Scilit]
- Boie, I.; Kost, C.; Bohn, S.; Agsten, M.; Bretschneider, P.; Snigovyi, O.; Pudlik, M.; Ragwitz, M.; Schlegl, T.; Westermann, D. Opportunities and challenges of high renewable energy deployment and electricity exchange for North Africa and Europe—Scenarios for power sector and transmission infrastructure in 2030 and 2050. Renew. Energy 2016, 87, 130–144. [Google Scholar] [CrossRef] [Scilit]
- Díaz-Cuevas, P.; Haddad, B.; Fernandez-Nunez, M. Energy for the future: Planning and mapping renewable energy. The case of Algeria. Sustain. Energy Technol. Assess. 2021, 47, 101445. [Google Scholar] [CrossRef] [Scilit]
- Ayetor, G.K.; Quansah, D.A.; Adjei, E.A. Towards zero vehicle emissions in Africa: A case study of Ghana. Energy Policy 2020, 143, 111606. [Google Scholar] [CrossRef] [Scilit]
- Akuru, U.B.; Onukwube, I.E.; Okoro, O.I.; Obe, E.S. Towards 100% renewable energy in Nigeria. Renew. Sustain. Energy Rev. 2017, 71, 943–953. [Google Scholar] [CrossRef] [Scilit]
- Bamisile, O.; Huang, Q.; Xu, X.; Hu, W.; Liu, W.; Liu, Z.; Chen, Z. An approach for sustainable energy planning towards 100% electrification of Nigeria by 2030. Energy 2020, 197, 117172. [Google Scholar] [CrossRef] [Scilit]
- Gulagi, A.; Ram, M.; Solomon, A.A.; Khan, M.; Breyer, C. Current energy policies and possible transition scenarios adopting renewable energy: A case study for Bangladesh. Renew. Energy 2020, 155, 899–920. [Google Scholar] [CrossRef] [Scilit]
- Sadiqa, A.; Gulagi, A.; Breyer, C. Energy transition roadmap towards 100% renewable energy and role of storage technologies for Pakistan by 2050. Energy 2018, 147, 518–533. [Google Scholar] [CrossRef] [Scilit]
- Li, T.; Liu, P.; Li, Z. A multi-period and multi-regional modeling and optimization approach to energy infrastructure planning at a transient stage: A case study of China. Comput. Chem. Eng. 2020, 133, 106673. [Google Scholar] [CrossRef] [Scilit]
- Liu, W.; Lund, H.; Mathiesen, B.V.; Zhang, X. Potential of renewable energy systems in China. Appl. Energy 2011, 88, 518–525. [Google Scholar] [CrossRef] [Scilit]
- Cheng, Y.; Zhang, N.; Kirschen, D.S.; Huang, W.; Kang, C. Planning multiple energy systems for low-carbon districts with high penetration of renewable energy: An empirical study in China. Appl. Energy 2020, 261, 114390. [Google Scholar] [CrossRef] [Scilit]
- Libório, F.; Firmo, H.T. Pumped Hydroelectric Energy Storage in Brazil: Challenges and Opportunities. IOP Conf. Ser. Earth Environ. Sci. 2020, 503, 012031. [Google Scholar] [CrossRef] [Scilit]
- Dranka, G.G.; Ferreira, P. Towards a smart grid power system in Brazil: Challenges and opportunities. Energy Policy 2020, 136, 111033. [Google Scholar] [CrossRef] [Scilit]
- Pohekar, S.D.; Ramachandran, M. Application of multi-criteria decision making to sustainable energy planning—A review. Renew. Sustain. Energy Rev. 2004, 8, 365–381. [Google Scholar] [CrossRef] [Scilit]
- Løken, E. Use of multicriteria decision analysis methods for energy planning problems. Renew. Sustain. Energy Rev. 2007, 11, 1584–1595. [Google Scholar] [CrossRef] [Scilit]
- Wang, J.-J.; Jing, Y.-Y.; Zhang, C.-F.; Zhao, J.-H. Review on multi-criteria decision analysis aid in sustainable energy decision-making. Renew. Sustain. Energy Rev. 2009, 13, 2263–2278. [Google Scholar] [CrossRef] [Scilit]
- Zhou, P.; Ang, B.W.; Poh, K.L. Decision analysis in energy and environmental modeling: An update. Energy 2006, 31, 2604–2622. [Google Scholar] [CrossRef] [Scilit]
- OECD; European Commission Joint Research Centre. Handbook on Constructing Composite Indicators: Methodology and User Guide; OECD Publishing: Paris, France, 2008. [Google Scholar] [CrossRef] [Scilit]
- Ferraz, D.; Falguera, F.P.S.; Mariano, E.B.; Hartmann, D. Linking economic complexity, diversification, and industrial policy with sustainable development: A structured literature review. Sustainability 2021, 13, 1265. [Google Scholar] [CrossRef] [Scilit]
- Government of Costa Rica 2018–2022. Contribución Nacionalmente Determinada 2020. 2020. Available online: https://unfccc.int/sites/default/files/NDC/2022-06/Contribucio%CC%81n%20Nacionalmente%20Determinada%20de%20Costa%20Rica%202020%20-%20Versio%CC%81n%20Completa.pdf (accessed on 29 September 2026).
- Government of Costa Rica 2018–2022. Plan Nacional de Descarbonización 2018–2050. San José, Costa Rica, 2019. Available online: https://unfccc.int/documents/204474 (accessed on 29 September 2026).
- Sciarra, C.; Chiarotti, G.; Ridolfi, L.; Laio, F. Reconciling contrasting views on economic complexity. Nat. Commun. 2020, 11, 3352. [Google Scholar] [CrossRef] [Scilit] [PubMed]
- GeoAdaptive LLC; Ministerio de Planificación Nacional y Política Económica de Costa Rica. Estrategia Económica Territorial para una Economía Inclusiva y Descarbonizada 2020–2050 en Costa Rica. 2021. Available online: https://www.mideplan.go.cr/estrategia-economica-territorial-para-una-economia-inclusiva-y-descarbonizada-2020-2050-en-costa (accessed on 29 September 2026).
- Vogt-Schilb, A.; Hallegatte, S.; de Gouvello, C. Marginal abatement cost curves and the quality of emission reductions: A case study on Brazil. Clim. Policy 2015, 15, 703–723. [Google Scholar] [CrossRef] [Scilit]
- Vogt-Schilb, A.; Meunier, G.; Hallegatte, S. When starting with the most expensive option makes sense: Optimal timing, cost and sectoral allocation of abatement investment. J. Environ. Econ. Manag. 2018, 88, 210–233. [Google Scholar] [CrossRef] [Scilit]
- Godínez-Zamora, G.; Victor-Gallardo, L.; Angulo-Paniagua, J.; Ramos, E.; Howells, M.; Usher, W.; De León, F.; Meza, A.; Quirós-Tortós, J. Decarbonising the transport and energy sectors: Technical feasibility and socioeconomic impacts in Costa Rica. Energy Strategy Rev. 2020, 32, 100573. [Google Scholar] [CrossRef] [Scilit]
- Pye, S.; Bataille, C. Improving deep decarbonization modelling capacity for developed and developing country contexts. Clim. Policy 2016, 16, S27–S46. [Google Scholar] [CrossRef] [Scilit]
- Escuela de Ingeniería Eléctrica—Universidad de Costa Rica. Estudio para la Caracterización del Consumo Energético en el Sector Industrial; Universidad de Costa Rica: San Pedro, Costa Rica, 2019. [Google Scholar]
- Escuela de Ingeniería Eléctrica—Universidad de Costa Rica. Opciones de Descarbonización del Consumo Energético en el Sector Industrial; Universidad de Costa Rica: San Pedro, Costa Rica, 2020. [Google Scholar]
- Banco Central de Costa Rica. Producto Interno Bruto por Actividad Económica. Available online: https://web.archive.org/web/20220623185411/https://gee.bccr.fi.cr/indicadoreseconomicos/Cuadros/frmVerCatCuadro.aspx?idioma=1&CodCuadro=%205784 (accessed on 29 September 2026).
- IEA. World Energy Outlook 2025; IEA: Paris, France, 2025; Available online: https://www.iea.org/reports/world-energy-outlook-2025 (accessed on 29 September 2026).
- Banco Central de Costa Rica. Matriz Insumo Producto 2017 por Actividad Económica. Cuentas Nacionales Período de Referencia 2017. 2021. Available online: https://sdd.bccr.fi.cr/es/IndicadoresEconomicos/Inicio/Submenu/1112 (accessed on 29 September 2026).
- Growth Lab at Harvard University. The Atlas of Economic Complexity. Available online: https://atlas.hks.harvard.edu/ (accessed on 29 September 2026).
- Porzio, J.; McNeil, W.; Tong, F.; Moura, S.; Auffhammer, M.; Scown, C.D. Electrifying long-haul freight trucks reduces societal costs in the United States. Nat. Commun. 2026, 17, 468. [Google Scholar] [CrossRef] [Scilit] [PubMed]
- Christoforidis, T.; Katrakilidis, C. Assessing the impacts of economic complexity and economic freedom on the energy-induced environmental performance: New evidence from a panel of EU countries. J. Knowl. Econ. 2026, 17, 587–622. [Google Scholar] [CrossRef] [Scilit]
- Link, S.; Stephan, A.; Speth, D.; Plötz, P. Rapidly declining costs of truck batteries and fuel cells enable large-scale road freight electrification. Nat. Energy 2024, 9, 1032–1039. [Google Scholar] [CrossRef] [Scilit]
- Bleviss, D.; BBG Group. The Opportunities for Sustainable Urban Transportation in Medium-Sized Cities in Latin American and the Caribbean; IDB Publications (Working Papers) 2984; Inter-American Development Bank: Washington, DC, USA, 2004. [Google Scholar] [CrossRef] [Scilit]
- Brichetti, J.P.; Mastronardi, L.; Rivas, M.E.; Serebrisky, T.; Solís, B. The Infrastructure Gap in Latin America and the Caribbean: Investment Needed Through 2030 to Meet the Sustainable Development Goals; Inter-American Development Bank: Washington, DC, USA, 2021. [Google Scholar] [CrossRef] [Scilit]
- Nunez, A.B. Sustainable Mobility for Odessa: A Road Map for Improving Accessibility and Energy Efficiency; Report No. AUS0000346; World Bank: Washington, DC, USA, 2018. [Google Scholar]
- Goytia, C. Situación Financiera de la Movilidad Urbana en Buenos Aires, 2015–2021; Documentos de Proyectos LC/TS.2022/160; Comisión Económica para América Latina y el Caribe (CEPAL): Santiago, Chile, 2022. [Google Scholar]
- Quirós-Tortós, J.; Víctor-Gallardo, L.; Rodríguez-Arce, M.; Soto-Rodríguez, A. Using Robust Decision-Making to Develop Long-Term Strategies: A Practical Guide; 2050 Pathways Platform. 2024. Available online: https://2050pathways.org/wp-content/uploads/2024/09/2050PP_RDMReport_FINAL092624Pages.pdf (accessed on 29 September 2026).
- Victor-Gallardo, L.; Salazar-Vargas, A.; González-Sanabria, L.; Soa George, J.; Quirós-Tortós, J. OSeMOSYS-RDM: A reproducible workflow for robust decision making with OSeMOSYS models. MethodsX 2026, 17, 104102. [Google Scholar] [CrossRef] [Scilit] [PubMed]
- Quirós-Tortós, J.; Valverde, G.; Argüello, A.; Ochoa, L.F. Geo-Information Is Power: Using Geographical Information Systems to Assess Rooftop Photovoltaics in Costa Rica. IEEE Power Energy Mag. 2017, 15, 48–56. [Google Scholar] [CrossRef] [Scilit]

Disclaimer/Publisher’s Note: The statements, opinions and data contained in all publications are solely those of the individual author(s) and contributor(s) and not of MDPI and/or the editor(s). MDPI and/or the editor(s) disclaim responsibility for any injury to people or property resulting from any ideas, methods, instructions or products referred to in the content. |
© 2026 by the authors. Licensee MDPI, Basel, Switzerland. This article is an open access article distributed under the terms and conditions of the Creative Commons Attribution (CC BY) license.