


Abstract
Sustainable management of agri-food systems requires advanced decision-support tools capable of integrating and balancing trade-offs across economic, food-security, nutritional, and food-system dimensions under uncertainty. This study develops a hybrid Mamdani Fuzzy Inference System–Multi-Objective Genetic Algorithm (MFIS–MOGA) framework using a harmonized global panel dataset covering the 2000–2025 analytical period, subject to indicator-specific data availability. Data from FAOSTAT, the World Bank, FAO food-security and nutrition databases, the FAO Healthy Diet Cost Database, and United Nations repositories were harmonized, preprocessed, normalized, and incorporated into MATLAB R2024a. The MFIS transformed heterogeneous indicators into interpretable sustainability assessments, while the MOGA explored trade-offs among Economic Performance, Food Security, Nutritional Sustainability, Food Loss and Waste, and the integrated Sustainability Index. The first non-dominated front contained 42 Rank-1 solutions, while five representative solutions were reported for comparative interpretation. Across the complete Rank-1 Pareto set, the Sustainability Index ranged from 0.742 to 0.770. Agreement between the model-generated and reference sustainability-score series yielded R2 = 0.964, RMSE = 0.0348, MAE = 0.0261, and MAPE = 4.87%; these statistics are interpreted as internal agreement measures rather than independent predictive validation because the reference series is derived from the same underlying indicator structure. The results demonstrate the capacity of the MFIS–MOGA framework to represent multidimensional sustainability trade-offs while maintaining interpretability and computational transparency. The sensitivity analysis identified GDP per capita as the most influential factor, followed by the Crop Production Index, Food Production Index, and Agricultural Value Added. This novel approach provides a flexible and clear workflow underpinned by evidence for the development of informed agricultural policies.
1. Introduction
Sustainable agri-food systems have become a global imperative due to increasing pressures from population growth, climate change, land degradation, water scarcity, and market volatility. These interconnected challenges directly impact agricultural productivity, economic resilience, food security, nutritional quality, and environmental integrity. Addressing these complexities requires integrated decision-support frameworks capable of balancing economic, social, and environmental trade-offs, as emphasized by United Nations Sustainable Development Goals SDG 2, SDG 12, and SDG 13. Conventional deterministic models often fail to capture these multidimensional and nonlinear interactions, frequently improving one sustainability dimension at the expense of others [1,2,3,4,5,6,7,8]. While recent developments in digital agriculture and computational intelligence provide opportunities for data-driven assessment using harmonized longitudinal datasets from organizations like the FAO, World Bank, and UN, critical methodological challenges persist [9]. Many standard artificial intelligence (AI) applications function as “black-box” models, prioritizing predictive power over interpretability and accountability [10,11,12,13,14]. The Mamdani Fuzzy Inference System (MFIS) addresses this limitation by translating quantitative indicators into interpretable linguistic variables through rule-based reasoning under uncertainty [15,16,17]. However, fuzzy systems alone do not identify optimal policy strategies when sustainability objectives conflict. Multi-Objective Genetic Algorithms (MOGAs) complement MFIS by exploring trade-off spaces to identify Pareto-optimal solutions without requiring assumptions of linearity or convexity [18,19].
- To address existing methodological gaps regarding regional bias, deterministic assumptions, and the lack of holistic integration, this study proposes a globally applicable, transparent, and reproducible hybrid evaluation framework. The main contributions of this work are fourfold:
- Hybrid AI Architecture: A unified framework combining Mamdani Fuzzy Inference Systems (MFIS) and Multi-Objective Genetic Algorithms (MOGA) for explainable sustainability assessment and optimization under uncertainty.
- Harmonized Global Dataset: A comprehensive and reproducible global panel dataset covering 2000–2025, subject to the latest available observations, and integrating twelve agricultural, socioeconomic, demographic, and nutritional indicators sourced from FAOSTAT, the World Bank, and the United Nations.
- Multi-Objective Pareto Optimization: Simultaneous evaluation and optimization across four key dimensions: economic performance, food security, nutritional sustainability, and food loss/waste reduction.
- Computational Reproducibility and Scalability: A fully functional MATLAB R2024a implementation offering an adaptable computational environment for national and regional policy analysis.
2. Literature Review
2.1. Sustainable Agri-Food Systems
Sustainable agri-food systems have evolved from production-oriented models toward multidimensional socioecological systems integrating economic viability, environmental stewardship, food security, nutrition, and social equity. Agriculture requires long-term resilience and resource availability alongside productivity. International initiatives, including the United Nations Sustainable Development Goals (SDGs), FAO frameworks, and global climate agendas, emphasize the interdependence of agricultural production, livelihoods, nutrition, natural resources, and environmental conservation.
Contemporary agri-food systems are increasingly affected by climate variability, market uncertainty, population growth, technological change, geopolitical instability, and changing consumption patterns. These factors create complex trade-offs among productivity, food availability, nutrition, resource use, and environmental performance. For instance, intensive production may increase short-term yield while contributing to soil degradation, biodiversity loss, greenhouse gas emissions, and water scarcity. Sustainable agricultural development is inherently a multidimensional systems problem requiring decision-support tools capable of balancing competing objectives [20,21].
Harmonized international databases from organizations such as the FAO, the World Bank, and the United Nations enable longitudinal cross-country sustainability assessments. However, integrating heterogeneous indicators remains challenging because variables differ in scale, temporal coverage, spatial resolution, and uncertainty. Effective decision-support systems must harmonize this information while maintaining analytical consistency and interpretability [22,23].
Previous studies have applied composite indicators, multi-criteria decision analysis, econometric models, system dynamics, machine learning, and optimization techniques. Nevertheless, composite indices may involve subjective weighting, statistical models often impose restrictive assumptions, and deterministic optimization inadequately represents system uncertainty. Furthermore, few studies integrate agricultural performance, economic conditions, food security, nutrition, and food loss within a unified computational framework using internationally harmonized panel data [24,25,26,27,28]. This creates a clear need for decision-support systems that combine explainable artificial intelligence, fuzzy inference, and evolutionary optimization.
2.2. Artificial Intelligence in Sustainable Agriculture
Artificial intelligence (AI) has become a key driver of digital agricultural transformation. Remote sensing, Internet of Things (IoT) sensors, cloud computing, unmanned aerial vehicles, and large-scale databases enable machine learning, deep learning, reinforcement learning, evolutionary computation, and knowledge-based systems [29,30]. Applications span crop-yield prediction, disease detection, irrigation and fertilizer management, soil assessment, climate-risk forecasting, livestock monitoring, supply-chain optimization, market forecasting, food-loss prevention, and policy analysis [31,32,33,34].
Despite these advancements, critical methodological limitations remain. Many AI models prioritize predictive accuracy while functioning as opaque “black boxes,” limiting their utility in policy contexts where transparency and accountability are paramount [35]. Moreover, AI applications are frequently fragmented, assessing food security, nutrition, food loss, environmental performance, and economic resilience separately despite their interdependence [36]. Purely numerical algorithms also struggle to capture qualitative concepts such as high resilience, moderate food security, or acceptable nutritional performance. Explainable artificial intelligence (XAI) seeks to address opacity, but intrinsically interpretable architectures such as fuzzy inference systems offer a superior alternative by directly modeling rule-based logic. Hybrid approaches combining knowledge-based reasoning with evolutionary optimization are particularly promising for bridging these gaps.
2.3. Mamdani Fuzzy Inference Systems for Assessment
Agricultural sustainability assessment involves pervasive uncertainty from climatic variability, environmental heterogeneity, socioeconomic disparities, and ambiguous policy criteria. Concepts such as high productivity, adequate food security, acceptable nutrition, and low environmental pressure lack rigid quantitative thresholds. Fuzzy set theory offers an effective modeling paradigm by assigning observations to linguistic categories with varying degrees of membership [37,38].The Mamdani Fuzzy Inference System (MFIS) is exceptionally well-suited for interpretable decision-support because it incorporates expert knowledge through intuitive rule structures spanning fuzzification, rule evaluation, aggregation, and defuzzification [39,40]. Compared to Sugeno systems (which use mathematical consequents), Type-2 systems (which introduce high computational costs), and ANFIS (which risks reduced interpretability through data-driven rule tuning), Mamdani systems achieve an optimal balance between uncertainty representation, computational tractability, and structural interpretability [41].While fuzzy systems excel at evaluating complex conditions, they are primarily diagnostic; they evaluate sustainability states but do not independently search for optimal strategies across conflicting goals. Therefore, adopting MFIS for uncertainty modeling and knowledge representation provides a solid foundation, which can then be extended into strategic optimization when coupled with multi-objective evolutionary algorithms.
2.4. Multi-Objective Genetic Algorithms for Optimization
Agri-food planning involves inherently conflicting objectives across economic, social, and environmental domains. Decision-makers require candidate solution sets that illuminate trade-offs rather than a single aggregated answer [42,43]. Traditional optimization techniques (e.g., linear, dynamic, or gradient-based programming) often depend on assumptions of linearity, differentiability, or convexity—assumptions that fail in complex, nonlinear agri-food systems [44]. Multi-Objective Genetic Algorithms (MOGAs) overcome these constraints by using population-based operators (selection, crossover, and mutation) to search non-convex solution spaces without requiring gradient information. MOGAs optimize multiple objectives simultaneously to construct a Pareto front of non-dominated trade-offs [45]. In particular, the Non-dominated Sorting Genetic Algorithm II (NSGA-II) is widely favored for its elitist selection, fast non-dominated sorting, and crowding-distance mechanisms that maintain solution diversity. Applying MOGAs allows for simultaneous optimization across economic performance, food security, nutritional quality, and food-loss reduction.
2.5. Hybrid Fuzzy–Genetic Decision Frameworks
The complexity of sustainable agriculture supports hybrid computational approaches. Combining fuzzy logic with genetic algorithms leverages complementary strengths: fuzzy systems provide interpretable uncertainty modeling and expert-knowledge representation, while genetic algorithms deliver robust global optimization capabilities [46,47,48,49,50].
Existing hybrid fuzzy–genetic applications in agriculture focus predominantly on operational or farm-level problems (e.g., localized irrigation scheduling, fertilizer dosing, or greenhouse management) [51,52,53]. They rarely incorporate macro-level indicators covering socioeconomic, demographic, nutritional, and resource-efficiency dimensions, nor do they leverage multi-country panel datasets. Developing a hybrid architecture that integrates Mamdani Fuzzy Inference with Multi-Objective Genetic Algorithms over harmonized longitudinal data addresses these operational gaps, moving the field toward transparent, multi-dimensional policy optimization.
2.6. Research Gaps and Scientific Contributions
Despite substantial progress in AI-based sustainability modeling, four principal methodological gaps persist in the literature. First, siloed optimization remains prevalent, as productivity, economic performance, food security, nutrition, and food loss are rarely optimized simultaneously within a unified framework. Second, geographic limitations are evident because most studies rely on localized datasets, restricting cross-country comparability and global generalizability. Third, opacity and high determinism remain important concerns: conventional machine-learning approaches often lack interpretability, whereas deterministic models have limited capacity to account for system uncertainty. Fourth, subjective aggregation is common in traditional multi-objective studies, which frequently apply arbitrary weighting schemes that may obscure the underlying Pareto trade-offs.
To address these limitations, this study presents a hybrid Mamdani Fuzzy Inference System–Multi-Objective Genetic Algorithm (MFIS–MOGA) framework applied to a harmonized international panel dataset covering the period 2000–2025, subject to the latest available observations, and incorporating twelve key indicators. Implemented in MATLAB R2024a, the framework offers several core scientific contributions. First, it introduces an explainable hybrid architecture that integrates rule-based uncertainty reasoning through MFIS with evolutionary multi-objective optimization through MOGA. Second, it develops a harmonized panel dataset designed to support reproducible global analysis by combining twelve agricultural, socioeconomic, nutritional, and environmental metrics obtained from FAOSTAT, the World Bank, and United Nations sources. Third, the framework enables Pareto trade-off identification across four critical dimensions economic performance, food security, nutritional sustainability, and food-loss reduction without relying on subjective weighting schemes. Fourth, it provides computational reproducibility through a scalable MATLAB R2024a codebase designed to facilitate replication, verification, and adaptation to national or regional policy contexts. Finally, the proposed framework serves as a policy-relevant decision-support system capable of generating interpretable assessments and actionable policy scenarios under conditions of uncertainty, while maintaining potential for global transferability.
3. Theoretical Background
Sustainable agri-food systems are interconnected socio-technical systems in which agricultural production, resources, food security, nutrition, environmental performance, and economic development interact dynamically. Therefore, sustainability assessment requires a multidimensional approach that considers competing objectives, uncertainty, and potential trade-offs rather than focusing on single indicators. The proposed framework is based on systems thinking, fuzzy reasoning, and multi-objective optimization. Fuzzy logic captures uncertainty and imprecise relationships, while the evolutionary optimization component identifies trade-offs among economic, food-security, nutritional, and environmental objectives. Explainability is ensured through transparent fuzzy rules and Pareto-based analysis rather than black-box modeling. Thus, sustainable agri-food system intelligence is built on three pillars: (i) knowledge-based uncertainty representation, (ii) multi-objective evolutionary optimization, and (iii) harmonized international panel-data integration. These components jointly provide an interpretable and adaptable framework for sustainable agri-food system assessment Table 1.
Table 1.
Theoretical constructs underpinning the proposed MFIS–MOGA framework together with their definitions, representative indicators, methodological roles, and supporting references [54,55,56,57,58,59,60,61,62,63].
Sustainable agri-food systems are complex socio-technical structures where agricultural production, natural resources, food security, nutrition, environmental performance, and economic development dynamically interact. A holistic assessment requires the simultaneous evaluation of economic, environmental, and social dimensions. Because system components are interdependent, decision-support tools must effectively model these multidimensional relationships and inherent uncertainties. The proposed framework uses a Mamdani Fuzzy Inference System (MFIS) to model system uncertainties and a Multi-Objective Genetic Algorithm (MOGA) to identify Pareto-optimal solutions among competing objectives. Grounded in Explainable Artificial Intelligence (XAI), the model ensures all decisions are based on transparent, interpretable rules.
3.1. Research Architecture of the Proposed Hybrid Intelligent Framework
The proposed architecture follows a continuous computational pipeline from empirical data to policy analysis. First, data collection and harmonization involve cleaning, imputing missing values, aligning temporal scales, and normalizing indicators sourced from heterogeneous international databases. Next, fuzzy inference processing evaluates these standardized indicators by transforming quantitative variables into linguistic representations through predefined MFIS membership functions and rule bases. Subsequently, multi-objective evolutionary optimization processes these fuzzy assessments through MOGA utilizing Non-dominated Sorting Genetic Algorithm II (NSGA-II) mechanics to search the non-convex solution space. Finally, Pareto dominance analysis evaluates the resulting non-dominated solution sets to identify strategic trade-offs and decision scenarios across conflicting objectives.
3.2. Proposed Theoretical Framework
The theoretical model evaluates sustainable agri-food systems across three interconnected analytical levels. At the empirical system indicators level, raw inputs encompass agricultural value added, crop and food production indices, fertilizer consumption, agricultural employment, agricultural land area, GDP per capita, and rural population metrics. At the integrated sustainability assessment level, the MFIS layer processes these empirical inputs through linguistic variables to generate interpretable composite sustainability scores. At the decision optimization level, the MOGA layer simultaneously optimizes four strategic goals without relying on subjective weighted aggregation: maximizing agricultural economic performance, maximizing food security, maximizing nutritional sustainability, and minimizing food loss and waste.
The characteristics of the harmonized datasets, sustainability indicators, temporal coverage, and original data sources used in the proposed MFIS–MOGA framework are summarized in Table 2 [64,65,66,67,68].
Table 2.
Characteristics of the internationally harmonized datasets, selected sustainability indicators, temporal coverage, and original data sources employed in the proposed MFIS–MOGA framework.
The conceptual structure of the proposed framework is illustrated in Figure 1, which presents the relationships among data acquisition, indicator standardization, fuzzy sustainability assessment, multi-objective optimization, and decision support. The figure highlights the sequential information flow from raw global panel data to optimized sustainability outcomes, demonstrating how heterogeneous indicators are transformed into evidence-based policy recommendations. Figure 1 presents the proposed theoretical framework of the study. The framework illustrates the sequential relationships among global data acquisition, data preprocessing, fuzzy inference modeling, multi-objective genetic optimization, and sustainability-oriented decision support. It also demonstrates how heterogeneous sustainability indicators are transformed into optimized policy recommendations through the proposed hybrid artificial intelligence framework.
Figure 1.
Overall research framework illustrating the data acquisition, preprocessing, MFIS–MOGA modeling procedure, validation process, and sustainability-oriented decision-support workflow. (Authors’ illustration).
Building upon this theoretical foundation, the following section presents the methodological implementation of the proposed framework. It describes the research design, global panel dataset, variable definitions, mathematical formulations, fuzzy inference system, multi-objective genetic algorithm, and the computational implementation developed in MATLAB R2024a.
4. Materials and Methods
4.1. Research Design
This study adopts a quantitative and computational research design to evaluate and optimize the sustainability of global agri-food systems. The proposed framework combines a Mamdani Fuzzy Inference System (MFIS) with a Multi-Objective Genetic Algorithm (MOGA). The research process consists of four sequential stages: (i) data acquisition and harmonization, (ii) data preprocessing and normalization, (iii) fuzzy-based sustainability assessment, and (iv) multi-objective optimization.
The study addresses three main research questions. RQ1: Can heterogeneous agricultural, economic, demographic, food-security, and nutritional indicators be integrated into a single interpretable sustainability assessment framework? RQ2: Can the proposed MFIS–MOGA framework identify feasible trade-offs among economic performance, food security, nutritional sustainability, and food loss and waste? RQ3: Which input indicators have the greatest influence on the resulting Sustainability Index under the defined computational conditions?
To address these questions, the study evaluates the following hypotheses.
H1.
The proposed MFIS provides an interpretable representation of sustainability conditions by integrating heterogeneous indicators through predefined membership functions and fuzzy rules.
H2.
The MOGA identifies non-dominated solutions that represent trade-offs among the competing sustainability objectives.
H3.
Changes in key agricultural and socioeconomic input indicators produce measurable changes in the Sustainability Index, allowing their relative influence to be examined through sensitivity analysis.
The empirical analysis uses a harmonized global panel dataset covering 2000–2025, subject to the latest available observations for each indicator. The data were obtained from FAOSTAT, the World Bank, FAO food security and nutrition databases, the FAO Healthy Diet Cost Database, and United Nations repositories. After data cleaning, missing-value treatment, outlier checking, unit harmonization, and Min–Max normalization, the standardized indicators were processed through the MFIS. The resulting sustainability assessment was subsequently used within the MOGA to identify non-dominated solutions under the defined objective functions and constraints.
The framework was implemented in MATLAB R2024a using the Fuzzy Logic Toolbox and Global Optimization Toolbox. Model evaluation was conducted using predictive performance measures, optimization indicators, sensitivity analysis, and comparative interpretation of the resulting sustainability outcomes. The research design therefore links the data, computational procedures, research questions, hypotheses, and evaluation criteria within a single reproducible analytical workflow.
4.2. Global Panel Dataset and Variable Selection
The study uses a harmonized global panel dataset covering 2000–2025, subject to the latest available observations for each indicator, from FAOSTAT, World Development Indicators, FAO food security and nutrition databases, the FAO Healthy Diet Cost Database, and United Nations repositories. The datasets were integrated to represent agricultural, economic, demographic, nutritional, and food-system conditions. Data were checked for consistency, missing values, outliers, temporal alignment, and unit differences before standardization. No 2026 values were treated as observed data unless they were explicitly available as official source observations. Variables were then classified according to their roles in the MFIS–MOGA framework, distinguishing MFIS inputs from optimization objectives and outputs. Detailed definitions, units, sources, and computational roles are provided in Table 3.
Table 3.
Description of the harmonized global dataset and sustainability indicators used for the development and validation of the proposed MFIS–MOGA framework.
4.3. Variable Operationalization and Optimization Framework
The study uses a harmonized global panel dataset covering the 2000–2025 analytical period, subject to indicator-specific data availability. Data were obtained from FAOSTAT, World Development Indicators, FAO food-security and nutrition databases, the FAO Healthy Diet Cost Database, and United Nations repositories. These sources were integrated to represent agricultural, economic, demographic, nutritional, and food-system conditions within a common analytical framework. Because the source databases do not provide complete annual coverage for every indicator and country, the resulting dataset is treated as an unbalanced analytical panel rather than as a fully observed balanced panel. The eight input indicators served two distinct but connected roles in the computational framework. At the data-assembly stage, AVA, CPI, FPI, FC, AE, AL, GDP, and RP represented observed country-year indicators obtained from the harmonized global panel dataset. At the optimization stage, the normalized representations of these eight indicators constituted the decision-variable vector explored by the MOGA within their predefined feasible ranges. Thus, the term “input variable” refers to the role of these indicators in the MFIS, whereas “decision variable” refers to their role in the optimization search. The distinction is important because the empirical dataset provides the observed indicator ranges and contextual information, while the MOGA searches feasible combinations of the normalized decision variables to evaluate alternative sustainability configurations. Prior to modeling, the dataset underwent duplicate removal, consistency checks, missing-value assessment, outlier detection, unit harmonization, and normalization. Variables with less than 5% missing observations were linearly interpolated, while outliers were identified using the IQR method. Observations failing quality criteria were excluded, and all retained variables were transformed using Min–Max normalization. The resulting standardized country-year database was then used for fuzzy inference and evolutionary optimization. Detailed variable definitions, sources, geographical coverage, and preprocessing procedures are provided in Table 3 and Appendix A.4 and Appendix A.5. The selected variables are subsequently represented mathematically as input and output vectors. The input vector is defined as
where
X = [AVA,CPI,FPI,FC,AE,AL,GDP,RP]T
Y = [FS,PU,HDA,FLW]T
Accordingly, the optimization decision vector is represented as
where each component represents the normalized decision-variable value associated with the corresponding observed sustainability indicator. The decision variables are constrained to the feasible ranges established from the harmonized dataset and preprocessing procedure. The MOGA evaluates candidate vectors through the MFIS and subsequently calculates the resulting objective values used for Pareto ranking.
x = [xAVA,xCPI,xFPI,xFC,xAE,xAL,xGDP,xRP]
Representing Agricultural Value Added (AVA), Crop Production Index (CPI), Food Production Index (FPI), Fertilizer Consumption (FC), Agricultural Employment (AE), Agricultural Land (AL), Gross Domestic Product per capita (GDP), and Rural Population (RP). Similarly, the output vector is expressed as
where FS denotes Food Security, PU represents the Prevalence of Undernourishment, HDA indicates Healthy Diet Affordability, and FLW corresponds to Food Loss and Waste. These variables collectively represent the principal sustainability outcomes optimized within the proposed framework. The relationship between the input and output variables is modeled as
Y = f(X;θ)
F = FIS(Xnorm)
max[f1(X), f2(X), f3(X)]
X ∈ Ω
F(X) = [1 − EP(X),1 − FS(X),1 − NS(X),1 − SI(X),FLW(X)]
Xa≺Xb ⟺ fi(Xa) ≤ fi(Xb)∀i and fj(Xa) < fj(Xb) for at least one j
P = {X∣∄X′≻X}
Before fuzzy reasoning and evolutionary optimization, all variables undergo a standardized preprocessing procedure to eliminate inconsistencies arising from heterogeneous reporting systems, different measurement units, and variations in statistical scales. The preprocessing stage consists of missing-value treatment, outlier detection, data normalization, fuzzy membership transformation, rule evaluation, and sustainability index generation. These operations ensure that all variables contribute consistently to the subsequent computational analysis while improving the robustness and numerical stability of the optimization process. The complete mathematical formulations describing the preprocessing procedure and the Mamdani Fuzzy Inference System are summarized in Table 4. The presented equations include linear interpolation for missing observations, interquartile-range-based outlier detection, Min–Max normalization, triangular membership functions, fuzzy IF–THEN rules, rule aggregation, centroid defuzzification, and Sustainability Index generation. Collectively, these formulations establish the mathematical foundation through which heterogeneous agricultural and socioeconomic variables are transformed into a unified sustainability representation suitable for artificial intelligence-based decision support. The corresponding mathematical notation adopted throughout the methodology is additionally summarized in Appendix A (Table A2) to facilitate reproducibility and improve the readability of subsequent mathematical developments. To ensure computational reproducibility, all optimization parameters and fuzzy inference settings adopted in the proposed framework were explicitly defined prior to model implementation. The selected parameter configuration was established based on preliminary experiments and commonly accepted practices reported in the optimization literature. The adopted computational parameters are summarized in Table 4.
Table 4.
Computational parameters adopted for the Mamdani Fuzzy Inference System and the Multi-Objective Genetic Algorithm implemented in MATLAB R2024a [69].
As shown in Table 4, the preprocessing equations standardize the heterogeneous variables before computational analysis, while the fuzzy inference equations transform normalized observations into linguistic representations through predefined membership functions and inference rules. The resulting Sustainability Index (SI) is subsequently incorporated into the multi-objective optimization procedure. The MOGA represents each candidate solution as a chromosome containing a specific combination of decision variables. The optimization process follows successive cycles of population initialization, objective evaluation, non-dominated sorting, selection, crossover, mutation, and elitist replacement. Candidate solutions are progressively improved until the predefined termination criterion is reached. The resulting Pareto front contains non-dominated solutions representing alternative trade-offs among the specified sustainability objectives Triangular membership functions are employed to represent the linguistic states of the input variables. Their simple parameterization and computational efficiency facilitate repeated fuzzy evaluations during the evolutionary optimization process. The mathematical formulation of the membership functions and the corresponding fuzzy rules are provided in Table 4. The performance of the proposed MFIS–MOGA framework was assessed using the statistical and optimization metrics defined in Table 5. These measures were used to evaluate model consistency, solution quality, and optimization performance.
Table 5.
Evaluation of the proposed MFIS–MOGA framework based on statistical accuracy and optimization quality indicators [70,71,72].
4.4. Data Preprocessing and Data Quality Assessment
Following data cleaning, missing-value treatment, outlier screening, and unit harmonization, the study uses a harmonized analytical panel covering 27 representative countries across six major geographic regions: Europe (7 countries), Asia (6), Africa (5), North America (3), South America (4), and Oceania (2). The analytical period spans 2000–2025, corresponding to 26 annual time points (T = 26) per country. Accordingly, the panel structure contains 702 potential country-year units (N × T = 27 × 26 = 702). Because the underlying international databases do not provide complete annual coverage for every country and indicator, the empirical dataset is treated as an unbalanced analytical panel; therefore, 702 represents the number of potential country-year combinations rather than a claim that every indicator is observed for all country-year units. The dataset comprises 12 primary sustainability indicators: eight MFIS input variables—Agricultural Value Added (AVA), Crop Production Index (CPI), Food Production Index (FPI), Fertilizer Consumption (FC), Agricultural Employment (AE), Agricultural Land (AL), GDP per capita (GDP), and Rural Population (RP)—and four MFIS output variables: Food Security (FS), Prevalence of Undernourishment (PU), Healthy Diet Affordability (HDA), and Food Loss and Waste (FLW). The Sustainability Index (SI) is treated as a derived model output rather than as a thirteenth primary empirical indicator. Missing observations accounting for less than 5% of the relevant series were estimated using linear interpolation between adjacent available observations, where appropriate: , where xt is the estimated value at time t, and t1 and t2 denote the nearest time points with available observations. Potential outliers were identified using the interquartile range (IQR) method and cross-checked against the primary data sources. Valid extreme observations were retained, whereas entries confirmed to be erroneous were corrected or removed. Following these procedures, the retained indicators were harmonized and transformed to the normalized [0, 1] scale using Min–Max normalization before fuzzy inference and multi-objective optimization.
4.5. Mamdani Fuzzy Inference System
The 12 primary indicators are processed through a Mamdani Fuzzy Inference System (MFIS), which maps normalized values to linguistic categories using triangular membership functions. The rule-firing strengths are combined through the specified aggregation operator, and the aggregated fuzzy output is converted into a crisp Sustainability Index (SI) using the selected defuzzification procedure.
For computational reproducibility, the complete IF–THEN rule base and the associated inference settings, including rule-firing, aggregation, and defuzzification procedures, are described in the manuscript. These specifications correspond exactly to the MATLAB implementation used in the analysis.
4.6. Multi-Objective Genetic Algorithm
The MOGA did not introduce a separate set of physical variables outside the empirical indicator system. Instead, it searched the feasible normalized space defined by the eight agricultural, socioeconomic, and demographic indicators already introduced in Section 4.2. Each candidate chromosome therefore represented one feasible combination of AVA, CPI, FPI, FC, AE, AL, GDP, and RP, and each chromosome was evaluated by passing its indicator values through the predefined MFIS structure. This formulation allows the optimization algorithm to explore alternative sustainability configurations while maintaining a direct correspondence between the empirical indicators and the computational decision variables.
The Multi-Objective Genetic Algorithm (MOGA) was employed to identify non-dominated solutions across five optimization objectives: Economic Performance (EP), Food Security (FS), Nutritional Sustainability (NS), Food Loss and Waste (FLW), and the integrated Sustainability Index (SI). The beneficial objectives (EP, FS, NS, and SI) are transformed into minimization terms, whereas FLW is minimized directly. Pareto dominance is used to identify non-dominated configurations and characterize trade-offs among the five objectives.
Following the MFIS-based calculation of the Sustainability Index, a Multi-Objective Genetic Algorithm (MOGA) was employed to identify feasible solutions under competing economic, food-security, nutritional, and food-system objectives. The optimization problem was formulated using a consistent minimization convention so that all objective functions had the same mathematical direction during Pareto ranking.
Five objective dimensions were considered. Economic Performance (EP), Food Security (FS), Nutritional Sustainability (NS), and the Sustainability Index (SI) were treated as beneficial objectives, for which higher values represent improved system performance. Food Loss and Waste (FLW) was treated as a non-beneficial objective, for which lower values represent improved performance. To maintain a uniform minimization formulation, the beneficial objectives were transformed using their complementary forms. The resulting objective vector was defined as
This formulation applies when the beneficial objectives are normalized to [0, 1] and the MATLAB implementation uses these same transformations.
Under this formulation, a reduction in (1 − EP), (1 − FS), (1 − NS), and (1 − SI) corresponds to an improvement in the associated beneficial performance dimension, whereas a reduction in (FLW) directly represents lower food loss and waste. This transformation eliminates ambiguity regarding objective direction and ensures consistency between the mathematical formulation, Pareto-dominance procedure, and computational implementation. Only feasible candidate solutions satisfying the predefined variable bounds and model constraints were retained during the evolutionary search. The decision-variable bounds were applied before objective evaluation, and infeasible candidate solutions were excluded from the final Pareto set. The same feasibility conditions were applied consistently across all optimization iterations so that differences among Pareto solutions reflected objective trade-offs rather than violations of the model constraints.
A solution xa dominates another solution xb when it is no worse in all five minimization objectives and strictly better in at least one objective. The non-dominated solutions obtained from the evolutionary search constitute the Pareto-optimal set and represent alternative sustainability strategies under different trade-off structures. Accordingly, the MOGA does not identify a single universally optimal configuration; instead, it generates a set of feasible non-dominated alternatives from which decision-makers can select according to their application-specific priorities.
4.7. MATLAB R2024a Implementation
The complete MFIS–MOGA framework was implemented in MATLAB R2024a (MathWorks Inc., Natick, MA, USA). Custom numerical scripts handled data preprocessing and normalization, while the Fuzzy Logic Toolbox supported membership functions, rule evaluation, inference, aggregation, and centroid defuzzification. Multi-objective evolutionary optimization was executed using the Global Optimization Toolbox. The framework was structured into modular components covering data preparation, fuzzy inference, multi-objective optimization, model validation, sensitivity analysis, and visualization. Parameters, fuzzy rules, convergence criteria, and stopping conditions were held constant to guarantee computational reproducibility.
Artificial Intelligence Use Statement. The authors used artificial intelligence (AI) tools solely for language editing, grammar correction, proofreading, and enhancing the clarity and readability of the manuscript. No generative AI (GenAI) tools were employed to draft scientific content, conduct data analysis, design the methodology, interpret results, or formulate conclusions. The authors have reviewed and approved the final manuscript and assume full responsibility for its accuracy, integrity, and originality.
4.8. Model Performance Evaluation and Sensitivity Analysis
The evaluation procedure was designed to distinguish model-output agreement from independent predictive validation. Because the Sustainability Index (SI) is generated within the proposed Mamdani Fuzzy Inference System from the harmonized agricultural, socioeconomic, food-security, nutritional, and food-system indicators, the reference SI used for comparison is not treated as an independently observed external outcome. Accordingly, the comparison between the model-generated SI and the reference SI is interpreted as an internal consistency and agreement assessment rather than as independent predictive validation.
For each evaluated observation, the reference sustainability score was obtained from the corresponding sustainability-score series derived from the harmonized global panel dataset, while the model-generated SI was obtained from the MFIS under the predefined membership functions, fuzzy rules, aggregation procedure, and centroid defuzzification. The comparison was performed on the same normalized sustainability scale. The agreement between the two series was quantified using Root Mean Square Error (RMSE), Mean Absolute Error (MAE), Mean Absolute Percentage Error (MAPE), and the coefficient of determination (R2). These measures were used to quantify numerical agreement and systematic deviation between the compared sustainability scores rather than to claim out-of-sample predictive accuracy.
RMSE measures the square-rooted average magnitude of the differences between the model-generated and reference sustainability scores and is expressed as
MAE measures the average magnitude of the differences between predicted values (yi) and reference values (yi), without considering their direction:
MAPE expresses the average absolute deviation as a percentage of the corresponding reference values and is expressed as
The coefficient of determination (R2) was used to describe the proportion of variation in the reference sustainability scores that is statistically associated with the model-generated scores. Because the reference series is not an independently collected outcome variable, R2 is interpreted as an agreement statistic rather than as evidence of independent predictive performance.
The model achieved an RMSE of 0.0348 and an MAE of 0.0261, indicating a relatively small discrepancy between the model-derived and reference sustainability values. The MAPE was 4.87%, while the coefficient of determination (R2) was 0.964, indicating a high degree of correspondence between the predicted and reference values within the evaluated dataset. Collectively, these metrics provide quantitative evidence of the predictive agreement and numerical performance of the proposed framework.
4.8.1. Sensitivity Analysis
In addition to prediction accuracy, the robustness of the proposed methodology was evaluated through a systematic sensitivity analysis. The purpose of this analysis was to determine the relative influence of the principal input variables on the generated Sustainability Index and the corresponding Pareto-optimal solutions.
Sensitivity analysis was performed using a one-factor-at-a-time (OFAT) approach. Each principal input variable was independently perturbed within a predefined range while all remaining variables were maintained at their baseline values. This procedure enabled the isolated effect of each variable to be quantified without interference from simultaneous changes in other indicators. Agricultural Value Added (AVA), Crop Production Index (CPI), Food Production Index (FPI), Gross Domestic Product per capita (GDP), Agricultural Land (AL), and Fertilizer Consumption (FC) were selected for sensitivity evaluation because these indicators represent the principal economic and agricultural drivers influencing sustainability performance. For each perturbation scenario, the corresponding changes in the Sustainability Index, objective function values, and Pareto-optimal solution set were recorded and analyzed. The sensitivity analysis provides two important methodological benefits. First, it identifies the variables that exert the greatest influence on sustainability performance, thereby improving the interpretability of the optimization results. Second, it evaluates the numerical stability of the proposed MFIS–MOGA framework by verifying that moderate variations in input variables do not produce unrealistic fluctuations in the optimization outcomes. A computational framework exhibiting stable responses to controlled input perturbations can accordingly be considered more reliable for practical decision-support applications.
4.8.2. Robustness Assessment
The computational robustness of the Multi-Objective Genetic Algorithm was assessed by monitoring convergence behavior across successive generations. Population diversity, Pareto-front evolution, and objective-function stability were examined to evaluate convergence quality and detect potential premature convergence. The robustness assessment focused on the stability of the optimization process and the preservation of solution diversity. The quantitative results of these analyses are presented in Section 5.
5. Results
The proposed MFIS–MOGA framework was evaluated using the harmonized global panel dataset covering the period 2000–2025, subject to the latest available observations. Computational analyses were conducted in MATLAB R2024a according to the procedures described in Section 4. The results are presented in five stages: (i) descriptive characteristics of the dataset, (ii) fuzzy-based Sustainability Index results, (iii) multi-objective optimization and Pareto-front analysis, (iv) model validation, and (v) sensitivity and robustness analyses. The results demonstrate how the proposed framework transforms heterogeneous agricultural, economic, demographic, and food-system indicators into integrated sustainability assessments and Pareto-efficient alternatives. The effects of input perturbations, convergence behavior, and solution stability are evaluated quantitatively in the corresponding subsections.
Figure 2 presents the overall research workflow, including data collection, preprocessing, fuzzy inference, multi-objective optimization, validation, sensitivity analysis, and interpretation of sustainability outcomes.
Figure 2.
Computational workflow of the proposed MFIS–MOGA framework, including data preprocessing, fuzzy inference, multi-objective genetic optimization, Pareto solution generation, model validation, sensitivity analysis, and decision support. (Authors’ illustration).
Figure 2 illustrates the computational workflow of the proposed MFIS–MOGA framework, tracing the transformation of heterogeneous agricultural, economic, demographic, and food-system data into actionable sustainability decision support. The process initiates with data acquisition and harmonization from open-access global databases (FAOSTAT, the World Bank, and the United Nations Portal) to establish a standardized empirical panel for cross-country and longitudinal evaluation. Preprocessing steps—including missing-value imputation, outlier verification, Min–Max normalization, and data-quality checks—guarantee analytical comparability across metrics with differing measurement scales and statistical distributions. The standardized variables enter the Mamdani Fuzzy Inference System, where triangular membership functions and domain-expert IF–THEN rules convert quantitative observations into interpretable sustainability assessments while accounting for system uncertainties and nonlinearities. The resulting Sustainability Index directly informs the Multi-Objective Genetic Algorithm (MOGA), which simultaneously evaluates competing sustainability goals to map a set of Pareto-efficient trade-off strategies rather than a single aggregated scalar optimum. This dual-layer design illuminates strategic balances among economic performance, food security, nutritional quality, and food-loss reduction. The pipeline concludes with predictive model validation, input sensitivity testing, and multi-scenario policy analysis, offering an integrated, transparent, and computationally reproducible decision-support system.
5.1. Dataset Characteristics and Descriptive Statistics
The proposed framework was evaluated using the harmonized global panel dataset spanning 2000–2025, subject to the latest available observations. Preprocessing established a structurally consistent analytical database for fuzzy reasoning and evolutionary optimization. Descriptive statistical analysis revealed substantial cross-country heterogeneity, driven by structural variations in agricultural practices, climate, technological adoption, economic capacity, and demographics. Key agricultural indicators—including Agricultural Value Added (AVA), Crop Production Index (CPI), and Food Production Index (FPI)—demonstrated wide variation across regions, mirroring significant disparities observed in per capita GDP and rural population proportions. Systematic data cleaning and interpolation reduced the influence of incomplete or anomalous records on downstream model components. By deploying the Mamdani Fuzzy Inference System, these diverse quantitative metrics are mapped into interpretable linguistic categories governed by expert-defined rules, accurately reflecting non-linear transitions across sustainability states. To analyze how differing policy priorities influence evolutionary outcomes, multiple computational scenarios were evaluated to map target trade-offs and confirm the structural robustness of the generated Pareto-optimal solutions, as detailed in Table 6.
Table 6.
Analysis of optimization results obtained under different sustainability scenarios generated by the proposed MFIS–MOGA framework.
Table 6 presents the descriptive statistics of the processed global dataset for 2000–2025, subject to the latest available observations. Agricultural Value Added (AVA) averaged 9.84% of GDP, while GDP per capita showed the greatest dispersion (mean = USD 18,964; SD = USD 21,875), reflecting significant differences in national development levels. Fertilizer consumption also varied considerably (3.25–621.84 kg/ha) and showed positive skewness, indicating intensive agricultural input use in a limited number of countries. Overall, the statistics confirm that the selected variables capture the multidimensional characteristics of sustainable agri-food systems. Production indicators showed moderate variability, whereas socioeconomic indicators displayed greater dispersion. Following preprocessing and normalization, food-security indicators showed more balanced distributions. To capture uncertainty and nonlinear relationships, the proposed framework employs a Mamdani Fuzzy Inference System (MFIS). Normalized input variables were converted into linguistic variables using predefined membership functions, allowing quantitative observations to be interpreted through human-readable fuzzy rules. The membership functions used in the analysis are presented in Figure 3.
Figure 3.
Triangular membership functions used in the Mamdani Fuzzy Inference System to transform quantitative sustainability indicators into Low, Medium, and High linguistic states. (Authors’ illustration).
The three-dimensional distribution in Figure 3 highlights substantial heterogeneity in the global agri-food dataset. Agricultural Value Added (AVA) ranges from 0.31% to 43.82% of GDP, with a mean of 9.84%, while GDP per capita varies from USD 468 to USD 133,711 (mean: USD 18,964). The Food Security Index ranges from 28.45 to 91.83, with a mean of 66.84. These variations reflect substantial cross-country differences in agricultural dependence, economic development, and food-security performance. High-income economies generally exhibit Food Security Index values above 80, whereas lower-income countries show greater variability. Although economic development is positively associated with food security, the observed dispersion indicates that economic prosperity alone does not determine sustainability performance. This nonlinear relationship supports the application of fuzzy inference, which captures gradual transitions more effectively than rigid threshold-based approaches.
Figure 4 presents the Pareto-optimal solutions obtained from the proposed multi-objective optimization framework, illustrating trade-offs among agricultural economic performance, food security, nutritional sustainability, and food-loss reduction. Overall, the harmonized dataset provides a reliable basis for subsequent sustainability assessment and optimization through standardized indicators, systematic quality control, and appropriate preprocessing.
Figure 4.
The nonlinear response surface generated by the Mamdani Fuzzy Inference System (MFIS), showing the relationship between the Crop Production Index (CPI), Food Production Index (FPI), and Sustainability Index (SI). (Authors’ illustration).
5.2. Sustainability Assessment Using the Mamdani Fuzzy Inference System
The first computational stage involved assessing agri-food sustainability using a Mamdani Fuzzy Inference System (MFIS). The system integrates agricultural, economic, demographic, nutritional, and food-system indicators into a unified Sustainability Index (SI). SI values varied considerably across observations, reflecting differences in agricultural productivity, socioeconomic conditions, food security, nutrition, and food-system performance. Stronger agricultural and economic conditions were generally associated with higher SI values.
The distribution of SI demonstrates that the fuzzy framework differentiates sustainability conditions without imposing abrupt classification boundaries. Overlapping triangular membership functions enable gradual changes in input variables to generate corresponding transitions between linguistic sustainability categories. Following fuzzification, expert knowledge was incorporated through an IF–THEN rule base linking agricultural, socioeconomic, nutritional, and food-system conditions. The resulting fuzzy outputs were subsequently transferred to the multi-objective optimization stage. The overall fuzzy inference process is illustrated in Figure 4.
CPI ranges from 56.84 to 176.91, while FPI ranges from 62.45 to 182.76, with SI values ranging approximately from 0.35 to 0.90. Lower production levels are generally associated with lower SI values, whereas simultaneous increases in CPI and FPI lead to higher sustainability outcomes, with SI approaching 0.90 at high production levels. The smooth nonlinear pattern reflects the overlapping membership functions and IF–THEN rules of the MFIS, allowing gradual transitions rather than rigid thresholds.
The descriptive results also reveal substantial heterogeneity in the global dataset. Positive skewness in AVA, GDP per capita, fertilizer consumption, and PU indicates asymmetric distributions, while high kurtosis for fertilizer consumption (8.64) and GDP per capita (7.83) reflects extreme observations. These findings highlight the importance of data harmonization, outlier detection, and normalization. Overall, the results demonstrate that MFIS can generate continuous and interpretable nonlinear sustainability responses, supporting its application to heterogeneous agri-food systems. Table 7 presents the numerical agreement assessment between the model-generated Sustainability Index and the reference sustainability-score series. The reported metrics quantify the magnitude of deviation and the degree of statistical correspondence between the two series. Because the reference sustainability score is not an independently observed external outcome, these statistics are interpreted as internal consistency and agreement measures rather than independent predictive-performance measures. For transparency and reproducibility, the fuzzy inference system is defined by its membership functions, rule base, aggregation procedure, and defuzzification method. These specifications enable readers to examine how the input indicators are mapped to the Sustainability Index (SI) and to reproduce the inference procedure under the same model settings.
Table 7.
Triangular Fuzzy Membership Function Parameters for the Normalized Indicators and Sustainability Index Output.
5.3. Multi-Objective Genetic Algorithm Optimization Results
Following the computation of the Sustainability Index by the Mamdani Fuzzy Inference System, the Multi-Objective Genetic Algorithm (MOGA) was employed to determine the optimal sustainability strategies under simultaneously conflicting economic, social, and environmental objectives. The optimization process generated a set of feasible candidate solutions exhibiting different trade-offs among Economic Performance (EP), Food Security (FS), Nutritional Sustainability (NS), Food Loss and Waste (FLW), and the integrated Sustainability Index (SI). Non-dominated solutions were identified through Pareto ranking, and the first non-dominated front contained 42 solutions. Five solutions are reported in Table 8 as representative cases for detailed comparison; these include four Rank-1 solutions and one Rank-2 solution selected to illustrate the economic-performance trade-off. Unlike conventional single-objective optimization methods that identify only one optimal solution, the Pareto-based evolutionary algorithm produced multiple non-dominated alternatives. Each candidate solution represents a feasible configuration within the modeled indicator space. The solutions differ in their objective values and therefore illustrate alternative trade-offs among the modeled sustainability dimensions rather than directly executable agricultural policies. This distinction is maintained throughout the interpretation of the Pareto results. This characteristic provides greater flexibility for agricultural decision-makers because different policy priorities can be addressed using different Pareto-optimal solutions Table 8.
Table 8.
Representative Solutions from the MOGA Pareto Search.
Across the complete set of 42 Rank-1 non-dominated solutions, the Sustainability Index ranged from 0.742 to 0.770, with the reported range describing the complete first Pareto front rather than only the five solutions displayed in Table 8. Table 8 contains four Rank-1 solutions and one Rank-2 comparative solution. Therefore, P4 is not included in the calculation of the Rank-1 Pareto-front range. The five displayed cases are used only to illustrate contrasting objective trade-offs. This comparison clearly illustrates that economic growth alone cannot ensure sustainable agri-food system development. Sustainable agri-food systems involve multiple conflicting objectives that cannot be optimized simultaneously using conventional single-objective approaches. Among the five representative cases, P5 exhibited the highest Sustainability Index (0.770), together with a Food Security score of 0.88, Nutritional Sustainability of 0.84, and Food Loss and Waste of 0.26. P4 exhibited the highest Economic Performance among the five reported cases (0.84), but its Sustainability Index was 0.744 and its Pareto Rank was 2. These differences demonstrate the trade-offs among the objective dimensions and show that a stronger performance in one dimension does not necessarily produce simultaneous improvements in all other dimensions. P4 is therefore interpreted as a comparative near-efficient configuration rather than as a member of the first Pareto front. The complete Rank-1 solution set remains the basis for interpretation of the Pareto-front-level results. The resulting Pareto front is presented in Figure 5.
Figure 5.
First Pareto front generated by the MFIS–MOGA framework, showing the 42 Rank-1 non-dominated solutions and the trade-offs among Economic Performance, Food Security, Nutritional Sustainability, Food Loss and Waste, and the integrated Sustainability Index. (Authors’ illustration).
Figure 5 presents the Pareto-optimal solutions obtained through the Multi-Objective Genetic Algorithm. The Sustainability Index of the representative solutions ranges from 0.742 to 0.770, indicating consistently high overall system performance. Among the reported solutions, P5 achieved the highest Sustainability Index (0.770) by combining a Food Security score of 0.88, Nutritional Sustainability of 0.84, and the lowest Food Loss and Waste value (0.26). In contrast, P4 produced the highest Economic Performance (0.84) but a lower overall Sustainability Index (0.744) because of comparatively weaker food security and nutritional outcomes.
Optimization Performance Analysis
The computational performance of the proposed Multi-Objective Genetic Algorithm (MOGA) was further evaluated by analyzing its convergence behavior, solution diversity, and optimization efficiency throughout the evolutionary search process. The objective of this analysis was to verify that the algorithm consistently converged toward a stable set of Pareto-optimal solutions while preserving sufficient diversity within the candidate population. Figure 6 illustrates the convergence characteristics of the proposed optimization framework. A rapid improvement in the objective function values was observed during the initial generations, indicating efficient exploration of the feasible search space. As the evolutionary process progressed, the convergence rate gradually decreased and eventually stabilized, demonstrating that the algorithm successfully approached the Pareto-optimal region without exhibiting oscillatory behavior or premature convergence. The optimization performance indicators are summarized in Table 9.
Figure 6.
Convergence curve showing the evolution of the best sustainability index over 200 generations using the proposed MFIS–MOGA algorithm. The maximum achieved value Best Val= 0.770 is indicated.
Table 9.
Summarizes the computational performance of the proposed MFIS–MOGA framework during the multi-objective optimization process.
Table 9 summarizes the computational performance of the proposed MFIS–MOGA framework during the multi-objective optimization process. The algorithm was executed using a population size of 100 individuals over 200 generations, providing a predefined computational setting for exploring the feasible solution space and identifying non-dominated solutions. The optimization simultaneously considered eight decision variables representing agricultural and socioeconomic characteristics and four sustainability objectives: Economic Performance, Food Security, Nutritional Sustainability, and Food Loss and Waste.
The optimization procedure identified 42 non-dominated Pareto-optimal solutions, indicating that the algorithm generated multiple efficient alternatives rather than converging to a single solution. The resulting Pareto set provides decision-makers with alternative sustainability strategies corresponding to different trade-offs among the considered objectives. This multi-solution structure is particularly relevant for sustainability planning because the relative importance assigned to economic, food-security, nutritional, and food-loss objectives may differ across countries and policy contexts. The Sustainability Index values associated with the Pareto-optimal solutions ranged from 0.742 to 0.770, with a mean value of 0.756. The observed range of 0.028 indicates relatively limited variation in the aggregated Sustainability Index across the identified Pareto solutions. This result suggests that alternative non-dominated solutions achieved broadly comparable overall sustainability scores while differing in the underlying objective trade-offs. However, the narrow Sustainability Index range should be interpreted together with the individual objective values because aggregation into a single index may conceal differences among specific sustainability dimensions. The Pareto-based results indicate that agri-food sustainability is inherently multi-objective, involving trade-offs among economic performance, food security, nutritional sustainability, and food loss and waste. The final first non-dominated front contained 42 Rank-1 solutions, demonstrating that alternative feasible configurations can achieve different combinations of objective performance rather than converging to a single universally superior configuration. The five solutions presented in Table 8 are representative comparative cases; four belong to the first non-dominated front, whereas P4 is a Rank-2 solution retained to illustrate the economic-performance trade-off. Thus, the reported alternatives should be interpreted as comparative modeled configurations rather than as a definitive ranking of universally optimal agricultural policies.
The evolutionary search employed a crossover probability of 0.80 and a mutation probability of 0.10. These parameter settings were used to balance recombination of promising solutions with the introduction of stochastic variation during the evolutionary search. The resulting Pareto-front distribution was subsequently examined to evaluate convergence behavior and solution diversity. Evidence regarding convergence and the preservation of population diversity is presented separately through the convergence analysis in Figure 6.
The complete optimization required approximately 2.63 s under the MATLAB R2024a computational environment. This execution time indicates a relatively low computational burden for the specific experimental configuration considered in this study. Accordingly, the framework can support repeated optimization runs and scenario-based analyses within the same computational environment. Nevertheless, computational time may vary depending on hardware specifications, population size, number of generations, number of objective functions, and the complexity of the implemented fuzzy rule base.
Overall, the optimization results demonstrate that the proposed MFIS–MOGA framework was capable of generating a set of non-dominated sustainability alternatives within the specified computational settings. The combination of multiple Pareto-optimal solutions, comparatively limited variation in the aggregated Sustainability Index, and the observed computational efficiency provides evidence of the practical computational performance of the proposed framework. The convergence behavior of the algorithm was subsequently examined across successive generations to further assess search stability and the progression of the Pareto front. The corresponding convergence profile is presented in Figure 6.
Figure 6 illustrates the convergence behavior of the proposed Multi-Objective Genetic Algorithm (MOGA) throughout the evolutionary optimization process. Authors’ illustration).
During the initial generations, the objective functions improve rapidly as the algorithm explores the feasible solution space. Subsequently, the improvement rate decreases and the convergence curve approaches a stable plateau, indicating convergence toward a well-distributed Pareto-optimal region.
The convergence pattern demonstrates an effective balance between global exploration and local exploitation. Early generations identify promising search regions, while later generations refine non-dominated solutions while preserving population diversity. The absence of substantial oscillations suggests stable optimization and effective crossover and mutation operators. As summarized in Table 9, Each Pareto solution represents a feasible combination of the eight normalized agricultural, socioeconomic, and demographic decision variables. The resulting combination was evaluated through the fixed MFIS structure to obtain the corresponding sustainability-related outputs and objective values. Consequently, the differences among Pareto solutions reflect alternative configurations of the empirical indicator space rather than independently observed country-year cases. This interpretation allows the Pareto front to be understood as a computational exploration of feasible sustainability configurations derived from the empirical indicator ranges. Overall, the convergence analysis confirms the computational stability and robustness of the proposed framework, supporting its applicability to complex agri-food sustainability planning and decision-making. Sensitivity analysis indicates that GDP per capita and the Crop Production Index exert the strongest modeled influence on the Sustainability Index under the specified computational conditions, whereas Agricultural Value Added and the Food Production Index show comparatively smaller responses. These findings suggest that the sustainability score generated by the proposed framework is particularly sensitive to socioeconomic development conditions and crop-production performance. However, the sensitivity results should be interpreted as model-based associations within the defined indicator space rather than as estimates of causal effects. The findings therefore identify variables that deserve greater attention in scenario analysis, while further empirical and longitudinal studies would be required to establish causal mechanisms.
5.4. Model Validation and Sensitivity Analysis
The reliability, predictive accuracy, and robustness of the proposed MFIS–MOGA framework were evaluated through model validation and sensitivity analysis using the global panel dataset. Predicted Sustainability Index values were compared with observed values to assess the model’s ability to represent interactions among agricultural production, socioeconomic conditions, food security, and resource use.
Figure 7 presents the relationship between observed and predicted Sustainability Index values. The close agreement between the two series indicates that the hybrid model effectively reproduces observed sustainability patterns across countries and time periods. Minor deviations at the extremes of the prediction range suggest stable predictive performance under heterogeneous agricultural and socioeconomic conditions. The corresponding statistical validation results are presented in Table 10.
Figure 7.
Comparison between model-generated and reference sustainability index values (R2 = 0.964, RMSE = 0.0348), illustrating internal numerical agreement across the evaluated country-year observations. (Authors’ illustration).
Table 10.
Model–Reference Sustainability Index Agreement Results.
The agreement assessment on Table 10 produced an RMSE of 0.0348 and an MAE of 0.0261, indicating relatively small numerical deviations between the model-generated and reference sustainability-score series. The MAPE was 4.87%, while R2 was 0.964, indicating a high degree of statistical correspondence within the evaluated dataset. These values support the numerical consistency of the proposed MFIS with the reference sustainability-score series under the defined computational conditions. However, because the reference series is not independent of the indicator structure used by the framework, these results are interpreted as internal agreement measures rather than as evidence of out-of-sample predictive accuracy.
In addition to statistical validation, a sensitivity analysis was conducted to examine the response of the Sustainability Index to variations in selected input variables. Agricultural Value Added (AVA), Crop Production Index (CPI), Food Production Index (FPI), and Gross Domestic Product per capita (GDP) were individually perturbed by ±20%, while all remaining variables were held constant. The resulting changes in the Sustainability Index were evaluated to determine the relative sensitivity of the framework to changes in the principal input variables.
The sensitivity analysis indicated that GDP per capita exerted the greatest influence on the Sustainability Index, followed by CPI, FPI, and AVA. A 20% decrease and increase in GDP resulted in Sustainability Index changes of −9.42% and +8.76%, respectively. Equivalent perturbations in CPI produced changes of −7.34% and +6.95%, whereas FPI resulted in changes of −6.51% and +6.12%. AVA exhibited the smallest response, with corresponding changes of −5.21% and +4.83%. The relatively consistent responses to positive and negative perturbations indicate stable model behavior within the examined sensitivity range.
To further assess predictive performance, the optimized sustainability estimates were compared with the corresponding reference values derived from the harmonized global dataset. This comparison provides an additional quantitative assessment of the agreement between model outputs and reference observations. The results presented in Table 9 therefore complement the sensitivity analysis by evaluating both predictive agreement and response stability under controlled perturbations. This comparison provides an additional level of model validation by evaluating the agreement between predicted and observed sustainability outcomes. The validation results are presented in Figure 7.
Figure 7 demonstrates the predictive capability of the proposed hybrid model. The statistical validation results reported in Table 9 indicate an RMSE of 0.0348, MAE of 0.0261, and MAPE of 4.87%, confirming relatively small prediction errors across the evaluation dataset. Furthermore, the coefficient of determination (R2 = 0.964) shows that approximately 96.4% of the variability in sustainability performance is explained by the proposed computational framework.
The close agreement between observed and predicted values indicates that the integrated fuzzy–genetic model accurately captures the complex relationships among agricultural, economic, and food-system indicators. Only limited deviations are observed at the extremes of the prediction range, suggesting that the proposed framework remains reliable even under highly heterogeneous conditions. Overall, the validation results demonstrate excellent predictive performance and strong computational robustness.
Table 11 presents the overall performance evaluation and policy implications of the proposed hybrid optimization framework. The table summarizes the principal computational outcomes, validation metrics, optimization performance, and practical sustainability contributions obtained from the developed artificial intelligence model. It provides a comprehensive overview of the effectiveness and applicability of the proposed methodology.
Table 11.
Summarizes the sensitivity analysis conducted.
Table 10 summarizes the sensitivity analysis performed by systematically varying the principal input variables by ±20% while maintaining all remaining variables constant. The objective of this analysis was to evaluate the robustness of the proposed MFIS–MOGA framework and to identify the variables exerting the greatest influence on the Sustainability Index. The results indicate that GDP per capita is the most influential variable, with a 20% decrease reducing the Sustainability Index by 9.42%, whereas a 20% increase improves the index by 8.76%. The Crop Production Index (CPI) represents the second most influential factor, producing changes of −7.34% and +6.95%, respectively. Agricultural Value Added (AVA) exhibits a moderate influence, while the Food Production Index (FPI) demonstrates comparatively lower sensitivity within the analyzed range. These findings indicate that the proposed optimization framework remains numerically stable under moderate variations in the input variables while accurately distinguishing the relative importance of agricultural and socioeconomic indicators. Consequently, the sensitivity analysis confirms the robustness of the developed hybrid artificial intelligence model and supports its applicability for sustainable agri-food planning under varying development scenarios. To further investigate the robustness of the proposed decision-support framework, a comprehensive sensitivity analysis was conducted by systematically varying the principal agricultural and socioeconomic indicators while maintaining the remaining variables at their baseline values. This analysis identifies the relative influence of individual variables on sustainability performance and evaluates the numerical stability of the optimization framework under different input conditions. The corresponding sensitivity results are illustrated in Figure 8.
Figure 8.
Sensitivity analysis illustrating the influence of variations in key agricultural and socioeconomic indicators on the integrated Sustainability Index generated by the proposed MFIS–MOGA framework. (Authors’ illustration).
Figure 8 presents the sensitivity analysis conducted by perturbing the principal decision variables by ±20%. Among the examined variables, GDP per capita exhibited the strongest influence on the Sustainability Index, with a 20% decrease resulting in a 9.42% reduction in sustainability, whereas a 20% increase produced an 8.76% improvement. The Crop Production Index demonstrated the second-highest sensitivity, with corresponding changes of −7.34% and +6.95%. Agricultural Value Added showed a comparatively moderate effect, resulting in sustainability changes of −5.21% and +4.83%. The Food Production Index produced changes of −6.51% and +6.12%, indicating a measurable but comparatively less pronounced influence on the Sustainability Index. Overall, the relatively balanced responses to positive and negative perturbations indicate that the model behaves consistently across alternative input conditions. The absence of abrupt changes further supports the numerical stability of the proposed MFIS–MOGA framework and its applicability to sustainability assessment under varying socioeconomic conditions. The results demonstrate that the proposed MFIS–MOGA framework can identify meaningful relationships between economic, agricultural, and sustainability-related variables while maintaining a multi-objective optimization perspective. The results also show that the influence of the input variables is not uniform. GDP per capita has the strongest effect on the model outcomes, followed by the Crop Production Index, while Agricultural Value Added and the Food Production Index have comparatively smaller effects. This finding indicates that economic capacity and agricultural productivity should be considered jointly when evaluating sustainable agri-food systems. The consistency between the sensitivity analysis, statistical validation, and Pareto-based optimization results further supports the robustness of the proposed framework.
6. Discussion
The findings demonstrate that integrating the Mamdani Fuzzy Inference System (MFIS) with a Multi-Objective Genetic Algorithm (MOGA) provides an interpretable computational framework for assessing and exploring sustainability trade-offs in agri-food systems using harmonized international data. The framework simultaneously considers Economic Performance, Food Security, Nutritional Sustainability, and Food Loss and Waste, thereby avoiding the restriction of a single aggregated objective. The model-generated and reference sustainability-score series showed strong numerical agreement, with R2 = 0.964, RMSE = 0.0348, MAE = 0.0261, and MAPE = 4.87%. These statistics should be interpreted as internal agreement measures because the reference series is derived from the same underlying indicator structure rather than from an independent external validation dataset. Accordingly, the results support the numerical consistency of the proposed assessment procedure but should not be interpreted as evidence of causal relationships or independent out-of-sample predictive accuracy. The principal methodological contribution lies in integrating interpretable fuzzy reasoning with evolutionary multi-objective optimization. MFIS provides a transparent rule-based mechanism for translating heterogeneous agricultural and socioeconomic indicators into an integrated Sustainability Index, while MOGA explores alternative configurations under competing objectives without requiring a single subjective weighting scheme. The integration of harmonized agricultural, economic, demographic, nutritional, and food-system indicators further provides a common computational basis for cross-country analysis. This combination is particularly useful when the objective is not to identify one deterministic optimum, but to characterize alternative sustainability configurations and the associated trade-offs among competing dimensions.
Sensitivity analysis indicates that GDP per capita and the Crop Production Index have the strongest effects on the Sustainability Index, whereas Agricultural Value Added and the Food Production Index show comparatively smaller responses. This finding suggests that sustainability depends not only on production capacity but also on broader socioeconomic conditions affecting food accessibility, affordability, and system resilience.
From a policy perspective, the framework can support scenario evaluation before implementation by allowing decision-makers to compare alternative modeled configurations across competing sustainability objectives. Because several MOGA decision variables correspond to observed socioeconomic and agricultural indicators rather than directly controllable policy instruments, the generated solutions should not be interpreted as ready-to-implement policy packages. Instead, they provide a structured analytical basis for examining how alternative combinations of agricultural and socioeconomic conditions are associated with different sustainability outcomes. This distinction strengthens the appropriate use of the framework as a decision-support tool rather than as a prescriptive policy model. Nevertheless, limitations include reliance on secondary international data, potential inconsistencies in reporting and temporal coverage, subjectivity in the fuzzy rule base, and the use of nationally aggregated indicators. Future research should incorporate higher-resolution spatial data, climate indicators, remote sensing, real-time monitoring, and advanced AI methods. Comparative applications of NSGA-III, MOEA/D, and multi-objective particle swarm optimization could further assess computational efficiency and robustness.
Overall, the findings support the usefulness of the MFIS–MOGA framework for representing multidimensional sustainability trade-offs in a transparent computational environment. The main value of the framework lies in integrating heterogeneous indicators, interpretable fuzzy assessment, and Pareto-based optimization within a common analytical structure. At the same time, the results should be interpreted within the limits of the available secondary data, the nationally aggregated analytical scale, the subjectivity associated with fuzzy-rule formulation, and the stochastic nature of evolutionary optimization. These considerations define the appropriate scope for interpreting the reported results and motivate further validation using richer spatial, temporal, and computational datasets. The findings provide an important implication for sustainable agri-food policy. The higher influence of GDP per capita suggests that economic capacity can affect the ability of countries to improve agricultural performance and manage food-system losses. At the same time, the strong contribution of the Crop Production Index indicates that agricultural productivity remains a central component of sustainability. Therefore, improvement strategies should not focus on agricultural production alone but should also consider the economic conditions that support technological adoption, resource efficiency, and system resilience. The proposed framework can support this process by comparing alternative configurations rather than prescribing a single optimal solution.
7. Conclusions, Limitations and Future Research
This study developed a hybrid computational framework integrating Mamdani fuzzy reasoning with multi-objective evolutionary optimization for sustainable agri-food system assessment. The framework combines harmonized international data, uncertainty-aware evaluation, Pareto-based optimization, and quantitative validation within a unified analytical structure. The optimization results further demonstrate the multi-objective nature of agri-food sustainability. The final first non-dominated front contained 42 Rank-1 solutions, while the five solutions reported in Table 8 were used as representative comparative cases. Across the complete Rank-1 Pareto set, the Sustainability Index ranged from 0.742 to 0.770. These results indicate that alternative combinations of the modeled agricultural and socioeconomic indicators can produce different trade-offs among Economic Performance, Food Security, Nutritional Sustainability, and Food Loss and Waste. The results therefore support the use of Pareto-based decision support when multiple sustainability objectives must be considered simultaneously rather than reduced to a single weighted score.
The results demonstrate that agri-food sustainability cannot be adequately represented by a single economic or production indicator. Integrating agricultural, socioeconomic, food-security, nutritional, and food-system dimensions provides a more comprehensive assessment. The MFIS converts heterogeneous indicators into an interpretable Sustainability Index, while MOGA identifies alternative solutions under competing objectives.
The Pareto-based results further demonstrate that sustainable development involves inherent trade-offs. By preserving objective independence and generating multiple non-dominated alternatives, the framework enables decision-makers to select strategies according to institutional priorities, resource constraints, and development conditions. Systematic data harmonization, missing-value treatment, outlier assessment, normalization, and quality control also strengthen the reliability and reproducibility of the analysis.
The framework offers practical value as a decision-support tool for evaluating alternative sustainability strategies before policy implementation. However, several limitations remain. The use of harmonized secondary data may introduce residual uncertainty due to differences in reporting practices, temporal coverage, and data availability. Nationally aggregated indicators may also mask within-country differences in climate, farming systems, infrastructure, and resource availability. Accordingly, the results should primarily be interpreted as strategic and policy-level guidance rather than farm-level recommendations. Furthermore, expert-based fuzzy rule formulation introduces a degree of methodological subjectivity.
Future research should incorporate higher-resolution spatial datasets, remote sensing, IoT-based monitoring, and near-real-time agricultural observations. Additional dimensions, including climate change, greenhouse-gas emissions, water–energy–food interactions, biodiversity, soil quality, and circular bioeconomy indicators, could further strengthen the assessment. Advanced approaches such as explainable AI, reinforcement learning, graph neural networks, federated learning, and digital twins could also improve model adaptability. Comparative testing with alternative multi-objective algorithms, including NSGA–III, MOEA/D, and multi-objective particle swarm optimization, would provide further evidence of computational robustness and generalizability.
The MFIS–MOGA framework provides an interpretable and flexible computational approach for representing multidimensional sustainability trade-offs in agri-food systems. Its primary value lies in integrating heterogeneous international indicators, transparent fuzzy reasoning, and Pareto-based optimization within a reproducible analytical workflow. The framework should be regarded as a decision-support and scenario-analysis tool whose results are conditioned by the quality of the underlying data, the specified fuzzy knowledge structure, and the stochastic optimization configuration. Further empirical validation, higher-resolution data, and repeated computational experiments will be important for extending its generalizability and practical applicability. The study also highlights several practical implications. The sensitivity analysis identifies GDP per capita as the most influential factor, followed by the Crop Production Index, indicating that economic capacity and agricultural productivity should be addressed together in sustainability-oriented strategies. The MFIS–MOGA framework provides a flexible computational structure for evaluating multiple objectives without relying on a single weighted aggregation. Rather than producing one universally optimal configuration, the approach generates a set of non-dominated alternatives that can support context-specific decision making. Future studies may extend the framework by incorporating additional country-level indicators, longer time-series observations, and alternative sustainability dimensions as new data become available.
Author Contributions
Conceptualization, A.G., W.S., F.G.,H.K., A.Y. and H.Y.O.; methodology, A.G. and F.G.; software, A.G. and F.G.; validation, A.G. and F.G.; formal analysis, W.S. and F.G.; research, W.S. and H.K.; references, W.S., A.Y., H.Y.O. and H.K.; data collection, W.S. and F.G.; writing of the first draft, A.G., W.S., F.G.,H.K., A.Y. and H.Y.O.; review and editing of the manuscript, A.G., W.S., F.G.,H.K., A.Y. and H.Y.O.; visualization, A.G., W.S., F.G., A.Y., H.Y.O. and H.K.; supervision, A.G.; project management, A.G.; funding, A.G., W.S., F.G.,H.K., A.Y. and H.Y.O. All authors have read and agreed to the published version of the manuscript.
Funding
This research received no external funding.
Institutional Review Board Statement
Not applicable.
Informed Consent Statement
Not applicable.
Data Availability Statement
The data presented in this study are available on request from the corresponding author.
Acknowledgments
The authors used artificial intelligence (AI) tools solely for language editing and clarity improvement. No generative AI (GenAI) was used in the development of the scientific content, data analysis, methodological design, interpretation of results, or conclusions. The authors take full responsibility for the integrity, accuracy, originality, and scientific validity of the manuscript.
Conflicts of Interest
The authors declare no conflicts of interest.
Appendix A
Appendix A.1
The appendices provide additional data and projections that support the findings of this study. They include the following:
The variables presented in Table A1 represent the multidimensional structure of sustainable agri-food systems. The selected input variables characterize agricultural production capacity, economic development, demographic structure, resource utilization, and labor participation, whereas the output variables represent the principal sustainability objectives optimized by the proposed hybrid artificial intelligence framework. Collectively, these indicators constitute the analytical foundation of the MFIS–MOGA model.
Table A2 summarizes the mathematical symbols and notation adopted throughout the proposed methodology. The standardized notation improves readability, eliminates ambiguity, and ensures consistency across the fuzzy inference system, the multi-objective optimization algorithm, and the MATLAB R2024a implementation.
Table A3 summarizes the principal variables incorporated into the proposed computational framework. The input variables describe agricultural production, resource utilization, and socioeconomic development, whereas the output variables correspond to the sustainability objectives optimized through fuzzy inference and evolutionary search.
Appendix A.2
Unit Harmonization—since the variables were obtained from FAOSTAT, the World Bank, and the United Nations databases, their original measurement units differed considerably. Before model implementation, all variables were harmonized into consistent units to ensure compatibility during preprocessing, fuzzy inference, and evolutionary optimization.
Appendix A.3
Data Standardization—prior to fuzzy inference and multi-objective optimization, all variables were subjected to a standardized preprocessing procedure. Missing observations accounting for less than 5% of the complete dataset were estimated using linear interpolation, whereas potential outliers were identified using the interquartile range (IQR) method. Subsequently, all variables were normalized using the Min–Max transformation:
where X denotes the original value of the variable, while Xmin and Xmax represent the minimum and maximum observed values, respectively. This transformation scales all variables into the interval [0, 1], preventing indicators with larger numerical magnitudes from dominating the fuzzy inference and optimization processes. The standardized preprocessing workflow presented in Table A5 enhances the robustness, transparency, and reproducibility of the proposed MFIS–MOGA framework by ensuring that all heterogeneous variables are consistently prepared before sustainability assessment and evolutionary optimization.
Appendix A.4
The harmonized panel dataset includes countries from all major geographical regions. Representative countries are presented for illustrative purposes, while the complete analytical dataset was generated through harmonization of internationally recognized open-access databases.
Appendix A.5
Appendix A.5 to further improve methodological transparency and facilitate computational reproducibility.
Geographic coverage of the harmonized global panel dataset across Europe, Asia, Africa, North America, South America, and Oceania (Figure A1). The representative countries shown in the figure illustrate the spatial diversity of the dataset and its coverage of developed, emerging, rapidly developing, export-oriented, and sustainable agricultural systems. This geographical representation supports the comparative assessment of sustainable agri-food systems across heterogeneous national contexts.
Table A1.
Definitions of Input and Output Variables.
Table A2.
Mathematical Symbols and Notation.
Table A3.
Principal Variables Used in the Optimization Model.
Table A4.
Unit Harmonization of Variables.
Table A5.
Data Standardization Workflow.
Table A6.
Geographic Coverage of the Harmonized Global Panel Dataset.
Table A7.
Data Quality Control and Preprocessing Workflow.
Figure A1.
Geographic coverage of the harmonized global panel dataset and representative countries included across the six major geographical regions.
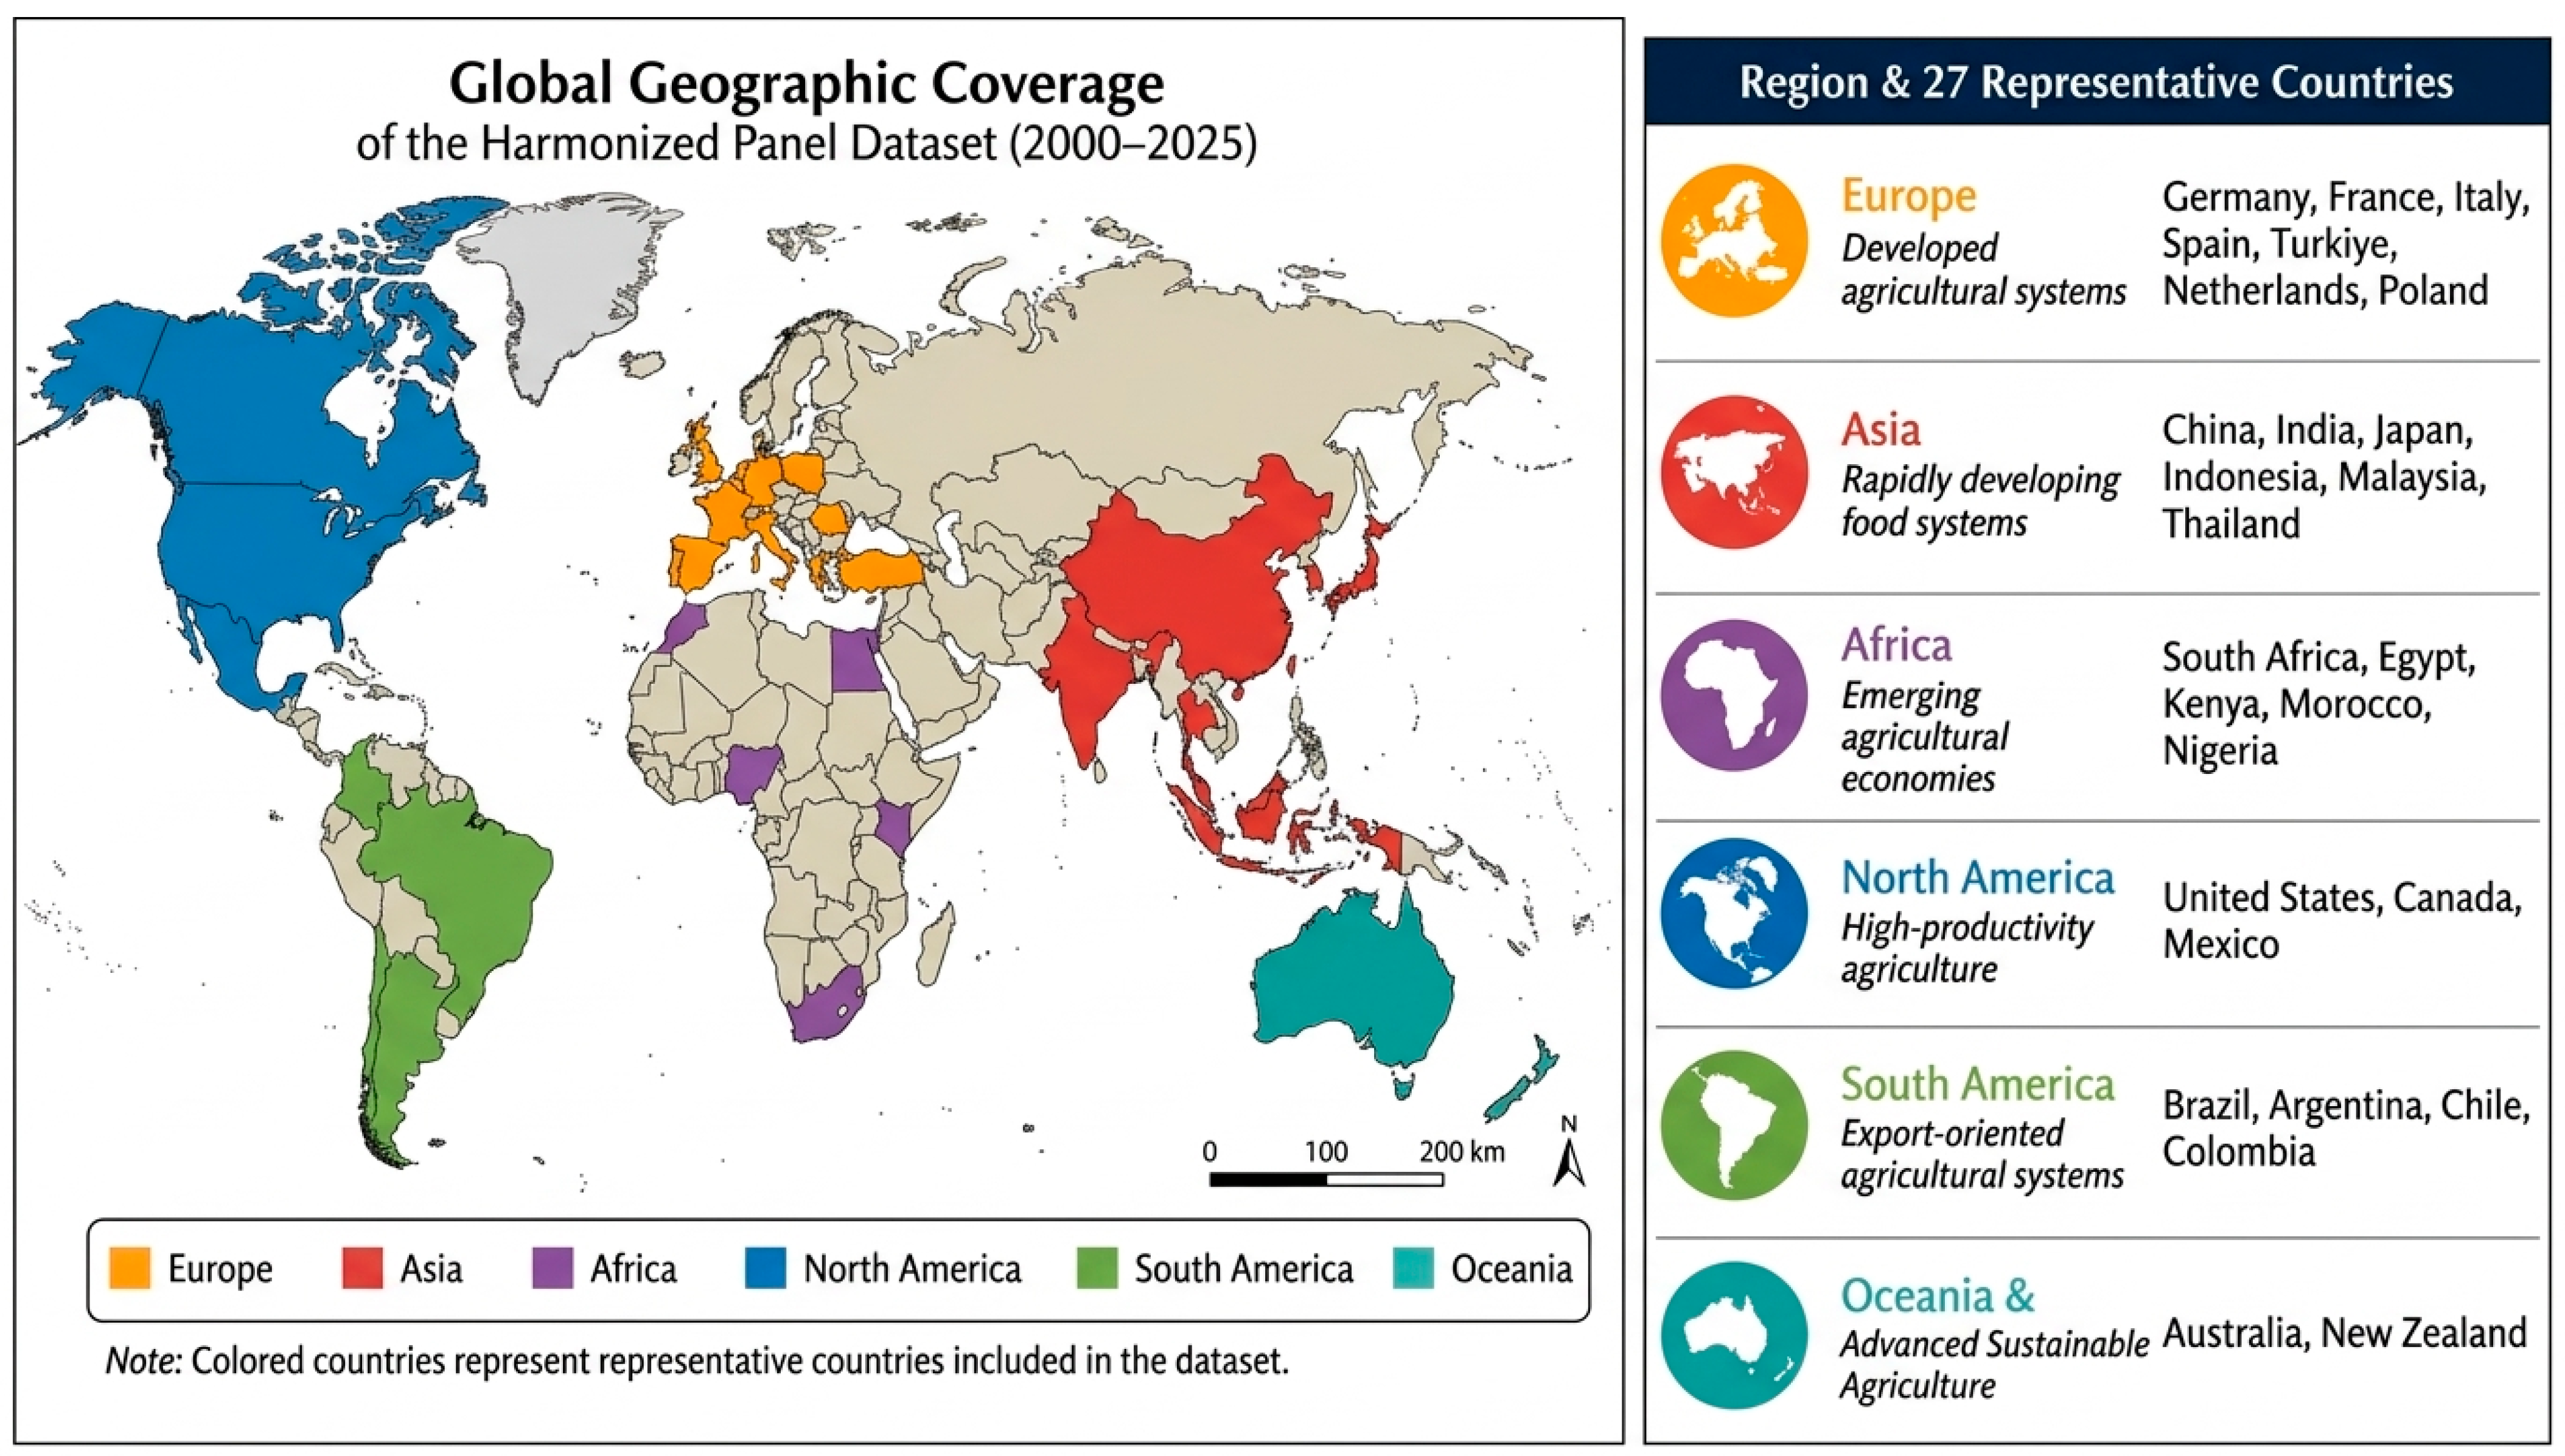
References
- Kanter, D.R.; Musumba, M.; Wood, S.L.R.; Palm, C.; Antle, J.; Balvanera, P.; Dale, V.H.; Havlik, P.; Kline, K.L.; Scholes, R.J.; et al. Evaluating agricultural trade-offs in the age of sustainable development. Agric. Syst. 2016, 163, 73–88. [Google Scholar] [CrossRef] [Scilit]
- Pawlak, K.; Kołodziejczak, M. The role of agriculture in ensuring food security in developing countries: Considerations in the context of the problem of sustainable food production. Sustainability 2020, 12, 5488. [Google Scholar] [CrossRef] [Scilit]
- Bahn, R.A.; Yehya, A.A.K.; Zurayk, R. Digitalization for sustainable agri-food systems: Potential, status, and risks for the MENA region. Sustainability 2021, 13, 3223. [Google Scholar] [CrossRef] [Scilit]
- Morepje, M.T.; Sithole, M.Z.; Msweli, N.S.; Agholor, A.I. The influence of e-commerce platforms on sustainable agriculture practices among smallholder farmers in Sub-Saharan Africa. Sustainability 2024, 16, 6496. [Google Scholar] [CrossRef] [Scilit]
- Díaz-Curbelo, A.; Andrade, R.A.E.; Municio, Á.M.G. The role of fuzzy logic to dealing with epistemic uncertainty in supply chain risk assessment: Review standpoints. Int. J. Fuzzy Syst. 2020, 22, 2769–2791. [Google Scholar] [CrossRef] [Scilit]
- Maqekeni, S.; Obileke, K.; Ndiweni, O.; Mukumba, P. Application of fuzzy logic techniques in solar energy systems: A review. Appl. Syst. Innov. 2025, 8, 144. [Google Scholar] [CrossRef] [Scilit]
- Sukono; Ibrahim, R.A.; Effendie, A.R.; Saputra, M.P.A.; Prihanto, I.G.; Azahra, A.S. Multi-objective optimization with a closed-form solution for capital allocation in environmental energy stock portfolio. Mathematics 2025, 13, 2844. [Google Scholar] [CrossRef] [Scilit]
- Korneeva, E.; Alamanova, C.; Orozonova, A.; Parmanasova, A.; Krayneva, R. Sustainable development of the agricultural sector of the economy. E3S Web Conf. 2023, 431, 01030. [Google Scholar] [CrossRef] [Scilit]
- Erdoğdu, A.; Dayi, F.; Yildiz, F.; Ganji, F.; İçöz, A. Temporal multi-objective optimization for sustainable agricultural finance: Evidence from evolutionary algorithms. Sustainability 2026, 18, 3839. [Google Scholar] [CrossRef] [Scilit]
- Krishnamurthy, S.; Adewuyi, O.B.; Salimon, S.A. Recent advances in artificial intelligence-based optimization for power system applications: A review of techniques, challenges, and future directions. Renew. Sustain. Energy Rev. 2026, 226, 116340. [Google Scholar] [CrossRef] [Scilit]
- Erdogdu, A.; Dayi, F.; Yildiz, F.; Esmer, Y.; Ganji, F. A hybrid deep learning–fuzzy–genetic framework for climate-resilient agricultural investment and resource allocation under carbon market uncertainty. Agriculture 2026, 16, 1163. [Google Scholar] [CrossRef] [Scilit]
- Khan, A.N.; Khan, S.; Ali, A.; Mansoor; Junaid, M.A.; Jameel, A.; Rustam, R.; Aslam, R.; Shah, J. Artificial intelligence in computer science: Evolution, techniques, challenges, and multidisciplinary applications. Sch. J. Eng. Technol. 2025, 13, 246–263. [Google Scholar] [CrossRef] [Scilit]
- Górriz, J.M.; Álvarez-Illán, I.; Álvarez-Marquina, A.; Arco, J.E.; Atzmueller, M.; Ballarini, F.; Barakova, E.; Bologna, G.; Bonomini, P.; Castellanos-Dominguez, G.; et al. Computational approaches to explainable artificial intelligence: Advances in theory, applications and trends. Inf. Fusion 2023, 100, 101945. [Google Scholar] [CrossRef] [Scilit]
- Mienye, I.D.; Swart, T.G. A comprehensive review of deep learning: Architectures, recent advances, and applications. Information 2024, 15, 755. [Google Scholar] [CrossRef] [Scilit]
- Hanne, T.; Moghaddam, M.J. A review of the evolution of multi-objective evolutionary algorithms. Comput. Mater. Contin. 2025, 85, 4203–4236. [Google Scholar] [CrossRef] [Scilit]
- Saman, S. Optimization Techniques and Evolutionary Algorithms; Zenodo: Genève, Switzerland, 2021. [Google Scholar] [CrossRef]
- Bolufé-Röhler, A.; Tamayo-Vera, D. Machine learning for enhancing metaheuristics in global optimization: A comprehensive review. Mathematics 2025, 13, 2909. [Google Scholar] [CrossRef] [Scilit]
- Ridwan, I.B.; Addo, S. Multi-objective optimization in business analytics: Balancing profitability, risk exposure, and sustainability in strategic decision-making. Int. J. Res. Publ. Rev. 2025, 6, 89–111. [Google Scholar] [CrossRef] [Scilit]
- Olfati, M.; Krömer, P.; Rashidi, S.F.; Mirjalili, S.; Snášel, V. A goal programming-based algorithm for solving multi-objective optimization problems. Ann. Oper. Res. 2025, 1–26. [Google Scholar] [CrossRef] [Scilit]
- Gazi, F.; Atan, T.; Kılıç, M. The assessment of internal indicators on the balanced scorecard measures of sustainability. Sustainability 2022, 14, 8595. [Google Scholar] [CrossRef] [Scilit]
- Watanabe, S.; Sakakibara, K. Multi-objective approaches in a single-objective optimization environment. In Proceedings of the 2005 IEEE Congress on Evolutionary Computation; IEEE: New York, NY, USA, 2005; Volume 2. [Google Scholar] [CrossRef] [Scilit]
- Patil, D.; Rane, N.; Desai, P.; Rane, J. Machine learning and deep learning: Methods, techniques, applications, challenges, and future research opportunities. In Trustworthy Artificial Intelligence in Industry and Society; Deep Science Publishing: Erzurum, Turkey, 2024; pp. 28–81. [Google Scholar] [CrossRef] [Scilit] [PubMed]
- Dudek, G. Advances in machine learning: Emerging methods and real-world applications. Appl. Sci. 2026, 16, 443. [Google Scholar] [CrossRef] [Scilit]
- Asha, L.N.; Dey, A.; Yodo, N.; Aragon, L.G. Optimization approaches for multiple conflicting objectives in sustainable green supply chain management. Sustainability 2022, 14, 12790. [Google Scholar] [CrossRef] [Scilit]
- Nagy, M.; Mansour, Y.; Abdelmohsen, S. Multi-objective optimization methods as a decision making strategy. Int. J. Eng. Res. Technol. 2020, 9, 516–522. [Google Scholar] [CrossRef] [Scilit]
- Sanchez, M.; Oliver Alfonso, M.D.; Sanchís-Pedregosa, C. Fuzzy logic and its uses in finance: A4 systematic review exploring its potential to deal with banking crises. Mathematics 2019, 7, 1091. [Google Scholar] [CrossRef] [Scilit]
- Barcellos-Paula, L.; Castro-Rezende, A.; Alvares, D.F. Fuzzy algorithm applied to factors influencing competitiveness: A case study of Brazil and Peru through affinities theory. Axioms 2023, 12, 1038. [Google Scholar] [CrossRef] [Scilit]
- Erdoğdu, A.; Dayi, F.; Özbek, A.; Ganji, F.; Benek, A. The role of green finance in investing in environmentally friendly technologies: Risks and returns. Sustainability 2025, 17, 9652. [Google Scholar] [CrossRef] [Scilit]
- Baez Hernández, A.; Bravo Hidalgo, D. Fuzzy logic in business, management and accounting. Open J. Bus. Manag. 2020, 8, 2524–2544. [Google Scholar] [CrossRef]
- Saatchi, R. Fuzzy logic concepts, developments and implementation. Information 2024, 15, 656. [Google Scholar] [CrossRef] [Scilit]
- Botero-Valencia, J.S.; García Pineda, V.; Valencia-Arias, A.; Valencia, J. Machine learning in sustainable agriculture: Systematic review and research perspectives. Agriculture 2025, 15, 377. [Google Scholar] [CrossRef] [Scilit]
- Li, F.; Xu, C.; Jin, R. Enhancing agricultural sustainability through efficient yield monitoring: A lightweight spatio-temporal fusion model with dual symmetric branches. Sustainability 2026, 18, 2418. [Google Scholar] [CrossRef] [Scilit]
- Farooq, M.A.; Gao, S.; Hassan, M.A.; Huang, Z.; Rasheed, A.; Hearne, S.; Prasanna, B.; Li, X.; Li, H. Artificial intelligence in plant breeding. Trends Genet. 2024, 40, 891–908. [Google Scholar] [CrossRef] [Scilit] [PubMed]
- Chowdhury, P.; Maiti, B.; Mudi, L.K.; Chatterjee, S. Artificial intelligence for sustainable agriculture: A review of machine learning and deep learning techniques for crop growth and yield prediction. Int. J. Appl. Resil. Sustain. 2026, 2, 176–207. [Google Scholar] [CrossRef] [Scilit]
- Kusumavathi, K.; Konatala, R.; Lal, P.; Sarkar, S. Artificial intelligence for fostering sustainable agriculture. Curr. Plant Biol. 2025, 42, 100476. [Google Scholar] [CrossRef] [Scilit]
- Cravero, A.; Sepúlveda, S.; Gutiérrez, F.; Muñoz, L. From precision agriculture to intelligent agricultural ecosystems: A systematic review of machine learning and big data applications. Agronomy 2026, 16, 516. [Google Scholar] [CrossRef] [Scilit]
- dos Reis, J.C.; Rodrigues, G.S.; Barros, I.; Rodrigues, R.d.A.R. Fuzzy logic indicators for the assessment of farming sustainability strategies in a tropical agricultural frontier. Agron. Sustain. Dev. 2023, 43, 8. [Google Scholar] [CrossRef] [Scilit]
- Tuncel, G.; Gunturk, B. A fuzzy multi-criteria decision-making approach for agricultural land selection. Sustainability 2024, 16, 10509. [Google Scholar] [CrossRef] [Scilit]
- Calone, R.; Fiore, A.; Pellis, G.; Cayuela, M.L.; Mongiano, G.; Lagomarsino, A.; Bregaglio, S. A fuzzy logic evaluation of synergies and trade-offs between agricultural production and climate change mitigation. J. Clean. Prod. 2024, 434, 140878. [Google Scholar] [CrossRef] [Scilit]
- Bin, L.; Shahzad, M.; Khan, H.; Bashir, M.M.; Ullah, A.; Siddique, M. Sustainable smart agriculture farming for cotton crop: A fuzzy logic rule based methodology. Sustainability 2023, 15, 13874. [Google Scholar] [CrossRef] [Scilit]
- Sami, M.; Shiekhdavoodi, M.; Almassi, M.; Marzban, A. Assessing the sustainability of agricultural production systems using fuzzy logic. J. Cent. Eur. Agric. 2013, 14, 318–330. [Google Scholar] [CrossRef] [Scilit]
- Konak, A.; Coit, D.W.; Smith, A.E. Multi-objective optimization using genetic algorithms: A tutorial. Reliab. Eng. Syst. Saf. 2006, 91, 992–1007. [Google Scholar] [CrossRef] [Scilit]
- Guariso, G.; Sangiorgio, M. Improving the performance of multiobjective genetic algorithms: An elitism-based approach. Information 2020, 11, 587. [Google Scholar] [CrossRef] [Scilit]
- Feng, D.; Liu, J. A novel genetic algorithm for constrained multimodal multi-objective optimization problems. Mathematics 2025, 13, 1851. [Google Scholar] [CrossRef] [Scilit]
- Alexakis, K.; Benekis, V.; Kokkinakos, P.; Askounis, D. Genetic algorithm-based multi-objective optimisation for energy-efficient building retrofitting: A systematic review. Energy Build. 2024, 318, 115216. [Google Scholar] [CrossRef] [Scilit]
- Chowdhury, D.; Hovda, S. A hybrid fuzzy logic/genetic algorithm model based on experimental data for estimation of cuttings concentration during drilling. Eng. Geol. 2023, 326, 106. [Google Scholar] [CrossRef] [Scilit]
- Deswinda, N.; Hadiguna, R.A.; Sirivongpaisal, N. Hybrid model of fuzzy logic and genetic algorithm for product assembly sequence optimization. Andalasian Int. J. Appl. Sci. Eng. Technol. 2024, 4, 20–30. [Google Scholar] [CrossRef] [Scilit]
- Eswari, S.; Nadgaundi, S.K.; Rvs, P.; Trakroo, K. Hybrid genetic algorithm–fuzzy logic framework for optimized seed quality assessment and yield enhancement. In Proceedings of the 2025 5th International Conference on Ubiquitous Computing and Intelligent Information Systems (ICUIS); IEEE: New York, NY, USA, 2025. [Google Scholar] [CrossRef] [Scilit]
- Taghizadeh-Farahmand, F.; Afsari, N.; Chavoshy, A.S. Seismic hazard analysis with a hybrid fuzzy logic and genetic algorithm framework: The Qom oil depot case study. J. Appl. Geophys. 2026, 235, 106342. [Google Scholar] [CrossRef] [Scilit]
- Azadeh, A.; Abdollahian, M.; Hamedi, M.; Asadzadeh, S.M. A novel hybrid fuzzy logic-genetic algorithm-data envelopment approach for simulation optimisation of pressure vessel design problems. Int. J. Math. Oper. Res. 2012, 4, 703–724. [Google Scholar] [CrossRef] [Scilit]
- Alam, M.S.; Tokhi, M.O. Hybrid fuzzy logic control with genetic optimisation for a single-link flexible manipulator. Eng. Appl. Artif. Intell. 2008, 21, 858–873. [Google Scholar] [CrossRef] [Scilit]
- Chitti Babu, Y.; Naga Vamsi Krishna, B. Genetic algorithm-fuzzy logic hybrid framework for privacy preservation and access control in educational social networks. In Proceedings of the 2025 6th International Conference on IoT Based Control Networks and Intelligent Systems (ICICNIS); IEEE: New York, NY, USA, 2025. [Google Scholar] [CrossRef] [Scilit]
- Torres-Salinas, H.; Rodríguez-Reséndiz, J.; Cruz-Miguel, E.E.; Ángeles-Hurtado, L.A. Fuzzy logic and genetic-based algorithm for a servo control system. Micromachines 2022, 13, 586. [Google Scholar] [CrossRef] [Scilit] [PubMed]
- Adam, N.A.; Alzuman, A. Effect of per capita income, GDP growth, FDI, sectoral composition, and domestic credit on employment patterns in GCC countries: GMM and OLS approaches. Economies 2024, 12, 315. [Google Scholar] [CrossRef] [Scilit]
- Bijja, S. GCC countries’ financial scenario: FDI impression on GDP. ECS Trans. 2022, 107, 3983–3994. [Google Scholar] [CrossRef] [Scilit]
- Alawode, A. The role of agricultural value chains in enhancing food security and economic development. Int. Res. J. Mod. Eng. Technol. Sci. 2025, 7, 2582–5208. [Google Scholar] [CrossRef] [Scilit]
- Tabe-Ojong, M.P., Jr.; Nana, I.; Zimmermann, A.; Jafari, Y. Trends and evolution of global value chains in food and agriculture: Implications for food security and nutrition. Food Policy 2024, 127, 102679. [Google Scholar] [CrossRef] [Scilit]
- Mekonnen, D.A.; Akerele, D.; Achterbosch, T.; de Lange, T.; Talsma, E.F. Affordability of healthy and sustainable diets in Nigeria. Front. Sustain. Food Syst. 2021, 5, 726773. [Google Scholar] [CrossRef] [Scilit]
- Grevulo-Minofu, J.; Maonga, B.; Phiri, H.; Matumba, L. Healthy foods cost more and differ by Region in Sub-Saharan Africa: A meta-analysis. Food Humanit. 2025, 5, 100924. [Google Scholar] [CrossRef] [Scilit]
- Peñuelas, J.; Coello, F.; Sardans, J. A better use of fertilizers is needed for global food security and environmental sustainability. Agric. Food Secur. 2023, 12, 5. [Google Scholar] [CrossRef] [Scilit]
- He, G.; Liu, X.; Cui, Z. Achieving global food security by focusing on nitrogen efficiency potentials and local production. Glob. Food Secur. 2021, 29, 100536. [Google Scholar] [CrossRef] [Scilit]
- Chiaraluce, G.; Bentivoglio, D.; Finco, A. The circular economy model in the agri-food sector: A new strategy for the regional development. AIMS Agric. Food 2023, 8, 851–872. [Google Scholar] [CrossRef] [Scilit]
- Oztuna Taner, O. Sustainable food and agriculture production: Reducing food waste through technological advancements and assessing its economic impact. Res. World Agric. Econ. 2024, 5, 144–165. [Google Scholar] [CrossRef] [Scilit]
- Food and Agriculture Organization of the United Nations. FAOSTAT: Food and Agriculture Data. 2026. Available online: https://www.fao.org/faostat/en/ (accessed on 14 October 2026).
- World Bank. World Development Indicators. 2026. Available online: https://databank.worldbank.org/source/world-development-indicators (accessed on 14 October 2026).
- Food and Agriculture Organization of the United Nations. Suite of Food Security Indicators. 2026. Available online: https://www.fao.org/faostat/en/#data/FS (accessed on 14 October 2026).
- Food and Agriculture Organization of the United Nations. Cost and Affordability of a Healthy Diet (CoAHD). 2026. Available online: https://www.fao.org/faostat/en/#data/CAHD (accessed on 14 October 2026).
- United Nations. UNData: A World of Information. 2026. Available online: https://data.un.org/ (accessed on 14 October 2026).
- Burmakova, A.; Kalibatienė, D. Applying fuzzy inference and machine learning methods for prediction with a small dataset: A case study for predicting the consequences of oil spills on a ground environment. Appl. Sci. 2022, 12, 8252. [Google Scholar] [CrossRef] [Scilit]
- Peralta, A.; Olivas, J.A.; Navarro-Illana, P. A fuzzy logic framework for text-based incident prioritization: Mathematical modeling and case study evaluation. Mathematics 2025, 13, 2014. [Google Scholar] [CrossRef] [Scilit]
- Alihodzic, A.; Dukic, N. Fuzzy formulas in data modeling. In Proceedings of the MASSEE International Congress on Mathematics (MICOM 2012); MASSEE: Athens, Greece, 2012. [Google Scholar] [CrossRef] [Scilit]
- Mubarak, S.M.J.; Crampton, A.; Carter, J.; Parkinson, S. Robust data expansion for optimised modelling using adaptive neuro-fuzzy inference systems. Expert Syst. Appl. 2022, 188, 116138. [Google Scholar] [CrossRef] [Scilit]
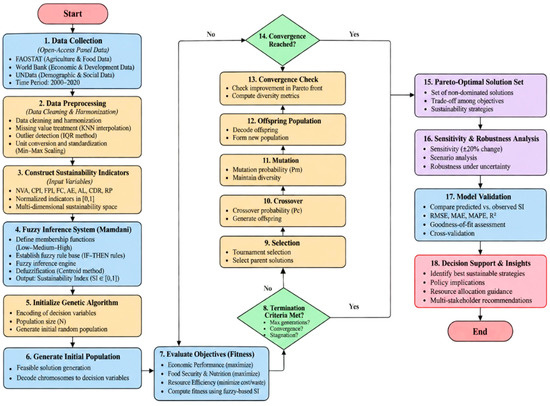
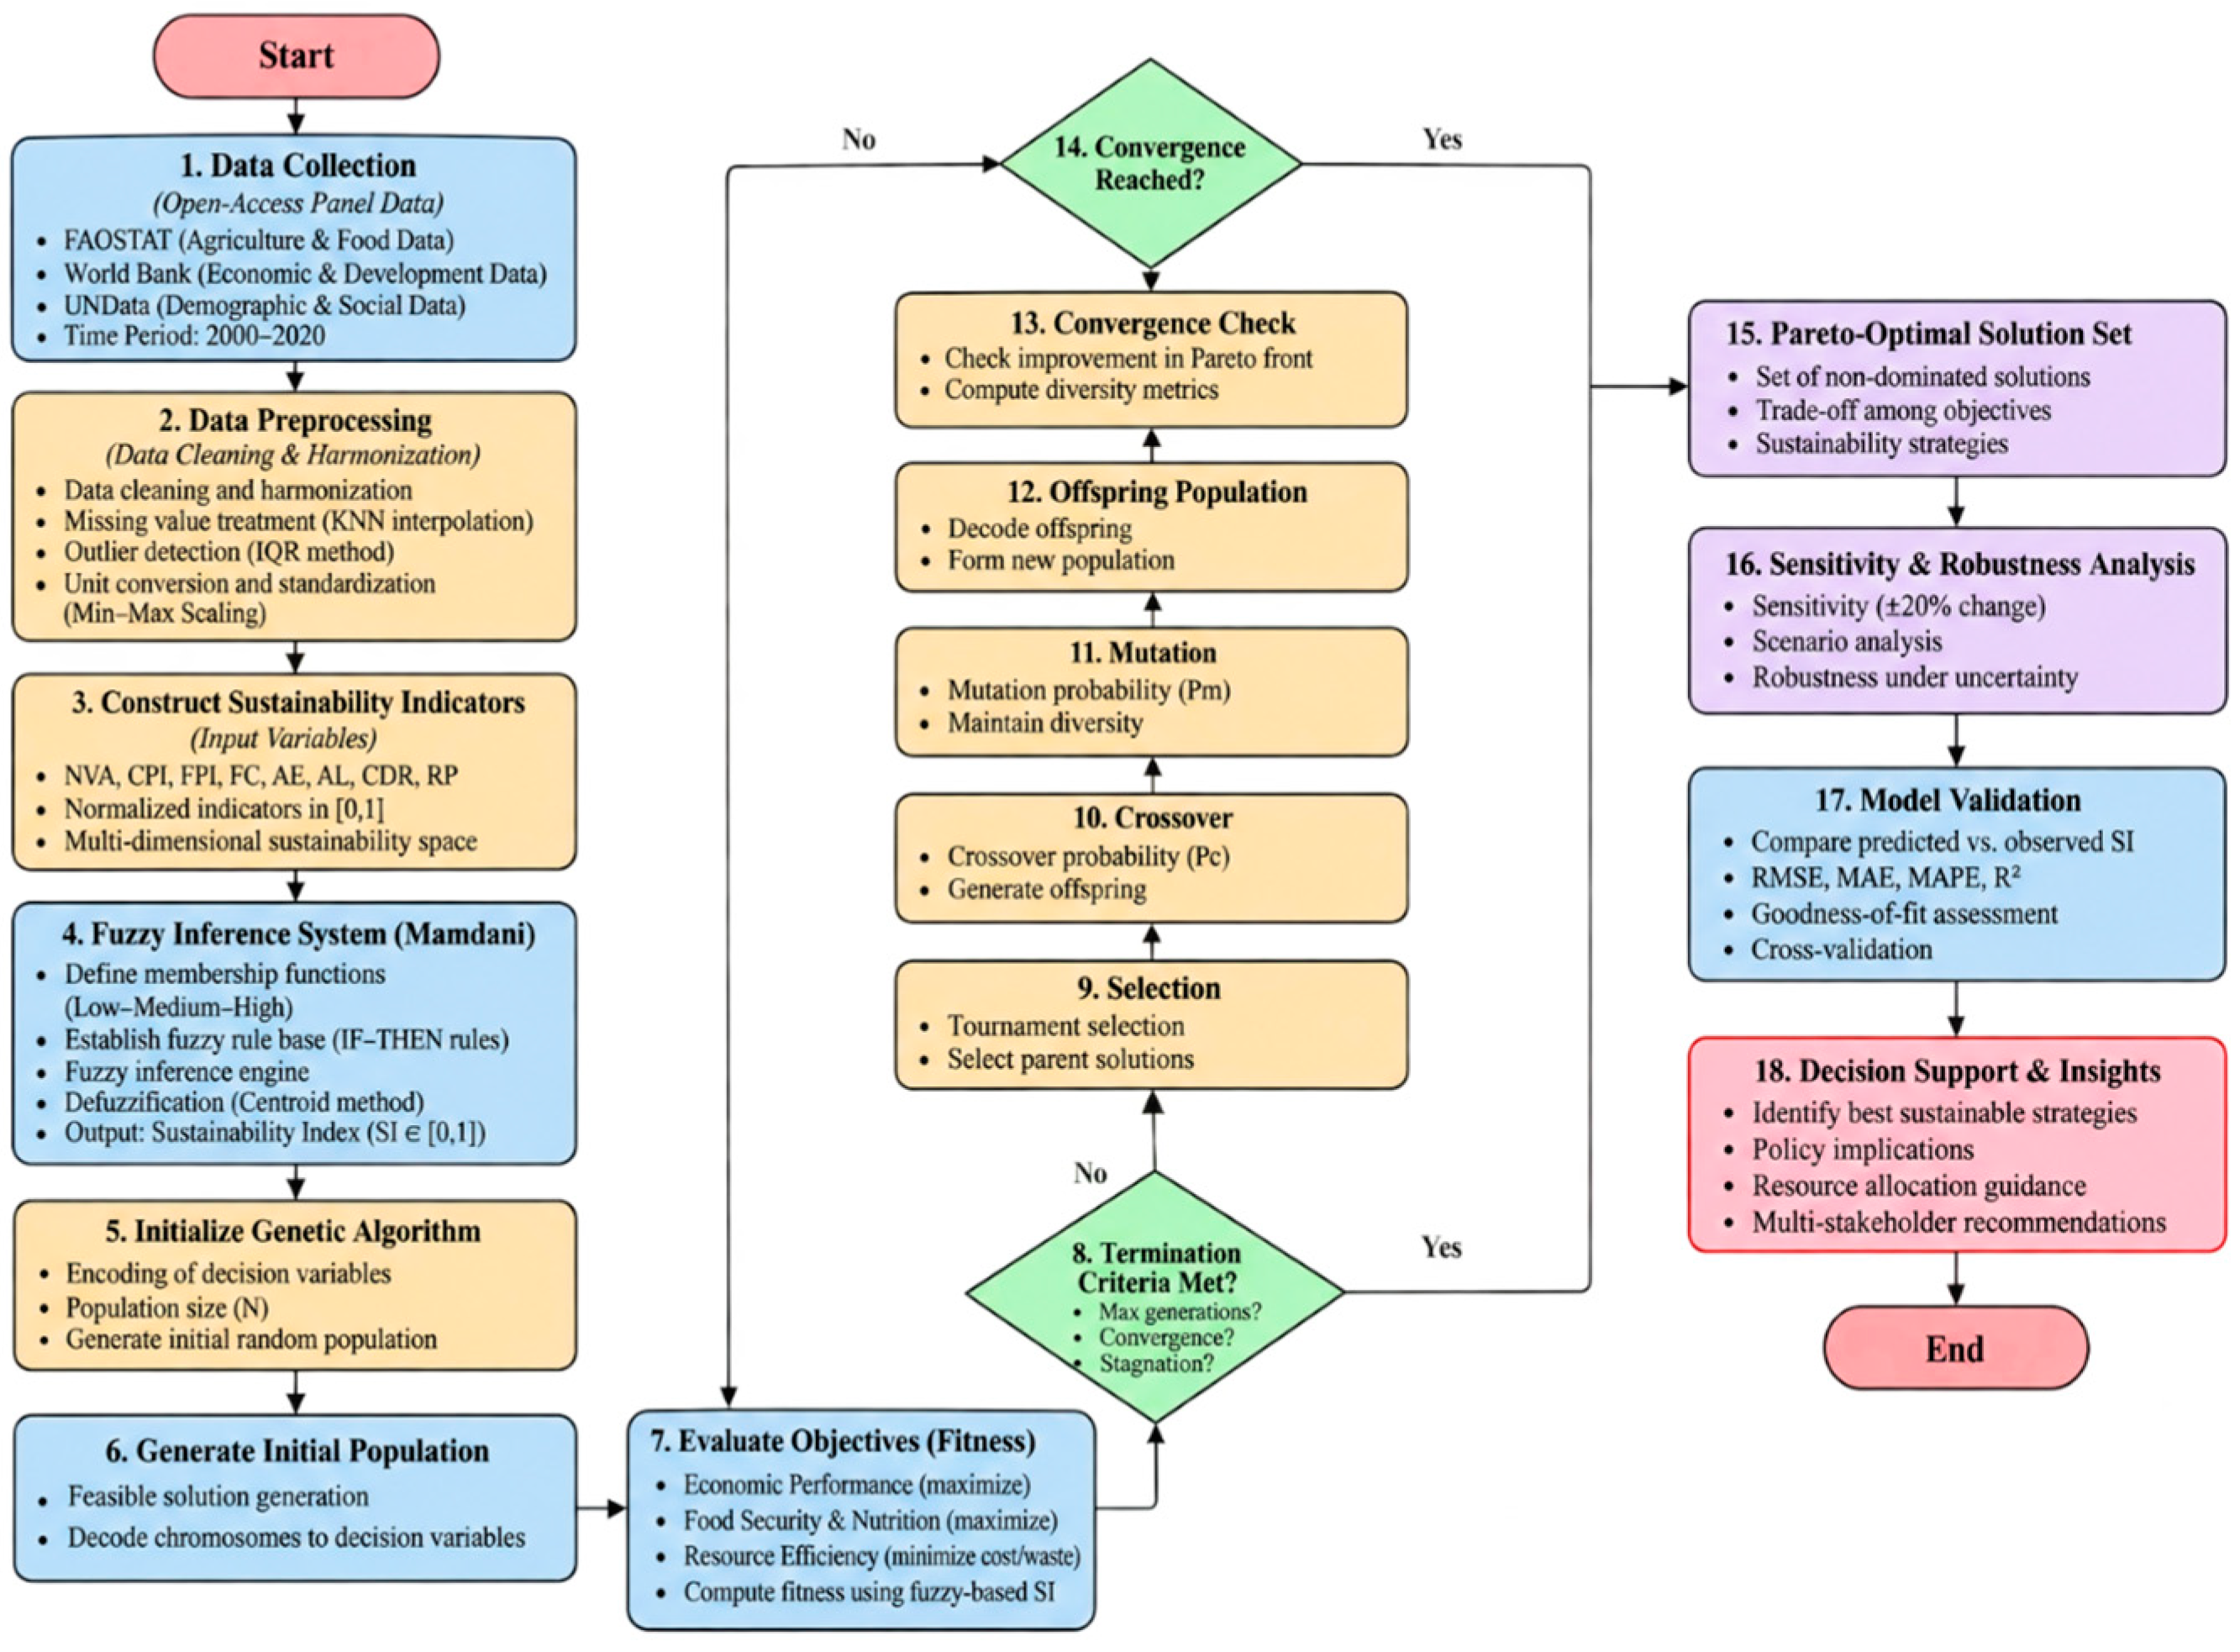
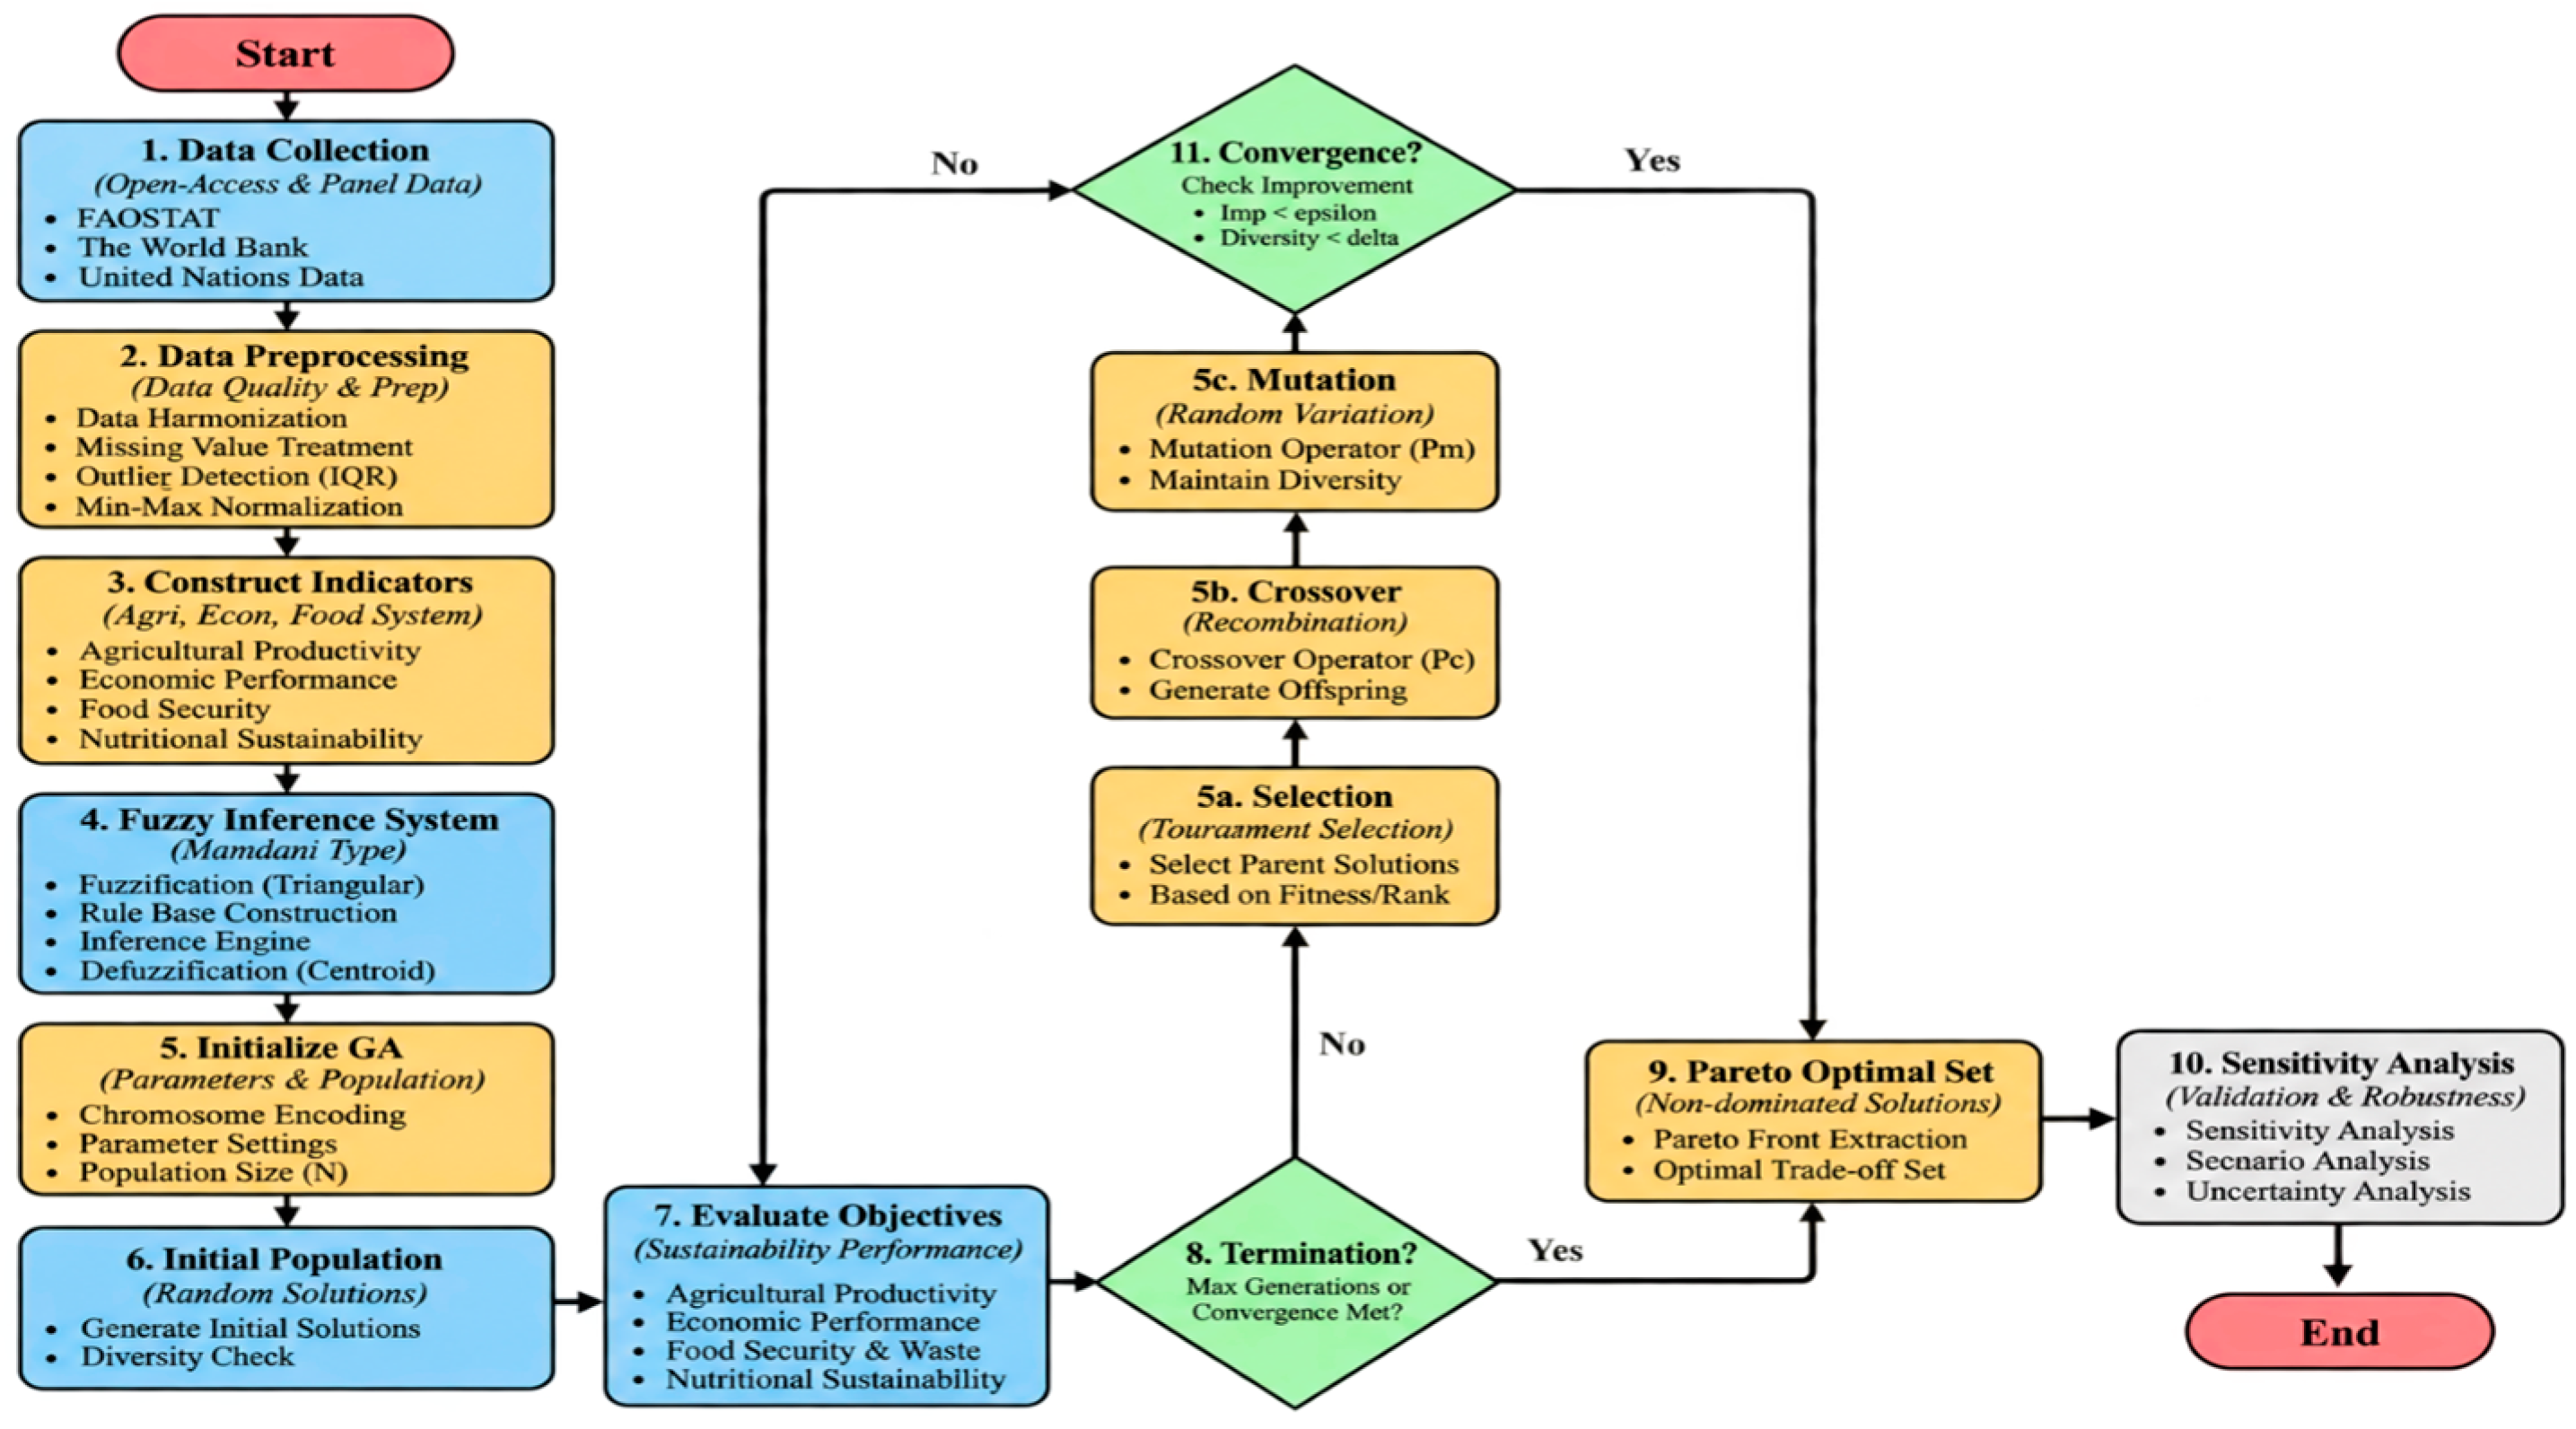
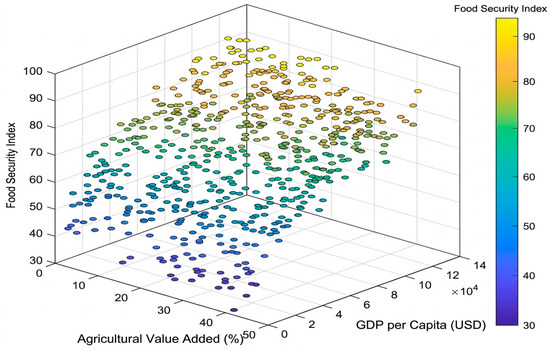
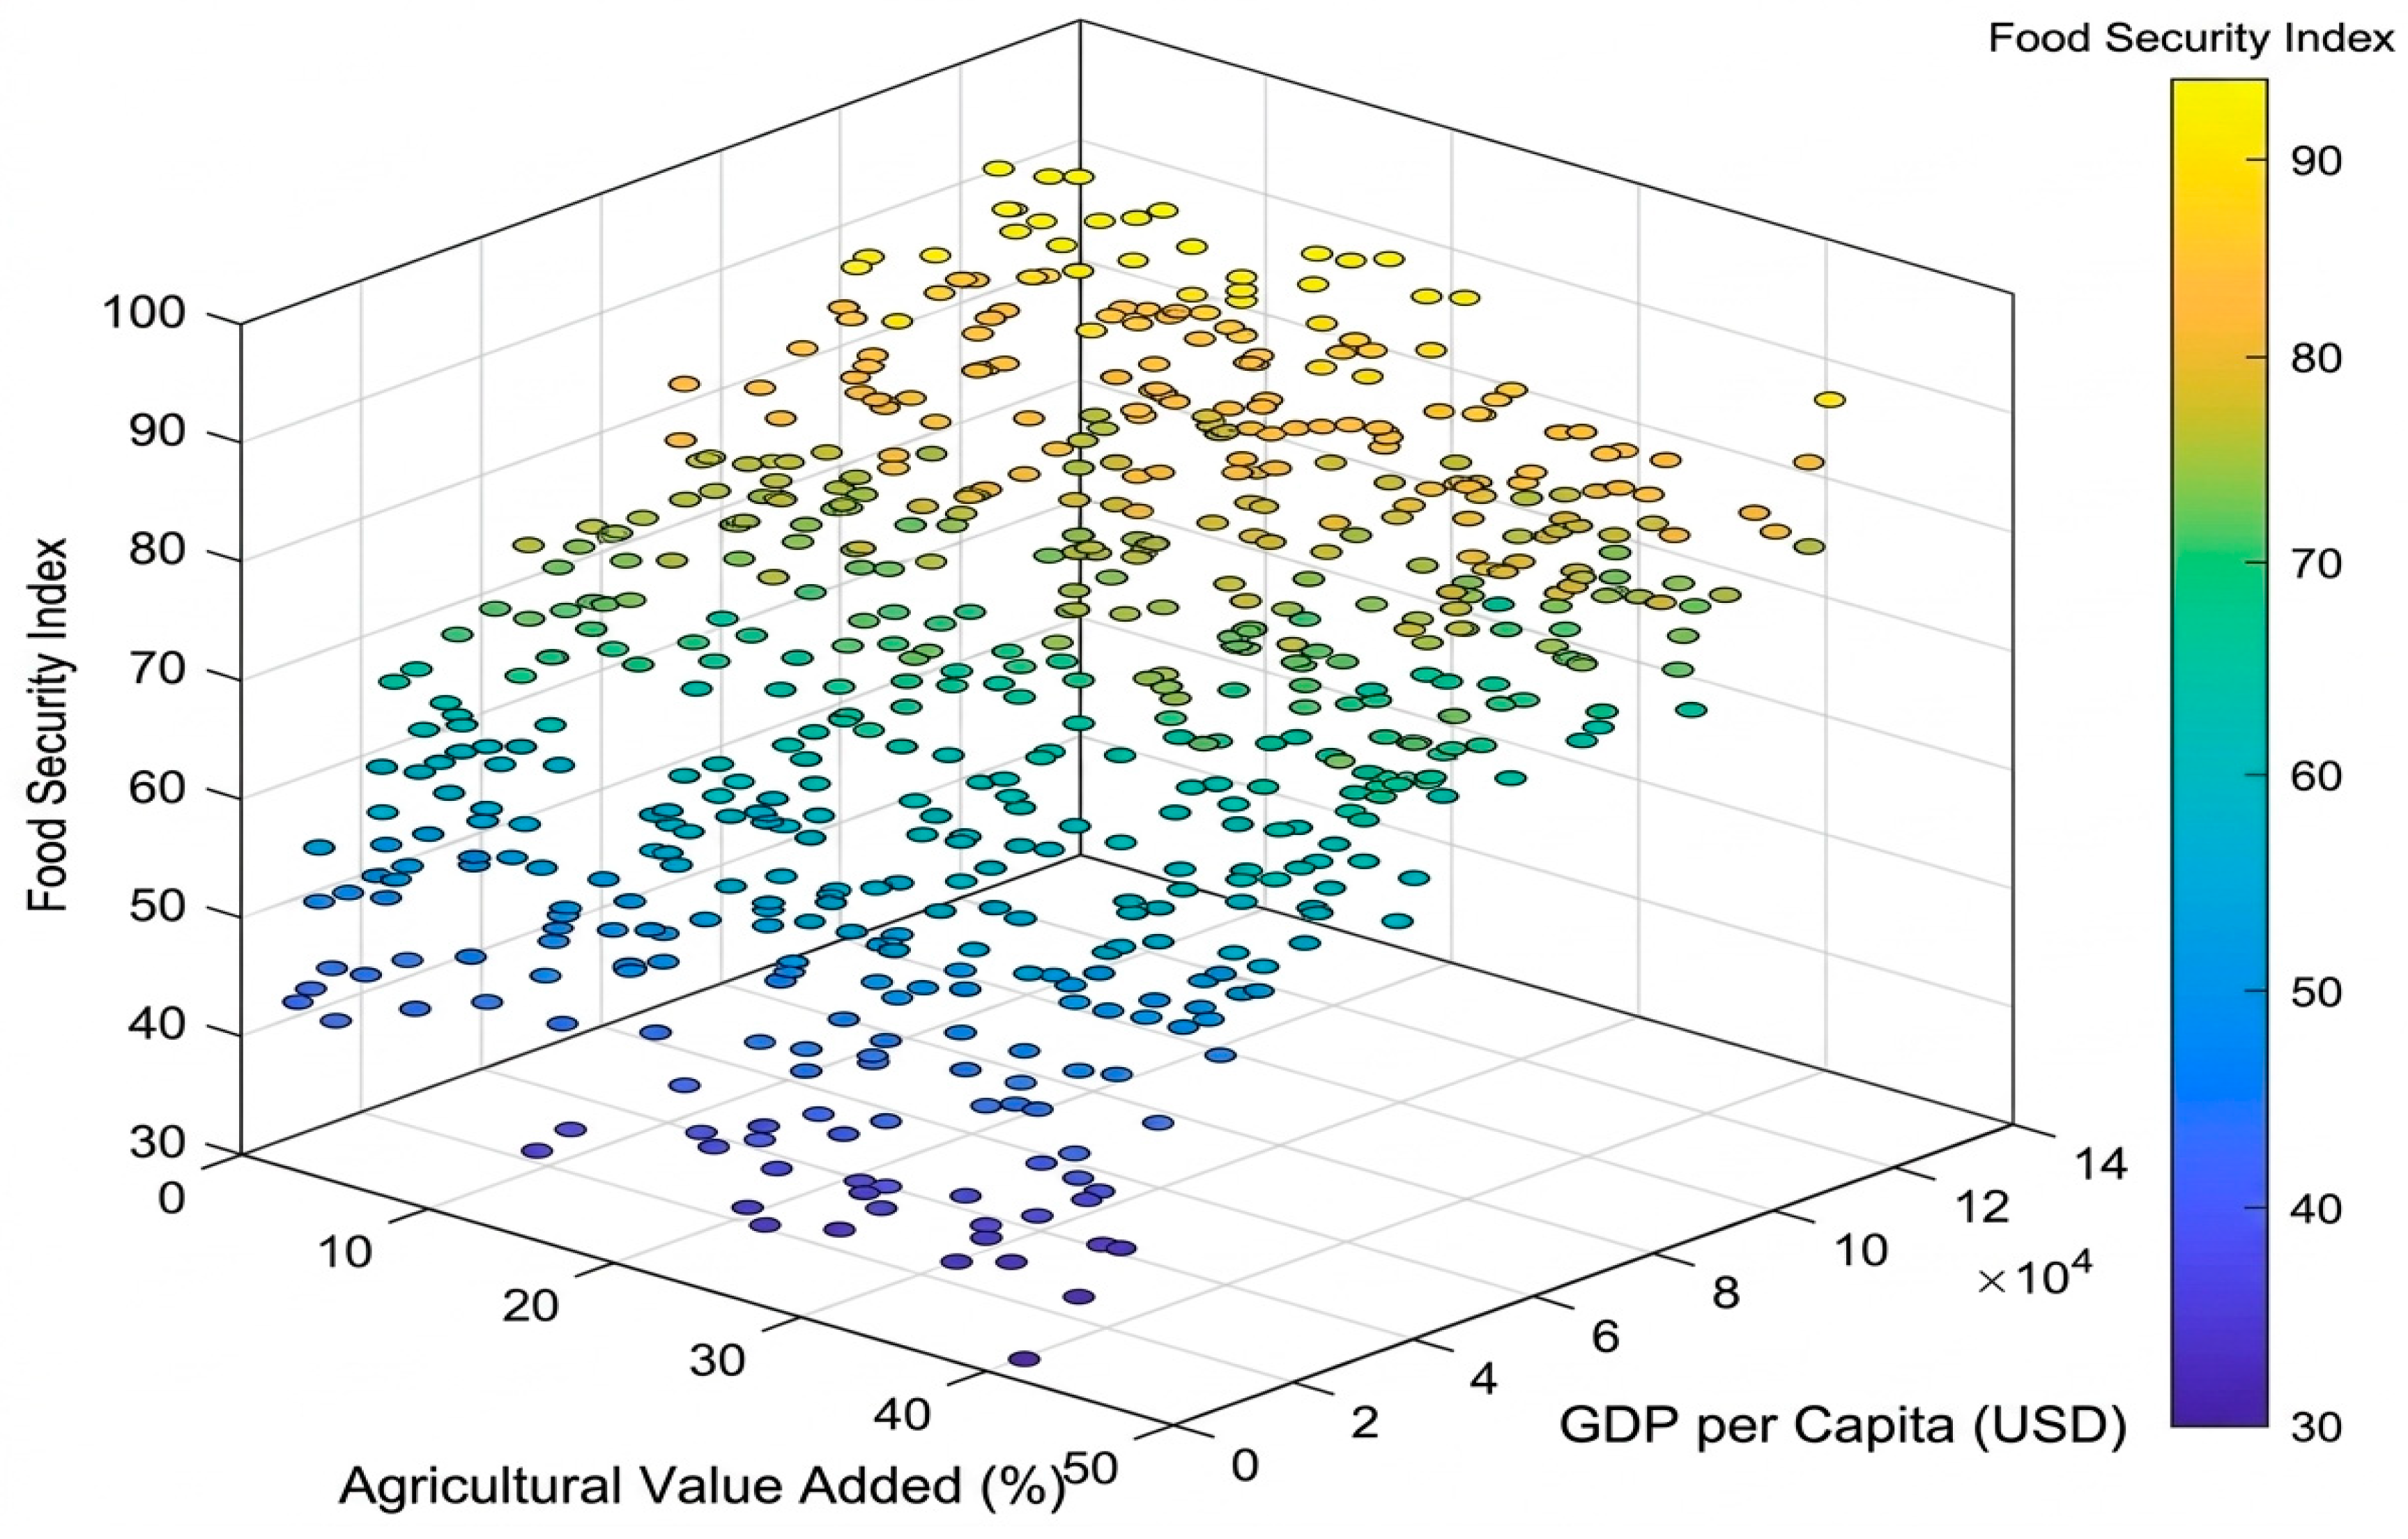
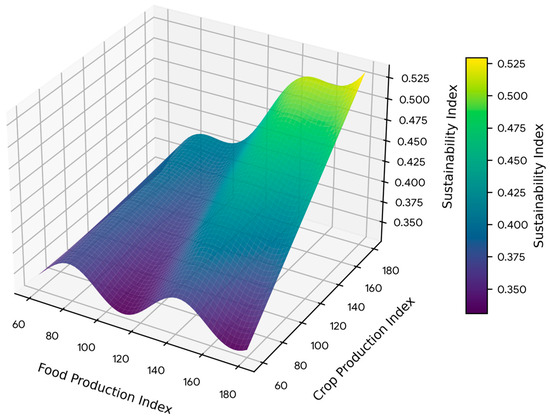
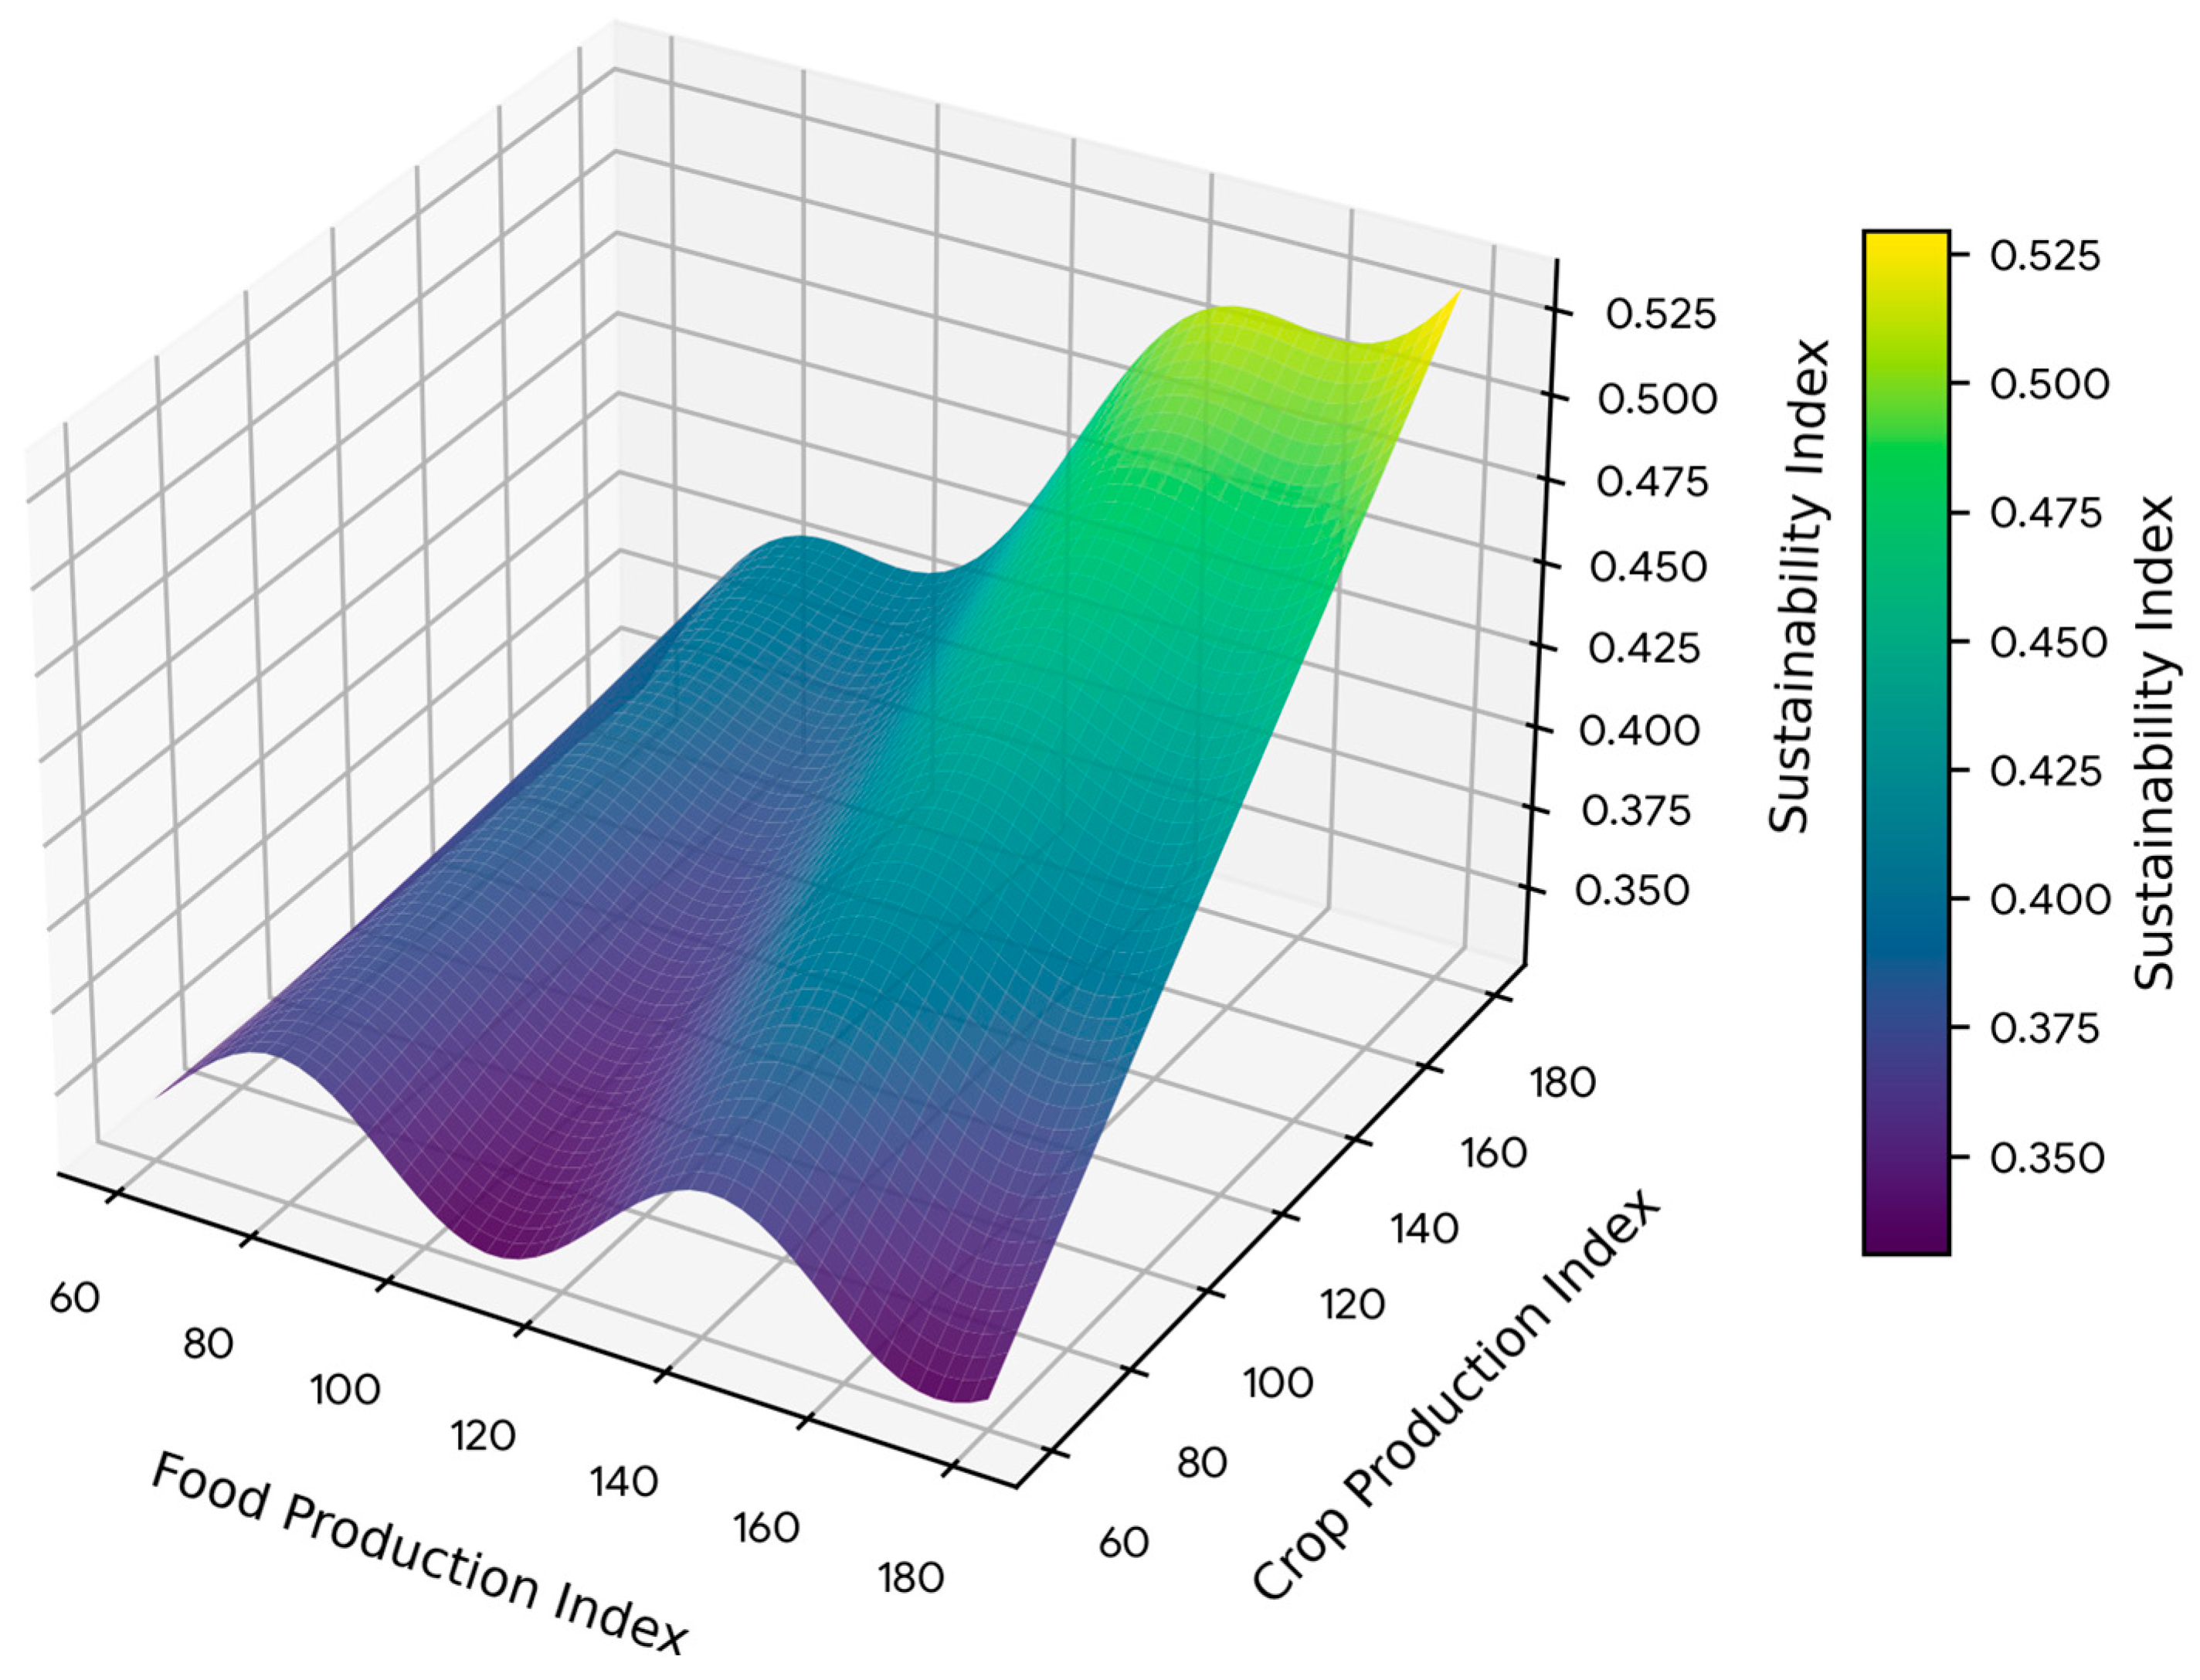
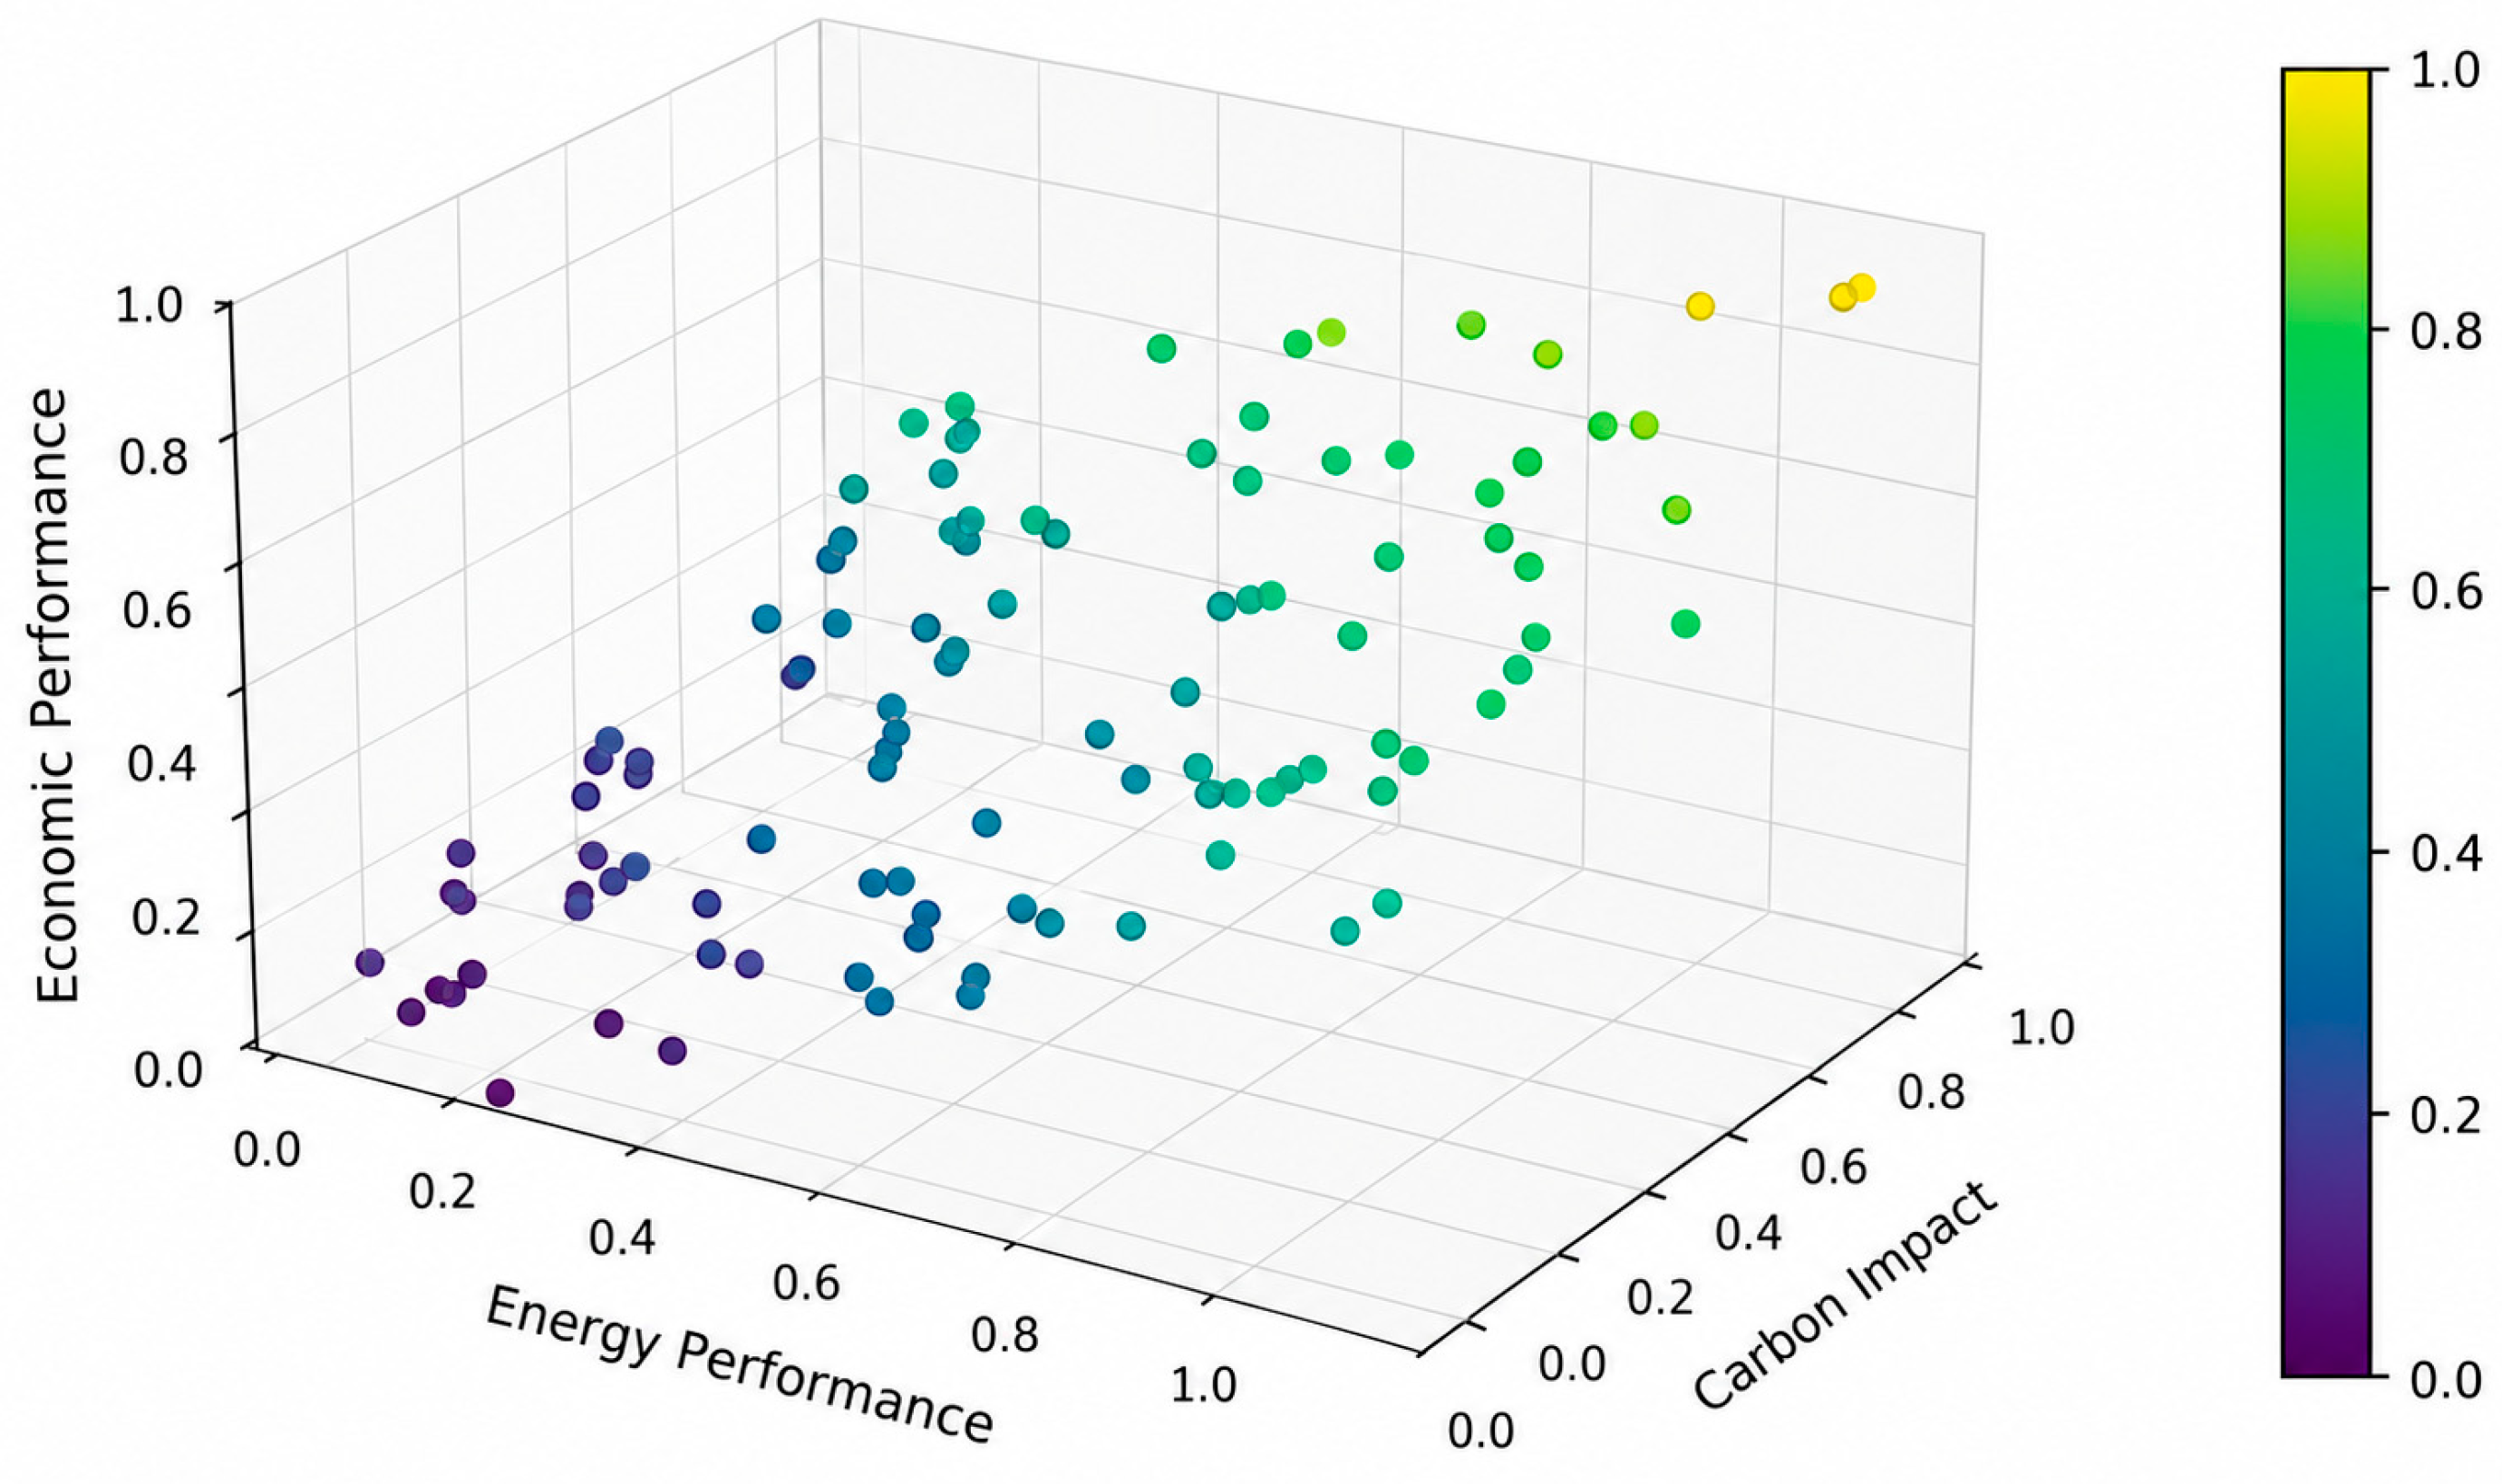
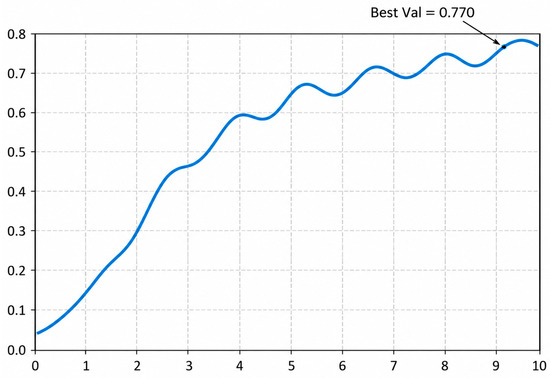
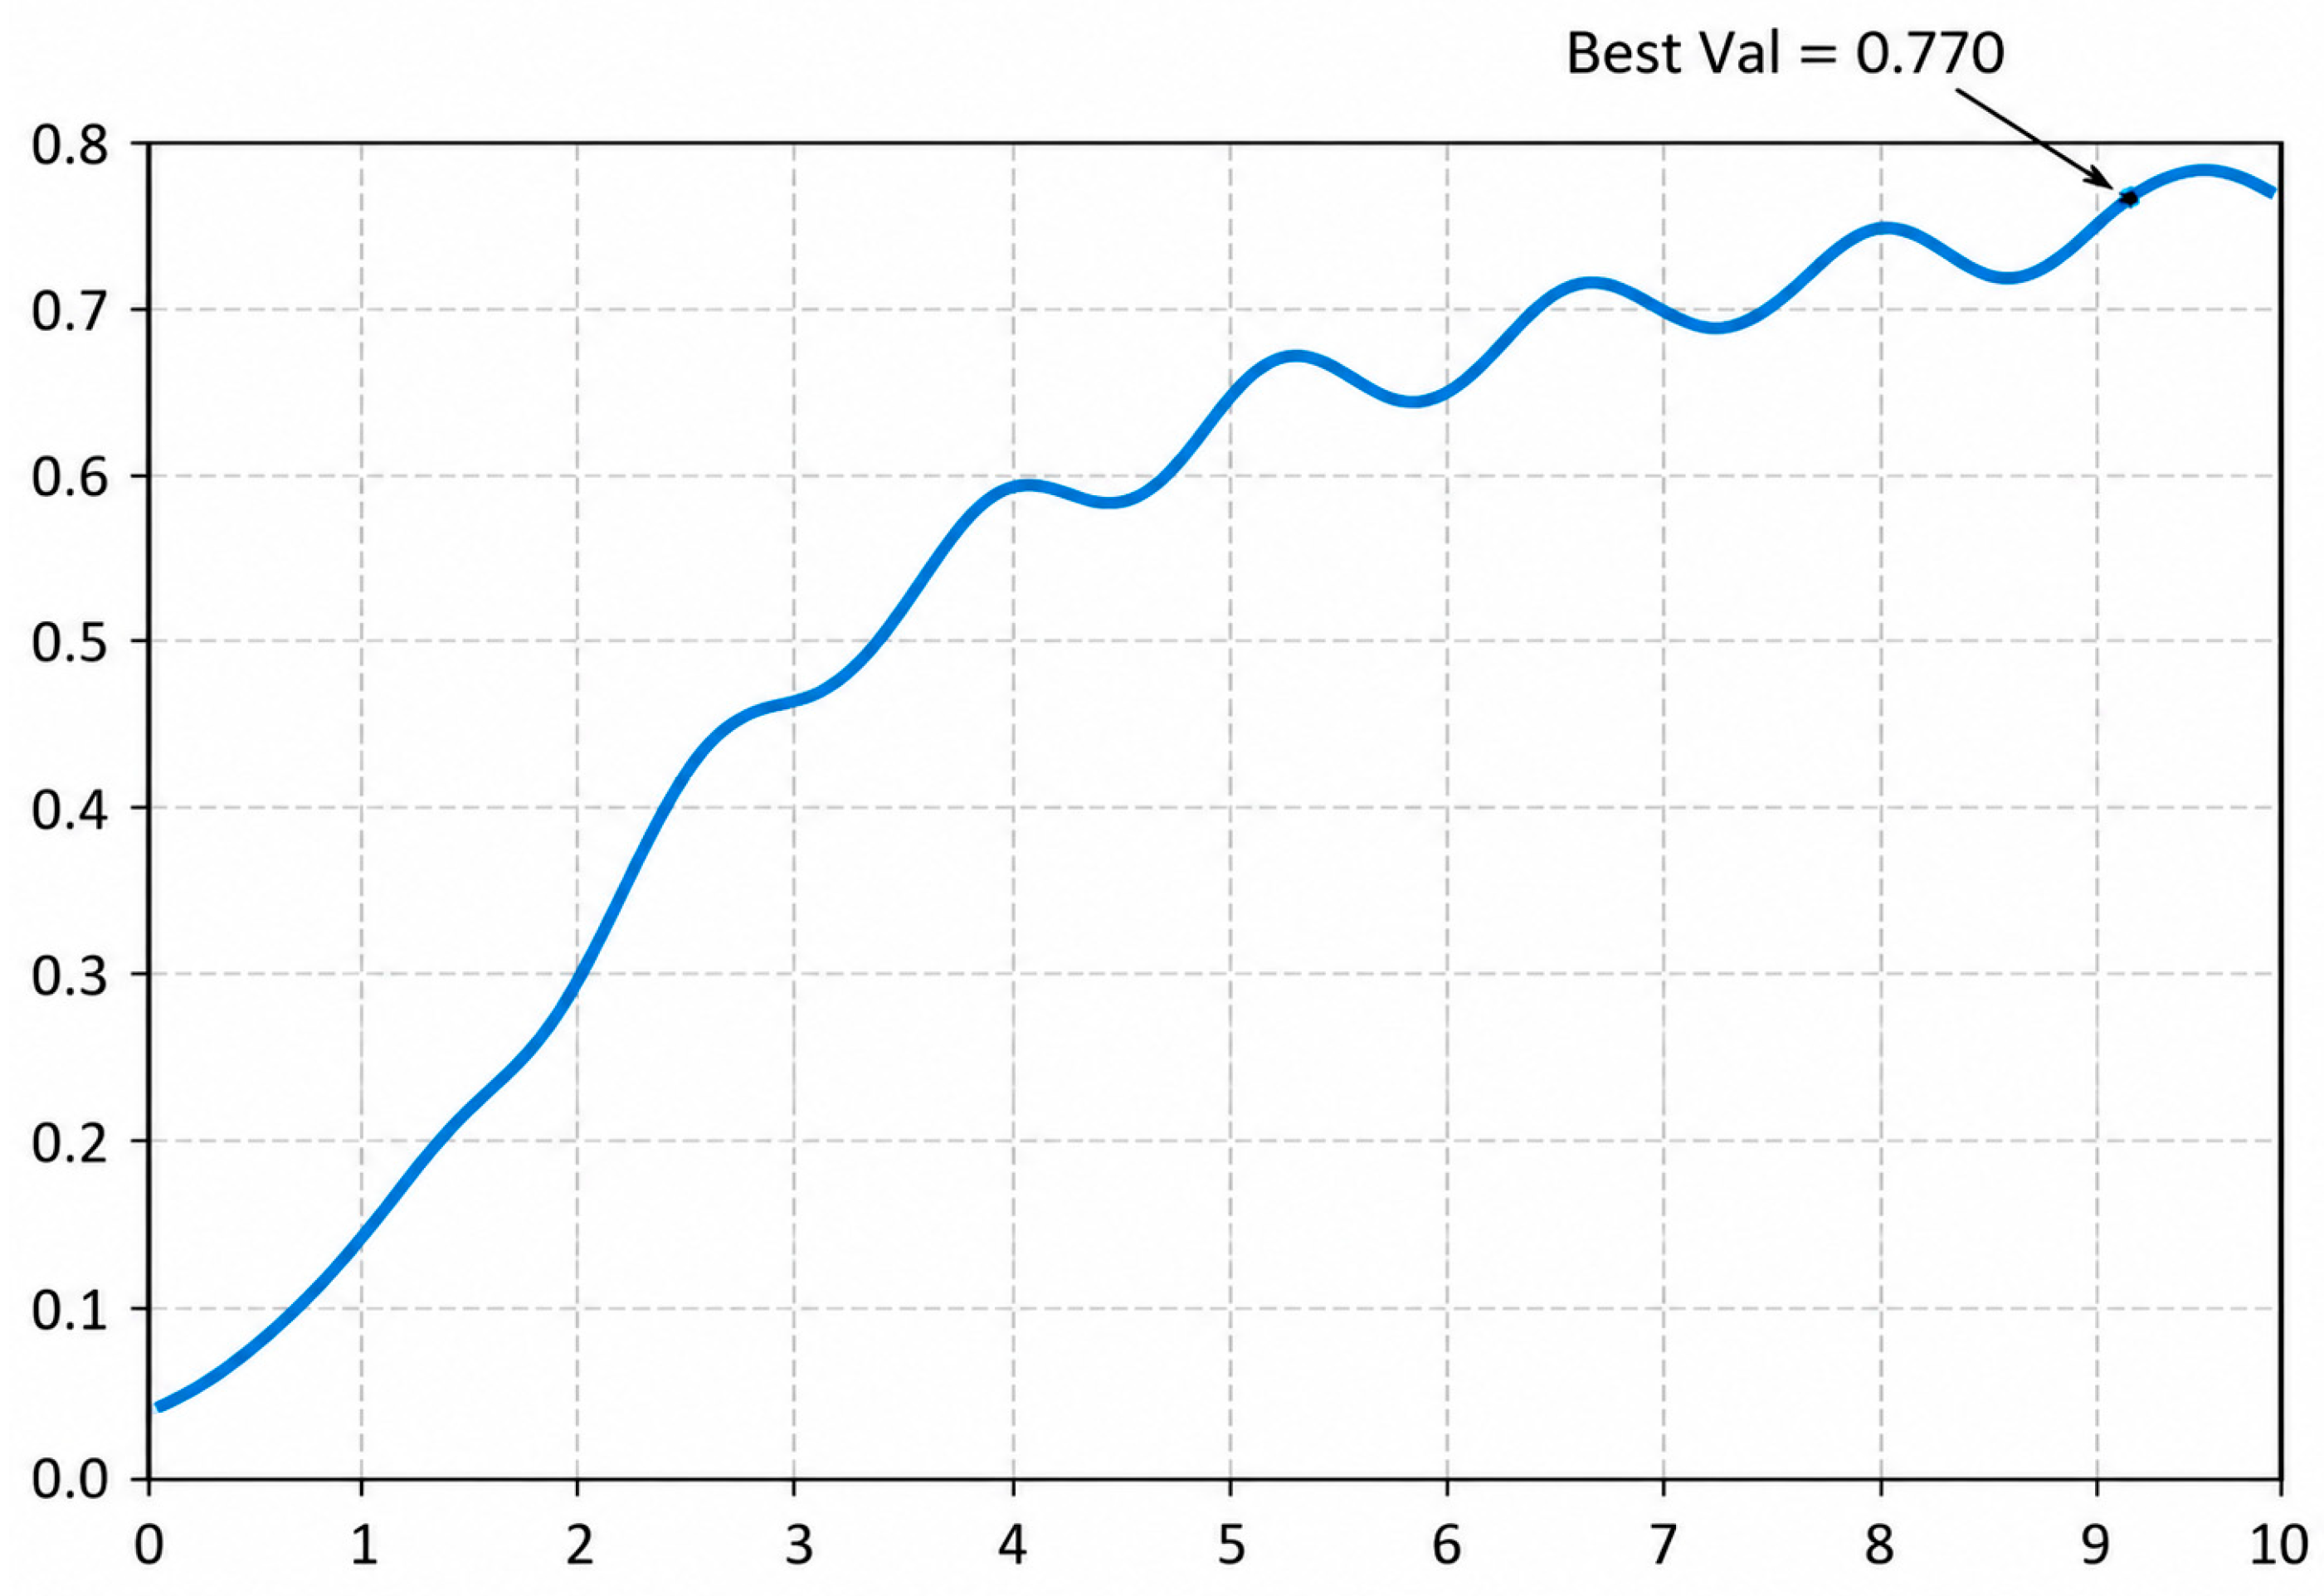
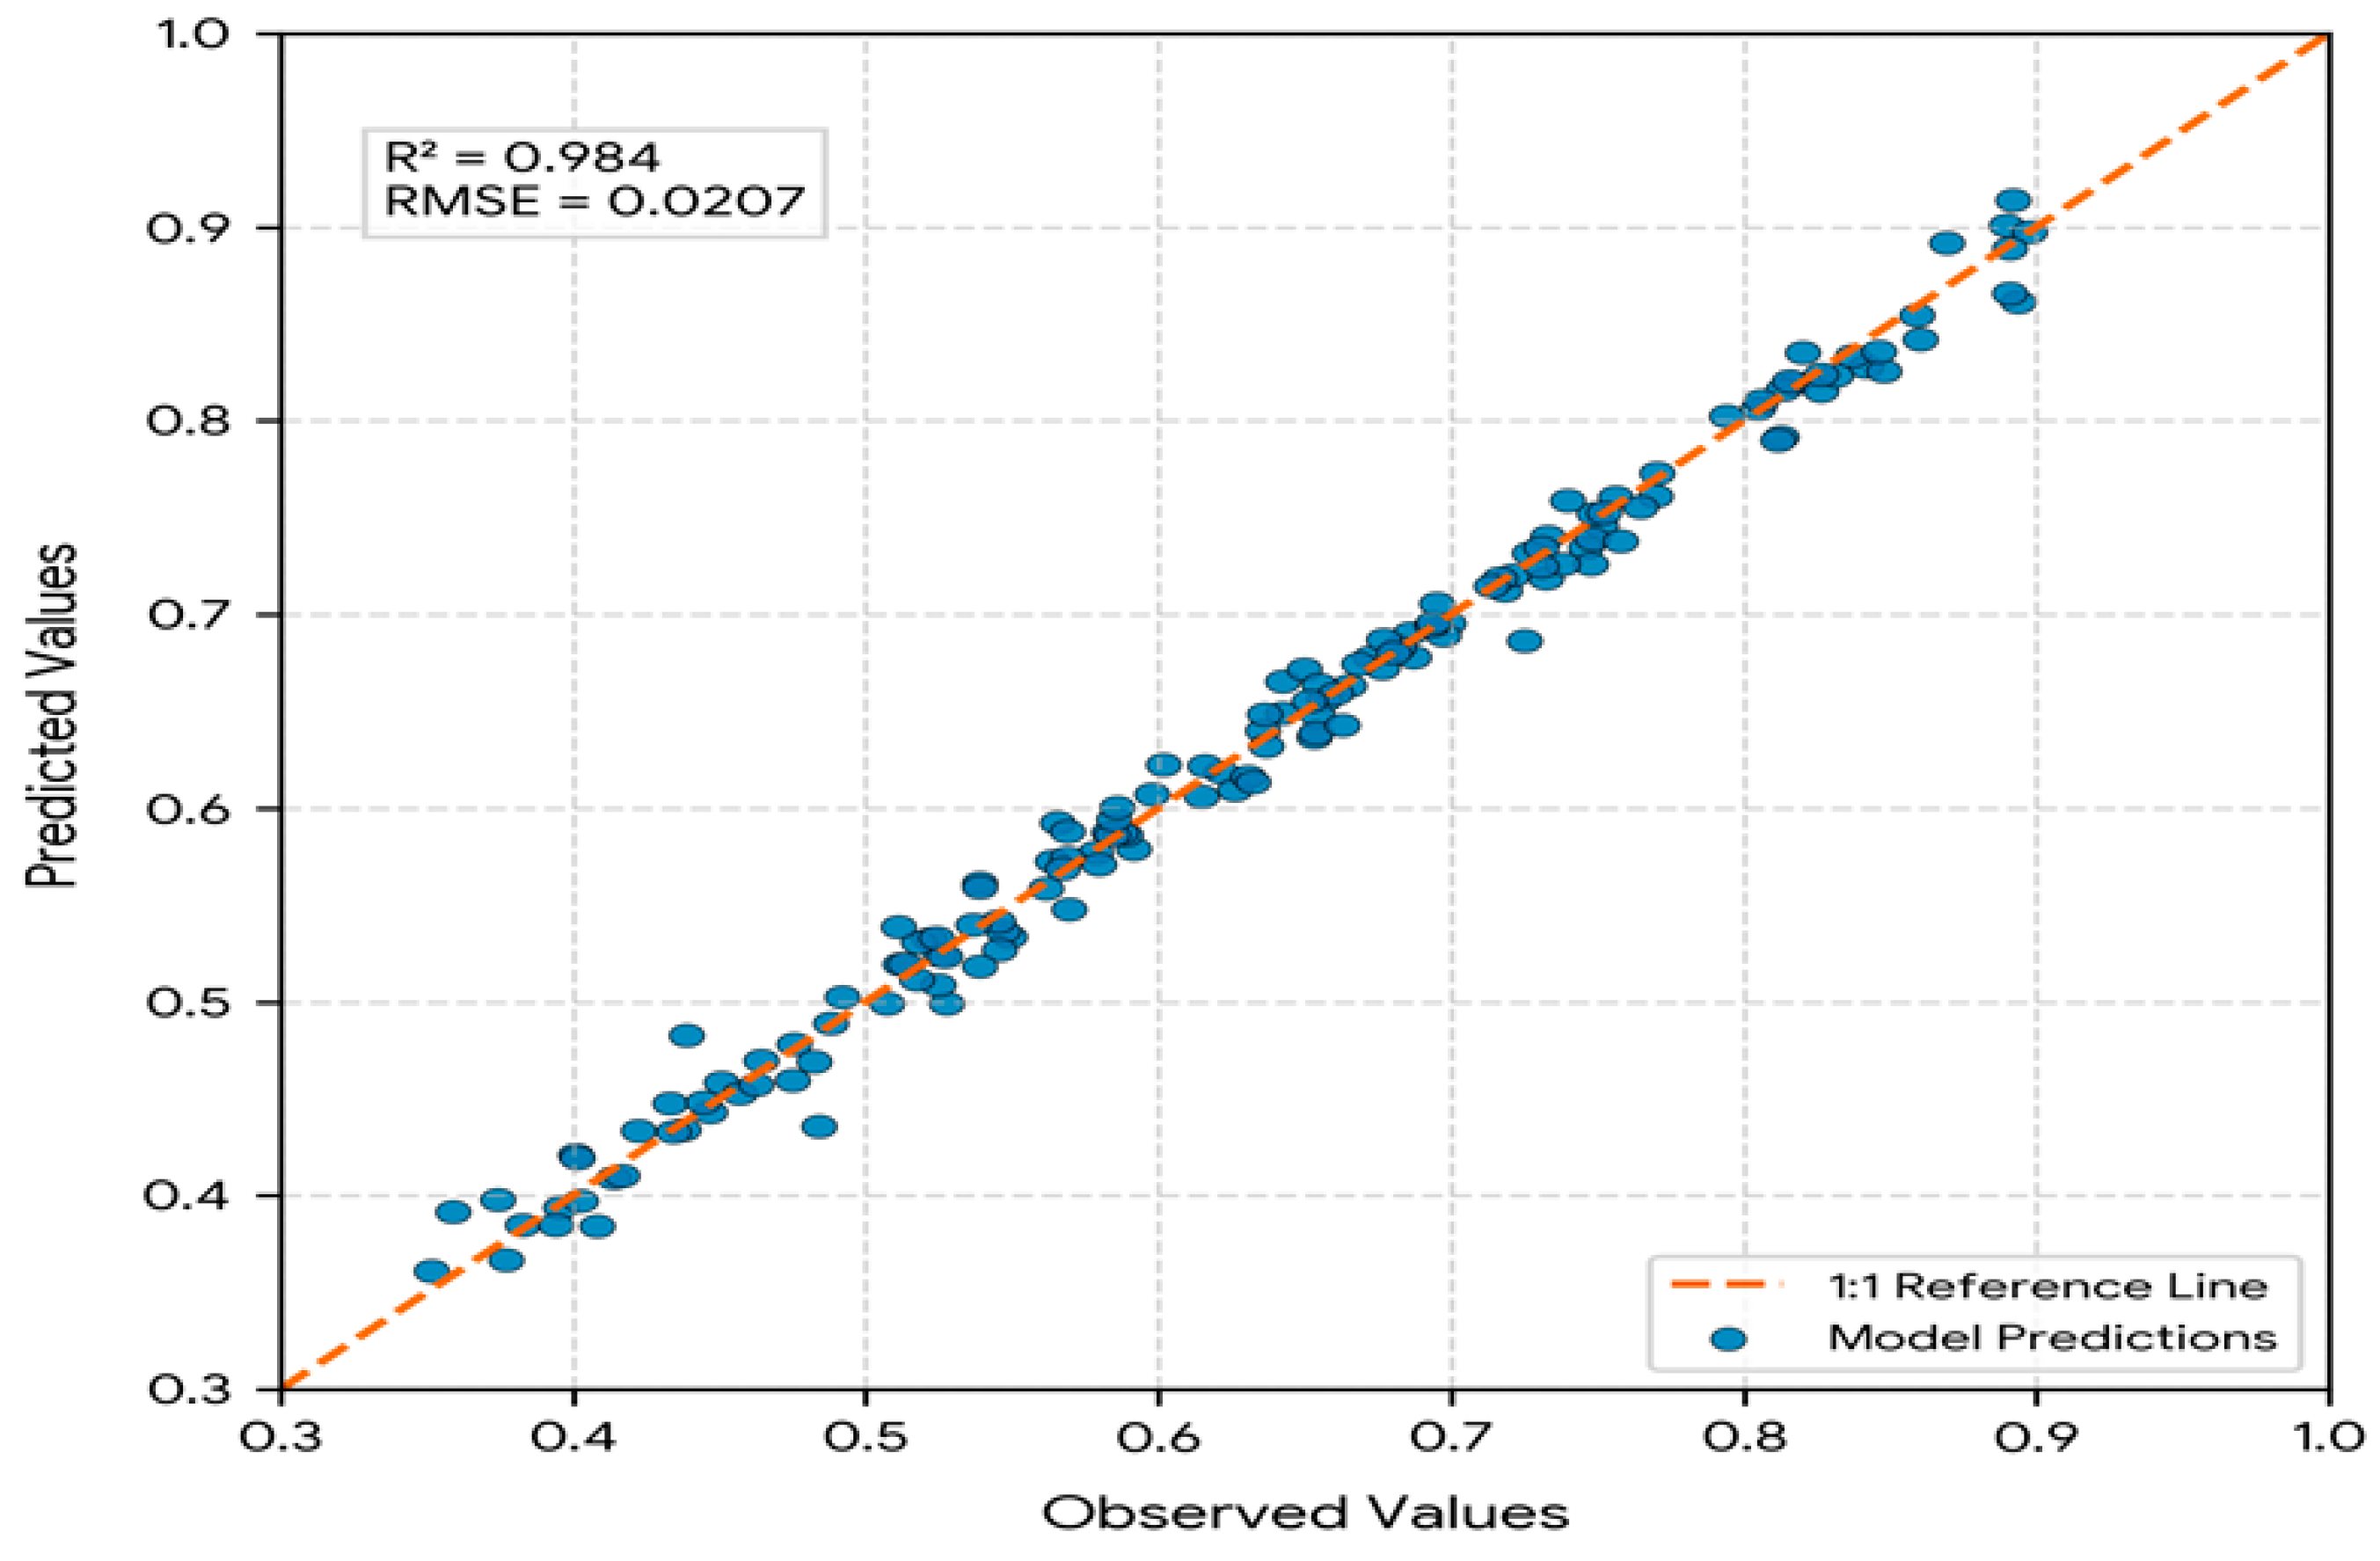
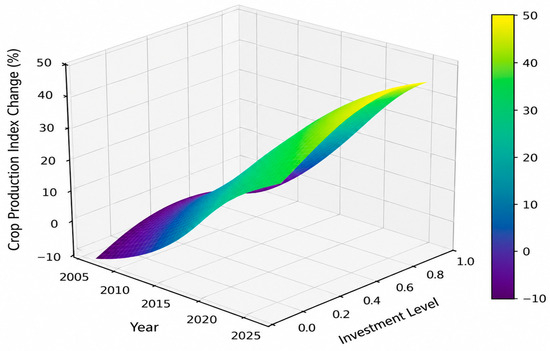
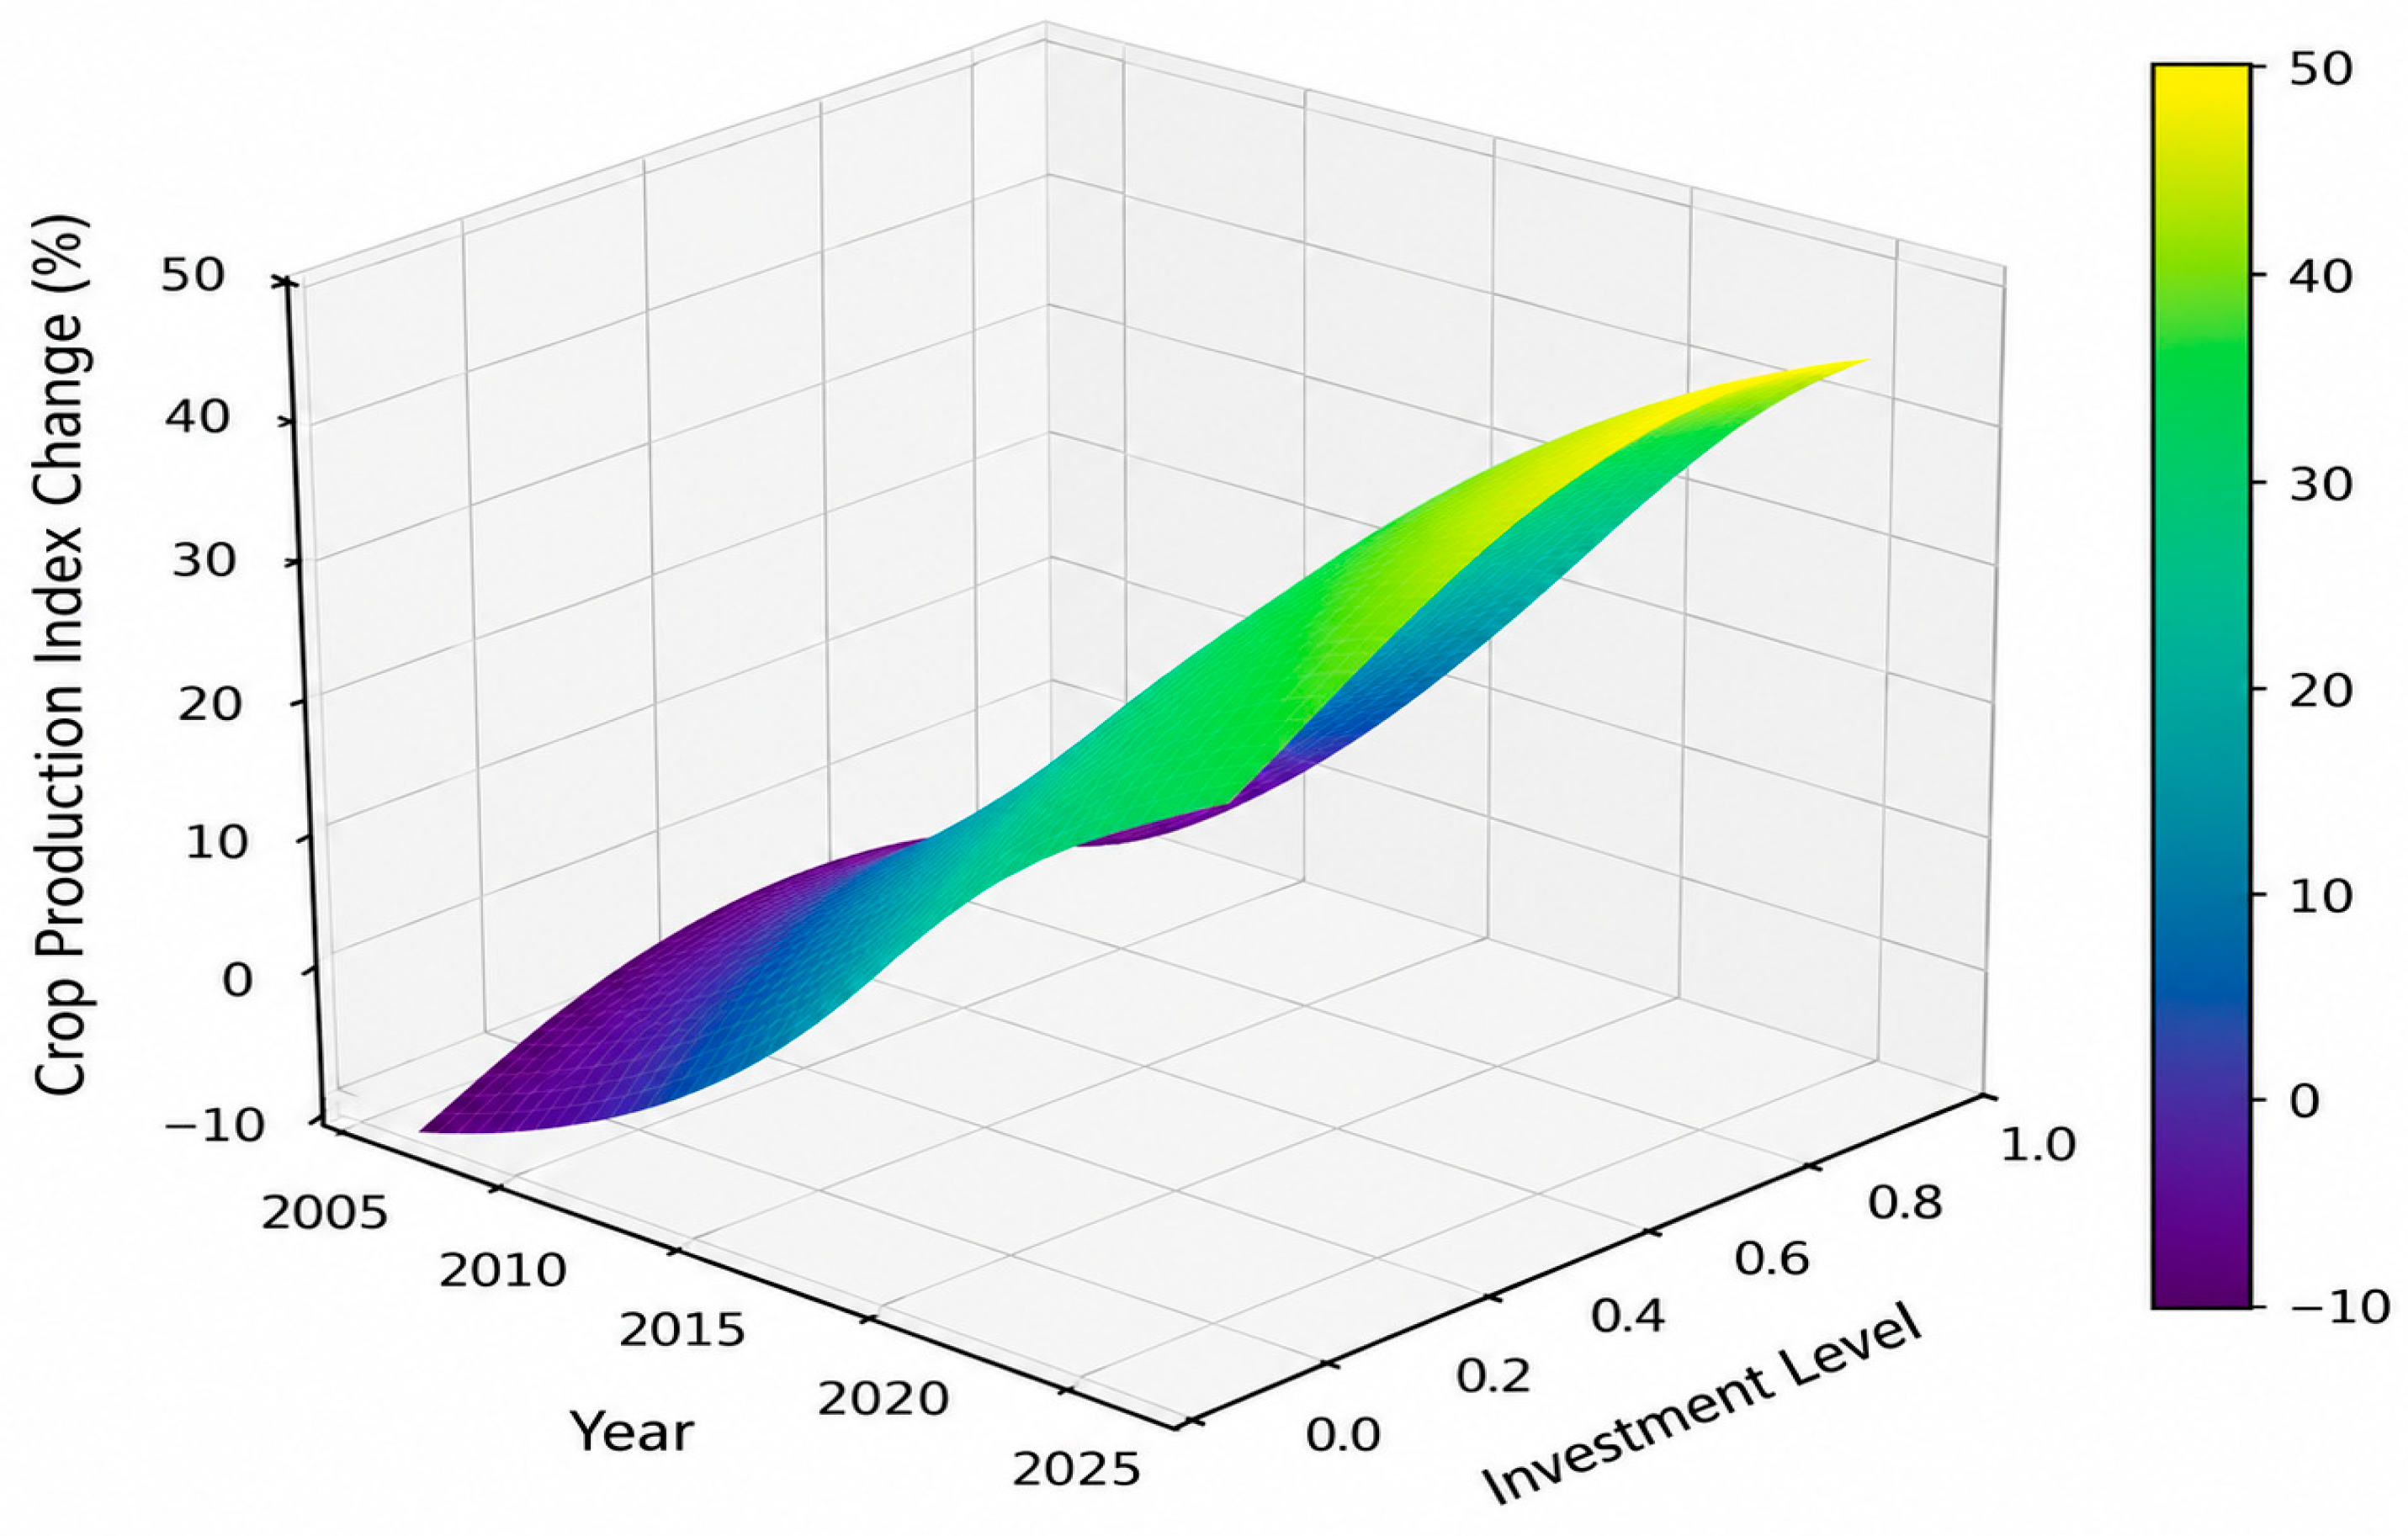

Disclaimer/Publisher’s Note: The statements, opinions and data contained in all publications are solely those of the individual author(s) and contributor(s) and not of MDPI and/or the editor(s). MDPI and/or the editor(s) disclaim responsibility for any injury to people or property resulting from any ideas, methods, instructions or products referred to in the content. |
© 2026 by the authors. Licensee MDPI, Basel, Switzerland. This article is an open access article distributed under the terms and conditions of the Creative Commons Attribution (CC BY) license.