


Abstract
The economic viability of nuclear-powered container ships remains uncertain owing to high capital costs and limited operating experience. This study uses recalculated cost data from a published 15,000 TEU small modular reactor (SMR) container ship case to derive four economic thresholds for capital expenditure, insurance, carbon pricing, and discount rates over a 25-year horizon. Under the published freight-revenue assumptions, the Best scenario recovers its capital premium in 11.3 years (NPV +$278.3 million), whereas the Worst scenario exceeds the assumed 25-year vessel life, with an extrapolated recovery period of 36.5 years (NPV −$183.8 million). Nuclear propulsion retains an operating-cost advantage without carbon pricing, although this does not guarantee positive full-horizon NPV. A separate maritime autonomous surface ship (MASS) analysis identifies a 62.5% nuclear crew-cost reduction as the cash-flow-neutral threshold when the conventional comparator eliminates its crew costs. A published methanol case shows no cost recovery in 5000 Monte Carlo draws, but differing study assumptions preclude direct technology ranking. The nuclear results depend on the source’s reported freight revenues, which cannot be independently reconstructed from its disclosed operating inputs. These findings identify conditional investment boundaries relevant to sustainable shipping.
1. Introduction
International shipping is under increasing pressure to reduce greenhouse-gas (GHG) emissions under the 2023 International Maritime Organization (IMO) GHG Strategy, the inclusion of maritime transport in the European Union Emissions Trading System (EU ETS), and the implementation of FuelEU Maritime. The IMO Strategy calls for international shipping to reach net-zero GHG emissions by or around 2050, while the EU ETS has applied to maritime transport since 2024 and FuelEU Maritime has applied in full since January 2025 [1,2]. Operational measures, efficiency improvements, and alternative fuels are expected to contribute substantially to maritime decarbonization, but may not be sufficient on their own to meet the sector’s long-term emission-reduction objectives [3].
The economic challenge is particularly significant for alternative fuels, whose competitiveness often depends on fuel-price assumptions, carbon-pricing mechanisms, and supporting policy conditions. A recent dynamic total-cost-of-ownership analysis of a 15,000 TEU class container ship found that, with other model assumptions held constant, the EU ETS carbon price would have to rise from a 2026 baseline of €73.5/tCO2 to approximately €916.24/tCO2—about 12.5 times the baseline level—for a green-methanol vessel to reach cost parity with a conventional VLSFO-fueled vessel [1]. This suggests that carbon pricing alone may not eliminate the economic disadvantage of some low-carbon propulsion alternatives and strengthens the case for propulsion systems that can deliver substantial emissions reductions without sacrificing the power density, range, and operational reliability required for large oceangoing vessels.
Nuclear propulsion is one such option. It offers near-zero direct operational GHG emissions, high energy density, long endurance, and relatively low exposure to conventional bunker-fuel price volatility. Its commercial deployment, however, remains highly uncertain. Civil nuclear-powered merchant ships have historically been limited to a small number of demonstration or specialized vessels, including the NS Savannah, Otto Hahn, Mutsu, and Sevmorput [4,5]. Their operating experience demonstrated technical feasibility but also exposed major challenges related to capital cost, specialized crewing, maintenance infrastructure, regulation, liability, insurance, and public acceptance. Among these cases, the NS Savannah is particularly valuable because its audited operating and cost records provide an unusually detailed empirical benchmark for the cost structure of nuclear-powered merchant shipping [6].
Advances in small modular reactor (SMR) technology have renewed interest in the commercial potential of nuclear-powered merchant vessels. Recent techno-economic studies provide increasingly detailed evidence of that potential. Kim et al. [7], using a conceptual 15,000 TEU SMR-powered container ship, showed that nuclear propulsion could generate substantial long-term economic benefits through lower fuel expenditure and reduced carbon-related costs, although the results varied considerably with reactor manufacturing cost, nuclear-fuel cost, and other scenario assumptions. Locatelli et al. [8], using a levelized-cost-of-transport framework, likewise found that nuclear-powered container ships may become economically competitive under conditions such as high cruising speed and favorable reactor CAPEX. These studies suggest that the economic viability of nuclear propulsion is highly conditional on technical, operational, and financial assumptions.
Most existing economic assessments evaluate nuclear propulsion under selected scenarios or parameter ranges. Such analyses are useful for showing how economic performance changes as assumptions vary, but they do not necessarily identify the critical cost, financing, or policy parameters at which the investment conclusion reverses. For investment decisions, the more relevant question is how far key cost, financing, and operating parameters can change before the economic advantage of nuclear propulsion is lost.
The present study addresses this issue through an explicit threshold-analysis framework. The published CAPEX and OPEX line items reported by Kim et al. [7] are independently recalculated and checked for internal arithmetic consistency, with discrepancies in the published CAPEX totals explicitly documented. The economics of a 15,000 TEU SMR-powered container ship are then evaluated on a per-vessel basis over a 25-year investment horizon. Four core threshold variables are examined under a propulsion-only baseline: whole-vessel CAPEX premium, nuclear insurance cost, carbon price, and discount rate. As a separate additional effect, a crew-cost reduction threshold under autonomous operation is also derived. For each variable, the analysis identifies a threshold under a clearly defined economic criterion, as detailed in Section 3.3.
The framework is extended in three directions. First, autonomous-operation economics are examined across an exploratory M0–M4 crew-reduction sensitivity range to capture the asymmetric effect of automation between nuclear and conventionally powered vessels. A conventional vessel may ultimately achieve deeper crew reductions, whereas a nuclear-powered vessel may continue to require specialized reactor personnel. Under such conditions, automation can narrow the relative cost advantage of nuclear propulsion. The analysis therefore identifies the nuclear crew-cost reduction level required to offset this asymmetry.
Second, nuclear propulsion is compared with methanol through external economic benchmarking. Because the underlying models differ in route, vessel speed, discount rate, fuel-price assumptions, and model structure, their absolute cost values are not combined. Instead, relative CAPEX premiums and long-term economic outcomes are reported under each study’s original assumptions, without attempting a direct ranking of the two propulsion technologies.
Third, the audited cost structure of the NS Savannah is used as an auxiliary historical benchmark. Historical costs are not transferred directly to a contemporary SMR vessel; instead, they provide an external plausibility check on the scale and structure of selected nuclear-specific operating-cost categories. An ammonia-fueled container ship is retained separately as a CAPEX reference where sufficiently comparable OPEX and full-horizon TCO data are unavailable.
The study contributes by expressing nuclear-ship economics in terms of explicit reversal thresholds rather than scenario outcomes alone. This provides a direct measure of how much variation in capital cost, financing conditions, insurance, carbon pricing, and crew-related savings can be absorbed before the investment conclusion changes. The resulting boundary conditions offer a more transparent basis for evaluating the commercial feasibility and robustness of SMR-powered merchant shipping under uncertain future conditions. In doing so, the study contributes to the broader sustainable development agenda for maritime transport, providing evidence relevant to United Nations Sustainable Development Goal (SDG) 7 (Affordable and Clean Energy), SDG 9 (Industry, Innovation, and Infrastructure), and SDG 13 (Climate Action) by clarifying the economic conditions under which a near-zero-emission propulsion technology can be adopted at commercial scale.
2. Related Literature
2.1. Nuclear Merchant Ships and Contemporary SMR Economics
Historical experience with nuclear merchant shipping provides important technical and economic context for current SMR concepts. Freire and de Andrade [4] review the principal nuclear merchant ships that entered service and identify recurring technical, institutional, and commercial challenges. Schøyen and Steger-Jensen [5] examine the Savannah, Otto Hahn, Mutsu, and Sevmorput and draw lessons for future nuclear-powered commercial vessels. Carlton, Smart, and Jenkins [9] and Namikawa et al. [10] emphasize the engineering, safety, regulatory, and commercial barriers that separate technical feasibility from practical deployment.
The audited operating accounts of the NS Savannah [6] are especially valuable because they provide one of the few detailed empirical cost records for a nuclear merchant vessel. U.S. General Accounting Office records document nuclear-specific shore-support staffing of approximately $409,000/year, a dedicated servicing facility costing approximately $1.162 M/year, and specialized crew training of approximately $300,000/year. Together, these items account for roughly $1.9 M of the vessel’s $2.9 M annual net operating cost, providing a rare historical benchmark for nuclear-specific operating expenditures.
The emergence of SMRs has shifted the literature toward forward-looking techno-economic assessment. Gravina et al. [11] propose a modular nuclear-powered container ship concept emphasizing accident tolerance and operational flexibility, while Hirdaris et al. [12] examine the technical and risk characteristics of an SMR-powered Suezmax tanker. Freire and de Andrade [13] consider a detachable mobile nuclear power-plant concept in which reactor ownership and operation are separated from the vessel, illustrating how alternative business models might reduce some barriers to nuclear propulsion.
Recent studies provide increasingly detailed economic assessments. De Vries, Houtkoop, and Leurs [14] conduct a speed-dependent total-cost-of-ownership analysis for a 20,000 TEU nuclear container ship (512.6 MWe) and a large bulk carrier, finding that the economic attractiveness of nuclear propulsion improves at higher operating speeds. Kim, Kwon, and Kim [7] develop Best and Worst CAPEX/OPEX scenarios for a 15,000 TEU SMR-powered container ship and report substantial variation in long-term economic performance with reactor manufacturing cost, nuclear-fuel cost, carbon taxation, and related assumptions. Their dataset provides the principal contemporary cost basis reproduced and extended in this analysis. Locatelli et al. [8] apply a levelized-cost-of-transport framework to a 12,000 TEU Neo-Panamax container ship and find that competitiveness depends strongly on vessel speed, carbon taxation, and reactor CAPEX. Kim, Mugabi, and Jeong [15] assess technology, investment, and community readiness for marine SMRs and emphasize that technical potential alone does not imply commercial readiness.
Industry developments reflect this growing interest. HD KSOE received Approval in Principle from DNV for a 15,000 TEU SMR-powered container ship design [16]. Lloyd’s Register Advisory and LucidCatalyst [17], in an assessment commissioned for Seaspan Corporation, estimate that a comparably sized nuclear vessel could reduce annual bunker-fuel costs by up to $50 M and carbon penalties by approximately $18 M on some routes, while increasing annual cargo throughput by up to 38% through additional round voyages. Duong, Ha, Lee, and Kang [18] provide a broader review of the technical and sustainability considerations associated with SMR-powered merchant ships.
Regulatory and industry assessments continue to identify substantial barriers. Lloyd’s Register [19], DNV [20], and the European Maritime Safety Agency [21] note the potential of advanced nuclear technologies in commercial shipping but also highlight unresolved issues involving licensing, liability, port access, fuel-cycle management, insurance, emergency preparedness, and business models. Holman Fenwick Willan [22] likewise shows that commercial viability is closely tied to the regulatory framework governing nuclear-powered vessels. In the Korean context, Jang [23] reports that nuclear propulsion becomes economically superior to diesel and LNG after approximately 11.8 years of operation and identifies potential advantages for Arctic routes, while Kim, S. [24] applies PEST-SWOT-AHP analysis, using the NS Savannah as a historical reference, to assess the domestic introduction of nuclear-powered merchant vessels.
Across these studies, economic performance is generally evaluated through discrete scenarios or parameter ranges. Although previous studies have identified breakeven conditions for particular operating parameters, such as vessel speed or operating duration, systematic analysis of reversal thresholds across capital costs, financing conditions, insurance, and carbon pricing remains limited. This gap motivates the threshold framework used here.
2.2. Alternative-Fuel Economics and Cross-Study Benchmarking
The economic case for nuclear propulsion must also be considered alongside other maritime decarbonization options. Methanol and ammonia have attracted particular attention as potential fuels for large oceangoing vessels.
Bo, Cai, and Zhang [1] develop a dynamic total-cost-of-ownership model for a 15,000 TEU class methanol dual-fuel container ship operating on the Ningbo–Zhoushan–Valencia corridor. The model incorporates CAPEX, OPEX, EU ETS exposure, FuelEU Maritime compliance costs, and green-premium revenue. Under the baseline assumptions, the methanol alternative remains economically disadvantaged relative to VLSFO throughout the modeled period: the 15-year present-value cost is substantially higher, and cumulative discounted cost parity is not achieved even over an extended 30-year horizon.
Hansen et al. [25] report newbuild premiums of approximately 11% for methanol and 16% for ammonia on a 15,000 TEU reference vessel, although fuel expenditure, operating cost, and carbon-policy effects are excluded from their analysis. Because this estimate reflects capital cost alone and does not provide a comparable full-horizon OPEX, carbon-policy, or total-cost-of-ownership structure, the present study’s main cross-study comparison, presented later in Section 4.5.1, instead uses the +20% methanol CAPEX premium reported together with a complete Monte Carlo TCO framework by Bo et al. [1]; Hansen et al.’s +11% methanol and +16% ammonia figures are retained here, and as the ammonia CAPEX reference in Section 4.5.2, as independent literature benchmarks rather than inputs to the main comparison. Schreuder et al. [26] provide a total-cost-of-ownership assessment of low-carbon ammonia for a Post-Panamax vessel and estimate the carbon tax increase required to offset its remaining cost disadvantage relative to VLSFO. Diamantakis et al. [2] place methanol and ammonia within the broader techno-economic landscape of LNG, hydrogen, and other alternative marine fuels.
Direct comparison with nuclear propulsion is difficult because the underlying models differ in route, vessel characteristics, speed, discount rate, fuel-price assumptions, and policy environment. Combining absolute cost values from structurally different models can create a misleading impression of comparability. The comparison in this study therefore retains each model on its own terms and reports relative CAPEX premiums and long-term economic outcomes under each study’s original assumptions. These results are treated as external economic benchmarks rather than directly comparable estimates of technological superiority.
2.3. Autonomous Shipping and Nuclear-Specific Manning Constraints
Autonomous operation adds another dimension to future ship economics. Most maritime autonomous surface ship (MASS) studies focus on conventionally powered small- or medium-sized vessels and identify crew-cost reduction as a major potential source of savings. Kooij, Kana, and Hekkenberg [27] model staged crew reductions from 11 crew members to zero for a 750 TEU short-sea container feeder, while Kretschmann, Burmeister, and Jahn [28] compare autonomous and conventional bulk-carrier configurations.
Ziajka-Poźnańska and Montewka [29] report that removing crew accommodation may reduce vessel capital cost by approximately 5% and increase container capacity by up to 20% in small feeder concepts, while noting that redundancy, shore-control, communication, and additional system requirements may offset some or all of these savings. Akbar et al. [30] find that autonomous feeders on a Rotterdam–Norway coastal liner network reduce total operating costs by approximately 11% on average, with 94% of the estimated savings arising from lower time-charter costs. Because the modeled time-charter rate incorporates both vessel and crew costs, crew removal forms an important part of the reduction, although fleet composition and vessel-size changes also contribute.
The implications are different for nuclear-powered vessels. Even if navigation and conventional shipboard functions become highly automated, nuclear vessels may continue to require certified reactor personnel and other specialized crew. The United Kingdom’s Merchant Shipping (Nuclear Ships) Regulations 2022 [31], one of the few contemporary statutory frameworks to address nuclear-ship manning and training explicitly, impose functional safe-manning and competency requirements rather than a numerical crew-reduction ceiling. The regulations therefore do not establish in advance the maximum degree of unmanning that could be permitted for a future nuclear-powered merchant vessel.
A resulting asymmetry may affect relative operating costs. Conventionally powered vessels may achieve deeper crew-cost reductions than nuclear vessels, meaning that greater automation does not necessarily improve the relative economic position of nuclear propulsion. Under some conditions, it may narrow the operating-cost advantage.
Although nuclear propulsion and autonomous shipping are both recognized as potentially disruptive maritime technologies [32], their economic interaction remains poorly quantified. Nuclear-specific manning requirements have rarely been treated as an explicit constraint in comparative propulsion economics. The analysis therefore examines staged MASS crew reductions and identifies the nuclear crew-cost reduction threshold required to offset the greater automation-related savings potentially available to a conventional vessel.
2.4. Research Gaps and Research Questions
Four research gaps emerge from the literature.
First, nuclear-ship economic studies typically report Best/Worst scenarios, alternative cases, or parameter ranges; systematic reversal-threshold analysis across capital costs, financing conditions, insurance, and carbon pricing remains limited.
Second, the interaction between nuclear propulsion and autonomous operation remains underexplored, particularly where nuclear-specific manning requirements may constrain crew-cost reductions.
Third, comparisons between nuclear propulsion and alternative fuels are complicated by differences in routes, vessel size, speed, discount rates, and model structure, which limits the validity of direct comparisons based on absolute costs.
Fourth, relatively few studies independently recalculate published cost components, assess their internal consistency, and explicitly document discrepancies before deriving further economic results. This methodological gap is addressed through the data assessment procedure described in Section 3.5.1.
These gaps lead to the following research questions:
- RQ1. Under what whole-vessel CAPEX premium and discount-rate thresholds does nuclear propulsion remain economically advantageous for a 15,000 TEU SMR-powered container ship?
- RQ2. At what levels of nuclear-ship insurance cost and carbon price is the relative economic advantage of nuclear propulsion eliminated or reversed?
- RQ3. How does autonomous-shipping crew reduction affect nuclear and conventionally powered vessels asymmetrically, and what nuclear crew-cost reduction threshold is required to offset the greater automation-related savings available to the conventional vessel?
- RQ4. How do the reported economic outcomes of nuclear propulsion compare with those of an independently published dynamic TCO model of a methanol dual-fuel container ship of similar nominal capacity?
3. Materials and Methods
3.1. Dual-Layer Modeling Framework
The analysis is organized into two distinct layers. The primary layer reproduces the CAPEX, OPEX, and NPV calculations for the 15,000 TEU SMR-powered container ship reported by Kim et al. [7] and provides the basis for the threshold analysis. Before applying the economic framework defined in Section 3.2 to the threshold variables specified in Section 3.3, the published CAPEX and OPEX line items are recalculated and checked for internal arithmetic consistency, with discrepancies in the published CAPEX totals explicitly documented.
A separate historical layer draws on the audited 1965–1968 operating accounts of the NS Savannah [6] and the U.S. Maritime Administration’s 2008 Post-Shutdown Decommissioning Activities Report (PSDAR Rev. 1) [33]. These data are used qualitatively in Section 4.5.3 to compare the scale and structure of selected nuclear-specific costs in the contemporary model with those observed in historical nuclear-ship operation. The historical and contemporary datasets are not combined because inflation adjustment alone cannot make the cost structure of a 1960s pressurized-water-reactor vessel directly comparable with that of a present-day SMR concept.
3.2. Definition of CAPEX, OPEX, and NPV
For option j ∈ {C, D, E}, where C, D, and E denote the conventional, nuclear Best, and nuclear Worst cases, respectively, total capital expenditure is defined as
Annual operating expenditure at autonomous-operation stage M is given by
Crew cost at stage M is defined as
where is the crew-cost reduction rate associated with autonomous-operation stage M [27]. Annual revenue, , and operating expenditure, , are assumed to remain constant over the 25-year operating horizon (Section 3.5). Annual net cash flow is therefore
and is constant with respect to year t*.
Net present value is calculated on a per-vessel basis over the 25-year operating horizon as
where is the discount rate (WACC = 5% [7]), is the end-of-life scrap value, and is the decommissioning cost. Fleet size (reported as a reference variable in the CAPEX dataset (Section 3.5.1)) does not enter Equation (5); economic comparisons in Section 4.1, Section 4.2, Section 4.3 and Section 4.4 are made on a per-vessel basis.
For the threshold and breakeven calculations, each nuclear case is evaluated relative to the conventional baseline C:
The operating-cash-flow-only breakeven year t* is obtained from
A finite breakeven year exists only when the discounted cumulative operating-cash-flow advantage is sufficient to recover the incremental CAPEX. If this condition is not satisfied, the investment premium is reported as not recovered within the vessel’s assumed useful life.
Full-horizon NPV at (T = 25), including the terminal scrap and decommissioning terms, is
Because the breakeven year (Equation (7)) and the full-horizon NPV and IRR (Equation (8)) address different economic questions, they are evaluated on different cash-flow bases. The breakeven year identifies when cumulative operating-cash-flow savings offset the initial CAPEX premium and is therefore calculated using operating cash flows only. By contrast, NPV(25) and IRR are evaluated over the full horizon and include the terminal scrap/decommissioning value realized at the end of the project life. Accordingly, IRR, denoted by , is defined as the discount rate that satisfies in Equation (8). All calculations and exploratory sensitivity analyses were implemented in Python 3.11.
3.3. Definition of Threshold Variables
For each threshold variable , all other parameters are held at their point estimates while solving for the critical value at which the relevant economic advantage of nuclear propulsion disappears. Because the five variables enter the economic model through different channels, the corresponding threshold criteria are defined separately. Four of these five variables—the CAPEX premium, insurance cost, carbon price, and discount-rate thresholds—are treated as the core thresholds evaluated together in Section 4.2 under the no-MASS (M0/M0) baseline; the fifth, the crew-cost reduction threshold under autonomous operation, is analyzed separately, as an additional effect, in Section 4.4.
The CAPEX threshold, , is evaluated on a full-horizon NPV-parity basis:
The insurance and carbon-price thresholds are defined on an annual OPEX-parity basis. In particular, the carbon-price threshold captures changes in the conventional vessel’s carbon tax expenditure but excludes the nuclear vessel’s assumed carbon-credit revenue, which enters the model separately through annual revenue.
The crew-cost threshold, , is defined differently: because it enters the model only through the asymmetric MASS comparison introduced in Section 4.4 (conventional vessel fixed at full crew-cost elimination, M4; nuclear crew-cost reduction varied), it is not an operating-cost-parity condition between the two vessels. Instead, is the nuclear crew-cost reduction rate at which the MASS-adjusted cash-flow advantage, ΔCF(conventional = M4, nuclear = ), equals the pre-MASS cash-flow advantage, ΔCF(conventional = M0, nuclear = M0); this condition is applied in Section 4.4.
The WACC threshold, , is defined as the discount rate at which the full-horizon NPV advantage of nuclear propulsion relative to the conventional vessel disappears:
or equivalently, where
Throughout this study, the reported internal rate of return (IRR) is this same incremental (crossover) discount rate—the rate that sets the full-horizon NPV of the incremental cash-flow stream (ΔCAPEX, ΔCF, and the terminal-value difference between the nuclear and conventional vessel) equal to zero—and is numerically identical to . It is distinct from a standalone IRR computed on the nuclear vessel’s own absolute cash flows, which would equal 14.26% in the Best scenario and 7.20% in the Worst scenario under the same inputs; the incremental definition is used throughout the analysis because it is the metric relevant to the vessel-against-vessel threshold comparison that is the focus of this study.
The five primary thresholds and their respective criteria are summarized in Table 1. Table 1 defines all five for completeness; only the first four, however, are treated as the core thresholds analyzed jointly in Section 4.2, while the fifth, , is analyzed separately, as an additional effect, in Section 4.4.
Table 1.
Definition of the five threshold variables (four core thresholds analyzed jointly in Section 4.2; * analyzed separately in Section 4.4).
3.4. Principle of Cross-Study Economic Benchmarking
The nuclear [7] and methanol [1] models differ substantially in their underlying assumptions. The nuclear case is based on the Busan–Tacoma route, operating speeds of 16.63/25 kn, and a 5% discount rate, whereas the methanol case uses the Ningbo–Valencia route, a 21 kn service speed, and an 8% discount rate. Their absolute cost estimates are therefore not combined into a single economic model.
Instead, each study is retained as a self-contained comparison between its alternative propulsion option and conventional comparator. The cross-study benchmarking in Section 4.5.1 reports the relative CAPEX premiums and the long-term economic outcomes under each study’s original assumptions. The relative CAPEX premium is calculated as −/ × 100%. For the nuclear cases, the reported outcomes include incremental operating-cash-flow breakeven periods and 25-year differential NPVs. For the methanol case, the comparison uses the published discounted cost outcomes and Monte Carlo results reported by Bo et al. [1].
These measures are presented as study-specific economic benchmarks rather than directly comparable indicators of technological superiority. Differences in routes, vessel characteristics, discount rates, operating assumptions, and modeling methods preclude a direct economic ranking or harmonization of full-horizon costs across the two studies.
3.5. Variable Data
The evidence used in the analysis is classified into four categories: [OBS] primary observation; [PRX] proxy indicator; [ASM] assumption or extrapolation; and [CALC] value calculated in this study. The input data and computational scripts used in this study are provided in the Supplementary Materials (Table S1 and Software S2–S5).
3.5.1. CAPEX and OPEX (Reproduction of Kim et al. [7])
The reproduced CAPEX line items for the conventional and nuclear options are summarized in Table 2.
Table 2.
CAPEX components (per vessel, USD million) [7].
To assess the sensitivity of the main economic findings to the CAPEX discrepancy identified in Table 3, the incremental breakeven periods and 25-year NPVs were recalculated using the total capital costs originally reported by Kim et al. [7]. Under the published totals, the incremental CAPEX decreases by $39.60 M in both nuclear scenarios. The Best-case breakeven period decreases from 11.27 to 10.08 years, and its incremental NPV increases from +$278.3 M to +$317.9 M. The corresponding Worst-case values change from 36.45 to 32.53 years and from −$183.8 M to −$144.2 M, respectively. Thus, the alternative CAPEX basis does not change the main finding that the Best case recovers its additional capital investment within 25 years, whereas the Worst case does not. The arithmetically reconciled CAPEX totals are retained as the primary inputs because they are consistent with the sum of the published cost components.
Table 3.
Reconciliation of Table 2’s CAPEX totals: published [7] vs. recalculated.
The OPEX components for the conventional and nuclear options are summarized in Table 4.
Table 4.
OPEX components (per vessel per year, USD million, stage M0) [7].
Annual revenue, including the assumed carbon-credit component reported by Kim et al. [7], is $113.30 M for the conventional vessel and $155.12 M for the nuclear vessel. End-of-life scrap values are $10.00 M and $4.00 M, respectively. Nuclear decommissioning liability is assumed to be $140.00 M as a one-time terminal cost. The discount rate is 5% [7], and the vessel life is 25 years.
Kim et al. [7] attribute the annual revenue differential of approximately $41.82 M to two components: an assumed carbon-credit revenue of $10,578,743/year and an additional freight revenue of $31,237,917/year ($144,540,000—$113,302,083). The carbon-credit component depends on the carbon-pricing mechanism assumed in [7], based on a carbon price of $120/tCO2 within the $90–150/tCO2 range discussed in that study. The additional freight revenue is attributed to the nuclear vessel’s higher design speed (25 vs. 16 knots), greater annual voyage frequency (10.43 vs. 8.69 voyages), and larger TEU capacity (15,000 vs. 14,500 TEU). The two components sum to $41,816,660/year, consistent with the revenue differential reported in [7].
Although this decomposition is arithmetically consistent, the reported annual freight revenues cannot be independently reconstructed from the disclosed operational inputs. Calculations based on the reported vessel capacities, freight rates, and annual voyage counts produce higher revenue estimates, suggesting that additional assumptions or adjustments may have been applied, such as vessel utilization, voyage definitions, or revenue-realization factors. However, these cannot be uniquely identified from the available information. Accordingly, this study retains the published freight-revenue figures without introducing unverified assumptions. The sensitivity of the economic conclusions to the assumed freight-revenue differential is examined in Section 4.3.
3.5.2. Autonomous-Operation (MASS) Crew-Reduction Rates
The staged crew-cost reduction rates are taken from Kooij, Kana, and Hekkenberg [27], whose reference case is a 750 TEU short-sea container vessel with 11 crew during normal sailing.
The staged crew-cost reduction rates are summarized in Table 5.
Table 5.
Staged crew-cost reduction rates adopted from Kooij et al. [27] for scenario-based application to a 15,000 TEU nuclear-powered container ship.
The disproportion between headcount reduction and reflects rank-based wage differentiation in the underlying source rather than an inconsistency in this study. Kooij et al. [27] report highly unequal monthly wage rates by rank (master €9000; chief engineer €8900; chief officer €7500; second engineer €7400; versus able seaman €2000 and deck boy €1400), a spread exceeding sixfold. Stage M1 (open-sea autonomous navigation) removes mainly lower-paid, junior watchkeeping crew, so the headcount reduction from 11 to 8 (−27.3%) corresponds to only a 5.7% reduction in crew cost. From stage M2 onward (port automation and outsourced deck maintenance), the remaining complement is reduced to senior, high-wage ranks only (master, chief engineer, and second engineer), so the cost-reduction rate rises disproportionately to 48.3% even though headcount falls only from 8 to 3. At stage M3 (two crew—the chief engineer and second engineer; on-board responsibility for the vessel transfers from the captain to the chief engineer at this stage, per [27]), the wage-weighted cost-reduction rate rises further to 66.6%, continuing the pattern observed at stage M2: because the ranks removed between successive stages are, on average, lower-paid than the ranks retained, the wage-weighted reduction rate does not scale linearly with headcount. Stage M4 (fully unmanned, 0 crew) yields a cost reduction of 100% by definition, independent of rank weighting, since no crew wage cost remains. is therefore a wage-weighted, not a headcount-weighted, reduction rate, consistent with the crew-cost accounting used in the source.
Table 6 reconstructs the crew-cost reductions for stages M2–M4 using the rank-specific monthly wages reported by Kooij et al. [27]. The retained crew costs are deducted from the baseline monthly cost of €48,900 per crew complement and annualized for two rotating complements. The M1 reduction is retained as reported in [27], without an independent rank-by-rank reconstruction.
Because Kooij et al. [27] examine a 750 TEU short-sea container ship, only the crew-cost reduction rates—not the absolute cost savings or crew compositions—are applied to the 15,000 TEU nuclear-powered vessel. These rates are classified as [ASM] and used solely for exploratory sensitivity analysis (Table 5; Section 4.4), rather than as predictions of technically or legally achievable crew reductions.
The regulatory sources reviewed do not establish a fixed numerical crew-reduction limit for nuclear-powered ships. In particular, the UK’s Merchant Shipping (Nuclear Ships) Regulations 2022, Regulation 18(1)(b) [31], impose safe-manning requirements rather than specifying a percentage reduction limit, while DNV’s Maritime Nuclear Propulsion white paper [20] does not identify 48.3% as a regulatory ceiling. Accordingly, M2 (48.3%) is retained only as an illustrative scenario derived from the port automation and outsourced deck maintenance concept of Kooij et al. [27], not as a technical or regulatory limit.
3.5.3. Methanol (Bo et al. [1])
The methanol comparison uses the independently published dynamic TCO model of Bo et al. [1] for an Ane Maersk-calibrated 15,000 TEU class methanol dual-fuel container ship operating on the Ningbo–Valencia corridor at an 8% WACC. The reported values are used as published and are not independently reproduced. Reference-vessel characteristics, economic assumptions, and the price- and carbon-parity thresholds reported by Bo et al. are presented with the comparison results later in Section 4.5.1.
3.5.4. Ammonia (Hansen et al. [25])—CAPEX Reference Only
Ammonia is included only as a CAPEX reference using Hansen et al. [25], who examine a 15,000 TEU twin-island vessel. Their study does not provide sufficiently comparable fuel-cost, OPEX, carbon-policy, and full-horizon TCO data for inclusion in the threshold analysis. The relevant vessel characteristics, CAPEX premium, and discount-rate assumption, together with the Seaspan design reference reported by Seatrade Maritime [34], are summarized in Section 4.5.2.
3.5.5. NS Savannah Historical Benchmark
The NS Savannah provides the auxiliary historical benchmark used in the second analytical layer. According to the GAO [6], the vessel’s dedicated servicing facility was designed to support up to ten nuclear ships on a 2.5-year core-life basis. The cost borne by a single vessel therefore reflects a substantial first-of-a-kind infrastructure burden. This historical evidence provides context for considering how scale and learning effects may influence contemporary SMR cost assumptions, but it is not used to recalibrate the modern cost model directly. This $1,162,000/year figure (1965–1968 average; Table 7) is the facility’s full annual operating cost, not a one-tenth per-ship share of a ten-vessel fleet: the GAO report states explicitly that, because the Savannah was the only nuclear merchant vessel ever to enter U.S. service, “the entire cost of these special programs and facilities must be borne by the SAVANNAH as a ‘lone ship system’” [6], and that the per-vessel cost of the nuclear shore staff and servicing facility “would be less if the SAVANNAH were not the only nuclear vessel” they supported [6]. The ten-ship design capacity therefore describes unused capacity in the historical record rather than a basis for cost-sharing, and the figures in Table 7 and Section 4.5.3 should be read as the full lone-ship burden, not a per-ship-amortized cost.
Table 7.
NS Savannah audited cost structure, 1965–1968 average [6,33].
4. Results
The results are presented in five parts, following the research question set out in Section 1. First, the published baseline cost data are recalculated and checked for internal consistency (Section 4.1). The core economic thresholds are then derived (Section 4.2) and examined through sensitivity analyses (Section 4.3). Next, the effects of autonomous operation (MASS) on these thresholds are evaluated (Section 4.4). Finally, the findings are placed in a broader context using alternative-fuel benchmarks and historical evidence from the NS Savannah (Section 4.5).
4.1. Core Model Verification
The CAPEX and OPEX line items reported by Kim et al. [7] were independently recalculated and arithmetically cross-checked against the published figures. The OPEX totals were reproduced, whereas the recalculated CAPEX totals differed from those reported in [7], as documented in Section 3.5.1 and Table 2 and Table 3. Accordingly, the internally reconciled CAPEX totals are retained as the primary inputs for the economic analysis.
Kim et al. [7] report absolute payback periods of approximately 8 years (Best) and 16 years (Worst), representing the time required for each nuclear-powered vessel to recover its own capital investment through its own net cash flows, without comparison to a conventional vessel. Applying Equation (7) to the published CAPEX totals ($644.5 M for Best and $1086.9 M for Worst) yields 7.78 and 15.93 years, respectively, closely reproducing the reported values. Using the internally reconciled CAPEX totals ($684.9 M for Best and $1127.3 M for Worst; Section 3.5.1, Note 2) instead yields 8.38 and 16.84 years, reflecting the higher recalculated capital costs.
These absolute payback periods differ from the incremental breakeven periods reported in Table 8 because they address different investment evaluation questions. Absolute payback measures the recovery of the nuclear vessel’s total capital investment, whereas incremental breakeven evaluates whether the additional investment required for nuclear propulsion can be recovered through the incremental operating cash flows relative to a conventional vessel. The incremental approach is therefore more appropriate for assessing the comparative investment decision examined in this study. Table 8 presents the resulting incremental breakeven periods under a WACC of 5% and an assumed vessel life of 25 years.
Table 8.
Core model breakeven results.
Figure 1 shows the cumulative discounted cash-flow advantage of nuclear propulsion relative to the conventional vessel at WACC = 5%, expressed as Before , the trajectory reflects recovery of the incremental CAPEX through cumulative operating-cash-flow differences only, consistent with Equation (7). The terminal scrap/decommissioning value is incorporated at in accordance with Equation (8). Under the Best scenario, operating-cash-flow breakeven occurs at 11.27 years, whereas under the Worst scenario it occurs at 36.45 years, beyond the assumed 25-year vessel life. The corresponding full-horizon NPV(25) values are +$278.3 M and −$183.8 M, respectively.
Figure 1.
Cumulative discounted cash-flow advantage of nuclear propulsion relative to the conventional vessel at WACC = 5%, expressed as . Before , the trajectory reflects recovery of the incremental CAPEX through cumulative operating-cash-flow differences only, consistent with Equation (7); the terminal scrap/decommissioning value is incorporated at in accordance with Equation (8).
Under the Best scenario, this additional investment is recovered within 11.27 years, well inside the 25-year vessel life. Under the Worst scenario, the 36.45-year incremental breakeven exceeds that vessel life, so the additional capital committed to nuclear propulsion is not recovered through incremental cash flow alone—even though, as shown above, the absolute payback for the same Worst-case scenario remains within 25 years when evaluated on a single-vessel basis. Without discounting, the incremental CAPEX would be recovered in 8.46 years (Best) and 16.62 years (Worst) (Table 8). Discounting at the 5% WACC lengthens these periods to 11.27 and 36.45 years, respectively; the effect is much larger in the Worst scenario because its annual cash-flow advantage is small relative to its incremental CAPEX. The difference arises from the distinct investment evaluation bases rather than a numerical inconsistency: absolute payback assesses the nuclear vessel on a standalone basis, whereas incremental breakeven evaluates the additional investment relative to a conventional vessel. The nuclear-versus-conventional threshold and NPV analyses in Section 4.2, Section 4.3 and Section 4.4 use this incremental basis, while the external benchmarks in Section 4.5 are interpreted according to their respective data sources and comparison limits.
4.2. Core Economic Thresholds
Table 9 reports the four threshold values under the same no-MASS (M0/M0) baseline used in Section 4.1: both the conventional and nuclear vessels are held at MASS stage M0, so the propulsion-related economics are isolated from any autonomous-operation crew-cost assumption. The MASS-neutrality crew-cost threshold, , is instead reported in Section 4.4, where the effect of autonomous operation is introduced and analyzed on its own terms.
Table 9.
Four threshold values under the no-MASS (M0/M0) propulsion-only baseline introduced in Section 4.1.
For the Best scenario, the maximum recoverable incremental whole-vessel CAPEX premium is $761.2 M, leaving $278.3 M of headroom relative to the modeled premium of $482.9 M. In the Worst scenario, the corresponding threshold is $741.5 M, which is $183.8 M below the modeled incremental CAPEX premium of $925.3 M.
The insurance-cost threshold is $20.18 M/year for both nuclear scenarios. This value is approximately 18.3 times the $1.10 M/year land-based nuclear-insurance proxy reported by the U.S. NRC [35] and is substantially higher than the insurance-cost assumptions used in the reproduced model. The NRC-reported figure represents the average annual premium paid by a single-unit land-based reactor licensee, rather than a coverage or liability limit. Thus, the comparison is between insurance premiums, not between a premium and a coverage limit. Nevertheless, land-based and marine nuclear risk profiles differ substantially in their liability frameworks, risk-pooling arrangements, and exposure characteristics. Accordingly, this comparison should be interpreted as an order-of-magnitude reference for the insurance-cost threshold, rather than as a market-calibrated estimate of marine nuclear-insurance premiums.
The calculated carbon-price thresholds are negative, at −$53.0/tCO2 in the Best scenario and −$37.1/tCO2 in the Worst scenario. These results indicate that no non-negative carbon price is required to maintain the modeled nuclear OPEX advantage. Even at a carbon price of zero, nuclear OPEX remains below that of the conventional vessel under the no-MASS (M0/M0) baseline reported in Table 9. However, these thresholds are defined solely by annual OPEX parity and exclude the assumed carbon-credit revenue attributed to the nuclear vessel in [7]. They should therefore not be interpreted as carbon-price thresholds for full-horizon NPV parity, which would also depend on the treatment of carbon-credit revenue.
As a complementary test of the same OPEX advantage from the fossil-fuel side, the conventional vessel’s annual VLSFO cost of $17.12 M would need to decline by 89.1% in the Best scenario and 80.9% in the Worst scenario for OPEX parity to be reached. These results are reported as supplementary reference values rather than as a fifth core threshold, because they examine the same operating-cost advantage from a different cost perspective.
The WACC threshold is 10.61% in the Best scenario and 2.72% in the Worst scenario. Relative to the assumed WACC of 5%, the Best scenario retains a positive margin of 5.61 percentage points, whereas the assumed WACC in the Worst scenario exceeds its economic viability threshold by 2.28 percentage points. Figure 2 compares the modeled values with their corresponding economic thresholds, illustrating the margins between the baseline assumptions and the critical values.
Figure 2.
Current values versus threshold values for three numerical thresholds (, , and ), evaluated at a baseline WACC of 5%. The terminal scrap/decommissioning value is included in the full-horizon NPV-based thresholds. Because is negative, it is omitted from the positive-valued axis and discussed separately in the text. Lighter bars represent the current assumed values, while darker bars represent the corresponding threshold values. Gray bars indicate the baseline WACC of 5% in panel (c).
4.3. Robustness of the Threshold Results
A probabilistic characterization of the five thresholds would be more decision-relevant than point estimates alone. However, key inputs required for Monte Carlo simulation—including the whole-vessel CAPEX premium, nuclear insurance premium, and nuclear crew-cost reduction rate—are based on single-source estimates, proxies, or extrapolated assumptions for which empirically supported probability distributions are unavailable (Table 2, Note 1; Table 4; Section 3.5). Assigning arbitrary probability distributions to these inputs could create a misleading impression of quantified uncertainty. Accordingly, this study employs deterministic one-way (tornado) sensitivity analysis. Each of the five variables is varied individually over a range derived from the published literature, source-based scenario assumptions, or explicitly defined robustness bands, while the remaining inputs are held at their Table 9 baseline values (M0/M0).
The CAPEX premium range combines the DNV [20] Low-Nuclear estimate (+12%) and the EMSA [21] High scenario (+894%), which are based on different methodologies. The WACC range (2–8%) and nuclear insurance premium range (±50%) are exploratory robustness bands rather than empirically estimated confidence intervals. The nuclear crew-cost reduction range (0–100%, M0–M4) is adapted from [27] and applied as an exploratory scenario assumption rather than an empirically validated range for nuclear-powered container ships. For the carbon-price sensitivity, only the conventional vessel’s carbon tax expenditure is varied over $0–380/tCO2, while the nuclear vessel’s assumed carbon-credit revenue is held constant. The resulting changes in full-horizon NPV(25) are presented in Table 10.
Table 10.
Deterministic one-way sensitivity of full-horizon NPV(25) to five economic variables.
As shown in Table 10 and Figure 3, within the specified sensitivity ranges, the whole-vessel CAPEX premium produces the largest variation in NPV(25), followed by carbon price and WACC. Nuclear insurance premiums and crew-cost reductions show smaller NPV swings under their respective assumed ranges. This ranking is consistent across the Best and Worst scenarios. However, because the sensitivity ranges differ in both magnitude and evidentiary basis, the ranking should be interpreted as conditional on the selected ranges rather than as a universal measure of each variable’s economic importance.
Figure 3.
Deterministic one-way (tornado) sensitivity of full-horizon NPV(25) to five economic variables under the Table 9 baseline (M0/M0), for the Best and Worst scenarios. Dashed lines indicate baseline NPV(25), and bars represent the NPV variation across the specified sensitivity ranges.
Using the freight-revenue figures reported by [7], a robustness check identifies the annual incremental freight revenue required for full-horizon NPV(25) to reach zero, with other inputs held constant. The thresholds are $11.49 M/year (Best) and $44.28 M/year (Worst), compared with the baseline differential of $31.24 M/year. These represent conditional decreases of approximately 63% and increases of 42%, respectively, rather than freight-rate forecasts. The CAPEX and WACC thresholds in Table 9 are also conditional on this baseline freight-revenue assumption.
The baseline model incorporates two distinct carbon-policy benefits: $10.58 M/year in carbon tax expenditure for the conventional vessel and $10,578,743/year in assumed carbon-credit revenue for the nuclear vessel. Although these items are accounted for separately, both contribute to the nuclear vessel’s incremental cash-flow advantage, increasing its dependence on the assumed carbon-policy framework. This dependence is particularly important because Ref. [7] notes that the modeled carbon-credit revenue mechanism is not currently available for the route considered. Table 11 therefore examines three carbon-accounting treatments by recalculating ΔCF, full-horizon NPV(25), and operating-cash-flow breakeven periods while holding all other inputs constant.
Table 11.
Sensitivity of incremental cash flow, NPV(25), and breakeven period to carbon-policy assumptions.
Removing only the nuclear carbon-credit revenue leaves the Best scenario NPV-positive (+$129.2 M), whereas the Worst scenario has no finite operating-cash-flow breakeven period. When both the carbon credit and conventional carbon tax are removed, the Best-case NPV(25) becomes negative (−$19.9 M), despite achieving operating-cash-flow breakeven within 25 years (22.87 years). This difference arises because the full-horizon NPV includes terminal decommissioning costs, whereas the operating-cash-flow breakeven calculation excludes terminal values. Thus, the nuclear OPEX advantage identified in Section 4.2 does not necessarily imply a positive full-horizon NPV, highlighting the dependence of economic viability on the assumed carbon-policy framework.
4.4. Effect of Autonomous Operation (MASS)
The MASS comparison fixes the conventional vessel at M4 (δ = 100%) and varies nuclear crew-cost reduction across M0–M4. This setup reflects the possibility of full unmanning for conventional vessels while avoiding an assumed numerical ceiling for future nuclear-ship manning, for which no equivalent regulatory or empirical basis is available (Section 2.3 and Section 3.5.2). M2 (δ = 48.3%) is retained only as an illustrative reference point. The resulting unmanning sensitivity is reported in Table 12.
Table 12.
MASS crew-cost sensitivity with the conventional vessel fixed at M4.
As nuclear crew-cost reduction increases from M0 to M4, the annual incremental cash-flow advantage rises from $54.67 M to $58.51 M in the Best scenario and from $53.27 M to $57.11 M in the Worst scenario. The corresponding breakeven periods decrease from 11.94 to 10.91 years and from 41.58 to 34.05 years, respectively. Nevertheless, the Worst scenario does not achieve incremental breakeven within the assumed 25-year vessel life at any MASS stage examined. The key boundary is the 62.5% MASS-neutrality threshold, at which the original pre-MASS incremental cash-flow advantage is restored. The illustrative M2 reduction (48.3%) remains 14.2 percentage points below this threshold, whereas M3 (66.6%) and M4 (100%) exceed it.
However, these staged reductions do not establish an achievable upper limit for nuclear-powered vessels. Kooij et al. [27] examine automation of conventional shipboard functions, whereas nuclear propulsion requires specialized personnel for reactor operation and radiation safety [7]. Because Ref. [7] does not disaggregate the nuclear vessel’s annual crew cost of $3.84 M into general and nuclear-specific functions, the proportion potentially reducible through automation cannot be independently verified. DNV [20] discusses future nuclear-vessel manning without assuming a substantial increase in crew size relative to conventional vessels, but this does not establish a minimum crew cost or maximum achievable reduction. Likewise, the reviewed regulatory and classification-related guidance [36,37,38,39,40] does not establish a universally applicable numerical crew minimum or crew-cost floor for autonomous nuclear-powered container ships.
As an illustrative conservative benchmark, this study assumes that nuclear crew costs could be reduced from $3.84 M/year to the conventional vessel’s baseline crew cost of $2.40 M/year, implying a 37.5% reduction. This study-defined benchmark is informed by DNV [20] but does not represent an empirically verified or legally mandated limit. Table 13 presents selected crew-cost reduction scenarios, highlighting the illustrative 37.5% benchmark, M2 (48.3%), and the 62.5% MASS-neutrality threshold.
Table 13.
Sensitivity of economic outcomes to selected nuclear crew-cost reduction rates.
At the illustrative 37.5% reduction level, the annual incremental cash-flow advantage remains below its pre-MASS level in both scenarios. Although higher crew-cost reductions improve economic performance, the original cash-flow advantage is restored only at the 62.5% threshold. These results illustrate the sensitivity of nuclear propulsion economics to achievable crew-cost reductions, while the practical feasibility of reaching this threshold remains uncertain.
4.5. External Comparison: Alternative Fuels and Historical Benchmark
4.5.1. Economic Benchmark Comparison with Methanol
The methanol comparison uses the dynamic TCO model reported by Bo et al. [1] for an Ane Maersk-calibrated 15,000 TEU class methanol dual-fuel container ship operating on the Ningbo–Valencia corridor via the Suez Canal. The reference case assumes 44,187 kW propulsion power, a service speed of 21 kn, seven round trips per year, and annual bidirectional cargo volume of 147,000 TEU.
The reported CAPEX premium is +20%, the annual insurance-and-maintenance rate is 2.5% of newbuild price, the OPEX premium is +5%, and the discount rate is 8%. Annual fuel consumption is 50,788 t for VLSFO and 112,114 t for methanol, with baseline fuel prices of $600/t and $1500/t, respectively. Methanol price is assumed to decline by 3% annually, while the EU ETS carbon price begins at €73.5/tCO2 and increases by 5% per year.
Under these assumptions, Bo et al. [1] report that the 15-year present-value TCO of the green-methanol case is 134.4% higher than that of the VLSFO case. Across their 5000 Monte Carlo simulations, no draw achieves a cumulative discounted cost advantage at the 15-, 25-, or 30-year horizon. With other baseline assumptions held constant, cost parity requires either an initial methanol price of approximately $467.67/t, 68.8% below the $1500/t baseline, or an EU ETS carbon price of approximately €916.24/tCO2, about 12.5 times the baseline value. These results are used as reported in [1]. This comparison is summarized in Table 14.
Table 14.
Economic benchmarks for nuclear and methanol propulsion.
Although the reported methanol CAPEX premium (+20%) is substantially lower than that of nuclear propulsion (+239% to +458%), the methanol case does not achieve a discounted cost advantage over VLSFO in any of the 5000 simulated outcomes at the evaluated horizons [1]. In contrast, the nuclear Best scenario reaches operating-cash-flow breakeven in 11.27 years and yields a positive 25-year NPV (+$278.3 M), whereas the Worst scenario remains NPV-negative (−$183.8 M). This comparison highlights the importance of considering operating costs and long-term economic outcomes alongside initial CAPEX premiums. However, differences in routes, operating assumptions, discount rates, evaluation periods, and modeling methods preclude a direct ranking of the two technologies.
A separate MASS analysis is not applied to the methanol comparison because crew costs are treated symmetrically between the methanol and VLSFO cases in Bo et al. [1]. Unlike the nuclear comparison, the reported model therefore does not support an equivalent asymmetric MASS-neutrality threshold.
4.5.2. Ammonia CAPEX Reference
The ammonia comparison is based on Hansen et al. [25], who examine a 15,000 TEU twin-island reference container vessel and estimate that an ammonia–fuel-oil dual-fuel newbuild would cost approximately 16% more than a standard fuel-oil newbuild. This newbuild cost premium is lower than the +20% methanol premium reported in Bo et al. [1] and substantially below the +239–458% nuclear CAPEX premium examined in the present study. However, Hansen et al. [25] focus on vessel preparation and conversion economics and do not provide a complete fuel-cost, OPEX, carbon-policy, and full-horizon TCO structure comparable to those available for the nuclear and methanol cases. Ammonia is therefore retained solely as an external capital-cost reference and is not used to infer TCO recoverability or a breakeven threshold.
As an additional design reference, Seatrade Maritime [34] reports that the 15,000 TEU ammonia dual-fuel container ship design developed by Seaspan, the Mærsk Mc-Kinney Møller Center for Zero Carbon Shipping, and Foreship received ABS Approval in Principle in 2023 and subsequently attracted interest from liner operators. The report, however, provides design and development information rather than quantitative CAPEX or OPEX estimates. All numerical values used in this subsection are treated as [OBS] and cited as reported.
4.5.3. Qualitative Cross-Check with the NS Savannah Benchmark
The CPI-adjusted nuclear-specific excess operating cost of the NS Savannah is $18.92 M/year (Table 7). In the reproduced contemporary model, incremental security, nuclear-waste disposal, and insurance costs relative to the conventional vessel total approximately $15.5 M/year in the Best case and $16.9 M/year in the Worst case.
The similarity in order of magnitude does not establish direct validation. The two cases differ substantially in reactor technology, regulation, operating practice, and cost classification. The historical comparison is used only as a plausibility check indicating that nuclear-specific support, safety, and risk-related expenditures can remain economically material.
The Savannah data also reveal a structural difference between the two cost frameworks. Its dedicated servicing facility represents approximately $11.75 M/year in June 2026 CPI-adjusted terms, whereas the reproduced contemporary model contains no directly equivalent cost category. A one-to-one mapping between the historical and modern cost structures is therefore not possible.
5. Discussion
5.1. RQ1: Conditions for the Nuclear Economic Advantage
The threshold results show that the economic position of the Best and Worst nuclear cases differs markedly. Under the Best scenario, the modeled CAPEX premium could increase by a further $278.3 M before reaching the 25-year recoverability threshold, while the discount rate could rise by 5.61 percentage points above the assumed 5% WACC. The crew-reduction threshold, however, is not reached under the illustrative M2 assumption discussed in Section 4.4.
The Worst scenario lies beyond both its CAPEX and discount-rate thresholds. To restore economic viability within the model, the CAPEX premium would need to fall by at least $183.8 M, or the cost of capital would need to decline to approximately 2.72% or below. These results indicate that the economic case for nuclear propulsion is particularly sensitive to realized capital cost and financing conditions. These results are conditional on the annual freight-revenue differential reported by Kim et al. [7]. The separate robustness check in Section 4.3 indicates that, with other model inputs held constant, the Best scenario’s differential NPV would become negative if the assumed freight-revenue advantage decreased by approximately 63%, whereas the Worst scenario’s differential NPV would become positive if that advantage increased by approximately 42%. These are conditional reversal thresholds, not estimates of the likelihood of such revenue changes.
5.2. RQ2: Insurance and Carbon-Price Thresholds
The modeled insurance assumption remains well below the calculated insurance threshold. The nuclear insurance values used in the reproduced model are approximately 4.5–5.75 times the land-based proxy, whereas the OPEX-parity threshold is about 18.3 times that proxy. Within the present cost structure, this leaves substantial modeled headroom before insurance costs eliminate the nuclear operating-cost advantage.
This result should not be interpreted as a prediction of future marine nuclear-insurance prices. A mature commercial insurance market for nuclear-powered merchant ships does not yet exist, and the insurance values inherited from [7] are modeling assumptions rather than observed market premiums. The threshold is therefore best understood as a model-implied tolerance boundary.
The carbon-price result is structurally different. No non-negative carbon-price threshold is found because nuclear OPEX remains below that of the conventional comparator even at a zero carbon price. OPEX parity would require a negative carbon price under the assumptions used here. Positive carbon pricing strengthens the relative operating-cost position of nuclear propulsion but is not necessary for the modeled OPEX advantage to exist. This conclusion concerns operating-cost parity rather than full-horizon investment viability. When both the conventional vessel’s carbon tax and the nuclear vessel’s assumed carbon-credit revenue are removed, the nuclear OPEX advantage remains positive but decreases substantially, while the Best scenario’s 25-year differential NPV becomes negative (−$19.9 million) after accounting for the full investment and terminal-value effects (Section 4.3, Table 11).
The companion VLSFO calculation leads to the same conclusion from the conventional-fuel side. Conventional fuel cost would have to fall by 89.1% in the Best case or 80.9% in the Worst case before the nuclear OPEX advantage disappears. Together, the carbon-price and VLSFO thresholds indicate that the modeled nuclear OPEX advantage persists under substantial reductions in these variables. Separately, the NPV sensitivity analysis in Section 4.3 highlights the importance of CAPEX and financing conditions for full-horizon investment viability.
The carbon-price thresholds examined in this study reflect private operating-cost differences rather than the broader social benefits of avoided emissions. As demonstrated by Lu et al. [41] in their assessment of avoided external energy costs from renewable electricity generation, environmental externalities provide an additional perspective for evaluating low-carbon energy transitions. However, quantifying such external benefits for nuclear-powered shipping is beyond the scope of the present analysis.
5.3. RQ3: Asymmetric Effect of Autonomous Operation
The MASS analysis shows that automation does not affect nuclear and conventional vessels symmetrically. In the comparison used here, the conventional vessel is assumed to reach M4 and eliminate crew cost entirely, while nuclear crew-cost reduction is varied across M0–M4. The resulting economic effect depends on how far nuclear manning can also be reduced.
When nuclear crew-cost reduction remains below the 62.5% MASS-neutrality threshold, the pre-MASS cash-flow advantage of nuclear propulsion is reduced. At exactly 62.5%, the original relative advantage is restored, and reductions above that level increase it beyond the pre-MASS value. Among the stages examined, M3 and M4 exceed the threshold, while the illustrative M2 case remains 14.2 percentage points below it.
The result does not imply that 62.5% is a technically or legally achievable target. No verified nuclear-specific regulatory ceiling on unmanning was identified in the sources reviewed. The threshold is instead an economic boundary: it identifies the degree of nuclear crew-cost reduction required to prevent conventional-vessel automation from eroding the original relative advantage.
This distinction matters because autonomy is often treated as an unqualified source of operating-cost reduction. For nuclear propulsion, however, the economic effect depends on the extent to which total crew costs can be reduced while maintaining the specialized reactor-operation and safety functions required. Future nuclear-manning regulation may therefore influence the economics of autonomous nuclear shipping as directly as the underlying automation technology itself.
5.4. RQ4: Implications of the Economic Benchmark Comparison with Methanol
The external benchmark comparison highlights differences in the economic assumptions and reported outcomes of nuclear and methanol propulsion. The methanol case in Bo et al. [1] has a substantially lower CAPEX premium but does not achieve a discounted cost advantage over VLSFO within the evaluated horizons, whereas the nuclear Best scenario recovers its incremental investment within the assumed 25-year vessel life.
These findings highlight the importance of considering operating costs and long-term economic outcomes alongside initial CAPEX premiums. However, the two studies differ in routes, vessel speeds, discount rates, fuel-price assumptions, policy treatment, and modeling methods. Their results therefore cannot establish a direct economic ranking of the two propulsion technologies.
The methanol study [1] reports that cost parity would require either a substantial reduction in methanol prices or a large increase in carbon prices. Separately, the present nuclear model indicates that its annual OPEX advantage persists at zero carbon price. Because these findings concern different economic criteria, they are presented as study-specific benchmarks rather than directly comparable parity thresholds.
5.5. Position Relative to Existing Literature
The results extend earlier nuclear-ship economic studies in a specific way. Although previous studies have reported scenario-based economic outcomes and identified breakeven conditions for selected operational variables, systematic analysis of economic reversal thresholds across capital costs, financing conditions, nuclear insurance, and carbon pricing remains limited. The present study contributes by explicitly deriving these thresholds under their respective economic criteria.
This distinction is most evident in the CAPEX, WACC, carbon-price, and crew thresholds. A Best/Worst comparison can show that outcomes differ across assumptions, but it does not indicate how much additional CAPEX can be absorbed, how far financing costs can rise, or at what crew-reduction level the effect of automation changes direction. The threshold approach makes these boundaries explicit.
Two findings are especially difficult to see from point estimates alone. First, the carbon-price threshold is negative, showing that the modeled nuclear OPEX advantage exists even without positive carbon pricing. Second, the MASS-neutrality threshold is 62.5% under the assumed crew-cost structure. Below this threshold, the pre-MASS incremental cash-flow advantage is reduced; at the threshold, it is restored; and above it, the advantage increases.
The external methanol benchmark provides an additional perspective by highlighting the importance of long-term economic outcomes alongside initial CAPEX premiums, while acknowledging differences in study assumptions. The contribution is therefore not a single estimate of whether nuclear propulsion is economical, but a set of boundary conditions showing when that conclusion holds and when it changes.
5.6. Limitations
Several limitations should be considered when interpreting the results.
First, the analysis is limited to a single vessel type and operating pattern: a 15,000 TEU container ship operating in scheduled liner service. Container and dry bulk shipping differ systematically in chartering arrangements, route flexibility, and operating patterns, particularly between liner and tramp services. Therefore, the reported threshold values should not be extrapolated to other vessel types or operating segments without re-estimation. Future research should extend the present framework to dry bulk carriers and other tramp-operated vessels to examine whether the threshold values and their relative ranking remain consistent across different shipping segments and operating conditions.
Second, the reported thresholds are deterministic estimates derived from specific assumptions regarding CAPEX, insurance, crew costs, fuel prices, and freight revenue, based primarily on Kim et al. [7] and the cited industry sources. Reliable empirical probability distributions for key inputs, particularly commercial-scale marine SMR capital costs and nuclear insurance premiums, are not yet available. Assigning arbitrary distributions could therefore create a misleading impression of quantified uncertainty. Accordingly, this study employs deterministic one-way sensitivity analysis (Section 4.3, Figure 3) rather than a full Monte Carlo simulation. The annual freight-revenue differential is examined separately through conditional reversal thresholds because its empirical variation range cannot be established from the disclosed source data. Likewise, the MASS analysis (Section 4.4) uses selected crew-cost reduction scenarios, including an illustrative 37.5% benchmark that does not represent a verified technical or regulatory limit. The resulting thresholds should therefore be interpreted as conditional economic boundaries rather than probabilistic forecasts. Future research should incorporate stochastic methods when reliable empirical cost and operational data become available.
Third, the present study focuses on the economic conditions under which nuclear propulsion may become competitive and does not constitute a comprehensive sustainability assessment. Environmental lifecycle impacts, safety and regulatory requirements, and broader social considerations are outside the scope of the present analysis. These dimensions should be incorporated into future research to provide a more comprehensive assessment of nuclear propulsion within the broader transition toward lower-carbon shipping.
6. Conclusions
This study examined the economic conditions under which a 15,000 TEU SMR-powered container ship maintains or loses its relative economic competitiveness compared with a conventional vessel. Using an independently reproduced and internally reconciled CAPEX/OPEX dataset from Kim et al. [7], the analysis first derived four core economic thresholds—the CAPEX premium, nuclear insurance cost, carbon price, and WACC—under a propulsion-only baseline in which neither vessel adopts autonomous-operation crew reduction (M0/M0), over a 25-year investment horizon. It then examined, as a separate additional effect, how autonomous (MASS) crew-cost reduction shifts this picture, deriving the complementary MASS-neutrality threshold, , at which nuclear crew-cost savings restore the pre-MASS incremental cash-flow advantage. The economic evaluation is conducted on a differential (incremental) basis relative to the conventional vessel rather than as an absolute single-vessel assessment. Section 4.1 shows that this differential framing, applied to the same reconciled dataset, is suited to a comparative, vessel-against-vessel investment decision, consistent with—but evaluated on a different basis than—the absolute single-vessel payback reported by Kim et al. [7].
The results indicate that the economic viability of nuclear propulsion is particularly sensitive to capital and financing conditions. Under the Best scenario, the incremental investment is recovered within the assumed vessel life, and the project retains substantial headroom relative to both the CAPEX and WACC thresholds. By contrast, under the Worst scenario, the assumed CAPEX premium and WACC both exceed their respective threshold values, indicating that reductions in capital cost, financing cost, or both would be required to restore economic parity with the conventional vessel. These Worst-case and Best-case outcomes are, in turn, conditional on the freight-revenue totals reported by the source dataset [7], which this study reproduces as published rather than independently re-deriving (Section 3.5.1), with the corresponding freight-revenue reversal thresholds quantified separately in Section 4.3.
The operating-cost results are comparatively favorable. The calculated carbon-price thresholds are negative, indicating that no positive carbon price is required to preserve the modeled nuclear OPEX advantage. The companion VLSFO threshold analysis further shows that conventional bunker-fuel prices would need to decline substantially before OPEX parity is reached. The nuclear-insurance threshold also remains well above the insurance cost assumed in the model, although actual future marine nuclear-insurance premiums remain highly uncertain.
Autonomous operation introduces an additional source of uncertainty. Under the assumed asymmetric manning structure, the nuclear vessel requires a 62.5% reduction in crew cost to preserve its pre-MASS relative cash-flow advantage when the conventional vessel is assumed to achieve full crew-cost elimination. This threshold should be interpreted as an economic neutrality boundary within the model rather than as a forecast of technically feasible or regulatorily permissible nuclear manning levels.
The external benchmark comparison with methanol illustrates that a smaller initial CAPEX premium does not necessarily translate into stronger long-term economic performance. Although the reference methanol case has a substantially lower CAPEX premium than the nuclear cases, it does not achieve a discounted cost advantage over VLSFO within its evaluated horizons, whereas the nuclear Best case reaches incremental operating-cash-flow breakeven within the assumed vessel life. Because the underlying studies differ in routes, operating conditions, discount rates, and model structures, this comparison should be interpreted as a contrast in reported economic outcomes rather than as a direct ranking of propulsion technologies. Ammonia is retained only as an external CAPEX benchmark because sufficiently comparable full-horizon cost data are not available.
The principal contribution of this study is the identification of explicit economic boundaries rather than a single binary conclusion regarding the viability of nuclear propulsion. This contribution rests on three elements: an independently recalculated CAPEX/OPEX dataset that documents discrepancies between the published and recalculated capital-cost totals and evaluates their effect on the economic conclusions (Section 3.5.1); a differential (incremental) evaluation framework that measures nuclear propulsion’s additional capital and cash flow against the conventional vessel rather than in absolute single-vessel terms (Section 4.1); and the threshold analysis itself, which converts these reconciled, differential figures into explicit boundary conditions for the four core economic threshold variables (Section 4.2) and, as a separate additional analysis, the MASS crew-cost reduction threshold (Section 4.4). The threshold framework quantifies the conditions under which investment viability, operating-cost parity, and the relative cash-flow effects of automation change under their respective evaluation criteria. It therefore provides a transparent basis for assessing the robustness of the economic case for nuclear-powered merchant shipping and for identifying the conditions under which nuclear propulsion could become economically viable as part of the maritime sector’s transition toward lower-carbon shipping.
Future research should prioritize empirically observed marine nuclear-insurance costs, nuclear-specific manning requirements, and more mature reactor and shipbuilding cost data. The framework should also be extended to other vessel types and operating patterns, including dry bulk carriers operating in tramp service, to examine whether the reported threshold relationships generalize beyond a single container ship operating in liner service. A further extension would be to move from deterministic point thresholds to probabilistic threshold distributions using Monte Carlo simulation or other stochastic methods. Finally, evaluating nuclear, methanol, ammonia, and other low-carbon propulsion options within a common vessel, route, operating, and financing framework would provide a stronger basis for direct comparative assessment.
More broadly, by identifying the specific economic conditions under which nuclear propulsion could become commercially competitive, this study provides evidence relevant to the maritime sector’s sustainable development objectives, including SDG 7 (Affordable and Clean Energy), SDG 9 (Industry, Innovation, and Infrastructure), and SDG 13 (Climate Action). Specifically, it clarifies the capital-cost, financing, insurance, and crewing conditions that may influence the commercial adoption of nuclear propulsion alongside alternative-fuel and automation pathways, while recognizing that its broader environmental and social sustainability implications require separate assessment.
Supplementary Materials
The following supporting information can be downloaded at: https://www.mdpi.com/article/10.3390/su182110829/s1. Table S1: Variable master data (variable_master_data.xlsx); Software S2: Core economic model (threshold_simulation.py); Software S3: Figure generation (generate_figures.py); Software S4: Sensitivity analysis (sensitivity_analysis.py); Software S5: Tornado-chart regeneration (fig_tornado_regenerate.py).
Author Contributions
Conceptualization, S.K.; methodology, S.K. and H.S.; software, H.S.; formal analysis, S.K. and H.S.; writing—original draft preparation, S.K. and H.S.; writing—review and editing, S.K. and H.S.; supervision, S.K. All authors have read and agreed to the published version of the manuscript.
Funding
This work was supported by the National University Development Project of Mokpo National Maritime University, funded by the Ministry of Education in 2026.
Institutional Review Board Statement
Not applicable.
Informed Consent Statement
Not applicable.
Data Availability Statement
The data and computational materials supporting the findings of this study are provided in the Supplementary Materials.
Acknowledgments
ChatGPT (OpenAI, GPT-5.6 Sol) was used solely to improve English expression, readability, and academic writing style.
Conflicts of Interest
The authors declare no conflicts of interest.
Abbreviations
| CAPEX | Capital expenditure |
| OPEX | Operating expenditure |
| NPV | Net present value |
| IRR | Internal rate of return |
| WACC | Weighted average cost of capital |
| SMR | Small modular reactor |
| TCO | Total cost of ownership |
| MASS | Maritime autonomous surface ship(s) |
| VLSFO | Very-low-sulfur fuel oil |
| TEU | Twenty-foot equivalent unit |
References
- Bo, K.; Cai, L.; Zhang, D. Dynamic total cost of ownership assessment of methanol dual-fuel container ships in the Ningbo–Zhoushan–Valencia green shipping corridor. Sustainability 2026, 18, 7905. [Google Scholar] [CrossRef] [Scilit]
- Diamantakis, N.; Xynopoulos, N.; Sheth, J.; Andresen, J.; Maroto-Valer, M. Alternative maritime fuels for net-zero shipping: A comprehensive operational, techno-economic and regulatory review. Hydrogen 2026, 7, 36. [Google Scholar] [CrossRef] [Scilit]
- Vergara, J.; McKesson, C.; Walczak, M. Sustainable energy for the marine sector. Energy Policy 2012, 49, 333–345. [Google Scholar] [CrossRef] [Scilit]
- Freire, L.O.; de Andrade, D.A. Historic survey on nuclear merchant ships. Nucl. Eng. Des. 2015, 293, 176–186. [Google Scholar] [CrossRef] [Scilit]
- Schøyen, H.; Steger-Jensen, K. Nuclear propulsion in ocean merchant shipping: The role of historical experiments to gain insight into possible future applications. J. Clean. Prod. 2017, 169, 152–160. [Google Scholar] [CrossRef] [Scilit]
- U.S. General Accounting Office. Costs of Operating the Nuclear Merchant Ship Savannah; Report to the Congress, B-136209; Maritime Administration, Department of Commerce: Washington, DC, USA, 1970.
- Kim, K.; Kwon, C.; Kim, S. A conceptual study of 15,000 TEU SMR-powered containerships. Int. J. Nav. Archit. Ocean Eng. 2025, 17, 100662, Corrigendum in Int. J. Nav. Archit. Ocean Eng. 2025, 17, 100686. https://doi.org/10.1016/j.ijnaoe.2025.100686. [Google Scholar] [CrossRef] [Scilit]
- Locatelli, G.; Guglielmetti, N.; Dei, G.; Skliarenko, V. The economics of nuclear propulsion for containerships. Prog. Nucl. Energy 2026, 196, 106312. [Google Scholar] [CrossRef] [Scilit]
- Carlton, J.S.; Smart, R.; Jenkins, V. The nuclear propulsion of merchant ships: Aspects of engineering, science and technology. J. Mar. Eng. Technol. 2011, 10, 47–59. [Google Scholar] [CrossRef] [Scilit]
- Namikawa, S.; Maerli, M.B.; Hoffmann, P.N.; Brodin, E. Nuclear powered ships—Findings from a feasibility study. In Proceedings of the 19th International Conference on Nuclear Engineering (ICONE19), Osaka, Japan, 24–25 October 2011; Paper No. ICONE19-43821. [Google Scholar] [CrossRef] [Scilit]
- Gravina, J.; Blake, J.I.R.; Shenoi, A.; Turnock, S.R.; Hirdaris, S. Concepts for a modular nuclear powered containership. In Proceedings of the NAV International Conference on Ship and Shipping Research, Naples, Italy, 1 October 2013. [Google Scholar]
- Hirdaris, S.E.; Cheng, Y.F.; Shallcross, P.; Bonafoux, J.; Carlson, D.; Prince, B.; Sarris, G.A. Considerations on the potential use of Nuclear Small Modular Reactor (SMR) technology for merchant marine propulsion. Ocean Eng. 2014, 79, 101–130. [Google Scholar] [CrossRef] [Scilit]
- Freire, L.O.; de Andrade, D.A. Economically feasible mobile nuclear power plant for merchant ships and remote clients. Nucl. Technol. 2019, 205, 766–780. [Google Scholar] [CrossRef] [Scilit]
- de Vries, N.; Houtkoop, K.; Leurs, Z. The potential of next generation nuclear power for marine propulsion of commercial vessels. In Proceedings of the 15th International Marine Design Conference (IMDC-2024), Delft, The Netherlands, 2–6 June 2024. [Google Scholar] [CrossRef] [Scilit]
- Kim, S.-G.; Mugabi, J.; Jeong, J.-H. Feasibility and readiness of next-generation small modular reactors for marine decarbonization: A technical, economic, and societal review. Prog. Nucl. Energy 2026, 198, 106459. [Google Scholar] [CrossRef] [Scilit]
- DNV. HD KSOE Awarded DNV AiP for SMR-powered container vessel design. DNV News, October 2025. Available online: https://www.dnv.com/news/2025/hd-ksoe-awarded-dnv-aip-for-smr-powered-container-vessel-design/ (accessed on 2 August 2026).
- Lloyd’s Register; LucidCatalyst. Power Shift: Nuclear Power Pathways for Future Containership Fleets; Commissioned Report; Seaspan Corporation Pte. Ltd.: Singapore, 2025; Available online: https://www.lr.org/en/knowledge/case-studies/power-shift-nuclear-power-pathways-for-future-containership-fleets/ (accessed on 2 August 2026).
- Duong, P.A.; Ha, J.; Lee, C.; Kang, H. Nuclear propulsion for merchant ships: A path to sustainable maritime energy. Int. J. Sustain. Energy 2025, 44, 2579469. [Google Scholar] [CrossRef] [Scilit]
- Lloyd’s Register. Navigating Nuclear Energy in Maritime: Initial Considerations for Nuclear Ships and Offshore (LR0043); Lloyd’s Register Group: London, UK, 2025; Available online: https://www.lr.org/en/knowledge/research-reports/2025/navigating-nuclear-energy-in-maritime/ (accessed on 2 August 2026).
- DNV. Maritime Nuclear Propulsion: Technologies, Commercial Viability, and Regulatory Challenges for Nuclear-Powered Vessels; Reistad, O.C., Ovrum, E., Stensrud, E., Sagbakken Ness, A.S., Eds.; White Paper; DNV: Høvik, Norway, 2025; Available online: https://www.dnv.com/maritime/publications/maritime-nuclear-propulsion-download/ (accessed on 6 October 2026).
- European Maritime Safety Agency. Potential Use of Nuclear Power for Shipping; EMSA: Lisbon, Portugal, 2024; Available online: https://www.emsa.europa.eu/publications/reports/item/5366-potential-use-of-nuclear-power-for-shipping.html (accessed on 6 October 2026).
- Holman Fenwick Willan (HFW). Shipping’s Nuclear Option in the Move Towards Net Zero: Is It Viable? November 2023. Available online: https://www.hfw.com/insights/Shippings-nuclear-option-in-the-move-towards-net-zero-Is-it-viable/ (accessed on 2 August 2026).
- Jang, J. A study on the current situation and necessity of nuclear powered ship. J. Korea Acad.-Ind. Coop. Soc. 2024, 25, 322–328. [Google Scholar] [CrossRef] [Scilit]
- Kim, S. Assessment of the introduction of nuclear-powered merchant vessels in the decarbonization era. Marit. Bus. 2024, 60, 23–45. Available online: https://www.riss.kr/link?id=A109523202.
- Hansen, C.R. Preparing Container Vessels for Conversion to Green Fuels; Mærsk Mc-Kinney Møller Center for Zero Carbon Shipping: Copenhagen, Denmark, 2022; Available online: https://www.zerocarbonshipping.com/publications/preparing-container-vessels-for-conversion-to-green-fuels (accessed on 2 August 2026).
- Schreuder, W.; Slootweg, J.C.; van der Zwaan, B. Techno-economic assessment of low-carbon ammonia as fuel for the maritime sector. Appl. Energy Combust. Sci. 2025, 22, 100330. [Google Scholar] [CrossRef] [Scilit]
- Kooij, C.; Kana, A.A.; Hekkenberg, R.G. A task-based analysis of the economic viability of low-manned and unmanned cargo ship concepts. Ocean Eng. 2021, 242, 110111. [Google Scholar] [CrossRef] [Scilit]
- Kretschmann, L.; Burmeister, H.-C.; Jahn, C. Analyzing the economic benefit of unmanned autonomous ships: An exploratory cost-comparison between an autonomous and a conventional bulk carrier. Res. Transp. Bus. Manag. 2017, 25, 76–86. [Google Scholar] [CrossRef] [Scilit]
- Ziajka-Poźnańska, E.; Montewka, J. Costs and benefits of autonomous shipping—A literature review. Appl. Sci. 2021, 11, 4553. [Google Scholar] [CrossRef] [Scilit]
- Akbar, A.; Aasen, A.K.A.; Msakni, M.K.; Fagerholt, K.; Lindstad, E.; Meisel, F. An economic analysis of introducing autonomous ships in a short-sea liner shipping network. Int. Trans. Oper. Res. 2021, 28, 1740–1764. [Google Scholar] [CrossRef] [Scilit]
- United Kingdom. The Merchant Shipping (Nuclear Ships) Regulations 2022, SI 2022/1169, Regulation 18(1)(b); His Majesty’s Stationery Office: London, UK, 2022. Available online: https://www.legislation.gov.uk/uksi/2022/1169 (accessed on 2 August 2026).
- Wróbel, K. A tale of two disruptive maritime technologies: Nuclear propulsion and autonomy. TransNav 2022, 16, 733–741. [Google Scholar] [CrossRef] [Scilit]
- U.S. Maritime Administration (MARAD). Post Shutdown Decommissioning Activities Report (PSDAR), Revision 1, NS Savannah Program; MARAD: Washington, DC, USA, 2008. Available online: https://www.maritime.dot.gov/sites/marad.dot.gov/files/docs/national-defense-reserve-fleet/ns-savannah-program/6071/sts100rev1.pdf (accessed on 6 October 2026).
- Seatrade Maritime. Seaspan ammonia-fuelled 15,000 teu design attracts charterer interest. Seatrade Maritime News, 27 November 2023. Available online: https://seatrade-maritime.com/sustainability-green-technology/seaspan-ammonia-fuelled-15000-teu-design-attracts-charterer-interest (accessed on 2 August 2026).
- U.S. Nuclear Regulatory Commission. Backgrounder on Nuclear Insurance and Disaster Relief; U.S. NRC: Washington, DC, USA, 2025. Available online: https://www.nrc.gov/reading-rm/doc-collections/fact-sheets/nuclear-insurance (accessed on 20 August 2026).
- International Maritime Organization (IMO). Resolution A.1047(27): Principles of Minimum Safe Manning; IMO: London, UK, 2011; Available online: https://wwwcdn.imo.org/localresources/en/KnowledgeCentre/IndexofIMOResolutions/AssemblyDocuments/A.1047%2827%29.pdf (accessed on 9 October 2026).
- International Maritime Organization (IMO). Resolution MSC.595(111): International Code of Safety for Maritime Autonomous Surface Ships (MASS Code), Adopted at the 111th Session of the Maritime Safety Committee (MSC 111), 13–22 May 2026, Recommended for Application from 1 July 2026; IMO: London, UK, 2026. [Google Scholar]
- International Maritime Organization (IMO). Resolution A.491(XII): Code of Safety for Nuclear Merchant Ships; IMO: London, UK, 1981. [Google Scholar]
- United Kingdom Maritime and Coastguard Agency (MCA). Marine Guidance Note MGN 679 (M): Nuclear Ships; MCA: Southampton, UK, 2022. Available online: https://www.gov.uk/government/publications/mgn-679-nuclear-ships (accessed on 9 October 2026).
- International Association of Classification Societies (IACS). Nuclear Propulsion; High-Level Position Paper, Rev. 0; IACS: London, UK, 2025; Available online: https://iacs.s3.af-south-1.amazonaws.com/wp-content/uploads/2025/09/09091936/IACS-HLPP-Nuclear-propulsion.pdf (accessed on 9 October 2026).
- Lu, J.; Wang, C.; Zhang, C.; Guan, H.; Skare, M.; Štreimikis, J. Avoided external energy costs due to penetration of renewables: Evidence from Baltic States. J. Environ. Manag. 2021, 296, 113247. [Google Scholar] [CrossRef] [Scilit] [PubMed]
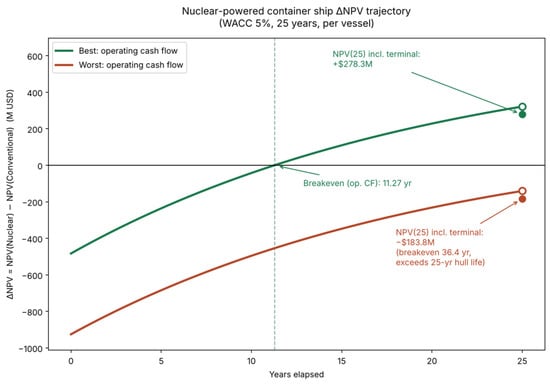
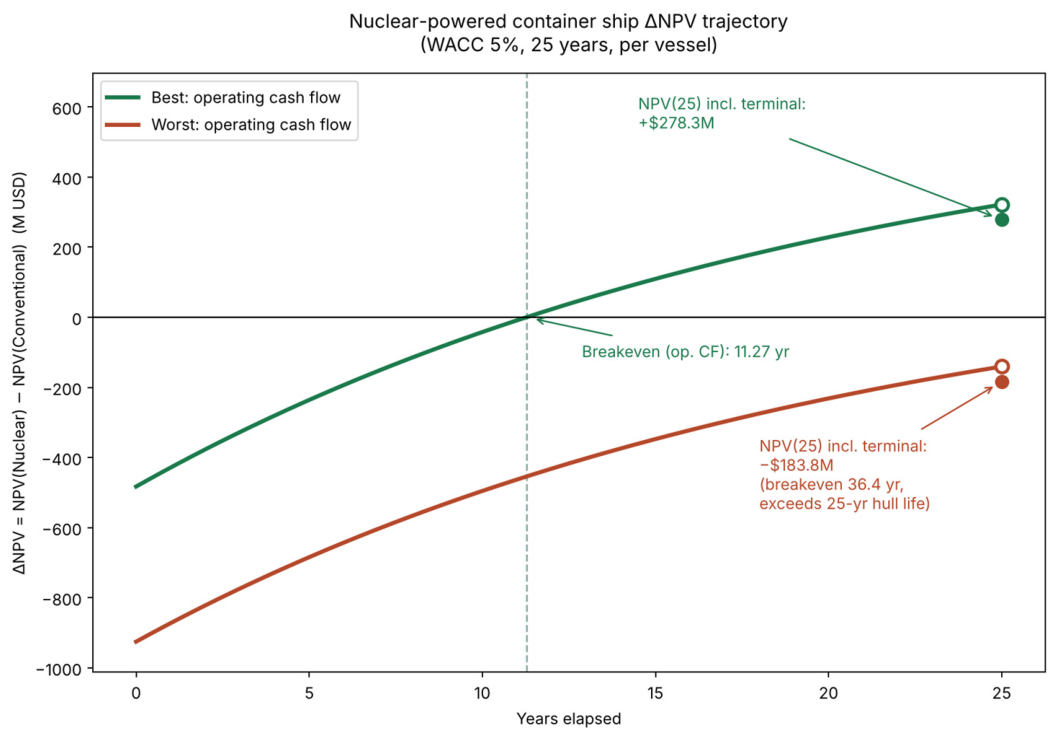
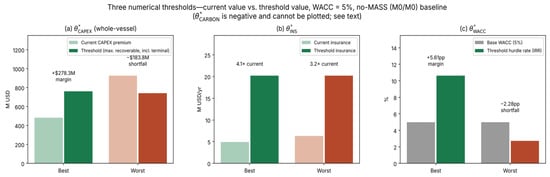
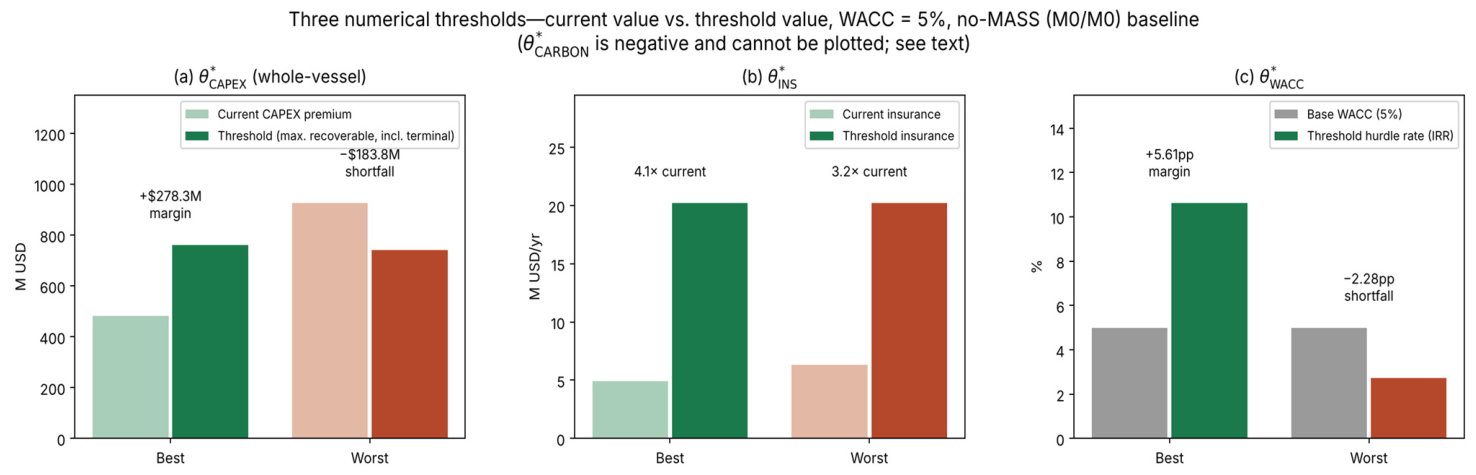
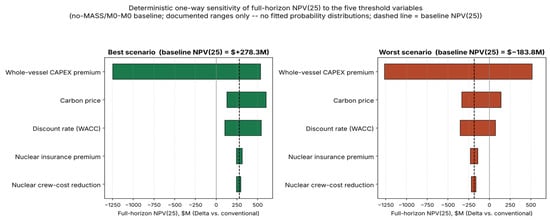
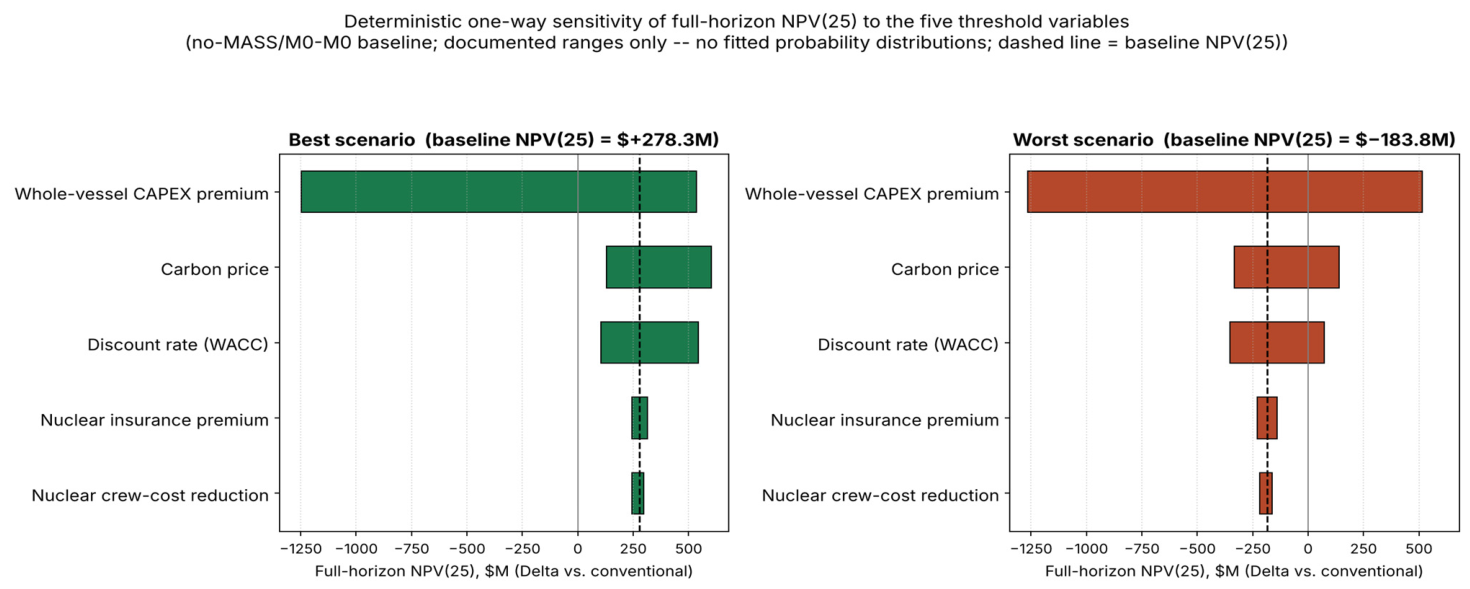

Disclaimer/Publisher’s Note: The statements, opinions and data contained in all publications are solely those of the individual author(s) and contributor(s) and not of MDPI and/or the editor(s). MDPI and/or the editor(s) disclaim responsibility for any injury to people or property resulting from any ideas, methods, instructions or products referred to in the content. |
© 2026 by the authors. Licensee MDPI, Basel, Switzerland. This article is an open access article distributed under the terms and conditions of the Creative Commons Attribution (CC BY) license.