


Abstract
Indoor hygrothermal conditions in occupied residential apartments are influenced by occupant behavior, room functions, and building characteristics. This study investigates long-term indoor hygrothermal performance at room level in two vertically adjacent occupied residential apartments in Jeddah, Saudi Arabia, under a hot-arid coastal climate. The monitored spaces comprised the master bedroom and living room in each apartment. Indoor air temperature and relative humidity were continuously monitored over 33 months, and the data were standardized to 30 min intervals for analysis. Dew point temperature was recalculated from the measured air temperature and relative humidity. For indoor air temperature, differences between corresponding rooms in the two apartments were modest, whereas bedroom–living room differences were larger. The paired monthly mean temperature was higher in the living room than in the master bedroom by 2.24 °C in the lower apartment and 2.63 °C in the upper apartment. Relative humidity did not follow the same spatial pattern, whereas dew point provided additional insight by revealing a distinct moisture-related condition in the lower living room, which recorded the highest mean dew point and the greatest month-to-month variability. The findings demonstrate that apartment-level averages alone do not fully represent room-level indoor hygrothermal performance. Room-level patterns also differed across air temperature, relative humidity, and dew point. Considering indoor air temperature, relative humidity, and dew point together provided a more comprehensive assessment of indoor hygrothermal performance. This study provides long-term field data on room-level indoor hygrothermal conditions in occupied apartments and supports more representative approaches to sustainable building-performance assessment in hot-arid climates.
1. Introduction
Indoor thermal and hygrothermal conditions, including indoor temperature and humidity, affect the quality of residential indoor environments. They influence occupant comfort, energy demand, building operation, and how residential spaces are used in daily life [1,2,3,4,5]. In residential buildings, these conditions are shaped not only by outdoor weather and building characteristics but also by occupant-related factors and everyday operational practices [1,6]. Therefore, measured indoor data collected under real operating conditions are needed to understand how dwellings perform rather than relying solely on assumed or idealized scenarios [1,3].
Long-term monitoring is crucial in residential buildings because short-term measurements may capture temporary conditions while missing continuous patterns associated with seasonal changes, occupancy routines, building operation, and room type differences [1,7,8,9,10]. Recent studies on residential buildings have monitored indoor temperature, humidity, and other environmental conditions over continuous or extended periods under actual use conditions [3,7,10,11]. In occupied dwellings, occupancy patterns, door and window use, room-use practices, air-conditioning operation, and ventilation behavior influence indoor conditions. These factors are difficult to represent using fixed schedules or simple assumptions and can affect the interpretation of measured indoor conditions [6,12,13,14].
Field-based evidence from Saudi buildings has also highlighted the importance of operational factors, including occupancy patterns, space use, door and window use, and user behavior, in shaping indoor air temperature [15]. Room-level differences are important because bedrooms and living rooms may vary in terms of occupancy duration, degree of enclosure, air-conditioning use, internal heat generation, and connections to adjacent spaces [8,16,17,18]. Previous studies in residential settings have shown that indoor conditions can vary between bedrooms and living rooms, indicating that dwelling-level or apartment-level averages may obscure important differences between rooms in occupied residences [8,16,17]. These room-level differences matter for interpreting field-monitoring data and selecting representative indoor measurement locations. This issue is particularly relevant in occupied apartments, where indoor conditions depend on both the physical characteristics of the apartment and the way each room is used and conditioned [6,13,16].
Although indoor air temperature is commonly used to describe thermal conditions, it does not fully represent indoor hygrothermal behavior in residential buildings [19,20]. Relative humidity is also important because indoor moisture levels depend on ventilation, occupancy, daily activities that generate moisture, and other household processes. These factors may vary between rooms and over time [19,21,22,23,24]. Internal moisture in homes can result from activities such as breathing, cooking, cleaning, and bathing [13,21]. Dew point provides additional information about indoor moisture conditions because relative humidity varies with air temperature and may not fully describe indoor air moisture content, particularly when rooms differ in cooling operation and thermal conditions [19,20,24,25].
In Saudi Arabia, cooling demand is a major component of residential energy use because of the hot climate and widespread reliance on air-conditioning systems [26,27,28,29,30]. Previous studies of Saudi residential buildings have examined cooling demand, envelope performance, energy-efficient design solutions, retrofit potential, and passive design strategies under hot climatic conditions [27,28,29,30,31,32,33,34]. Within the Saudi regulatory context, residential building energy performance is addressed by the Saudi Energy Conservation Code for Residential Buildings (SBC 602), which provides requirements related to residential envelope and building-system energy performance [31].
In addition, previous studies have examined residential indoor environmental quality, energy use, building performance, and occupant behavior. Several international studies have reported long-term, room-level residential monitoring, including comparisons of indoor conditions across rooms and occupied dwellings [7,8,9,10,16,17,18]. In Saudi Arabia, however, the studies reviewed here have focused mainly on indoor thermal conditions, cooling demand, envelope performance, energy consumption, passive design, and simulation-based building-performance strategies [26,27,28,29,30,31,32,33]. Within this literature, long-term field evidence simultaneously examining air temperature, relative humidity, and dew point at room level in occupied Saudi apartments remains limited. In particular, the combined comparison of bedrooms and living rooms over an extended monitoring period under hot-arid coastal conditions has received limited attention. Addressing this gap can improve the evidence base for understanding room-level indoor environmental performance in occupied residential buildings.
To address this gap, this study examines long-term indoor hygrothermal performance at room level in two vertically adjacent occupied apartments in Jeddah, Saudi Arabia, using long-term high-resolution field monitoring. The analysis compares the master bedroom and living room in each apartment to examine (1) how indoor air temperature, relative humidity, and dew point vary over time; (2) the magnitude and temporal variability of the observed differences among the four monitored rooms, including bedroom–living room contrasts within each apartment, and corresponding-room contrasts between the two apartments; and (3) how dew point contributes to the interpretation of indoor conditions based on air temperature and relative humidity.
The contribution of this study is the 33-month room-level characterization of indoor air temperature, relative humidity, and dew point, analyzed using monthly comparisons, seasonal patterns, diurnal profiles, and distributional statistics. The analysis aims to characterize these observed differences rather than isolate causal effects of room type, floor position, HVAC system, or occupant behavior. From a sustainability perspective, improved characterization of room-level indoor conditions can support more representative building-performance assessment, model calibration, and room-specific operational strategies in hot-climate residential buildings. This can help avoid the use of a single indoor condition to represent functionally different rooms in residential building assessment.
2. Materials and Methods
2.1. Case Study Building and Apartment Description
This study examined an occupied residential apartment building in Jeddah, Saudi Arabia, located in a hot-arid coastal climate. The average summer and winter outdoor air temperatures are approximately 30 °C and 24 °C, respectively, while the annual average relative humidity is approximately 55% [34]. The building occupies a plot area of approximately 500 m2 and consists of five levels: a ground floor, first floor, second floor, third floor, and a partial fourth floor. Each floor typically contains two residential apartments, and the building’s main façade faces south. The building has a reinforced-concrete structural frame and 30 cm Hourdi floor slabs (hollow-block slabs), each comprising a 25 cm ribbed slab and a 5 cm reinforced-concrete topping. The exterior walls are constructed with 200 mm red-clay masonry blocks, which are commonly used in residential construction throughout Saudi Arabia. Both monitored apartments had double-glazed windows throughout the monitoring period.
The two vertically adjacent occupied apartments on the second and third floors were selected for long-term indoor environmental monitoring. Both units are located within the same residential building and share the same structural system, construction materials, and overall characteristics, as shown in Table 1. Indoor measurements were conducted in two representative occupied spaces in each apartment: the master bedroom and the living room. Although the apartments are vertically adjacent, their internal layouts differ, reflecting the variations typically found in homes. The master bedroom and living room were selected because they represent residential spaces with distinct functions and patterns of use. These room types are also commonly included in residential indoor environmental monitoring studies [8,16,17].
Table 1.
Characteristics of the case study building.
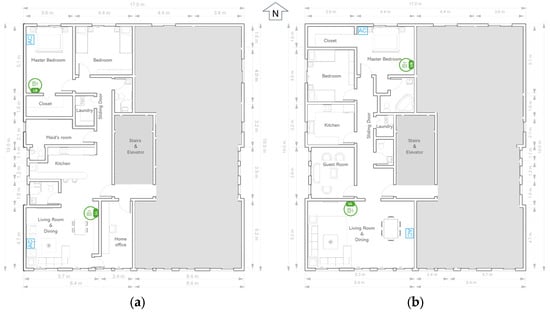
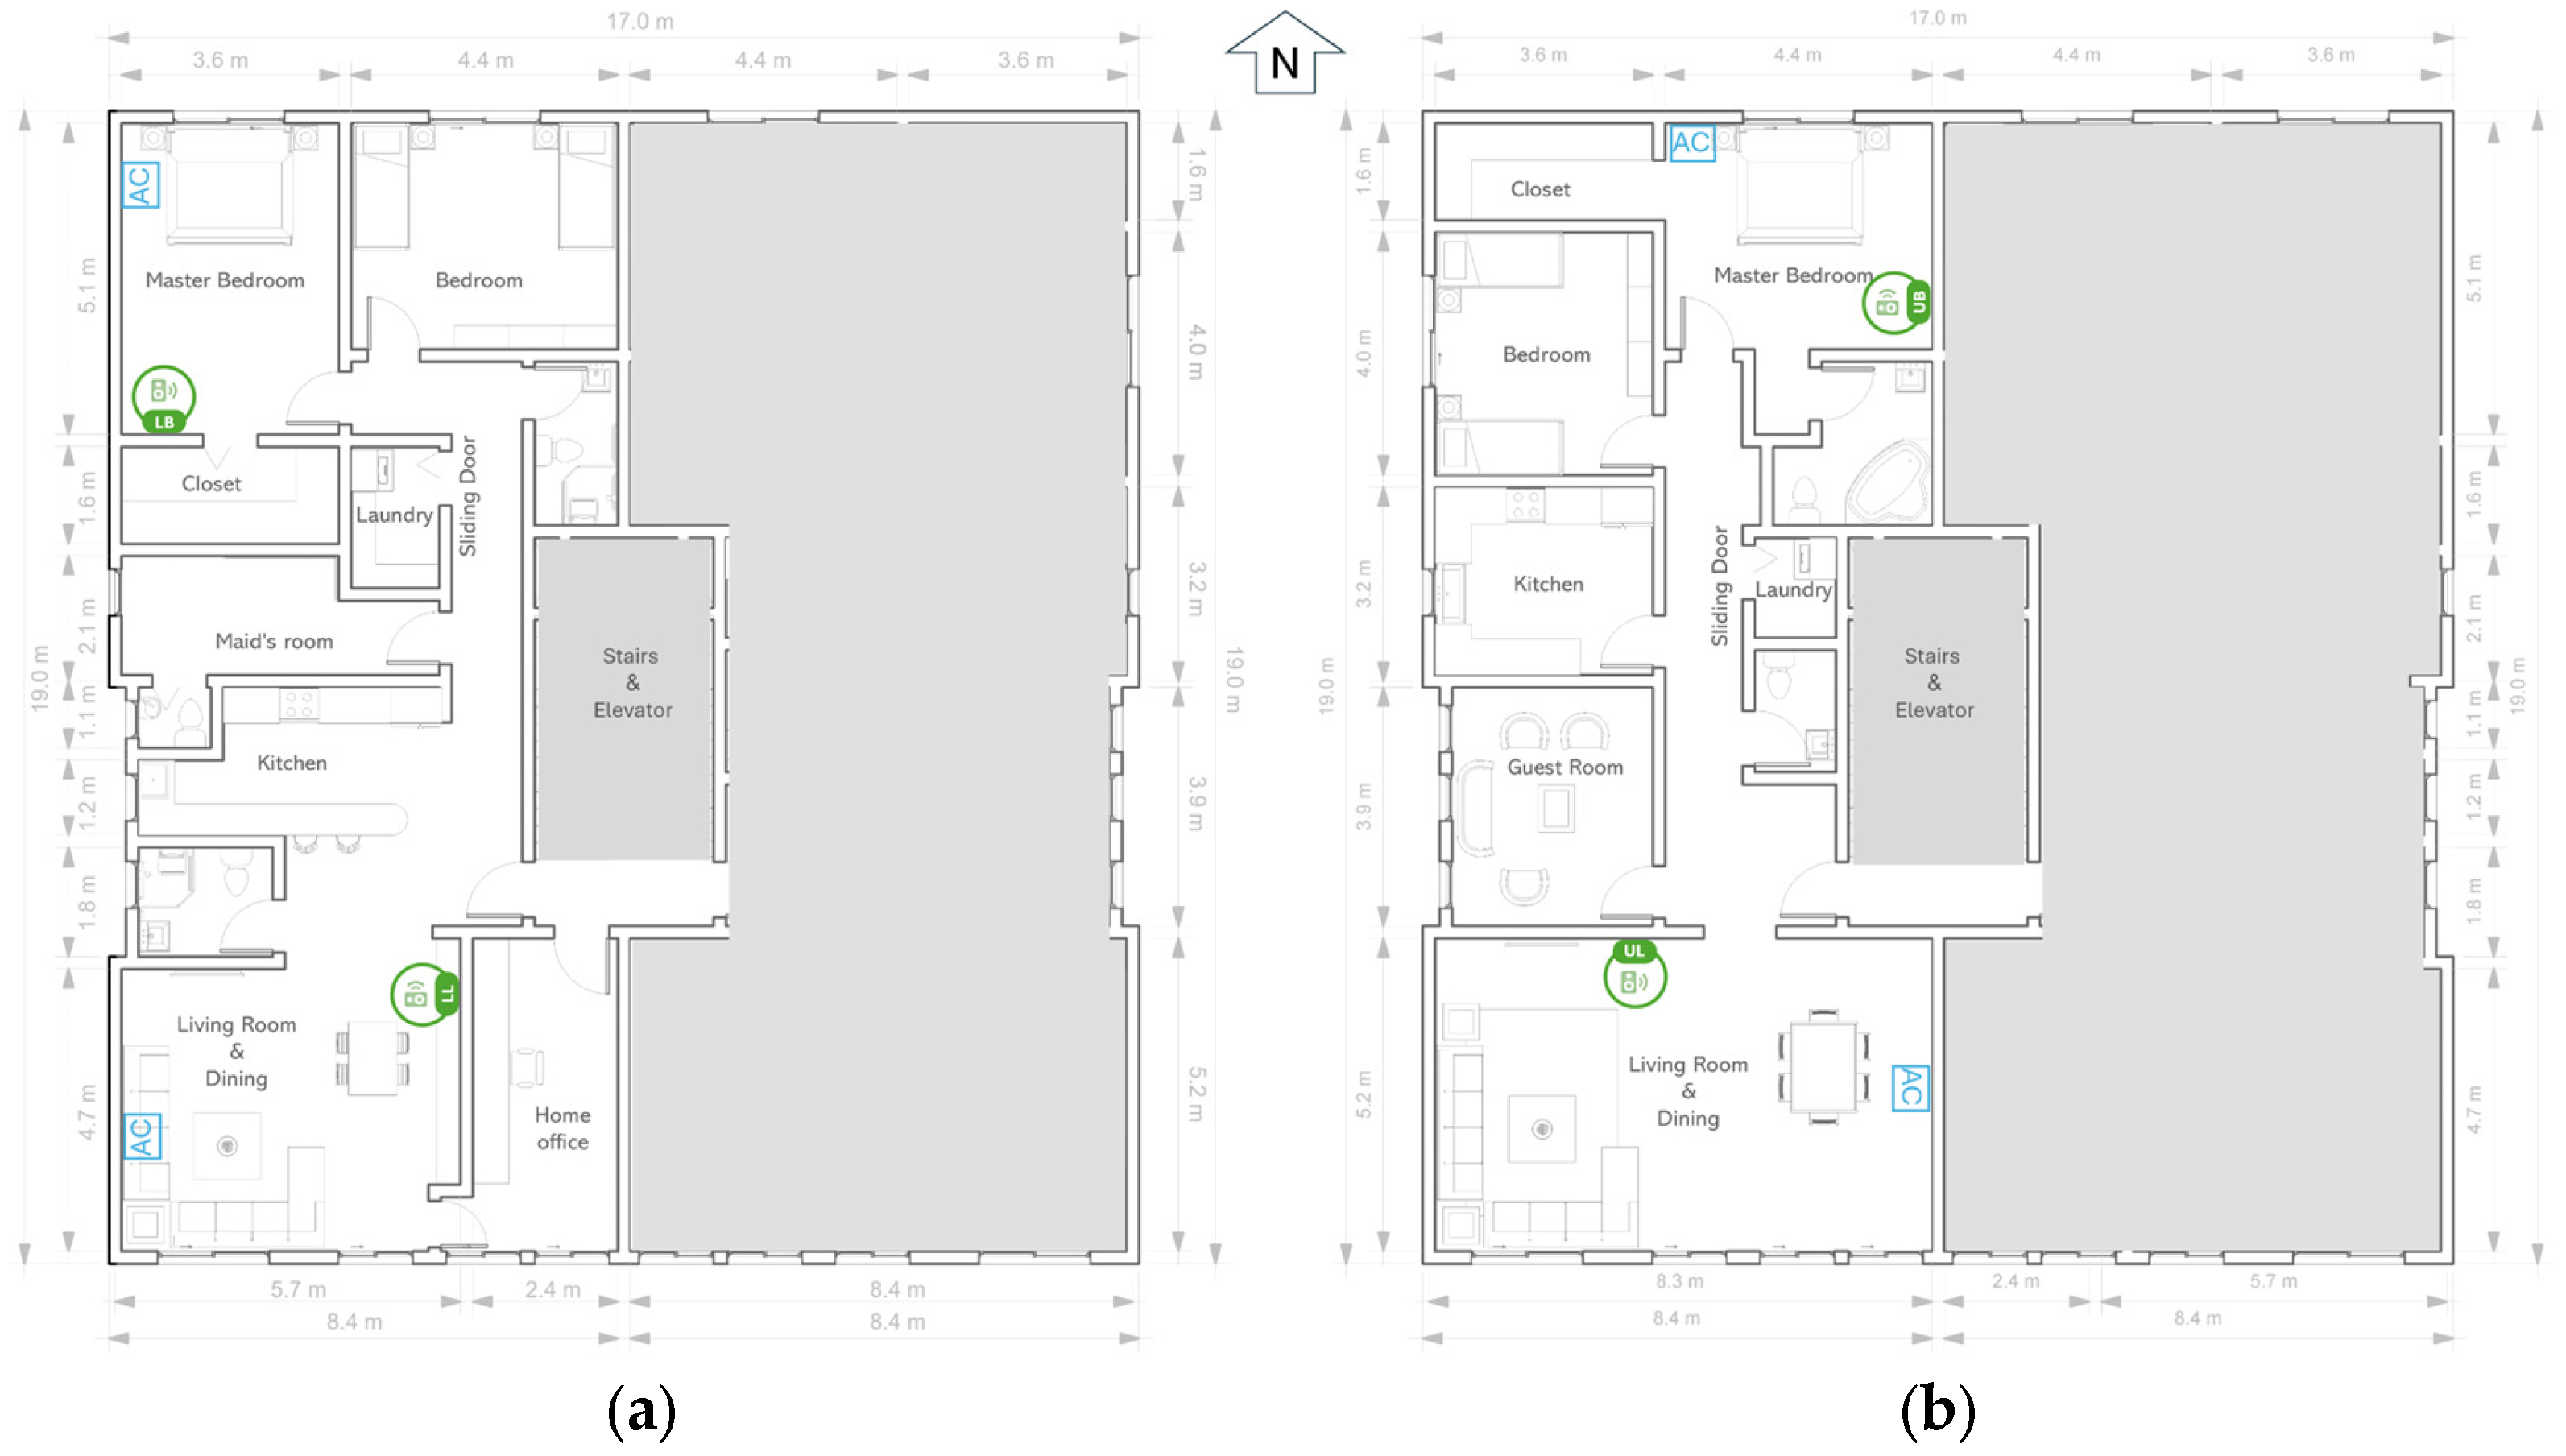
Figure 1 presents simplified plans of the two monitored apartments, including the monitored rooms and approximate sensor and air-conditioning locations. Table 2 summarizes the principal spatial characteristics of the four monitored rooms.
Figure 1.
Schematic plans of the two monitored apartments: (a) Lower apartment and (b) Upper apartment. Green symbols indicate data logger locations, blue AC labels indicate air-conditioning units, and N indicates north. Prepared using Autodesk Revit 2024 (Autodesk, Inc., San Francisco, CA, USA) and Microsoft PowerPoint for Microsoft 365 (Version 2608, Microsoft, Redmond, WA, USA).
Table 2.
Spatial characteristics of the monitored rooms.
Five-person households occupied both monitored apartments during the monitoring period. The monitored bedrooms were generally used as more enclosed private spaces, whereas the living rooms were more connected to adjacent circulation and shared residential spaces, as illustrated in Figure 1. The windows of the monitored rooms were generally kept closed during the monitoring period. Detailed occupancy schedules, occupant movements, door-opening events, prolonged unoccupied periods, and air-conditioning operating schedules were not systematically recorded. Accordingly, the occupancy information is used only to describe the residential context and not as an explanatory variable for the observed hygrothermal differences.
To protect occupant privacy and prevent identification of the residential property, the exact building location, detailed architectural drawings, and exterior photographs are intentionally omitted. Only simplified apartment plans and information necessary to describe the case study and interpret the monitoring results are presented. Because each monitored floor corresponded to a single apartment with a distinct household, internal layout, and HVAC type, these factors are confounded in the present case study. Accordingly, comparisons between the lower and upper apartments are treated as case-specific contrasts and are not interpreted as estimates of an independent floor-level effect.
2.2. Indoor Environmental Monitoring
Long-term indoor environmental monitoring was conducted from 1 July 2019 to 31 March 2022, a 33-month monitoring period, in two vertically adjacent occupied apartments using four HOBO® U12-012 data loggers manufactured by Onset Computer Corporation (Bourne, MA, USA). One data logger was installed in the master bedroom and one in the living room of each apartment, resulting in four monitoring locations. Long-term field monitoring provides valuable information on indoor environmental conditions under actual occupancy and allows for the identification of seasonal and operational variations that short-term measurements may not capture [1,2,3].
The data loggers recorded indoor air temperature and relative humidity at 30 min intervals during 2019 and at 5 min intervals from January 2020 onward. Indoor air temperature is widely recognized as a primary indicator of indoor thermal conditions, whereas relative humidity and dew point provide complementary information on indoor moisture behavior [2,19,20,25,36]. Before deployment, the four data loggers were placed together under the same indoor conditions for a functional co-location check to verify that they were operating consistently. This procedure was intended as a pre-deployment equipment check rather than a formal calibration, and individual inter-sensor offsets were not quantified. The loggers were subsequently configured with identical logging settings, synchronized to the same internal clock, and started simultaneously. No post-monitoring drift assessment was conducted. Accordingly, differences comparable to the manufacturer-stated measurement accuracy were interpreted cautiously.
The data loggers’ sensors were installed at a height of 1.5 to 1.8 m above the finished floor level. They were positioned within the occupied zone and kept away from heat sources, in accordance with standard recommendations for field monitoring studies [37]. The sensors were located away from windows, doors, direct sunlight, air-conditioning units, and air supply paths to minimize localized thermal disturbances. The same installation criteria were applied consistently in both apartments throughout the monitoring period.
One sensor was used in each monitored room to provide a consistent long-term measurement at a representative occupied-zone location. The monitoring design was intended to characterize long-term room-level conditions rather than spatial temperature or humidity gradients within each room. The sensor locations were selected to avoid localized effects from windows, doors, direct solar radiation, and AC supply air, consistent with the general principle of using representative occupied locations in indoor environmental assessment [37]. However, a single measurement point cannot capture all within-room spatial variations, and this is acknowledged as a limitation of the present study.
According to the manufacturer’s specifications, the HOBO U12-012 data logger measures air temperature over the range −20 to 70 °C, with an accuracy of ± 0.35 °C (0–50 °C) and a resolution of 0.03 °C at 25 °C. Relative humidity is measured over a range of 5–95% RH, with a typical accuracy of ±2.5% RH between 10% and 90% RH and a resolution of 0.05% RH. The system directly measured only indoor air temperature and relative humidity. Dew point temperature was treated as a derived variable rather than an independent measurement. For consistency across the four monitoring locations, dew point was recalculated from the measured air temperature and relative humidity using the Magnus formulation [38], as expressed in Equations (1) and (2):
where T is air temperature (°C), RH is relative humidity (%), γ is an intermediate variable calculated using Equation (1), Td is dew point temperature (°C), and ln denotes the natural logarithm [38]. HOBOware® also generated a dew-point series automatically from the measured temperature and relative humidity; however, the recalculated values were used in the revised analysis to ensure a consistent and transparent calculation method across all monitored spaces.
γ (T,RH) = ln (RH/100) + ((17.625 T)/(243.04 + T))
Td = (243.04 γ)/(17.625 − γ)
The manufacturer-stated temperature (±0.35 °C) and relative-humidity (±2.5% RH) accuracy limits were propagated through the dew-point calculation to assess the sensitivity of the derived values to sensor uncertainty. The resulting uncertainty was approximately ±1 °C under typical monitored conditions; therefore, dew-point differences in similar magnitude were interpreted cautiously. The lower apartment was conditioned using window-type air-conditioning units, whereas the upper apartment was equipped with mini-split air-conditioning units. The installed cooling capacities were 18,000 BTU/h for each master bedroom and 24,000 BTU/h for each living room; see Table 2 and Table 3 for further details. These nominal capacities are reported as descriptive equipment characteristics only; AC runtime, set-point temperature, equipment efficiency, and actual cooling output were not monitored and were not used to infer cooling performance.
Table 3.
Indoor environmental monitoring configuration.
2.3. Outdoor Climate Data
Outdoor meteorological data were obtained from the National Oceanic and Atmospheric Administration (NOAA) Climate Data Online (CDO) database. Daily observations from the King Abdulaziz International Airport meteorological station (Station ID: SA000041024) were used because this station provides a continuous long-term meteorological record for the Jeddah area. Outdoor weather conditions are essential for understanding how buildings maintain comfortable indoor conditions throughout the seasons. This applies to both homes with natural ventilation and those with mechanical systems [1,6].
For this study, daily average outdoor air temperature (TAVG) was obtained from NOAA for the period from 1 July 2019 to 31 March 2022, corresponding to the revised indoor monitoring period. To provide additional moisture-related climatic context, daily dew/frost point temperature at 2 m (T2MDEW) was obtained from the NASA POWER database for the same period. The NOAA temperature record contained 1001 valid daily observations out of 1005 days, whereas the NASA POWER dew-point record was available for the complete 1005-day period. Daily outdoor variables were aggregated to monthly mean values and aligned with the corresponding indoor monitoring records. These outdoor data were used to provide climatic context for interpreting indoor thermal and moisture patterns rather than to establish causal relationships between outdoor and indoor conditions. Table 4 summarizes the outdoor climate datasets used in the analysis.
Table 4.
Outdoor climate datasets used in the analysis.
2.4. Data Processing and Quality Control
The raw data collected at the four monitoring locations were periodically downloaded from the HOBO® U12-012 data loggers using HOBOware® software (Version 3.7.20). The indoor monitoring measurements covered the period from 1 July 2019 to 31 March 2022. Each monitoring location was saved as a separate CSV file. The individual datasets were subsequently imported into Microsoft Excel for Microsoft 365 (Version 2608), where they were merged into a master dataset for further processing and analysis. During the data preparation stage, time formats were standardized, apartment and room identifiers were verified, and the four monitoring datasets were synchronized.
Quality control procedures involved examining datasets for missing records, inconsistent timestamps, duplicate entries, and potential outliers to ensure data consistency before analysis. The revised analysis covers the period from 1 July 2019 to 31 March 2022. The indoor monitoring interval was initially 30 min during 2019 and was subsequently changed to 5 min from January 2020 onward. To provide a consistent temporal basis for the full monitoring period, observations recorded at 5 min intervals were aggregated into non-overlapping 30 min intervals by averaging the available temperature and relative-humidity measurements within each interval, whereas the original 30 min observations were retained. Dew point temperature was subsequently recalculated from the standardized 30 min temperature and relative-humidity data using the method described in Section 2.2.
Quality control included verification of timestamps and room identifiers, screening for duplicate records, identification of missing periods, and inspection of the measured temperature and relative-humidity values for physically implausible observations and values outside the specified sensor measurement ranges. No missing observations were interpolated or otherwise imputed. Missing intervals were retained as missing and excluded only from calculations requiring an available observation.
The data loggers were accessed approximately every two months for data download and routine battery replacement. The same monitoring locations were maintained throughout the study, and no planned sensor repositioning was performed. Temporary interruptions associated with data retrieval, battery replacement, or logger restart were retained as missing data and were not interpolated. Table 5 summarizes data completeness for the standardized 30 min indoor monitoring dataset.
Table 5.
Data completeness of the standardized 30 min indoor monitoring dataset.
The largest common data gap occurred between October 8 and November 17, 2020, and lasted approximately 39.6 days. Despite the identified gaps, overall data completeness exceeded 93.9% in all four monitored rooms. All statistical analyses were based on available observations, with no interpolation across missing periods.
The monitoring period overlapped with the COVID-19 pandemic. The data loggers continued to record indoor environmental conditions during this period; however, continuity of measurement does not imply continuity of residential operation. Potential pandemic-related changes in occupancy duration, room-use patterns, ventilation practices, and air-conditioning operation were not systematically recorded and therefore could not be evaluated directly. For this reason, the dataset was not divided into pre-pandemic and pandemic periods, because such a comparison would rely on calendar dates rather than measured changes in household occupancy or operation and could also be influenced by seasonal differences. Seasonal variation was therefore examined separately using the hot, transition, and cool periods described in Section 2.5.
The processed data were subsequently aggregated into monthly mean values for each monitored variable to facilitate long-term comparisons across the four monitored spaces and to evaluate month-to-month thermal and hygrothermal variability. Daily outdoor air temperature data from the NOAA CDO database were processed separately, aggregated to monthly means, and aligned with the corresponding monthly indoor records for descriptive comparison. Monthly aggregation was selected to show long-term trends while minimizing the influence of short-term changes and temporary events. The standardized 30 min dataset and the derived monthly dataset were used for the statistical analyses and visualizations in this study.
2.5. Statistical Analysis
The standardized 30 min indoor dataset was analyzed using descriptive statistics, paired monthly comparisons, distributional metrics, and diurnal profiles. Monthly mean values of indoor air temperature, relative humidity, and dew point temperature were calculated separately for each of the four monitored spaces. To examine seasonal variation, the monthly data were grouped into three study-specific climatic periods: hot (May–October), cool (December–February), and transition (March–April and November). Seasonal mean values were calculated from the monthly means for each monitored room and variable. This grouping was used to examine whether the observed room-level patterns persisted across different climatic periods.
Paired monthly differences were calculated for corresponding rooms between apartments and for bedroom–living room contrasts within each apartment, with 95% confidence intervals estimated from the 33 paired monthly values. Because the 33 monthly values form a time series, the confidence intervals were interpreted descriptively and were not used for population-level inference. Temporal autocorrelation may reduce the effective number of independent monthly observations; therefore, conventional confidence intervals may underestimate the uncertainty of the paired differences. These averages were then used to identify temporal variations and recurring month-to-month patterns during the monitoring period. In long-term indoor environmental monitoring, descriptive statistical analysis is frequently used to assess how thermal conditions vary over time and to compare different monitored areas [1,2].
To provide climatic context for the indoor temperature patterns, the monthly indoor measurements were compared with the corresponding outdoor air temperatures from the NOAA CDO database. This comparison supported the interpretation of month-to-month indoor temperature patterns by providing a descriptive climatic reference. The processed datasets were presented using comparative time-series plots illustrating monthly variations in indoor air temperature, relative humidity, dew point temperature, and outdoor air temperature. These plots were used to evaluate differences between the upper and lower apartments and identify long-term thermal patterns under occupied residential conditions.
In addition to descriptive statistics, the standard deviation and range of the monthly mean values were calculated for each monitored variable to quantify month-to-month variability across the monitored spaces. Lower standard deviations and narrower ranges in monthly mean temperatures indicate greater thermal stability from month to month. Additionally, 24 h mean temperature profiles and distributional statistics, including the 10th percentile, median, 90th percentile, and interquartile range, were calculated to characterize within-day and overall temperature variability beyond monthly averages.
3. Results and Discussion
3.1. Overall Descriptive Patterns
This section presents and discusses the hygrothermal conditions observed in the four monitored spaces: the lower bedroom (LB), lower living room (LL), upper bedroom (UB), and upper living room (UL). The results are interpreted within the context of occupied residential settings, where indoor conditions can be affected by factors such as room function, air-conditioning use, occupancy patterns, ventilation habits, and daily user practices [6,12,13].
Table 6 summarizes the overall descriptive statistics for indoor air temperature, relative humidity, and dew point across the four monitored spaces. These statistics provide a preliminary overview of the monitored indoor conditions before analyzing monthly trends and differences between rooms. The values show that both living rooms recorded higher mean temperatures than their corresponding bedrooms, whereas relative humidity and dew point exhibited less consistent differences across the four spaces. Overall, the temperature results show modest mean differences between corresponding rooms in the two vertically adjacent apartments. The paired monthly mean temperature difference was 0.47 °C cooler in the UB than in the LB, whereas the UL was 0.08 °C cooler than the LL. In contrast, room-type differences were larger: The lower living room was 2.24 °C warmer than the lower bedroom, and the upper living room was 2.63 °C warmer than the upper bedroom.
Table 6.
Overall descriptive statistics of indoor air temperature, relative humidity, and dew point across the four monitored spaces.
As summarized in Table 6, the standard deviation values describe the overall variability of the original 30 min measurements within each monitored space. For indoor air temperature, the lower bedroom exhibited the lowest overall variability (SD = 1.43 °C), whereas the upper living room exhibited the highest variability (SD = 2.36 °C). Relative humidity exhibited the lowest overall variability in the lower bedroom (SD = 6.57%) and the highest variability in the upper bedroom (SD = 8.46%). Dew point temperature showed the lowest overall variability in the lower bedroom (SD = 2.19 °C) and the highest variability in the lower living room (SD = 3.46 °C).
Table 7 presents the mean differences between corresponding rooms across the two apartments and between room types within each apartment. Corresponding-room differences compare the lower and upper bedrooms and the lower and upper living rooms, whereas room-type differences compare the bedroom and living room within each apartment. These comparisons describe the magnitude of the observed differences within and between the two monitored apartments without attributing them to an independent floor-level effect.
Table 7.
Paired monthly mean differences between corresponding rooms and room types, with 95% confidence intervals (n = 33 months).
Table 8 summarizes the seasonal patterns and month-to-month variability of the monitored indoor conditions. The seasonal comparison shows that room-level differences were not constant throughout the monitoring period. For air temperature, both living rooms remained warmer than their corresponding bedrooms in all three climatic periods, with larger differences during the hot period. Relative humidity and dew point showed different seasonal and spatial patterns. The lower living room showed the highest hot-period dew point, while the differences became smaller during the cool period. These results show that a single overall mean cannot fully represent long-term room-level patterns.
Table 8.
Seasonal mean and month-to-month variability of indoor hygrothermal conditions.
Table 6 provides the overall distribution of all valid 30 min observations, whereas Table 8 focuses on seasonal patterns derived from the monthly means. The two tables therefore provide complementary rather than duplicate information. The seasonal results show that the bedroom–living room temperature differences persisted across all three periods but varied in magnitude. During the hot period, LL was 2.97 °C warmer than LB and UL was 3.47 °C warmer than UB. During the cool period, these differences decreased to 1.28 °C and 1.65 °C, respectively. These findings are consistent with previous residential studies showing that indoor conditions can vary between bedrooms and living rooms and may be obscured by dwelling-level averages [8,16,17].
Relative humidity and dew point showed different spatial patterns from temperature. The upper bedroom had the highest mean relative humidity, while the lower living room had the highest mean dew point. This suggests that relative humidity and dew point should not be interpreted solely in relation to air temperature. Previous work has emphasized that humidity-related indoor conditions are affected by temperature, occupancy, ventilation, and internal moisture generation [19,20,21].
3.2. Indoor Air Temperature
As shown in Table 6 and Table 7, both living rooms were warmer than their corresponding bedrooms, while temperature differences between corresponding rooms in the two apartments remained relatively modest. The month-to-month variability results reveal a clearer room-type pattern. The bedrooms had lower standard deviations of monthly mean temperature than the living rooms, while the upper living room recorded the widest monthly temperature range. This indicates that the living rooms were generally warmer and experienced greater month-to-month fluctuations during the monitoring period.
Previous residential studies have shown that indoor conditions can be influenced by room-use patterns, internal gains, occupancy behavior, ventilation-related actions, and cooling operation [6,9,12,13,15,18]. Such factors may contribute to differences between bedrooms and living rooms. However, door position, occupancy schedules, occupant behavior, and air-conditioning operation were not systematically monitored in the present study. Therefore, these mechanisms are considered plausible hypotheses only and are not used as evidence-based explanations of the observed temperature differences.
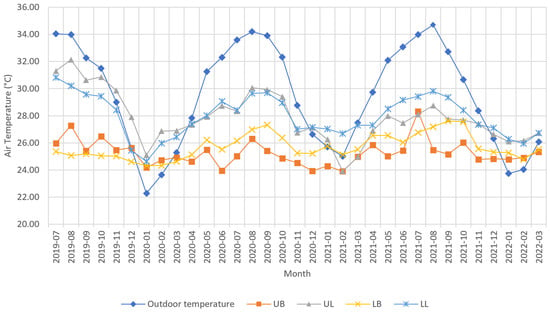
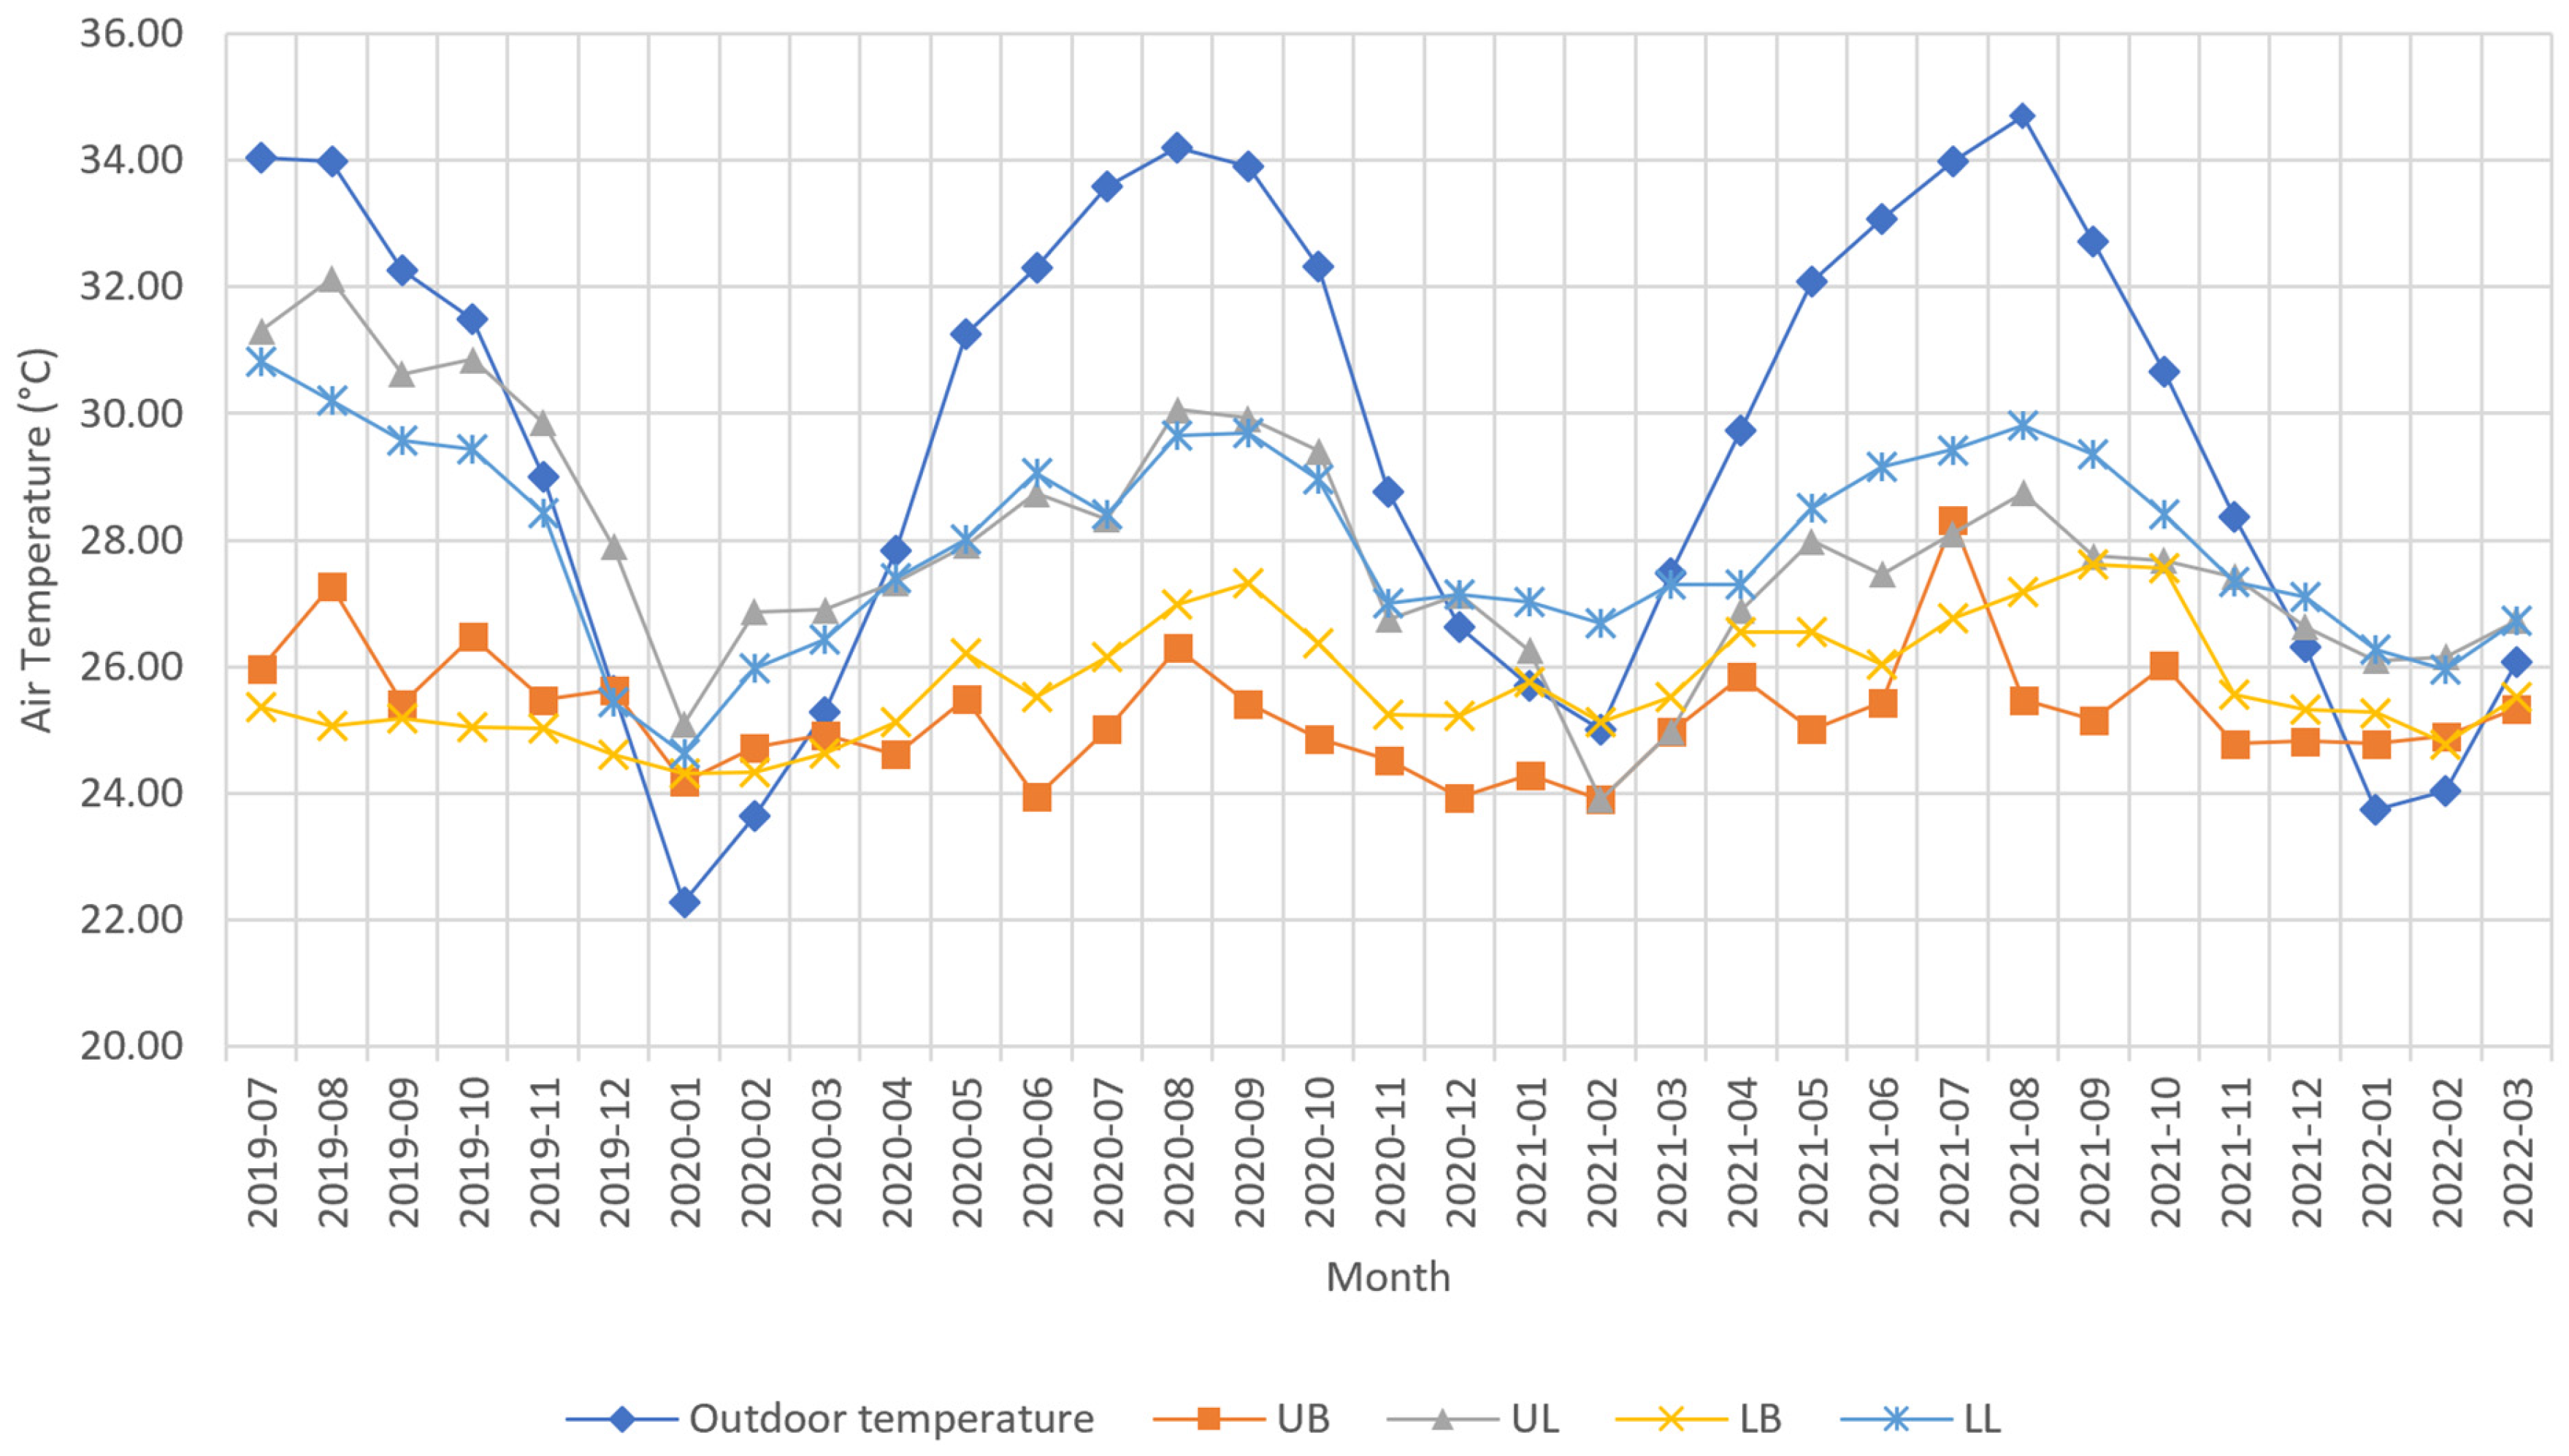
Figure 2 compares the monthly mean indoor air temperature of the monitored spaces with the monthly mean outdoor air temperature during the monitoring period. The outdoor temperature shows a clear seasonal trend, whereas indoor temperatures vary within a narrower range. The living rooms show greater month-to-month variation than the bedrooms, while the bedrooms remain comparatively more stable throughout the monitoring period. This comparison provides climatic context only and does not aim to isolate the causal impact of outdoor temperature on indoor conditions. Because mean radiant temperature, air speed, clothing insulation, and metabolic rate were not measured, the recorded air temperatures cannot be used to determine formal thermal-comfort compliance under ASHRAE Standard 55-2023 or ISO 7730:2025 [37,39]. These standards are therefore used as interpretive context rather than as pass–fail criteria in the present study.
Figure 2.
Monthly mean outdoor and indoor air temperature for the four monitored spaces. LB = lower bedroom; LL = lower living room; UB = upper bedroom; UL = upper living room. Data analysis and visualization were performed using Microsoft Excel for Microsoft 365 (Version 2608, Microsoft Corporation, Redmond, WA, USA).
3.3. Diurnal and Distributional Temperature Patterns
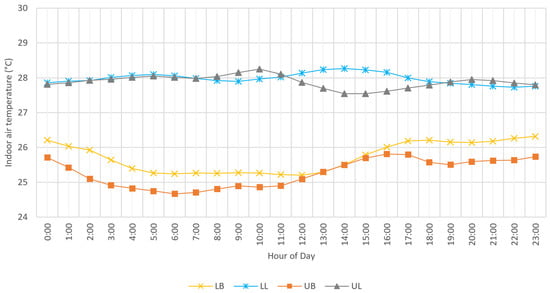
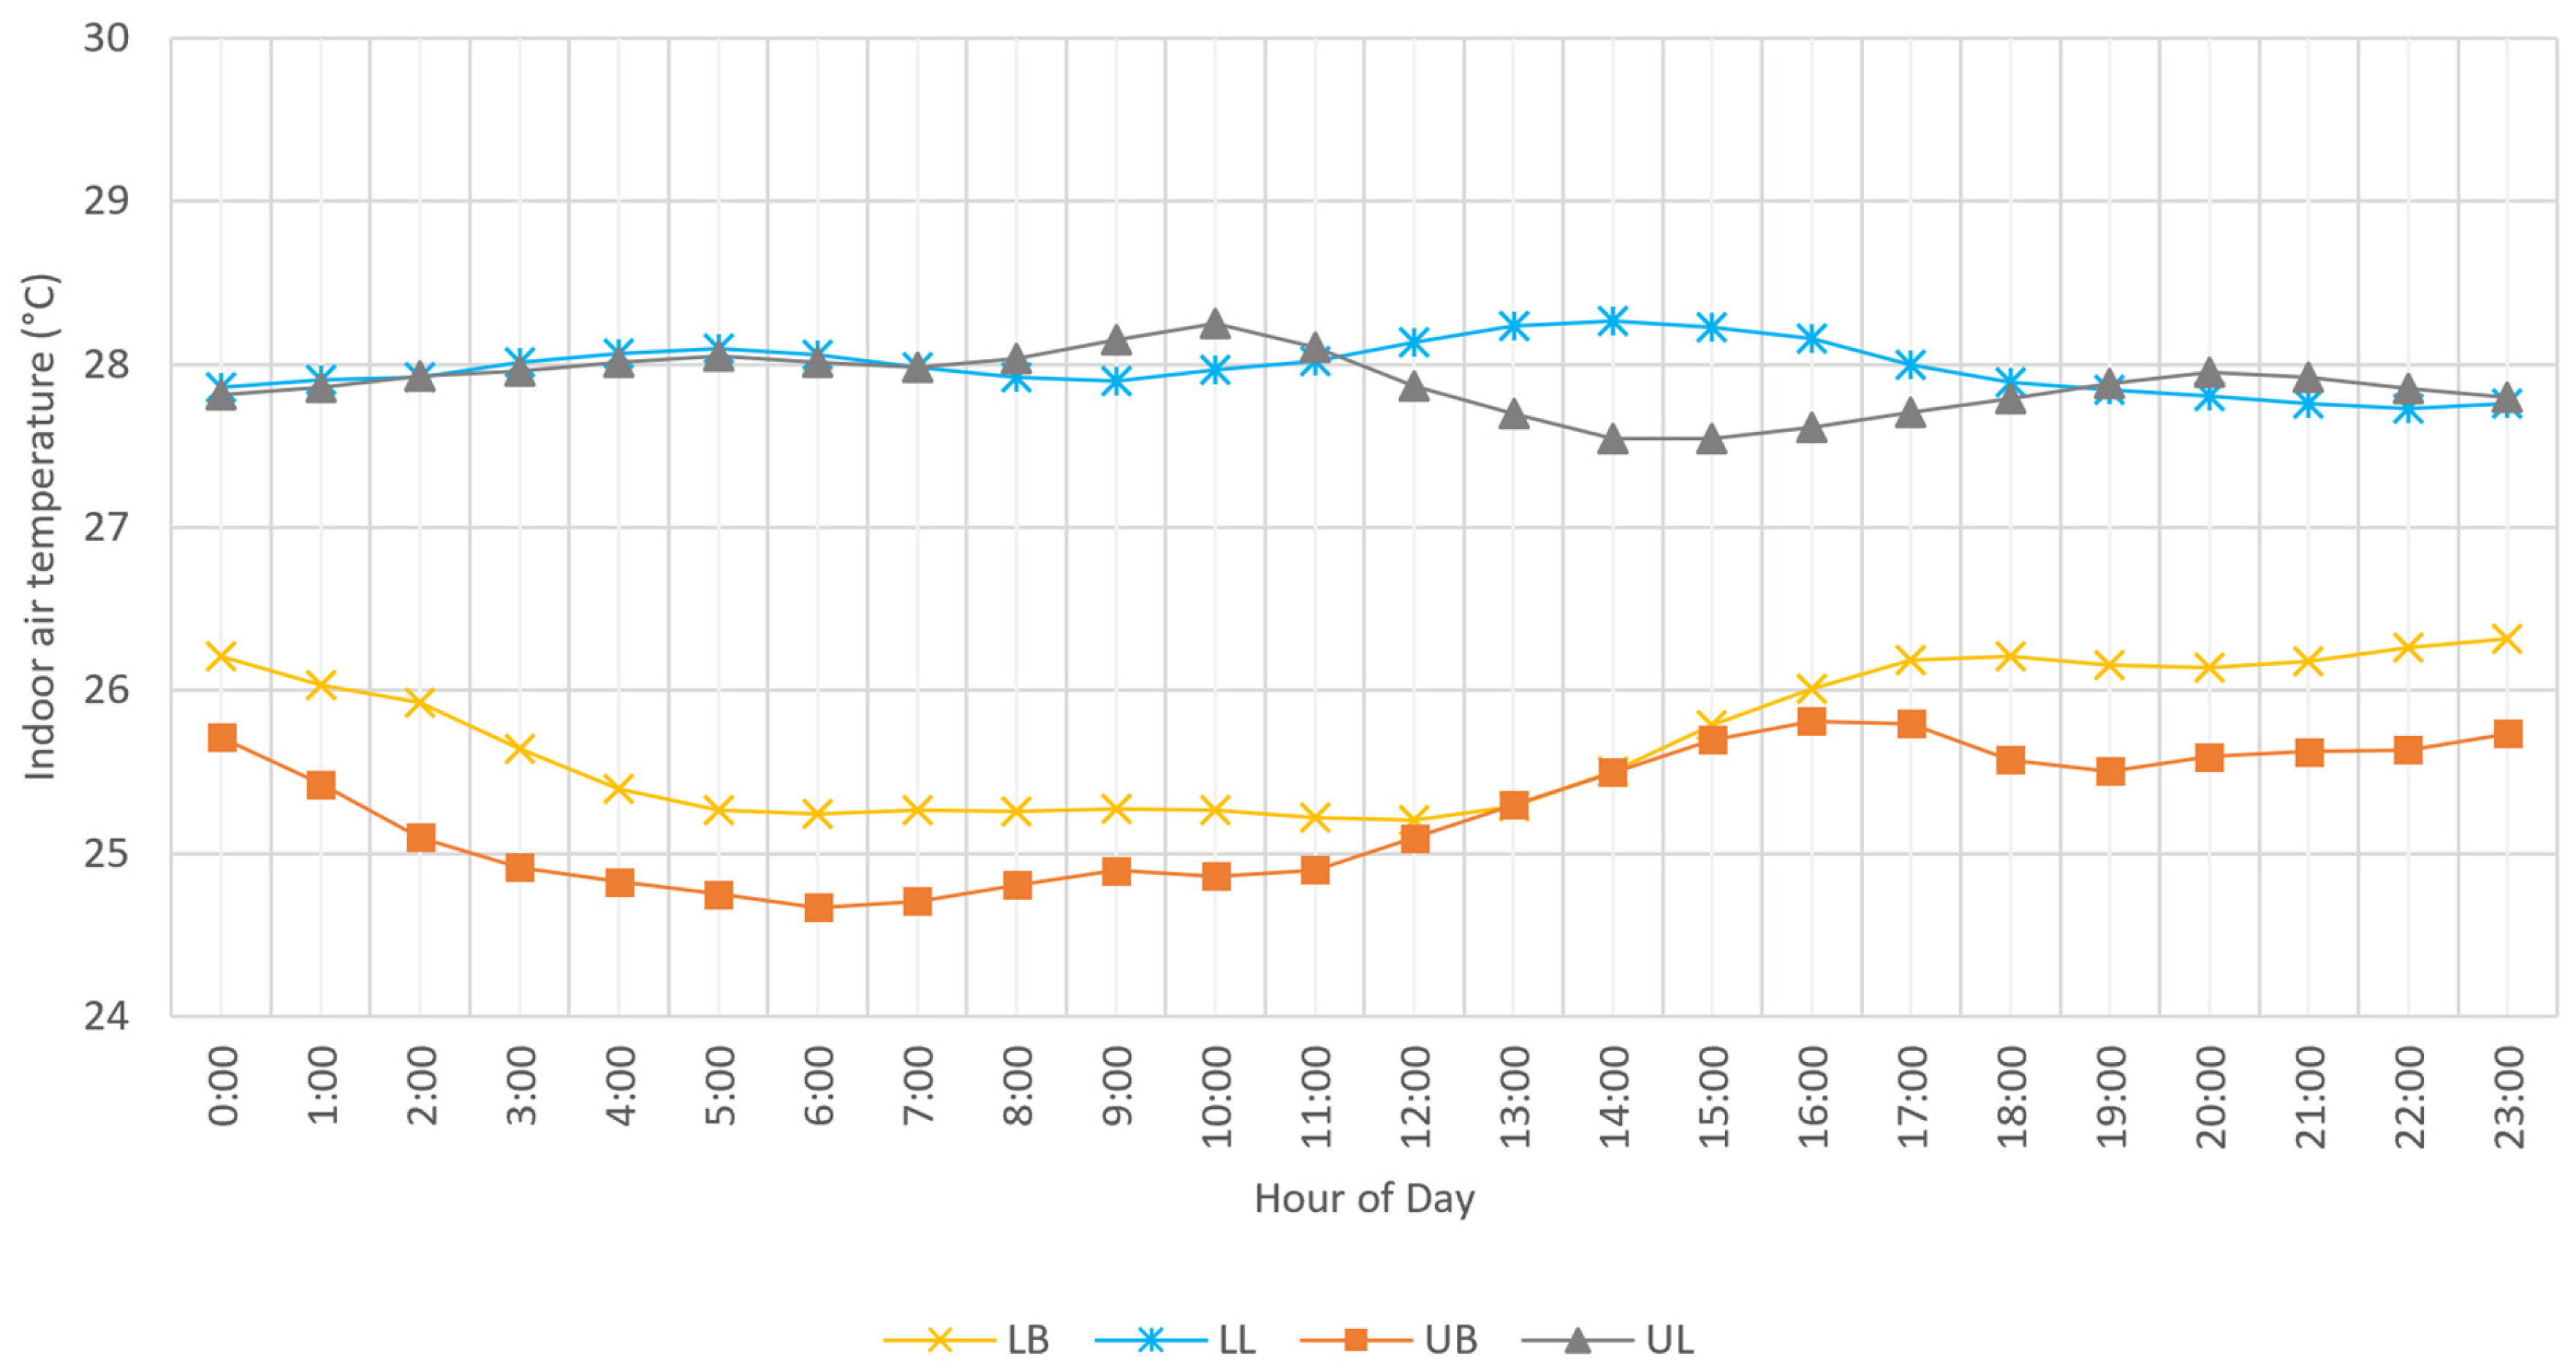
Table 9 and Table 10 and Figure 3 provide additional evidence of room-level temperature differences beyond the monthly averages. The 24 h mean profiles showed relatively small diurnal amplitudes, ranging from 0.54 °C in LL to 1.14 °C in UB, while both living rooms generally remained warmer than the bedrooms throughout the day. The distributional statistics showed a similar pattern, with higher median and 90th-percentile temperatures in the living rooms. UL exhibited the widest interquartile range (3.16 °C), indicating greater overall temperature variability than the other monitored rooms.
Table 9.
Summary of 24 h mean indoor air temperature profiles across the four monitored rooms.
Table 10.
Distributional statistics of indoor air temperature (P10 = 10th percentile; P90 = 90th percentile; IQR = interquartile range).
Figure 3.
24 h mean indoor air temperature profiles across the four monitored rooms. LB = lower bedroom; LL = lower living room; UB = upper bedroom; UL = upper living room. Data analysis and visualization were performed using Microsoft Excel for Microsoft 365 (Version 2608, Microsoft Corporation, Redmond, WA, USA).
3.4. Relative Humidity
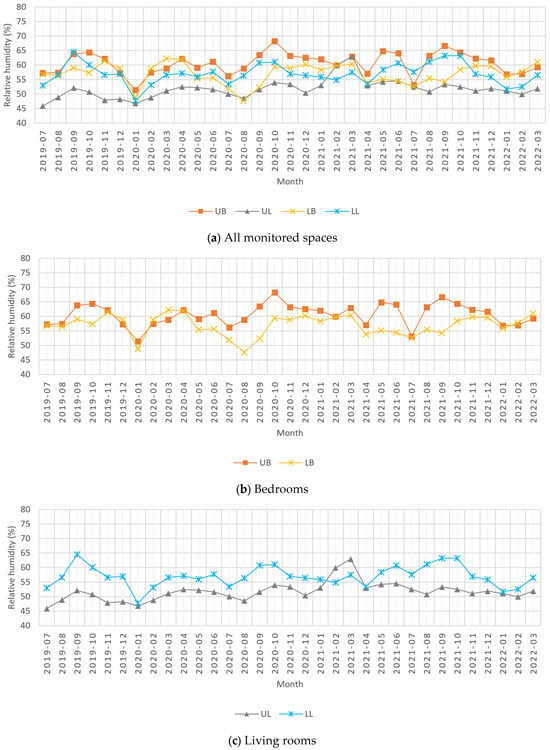
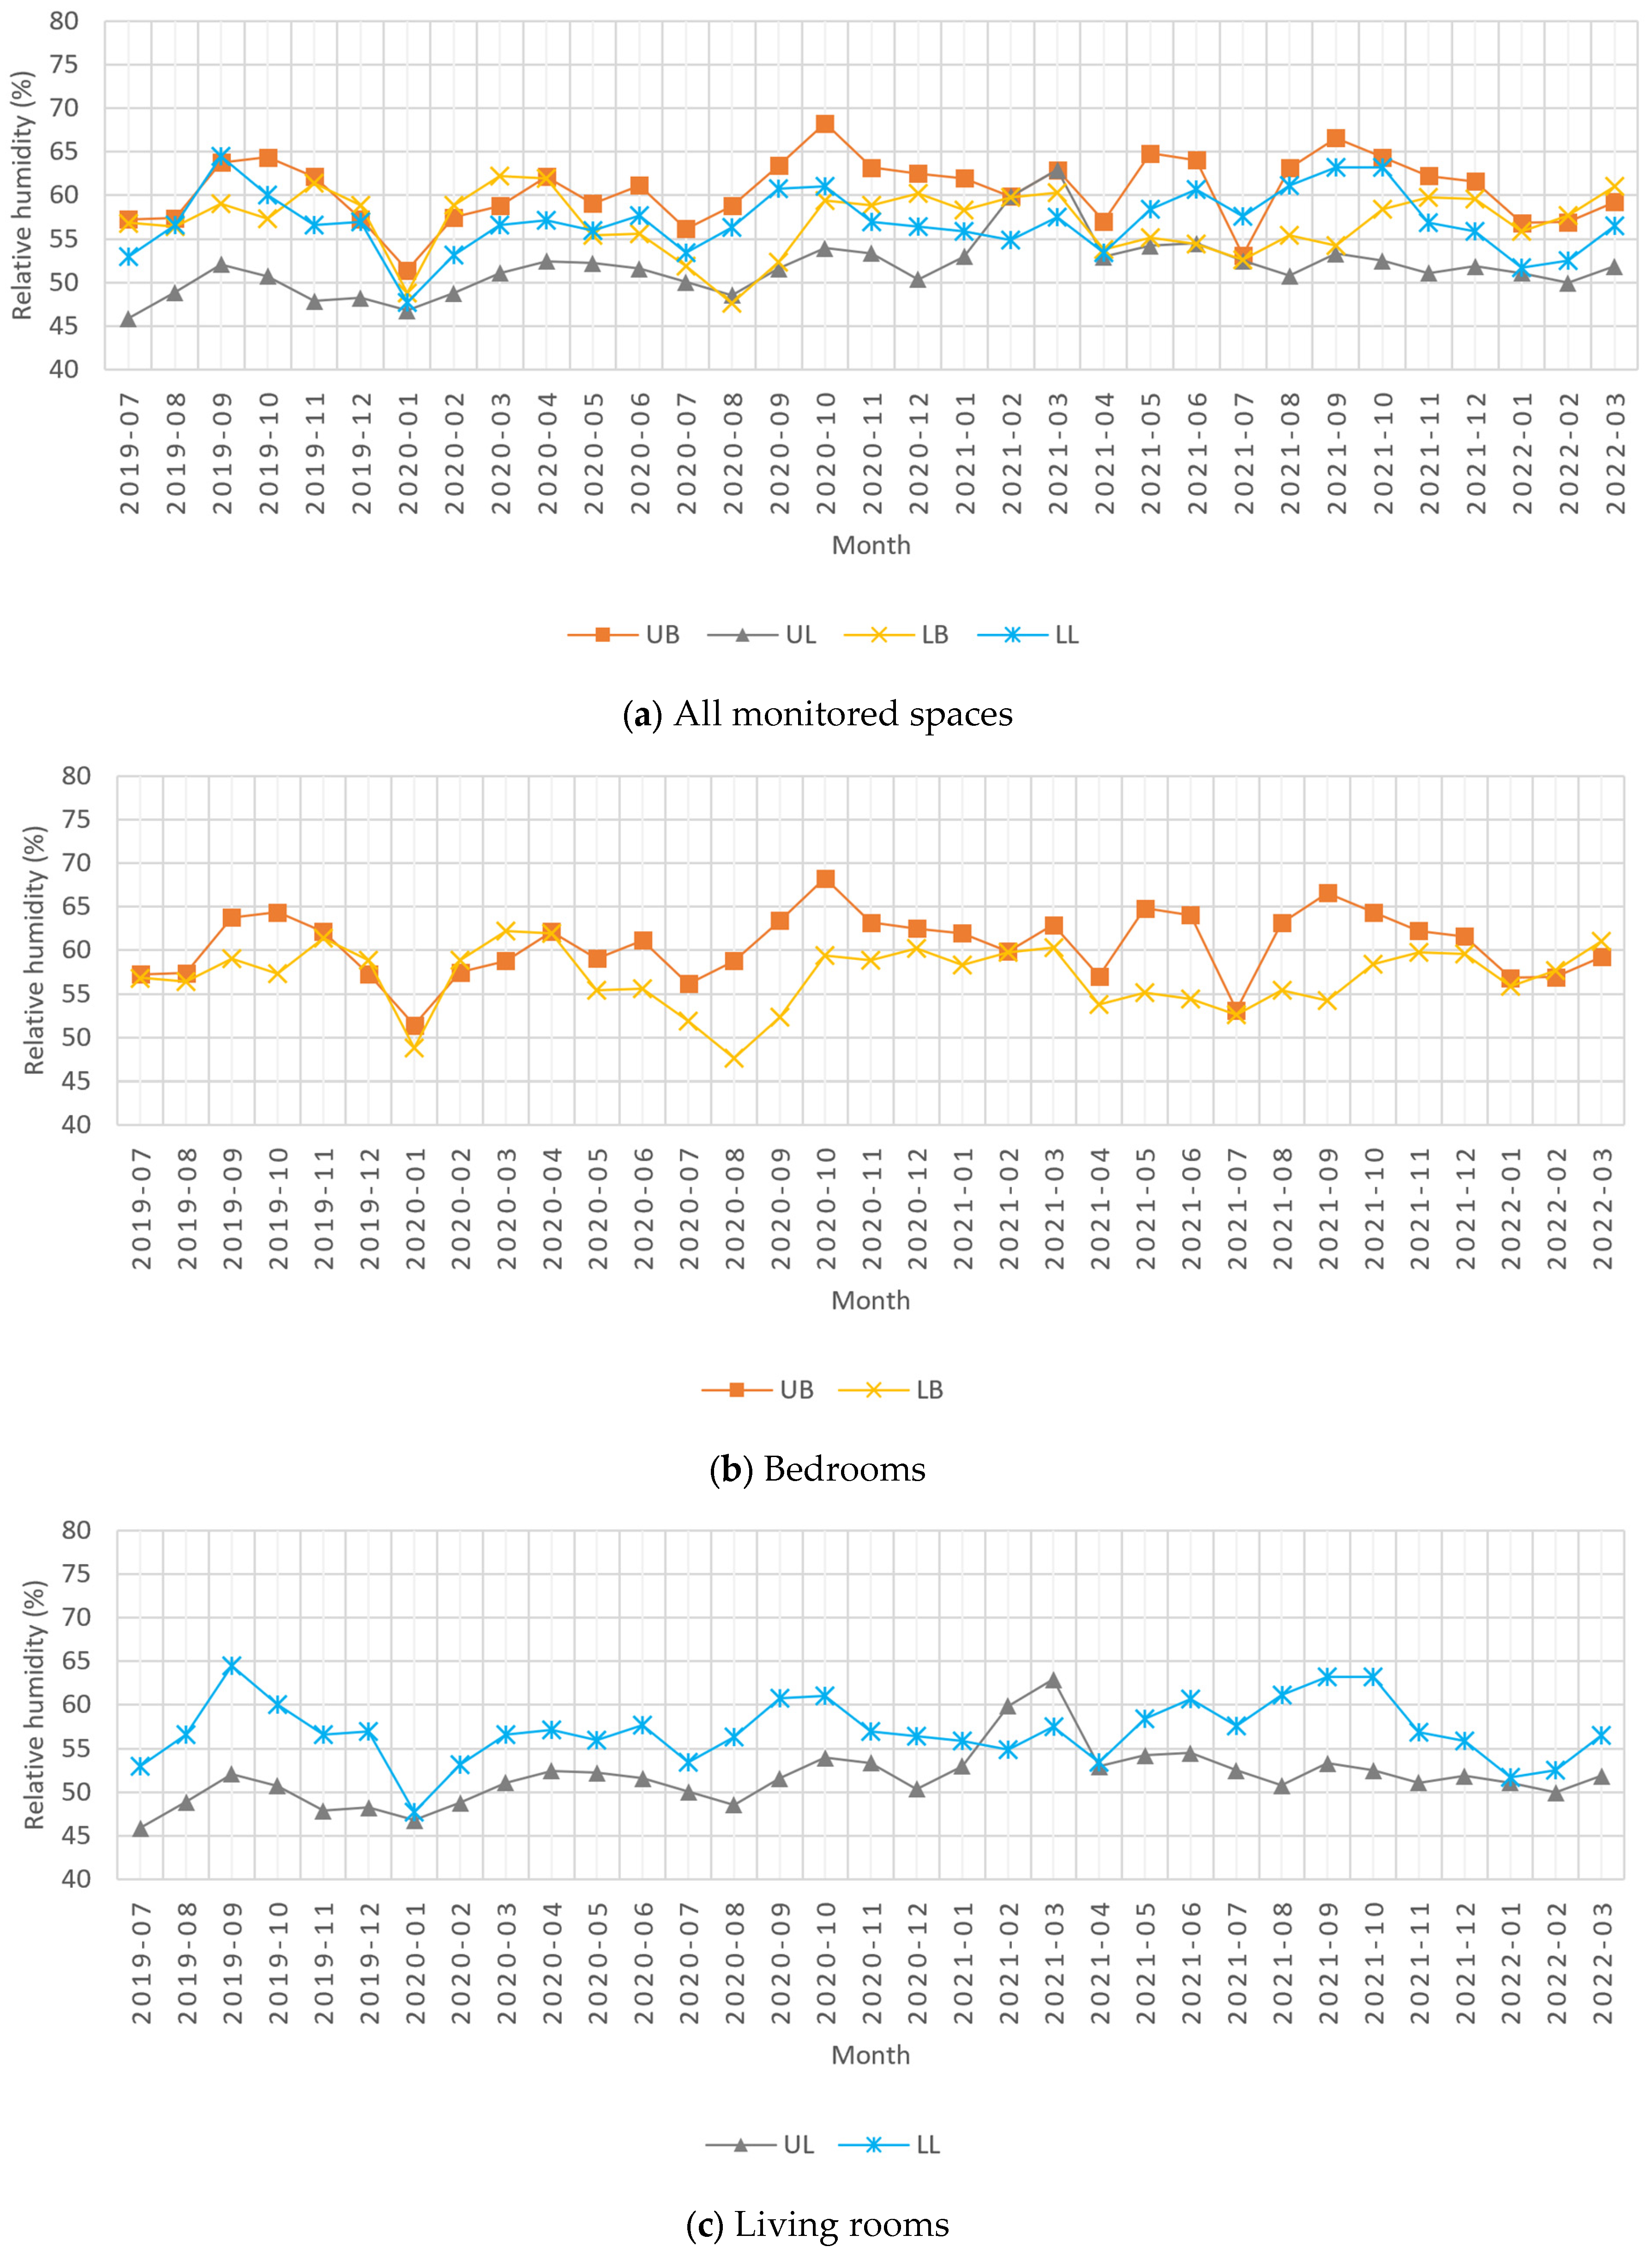
Figure 4 presents the monthly mean relative humidity across the monitored spaces. Figure 4a shows all four monitored spaces, Figure 4b compares the lower and upper bedrooms, and Figure 4c compares the lower and upper living rooms. The overall mean relative humidity values were 56.86% in the lower bedroom, 56.93% in the lower living room, 60.41% in the upper bedroom, and 51.61% in the upper living room. The upper bedroom recorded the highest overall mean relative humidity, whereas the upper living room recorded the lowest. In the lower apartment, the mean relative humidity difference between the living room and bedroom was negligible (+0.07 percentage points). In contrast, the upper living room had a mean relative humidity 8.80 percentage points lower than the upper bedroom. These results show that relative humidity did not follow the same spatial pattern as indoor air temperature.
Figure 4.
Monthly mean relative humidity for (a) all monitored spaces, (b) the lower and upper bedrooms, and (c) the lower and upper living rooms. LB = lower bedroom; LL = lower living room; UB = upper bedroom; UL = upper living room. Data analysis and visualization were performed using Microsoft Excel for Microsoft 365 (Version 2608, Microsoft Corporation, Redmond, WA, USA).
Relative humidity depends on both air temperature and water-vapor content and therefore should not be interpreted as a direct inverse reflection of indoor temperature [19,20,21]. Differences among the monitored rooms may reflect room characteristics, ventilation, moisture generation, occupancy, and cooling operation, although these factors were not systematically monitored [13,19,20,21]. In addition, very small differences, such as that observed between the lower bedroom and lower living room, should be interpreted cautiously in relation to the stated RH measurement accuracy of the sensors.
3.5. Dew Point
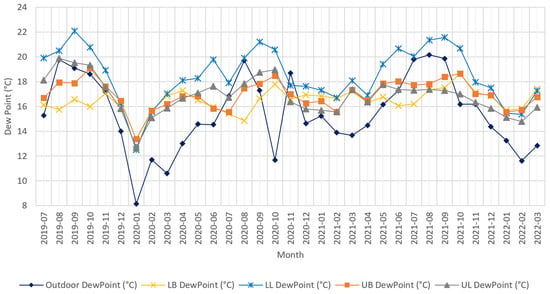
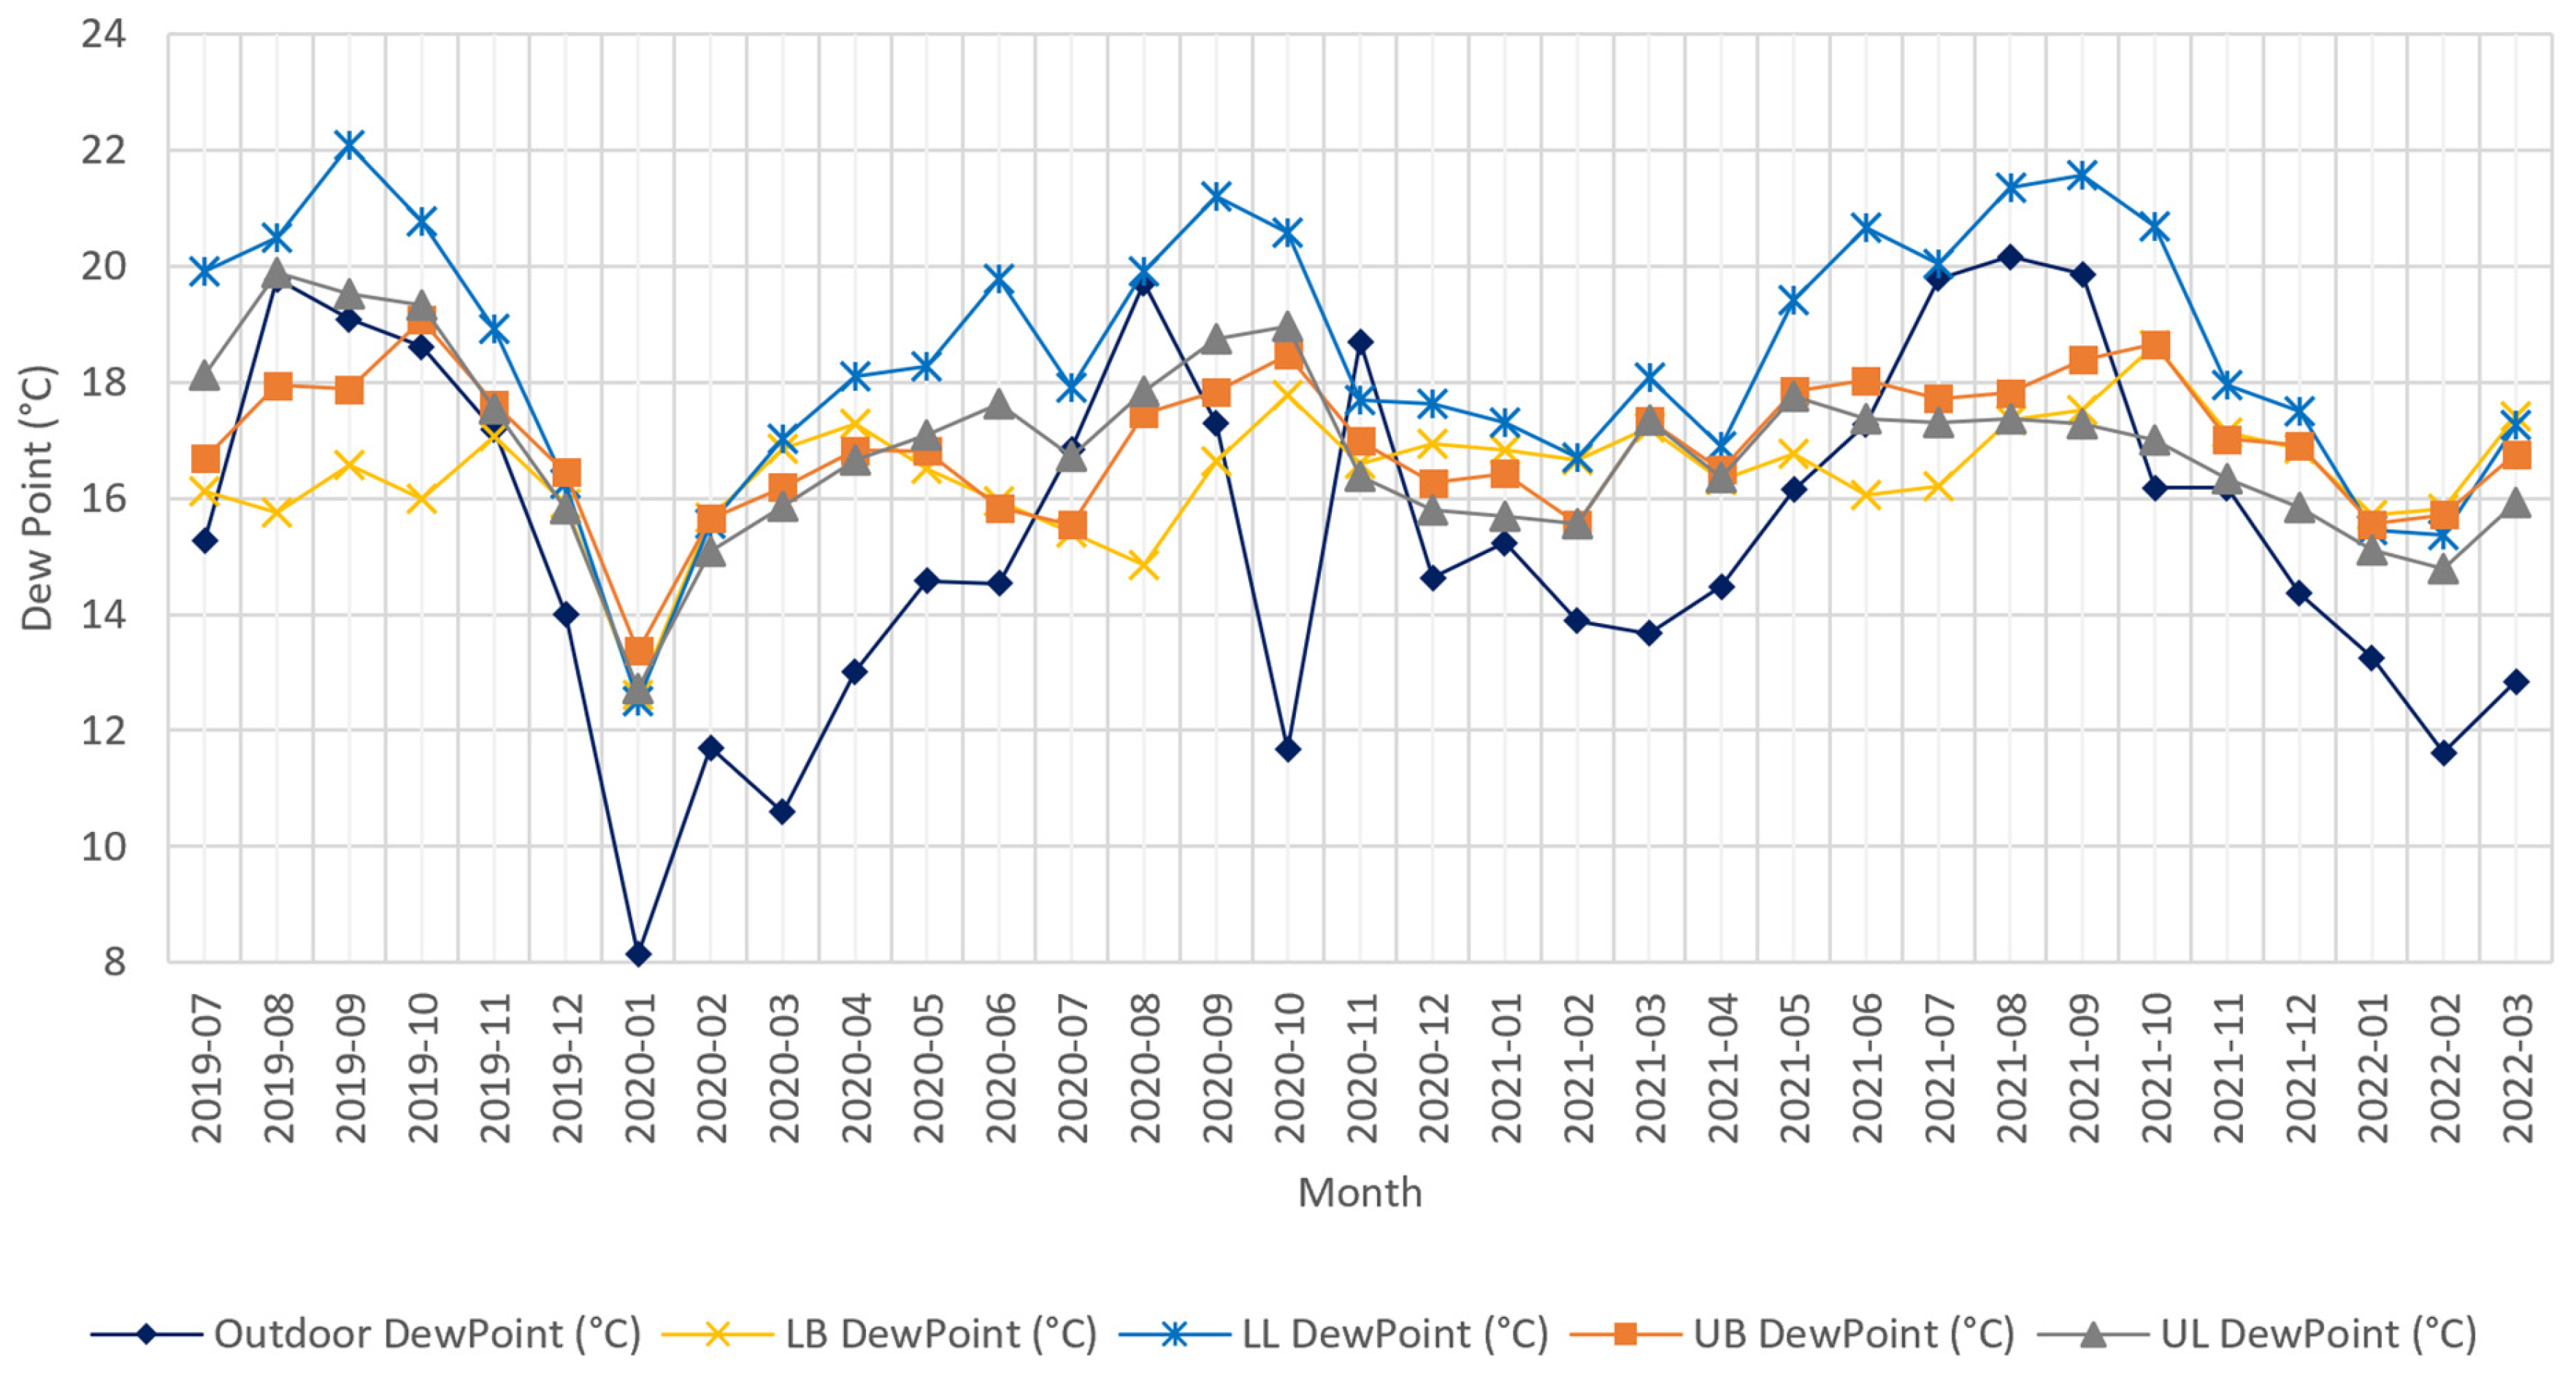
Figure 5 and Table 6 show that dew-point conditions differed across the monitored rooms and followed different spatial patterns from those observed for air temperature. Dew point provides an additional indicator of indoor moisture conditions because it is less affected by air temperature variations than relative humidity and more directly reflects the moisture content of air. This makes it useful for interpreting moisture differences between rooms when indoor temperatures change [20,21,24,25].
Figure 5.
Monthly mean outdoor and indoor dew point temperature from July 2019 to March 2022. Outdoor dew point was obtained from NASA POWER, while indoor dew point values were calculated from the standardized 30 min monitoring dataset for the four monitored rooms: LB, LL, UB, and UL. LB = lower bedroom; LL = lower living room; UB = upper bedroom; UL = upper living room. Data analysis and visualization were performed using Microsoft Excel for Microsoft 365 (Version 2608, Microsoft Corporation, Redmond, WA, USA).
The overall mean dew point values were 16.42 °C in LB, 18.51 °C in LL, 16.92 °C in UB, and 16.85 °C in UL. Unlike air temperature, dew point exhibited a different spatial pattern, with the lower living room recording the highest overall mean value. The lower living room also exhibited the greatest month-to-month dew-point variability, with an SD of monthly means of 2.18 °C and a monthly range of 9.58 °C. Based on the paired monthly comparisons, LL had a mean dew point 2.06 °C higher than LB, whereas the difference between UL and UB was only −0.07 °C. The corresponding-room contrast between UL and LL was −1.64 °C. The very small dew-point difference between UL and UB should be interpreted cautiously in relation to the estimated uncertainty of the derived dew-point values.
This pattern was not fully apparent from air temperature or relative humidity alone, demonstrating the additional value of dew point for room-level indoor hygrothermal assessment. The elevated dew point in the lower living room may reflect the combined influence of room function, apartment layout, room volume, exterior exposure, and HVAC characteristics. The lower apartment used window-type AC units, whereas the upper apartment used mini-split units, and the monitored rooms also differed in volume and exterior exposure, as shown in Table 2 and Table 3. However, because AC runtime, set-point temperature, airflow, and moisture removal were not monitored, the individual effects of HVAC type and room volume cannot be separated from room function and apartment layout.
Condensation risk cannot be determined from indoor dew point alone because it depends on whether local surface temperatures fall below the corresponding dew-point temperature. Because surface temperatures and material moisture were not measured, the observed RH and dew-point patterns should not be interpreted as direct evidence of condensation, mold risk, or envelope moisture damage under ASHRAE Standard 160-2021 [40]. A theoretical condensation estimate was not performed because the actual window thermal properties and interior surface temperatures were not measured. Using assumed U-values would introduce additional uncertainty and would not provide a reliable assessment of condensation risk for the monitored apartments.
Figure 5 provides additional climatic context for interpreting the indoor dew-point results. The outdoor dew point exhibited a clear seasonal cycle, with higher values during the hot season and lower values during the cooler months. The indoor dew-point conditions broadly reflected this seasonal pattern but remained more moderated and displayed persistent room-level differences. The lower living room (LL) generally recorded higher monthly dew-point values and greater temporal variability than the other monitored spaces, consistent with Table 8. These patterns support the interpretation that moisture-related indoor conditions varied across the monitored rooms and cannot be fully represented by a single apartment-level average.
3.6. Synthesis of Findings
Mean temperature differences between room types were more pronounced than those between corresponding rooms in the two apartments. This indicates that the monitored apartments should not be considered uniform indoor zones because bedrooms and living rooms may experience different thermal conditions during actual residential operation. Similar research indicates that variations in room use, occupant behavior, ventilation, and operational routines can create notable differences between spaces within the same home [6,16,17].
In the two monitored apartments, the bedroom–living room temperature contrasts were larger than the corresponding-room contrasts between the apartments. However, this observation should not be interpreted as evidence that room type is generally more influential than floor level. Previous residential studies have reported stronger vertical effects when apartments occupy substantially different building positions, particularly when top-floor dwellings are directly exposed to roof-related solar heat gains [41,42]. For example, Saeed [41] reported higher indoor temperatures in a roof-exposed top-floor apartment than in a ground-floor apartment in Riyadh, Saudi Arabia, while Arriazu-Ramos et al. [42] found substantially lower overheating risk in intermediate-floor apartments than in top-floor apartments.
In the present study, the monitored apartments were located on adjacent floors, without direct ground exposure. However, part of the upper apartment’s living room was located beneath an exposed roof, potentially increasing its exposure to solar heat gains. In addition, apartment identity was confounded with household, layout, and HVAC type. Therefore, the relatively small corresponding-room temperature contrasts observed here should be interpreted as case-specific differences rather than as evidence of a weak or negligible floor-level effect. These results emphasize the importance of considering room-level differences when characterizing indoor conditions in occupied apartments [6,16,17].
Taken together, the results provide long-term descriptive evidence that indoor hygrothermal conditions can vary substantially among rooms within occupied residential apartments. The observed patterns were not identical across air temperature, relative humidity, and dew point. In particular, the larger bedroom–living room contrasts observed for air temperature were not consistently reproduced for relative humidity or dew point. The main contribution is documenting the size and temporal variation in these room-level differences under actual residential use, while recognizing that the available data cannot separate the effects of individual architectural, operational, or behavioral factors.
Relative humidity and dew point exhibited spatial patterns that differed from those of air temperature. In particular, dew point revealed a distinct moisture-related condition in the lower living room. The results also show that air temperature alone did not capture the spatial patterns observed for relative humidity and dew point [19,20,21]. Rooms showing persistently higher temperature or moisture-related indicators should therefore be evaluated individually before applying apartment-wide design or operational assumptions. The seasonal analysis also showed that bedroom–living room temperature differences persisted across all three climatic periods but were larger during the hot period than during the cool period (Table 8), demonstrating that the magnitude of these differences varied over time.
3.7. Implications for Sustainable Building Performance and Modeling
The observed room-level temperature differences have implications for building-performance assessment because cooling-load calculations are sensitive to the indoor temperature conditions assigned to each thermal zone. In the present study, the living rooms were approximately 2.2–2.6 °C warmer than the corresponding bedrooms. If a single apartment-wide indoor temperature represents spaces with different thermal conditions, the resulting cooling-load estimate may not reflect actual room-level conditions. Depending on the uniform temperature selected, cooling demand in individual rooms may therefore be overestimated or underestimated. The present study did not measure energy consumption and therefore does not quantify the resulting energy or carbon effect; however, the findings indicate that room-level thermal conditions should be considered when defining indoor boundary conditions for residential building-performance models.
For building-performance modeling, the observed room-level differences indicate that bedrooms and living rooms should not automatically be represented using a single uniform indoor-zone assumption. Where multi-zone simulation is used, functionally distinct rooms should be represented as separate thermal zones when their geometry, external exposure, occupancy pattern, or conditioning strategy differs. The present monitoring data can provide room-specific temperature and moisture target profiles for future model calibration rather than relying only on apartment-level average conditions. Future model calibration should therefore include measured or independently characterized occupancy schedules, air-conditioning operation, internal moisture generation, and ventilation-related inputs, because these parameters were not directly monitored in the present study.
4. Conclusions
This study examined long-term room-level hygrothermal conditions in two vertically adjacent occupied apartments in Jeddah, Saudi Arabia, using indoor air temperature, relative humidity, and derived dew point data collected over 33 months. The 33-month monitoring period showed that room-level differences persisted across seasons while their magnitude varied over time, information that cannot be captured reliably from short-term measurements alone. The results demonstrated persistent spatial and temporal differences among the four monitored rooms. In both apartments, living-room air temperatures were generally higher than bedroom temperatures, whereas relative humidity and dew point exhibited different spatial patterns. These findings show that room-level conditions cannot necessarily be represented adequately by a single apartment-level average. Accordingly, residential field-monitoring studies should consider measurements in more than one functionally distinct room when the objective is to characterize whole-apartment hygrothermal conditions.
Accordingly, building-performance assessments should use room-specific indoor conditions when functionally different spaces show persistent thermal differences, rather than assigning one uniform temperature condition to the entire apartment. For air temperature, the observed bedroom–living room contrasts were larger than the corresponding-room contrasts between the two apartments. However, this pattern was specific to the two monitored cases and should not be interpreted as evidence of a general room-type effect or as evidence that floor position is unimportant. Relative humidity did not follow the same spatial pattern, and the dew-point analysis further demonstrated that moisture-related differences were distinct from temperature differences. The three variables should therefore be interpreted separately rather than assuming that they follow the same room-level pattern.
Several limitations should be considered. Air-conditioning operation, occupancy patterns, door and window use, and room-use behavior were not directly monitored. Because the monitoring period included the COVID-19 pandemic, unrecorded changes in time spent at home and residential operating practices during this period may also have influenced the observed indoor conditions. The two apartments also had non-identical layouts and different types of air-conditioning systems. The study was also limited to two apartments within a single building, and one monitoring point was used in each room; therefore, within-room spatial variations were not evaluated. These findings should be interpreted as case-study evidence rather than universally generalizable results. The monitored apartments and rooms should not be considered statistically representative of the wider residential building stock in Jeddah.
Future research should include occupancy data, air-conditioning schedules, and door and window use. Examining various apartments, building types, and layouts would help determine whether the room-level patterns observed are consistent across different occupied residential environments in hot-arid coastal climates. Such investigations would strengthen the evidence base for improving the understanding of indoor hygrothermal performance in occupied residential buildings under hot-arid coastal climates. Overall, the findings show that, in the monitored apartments, room-level monitoring captured hygrothermal differences that were obscured by apartment-level averages. These findings can support more representative monitoring and modeling approaches for sustainable residential building performance in hot-arid climates.
Funding
This research received no external funding.
Institutional Review Board Statement
Not applicable. The study involved only non-invasive indoor environmental monitoring and did not collect personal, behavioral, or identifiable occupant data.
Informed Consent Statement
Not applicable. The occupants provided verbal permission for the installation of the indoor environmental monitoring devices. No personal, behavioral, or identifiable occupant data were collected.
Data Availability Statement
The datasets presented in this article are not publicly available because they form part of an ongoing research program and include long-term measurements collected in privately occupied residential apartments. Requests to access the datasets should be directed to the corresponding author.
Acknowledgments
During the preparation of this manuscript, the author used AI-assisted tools for language editing and improving the clarity of the text. The author subsequently reviewed, revised, and verified the entire manuscript and assumes full responsibility for its content.
Conflicts of Interest
The author declares no conflicts of interest.
Abbreviations
The following abbreviations are used in this manuscript:
| NOAA | National Oceanic and Atmospheric Administration |
| NASA | National Aeronautics and Space Administration |
| CDO | Climate Data Online |
| TAVG | Daily average outdoor air temperature |
| RH | Relative humidity |
| SD | Standard deviation |
| LB | Lower bedroom |
| LL | Lower living room |
| UB | Upper bedroom |
| UL | Upper living room |
| HVAC | Heating, Ventilation, and Air Conditioning |
| AC | Air conditioning |
| SBC | Saudi Building Code |
| BTU | British Thermal Unit |
References
- Yao, H.; Cheng, X.; Wei, S.; Lv, Y.; Li, A.; Shen, X. Sampling method for long-term monitoring of indoor environmental quality in residential buildings. Build. Environ. 2022, 215, 108965. [Google Scholar] [CrossRef] [Scilit]
- Kakoulli, C.; Kyriacou, A.; Michaelides, M.P. A review of field measurement studies on thermal comfort, indoor air quality and virus risk. Atmosphere 2022, 13, 191. [Google Scholar] [CrossRef] [Scilit]
- Longares, J.M.; Mselle, B.D.; Gutierrez Galindo, J.I.; Ballestin, V. Dynamic indoor environmental quality assessment in residential buildings: Real-time monitoring of comfort parameters using LoRaWAN. Energies 2024, 17, 5534. [Google Scholar] [CrossRef] [Scilit]
- Aqilah, N.; Rijal, H.B.; Zaki, S.A. A review of thermal comfort in residential buildings: Comfort threads and energy saving potential. Energies 2022, 15, 9012. [Google Scholar] [CrossRef] [Scilit]
- Sansaniwal, S.K.; Mathur, J.; Garg, V.; Gupta, R. Review of studies on thermal comfort in Indian residential buildings. Sci. Technol. Built Environ. 2020, 26, 727–748. [Google Scholar] [CrossRef] [Scilit]
- Du, J.; Pan, W.; Yu, C. In-situ monitoring of occupant behavior in residential buildings—A timely review. Energy Build. 2020, 212, 109811. [Google Scholar] [CrossRef] [Scilit]
- Rodríguez-Vidal, I.; Hernández-Minguillón, R.J.; Otaegi, J. Long-term analysis of energy consumption and thermal comfort in a passivhaus apartment in Spain. Buildings 2024, 14, 878. [Google Scholar] [CrossRef] [Scilit]
- Almomani, A.Q.M.; Almeida, R.M.S.F.; Vicente, R.; Barreira, E. Long-term monitoring of thermal comfort in three apartments in Jordan. Build. Res. Inf. 2025, 53, 965–982. [Google Scholar] [CrossRef] [Scilit]
- Daly, D.; Harada, T.; Tibbs, M.; Cooper, P.; Waitt, G.; Tartarini, F. Indoor temperatures and energy use in NSW social housing. Energy Build. 2021, 249, 111240. [Google Scholar] [CrossRef] [Scilit]
- Huang, K.; Song, J.; Feng, G.; Chang, Q.; Jiang, B.; Wang, J.; Sun, W.; Li, H.; Wang, J.; Fang, X. Indoor air quality analysis of residential buildings in northeast China based on field measurements and longtime monitoring. Build. Environ. 2018, 144, 171–183. [Google Scholar] [CrossRef] [Scilit]
- Dai, X.; Liu, J.; Li, X.; Zhao, L. Long-term monitoring of indoor CO2 and PM2.5 in Chinese homes: Concentrations and their relationships with outdoor environments. Build. Environ. 2018, 144, 238–247. [Google Scholar] [CrossRef] [Scilit]
- Hong, T.; Yan, D.; D’Oca, S.; Chen, C. Ten questions concerning occupant behavior in buildings: The big picture. Build. Environ. 2017, 114, 518–530. [Google Scholar] [CrossRef] [Scilit]
- Baeza-Romero, M.T.; Dudzinska, M.R.; Amouei Torkmahalleh, M.; Barros, N.; Coggins, A.M.; Ruzgar, D.G.; Kildsgaard, I.; Naseri, M.; Rong, L.; Saffell, J.; et al. A review of critical residential buildings parameters and activities when investigating indoor air quality and pollutants. Indoor Air 2022, 32, 1–16. [Google Scholar] [CrossRef] [Scilit] [PubMed]
- IEA EBC Annex 66. Definition and Simulation of Occupant Behavior in Buildings. IEA Energy in Buildings and Communities Programme. 2023. Available online: www.iea-ebc.org (accessed on 6 July 2026).
- Alosaimi, A.H.; Mezaien, A.A. Assessing indoor air temperature in educational buildings: A case study at Jazan University, Saudi Arabia. J. Eng. Sci. Technol. 2026, 21, 368–391. [Google Scholar]
- Morey, J.; Beizaee, A.; Wright, A. An investigation into overheating in social housing dwellings in central England. Build. Environ. 2020, 176, 106814. [Google Scholar] [CrossRef] [Scilit]
- La Fleur, L.; Rohdin, P.; Moshfegh, B. Energy use and perceived indoor environment in a Swedish multifamily building before and after major renovation. Sustainability 2018, 10, 766. [Google Scholar] [CrossRef] [Scilit]
- Safarova, S.; van Hoof, J.; Law, L.; Zander, K.K.; Garnett, S.T. Thermal comfort in a tropical savanna climate: The case of home occupants in Darwin, Australia. Energy Build. 2022, 266, 112074. [Google Scholar] [CrossRef] [Scilit]
- Künzel, H.M. Indoor relative humidity in residential buildings—A necessary boundary condition to assess the moisture performance of building envelope systems. Eng. Environ. Sci. 2014, 56, 31–41. [Google Scholar]
- Ade, R.; Rehm, M.; Vishnupriya, V. What is drier? Understanding humidity in green-certified dwellings: A winter case study from Auckland, New Zealand. J. R. Soc. New Zeal. 2025, 55, 1959–1978. [Google Scholar] [CrossRef] [Scilit] [PubMed]
- Martin, E.; Khan, T.; Nigusse, B.A.; Withers, C.R. Estimating internal moisture generation rates in recently constructed, occupied homes in the southeastern United States. Sci. Technol. Built Environ. 2024, 30, 833–857. [Google Scholar] [CrossRef] [Scilit]
- Abdul Hamid, A.; von Platten, J.; Mjörnell, K.; Johansson, D.; Bagge, H. Determining the impact of high residential density on indoor environment, energy use, and moisture loads in Swedish apartments-and measures for mitigation. Sustainability 2021, 13, 5446. [Google Scholar] [CrossRef] [Scilit]
- Qiao, J.; Zhang, X.; Xiao, F.; Li, Y.; Gao, W. Experimental investigation of mold growth risk among typical residential indoor materials: Case study in coastal city, China. Energy Build. 2024, 304, 113885. [Google Scholar] [CrossRef] [Scilit]
- Pergantis, E.N.; Dhillon, P.; Premer, L.D.R.; Lee, A.H.; Ziviani, D.; Kircher, K.J. Humidity-aware model predictive control for residential air conditioning: A field study. Build. Environ. 2024, 266, 112093. [Google Scholar] [CrossRef] [Scilit]
- He, Y.; Liu, M.; Zhao, Z.; Li, S.; Zhang, X.; Zhou, J. Condensation risk under different window-opening behaviours in a residential building in Changsha during plum rains season. Buildings 2025, 15, 1536. [Google Scholar] [CrossRef] [Scilit]
- Alaboud, M.; Gadi, M. Evaluation of indoor thermal environmental conditions of residential buildings in Saudi Arabia. Energies 2022, 15, 1603. [Google Scholar] [CrossRef] [Scilit]
- AlFaraidy, F.A.; Azzam, S. Residential buildings thermal performance to comply with the energy conservation code of Saudi Arabia. Eng. Technol. Appl. Sci. Res. 2019, 9, 3949–3954. [Google Scholar] [CrossRef] [Scilit]
- Alrashed, F.; Asif, M. Trends in residential energy consumption in Saudi Arabia with particular reference to the Eastern province. J. Sustain. Dev. Energy Water Environ. Syst. 2014, 2, 376–387. [Google Scholar] [CrossRef] [Scilit]
- Krarti, M.; Aldubyan, M.; Williams, E. Residential building stock model for evaluating energy retrofit programs in Saudi Arabia. Energy 2020, 195, 116980. [Google Scholar] [CrossRef] [Scilit]
- Rodrigues, L.; Cherian, B.A.; Tokbolat, S. Reducing cooling energy demand in Saudi Arabian residential buildings using passive design approaches. Buildings 2025, 15, 1895. [Google Scholar] [CrossRef] [Scilit]
- Saudi Building Code National Committee-SBC 602. Saudi Energy Conservation Code for Low-Rise (Residential) Buildings (SBC 602); The Saudi Building Code National Committee (SBCNC): Riyadh, Saudi Arabia, 2018. Available online: https://www.sbc.gov.sa (accessed on 8 November 2025).
- Abuhussain, M.A.; Al-Tamimi, N.; Alotaibi, B.S.; Singh, M.K.; Kumar, S.; Elnaklah, R. Impact of courtyard concept on energy efficiency and home privacy in Saudi Arabia. Energies 2022, 15, 5637. [Google Scholar] [CrossRef] [Scilit]
- Alaidroos, A.; Krarti, M. Optimal design of residential building envelope systems in the Kingdom of Saudi Arabia. Energy Build. 2015, 86, 104–117. [Google Scholar] [CrossRef] [Scilit]
- Mezaien, A.A.; Baltazar, J.C. Operational carbon impact of integrating alternative cooling systems and renewables in arid homes. In Proceedings of the Building Simulation 2025: 19th Conference of IBPSA; IBPSA: Brisbane, Australia, 2025; Volume 19. [Google Scholar]
- ASHRAE Standard 169-2020; Climatic Data for Building Design Standards. ASHRAE and the American National Standards Institute: Peachtree Corners, GA, USA, 2021; Volume 8400.
- Mahdavi, A.; Berger, C.; Bochukova, V.; Bourikas, L.; Hellwig, R.T.; Jin, Q.; Pisello, A.L.; Schweiker, M. Necessary conditions for multi-domain indoor environmental quality standards. Sustainability 2020, 12, 8439. [Google Scholar] [CrossRef] [Scilit]
- ASHRAE Standard 55-2023; Thermal Environmental Conditions for Human Occupancy. ASHRAE: Peachtree Corners, GA, USA, 2023.
- Alduchov, O.A.; Eskridge, R.E. Improved Magnus form approximation of saturation vapor pressure. J. Appl. Meteorol. 1996, 35, 601–609. [Google Scholar] [CrossRef] [Scilit]
- ISO 7730; Ergonomics of the Thermal Environment—Analytical Determination and Interpretation of Thermal Comfort Using Calculation of the PMV and PPD Indices and Local Thermal Comfort Criteria. International Organization for Standardization: Geneva, Switzerland, 2025; Volume 2025. Available online: www.iso.org (accessed on 1 September 2026).
- ASHRAE Standard 160-2021; Criteria for Moisture-Control Design Analysis in Buildings. ASHRAE: Peachtree Corners, GA, USA, 2021; Volume 8400.
- Saeed, S.A.R. The effect of vertical location on thermal performance of multistorey apartments in Riyadh, Saudi Arabia Abstract Organizational access. Energy Build. 1989, 14, 51–59. [Google Scholar] [CrossRef] [Scilit]
- Arriazu-Ramos, A.; Bes-Rastrollo, M.; Guti´errez, A.S.-O.; Monge-Barrio, A. Building parameters that influence overheating of apartment buildings in a temperate climate in Southern Europe. Build. Environ. 2023, 228, 109899. [Google Scholar] [CrossRef] [Scilit]

Disclaimer/Publisher’s Note: The statements, opinions and data contained in all publications are solely those of the individual author(s) and contributor(s) and not of MDPI and/or the editor(s). MDPI and/or the editor(s) disclaim responsibility for any injury to people or property resulting from any ideas, methods, instructions or products referred to in the content. |
© 2026 by the author. Licensee MDPI, Basel, Switzerland. This article is an open access article distributed under the terms and conditions of the Creative Commons Attribution (CC BY) license.