


Abstract
Cultural misalignment in multicultural IT teams drives conflict, strain and avoidable turnover, making it a social sustainability risk for knowledge work. Using survey data from 136 IT professionals in 22 countries, analyzed at the individual level, this exploratory study examines whether Communication-Fit (CF) and Value-Fit (VF) can support sustainable risk management. CF (b = 0.279, p = 0.009) and cultural intelligence (b = 0.504, p = 0.008) were the only significant correlates of team effectiveness (R2 = 0.12), a pattern that held in three of four alternative outcome measures. The indirect effect of cultural intelligence through CF (13.5–16.5%) was not conclusively supported once covariates were entered. A reproducible Cultural Misalignment Risk index, CMR = 0.625(1 − CF) + 0.375(1 − VF), correlated negatively with effectiveness (r = −0.24, p = 0.005), robustly across weighting schemes. Under repeated nested cross-validation excluding outcome items and demographics, classifiers discriminated high- from low-effectiveness respondents only weakly (mean AUC 0.52–0.66), and one composite cut-point (CF × VF > 0.42) emerged repeatedly, though its location varied across resamples. Because the data are individual perceptions collected cross-sectionally, the use of CF, VF and CMR for aggregated team monitoring in sustainable human resource management (SDG 8, SDG 10) is presented as a possibility requiring longitudinal validation, and not as a basis for individual-level prediction or selection.
1. Introduction
1.1. The Evolving Landscape of Multicultural IT Team Management
The globalization of information technology (IT) service delivery has fundamentally transformed how software project teams are composed and managed. According to the Project Management Institute (PMI, 2024) [1], 61% of project managers now operate in at least partially remote configurations, and hybrid delivery models have expanded by 57% since 2020. Deloitte (2024) [2] reports that 71% of business leaders consider culturally diverse teams to be critical incubators of organizational agility and innovation. Simultaneously, industry data indicate that worldwide IT spending will exceed USD 5.74 trillion in 2025 and USD 6.08 trillion in 2026 [3], with over 78% of large-scale IT projects executed by multicultural teams distributed across multiple time zones and cultural contexts.
Ukraine’s IT sector represents a particularly illustrative case: with USD 6.45 billion in service exports and approximately 307,000 professionals collaborating with clients in 33+ countries [4,5], Ukrainian IT companies have institutionalized multicultural collaboration as a structural feature of their delivery model. This globalization creates concrete managerial challenges: differences in values, communication norms, decision-making styles, and uncertainty tolerance may compromise team alignment, escalate conflict intensity, and reduce project predictability [1,2].
Despite the maturity of Agile, Scrum, and Kanban methodologies [6,7,8], standardized process frameworks were originally designed for culturally homogeneous teams and require substantial adaptation in multicultural contexts [9,10]. Existing cross-cultural management research (Hofstede [11], Hall [12], Schwartz [13], Trompenaars [14], Meyer [15]) provides rich descriptive typologies but offers limited operational guidance for real-time risk detection.
These challenges are not confined to project economics. Persistent cultural misalignment translates into interpersonal conflict, chronic communication strain and elevated voluntary turnover, which erode precisely the resource that knowledge-intensive industries depend on most: skilled, motivated and psychologically safe people. In the terminology of sustainable human resource management, such teams consume human capital faster than they regenerate it [16,17,18]. Cultural risk in distributed IT delivery is therefore not only a managerial efficiency issue but a social sustainability issue, and it is on this premise that the present study is built.
1.2. Cultural Misalignment as a Social Sustainability Problem
Sustainability in organizational research is conventionally decomposed into environmental, economic and social pillars [19]. In knowledge-intensive service industries such as IT, the environmental footprint of delivery is comparatively modest, whereas the social and economic pillars carry the decisive weight: the durability of the sector rests on whether it can reproduce, rather than deplete, its human capital [16,20]. Sustainable human resource management extends this logic by treating employee well-being, retention and regenerative work design as outcomes of equal standing with short-term productivity [17,18,21]. In parallel, the sustainable project management literature has argued that project governance must be evaluated not only by the classical iron triangle but by its longer-term effects on people and resources [22,23].
Multicultural IT teams sit precisely at the intersection of these two literatures, and three sustainability-relevant consequences of cultural misalignment can be distinguished.
First, human sustainability. Communication breakdowns and value conflicts in culturally heterogeneous teams generate chronic interpersonal friction, reduce psychological safety and increase the likelihood of burnout and voluntary exit [24,25]. Because replacing an experienced engineer requires months of recruitment, onboarding and tacit-knowledge transfer, each avoidable departure represents a net loss of accumulated human capital rather than a neutral substitution [26].
Second, resource sustainability. Cultural misalignment is realized economically through rework, requirement misinterpretation, duplicated coordination effort and, in severe cases, project restart. Detecting misalignment ex ante rather than ex post therefore reduces the volume of work that must be performed twice—a direct contribution to responsible resource use in service delivery.
Third, institutional resilience. The Ukrainian IT sector illustrates the point in an extreme form: despite full-scale war, distributed and partially relocated teams have sustained service exports of approximately USD 6.45 billion and maintained collaboration with clients across more than thirty countries [4,5]. Continuity of this kind is not a by-product of technology but of the ability of multicultural teams to keep functioning under stress, which makes cultural risk management a component of economic resilience rather than a soft-skills concern.
It follows that the analytical shift pursued in this study—from descriptive diagnosis to measurable, repeatable monitoring—is itself a sustainability argument. Reactive intervention addresses damage that has already been done to people and to project resources; monitoring creates the possibility of addressing misalignment earlier. Accordingly, this study examines CF, VF and the composite Cultural Misalignment Risk index as candidate indicators of the social sustainability of multicultural teamwork, with explicit correspondence to SDG 8, SDG 9 and SDG 10 (Section 5.5), and it tests how far such indicators can, and cannot, be used for prediction.
1.3. From Descriptive Typologies to Measurable Monitoring: The Research Gap
Prior research has extensively documented what cultural dimensions influence team dynamics but has offered comparatively little on how managers can detect emerging cultural misalignment before it degrades measurable team performance. Three specific limitations of the current state of the art are noteworthy.
First, existing instruments—including the Cultural Intelligence Scale (CQS) [27], GLOBE dimensions [28], and Hofstede’s VSM [11]—operate at descriptive and diagnostic levels, providing snapshot assessments rather than continuous risk monitoring. Second, most empirical studies stop at correlational analysis, without validating classification accuracy or establishing operational thresholds usable in management dashboards. Third, the mediating mechanisms through which cultural factors influence team effectiveness remain quantitatively underspecified: while communication and value alignment are widely acknowledged as mediators, the precise decomposition of direct and indirect effects has not been systematically established.
Recent work by Mazur, Chukhray and Dronyuk [29] introduced the CROSS Cycle framework as a five-phase methodology (Cultural Recognition → Role Alignment → Organizational Adaptation → Synergy Building → Sustainability) for adaptive management of multicultural IT teams. Subsequent contributions [30,31,32] formalized the Communication-Fit (CF) and Value-Fit (VF) coefficients within the Universal Team Management–Effectiveness Framework (UTM-EF). However, these prior contributions have focused on descriptive framework development rather than on empirical testing. The present study extends this research program by testing, with explicit leakage controls, how far CF and VF can serve as monitoring indicators and whether they support individual-level prediction. Table 1 summarizes these limitations and positions the present study relative to prior work.
Table 1.
Research gap analysis: from descriptive to monitoring-oriented cultural analytics.
1.4. Research Questions and Objectives
Building on the identified gap, this study addresses three interrelated research questions:
RQ1. How strongly are Communication-Fit, Value-Fit, cultural intelligence and methodology integration associated with team effectiveness, and is the association of cultural intelligence transmitted through Communication-Fit?
RQ2. To what extent can these indicators discriminate between higher- and lower-effectiveness respondents out of sample, and are there stable CF/VF threshold values that could serve as monitoring rules?
RQ3. Can CF and VF be combined into a reproducible Cultural Misalignment Risk (CMR) index that tracks team effectiveness, and how sensitive is it to the choice of weights and cut-points?
The corresponding research objectives are: (i) to estimate the associations of CF, VF, CI and MI with team effectiveness and to decompose the effect of CI into direct and CF-mediated components, with and without covariates; (ii) to evaluate three classification algorithms (Logistic Regression, Random Forest, Gradient Boosting) under repeated nested cross-validation with explicit leakage controls; (iii) to derive and bootstrap-test CF/VF thresholds by Classification and Regression Tree (CART) analysis; (iv) to formalize and validate a two-component CMR index, including weight-sensitivity and discrimination analyses.
1.5. Contributions and Structure
This study makes four principal contributions to the cross-cultural management and sustainable human resource management literatures.
Methodologically, it provides a leakage-controlled evaluation of machine learning for cultural-fit data. Using repeated nested cross-validation, it shows that out-of-sample discrimination of team effectiveness from cultural indicators is modest (AUC 0.52–0.66), and it documents how circular labels or the inclusion of outcome items can produce the very high accuracies sometimes reported in this domain.
Theoretically, it quantifies the decomposition of the effect of Cultural Intelligence on team effectiveness into a direct pathway (86.5% of the total effect; b = 0.504, p = 0.008) and a pathway mediated by Communication-Fit (13.5%; 95% bootstrap CI [−0.012; 0.217]), and reports the sensitivity of that decomposition to model specification, thereby clarifying the relative standing of direct cultural competence and communication mediation as intervention targets.
Instrumentally, it introduces a fully reproducible two-component Cultural Misalignment Risk (CMR) index, reports its sensitivity to weighting and cut-points, and establishes its appropriate use as a monitoring indicator for aggregated team-level trends rather than as a classifier of individuals.
Practically, it provides IT project managers, HR leaders and Scrum Masters with transparent indicators that can be collected through short periodic surveys and reported in aggregate within common project-management platforms (Jira, Asana, Monday.com), supporting earlier and non-discriminatory attention to cultural risk.
In sustainability terms, the study contributes an operational instrument to the sustainable human resource management agenda. Whereas sustainable HRM research has established the normative case for regenerative work design, it has offered comparatively few validated, high-frequency measurement instruments through which managers can act on that case in real time [17,35]. The CMR index provides one such instrument for the multicultural, distributed setting, together with exploratory, empirically derived cut-points and an explicit mapping to the Sustainable Development Goals. Figure 1 presents the conceptual research model.
Figure 1.
Conceptual research model: from cultural value orientations to perceived fit and team effectiveness. Source: developed by the authors based on the theoretical synthesis of [11,12,13,27,36,37].
2. Theoretical Background and Related Work
The analytical framework proposed in this study rests on the convergence of three research streams: (i) cultural dimension theory and its operationalization in team settings; (ii) mediation-based explanations of how cultural factors translate into team outcomes; and (iii) the emerging application of machine learning to human-resource and team analytics. This section systematizes each stream and derives the study’s research hypotheses.
2.1. Cultural Dimensions in Multicultural Team Management
The theoretical bedrock of cross-cultural management remains Hofstede’s model of national culture, which distinguishes six dimensions—Power Distance (PDI), Individualism (IDV), Uncertainty Avoidance (UAI), Masculinity (MAS), Long-Term Orientation (LTO), and Indulgence versus Restraint (IVR) [11]. A three-decade multilevel meta-analysis by Taras, Kirkman and Steel [38] confirmed the predictive validity of these dimensions across 598 studies, while also cautioning that cultural values explain a modest but consistent share of behavioral variance—typically 8–15% at the individual level. This effect-size range is critical context for the present study: it establishes that cross-cultural models are expected to yield moderate rather than large explanatory power, and that R2 values in the 0.10–0.18 band are typical and theoretically meaningful in this domain.
Hall’s high-context/low-context framework [12] complements Hofstede by focusing specifically on communication patterns, distinguishing cultures in which meaning is embedded in implicit context (Japan, China, Arab states) from those favoring explicit, direct messaging (Germany, Scandinavia, the United States). This distinction is particularly consequential for IT teams, where miscommunication between high- and low-context members is a documented driver of coordination failure [39,40]. Schwartz’s theory of basic human values [13] and the World Values Survey (WVS) traditional-secular axis [41] provide a third layer, capturing value orientations that shape trust formation and conflict tolerance.
A recurrent methodological criticism—the ecological fallacy [42]—warns against inferring individual behavior from national averages. The present study addresses this concern architecturally, by employing individual-level self-assessment rather than assigning national scores to respondents, thereby measuring cultural orientation at the level at which team interaction actually occurs, within organizational cultures that frame how national differences are expressed [43]. Table 2 summarizes how these frameworks are used in the present measurement model.
Table 2.
Cultural frameworks and their role in the measurement model.
2.2. Cultural Mediation Mechanisms in Team Effectiveness
A central theoretical question concerns the pathway through which cultural composition influences team outcomes. Two competing perspectives dominate the literature. The direct-effect perspective holds that culturally intelligent individuals adapt their behavior in ways that improve performance regardless of intermediate processes. The mediation perspective, grounded in Baron and Kenny’s classical framework [44] and Hayes’ contemporary conditional-process analysis [45], contends that cultural factors operate primarily through intervening variables—most prominently communication quality and value alignment.
Empirical evidence has been mixed. Marlow et al. [46], in a meta-analysis of team communication and performance, found that communication mediates cultural effects but that the strength of mediation varies substantially with task type and technology. DeChurch and Mesmer-Magnus [47] demonstrated that cognitive team processes mediate diversity effects, while Stahl et al. [48] found that cultural diversity produces both process losses (conflict) and process gains (creativity), depending on moderating conditions, a pattern echoed in broader reviews of work-group diversity [49,50,51]. This ambiguity has left a critical unanswered question: what proportion of the cultural effect is direct versus mediated?
Kozlowski and Klein’s multilevel theory [36] and Marks et al.’s theory of emergent team states [37] establish that communication and value alignment may function as emergent properties of a team’s interaction network rather than as simple aggregates of individual traits. The present study does not test that proposition directly: its design is cross-sectional and its unit of analysis is the individual professional, so CF and VF are operationalized here as individual-level perceptions of fit with one’s current multicultural project team. This is a deliberate scope restriction rather than a theoretical claim, and Section 6 identifies the multilevel design that would be required to establish emergence empirically. Table 3 summarizes prior evidence on these mediation pathways.
Table 3.
Prior studies on cultural mediation in team effectiveness.
2.3. Machine Learning in Human-Resource and Team Analytics
The application of machine learning (ML) to human-resource management has accelerated markedly, transitioning the field from descriptive reporting toward predictive and prescriptive analytics [53]. Chamorro-Premuzic et al. [54] argue that ML-based talent analytics can outperform human judgment in structured prediction tasks, while Tambe, Cappelli and Yakubovich [55] caution that HR data present distinctive challenges—small samples, causal opacity, and fairness constraints—that require careful methodological handling.
Within team analytics specifically, supervised classification algorithms have been applied to predict team performance, turnover, and collaboration quality. However, three limitations characterize the existing body of work. First, cultural variables are rarely incorporated as predictors, with most models relying on behavioral log data or personality inventories. Second, few studies benchmark multiple algorithms systematically, making it difficult to establish which methods best suit cultural-prediction tasks. Third, and most critically for practice, existing models seldom translate predictions into operational thresholds that managers can act upon.
The choice of algorithms in this study reflects these considerations. Logistic Regression offers interpretability and probabilistic output. Random Forest provides robustness to non-linearity and feature interactions [56]. Gradient Boosting serves as a higher-capacity benchmark [57]. Classification and Regression Trees (CART) are employed to search for interpretable decision thresholds, since their recursive partitioning naturally identifies cut-points [58]; whether such cut-points are stable enough to serve as monitoring rules is treated here as an empirical question. Table 4 positions the present study against representative applications.
Table 4.
Machine learning applications in HR and team analytics (2017–2025).
2.4. Sustainable Human Resource Management and Sustainable Project Management
The sustainable HRM literature reframes the employment relationship as a regenerative rather than extractive one, arguing that practices that maximize short-term output while depleting employee health, motivation and trust are economically self-defeating over the project and organizational life cycle [17,18]. Empirical work in this stream has demonstrated that sustainable HR practices translate into employee outcomes through perceptual and process mechanisms rather than through policy adoption alone [35], and—of particular relevance here—that the effect of sustainable HRM on employee performance is itself moderated by national culture across a 26-country sample [21]. Related evidence links sustainability-oriented HR practices to reduced turnover intention [25] and identifies recruitment as a decisive leverage point for sustainable workforce composition [26]. Monitoring of psychological well-being has likewise been positioned as a precondition of sustainable management rather than an optional welfare activity [59].
Two implications follow for the present study. First, if the effectiveness of sustainable HR practices is culturally contingent, then culturally calibrated diagnostics are a prerequisite for their implementation in multicultural teams—a requirement that the descriptive instruments reviewed in Section 2.1 and Section 2.2 do not satisfy. Second, sustainable HRM has been criticized for its measurement deficit: normative commitments are widely articulated, but the field lacks validated, high-frequency indicators that can be embedded in operational decision-making. The CF/VF/CMR instrumentation developed below is positioned as a response to this deficit within the sustainable project management tradition [22,23], which requires project governance to internalize people-related and resource-related consequences beyond scope, time and cost.
2.5. Research Hypotheses
Synthesizing the three research streams, the study advances four hypotheses that operationalize the research questions stated in Section 1.4.
H1.
Supervised classifiers trained on CF, VF, CI and MI, or on the underlying survey items, will discriminate respondents with above-median from those with at-or-below-median team effectiveness above chance level under repeated nested cross-validation.
H2.
There exist CF/VF threshold values, recoverable through CART recursive partitioning, that are stable across bootstrap resamples and associated with a materially higher share of high-effectiveness respondents.
H3.
The effect of Cultural Intelligence on team effectiveness is partially mediated by Communication-Fit, with a statistically significant direct pathway coexisting with a significant indirect pathway, whereas Value-Fit does not function as a significant mediator.
H4.
A composite Cultural Misalignment Risk (CMR) index constructed from CF and VF will correlate negatively and significantly with measured team effectiveness, supporting its validity as a monitoring indicator.
Figure 2 presents the hypothesis model linking the constructs to team effectiveness, with the corresponding empirical results summarized in Section 4.6.
Figure 2.
Integrated hypothesis model. Source: developed by the authors based on the theoretical foundations of [27,36,37,44,45,46,47,48,52] and own empirical analysis (N = 136).
3. Methodology
Building on the theoretical foundations and hypotheses established in Section 2, this section describes the research design, measurement and analytical procedures. The design is quantitative and cross-sectional, and all procedures are specified so that the reported results can be reproduced from the data and code described in Appendix A and Appendix B.
3.1. Research Design and Sample
The study employs a cross-sectional online survey. The target population comprised IT professionals with active experience in multicultural project teams. Inclusion criteria required (i) a minimum of one year of IT project experience, (ii) collaboration with representatives of at least two national cultures, and (iii) active project engagement at the time of survey completion. The questionnaire was available in Ukrainian and English and was administered between 16 January 2024 and 30 July 2025. Recruitment used non-probability purposive sampling: the first author distributed the survey link through LinkedIn, closed professional work chats, open professional communities and personal messages, selecting individual invitees and communities with a connection to IT or project management. Because invitations were partly posted in open groups, the number of people reached is unknown and an exact response rate cannot be computed; for direct, individually addressed invitations, it is estimated at approximately 15–20%. Of the 141 responses received, five were not included in the analytic sample: duplicate submissions by the same respondent, and responses that arrived after the dataset had been frozen for analysis; the final sample therefore comprises N = 136 respondents. Participation was voluntary, with informed consent obtained at the survey opening; email addresses recorded by the survey form were not retained in the analysis dataset, and all analyses were performed on de-identified data. Item-level missingness was low for most indicators (0–2.2%) and highest for one methodology item that did not apply to all respondents (30.9%); composite scores were computed as the mean of available items, and for machine-learning analyses, remaining missing values were imputed with the median estimated within each training fold only.
The final sample consists of N = 136 IT professionals from 22 countries, distributed across four organizational typologies: IT departments within non-IT businesses (40.4%), service IT companies (28.7%), product IT companies (27.2%), and hybrid business models (3.7%). The unit of analysis throughout is the individual respondent. Each participant reported on their own experience within their current multicultural project team; respondents were not sampled in team clusters, no team identifiers were collected, and no two responses can be attributed to the same team. Consequently, all constructs, including CF and VF, are individual-level perceptual measures, and no within-team aggregation, intraclass correlation or within-group agreement statistics are computed or claimed. Table 5 summarizes sample characteristics.
Table 5.
Sample demographic and professional characteristics (N = 136).
The sample achieves methodological balance across the two key dimensions relevant to hypothesis testing: market origin (Ukrainian market 49.3% vs. international market 50.7%) and methodological orientation (Agile-family methodologies 91.2% vs. traditional 8.8%). This balance minimizes single-context bias while preserving sufficient statistical power for the analyses reported in Section 4. At the same time, the sample is geographically concentrated: 51.5% of respondents are from Eastern Europe and 45.6% from Ukraine. The findings therefore describe multicultural IT teams with a substantial Eastern European component and should not be generalized to other regions without replication (Section 6.1).
Sample-size adequacy was assessed against three benchmarks: (i) Bartlett’s criterion for factor analysis (N > 5 × number of variables = 100); (ii) Cohen’s guideline for multiple regression detecting medium effects at α = 0.05, β = 0.80 (N = 85 for four predictors) [60]; and (iii) the empirical distribution of sample sizes in comparable cross-cultural management studies (typically N = 100–250). The achieved N = 136 satisfies all three benchmarks.
3.2. Measurement Instruments
All constructs were measured with closed items on five-point scales and are formed as an unweighted means of their items or item parcels (full wording, item assignment and scoring in Appendix A). Cultural value orientations were captured with single items adapted from Hofstede’s Values Survey Module (power distance, uncertainty avoidance, long-term orientation, achievement and caring orientation, individualism), complemented by items informed by Schwartz and the World Values Survey. Cultural Intelligence (CI) is a brief four-parcel composite of cultural awareness and orientation informed by the Cultural Intelligence Scale [27,61]; it is not the full 20-item CQS. It should be emphasized that CF, VF, CI and MI are exploratory composite indices constructed for this study from items adapted for the present context. They are not previously validated scales; they have not undergone independent psychometric validation, and the correspondence between each index and its constituent indicators is documented in Appendix A so that all reported values can be recomputed. The study is accordingly exploratory in character, and its estimates are best read as first evidence requiring confirmation on independent samples.
Because CI, CF, VF and MI are exploratory formative composites, the conventional reflective criteria (α > 0.70, AVE > 0.50, Fornell-Larcker discriminant validity [62]) are not applicable and are therefore not reported for them. What is reported instead is construct-level collinearity among the four composites when they enter the regression model (all VIF < 1.10, Table 6), which is a diagnostic of the predictor set rather than a validation of the indices themselves; collinearity among the indicators within each composite was not assessed, and the indices have not been psychometrically validated. The single reflective construct, Team Effectiveness, meets the conventional reliability threshold (α = 0.702). The consequences of this measurement structure for model specification are addressed in Section 3.6.
Table 6.
Measurement instruments and reliability estimates.
Communication-Fit is operationalized as the mean of three items: the perceived impact of cultural differences on communication processes in the team, difficulty in understanding interlocutors because of accent or language (coded so that higher values denote fewer difficulties), and the change in communication and interaction following the transition to remote work (coded so that higher values denote improvement). Each item is scored 1–5 and normalized to [0, 1]:
CF = (1/3) · Σj (xj − 1)/4, j = 1, 2, 3
Value-Fit is formed analogously as the mean of five normalized parcels: planning orientation, orientation to tradition, achievement orientation, caring orientation and interdependent work style. Both indices express an individual professional’s perceived fit with their current multicultural project team; they are perceptual measures reported by one respondent, not aggregated group properties.
3.3. Machine Learning Pipeline
The machine-learning component is designed as a test of the limits of individual-level prediction rather than as a deployment model. Three supervised algorithms with complementary properties were evaluated (see Section 2.3): Logistic Regression (LR) for interpretability, Random Forest (RF) for non-linearities and interactions [56], and Gradient Boosting (GB) as a higher-capacity benchmark [57]. A majority-class classifier serves as the baseline. Figure 3 presents the analytical pipeline.
Figure 3.
Analytical pipeline. Source: developed by the authors.
All models were implemented in Python 3.12 with scikit-learn [66] and fixed random seeds. Performance was estimated by repeated nested cross-validation: an outer stratified 5-fold split repeated five times (25 outer test folds) provided the performance estimates, and hyperparameters were selected by grid search within an inner stratified cross-validation on the training portion only, using AUC as the selection criterion, so that no test observation informed model selection or imputation. For each model, we report accuracy, balanced accuracy, macro-F1, sensitivity, specificity and AUC, together with the 2.5th and 97.5th percentiles of the fold-level estimates, which describe variability across partitions rather than the precision of the mean. Hyperparameter grids and the full protocol are given in Appendix B.
The prediction target is binary team effectiveness: respondents above the sample median of the normalized TE index (0.667; 67 of 136 respondents) versus the remainder. Because the two classes are balanced by construction, no oversampling (e.g., SMOTE [67]) was applied. Two predictor sets were evaluated: (1) the four construct indices CF, VF, CI and MI; (2) the 24 underlying ordinal survey items. Two leakage controls were applied throughout. First, the three items that constitute the TE index were excluded from every predictor set. Second, demographic and professional characteristics (sex, age, position, nationality, sector, company type, employment rate) were excluded by design, because an instrument intended for non-discriminatory team monitoring should not rank individuals on protected or quasi-protected attributes. A three-class archetype classification is not used as a test of predictive validity: when class labels are produced by k-means on the same variables that the classifier receives, high accuracy reflects the reproducibility of the clustering rule rather than predictive capability (Appendix B).
3.4. Cart-Based Threshold Derivation
To test H2, classification trees [58] were fitted on (CF, VF, CF × VF) with binary team effectiveness as the target.
The declared constraints were enforced exactly: minimum leaf size of 15 observations, maximum depth of 4, and cost-complexity pruning with α selected by 5-fold cross-validation on balanced accuracy. The stability of candidate thresholds was assessed with 1000 bootstrap resamples, recording the variable selected at the root and the location of the split. Rule precision is reported as the share of high-effectiveness respondents among those satisfying a rule; precision and accuracy are reported separately throughout.
3.5. CMR Index Formalization
The Cultural Misalignment Risk index was constructed as a linear composite of two directly measured components corresponding to communication misfit and value misfit:
where CF and VF are the normalized indices defined in Section 3.2 and CMR ∈ [0, 1], with higher values indicating greater perceived cultural misalignment. The weights preserve the 0.5:0.3 ratio derived from the mediation results reported in Section 4.4, rescaled to sum to unity: Communication-Fit receives the dominant weight as the only component with a specification-robust association with team effectiveness, while Value-Fit contributes the remainder, reflecting diagnostic value despite non-significance as a mediator. Both components are computed from items administered in the present survey, so that the index is fully reproducible from the data reported in Appendix A. A sensitivity analysis across the full weight continuum is reported in Section 4.5.
CMR = 0.625 · (1 − CF) + 0.375 · (1 − VF)
Three interpretive zones were defined a priori: CMR < 0.30 (low risk/operating norm), 0.30 ≤ CMR ≤ 0.50 (moderate risk/requires attention), CMR > 0.50 (elevated risk/requires management attention). Concurrent validity of the index was assessed via Pearson and Spearman correlation with measured team effectiveness, with a hypothesized negative direction (H4), and its discriminative performance was evaluated against a bottom-tercile team-effectiveness criterion.
3.6. Validity, Reliability and Ethical Considerations
Several safeguards address common criticisms of predictive analytics in cross-cultural HRM. Ecological-fallacy risk is limited by using individual self-reports rather than national averages, and no team-level properties are inferred from the data (Section 3.1). Because CI, CF, VF and MI are exploratory formative composites, reflective confirmatory factor analysis is not applicable to them; construct-level collinearity among the composites is reported instead (Table 6), and the indices are presented as exploratory rather than validated instruments. Leakage is controlled as described in Section 3.3. Ethical safeguards included voluntary participation with informed consent and the removal of email addresses from the analysis dataset; these are design commitments consistent with the intent of the GDPR [68] and the EU AI Act [69], not a claim of certified compliance.
Choice of analytical approach. Three specifications were compared before selecting the reported model. A latent structural equation model with listwise deletion (N = 90) produced unacceptable fit (CFI = 0.606, TLI = 0.521, RMSEA = 0.085, χ2(126) = 207.78, p < 0.001), and a latent model with iterative imputation (N = 136) improved but remained below conventional thresholds (CFI = 0.749, TLI = 0.695, RMSEA = 0.056, χ2(126) = 179.87, p = 0.001). The inadequate fit of both latent specifications is attributable to the formative nature of the CI, CF, VF and MI constructs, for which the reflective assumptions of common-factor models do not hold. Path analysis on composite indices was therefore adopted as the reported specification, consistent with recommendations for formative composites [63]. Full output for all three specifications is reported in Appendix C.
4. Results
This section presents the empirical findings organized around the four research hypotheses (H1–H4). Analyses proceed from descriptive statistics and dimensionality reduction, through exploratory value-orientation profiles, out-of-sample classification under nested cross-validation, CART threshold analysis and mediation analysis, to validation of the Cultural Misalignment Risk (CMR) index. All tests use α = 0.05, and effect sizes are reported alongside significance levels.
4.1. Descriptive Statistics and Dimensionality Reduction
Descriptive statistics for the primary constructs are presented in Table 7, reported on the original five-point response scale of the instrument. Construct means range from 3.04 to 3.80, with standard deviations indicating meaningful dispersion for subsequent modeling. Skewness and kurtosis fall within ±1 for all five constructs, supporting the use of parametric estimation. Where normalized values are referenced in later sections, the transformation applied is (x − 1)/4, yielding CF = 0.511, VF = 0.637, CI = 0.645, MI = 0.539 and TE = 0.700.
Table 7.
Descriptive statistics for primary constructs (N = 136).
Principal Component Analysis of the 24 ordinal indicators (excluding the three TE items) yielded a Kaiser-Meyer-Olkin measure of 0.565 [70], which is mediocre but above the conventional minimum of 0.50, and a significant Bartlett test of sphericity (χ2 = 516.5, df = 276, p < 0.001). The Kaiser criterion (eigenvalue > 1) retained nine components, cumulatively explaining 61.18% of total variance (Figure 4).
Figure 4.
Scree plot of principal components with cumulative variance explained (24 indicators; KMO = 0.565; Bartlett’s χ2 = 516.5, df = 276, p < 0.001). Source: computed by the authors.
The dispersion of variance across nine components indicates a multidimensional item structure without a dominant general factor. The first three components account for 29.16% of variance: PC1 (11.32%) loads on perceived cultural impact on processes and management, PC2 (9.30%) on hierarchy and power relations, and PC3 (8.54%) on orientation to tradition and uncertainty. The PCA is used descriptively; the composite indices are defined a priori (Section 3.2) rather than derived from component scores. The R2 = 0.118 obtained in the regression models reported in Section 4.4 is consistent with the effect-size range documented in the Hofstede (8–15%) and GLOBE (12–18%) research traditions [38].
4.2. Exploratory Value-Orientation Profiles
To describe heterogeneity in cultural value orientations, k-means clustering was applied to the 13 standardized value-orientation items (power distance, uncertainty avoidance, long-term orientation, achievement, caring and individualism items). Silhouette coefficients for k = 2–6 ranged from 0.087 to 0.114 (Figure 5), well below the 0.25 threshold for a weak structure, and bootstrap stability of the three-cluster solution was modest (median adjusted Rand index 0.30). The three-cluster solution was retained for interpretability, and the resulting profiles are treated as exploratory descriptions of respondents rather than as empirical team types.
Figure 5.
Silhouette coefficients for k = 2–6 (k-means on 13 value-orientation items; k = 3 selected for interpretability). Source: computed by the authors.
Two findings in Table 8 are substantively relevant. First, the profiles differ strongly on the value orientations used to form them (η2 = 0.085–0.457), yet Communication-Fit does not differ across them (F(2,133) = 0.17, p = 0.847, η2 = 0.002), and neither does team effectiveness (F(2,133) = 0.05, p = 0.949). Perceived communication fit is therefore not reducible to a respondent’s value-orientation profile. Second, this independence should not be over-read as independence from national origin: across the five national groups with at least five respondents (n = 99), CF differed moderately (F(4,94) = 3.53, p = 0.010, η2 = 0.131), although Ukrainian respondents did not differ from all others (p = 0.175). Given the small national subgroups, these contrasts are descriptive; their managerial implication is addressed in Section 5.1.
Table 8.
Exploratory value-orientation profiles (N = 136).
4.3. Out-of-Sample Discrimination Under Nested Cross-Validation (H1)
Table 9 reports the performance of the three algorithms on both predictor sets, together with the majority-class baseline. Figure 6 summarizes the AUC distributions across the 25 outer test folds.
Table 9.
Out-of-sample classification of above-median team effectiveness (repeated nested cross-validation, 5 × 5 outer folds).
Figure 6.
Out-of-sample AUC by predictor set and algorithm (mean and 2.5–97.5th percentile of fold-level estimates across 25 outer test folds; the ranges describe variability across partitions and are not confidence intervals). Green: models on the 24 survey items; blue: models on the four construct indices; grey: majority-class baseline; the red dashed line marks AUC = 0.5. Source: computed by the authors.
Hypothesis H1 is not supported. Mean AUC ranged from 0.520 to 0.660 across models, with the best specification—a random forest on the 24 survey items—reaching a balanced accuracy of 0.613 against a majority-class baseline of 0.507. Performance varied considerably across partitions (fold-level AUC values spanning roughly 0.36 to 0.82), which is expected with N = 136; these percentile ranges describe that variability rather than the precision of the estimates, and no formal test against chance is implied by them. What the results do show is that discrimination is weak and close to the baseline, so the indicators do not support individual-level prediction in this sample. For comparison, two procedures reproduce the much higher accuracies that analyses of this kind can appear to show. Predicting k-means cluster labels from the same items that generated them yields an accuracy of 0.958, and admitting the three TE items as predictors raises the AUC to 0.98 (Appendix B). Both results are artifacts—of circular labeling and of outcome leakage, respectively—and are therefore not interpreted as evidence of predictive validity.
Two further observations qualify this result. First, when demographic and professional characteristics were admitted as predictors in a sensitivity analysis, discrimination improved (AUC ≈ 0.74), with sex, position and nationality among the most influential variables; this specification was rejected on ethical grounds, and the result is reported only to show that apparent predictive gains in this domain can stem from attributes that a non-discriminatory instrument must not use. Second, the modest out-of-sample performance is consistent with the modest, explained variance of the regression models (Section 4.4): cultural-fit indicators carry a real but small signal about individual-reported effectiveness, which may be sufficient for monitoring aggregated trends, pending longitudinal validation, but not for classifying individuals.
4.4. CART Threshold Analysis and Mediation Decomposition (H2, H3)
After cross-validated cost-complexity pruning, the tree retained a single split on the composite term (Figure 7): respondents with CF × VF > 0.42 (n = 27, 19.9% of the sample) comprised 77.8% of high-effectiveness respondents (21 of 27), against 42.2% among the remaining 109. The pruned tree achieved a cross-validated balanced accuracy of 0.598.
Figure 7.
Pruned CART tree on (CF, VF, CF × VF) and bootstrap distribution of the root split (1000 resamples); the distribution shows how often CF × VF is selected and how widely the split location varies; the red dashed line marks the median bootstrap split (0.420). Source: computed by the authors.
Hypothesis H2 is partially supported, and the cut-point should be read as an exploratory finding from this sample rather than as a calibrated decision rule. Two properties must be distinguished. The selection frequency of the variable is high: CF × VF was chosen as the root split in 83% of 1000 bootstrap resamples, indicating that the composite term, rather than either construct alone, is what the data repeatedly identify. The location of the threshold is far less determinate: although its bootstrap median is 0.420, the resampled splits range from 0.24 to 0.44, so the precise value of 0.42 is specific to this sample and should not be transferred to other settings without re-estimation. Its precision of 0.778 is obtained on one-fifth of the sample, and the overall accuracy of the rule is modest (cross-validated balanced accuracy 0.598). Single-construct thresholds were not stable: the CF split varied between 0.375 and 0.708 across resamples, and single-construct cut-points in the 0.55–0.60 range, examined for comparison, reached a precision of at most 0.60. The composite rule is therefore best read as an exploratory positive signal of favorable fit, not as a screening criterion for identifying at-risk individuals.
Path analysis with 5000 bootstrap resamples [71] decomposed the total effect of Cultural Intelligence on Team Effectiveness (Table 10).
Table 10.
Mediation decomposition of CI → TE through CF, full model with VF and MI as covariates (5000 bootstrap resamples).
Hypothesis H3 is partially supported. The CF → TE path is significant and robust across specifications (b = 0.279, SE = 0.105, p = 0.009). The indirect CI → TE pathway through Communication-Fit is positive in the unconditional model (b = 0.092; 95% bootstrap CI [0.005; 0.227]), but in the adjusted model reported in Table 10 it is not conclusively supported: its bootstrap confidence interval includes zero (b = 0.079; 95% CI [−0.012; 0.217]; Sobel z = 1.52, p = 0.128). The proportion of the total effect transmitted through CF is estimated at 13.5–16.5% in the two specifications, with the remainder operating directly. Following the adjusted specification, the data do not establish mediation through Communication-Fit; they are consistent with it but do not confirm it. Value-Fit was not tested as a mediator in the analyses reported here: it enters the adjusted model as a covariate, where its direct association with team effectiveness is non-significant (b = −0.093, p = 0.729), and no claim about a mediating role of value fit is made. Given the cross-sectional design, no causal ordering among CI, CF and TE can be established from these data.
4.5. Cmr Index Validation (H4)
The Cultural Misalignment Risk index defined in Equation (2) was computed for all 136 respondents from the CF and VF indices and validated against measured team effectiveness (Figure 8).
Figure 8.
Scatter plot of CMR index vs. Team Effectiveness (N = 136). Points represent individual respondents (with slight vertical jitter); the red line is the least-squares fit; shaded bands mark the a priori CMR zones (green: low, <0.30; yellow: moderate, 0.30–0.50; red: elevated, >0.50). Source: computed by the authors.
Hypothesis H4 is supported in direction and significance, with a small-to-moderate effect size. The CMR index correlates negatively and significantly with Team Effectiveness (r = −0.238, p = 0.005; Spearman ρ = −0.229, p = 0.007). Across the a priori zones, 9.6% of respondents fall in the low-risk band (CMR < 0.30), 55.9% in the moderate band (0.30 ≤ CMR ≤ 0.50), and 34.6% in the elevated band (CMR > 0.50). Mean normalized TE declines monotonically across the three bands—0.840, 0.716 and 0.635, respectively—with one-way ANOVA F(2,133) = 4.71, p = 0.010, η2 = 0.066. An alternative tercile-based partition (cut-points 0.401 and 0.505) reproduces the same monotone ordering (TE = 0.774, 0.684, 0.638; F(2,133) = 4.23, p = 0.017, η2 = 0.060), indicating that the zone structure is not an artifact of the a priori cut-points.
Sensitivity to weighting. Because the allocation of weights between the two components is a modeling choice, the CMR–TE association was re-estimated across the full weight continuum. The correlation remains negative and statistically significant for every specification in which Communication-Fit carries at least 37.5% of the weight (r ranging from −0.255 at w_CF = 1.00 to −0.190 at w_CF = 0.375, all p < 0.05), and loses significance only when Value-Fit becomes dominant (w_CF ≤ 0.25). The reported weighting (0.625:0.375) therefore sits within a broad region of stability, and the substantive conclusion does not depend on the precise values chosen.
Discriminative performance. Evaluated as a screening instrument against a bottom-tercile team-effectiveness criterion, the index yields an area under the ROC curve of 0.605. At the Youden-optimal cut-point (CMR > 0.375), sensitivity is 0.841 and specificity is 0.373; at the a priori elevated-risk threshold (CMR > 0.50), sensitivity is 0.420 and specificity is 0.731. These values indicate that CMR functions as a directional monitoring indicator rather than as a diagnostic classifier: it may be informative for tracking change within a team over time, pending longitudinal validation, and for prioritizing managerial attention, but it is not accurate enough at the individual level to warrant decisions about particular respondents. This limitation is stated explicitly because the index is intended for deployment in operational dashboards, where over-interpretation of a single score carries real consequences for the people measured.
4.6. Summary of Hypothesis Testing
Table 11 consolidates the empirical support for the four hypotheses tested in this study, alongside the specific statistical evidence supporting each outcome.
Table 11.
Summary of hypothesis testing outcomes.
5. Discussion
The findings reported in Section 4 support a more precise and more modest claim than is common in the predictive-analytics literature on multicultural teams. Communication-Fit and cultural intelligence carry a consistent, specification-robust association with self-reported team effectiveness, and the two-component CMR index tracks effectiveness monotonically, but none of these indicators, alone or in combination, permits reliable prediction for individual respondents. This section interprets these results, situates them in the cross-cultural management literature, and derives implications for practice.
5.1. Theoretical Implications
Locating the mediation pathway. A central theoretical contribution concerns the decomposition of Cultural Intelligence’s association with Team Effectiveness. Prior meta-analyses [46,47,48] have consistently reported that cultural factors operate through communication and value alignment, but have not quantified the relative contribution of each pathway. The present estimates place the share transmitted through Communication-Fit at 13.5–16.5%, with the remainder operating directly. Because the indirect pathway is not robust to the inclusion of covariates, and because the design is cross-sectional, these estimates do not support quantitative prescriptions for resource allocation, and none is advanced here. What the decomposition does indicate is the relative standing of two intervention targets: Communication-Fit is the only construct with a significant and specification-robust association with team effectiveness, which makes it the better-evidenced focus of managerial attention. Establishing the comparative return of cultural-competence development versus communication mediation would require an experimental or longitudinal design with measured cost and outcome data.
Perceived fit, value orientation and national origin. Communication-Fit did not differ across empirically derived value-orientation profiles (F(2,133) = 0.17, p = 0.847; Table 8), despite large differences in the orientations defining those profiles. Perceived communication fit is therefore not a by-product of a respondent’s values. At the same time, CF differed moderately across the larger national subgroups (η2 = 0.131), which is consistent with the language-related content of the CF items. Two conclusions follow. Empirically, the claim that fit is unrelated to cultural origin is not supported, and it is not made here. Normatively, the finding does not license screening by origin: the variation within national groups is far larger than the variation between them, and an instrument that allocated attention by nationality would violate the non-discriminatory design commitments of Section 5.4. The appropriate response is to adapt communication and coordination practice for the team as a whole. Within the present individual-level design, these results concern perceptions; they are consistent with, but do not test, multilevel accounts of emergent team states [36,37].
The Ukrainian IT context as a theoretical test case. With 45.6% of the sample from Ukraine—a country whose IT sector has operated under conditions of extreme geopolitical stress since 2022—the study also contributes an empirical case for the resilience of multicultural collaboration models under crisis. Because the Ukrainian subsample is large, however, these results should be read as evidence from this context rather than as evidence of the universality of cultural mechanisms (Section 6.1).
5.2. Practical Implications and Platform Integration
The framework’s potential practical value lies in translating empirical results into transparent monitoring instruments, a possibility that longitudinal validation would have to confirm. The CMR index (Equation 2) produces a single interpretable score that could be reported in aggregate for a team over time. Table 12 outlines how such aggregated scores might be integrated into widely used project-management platforms; only survey-based inputs are envisaged, and no behavioral or communication data are collected. Because the present data are individual perceptions measured at one point in time, neither the value of repeated measurement nor the responsiveness of the indices to change has been demonstrated here.
Table 12.
Integration of aggregated CF/VF/CMR monitoring into project-management platforms.
The three CMR bands (<0.30 low; 0.30–0.50 moderate; >0.50 elevated) suggest graduated, team-level responses (Figure 9). Given the modest discrimination of the index (AUC = 0.605) and the cross-sectional, individual-level data from which the bands were derived, band membership should prompt conversation and closer observation rather than decisions about individual team members, and the framework in Figure 9 should be read as a proposal for practice awaiting longitudinal validation.
Figure 9.
Monitoring framework by CMR band for aggregated team-level scores. Source: developed by the authors based on the zone analysis in Section 4.5 (η2 = 0.066).
Resource-efficiency considerations. Because the present design does not measure costs, rework or turnover, no quantitative return-on-investment estimate is offered. The resource argument is directional: to the extent that monitoring allows misalignment to be addressed before it escalates into conflict or attrition, it substitutes lower-cost preventive attention for higher-cost corrective effort and replacement hiring. Testing this proposition requires a longitudinal design with measured cost and outcome data (Section 6).
5.3. Comparison with Existing Diagnostic Tools
The proposed framework occupies a distinct niche relative to established organizational health instruments (Table 13).
Table 13.
Comparative positioning against established organizational diagnostics.
The framework’s differentiating attributes are: (i) a focus on perceived cultural fit within multicultural project teams, measured at the individual level and reported in aggregate; (ii) short instruments suited to repeated measurement within Agile cadences; (iii) indicators and thresholds whose stability and predictive limits have been tested rather than assumed; (iv) a design intended for integration with delivery platforms rather than stand-alone assessment.
5.4. Ethical and Regulatory Sustainability of AI-Based Team Analytics
Analytics of this kind must be positioned against the growing regulatory scrutiny of AI-driven human-resource applications, particularly under the EU AI Act (2024) [69] and the GDPR [68]. Three design choices are intended to reduce regulatory and ethical risk; they are statements of design intent, not a claim of verified compliance. First, reporting is restricted to aggregated, anonymous team-level summaries, and no scores are used for decisions about individuals—a restriction that the modest individual-level discrimination reported in Section 4.3 makes necessary as well as prudent. Second, all inputs are voluntarily self-reported, and demographic and protected attributes are excluded from every model. Third, the indicators are simple, documented composites whose computation can be inspected by those being measured.
This restraint is not merely a legal constraint but a condition of sustainability in the deployment sense: an analytics instrument that profiles individuals is unlikely to retain workforce legitimacy or survive regulatory tightening, and the present results show that such profiling would, in any case, not be accurate. Aggregated reporting, voluntary self-report and transparent computation are therefore design commitments that make continued use of the framework defensible over time.
5.5. Sustainability Implications
The results reported above bear on sustainability in four connected respects.
Human capital sustainability. The band analysis (Section 4.5) shows that respondents in the elevated-risk CMR band report lower team effectiveness (0.635) than those in the low-risk band (0.840). In sustainable HRM terms, elevated misalignment may describe teams that are meeting delivery obligations by drawing down goodwill, discretionary effort and psychological safety. Because CF and VF can be measured repeatedly with short instruments, the framework offers a candidate means of making this condition observable at the team level; whether repeated measurement actually tracks deterioration, and whether monitoring prevents attrition, are questions that only longitudinal data can answer.
Preventive resource use. The decomposition of the cultural-intelligence effect (Section 4.4) indicates that most of its association with team effectiveness is direct, and that Communication-Fit is the construct with the most robust association with effectiveness. This supports investment in durable cultural competence and communication practice as complementary targets. The present data do not, however, support quantitative statements about their relative returns, and none is made.
Inclusion without profiling. Communication-Fit is independent of respondents’ value-orientation profiles (Section 4.2), and all models in this study exclude demographic and protected attributes by design. Where CF does vary across national groups, the variation within groups far exceeds that between them. The appropriate managerial response to misalignment is, therefore, to adapt team-level communication and coordination practices, not to screen candidates or allocate attention by cultural origin. The framework thus supports the retention of diversity benefits rather than their elimination through homogenization, in line with SDG 10.
Resilience under crisis conditions. The sample was collected in a period in which a substantial share of respondents worked in distributed and relocated configurations. That CF remains associated with team effectiveness under these conditions suggests that the indicators are relevant precisely where team sustainability is most at risk, including post-crisis reconstruction contexts in which continuity of skilled employment is itself a development objective.
Table 14 maps these mechanisms onto the Sustainable Development Goals.
Table 14.
Correspondence between the proposed framework and the Sustainable Development Goals.
6. Limitations and Future Research
Several limitations qualify the generalizability of the findings and define priorities for subsequent research.
6.1. Design Limitations
Cross-sectional design. The current study captures culture, communication, and effectiveness at a single time point, precluding strong causal inference. While Path Analysis with bootstrap confidence intervals provides evidence consistent with the theorized mediation model, temporal precedence cannot be conclusively established. Priority for future research: longitudinal panel design tracking CF, VF, and TE across at least three measurement waves separated by six-month intervals, ideally within the same teams as they evolve through project life cycles.
Individual unit of analysis. Respondents were not sampled in team clusters and no team identifiers were collected, so all constructs are individual perceptions of one’s current team. Team-level properties, within-team agreement (rwg) and intraclass correlations cannot be estimated, and the results should not be read as statements about teams as collective units. Because team membership was not recorded, it cannot be verified that no two respondents belong to the same team; given recruitment across 22 countries and many organizations, such dependence is likely limited, but cross-validation folds could not be constructed to guarantee independence among teams. Priority for future research: a multilevel design sampling several members per team (at least 30 teams), permitting variance decomposition and tests of emergence.
Sample composition. The sample skews toward Eastern European respondents (51.5%), with Ukrainian professionals comprising the largest single national subgroup (45.6%). While this composition reflects the reality of contemporary IT service delivery, it constrains generalization to teams dominated by other cultural configurations. Recruitment was non-probability and purposive, relying on the first author’s professional networks and online communities, so the sample may over-represent professionals who are active in such communities and interested in the topic. Priority for future research: replication with balanced sampling across Asian, Latin American, and African IT hubs, particularly given the rapid expansion of the Indian, Brazilian, and Nigerian IT sectors.
Modest absolute R2. The R2 = 0.118 obtained in the main regression model, while consistent with cross-cultural research benchmarks, indicates that 88% of team-effectiveness variance is not explained by cultural factors alone. This is theoretically expected—technical competence, project structure, market conditions, and leadership quality also matter—but underscores that CF/VF/CMR should complement rather than replace existing management practices.
Sustainability outcomes are measured indirectly. The framework is validated against team effectiveness, not against sustainability outcomes as such. Turnover, burnout indicators, absenteeism and long-term well-being were not measured in the present design, and the sustainability argument therefore rests on the established empirical linkage between these outcomes and the constructs measured here rather than on direct observation [25,59]. A longitudinal design incorporating retention and well-being endpoints alongside CF and VF constitutes the most consequential extension of this work, and would allow the CMR index to be calibrated against sustainability outcomes directly.
6.2. Methodological Considerations
Self-report bias. All measures rely on individual self-assessment, introducing potential common-method variance [76]. In a post-hoc Harman single-factor test on the 27 ordinal items, the first unrotated factor accounted for 11.3% of variance, mitigating but not eliminating this concern. Priority for future research: multi-source data combining self-report with independent effectiveness ratings, collected with appropriate consent.
Limits of individual-level prediction. Under repeated nested cross-validation, the indicators did not discriminate high- from low-effectiveness respondents reliably better than chance (Section 4.3). With N = 136, the uncertainty of all performance estimates is wide, and a larger sample might reveal a weak but reliable signal. Until such evidence exists, the indicators should be used for monitoring aggregated trends rather than for classification or selection. Priority for future research: pre-registered validation on an independent sample with a held-out test set defined in advance.
Measurement. CI is represented by a brief composite informed by, but not equivalent to, the 20-item Cultural Intelligence Scale, and CF and VF are short formative indices. Priority for future research: replication with the full CQS and with multi-item, pre-tested CF and VF scales, including tests of measurement invariance across national groups.
6.3. Theoretical Extensions
Trust and psychological safety as additional mediators. The present study focuses on CF as the candidate mediator. Trust [52] and psychological safety [24], central components of effective teamwork [77,78], are additional plausible mediators not modeled here. Priority for future research: expanded structural equation model incorporating trust and psychological safety as parallel mediators alongside CF.
Moderation by team virtuality and technology fit. The framework treats team composition as the primary variation source; however, degree of virtuality (co-located vs. fully distributed) [79,80,81,82] and technology fit [83] likely moderate the CF–TE relationship. Priority for future research: moderation analysis with virtuality and tool-adoption indices as second-stage moderators.
Sector generalization. The IT-specific focus is theoretically motivated but empirically constraining. Priority for future research: cross-sector validation in engineering consulting, financial services, and creative industries to establish framework generality.
7. Conclusions
This study addressed a persistent gap in cross-cultural management research: the scarcity of transparent, empirically tested indicators for monitoring cultural risk in multicultural teams. Using data from 136 IT professionals in 22 countries, analyzed at the individual level, it examined Communication-Fit, Value-Fit and a composite Cultural Misalignment Risk index, and it tested how far these indicators can be used for prediction.
Principal empirical findings. Communication-Fit (b = 0.279, p = 0.009) and cultural intelligence (b = 0.504, p = 0.008) were the only significant correlates of team effectiveness (R2 = 0.12), a pattern that held in three of four alternative operationalizations of the outcome (H3 partially supported). The indirect effect of cultural intelligence through CF (13.5–16.5% of the total) was significant without covariates, but not after adjustment. The two-component CMR index correlated negatively with team effectiveness (r = −0.24, p = 0.005), with effectiveness declining monotonically across risk bands and the association robust across weighting schemes (H4 supported, small effect). Under repeated nested cross-validation with leakage controls, classifiers did not discriminate reliably above chance (AUC 0.52–0.66; H1 not supported), and a single composite term, CF × VF, was selected repeatedly across bootstrap resamples, although the location of its exploratory cut-point (0.42 in this sample) varied (H2 partially supported).
Theoretical contributions. The study extends cross-cultural management research in three respects. First, it locates Communication-Fit as the construct with the most robust association with team effectiveness and quantifies, with appropriate caveats, the share of the cultural-intelligence effect that it transmits. Second, it shows that perceived communication fit is independent of respondents’ value-orientation profiles, while varying moderately across national groups. Third, it offers a methodological corrective to predictive analytics in this field by demonstrating how circular labels and outcome leakage can generate implausibly high accuracies, and what realistic out-of-sample performance looks like when they are removed.
Practical contributions. The framework offers IT project managers, HR leaders and Scrum Masters three transparent instruments: (i) short CF and VF indices suitable for periodic measurement; (ii) a reproducible CMR index with defined bands for aggregated team-level reporting; and (iii) one composite cut-point (CF × VF > 0.42) that emerged repeatedly in this sample. All three are offered as exploratory instruments: the evidence reported here supports their use to prompt conversation and to structure observation within teams, while their value for monitoring change over time remains to be established longitudinally, and they are not suitable for decisions about individual employees or candidates.
Sustainability contributions. The study contributes to the sustainable human resource management and sustainable project management literatures by supplying transparent, tested and repeatable indicators for a field that has been rich in normative argument and comparatively poor in operational metrics. By making perceived cultural misalignment observable at the team level, and by explicitly excluding individual profiling, the framework supports earlier and non-discriminatory attention to the human capital of multicultural teams. The correspondence with SDG 8, SDG 9, SDG 10, SDG 12 and SDG 3 set out in Section 5.5 positions cultural-fit analytics as an instrument of sustainable workforce management rather than of performance surveillance.
Boundary conditions. The findings apply most confidently to IT service teams operating in Agile methodologies with Eastern and Western European cultural composition. Extension to other sectoral, methodological, and cultural contexts requires the replication studies outlined in Section 6.
Broader significance. In an era of accelerating globalization of technical labor markets, geopolitical realignment affecting where and how software is delivered, and intensifying regulatory scrutiny of AI-driven human-resource applications, the sustainability of knowledge work depends increasingly on whether organizations can maintain culturally heterogeneous teams without depleting the people who constitute them. Evidence-based, transparent and privacy-respecting instruments are a precondition of that outcome—and so is candor about what such instruments cannot do. This study offers indicators that are empirically grounded and reproducible, together with a clear statement of their predictive limits, and invites the longitudinal validation, cross-sectoral replication and outcome-level calibration that the sustainability claim ultimately requires.
Author Contributions
Conceptualization, N.Y.M. and N.I.C.; methodology, N.Y.M. and A.I.C.; software, N.Y.M.; validation, N.Y.M., N.I.C. and A.I.C.; formal analysis, N.Y.M. and A.I.C.; investigation, N.Y.M.; resources, N.Y.M. and N.I.C.; data curation, N.Y.M.; writing—original draft preparation, N.Y.M.; writing—review and editing, N.Y.M., N.I.C. and A.I.C.; visualization, N.Y.M. and A.I.C.; supervision, N.I.C.; project administration, N.Y.M. and N.I.C. All authors have read and agreed to the published version of the manuscript.
Funding
This research received no external funding.
Institutional Review Board Statement
This study is waived for ethical review by the Institutional Committee, as it was a voluntary, non-interventional online survey of adult professionals that collected no health-related or other sensitive personal data.
Informed Consent Statement
Informed consent was obtained from all subjects involved in the study.
Data Availability Statement
The anonymized dataset supporting the reported findings is available from the corresponding author upon reasonable request, subject to institutional data-sharing agreements. The analysis code for the machine-learning, CART and CMR analyses is available from the corresponding author upon reasonable request; the analytical protocol is documented in Appendix B.
Conflicts of Interest
The authors declare no conflict of interest.
Appendix A. Survey Instrument and Construct Scoring
All items were answered on five-point scales or were closed questions coded to five points as indicated. Construct scores are unweighted means of items or parcels, normalized to [0, 1] as (x − 1)/4 for the CF, VF, CMR and machine-learning analyses. Item parcels are means of the listed items; composite scores use all available items. The questionnaire was administered in Ukrainian and English; the English wording is given below. Where respondents entered a free-text answer instead of a listed option, the answer was coded to the closest scale point, or to the neutral midpoint if it expressed uncertainty about the question (four cases for the work-style item on behavior in the workplace).
Table A1.
Indicators, item wording and coding.
Appendix B. Machine-Learning Protocol and Diagnostics
Table A2 specifies the protocol used for all classification analyses reported in Section 4.3, and Table A3 reports the diagnostics that explain why the three-class archetype task is not used as evidence of predictive validity. The Python scripts reproducing Table 9 and Table A3 and Figure 6, Figure 7 and Figure 8 are available from the corresponding author upon reasonable request.
Table A2.
Classification and CART protocol.
Table A3.
Circularity and leakage diagnostics.
Table A4.
Confusion matrices pooled over the 25 outer test folds.
Appendix C. Comparison of Structural Model Specifications
Table A5.
Fit of latent and composite specifications.
References
- Project Management Institute. Pulse of the Profession 2024: The Future of Project Work; PMI: Newtown Square, PA, USA, 2024. [Google Scholar]
- Deloitte. 2024 Global Human Capital Trends: Thriving Beyond Boundaries; Deloitte Insights: New York, NY, USA, 2024. [Google Scholar]
- Gartner. Gartner Worldwide IT Spending Forecast, January 2025; Gartner Research: Stamford, CT, USA, 2025. [Google Scholar]
- IT Ukraine Association. Ukrainian IT Industry: Market Report 2024; IT Ukraine Association: Kyiv, Ukraine, 2024. [Google Scholar]
- Digital Tiger. Ukraine IT Market Report 2024: Export Volumes and Trends; Digital Tiger Research: Kyiv, Ukraine, 2024. [Google Scholar]
- Beck, K.; Beedle, M.; van Bennekum, A.; Cockburn, A.; Cunningham, W.; Fowler, M.; Grenning, J.; Highsmith, J.; Hunt, A.; Jeffries, R.; et al. Manifesto for Agile Software Development. Available online: https://agilemanifesto.org (accessed on 15 January 2026).
- Schwaber, K.; Sutherland, J. The Scrum Guide, 2020 Revision. Available online: https://scrumguides.org (accessed on 15 January 2026).
- Dingsøyr, T.; Nerur, S.; Balijepally, V.; Moe, N.B. A Decade of Agile Methodologies. J. Syst. Softw. 2012, 85, 1213–1221. [Google Scholar] [CrossRef] [Scilit]
- Chow, T.; Cao, D.B. A Survey Study of Critical Success Factors in Agile Software Projects. J. Syst. Softw. 2008, 81, 961–971. [Google Scholar] [CrossRef] [Scilit]
- Aritz, J.; Walker, R.C. Leadership Styles in Multicultural Groups. Int. J. Bus. Commun. 2014, 51, 72–92. [Google Scholar] [CrossRef] [Scilit]
- Hofstede, G. Culture’s Consequences: Comparing Values, Behaviors, Institutions and Organizations Across Nations, 2nd ed.; SAGE Publications: Thousand Oaks, CA, USA, 2001. [Google Scholar]
- Hall, E.T. Beyond Culture; Anchor Books: New York, NY, USA, 1976. [Google Scholar]
- Schwartz, S.H. Universals in the Content and Structure of Values. Adv. Exp. Soc. Psychol. 1992, 25, 1–65. [Google Scholar] [CrossRef] [Scilit]
- Trompenaars, F.; Hampden-Turner, C. Riding the Waves of Culture, 3rd ed.; Nicholas Brealey: London, UK, 2012. [Google Scholar]
- Meyer, E. The Culture Map: Breaking Through the Invisible Boundaries of Global Business; PublicAffairs: New York, NY, USA, 2014. [Google Scholar]
- Pfeffer, J. Building Sustainable Organizations: The Human Factor. Acad. Manag. Perspect. 2010, 24, 34–45. [Google Scholar] [CrossRef] [Scilit]
- Kramar, R. Beyond Strategic Human Resource Management: Is Sustainable Human Resource Management the Next Approach? Int. J. Hum. Resour. Manag. 2014, 25, 1069–1089. [Google Scholar] [CrossRef] [Scilit]
- Ehnert, I.; Parsa, S.; Roper, I.; Wagner, M.; Muller-Camen, M. Reporting on Sustainability and HRM: A Comparative Study of Sustainability Reporting Practices by the World’s Largest Companies. Int. J. Hum. Resour. Manag. 2016, 27, 88–108. [Google Scholar] [CrossRef] [Scilit]
- Elkington, J. Cannibals with Forks: The Triple Bottom Line of 21st Century Business; Capstone: Oxford, UK, 1997. [Google Scholar]
- Docherty, P.; Kira, M.; Shani, A.B. (Eds.) Creating Sustainable Work Systems: Developing Social Sustainability, 2nd ed.; Routledge: London, UK, 2009. [Google Scholar]
- Peretz, H. Sustainable Human Resource Management and Employees’ Performance: The Impact of National Culture. Sustainability 2024, 16, 7281. [Google Scholar] [CrossRef] [Scilit]
- Silvius, A.J.G.; Schipper, R.P.J. Sustainability in Project Management: A Literature Review and Impact Analysis. Soc. Bus. 2014, 4, 63–96. [Google Scholar] [CrossRef] [Scilit]
- Martens, M.L.; Carvalho, M.M. Key Factors of Sustainability in Project Management Context: A Survey Exploring the Project Managers’ Perspective. Int. J. Proj. Manag. 2017, 35, 1084–1102. [Google Scholar] [CrossRef] [Scilit]
- Edmondson, A. Psychological Safety and Learning Behavior in Work Teams. Adm. Sci. Q. 1999, 44, 350–383. [Google Scholar] [CrossRef] [Scilit]
- Hussein, S.H.; Zakhem, N.B. The Impact of Green Human Resource Management Practices on Brand Citizenship Behavior and Employee Turnover Intention: A Mixed Methods Approach. Sustainability 2024, 16, 6528. [Google Scholar] [CrossRef] [Scilit]
- Koman, G.; Boršoš, P.; Kubina, M. Sustainable Human Resource Management with a Focus on Corporate Employee Recruitment. Sustainability 2024, 16, 6059. [Google Scholar] [CrossRef] [Scilit]
- Ang, S.; Van Dyne, L. Handbook of Cultural Intelligence: Theory, Measurement, and Applications; Routledge: New York, NY, USA, 2015. [Google Scholar]
- House, R.J.; Hanges, P.J.; Javidan, M.; Dorfman, P.W.; Gupta, V. Culture, Leadership, and Organizations: The GLOBE Study of 62 Societies; SAGE: Thousand Oaks, CA, USA, 2004. [Google Scholar]
- Mazur, N.Y.; Chukhray, N.; Dronyuk, I. The Impact of Cultural Factors on IT Project Management Effectiveness: Developing the CROSS Cycle Framework for Multicultural Teams. Appl. Sci. 2025, 15, 9722. [Google Scholar] [CrossRef] [Scilit]
- Mazur, N.Y.; Chukhray, N.I. Development of the CROSS Cycle Methodology with Integrated Communication-Fit and Value-Fit Coefficients for Cross-Cultural Management of IT Teams. Grail Sci. 2025, 57, 147–163. (In Ukrainian) [Google Scholar] [CrossRef] [Scilit]
- Mazur, N.Y.; Chukhray, N.I. UTM-EF Framework: A Universal Approach to Multicultural IT Team Management Effectiveness in the Digital Era. Grail Sci. 2025, 57, 164–184. (In Ukrainian) [Google Scholar] [CrossRef] [Scilit]
- Mazur, N.Y. Management of Multicultural Teams in IT Projects. Ph.D. Thesis, Lviv Polytechnic National University, Lviv, Ukraine, 2026. Available online: https://lpnu.ua/sites/default/files/2026/radaphd/35947/disertaciya-mazura-nazariya-yaroslavovicha.pdf (accessed on 10 October 2026). (In Ukrainian)
- Kristof-Brown, A.L.; Zimmerman, R.D.; Johnson, E.C. Consequences of Individuals’ Fit at Work: A Meta-Analysis. Pers. Psychol. 2005, 58, 281–342. [Google Scholar] [CrossRef] [Scilit]
- Bücker, J.J.L.E.; Furrer, O.; Poutsma, E.; Buyens, D. The Impact of Cultural Intelligence on Communication Effectiveness. Int. J. Hum. Resour. Manag. 2014, 25, 2068–2087. [Google Scholar] [CrossRef] [Scilit]
- Elias, A.; Sanders, K.; Hu, J. The Sustainable Human Resource Practices and Employee Outcomes Link: An HR Process Lens. Sustainability 2023, 15, 10124. [Google Scholar] [CrossRef] [Scilit]
- Kozlowski, S.W.J.; Klein, K.J. A Multilevel Approach to Theory and Research in Organizations. In Multilevel Theory, Research, and Methods in Organizations; Jossey-Bass: San Francisco, CA, USA, 2000; pp. 3–90. [Google Scholar]
- Marks, M.A.; Mathieu, J.E.; Zaccaro, S.J. A Temporally Based Framework and Taxonomy of Team Processes. Acad. Manag. Rev. 2001, 26, 356–376. [Google Scholar] [CrossRef] [Scilit]
- Taras, V.; Kirkman, B.L.; Steel, P. Examining the Impact of Culture’s Consequences: A Three-Decade, Multilevel, Meta-Analytic Review of Hofstede’s Cultural Value Dimensions. J. Appl. Psychol. 2010, 95, 405–439. [Google Scholar] [CrossRef] [Scilit]
- Hinds, P.J.; Bailey, D.E. Out of Sight, Out of Sync: Understanding Conflict in Distributed Teams. Organ. Sci. 2003, 14, 615–632. [Google Scholar] [CrossRef] [Scilit]
- Cronin, M.A.; Weingart, L.R. Representational Gaps, Information Processing, and Conflict in Functionally Diverse Teams. Acad. Manag. Rev. 2007, 32, 761–773. [Google Scholar] [CrossRef] [Scilit]
- Inglehart, R.; Welzel, C. Modernization, Cultural Change, and Democracy: The Human Development Sequence; Cambridge University Press: Cambridge, UK, 2005. [Google Scholar]
- McSweeney, B. Hofstede’s Model of National Cultural Differences and Their Consequences: A Triumph of Faith—A Failure of Analysis. Hum. Relat. 2002, 55, 89–118. [Google Scholar] [CrossRef]
- Zakharchyn, H.M. Corporate Culture: A Textbook; Novyi Svit-2000: Kyiv, Ukraine, 2011. (In Ukrainian) [Google Scholar]
- Baron, R.M.; Kenny, D.A. The Moderator-Mediator Variable Distinction in Social Psychological Research. J. Personal. Soc. Psychol. 1986, 51, 1173–1182. [Google Scholar] [CrossRef] [Scilit]
- Hayes, A.F. Introduction to Mediation, Moderation, and Conditional Process Analysis, 3rd ed.; Guilford Press: New York, NY, USA, 2022. [Google Scholar]
- Marlow, S.L.; Lacerenza, C.N.; Paoletti, J.; Burke, C.S.; Salas, E. Does Team Communication Represent a One-Size-Fits-All Approach?: A Meta-Analysis of Team Communication and Performance. Organ. Behav. Hum. Decis. Process. 2018, 144, 145–170. [Google Scholar] [CrossRef] [Scilit]
- DeChurch, L.A.; Mesmer-Magnus, J.R. The Cognitive Underpinnings of Effective Teamwork: A Meta-Analysis. J. Appl. Psychol. 2010, 95, 32–53. [Google Scholar] [CrossRef] [Scilit]
- Stahl, G.K.; Maznevski, M.L.; Voigt, A.; Jonsen, K. Unraveling the Effects of Cultural Diversity in Teams: A Meta-Analysis. J. Int. Bus. Stud. 2010, 41, 690–709. [Google Scholar] [CrossRef] [Scilit]
- Van Knippenberg, D.; Schippers, M.C. Work Group Diversity. Annu. Rev. Psychol. 2007, 58, 515–541. [Google Scholar] [CrossRef] [Scilit]
- Roberson, Q.M. Diversity in the Workplace: A Review, Synthesis, and Future Research Agenda. Annu. Rev. Organ. Psychol. Organ. Behav. 2019, 6, 69–88. [Google Scholar] [CrossRef] [Scilit]
- Homan, A.C.; Buengeler, C.; Eckhoff, R.A.; van Ginkel, W.P.; Voelpel, S.C. The Interplay of Diversity Training and Diversity Beliefs on Team Creativity in Nationality Diverse Teams. J. Appl. Psychol. 2015, 100, 1456–1467. [Google Scholar] [CrossRef] [Scilit]
- Jarvenpaa, S.L.; Leidner, D.E. Communication and Trust in Global Virtual Teams. Organ. Sci. 1999, 10, 791–815. [Google Scholar] [CrossRef] [Scilit]
- Angrave, D.; Charlwood, A.; Kirkpatrick, I.; Lawrence, M.; Stuart, M. HR and Analytics: Why HR Is Set to Fail the Big Data Challenge. Hum. Resour. Manag. J. 2016, 26, 1–11. [Google Scholar] [CrossRef] [Scilit]
- Chamorro-Premuzic, T.; Akhtar, R.; Winsborough, D.; Sherman, R.A. The Datafication of Talent. Curr. Opin. Behav. Sci. 2017, 18, 13–16. [Google Scholar] [CrossRef] [Scilit]
- Tambe, P.; Cappelli, P.; Yakubovich, V. Artificial Intelligence in Human Resources Management. Calif. Manag. Rev. 2019, 61, 15–42. [Google Scholar] [CrossRef] [Scilit]
- Breiman, L. Random Forests. Mach. Learn. 2001, 45, 5–32. [Google Scholar] [CrossRef] [Scilit]
- Chen, T.; Guestrin, C. XGBoost: A Scalable Tree Boosting System. In Proceedings of the 22nd ACM SIGKDD; ACM: New York, NY, USA, 2016; pp. 785–794. [Google Scholar]
- Breiman, L.; Friedman, J.; Stone, C.J.; Olshen, R.A. Classification and Regression Trees; CRC Press: Boca Raton, FL, USA, 1984. [Google Scholar]
- Lorber, M.; Dobnik, M. The Importance of Monitoring the Psychological Wellbeing and Mental Health of Nursing Staff for Sustainable Management. Sustainability 2022, 14, 8300. [Google Scholar] [CrossRef] [Scilit]
- Cohen, J. Statistical Power Analysis for the Behavioral Sciences, 2nd ed.; Lawrence Erlbaum: Hillsdale, NJ, USA, 1988. [Google Scholar]
- Earley, P.C.; Ang, S. Cultural Intelligence: Individual Interactions Across Cultures; Stanford University Press: Stanford, CA, USA, 2003. [Google Scholar]
- Fornell, C.; Larcker, D.F. Evaluating Structural Equation Models with Unobservable Variables. J. Mark. Res. 1981, 18, 39–50. [Google Scholar] [CrossRef] [Scilit]
- Hair, J.F.; Risher, J.J.; Sarstedt, M.; Ringle, C.M. When to Use and How to Report the Results of PLS-SEM. Eur. Bus. Rev. 2019, 31, 2–24. [Google Scholar] [CrossRef] [Scilit]
- Diamantopoulos, A.; Winklhofer, H.M. Index Construction with Formative Indicators: An Alternative to Scale Development. J. Mark. Res. 2001, 38, 269–277. [Google Scholar] [CrossRef] [Scilit]
- Hackman, J.R.; Oldham, G.R. Development of the Job Diagnostic Survey. J. Appl. Psychol. 1975, 60, 159–170. [Google Scholar] [CrossRef] [Scilit]
- Pedregosa, F.; Varoquaux, G.; Gramfort, A.; Michel, V.; Thirion, B.; Grisel, O.; Blondel, M.; Prettenhofer, P.; Weiss, R.; Dubourg, V.; et al. Scikit-Learn: Machine Learning in Python. J. Mach. Learn. Res. 2011, 12, 2825–2830. [Google Scholar]
- Chawla, N.V.; Bowyer, K.W.; Hall, L.O.; Kegelmeyer, W.P. SMOTE. J. Artif. Intell. Res. 2002, 16, 321–357. [Google Scholar] [CrossRef] [Scilit]
- European Parliament and Council. Regulation (EU) 2016/679 (GDPR). Off. J. Eur. Union 2016, 119, 1–88. [Google Scholar]
- European Parliament and Council. Regulation (EU) 2024/1689 (AI Act). Off. J. Eur. Union 2024, 168, 1–144. [Google Scholar]
- Kaiser, H.F. An Index of Factorial Simplicity. Psychometrika 1974, 39, 31–36. [Google Scholar] [CrossRef] [Scilit]
- Preacher, K.J.; Hayes, A.F. Asymptotic and Resampling Strategies for Assessing and Comparing Indirect Effects. Behav. Res. Methods 2008, 40, 879–891. [Google Scholar] [CrossRef] [Scilit]
- McKinsey & Company. Organizational Health Index: Global Performance Benchmark; McKinsey Global Institute: New York, NY, USA, 2023. [Google Scholar]
- Gallup. State of the Global Workplace: 2024 Report; Gallup Press: Washington, DC, USA, 2024. [Google Scholar]
- Denison, D.R.; Nieminen, L.; Kotrba, L. Diagnosing Organizational Cultures. Eur. J. Work Organ. Psychol. 2014, 23, 145–161. [Google Scholar] [CrossRef] [Scilit]
- United Nations. Transforming Our World: The 2030 Agenda for Sustainable Development; United Nations: New York, NY, USA, 2015. [Google Scholar]
- Podsakoff, P.M.; MacKenzie, S.B.; Lee, J.-Y.; Podsakoff, N.P. Common Method Biases in Behavioral Research. J. Appl. Psychol. 2003, 88, 879–903. [Google Scholar] [CrossRef] [Scilit]
- Salas, E.; Sims, D.E.; Burke, C.S. Is There a “Big Five” in Teamwork? Small Group Res. 2005, 36, 555–599. [Google Scholar] [CrossRef] [Scilit]
- Klein, C.; DiazGranados, D.; Salas, E.; Le, H.; Burke, C.S.; Lyons, R.; Goodwin, G.F. Does Team Building Work? Small Group Res. 2009, 40, 181–222. [Google Scholar] [CrossRef] [Scilit]
- Gibson, C.B.; Gibbs, J.L. Unpacking the Concept of Virtuality. Adm. Sci. Q. 2006, 51, 451–495. [Google Scholar] [CrossRef] [Scilit]
- Gilson, L.L.; Maynard, M.T.; Young, N.C.J.; Vartiainen, M.; Hakonen, M. Virtual Teams Research: 10 Years, 10 Themes, and 10 Opportunities. J. Manag. 2015, 41, 1313–1337. [Google Scholar]
- Zaccaro, S.J.; Marks, M.A.; DeChurch, L.A. Multiteam Systems; Routledge: New York, NY, USA, 2012. [Google Scholar]
- Hoch, J.E.; Kozlowski, S.W.J. Leading Virtual Teams. J. Appl. Psychol. 2014, 99, 390–403. [Google Scholar] [CrossRef] [Scilit]
- Cascio, W.F.; Montealegre, R. How Technology Is Changing Work and Organizations. Annu. Rev. Organ. Psychol. Organ. Behav. 2016, 3, 349–375. [Google Scholar] [CrossRef] [Scilit]
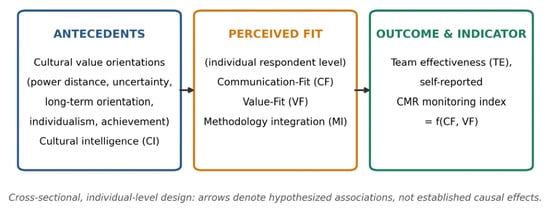
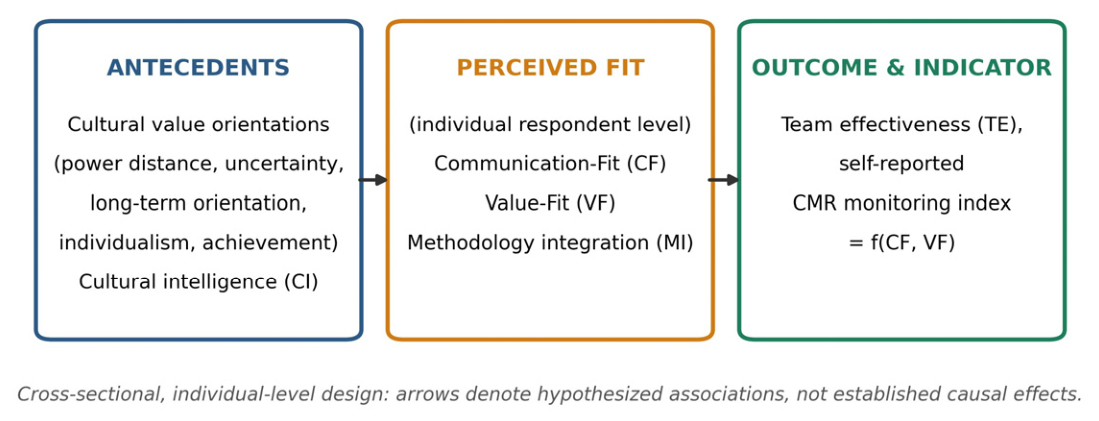
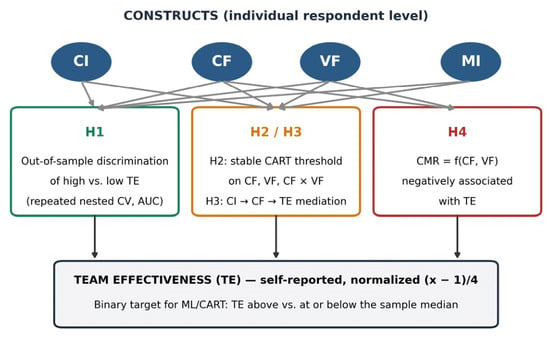
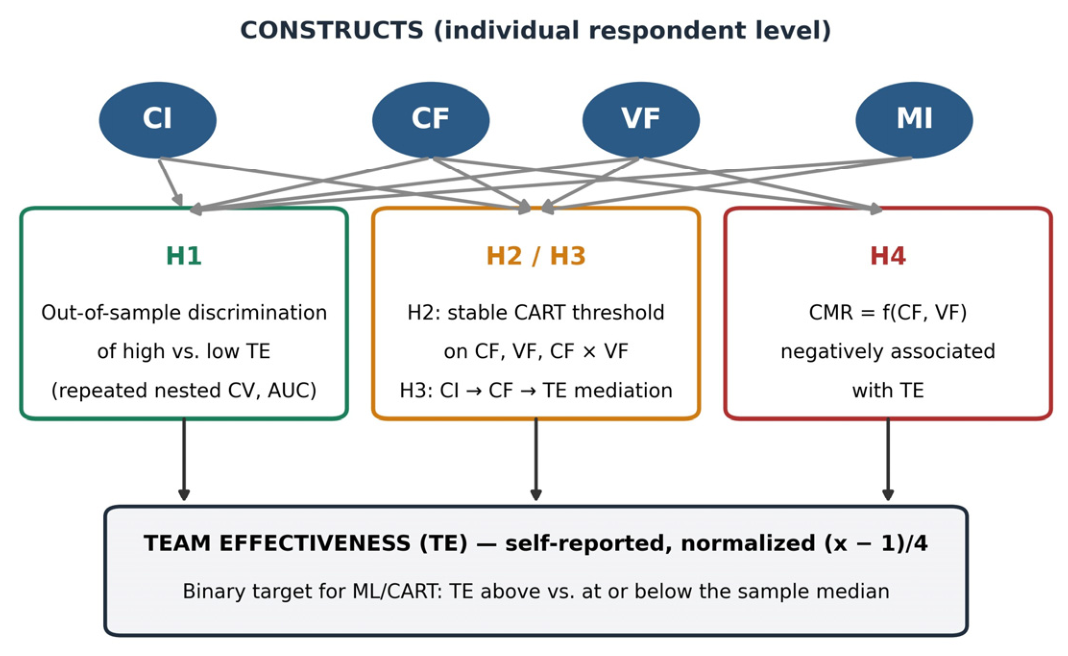
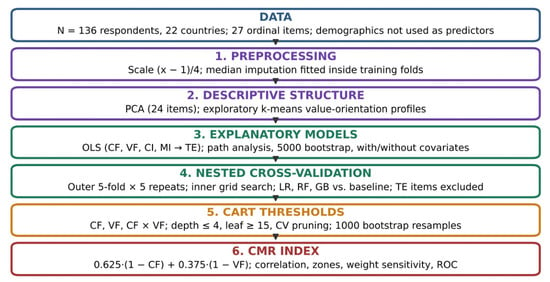
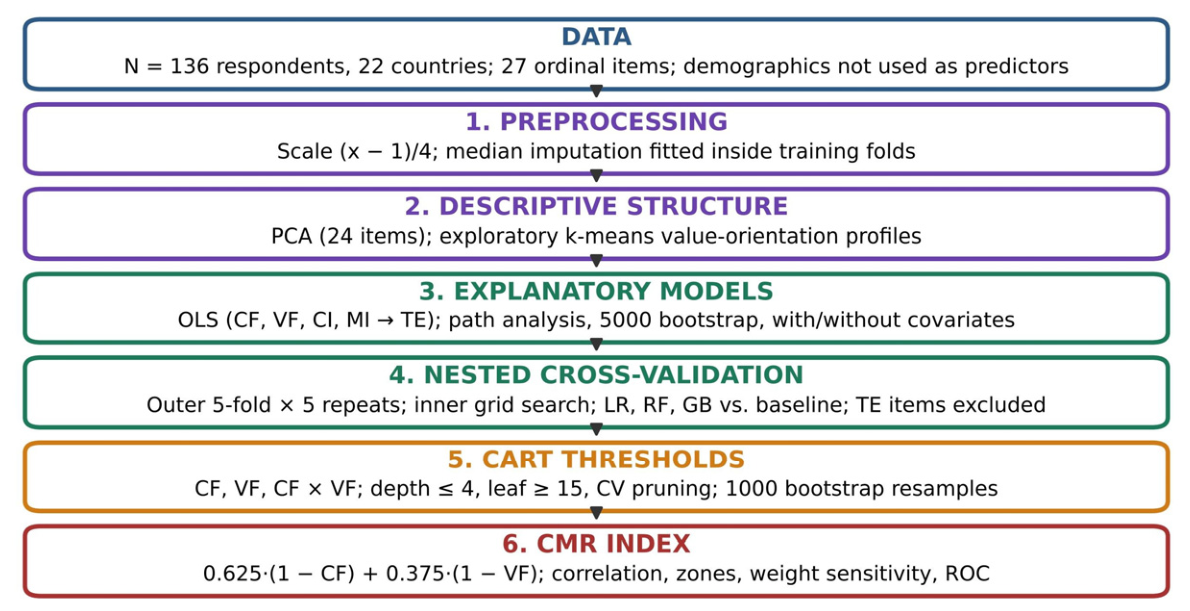
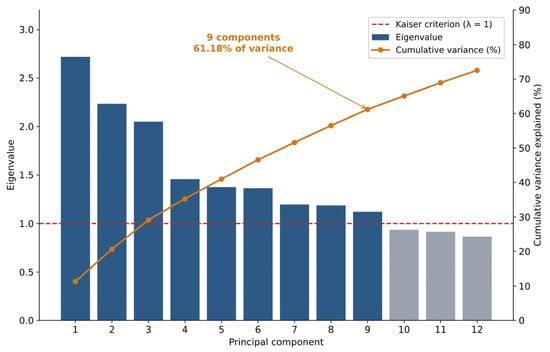
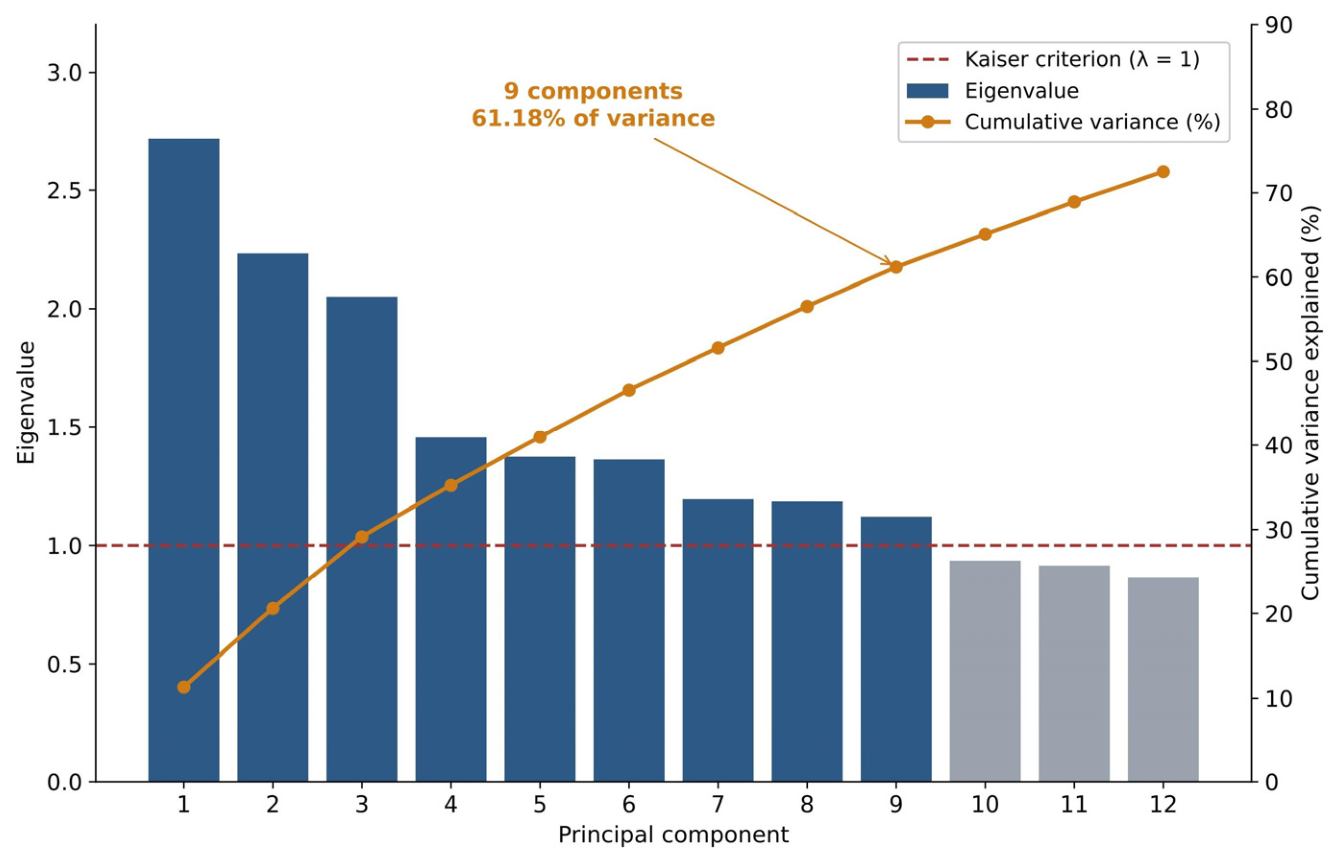
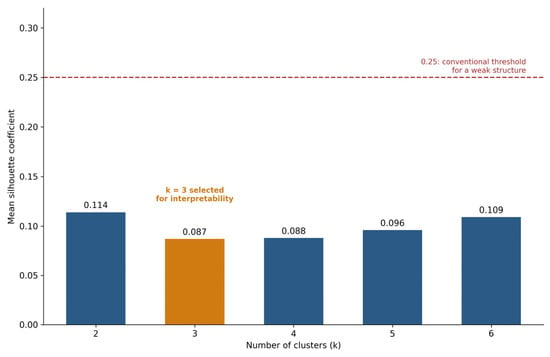
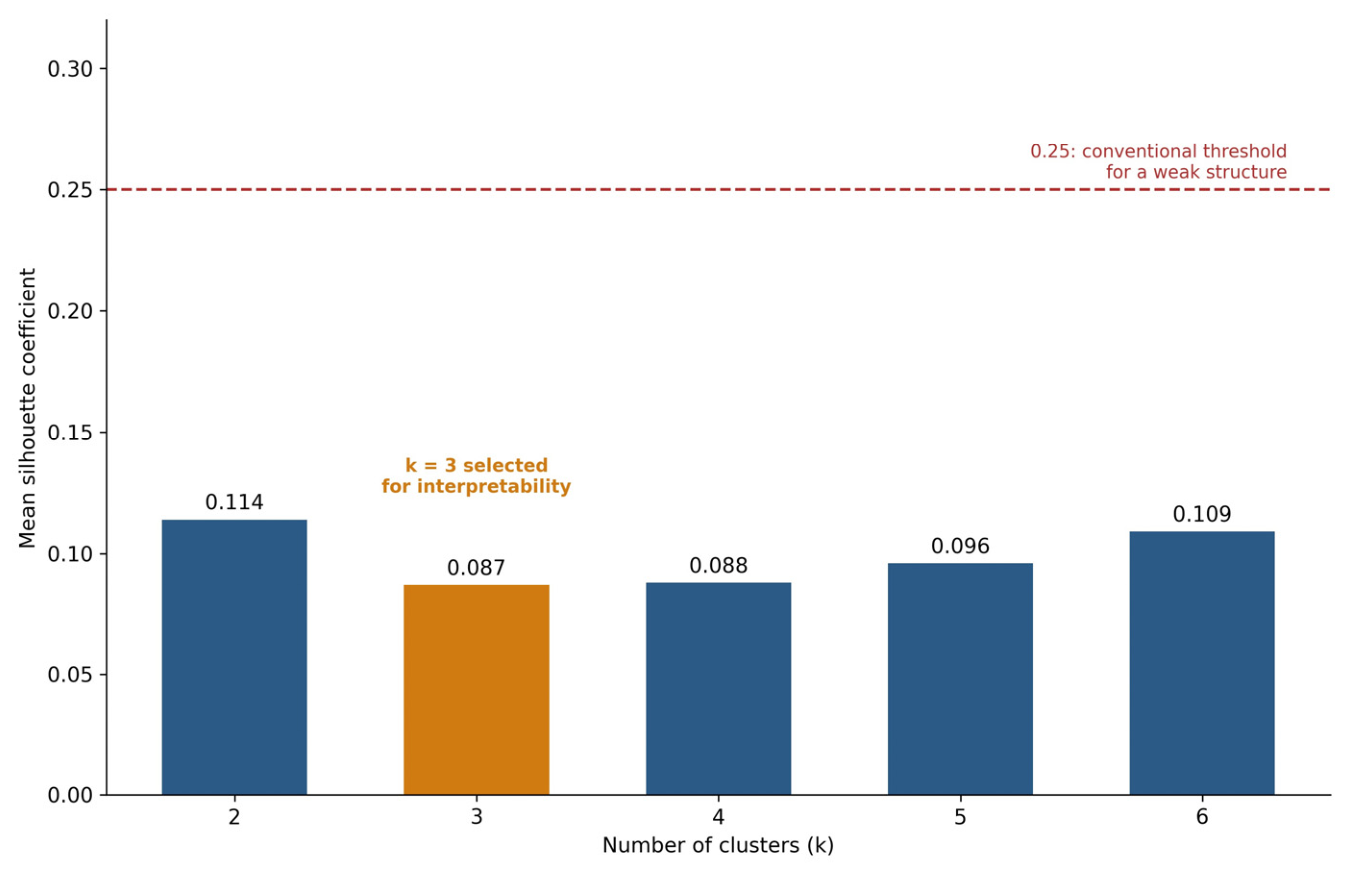
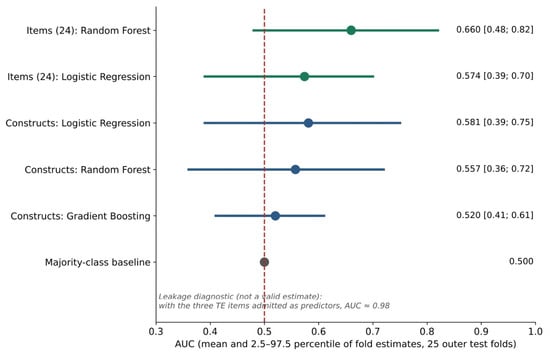
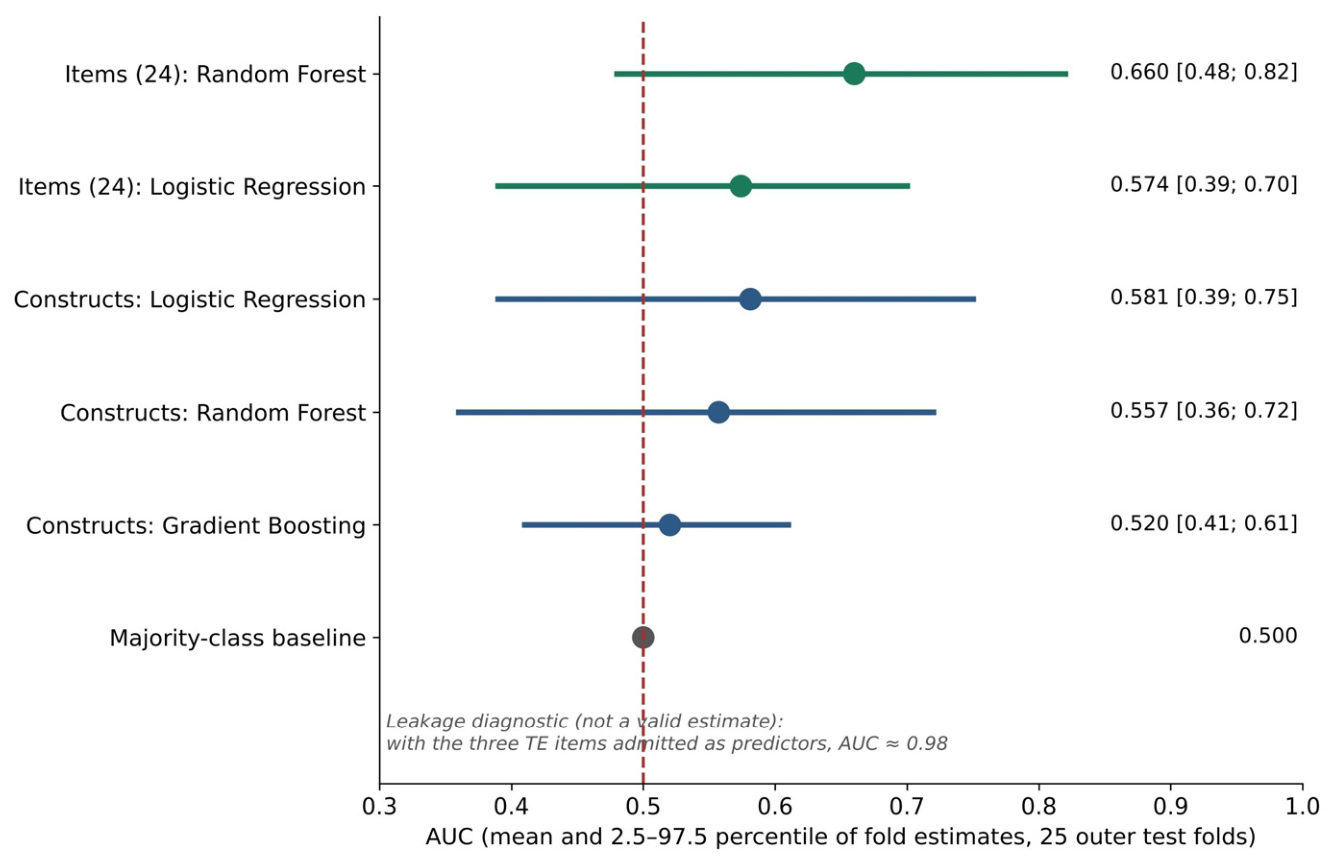
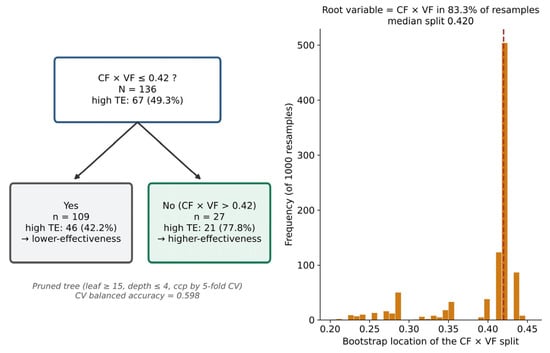
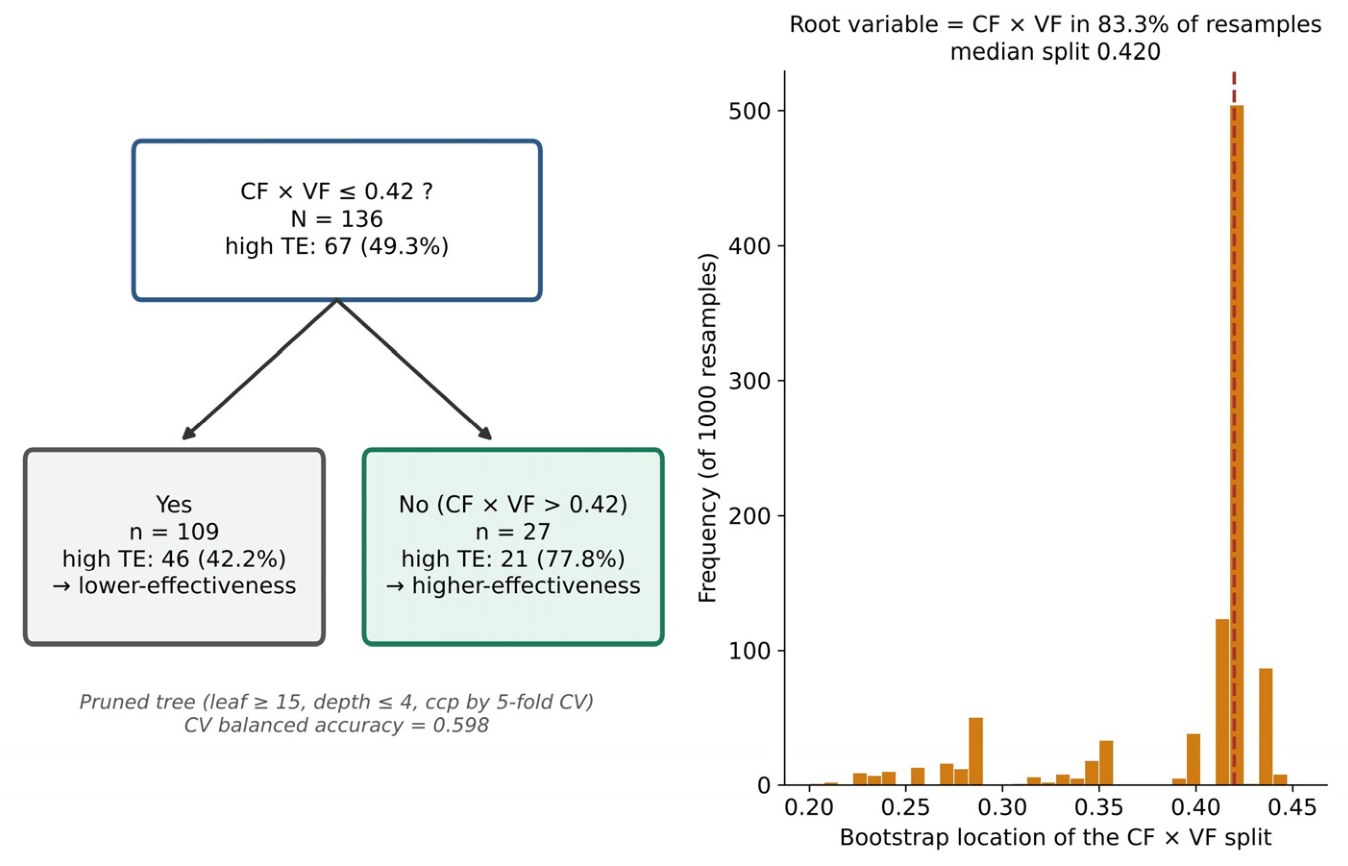
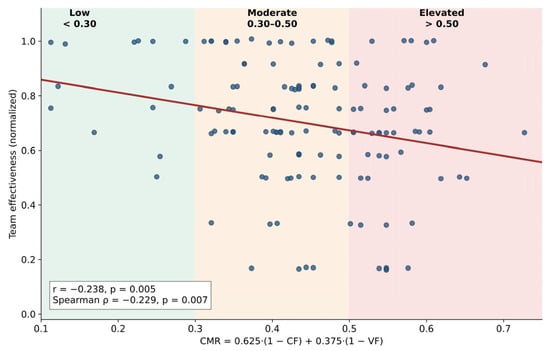
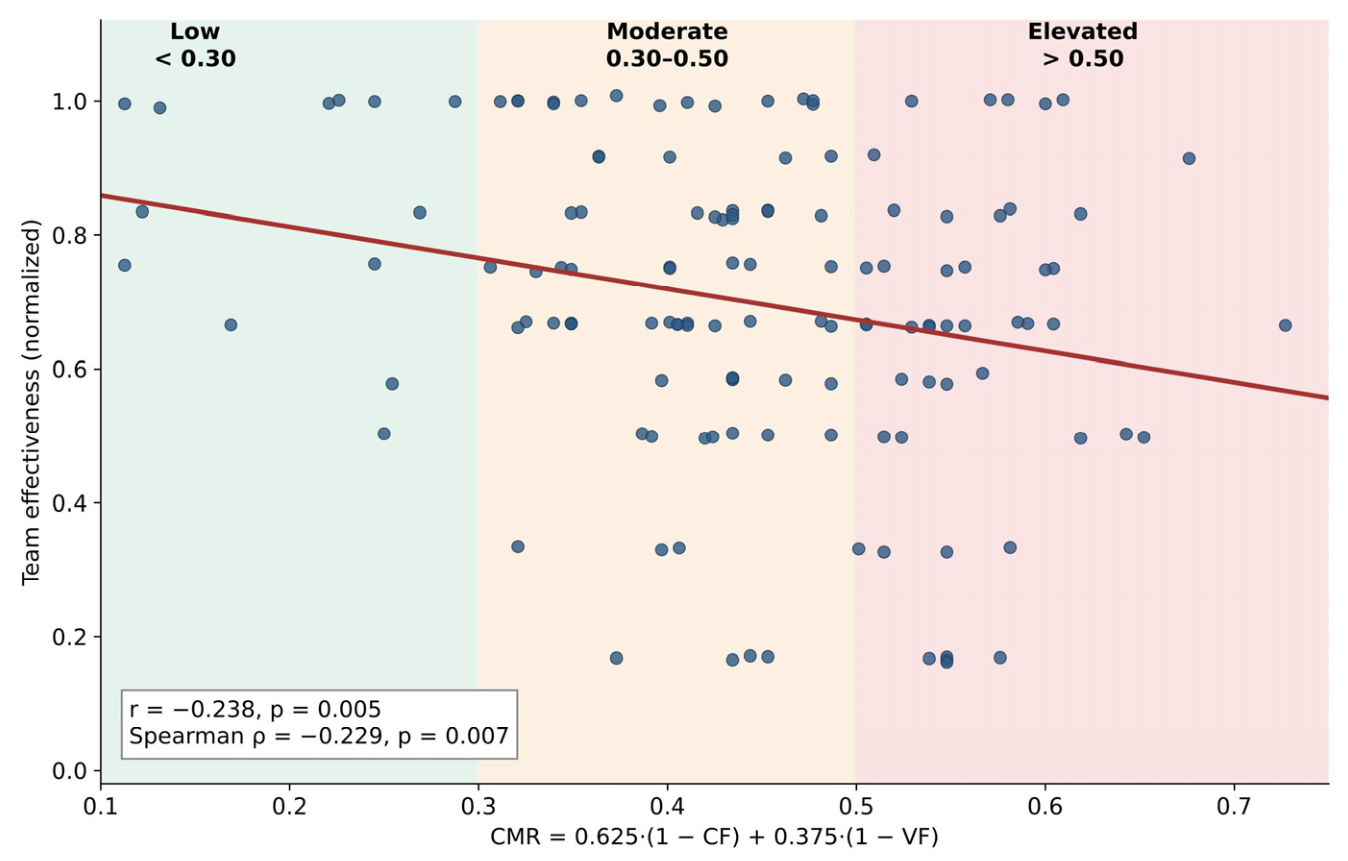
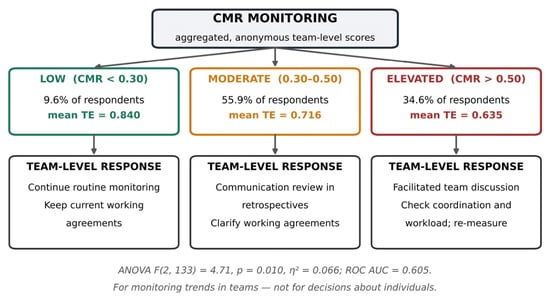
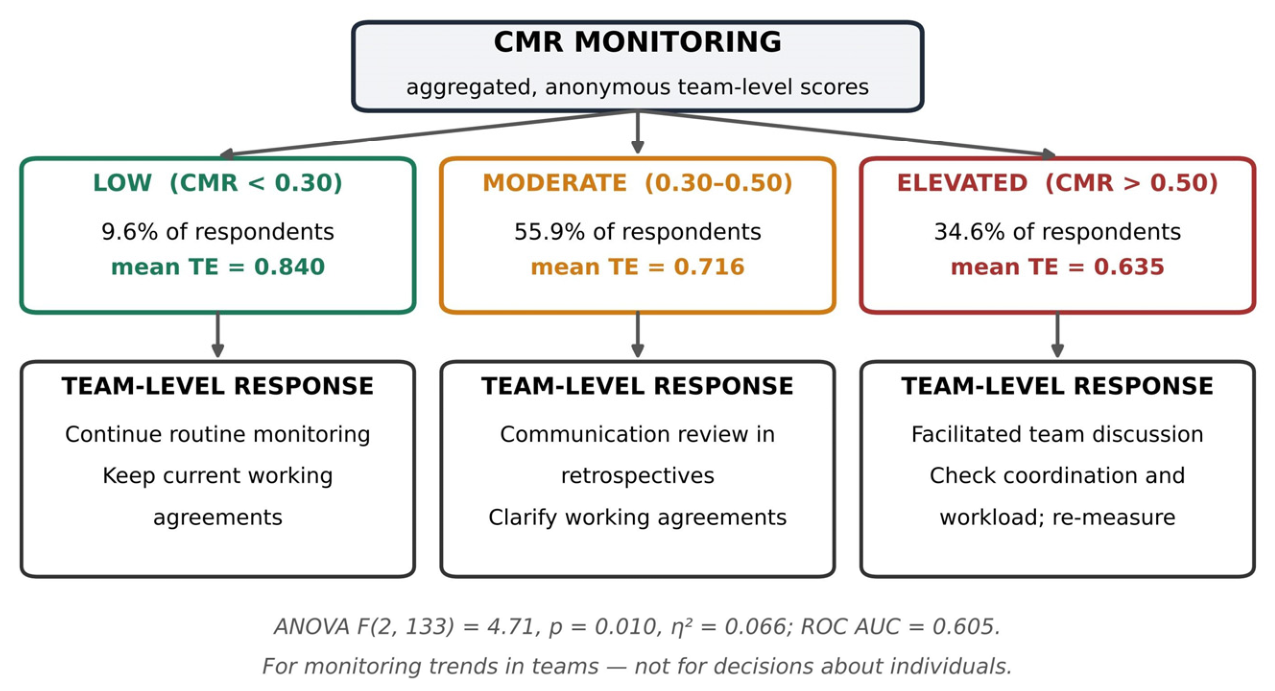

Disclaimer/Publisher’s Note: The statements, opinions and data contained in all publications are solely those of the individual author(s) and contributor(s) and not of MDPI and/or the editor(s). MDPI and/or the editor(s) disclaim responsibility for any injury to people or property resulting from any ideas, methods, instructions or products referred to in the content. |
© 2026 by the authors. Licensee MDPI, Basel, Switzerland. This article is an open access article distributed under the terms and conditions of the Creative Commons Attribution (CC BY) license.