


Abstract
Energy Poverty Vulnerability is a multidimensional phenomenon, which depends both on the energy efficiency of dwellings and on the related socio-economic aspects. Its diagnosis at the intra-urban scale has been addressed by few studies; therefore, its spatial distribution is still difficult to assess, as well as poorly integrated into urban planning processes. The research addresses these gaps by proposing a methodology to assess and map Vulnerability to Energy Poverty (Vep) at this scale, using open and institutional data that can be integrated into Italian urban planning processes. Based on the state of the art, a set of indicators is selected to construct the Local Index of Vulnerability to Energy Poverty (LIVep). The workflow includes an assessment of the applicability of Principal Component Analysis (PCA) and the mapping of the results through Geographic Information System (GIS). The methodology is applied to the municipality of Milan, Italy. PCA identified four Principal Components of Vep, which were mapped in a GIS environment. The first two components, interpreted as Socio-Economic Vulnerability (PC1) and Energy Vulnerability (PC2), were subsequently combined into LIVep, providing a single planning-oriented index. A sensitivity analysis, based on an alternative equal-weighted aggregation of the normalized indicators, showed strong consistency in the overall ranking of census sections, although some differences emerged in identifying the most vulnerable areas. The main contribution of the study concerns a spatial decision-support framework, based on open data and GIS, for building a local-scale knowledge base of Vep, supporting the spatial targeting of actions to tackle Vep, and fostering the integration of energy, social, and urban regeneration policies. The proposed methodology is potentially transferable to geographical contexts other than Italy, provided that comparable census and energy-related data are available from institutional sources or through urban planning processes.
1. Introduction
According to the World Cities Report of the United Nations Human Settlements Programme, the number of cities globally doubled between 1975 and 2020, making the urban environment the living context of the majority of the world’s population and urban planning essential to face new urban challenges [1].
It is well known that the attraction of the population by cities is historically attributable to the promise of more socially and economically advantageous living conditions compared to settlements inserted in rural contexts, which have become increasingly marginal [2]. On the other hand, the concentration of human activities in cities has made the latter progressively energy-intensive organisms, in which the increase in climate-changing emissions and local temperature seriously threatens the quality of life and, more generally, urban sustainability [3,4].
This phenomenon, in addition to undermining the competitiveness of urban areas, hinders progress towards the goal of carbon neutrality needed to combat climate change, whose achievement is increasingly advocated by major international organizations [5,6,7].
In Europe, the recent Climate Law, enacted as part of the Green Deal, makes this target legally binding by 2050 [8].
Furthermore, by 2050, the European Commission recommends zero net land consumption to Member States, calling on spatial planning to move more and more towards urban regeneration and densification, rather than encouraging further expansionary dynamics of cities, especially in the widespread form of sprawl [9].
According to Eurostat, in 2022 25.8% of final energy consumption in Europe comes from homes, in particular for heating (63.5%), followed by domestic hot water production (14.9%), lighting (13.9%), cooking food (6.3%), cooling (0.6%) and other uses (0.9%).
In this scenario, increasing the energy efficiency of existing residential buildings brings numerous benefits, not only for the reduction in climate-changing emissions in urban areas, but also for the fight against Energy Poverty (EP).
In fact, the poor energy performance of the current residential building stock is considered one of the three main causes of EP, according to the definition given to the latter by the European Commission, together with the low income of residents and the high cost of energy [10].
EP appears to be dramatically increasing in Europe, first as a result of the general impoverishment caused by the COVID-19 pandemic [11], then due to the Russia-Ukraine war crisis, which has led to turbulence in energy markets, price volatility and energy insecurity. As highlighted in the State of the Energy Union 2022 report, the phenomenon of EP no longer affects only low-income households, “but also those with lower and middle income and potentially others in some Member States as well”, putting at risk the achievement of ambitious European decarbonisation targets [12].
In 2023, 10.6% of the EU population said they were unable to heat their homes adequately. Compared to 2022, this share increased by 1.3 percentage points, in a context of energy crisis and inflation [13]. In addition, this new situation threatens sustainable energy planning in general [14].
Dubois and Meier suggest that it is not possible to adopt a single approach to combating EP in all Member States, as some suffer more than others from the problem of deprivation of energy services, with potentially greater difficulties in financing and effectively implementing policies against EP. However, they highlight that the most effective measure concerns the energy efficiency of homes, which represents the only permanent remedy for the lack of energy services [15].
This logic is consistent with the principle of ‘Energy Efficiency First’, recently promoted by the latest update of the European Energy Efficiency Directive [16].
Over the years, scholars and international design companies have been highlighting how it is possible to accelerate the energy transition of cities by intervening on entire neighborhoods or urban districts, rather than on individual buildings, in order to increase the impact of the actions taken [17,18].
Furthermore, if an effective strategy is to intervene at the district scale, acting primarily on the most problematic urban areas in terms of energy consumption, it is equally important to assess the socio-economic characteristics of residents and their possible interconnections with the poor energy performance of homes. If only the energy efficiency of buildings is taken into account, neglecting the related social aspects, or vice versa, there is a risk of acting incompletely, not adequately addressing all the components that characterize the EP phenomenon [19].
In Italy, according to the National Information System of Energy Performance Certificates (SIAPE), based on data collected from over seven million certificates, more than 70% of residential buildings fall into the worst classes (E, F and G), a percentage that drops to about 52% for non-residential use [20].
EP is estimated to be twice the European average already in 2021, as reported by the Italian National Institute of Statistics (ISTAT) [21].
Against this background, and considering the need to limit land take, the Italian government has long promoted energy efficiency interventions in the existing residential building stock through tax incentives and deductions, such as the so-called ‘Ecobonus’. These measures received a significant boost with Decree-Law No. 34/2020, which introduced the financial instrument known as the ‘Superbonus 110%’. The latter was also indirectly aimed at alleviating EP among Italian households; according to an Italian consulting company, households benefiting from the measure achieved energy bill savings of 30.9% when their dwellings improved by two energy classes [22].
However, if not accompanied by local general and energy planning, these policies tend to result in mostly isolated interventions on individual buildings, more frequently single-family houses, due to the greater technical and managerial obstacles associated with multi-family buildings [23].
Although beneficial, isolated interventions are insufficient to address a problem that can affect large parts of a city and should therefore be regarded as a collective issue, requiring a response from local planning.
It should be emphasized that these measures have been implemented within a national regulatory framework that lacks structural policies on urban regeneration, which provides the broader context within which such actions could be integrated, following an integrated approach that also contributes to limiting further land take [24].
In this direction, territorializing incentives and public investments, i.e., targeting them towards areas with the highest levels of EP, where their greater effectiveness is expected, requires spatial knowledge of the geography of EP. Such knowledge can be developed and made available through municipal urban planning processes.
The latter can also lead to the drafting of urban plans—general and integrated energy plans—that provide a support framework at the local level, promoting the energy efficiency of the residential building stock and the reduction in EP in actions, rules and regulations aimed more generally at promoting urban regeneration.
In fact, local authorities play a central role in the fight against EP, thanks to their greater knowledge of territorial needs and the ability to implement targeted interventions integrated with national policies [25].
All planning actions aimed at promoting initiatives such as Renewable Energy Communities (RECs)—particularly those with a solidarity-oriented approach, such as Renewable and Supportive Energy Communities (RSECs)—represent a recent and promising trend, which can be regarded either as an autonomous approach or as one integrated with urban regeneration interventions. Facilitating the development of RECs, among other benefits, can enable households experiencing EP to gain direct or indirect access to clean energy [26,27,28,29,30,31].
2. Literature Review and Aim
Since the topic of EP was introduced in the UK some thirty years ago, it has gradually attracted scholars and policymakers in Europe and beyond [32].
Recently, the EU’s Energy Poverty Advisory Hub (EPAH) developed a handbook on understanding and how to deal with EP. This manual is structured in three parts, corresponding to three main phases of work, considered effective for local governments to tackle EP:
- (1)
- Assessment of energy poverty at an identified local level—‘Diagnosis’ phase;
- (2)
- Development of an informed plan—‘Planning’ phase;
- (3)
- Execution of an impactful energy poverty project—‘Implementation’ phase [19].
In this framework, for each of the three phases, EPAH’s ‘Atlas’ platform compiles information on ongoing initiatives, including national and international projects, policies, and measures addressing EP at the international, national, regional and local levels [33].
As regards the diagnosis phase, the manual confirms the ‘causes’ of energy poverty previously identified by the EU and mentioned above:
- -
- Low income levels;
- -
- Low household energy efficiency and energy performance of buildings;
- -
- High energy prices.
In addition, the manual identifies a non-exhaustive list of ‘vulnerability factors’, i.e., those factors that can make residents more vulnerable to EP: socio-demographic factors such as rented residents, people with low levels of education, and ethnic minorities; factors related to the composition of the family unit, such as single-parent families, and people with disabilities; health factors, such as people with illnesses related to indoor thermal conditions; factors related to energy education, such as lack of awareness of the problem and solutions to address it; cultural factors, related to residents’ behavioral habits [19].
In general, scholars agree that EP is a multidimensional phenomenon, therefore not quantifiable by a single variable but rather through a set of indicators/indices. There is still a debate in the scientific community about what the EP components are, the appropriate methods to measure it and read its geographies at the territorial level [34].
However, the most recent studies on the subject can be classified mainly according to the spatial scale investigated, namely national (I), municipal (II), and infra-municipal or local (III). Most studies concern the national scale [35,36,37,38,39,40,41], while few studies address the issue at the municipal scale [42,43,44], and only a limited number focus on the local level [45,46,47,48,49].
2.1. Measuring and Mapping Energy Poverty
Leaving aside the national scale (I), which is beyond the scope of the research, at the municipal level (II) the study by Gouveia et al. proposes a composite index of vulnerability to EP, organized into two sub-indices, referring to the energy performance of residential buildings and the ability of the population to implement measures to combat EP. The first sub-index is derived from indicators relating to both energy performance and final energy consumption. The second sub-index is constructed by aggregating indicators related to unemployment, housing tenure, education, monthly income, population age, and the state of conservation of buildings [42].
With particular reference to the local scale (III), which is the focus of this paper, Robinson et al. use a multidimensional index of vulnerability to EP, starting from socioeconomic, demographic, housing and energy indicators. Since the context of the study is England, the data useful for measuring these indicators are mainly derived from the 2011 Census. The spatial unit of mapping is the Lower Super Output Area, which is broadly comparable to the neighborhood scale. The composite index is obtained using Principal Component Analysis (PCA), to identify the determining vulnerability factors [45]. This work is taken as a reference by Zardo et al., who apply the same method to Italian metropolitan cities, albeit on a municipal scale [44].
Castaño-Rosa et al. propose an Index of Vulnerable Homes, developed using four sub-indices: monetary poverty, an indicator that assesses the monetary vulnerability of the household based on household net income; energy vulnerability, estimated according to the median energy consumption required for the type of dwelling, established on the basis of the Typology Approach for Building Stock Energy Assessment (TABULA) project; thermal comfort, using the percentage of hours in which living spaces are outside the set comfort range; associated health costs, defined by attributing a range of monetary values to the Quality-Adjusted Life Year. The model was tested in a city centre area of the Borough of Salford, UK. Although the reference to urban planning is not explicit, the work intends to support local policy makers to direct energy renovation interventions. The proposed standard renovation intervention consists of the installation of a combination of energy efficiency measures: thermal insulation of the walls, insulation of the attic and double-glazed windows. The authors highlight that low-income households may still struggle to pay their energy bills, despite improving the energy efficiency of their homes [46].
Recent research, conducted by Clavijo-Núñez et al., proposes a methodology designed to support targeted and participatory regeneration interventions in vulnerable neighborhoods, applied to neighborhoods A and B of Polígono San Pablo, in the city of Seville, Spain. To measure energy vulnerability, an analysis extended to the entire city, the study uses indicators derived from both statistical data (building age, presence of an elevator, building condition, electricity consumption, heating, occupancy, income) and questionnaires administered to residents of some of the most critical neighborhoods (residents’ state of health, obsolete domestic elements). Also in this study it is suggested to pay attention to gender-related issues. However, the authors highlight that the indicators of vulnerability to EP proposed at the European level are difficult to measure at the local scale, due to the lack or outdated nature of publicly available data in Spain [47].
Italian research conducted in Bologna, in the Emilia-Romagna Region, proposes the mapping of EP using an index of vulnerability to EP, obtained from two sub-indices, relating to energy and socio-economic conditions of the population. The sub-indices are aggregated using weights, assigned to each variable according to its importance with respect to the phenomenon, based on the Budget Allocation Process. The authors note that, since a weight must be assigned to each variable, the number of variables should not exceed 10–12. The explicit reference to urban planning is interesting, as the authors suggest incorporating the resulting vulnerability maps into both the General Urban Plan (GUP) and the Sustainable Energy and Climate Action Plan (SECAP) of Bologna Municipality, in order to spatially target and refine strategies to combat energy poverty [48].
More recently, Calama-González et al. assessed energy vulnerability at the local scale in southern Spain, using an open access tool based on GIS. The methodology integrates public and open source data to estimate both the energy performance of the residential building stock and the socio-economic vulnerability of its occupants. Also in this study, the two dimensions are combined in a composite vulnerability index. The method has been tested in Seville on a dwelling scale, but an extension of the model on an urban scale is proposed by the authors, with application to several municipalities in Andalusia [49].
2.2. Current Challenges and Objectives of the Work
The analysis of the state of the art in the field of EP shows that this phenomenon is mostly analyzed on a national scale, while studies exploring the diagnosis of EP at the infra-urban scale are still limited.
In these studies, EP is interpreted in terms of the socio-spatial vulnerability of households, potentially exposed to the risk of experiencing the phenomenon, rather than in absolute terms, based on the number of energy-poor households.
Unlike studies on a national or sub-national scale, which use the municipal base as the minimum spatial unit for the measurement of EP indicators and the consequent mapping, at the local level the spatialization of the chosen variables takes place by census sections or neighborhoods. In fact, census sections generally represent the most detailed spatial level at which the relevant open data—data required to measure socio-economic indicators or indicators related to the characteristics of buildings and homes—are available from official national statistical institutes.
The choice of variables is not straightforward, but depends first of all on the definition of EP adopted, which may be different on a case-by-case basis, and secondly on the availability of data necessary to measure the indicators at the spatial level investigated and for the territorial context under consideration. The transferability of the indicators proposed in previous works to the Italian geographical context is limited by the lack of open data, normally accessible in municipal planning processes, to measure them. Although the data provided by the statistical offices are similar, they are not fully comparable. Therefore, a first research question (RQ1) is: which indicators can provide a multidimensional diagnosis of EP vulnerability at the intra-urban scale using open and institutional data available for urban planning?
The approaches adopted in the cited studies to construct composite indices include: simple arithmetic mean; weighted arithmetic mean; PCA; spatial autocorrelation techniques.
When it comes to measuring EP, it should be considered that indicators can be correlated with each other, with the risk of overestimating some dimensions of the phenomenon relative to others. For example, according to Franco et al., the energy consumption of buildings in Europe is significantly correlated with the following five key variables: living floor area, height, construction year, climatic conditions, building functionality [50]. Thus, if energy consumption is included together with these five additional variables, often mentioned in local-scale studies of EP, vulnerability is likely to be overestimated.
Similarly, in Italian metropolitan areas, household income is significantly correlated with low levels of education and high levels of unemployment [51,52]. In this framework, the PCA method may represent a suitable technique to limit redundancy of information when constructing composite EP indices. Conversely, if the statistical characteristics of the data do not support it, PCA may not be an appropriate technique [53]. Thus, a second research question (RQ2) is: which aggregation approach can provide a robust synthesis of the selected indicators while limiting information redundancy?
The planning implications of the constructed indices, which are consistently represented through thematic maps produced using Geographic Information System (GIS), are neglected. The maps obtained are discussed with reference to generic local policies to combat energy poverty, overlooking the importance of incorporating these policies into urban planning, both general and energy planning, mentioned in a single study [48]. So, a third research question (RQ3) is: how can the spatial diagnosis of EP vulnerability support the targeting and integration of energy, social, and urban regeneration actions within local planning processes?
Ultimately, what emerges from the state of the art is that mapping and tackling EP at a sub-municipal scale remain challenging. According to the identified research questions (RQs), the specific objectives of this work are, in order, the following:
- -
- propose an easily practicable methodology for diagnosing and mapping EP vulnerability within Italian urban planning processes, using data normally available to municipalities, and demonstrate its application to a case study;
- -
- discuss the implications of the results obtained for tackling EP vulnerability at local scale, with particular reference to urban planning.
To this end, Section 3 below describes the proposed methodology, which has been applied to the case study of Milan, Lombardy Region, Italy, as specified in Section 4, while Section 5 contains the results obtained from this application, and a sensitivity analysis aimed at verifying methodology robustness. Section 6 discusses the findings in relation to the literature reviewed in the current Section 2 and the RQs emerged. Section 7 concludes the paper by outlining its limitations and future research developments.
3. Materials and Methods
This paper proposes a methodology for the diagnosis and mapping of Energy Poverty Vulnerability (Vep) at the local scale in the Italian geographical context, to support the choice of actions to tackle Vep, to be implemented in urban planning.
Vulnerability, in accordance with the broader literature on territorial risk, is understood as systemic, i.e., as the set of characteristics of a system responsible for its overall response to one or more hazards [54]. In line with previous studies on EP, referred to in Section 2, the dwelling-occupant system is considered vulnerable with respect to two main issues: energy vulnerability, related to the dwelling energy performance and the demand for basic energy services; the ability of occupants to implement EP alleviation measures. The Vep is evaluated with reference to the LIVep composite index, Local Index of Vulnerability to Energy Poverty (Figure 1).
Figure 1.
Methodological scheme to construct LIVep, Local Index of Vulnerability to Energy Poverty.
This index is based on various indicators, selected by systematizing those proposed by the studies that address the phenomenon of EP vulnerability at the local level. Among the variables identified by the relevant literature, those measurable with Census data and SIAPE data, normally accessible in urban planning processes, were selected for a total of 12 variables. This choice allows for a reliable reading of the phenomenon at a local scale (Section 3.1).
In order to aggregate the indicators into the LIVep composite index, they must be normalized, to harmonize their units of measurement, not the polarity, which is the same for all (Section 3.2).
As mentioned, the indicators can be correlated with each other, therefore, while ensuring the possibility of reading the representative maps of the individual indicators, it is necessary to assess the PCA applicability in the calculation of the overall vulnerability index. PCA is applied not so much to reduce the initial set of indicators, but to avoid overestimating the EP vulnerability phenomenon by using redundant information (Section 3.3).
A sensitivity analysis can be performed to assess the robustness of LIVep to the aggregation method by comparing the PCA-based index with an alternative one (Section 3.4).
3.1. Indicators Selection and Data Collection
With reference to energy vulnerability, energy performance can be assessed through the Global Non-Renewable Performance Index (EPgl,nren), according to the GIS-based methodology proposed by Grimaldi & Marra [30]. Starting from census data, this method allows a value of EPgl,nren to be assigned to each census section throughout the Italian territory using data retrieved from SIAPE. By fixing climatic zone, residential use and building age class, SIAPE returns the corresponding EPgl,nren value, obtained from the average values declared in the APEs of dwellings having the specified characteristics. Since climatic zone is constant within the municipality, the differentiation among census sections is obtained from the number of residential buildings and the composition of the building stock by age class. Specifically, the EPgl,nren value for each census section is calculated as a weighted average of the SIAPE values associated with the different building age classes, using the number of buildings belonging to each age class as weights, according to the procedure detailed in [30].
The EPgl,nren index thus obtained, expressed in kWh/m2 per year, is multiplied by the useful floor area of the dwellings within each census section to estimate the overall demand for basic energy services, expressed in kWh per year [30].
The ability of occupants to implement EP alleviation measures depends on multiple vulnerability factors. The ratio of rented dwellings to total dwellings is a particularly relevant EP indicator, as it is associated with a higher incidence of absolute poverty and lower incentives for energy efficiency, as also suggested by the Italian National Integrated Energy and Climate Plan (PNIEC) [25]. Empty or sporadically occupied dwellings lead to possible deterioration due to lack of maintenance, with negative effects in terms of energy efficiency. Similarly, this happens if the state of conservation of the buildings is mediocre or very bad, a condition indicative of the degree of degradation. The elderly and children, who spend more time at home on average and need stable thermo-hygrometric conditions, are more vulnerable according to the studies examined in the literature reviewed. The widespread presence of foreigners from low-income countries, or families living in overcrowded conditions, is equivalent to a greater probability of being reduced to absolute poverty, consequently also to EP.
The selection of the socio-economic, demographic, and housing-related indicators was additionally supported by the framework proposed by ISTAT within the Italian Parliamentary Commission of Inquiry on urban safety and degradation [52], which provides an institutional basis for diagnosing multidimensional urban vulnerability using census data at the intra-urban scale (Table 1).
Table 1.
Selected infra-urban scale Vulnerability to Energy Poverty (Vep) indicators. Definition, units of measurement, formulas for their measurement and data available for census section useful for calculation.
3.2. Normalization
The normalization of the m basic indicators (, with m = 1, …, 12) is carried out through the “Min-Max” method. Among the possible normalization techniques, this procedure allows to relate the unique values of a single input indicator () to the maximum () and to the minimum () value that the indicator itself assumes in the territory under study, consisting of n census sections (with = 1, …, n). In the chosen set, all indicators have positive polarity, i.e., an increase in their value corresponds to an increase in Vep. Therefore, the formula that obtains the respective normalized values () can be written as follows:
The domain of each normalized indicator is made up of the interval to which it belongs [0, 1], where 1 corresponds to the maximum degree of criticality, while 0 represents the minimum.
3.3. PCA Suitability, Weights Choice and Aggregation
Since some of the selected indicators may convey partially overlapping information, the applicability of Principal Component Analysis (PCA) is assessed before their aggregation.
As a preliminary diagnostic, linear relationships among the normalized indicators are explored through the Pearson correlation matrix. For example, for the normalized indicators and the index is calculated as follows:
where and represent the average values of the two indicators calculated on the set of n census sections of the study area.
The correlation matrix is examined to identify the presence and extent of shared information among the indicators; however, no minimum pairwise correlation is imposed as a necessary condition for PCA, since the overall suitability of the data structure can be assessed through the Kaiser–Meyer–Olkin (KMO) measure of sampling adequacy and Bartlett’s test of sphericity. A KMO value above 0.5 and a statistically significant Bartlett’s test with p-value < 0.05 are considered evidence supporting the applicability of PCA [53].
When these conditions are satisfied, PCA is applied to the normalized indicators. Component retention is primarily based on the Kaiser criterion (eigenvalue ≥ 1), complemented by inspection of the scree plot and by consideration of the cumulative explained variance and substantive interpretability of the extracted components. The percentage of explained variance is therefore used as a diagnostic measure of the information retained by the solution rather than as a fixed exclusion threshold. To facilitate component interpretation, the retained solution is subjected to Varimax rotation with Kaiser normalization. Component scores are estimated using the regression method.
The extracted components are first interpreted as complementary dimensions of Vep on the basis of their rotated loadings. Their inclusion in the composite LIVep additionally requires that the component can be interpreted according to a consistent vulnerability direction, so that increasing component scores can be unambiguously associated with increasing vulnerability.
The composite index , for each i-th census section, will be given by the weighted sum of the Principal Components extracted that satisfy these conditions, as follows:
where is the number of components selected for aggregation and is the weight assigned to each component.
Since Varimax rotation redistributes the variance explained among the retained components, the weights are calculated from the Rotation Sums of Squared Loadings of the components included in LIVep, as follows:
where is the variance explained by the single component after rotation, and the denominator of the formula represents the cumulative variance.
Since the weighted sum of standardized orthogonal component scores does not necessarily have unit variance, the thresholds used to classify the individual standardized component scores are not directly applicable to .
Thus, is subsequently classified with the Natural Breaks method [55], which identifies class boundaries by minimizing within-class variance and maximizing differences between classes. This allows a practical use of the final map of for urban planning purposes.
3.4. Sensitivity Analysis
As emerged from the literature review, several techniques can be used to aggregate the selected indicators as alternatives to PCA. Among these, the arithmetic mean with equal weights represents one of the simplest and most transparent approaches. Therefore, an alternative equal-weighted index (LIVep-EW) is calculated as the arithmetic mean of the twelve normalized indicators, without applying PCA.
To assess the sensitivity of LIVep to the aggregation method, the two indices are compared using Spearman’s rank correlation coefficient. Furthermore, both indices are classified into four vulnerability classes using the Jenks Natural Breaks method, and the agreement between census sections classified as High Vulnerability is assessed.
4. Case of Study
The municipality of Milan is the capital of the Lombardy Region, the most populous in Italy, with over 10 million inhabitants. The city of Milan has 1,365,698 inhabitants in 2025, according to ISTAT data. The census sections identified by ISTAT for the city in 2011 are 6079, of which 68 have no data. In addition, the census sections are aggregated to constitute the Local Identity Nuclei (NIL), equal to 88. The NILs were introduced by the first GUP, which is called the Territorial Government Plan (PGT) in the Lombardy Region, and correspond to the recognizable districts of the city (Figure 2).
Figure 2.
Territorial framework of the municipality of Milan, in Lombardy Region, Italy.
To comply with the commitments made under the ‘C40 Cities’ initiative, the Municipality is currently drafting the ‘Plan for the fight against energy poverty and precariousness’, thus representing an optimal case study for testing the proposed methodology. Through this plan, the municipality intends to address both vulnerability to EP and the risk factors contributing to energy poverty and precariousness, structuring its strategy around four lines of action [56].
The first line of action (Action 1) concerns the establishment of a Municipal Observatory on Energy Welfare and specifically focuses on mapping households experiencing EP, which represent the target of measures aimed at tackling the phenomenon, while the subsequent lines of action define these measures. The mapping methodology consists of an initial measurement of EP based on a traditionally used indicator, namely the ratio of energy expenditure to household income. According to this approach, households are considered to be in EP if the energy expenditure exceeds 10% of household income. In addition, the plan envisages a more detailed assessment in the future, aimed at mapping vulnerable areas that better reflect the multidimensional nature of the phenomenon, in order to identify priority areas for intervention within the municipal territory. This assessment will be performed through the integration of additional economic, energy, climate and socio-demographic indicators (Low Income-High Costs, arrears in bills, energy prices, thermal comfort, age, education and unemployment). The data necessary to measure these indicators will be obtained from both institutional sources and ad hoc surveys. Data can be collected at various spatial scales, involving municipal technical staff, external professionals, and stakeholders. However, the spatial unit for mapping chosen is the census section, which is considered more suitable for the official communication of results, as it allows the data to be anonymized while providing an appropriate spatial resolution for understanding the territorial distribution of the phenomenon.
The measures for tackling EP concern economic support measures, aimed at improving access to energy efficiency incentives and promoting RSECs, in line with the Air and Climate Plan (Action 2); awareness-raising and user accompaniment activities (Action 3); governance tools (Action 4), aimed at strengthening coordination between energy, social and urban policies, within the framework of the Air and Climate Plan and other municipal strategies.
Although there is no explicit reference to the PGT, the municipal office responsible for urban regeneration is mentioned among the actors involved in Action 4.
The current PGT, approved in 2020, identifies areas where integrated actions aimed at promoting widespread urban regeneration are to be prioritized. These priority areas are the following: Buildings in outlying Historic Settlements; Urban Renewal Areas (ARU); Environmental Regeneration Areas; Squares; Interchange nodes; Major Urban Functions Areas. These areas partially overlap with some existing Public housing areas (ERP), which are therefore not all identified as priorities for intervention (Figure 3).
Figure 3.
Priority areas for urban regeneration according to the Territorial Government Plan (PGT) of Milan (own elaboration on data from the map “R.02—Urban Planning Indications” of the PGT).
Energy efficiency interventions and measures aimed at increasing carbon neutrality, on the other hand, apply to the entire municipal territory rather than only to priority areas [57].
5. Results
The application of the proposed methodology to the Milan case study used the following software, used with respect to the workflow in Figure 1:
- -
- QGIS (v. 3.40.4; QGIS Association, Laax, Switzerland) to prepare the input census data, calculate the basic indicators per census section and normalize them [58];
- -
- IBM SPSS Statistics (v. 32.0; IBM Corp., Armonk, NY, USA), for the verification of the PCA applicability, and the subsequent extraction of the Principal Components [59];
- -
- Again QGIS (v. 3.40.4) to classify the output data and visualize the results via choropleth maps.
5.1. Verification of the PCA Applicability
The analysis was conducted on a large number of observations: 6011 census sections, for 12 variables.
The PCA applicability was assessed by examining the Pearson correlation matrix of the twelve normalized indicators (Table A1—Appendix A) and performing the Kaiser–Meyer–Olkin (KMO) measure of sampling adequacy and Bartlett’s test of sphericity.
The value of KMO is equal to 0.706; while Bartlett’s test was statistically significant (χ2 = 8287.058; df = 66; p < 0.001).
These results support the suitability of the dataset for PCA, despite the generally modest pairwise correlations observed among several indicators.
5.2. Extraction and Mapping of the Principal Components
The number of Principal Components to be retained was determined primarily according to the Kaiser criterion (eigenvalue ≥ 1), complemented by inspection of the Scree plot (Figure 4), and consideration of the cumulative explained variance, as well as components interpretability.
Figure 4.
Scree plot of the initial eigenvalues.
The number of components that meet the eigenvalues criterion ≥ 1 is four (Figure 4), and the overall percentage of explained variance is 52.3% (Table 2). Although this percentage indicates that a substantial proportion of the original variability remains unexplained, the four-component solution was retained because it allows distinct and interpretable dimensions of Vep to be identified. The explained variance is therefore considered a measure of the information represented by the extracted components rather than a fixed threshold for excluding PCA.
Table 2.
Rotation sums of squared loadings and percentage of total variance explained by the four retained Principal Components after Varimax rotation.
As previously specified, the retained components were subjected to Varimax rotation with Kaiser normalization to facilitate their interpretation. Table 2 reports the Rotation Sums of Squared Loadings and the corresponding explained variance after rotation.
By observing the matrix of rotated components (Table 3) it is possible to proceed with the interpretation of the extracted Principal Components and recommend possible associated planning strategies, while the extraction communalities of the twelve indicators are reported in Appendix A (Table A2).
Table 3.
Matrix of rotated components for the four extracted Principal Components.
With regard to the First Principal Component (PC1), observing the matrix of rotated components, the value of I3, I5 and I12 is greater than 0.65. The values of I1, I4, I9 and I10 are close to 0.4, while the others are negligible. The signs are positive, so high positive values of PC1 identify areas with greater criticality, low negative values areas with less criticality. PC1 is therefore characterized by high loads associated with the Active unemployment rate (I3), the Low schooling rate (I5) and the Housing rate for rent (I12), mainly configuring itself as a Socio-Economic Vulnerability (Figure 5). Additional contributions, albeit to a lesser extent, are provided by the Global Non-Renewable Energy Performance Index (I1), the First-time job seekers rate (I4), the Vulnerable migration rate (I9), and the Building Degradation Index (I10). This makes this component interpreted as an expression of a multidimensional fragility, even if the socio-economic aspect is predominant. Including both social and energy aspects, PC1 describes a systemic vulnerability. The strategy associated with the most critical areas is Integrated Urban Regeneration, which can provide for a multiplicity of actions, capable of addressing the different dimensions of fragility that this component represents.
Figure 5.
Map of Socio-Economic Vulnerability (PC1).
The Second Principal Component (PC2) has Global Non-Renewable Energy Performance Index (I1) and Demand for basic energy services (I2) above 0.7. The value of the Incidence of children (I6) is greater than 0.5, while all the others are negligible. The signs are positive, so high positive values of PC2 identify areas with greater criticality, low negative values areas with less criticality. Predominantly depending on indicators I1 and I2, PC2 stands as an Energy Vulnerability (Figure 6). Therefore, the strategy associated with the most critical areas is the promotion of Energy Retrofit interventions.
Figure 6.
Map of Energy Vulnerability (PC2).
With regard to the Third Principal Component (PC3), the value of the Old-Age Index (I7) is the only one higher than 0.6. Its loading is negative. The values of I6 and I8 are greater than 0.5, while the value of I9 is close to 0.5. The signs are positive. The other variables are negligible.
Low, negative values of PC3 identify the areas with elderly populations, while high, positive values concern areas with more children and large families.
PC3 highlights a contrast between contexts characterized by a higher incidence of young population and large families and areas with a high Old age index, configuring itself as a dimension of Demographic Vulnerability (Figure 7).
Figure 7.
Map of Demographic Vulnerability (PC3).
With reference to the Fourth Principal Component (PC4), the Incidence of empty or sporadically occupied dwellings (I11) is the only one higher than 0.6 and only the Building Degradation Index (I10) is close to 0.5. The signs are both positive. The values of the First-time job seekers rate (I4) and the Incidence of large families (I8) are close to 0.4 and are negative. The other variables are negligible. The signs are contrasting, therefore low, negative values of PC4 indicate the areas with the greatest criticality in terms of large families and unemployed people; high, positive values of PC4 identify the areas with the greatest criticality in terms of empty dwellings and building degradation.
PC4 is characterized by high loads associated with the incidence of empty or sporadically occupied dwellings and building degradation, configuring itself as a dimension of physical-settlement vulnerability and underuse of the housing stock, in short a Housing Vulnerability (Figure 8).
Figure 8.
Map of Housing Vulnerability (PC4).
The maps obtained were classified into four ranges (<−1; −1–0; 0–1; >1), using the mean (0) and ±1 standard deviation as thresholds. This classification is possible because the scores of the Principal Components are standardized, with a mean of 0 and a standard deviation of 1. So, the thresholds adopted make it possible to distinguish the units with more marked deviations from the mean (more than ±1 standard deviation) from those characterized by intermediate values.
5.3. Measurement and Mapping of the LIVep Index
The first two main components (PC1 and PC2) have a clear interpretative consistency with respect to the polarity of the variables considered, i.e., the explanatory variables have a positive sign of loading. The subsequent components (PC3 and PC4), while contributing to the total variance, show contrasting loading signs that do not allow an unambiguous interpretation of increasing vulnerability. Therefore, they were mapped separately but excluded from the construction of LIVep.
From the correlation analysis of the PC1 and PC2 components it is clear that there is no correlation but they are orthogonal, or uncorrelated. This result was expected, having used Varimax’s rotation, which maintains orthogonality. However, it is interesting that even geographically PC1 and PC2 represent two distinct dimensions of the Vep phenomenon, as is evident from the almost total absence of spatial overlap. Specifically, critical areas for PC1 are more pronounced in peripheral districts, while critical areas for PC2 also concern privately developed housing in central districts (Figure 9).
Figure 9.
Spatial overlap between the critical areas of PC1 and PC2.
These two separate sub-indices of energy poverty, spatialized in the GIS environment, make it possible to obtain the relative maps, useful for territorializing contrast strategies: integrated urban regeneration, in the first case, or energy retrofit, in the second case.
To create the LIVep composite index, useful for knowing the areas with the greatest Vep, priority for intervention, the weighted sum of the PC1 and PC2 components is performed, where the weights take into account the variance explained by the single component with respect to the cumulative variance, given considering both components:
where
w1 = 19.831/32.331 = 0.613
w2 = 12.500/32.331 = 0.387
Higher values of the LIVep composite index indicate increasing levels of criticality, resulting from the combination of socio-economic and energy vulnerability (Figure 10).
Figure 10.
Map of LIVep composite index.
5.4. Sensitivity Analysis of the LIVep Index
A sensitivity analysis was performed to assess the robustness of LIVep to the aggregation method by comparing the PCA-based index with an alternative equal-weighted index (LIVep-EW), obtained as the arithmetic mean of the twelve normalized indicators. The values of LIVep-EW were spatially represented in a GIS environment, obtaining the corresponding map (Figure 11).
Figure 11.
Map of LIVep-EW composite index.
The comparison between the two indices showed a strong positive correlation, with Spearman’s rank correlation coefficient of 0.876 (p < 0.001), indicating a high degree of consistency in the ranking of census sections according to their vulnerability levels.
However, some differences emerged in the identification of the most vulnerable areas: 588 census sections were classified as High Vulnerability according to LIVep, compared with 557 according to LIVep-EW. Of these, 350 census sections were classified as High Vulnerability by both indices, corresponding to 59.5% of those identified by LIVep.
These results indicate that the overall ranking of census sections is relatively stable with respect to the aggregation method, although some differences emerge in identifying the most vulnerable areas.
5.5. Implications of the Results Obtained for Local Planning
Among the areas of the consolidated urban fabric that the PGT considers priorities for regeneration, represented in Figure 3, the Urban Renewal Areas (ARU) are of particular interest to discuss the implications of the results obtained for local planning, as well as Public housing areas (ERP). Thus, spatial overlap was calculated as the percentage of the total surface area of ERP and ARU falling within census sections characterized by critical vulnerability conditions according to PC1, PC2, and LIVep, respectively.
A total of 54.54% of the ERP surface area—as defined in the Milan PGT—falls within census tracts characterized by critical conditions according to PC1, compared with 4.80% according to PC2 (Figure 12). Furthermore, 49.78% of the total ERP surface area falls within census tracts classified as High Vulnerability according to LIVep (Figure 13).
Figure 12.
Spatial overlap between Public housing areas (ERP) and critical areas identified by PC1 and PC2.
Figure 13.
Spatial overlap between ERP areas and critical areas identified by LIVep.
Regarding ARUs, 16.68% and 6.26% of their total surface area fall within census tracts characterized by critical conditions according to PC1 and PC2, respectively (Figure 14), while 8.36% falls within census tracts classified as High Vulnerability according to LIVep (Figure 15). This highlights the potential contribution of Vep mapping to the integration of energy vulnerability considerations into urban regeneration strategies.
Figure 14.
Spatial overlap between Urban Renewal Areas (ARU) and critical areas identified by PC1 and PC2.
Figure 15.
Spatial overlap between ARU and critical areas identified by LIVep.
The drafting of the Plan for the fight against energy poverty and precariousness can benefit from the knowledge thus produced, in order to enhance the potential benefits of urban regeneration, already envisaged by the PGT, also in terms of tackling Vep (Action 4), and to spatially target measures aimed at facilitating access to energy efficiency incentives (Action 2).
Furthermore, the results suggest that the critical conditions affecting ERP areas are predominantly associated with socio-economic vulnerability (PC1). This finding is consistent with the fact that the presence of public housing may itself influence the socioeconomic composition of census tracts. However, vulnerability represented by PC1 is particularly pronounced in peripheral districts, where most ERP areas are located.
Energy vulnerability (PC2), on the other hand, also affects privately developed housing in central districts.
For the implementation of Action 2, which concerns the promotion of the RSECs, in line with the current Air and Climate Plan, and Action 3, relating to awareness-raising and user accompaniment activities, this knowledge is useful for identifying priorities for intervention.
With this awareness, the mapping of Vep envisaged by the Plan under Action 1 should be carried out.
More generally, these results confirm the importance of complementing the analysis of the energy efficiency of the building stock with the related social and economic aspects, in order to effectively counteract all dimensions of Vep.
6. Discussion
Previous studies on the EP subject show that in the scientific community there is a general agreement on the causes of EP, while there is still a lack of a shared vision on vulnerability indicators at the local scale.
With reference to the first research question (RQ1), previous studies addressing EP vulnerability at the intra-urban scale are still limited, probably due to the difficulty of finding the data necessary to measure EP indicators at such a detailed level [47]. In Italy, the datasets available in open format do not allow the measurement of all the variables identified by the relevant studies at an infra-urban scale, limiting their transferability to other geographical contexts. This work proposes a method of diagnosis of Vep entirely based on open data provided by public institutions, therefore easily practicable within urban planning processes.
This choice represents a strength of the work in terms of its transferability, but it implies that some indicators proposed by the relevant studies have not been selected due to the lack of data available in open format at an infra-urban scale for the entire Italian territory. This is the case, for example, of the ‘income’ variable and the indicators related to gender vulnerability.
The inclusion of income, recognized as one of the main drivers of EP, is supported by numerous studies addressing EP at the local level [42,46,47,48]. In the Italian geographical context, the territorial variation of per capita income is generally not known at an infra-urban scale. In fact, the Ministry of Economy and Finance provides these data with reference to a lower spatial detail, i.e., for each Italian municipality, with the exception of some large cities. To overcome this problem, it is possible to use other variables, measurable at the local level, that are indicative of potential socio-economic hardship among resident households, according to the technical-scientific literature on urban poverty. These variables, so-called ‘proxies’, have been proposed in order to identify measures other than income, since incomes tend to fluctuate over time, and related data may also be affected by under-reporting, especially with reference to individual income [60]. Nevertheless, similar problems may also arise when using income proxy variables. The market value of a dwelling is widely considered a proxy variable for estimating the income of its inhabitants. In Italy, these data can be derived from the property values provided by the Real Estate Market Observatory (OMI), through which the Revenue Agency has mapped urban and rural areas according to their market values across the entire Italian territory [61]. However, the level of spatial detail is not sufficient to differentiate within urban centres and smaller settlements, i.e., on an infra-urban scale.
The gender issue has been raised by relevant and very recent studies, which recommend considering the greater vulnerability of the female population to EP when the phenomenon is investigated on an infra-urban scale [47,62]. However, the proposed indicators, such as those relating to single women with children or elderly women living alone, cannot be measured using open data available at the infra-urban scale across the entire Italian territory. Manaresi and Santangelo, for example, report that they obtained such data from the municipality of Bologna, although at a less detailed spatial scale than the census section [48].
Further indicators were not considered, not only due to the lack of data, but also because they were already partly taken into account in the energy vulnerability assessment. One of these variables is the average outdoor temperature, proposed by Robinson et al. [45], whereas Zardo et al. use degree days [44]. From an operational perspective, it is problematic to find temperature datasets at the infra-urban level. Values are usually available for large areas, therefore at an infra-regional scale. The knowledge of temperature at the local scale requires advanced specialized processing, for example through the analysis of satellite data conducted for a specific study area [63]. It should also be noted that this variable is already taken into account through the climate zone, which is used to estimate energy vulnerability.
Data limitations can be addressed by integrating the available datasets with information directly provided by local authorities or citizens. The knowledge offered by the data already available can also serve as a basis for involving citizens in providing their data, thus allowing the results of the proposed approach to be compared with those obtained through a participatory one.
The second research question (RQ2) concerns the methods used to construct the composite indices based on the indicators identified to measure the selected vulnerability factors. As for the approaches adopted in previous studies to construct composite indices, the choice depends both on the objectives of the work and on the applicability of these methods. For example, PCA requires an adequate number of observations and a suitable correlation structure among the selected variables, as assessed through appropriate statistical tests. Therefore, its applicability must be verified in relation to the characteristics of the territorial context under study. The weighted average, on the other hand, is affected by the choice of weights, especially if this does not rely on statistical criteria, but depends on a subjective judgment. In the latter case, the method may be valid for the context examined but it is not automatically suitable for territories that do not have similar characteristics. These issues have already been highlighted by scholars regarding the application of these methods to other urban phenomena [64].
In the Milan case study, the large number of observations and the adequate statistical properties of the data supported the application of PCA. Among the extracted components, Socio-Economic Vulnerability (PC1) and Energy Vulnerability (PC2) were aggregated into LIVep, providing a synthetic representation of these dimensions intended to support spatial planning decisions. Conversely, PC3 and PC4, related to demographic and housing vulnerability, were retained as complementary diagnostic dimensions but excluded from LIVep, since their contrasting loading structures do not allow an unambiguous direction of vulnerability to be identified without introducing additional assumptions. Consequently, their direct translation into planning strategies is less straightforward. Notably, PC1 and PC2 correspond to the two core dimensions of energy poverty vulnerability recurrently identified in the reviewed literature. Nevertheless, since PC1 and PC2 together explain 32.331% of the original variance, LIVep should be interpreted as a planning-oriented synthesis of selected vulnerability dimensions rather than an exhaustive measure of vulnerability to energy poverty. Furthermore, since I2 measures an absolute quantity of energy, its contribution to PC2 may also reflect differences in residential floor area across census sections.
The sensitivity analysis compared LIVep with an alternative index based on the arithmetic mean of the twelve normalized indicators, assigning equal weights to all indicators to avoid context-specific weighting choices and facilitate the transferability of the method beyond the Milan case study. The results showed a good degree of robustness of LIVep in terms of the overall ranking of census sections, although the areas identified as having the highest vulnerability did not fully overlap. It should be noted that this comparison also reflects differences in the information retained in the final indices, since LIVep is based on Principal Components PC1 and PC2, whereas LIVep-EW includes all twelve original indicators. Therefore, the resulting maps of priority areas should be interpreted with caution. Overall, these findings highlight the importance of assessing both the applicability of PCA and the influence of the aggregation method when transferring the proposed methodological workflow to other territorial contexts.
The third research question (RQ3) concerns how the spatial diagnosis of Vep can support the targeting and integration of energy, social, and urban regeneration actions within local planning processes.
To combat EP through sustainable urban planning, it is possible to act on energy vulnerability on the one hand, and on the ability of occupants to implement alleviation measures on the other.
This approach translates into spatial strategies for tackling EP on a local scale, which can be framed in two main lines of action:
- -
- redeveloping the building stock as a priority where there is a greater problem (e.g., high energy consumption, poor energy performance of buildings), which can be addressed by facilitating private initiative through the rules of the general urban plan (e.g., by favoring volumetric increases, making urban planning parameters more flexible) or through local taxation (e.g., reductions in property and waste taxes);
- -
- identifying situations where residents cannot cope with such interventions, due to low income or other factors of social deprivation or vulnerability, i.e., where more incisive public action is needed, through integrated urban regeneration interventions.
A concrete example of the implementation of such strategies is the Metropolitan Urban Development Plan of the Metropolitan Area of Barcelona [65]. Although the concept of energy poverty is not expressly mentioned, the plan makes explicit reference to the phenomena of energy vulnerability and social vulnerability. For residential buildings in conditions of “energy deficit” or “energy vulnerability”, the plan provides for the “rehabilitate” strategy, while residential buildings that fall within urban areas where there is high social vulnerability are included in areas of urban regeneration, called “ARU-Re”, for which more integrated strategies are needed.
Urban regeneration is integrated, in the sense that it can provide for a plurality of actions, both aimed at the built environment and of a social and economic nature, intercepting the objectives of any existing sectoral planning. In this sense, the case of Milan is emblematic, as the drafting of the Plan for the fight against energy poverty and precariousness provides for a specific action (Action 4) aimed at systematizing energy, social and urban policies as part of the Air and Climate Plan and other municipal strategies, incorporating this perspective of integration.
However, the results obtained highlight the importance of integrating a spatially explicit diagnosis of Vep into urban planning processes.
The comparison with the PGT forecasts provides an initial assessment of the spatial relationships between the areas already identified as priorities for urban renewal and those characterized by critical vulnerability conditions. Moreover, the overlap with public housing areas highlights the relevance of socio-economic vulnerability in defining local intervention priorities. In this context, LIVep can support the identification of priority areas, while the maps of the individual components provide complementary information for differentiating interventions according to the prevailing dimensions of vulnerability. This knowledge can contribute to the implementation of Actions 2 and 3 of the municipal Plan for tackling energy poverty, within the broader policy coordination envisaged by Action 4.
7. Conclusions
This work proposes the construction of a knowledge base of local vulnerability to energy poverty, in order to support urban planning processes, informing measures aimed at tackling the phenomenon. The maps obtained, both for the LIVep composite index and Vep components, allow to spatially identify the most critical areas and, through PCA, where applicable, to distinguish the main dimensions of vulnerability. The knowledge produced aims to orient and coordinate energy, social and urban regeneration policies, to be translated into both general and sectoral urban planning tools, as demonstrated by the application to the case study of the municipality of Milan (Italy). The approach underlying the definition of the knowledge base is quantitative and based on datasets available throughout Italy, supporting the replicability of the method in other Italian municipalities.
The findings provide answers to the three research questions formulated after a literature review. First, a multidimensional diagnosis of Vep at the intra-urban scale can be developed using a set of indicators derived from open and institutional data available for municipalities (RQ1). Second, the proposed workflow allows the aggregation method to be selected according to the statistical characteristics of the data, using PCA where its applicability is supported, in order to limit information redundancy in the construction of the composite index. The sensitivity analysis showed a strong consistency in the overall ranking of census sections, although the identification of the most vulnerable areas remains sensitive to the aggregation method (RQ2).
Third, the spatial knowledge obtained can support the targeting of actions and their integration across energy, social, and urban regeneration policies within urban planning processes (RQ3).
Accordingly, the main contribution of the study is a spatial decision-support framework, based on open and institutional data and GIS, that links the multidimensional diagnosis of Vep at the intra-urban scale with the spatial targeting of planning actions.
The main limitation of the work presented concerns the outdated nature of the census data used to measure the proposed indicators, derived from the 2011 ISTAT Census. This was necessary because the input census variables are not yet available in the data released by the most recent censuses, although they are likely to become available in the future.
In addition, the energy data derived from SIAPE refer to different time periods, while, ideally, they should refer to the same reference year as the census data. Furthermore, SIAPE provides data derived from APEs, which are issued on the occasion of leases, sales, or renovations; dwellings without an APE are therefore underrepresented in the database. However, currently SIAPE represents the most suitable Italian source for retrieving the type of energy data required by the proposed methodology, being an institutional, open-access source with data available for the entire national territory.
Therefore, these aspects limit the ability to use the results as representative of current conditions. However, the aforementioned limitations could be overcome through future updates of the census datasets, or the availability of more recent local data sources with an equivalent level of spatial detail, which would allow the diagnosis to be updated. While keeping the proposed methodological structure substantially unchanged, some adjustments related to the indicators could be made, having adequate data that allow it, i.e., the indicator I2 could be constructed in such a way as to be independent of I1, while the indicator I9 could better reflect the foreign population actually living on low incomes.
With reference to the specific application to the Milan case study, future developments should include further testing of alternative normalization methods and component-retention criteria within the PCA framework.
Further progress of the work could also include the validation of the results against independent measures, where available, such as aggregated data on energy bonus beneficiaries or payment arrears, as well as the vulnerability maps to be produced as part of Action 1.
A further limitation concerns the spatial comparison between critical Vep areas and existing planning geographies, which is based on the observed spatial overlaps. Future developments could complement this analysis with permutation or Monte Carlo tests to assess whether the observed overlaps differ significantly from those expected under random spatial allocation.
Moreover, the proposed methodology does not explicitly account for the spatial dependence among the territorial units of analysis. Future research could therefore investigate the spatial autocorrelation of Vep and its components, in order to assess whether similar vulnerability conditions tend to cluster spatially and to identify statistically significant spatial patterns.
The methodological framework is potentially transferable to geographical contexts other than Italy, where comparable census and energy-related data are available. In this direction, the indicators and data sources may require adaptation to local data availability and planning contexts.
Future developments of the work also concern the extension of the proposed diagnosis to vulnerability to Summer Energy Poverty (SEPOV), a phenomenon expected to become increasingly relevant for sustainable urban planning due to climate change [62,63]. Finally, while the knowledge produced is useful in supporting decision-making, planning strategies will ultimately result from technical, political and social choices, also informed by citizen engagement. Innovative methodologies for public participation include Digital Twins, AI-based approaches and immersive visualization tools [66,67,68].
Author Contributions
Conceptualization, A.M.; methodology, A.M.; software, A.M.; validation, A.M. and M.G.; formal analysis, A.M.; investigation, A.M.; data curation, A.M.; writing—original draft preparation, A.M.; writing—review and editing, A.M. and M.G.; visualization, A.M.; supervision, A.M. and M.G.; project administration, A.M. and M.G.; funding acquisition, A.M. and M.G. All authors have read and agreed to the published version of the manuscript.
Funding
This study was carried out during the project “Monitoring Planned Renewable Energy Communities—MOPREC” (CUP: F53C25001450001), selected for funding under the Public Call for Research, Development and Technological Innovation Projects (Public Call No. 131 of 3 April 2025), issued by the Italian Ministry of the Environment and Energy Security (MASE). Michele Grimaldi is scientist responsible for the entire project, divided into five Activity Lines (ALs). Alessandra Marra is a member of the research group and the scientist co-responsible for AL1.1, which aims to design a dynamic monitoring and modeling system of RECs spatial configurations.
Institutional Review Board Statement
Not applicable.
Informed Consent Statement
Not applicable.
Data Availability Statement
The original data used in this study is publicly available from the institutional sources specified and cited in the manuscript. The processed datasets are not publicly available at this stage because they are associated with the ongoing MOPREC research and development project, and their potential release is subject to ongoing evaluation of data-sharing and intellectual property arrangements. Requests for access to the processed datasets may be directed to the corresponding authors and will be considered in accordance with the applicable project arrangements.
Conflicts of Interest
The authors declare no conflicts of interest.
Abbreviations
The following abbreviations are used in this manuscript:
| ARU | Urban Renewals Areas |
| ENEA | Italian Agency for New Technologies, Energy and Sustainable Economic Development |
| EP | Energy Poverty |
| EPgl,nren | Global Non-Renewable Performance Index |
| EPAH | Energy Poverty Advisory Hub |
| ERP | Public housing |
| GIS | Geographic Information System |
| GUP | General Urban Plan |
| ISTAT | Italian National Institute of Statistics |
| KMO | Kaiser-Meyer-Olkin |
| LIVep | Local Index of Vulnerability to Energy Poverty |
| OMI | Italian National Real Estate Market Observatory |
| PCA | Principal Component Analysis |
| PC1 | Socio-Economic Vulnerability |
| PC2 | Energy Vulnerability |
| PC3 | Demographic Vulnerability |
| PC4 | Housing Vulnerability |
| PGT | General Urban Plan of Milan Municipality |
| PNIEC | Italian National Integrated Energy and Climate Plan |
| RECs | Renewable Energy Communities |
| RSECs | Renewable and Supportive Energy Communities |
| SECAP | Sustainable Energy and Climate Action Plan |
| SIAPE | Energy Performance Certificates Information System |
| Vep | Vulnerability to Energy Poverty |
Appendix A
Table A1.
Correlation matrix of the normalized indicators.
Table A2.
Communalities of the twelve indicators derived from the rotated component matrix.
References
- UN-Habitat; United Nations Human Settlements Programme. World Cities Report 2022: Envisaging the Future of Cities; UN-Habitat: Nairobi, Kenya, 2022. [Google Scholar]
- Taylor, P.J.; Lang, R.E. The shock of the new: 100 concepts describing recent urban change. Environ. Plan. A 2004, 36, 951–958. [Google Scholar] [CrossRef] [Scilit]
- UN-Habitat; United Nations Human Settlements Programme. World Cities Report 2024: Cities and Climate Action; UN-Habitat: Nairobi, Kenya, 2024. [Google Scholar]
- UN-Habitat; United Nations Human Settlements Programme. World Cities Report 2026: The Global Housing Crisis: Pathways to Action; UN-Habitat: Nairobi, Kenya, 2026. [Google Scholar]
- UNFCCC, United Nations Framework Convention on Climate Change. Paris Agreement. In Proceedings of the 21st Conference of the Parties (COP21), Paris, France, 30 November–11 December 2015; UNFCCC: Paris, France, 2015. [Google Scholar]
- UN, United Nations. Transforming Our World: The 2030 Agenda for Sustainable Development; UN: New York, NY, USA, 2015. [Google Scholar]
- UN, United Nations. Resolution Adopted by the General Assembly on 23 December 2016, 71/256, New Urban Agenda; UN: New York, NY, USA, 2017. [Google Scholar]
- European Commission. Regulation 2021/1119 of the European Parliament and of the Council of 30 June 2021 Establishing the Framework for Achieving Climate Neutrality and Amending Regulations (EC) No 401/2009 and (EU) 2018/1999 («European Climate Law»); European Commission: Brussels, Belgium, 2021. [Google Scholar]
- European Commission. EU Soil Strategy for 2030: Reaping the Benefits of Healthy Soils for People, Food, Nature and Climate; European Commission: Brussels, Belgium, 2021. [Google Scholar]
- Rademaekers, K.; Yearwood, J.; Ferreira, A.; Pye, S.; Hamilton, I.; Agnolucci, P.; Grover, D.; Karásek, J.; Anisimova, N. Selecting Indicators to Measure Energy Poverty; European Commission: Brussels, Belgium; DG Energy: Brussels, Belgium, 2016. [Google Scholar]
- European Commission. State of the Energy Union 2021–Contributing to the European Green Deal and the Union’s Recovery. 2021. Available online: https://eur-lex.europa.eu/legal-content/EN/TXT/?uri=CELEX:52021DC0950&qid=1635753095014 (accessed on 24 August 2026).
- European Commission. State of the Energy Union 2022; COM (2022) 547 Final; European Commission: Brussels, Belgium, 2022. [Google Scholar]
- European Commission. State of the Energy Union Report 2024 (Pursuant to Regulation EU/2018/1999 on the Governance of the Energy Union and Climate Action); Report from the Commission to the European Parliament, the Council, the European Economic and Social Committee and the Committee of the Regions; European Commission: Brussels, Belgium, 2024. [Google Scholar]
- Tsangas, M.; Papamichael, I.; Zorpas, A.A. Sustainable energy planning in a new situation. Energies 2023, 16, 1626. [Google Scholar] [CrossRef] [Scilit]
- Dubois, U.; Meier, H. Energy affordability and energy inequality in Europe: Implications for policymaking. Energy Res. Soc. Sci. 2016, 18, 21–35. [Google Scholar] [CrossRef] [Scilit]
- European Parliament; Council of the European Union. Directive (EU) 2023/1791 of the European Parliament and of the Council of 13 September 2023 on energy efficiency and amending Regulation (EU) 2023/955 (recast). Off. J. Eur. Union 2023, L 231, 1–111. [Google Scholar]
- Paiho, S.; Ketomäki, J.; Kannari, L.; Häkkinen, T.; Shemeikka, J. A new procedure for assessing the energy-efficient refurbishment of buildings on district scale. Sustain. Cities Soc. 2019, 46, 101454. [Google Scholar] [CrossRef] [Scilit]
- C40Cities and ARUP: Green and Thriving Neighbourhoods Guidebook. 2021. Available online: https://www.arup.com/perspectives/publications/research/section/green-and-thriving-neighbourhoods (accessed on 24 August 2026).
- EU Energy Poverty Advisory Hub. Introduction to the Energy Poverty Advisory Hub (EPAH) Handbooks: A Guide to Understanding and Addressing Energy Poverty; Energy Poverty Advisory Hub: Bruxelles, Belgium, 2022. [Google Scholar]
- ENEA, Agenzia Nazionale per le Nuove Tecnologie, l’Energia e lo Sviluppo Economico Sostenibile. Sistema Informativo degli Attestati di Prestazione Energetica—SIAPE; ENEA: Roma, Italy, 2015; Available online: https://siape.enea.it (accessed on 24 August 2026).
- ISTAT, Italian National Institute of Statistics. Statistical Information for 2030 Agenda in Italy; ISTAT: Rome, Italy, 2022. [Google Scholar]
- Nomisma. 110% Monitor: L’analisi Nomisma per Misurare L’impatto Economico Della Misura del Superbonus 110% [110% Monitor: Nomisma’s Analysis to Assess the Economic Impact of the Superbonus 110% Measure]. Available online: https://www.nomisma.it/press-area/superbonus-nomisma-comunicato-stampa/ (accessed on 24 August 2026).
- Dolores, L.; Macchiaroli, M.; De Mare, G. Financial Impacts of the Energy Transition in Housing. Sustainability 2022, 14, 4876. [Google Scholar] [CrossRef] [Scilit]
- European Commission. Integrated Regeneration of Deprived Areas and the New Cohesion Policy Approach. An URBACT Contribution to the European Urban Agenda; Publications Office: Luxembourg, Germany, 2015; Available online: https://urbact.eu/sites/default/files/2025-03/20150909_urbact_deprived-areas_gb_md_1.pdf (accessed on 24 August 2026).
- MASE, Ministry of the Environment and Energy Security. Integrated National Energy and Climate Plan; MASE: Rome, Italy, 2024. [Google Scholar]
- Gerundo, R.; Marra, A. A Decision Support Methodology to Foster Renewable Energy Communities in the Municipal Urban Plan. Sustainability 2022, 14, 16268. [Google Scholar] [CrossRef] [Scilit]
- Marra, A. A Model to Detect Low Income Urban Areas to Plan Renewable Energy Communities Against Energy Poverty. In Computational Science and Its Applications—ICCSA 2023 Workshops; Gervasi, O., Murgante, B., Rocha, A.M.A.C., Garau, C., Scorza, F., Karaca, Y., Torre, C.M., Eds.; LNCS; Springer: Cham, Switzerland, 2023; Volume 14112, pp. 353–363. [Google Scholar] [CrossRef] [Scilit]
- Marra, A.; Luciano, D. Planning Renewable Energy Communities in Intermediate Areas. A Case of Study. In Computational Science and Its Applications—ICCSA 2024 Workshops. ICCSA 2024; Gervasi, O., Murgante, B., Garau, C., Taniar, D., Rocha, A.M.A.C., Faginas Lago, M.N., Eds.; LNCS; Springer: Cham, Switzerland, 2024; Volume 14818, pp. 256–271. [Google Scholar] [CrossRef] [Scilit]
- Marra, A. Exploring the integration of Renewable Energy Communities in urban planning. The case of Italy. Sci. Territ. 2024, 12, 18–31. [Google Scholar] [CrossRef] [Scilit]
- Grimaldi, M.; Marra, A. Optimizing the Spatial Configuration of Renewable Energy Communities: A Model Applied in the RECMOP Project. Sustainability 2025, 17, 6744. [Google Scholar] [CrossRef] [Scilit]
- Marra, A.; Grimaldi, M.; Fasolino, I.; Sebillo, M.M.L. Renewable Energy Communities Monitoring, Optimization, and Planning. The RECMOP Research Project. In Computational Science and Its Applications—ICCSA 2025 Workshops; Gervasi, O., Murgante, B., Garau, C., Karaca, Y., Lago, M.N.F., Scorza, F., Braga, A.C., Eds.; LNCS; Springer: Cham, Switzerland, 2025; Volume 15899, pp. 122–132. [Google Scholar] [CrossRef] [Scilit]
- Maxim, A.; Mihai, C.; Apostoaie, C.M.; Popescu, C.; Istrate, C.; Bostan, I. Implications and Measurement of Energy Poverty across the European Union. Sustainability 2016, 8, 483. [Google Scholar] [CrossRef] [Scilit]
- Energy Poverty Advisory Hub (EPAH) Atlas. Available online: https://energy-poverty.ec.europa.eu/discover-community/epah-atlas (accessed on 24 August 2026).
- Castaño-Rosa, R.; Solís-Guzmán, J.; Rubio-Bellido, C.; Marrero, M. Towards a multiple-indicator approach to energy poverty in the European Union: A review. Energy Build. 2019, 193, 36–48. [Google Scholar] [CrossRef] [Scilit]
- Thomson, H.; Bouzarovski, S.; Snell, C. Rethinking the measurement of energy poverty in Europe: A critical analysis of indicators and data. Indoor Built Environ. 2017, 26, 879–901. [Google Scholar] [CrossRef] [Scilit]
- Karpinska, L.; Śmiech, S. Invisible energy poverty? Analysing housing costs in Central and Eastern Europe. Energy Res. Soc. Sci. 2020, 70, 101670. [Google Scholar] [CrossRef] [Scilit]
- Karpinska, L.; Śmiech, S. Escaping Energy Poverty: A Comparative Analysis of 17 European Countries. Energies 2021, 14, 5761. [Google Scholar] [CrossRef] [Scilit]
- Cyrek, M.; Cyrek, P. Rural Specificity as a Factor Influencing Energy Poverty in European Union Countries. Energies 2022, 15, 5463. [Google Scholar] [CrossRef] [Scilit]
- Kryk, B.; Guzowska, M.K. Assessing the Level of Energy Poverty Using a Synthetic Multidimensional Energy Poverty Index in EU Countries. Energies 2023, 16, 1333. [Google Scholar] [CrossRef] [Scilit]
- Wojewódzka-Wiewiórska, A.; Dudek, H.; Ostasiewicz, K. Household Energy Poverty in European Union Countries: A Comparative Analysis Based on Objective and Subjective Indicators. Energies 2024, 17, 4889. [Google Scholar] [CrossRef] [Scilit]
- Campagna, L.; Radaelli, L.; Ricci, M.; Rancilio, G. Exploring the Complexity of Energy Poverty in the EU: Measure it, Map it, Take Actions. Curr. Sustain. Renew. Energy Rep. 2024, 11, 116–126. [Google Scholar] [CrossRef] [Scilit]
- Gouveia, J.P.; Palma, P.; Simoes, S.G. Energy poverty vulnerability index: A multidimensional tool to identify hotspots for local action. Energy Rep. 2019, 5, 187–201. [Google Scholar] [CrossRef] [Scilit]
- Camboni, R.; Corsini, A.; Miniaci, R.; Valbonesi, P. Mapping fuel poverty risk at the municipal level. A small-scale analysis of Italian Energy Performance Certificate, census and survey data. Energy Policy 2021, 155, 112324. [Google Scholar] [CrossRef] [Scilit]
- Zardo, L.; Cortinovis, C.; Lucertini, G. Prejudices May Be Wrong: Exploring Spatial Patterns of Vulnerability to Energy Poverty in Italian Metropolitan Areas. Sustainability 2024, 16, 8975. [Google Scholar] [CrossRef] [Scilit]
- Robinson, C.; Lindley, S.; Bouzarovski, S. The Spatially Varying Components of Vulnerability to Energy Poverty. Ann. Am. Assoc. Geogr. 2019, 109, 1188–1207. [Google Scholar] [CrossRef] [Scilit]
- Castaño-Rosa, R.; Sherriff, G.; Thomson, H.; Solís Guzmán, J.; Marrero, M. Transferring the index of vulnerable homes: Application at the local-scale in England to assess fuel poverty vulnerability. Energy Build. 2019, 203, 109458. [Google Scholar] [CrossRef] [Scilit]
- Clavijo-Núñez, S.; Herrera-Limones, R.; Rey-Pérez, J.; Roa-Fernández, J.; Hernández-Valencia, M. Analysis of the distribution of energy poverty in southern Spain: The relevance of working at the neighbourhood level. GeoJournal 2024, 89, 95. [Google Scholar] [CrossRef] [Scilit]
- Manaresi, S.; Santangelo, A. Investigating the spatial distribution of energy poverty. An application to the city of Bologna. TeMA J. Land Use Mobil. Environ. 2024, 81–96. [Google Scholar] [CrossRef]
- Calama-González, C.M.; Escandón, R.; Suárez, R.; Abajo-Casado, E.; Diánez-Martínez, A.R. Urban-scale building assessment and energy vulnerability mapping through an interactive geo-referenced web tool: Demonstration applicability to southern Spain. Environ. Dev. Sustain. 2025. [Google Scholar] [CrossRef] [Scilit]
- Franco, C.; Maduta, C.; Martínez, A.M.; Florio, P.; D’Agostino, D.; Todeschi, V.; Kona, A. Identification of essential variables for the estimation of energy demand in buildings at European scale. J. Build. Eng. 2026, 119, 115222. [Google Scholar] [CrossRef] [Scilit]
- Andreoli, A.; Biagetti, M.; Casavola, P.; Venanzi, D. Poverty Maps. Territorial Analysis of Socio-Economic Disadvantage in Urban Areas. An Exercise for the 14 Italian Metropolitan Cities; Technical Report; NUVAP–Evaluation and Analysis Unit for Programming, Department for Cohesion Policies of Italian Prime Minister Office: Rome, Italy, 2017. [Google Scholar]
- ISTAT–Italian National Institute of Statistics. Commissione Parlamentare di Inchiesta sulle Condizioni di Sicurezza e Sullo Stato di Degrado delle città e delle loro Periferie. Audizione dell’Istituto Nazionale di statistica. Nota Metodologica [Parliamentary Committee of Inquiry into the Security Conditions and the State of Degradation of Cities and Their Suburbs. Hearing of the National Institute of Statistics. Methodological Note]; ISTAT: Rome, Italy, 2024. [Google Scholar]
- Nardo, M.; Saisana, M.; Saltelli, A.; Tarantola, S.; Hoffmann, A.; Giovannini, E. Handbook on Constructing Composite Indicators: Methodology and User Guide; OECD Publishing: Paris, France, 2008. [Google Scholar]
- Marra, A. Il rischio di periferizzazione nelle aree urbane e metropolitane. Una proposta metodologica per l’analisi e la mitigazione [Peripheralization Risk in Urban and Metropolitan Areas. A Methodological Proposal for the Analysis and Mitigation]. Ph.D. Thesis, University of Salerno, Fisciano, Italy, 2021. [Google Scholar] [CrossRef]
- Jenks, G.F. The Data Model Concept in Statistical Mapping. In International Yearbook of Cartography; Frenzel, K., Ed.; George Philip: London, UK, 1967; Volume 7. [Google Scholar]
- Milan Municipality. Plan to Combat Energy Poverty and Precariousness. Available online: https://www.comune.milano.it/argomenti/ambiente-e-animali/piano-per-il-contrasto-alla-poverta-e-precarieta-energetiche (accessed on 24 August 2026).
- Milan Municipality. General Urban Plan, Regulatory Plan. Available online: https://pgt.comune.milano.it/piano-delle-regole (accessed on 24 August 2026).
- OSGeo—Open Source Geospatial Foundation. QGIS Geographic Information System. Version 3.40.4. Available online: https://qgis.org/ (accessed on 24 August 2026).
- IBM. SPSS Statistics, Version 32; IBM: Armonk, NY, USA, 2025. [Google Scholar]
- Baker, J.; Schuler, N. Analyzing Urban Poverty. A Summary of Methods and Approaches; Policy Research Paper 3399; World Bank: Washington, DC, USA, 2004. [Google Scholar]
- Italian Revenue Agency: Database of Real Estate Prices. Available online: https://www1.agenziaentrate.gov.it/servizi/geopoi_omi/index.php (accessed on 24 August 2026).
- Núñez-Peiró, M.; Sánchez-Guevara Sánchez, C.; Sanz Fernández, A.; Gayoso-Heredia, M.; López-Bueno, J.A.; Neila González, F.J.; Linares, C.; Díaz, J.; Gómez-Muñoz, G. Exposure and Vulnerability Toward Summer Energy Poverty in the City of Madrid: A Gender Perspective. In Smart and Sustainable Planning for Cities and Regions, SSPCR 2019; Bisello, A., Vettorato, D., Haarstad, H., Beurden, J.B.-V., Eds.; Green Energy and Technology; Springer: Cham, Switzerland, 2021; pp. 481–495. [Google Scholar] [CrossRef] [Scilit]
- Sharma, G.K.; Fasolino, I. Evaluating the effect of urban built-up expansion on the heat exposure in an Indian metropolitan city during 2000–2020. Energy Build. 2026, 367, 117739. [Google Scholar] [CrossRef] [Scilit]
- Gerundo, R.; Marra, A.; De Salvatore, V. Construction of a Composite Vulnerability Index to Map Peripheralization Risk in Urban and Metropolitan Areas. Sustainability 2020, 12, 4641. [Google Scholar] [CrossRef] [Scilit]
- AMB, Barcelona Metropolitan Area. Metropolitan Urban Development Plan (Pla Director Urbanístic Metropolità—PDUM); AMB: Barcelona, Spain, 2023; Available online: https://urbanisme.amb.cat (accessed on 24 August 2026).
- Casillo, M.; Cecere, L.; Colace, F.; Lo Russo, A.; Santaniello, D.; Valentino, C. Digital Twin and Metaverse Supporting Smart Cities: New Perspectives and Potentials. In Intelligent Sustainable Systems, Proceedings of the WorldCIST 2023; Nagar, A.K., Jat, D.S., Mishra, D.K., Joshi, A., Eds.; Lecture Notes in Networks and Systems; Springer: Singapore, 2024; Volume 828, pp. 111–119. [Google Scholar] [CrossRef] [Scilit]
- Casillo, M.; Colace, F.; Gaeta, R.; Lo Russo, A.; Pellegrino, M. Artificial Intelligence in Archaeological Site Conservation: Trends, Challenges, and Future Directions. J. Comput. Appl. Archaeol. 2025, 8, 224–241. [Google Scholar] [CrossRef] [Scilit]
- Macchiaroli, M.; Dolores, L.; De Mare, G. Extended reality (XR) impacts on real estate market and economic-financial project management of residential built environments: Systematic review and analysis. Smart Sustain. Built Environ. 2026, 15, 2443–2491. [Google Scholar] [CrossRef] [Scilit]
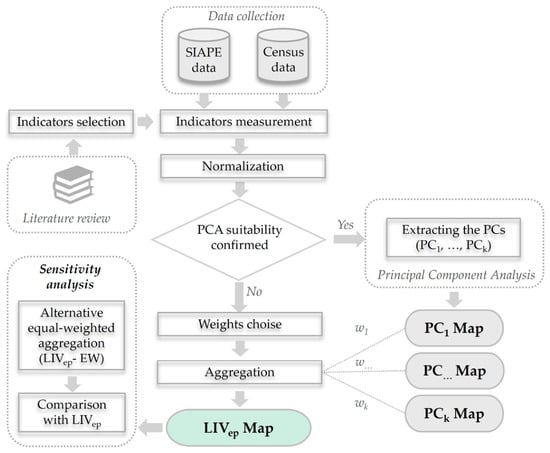
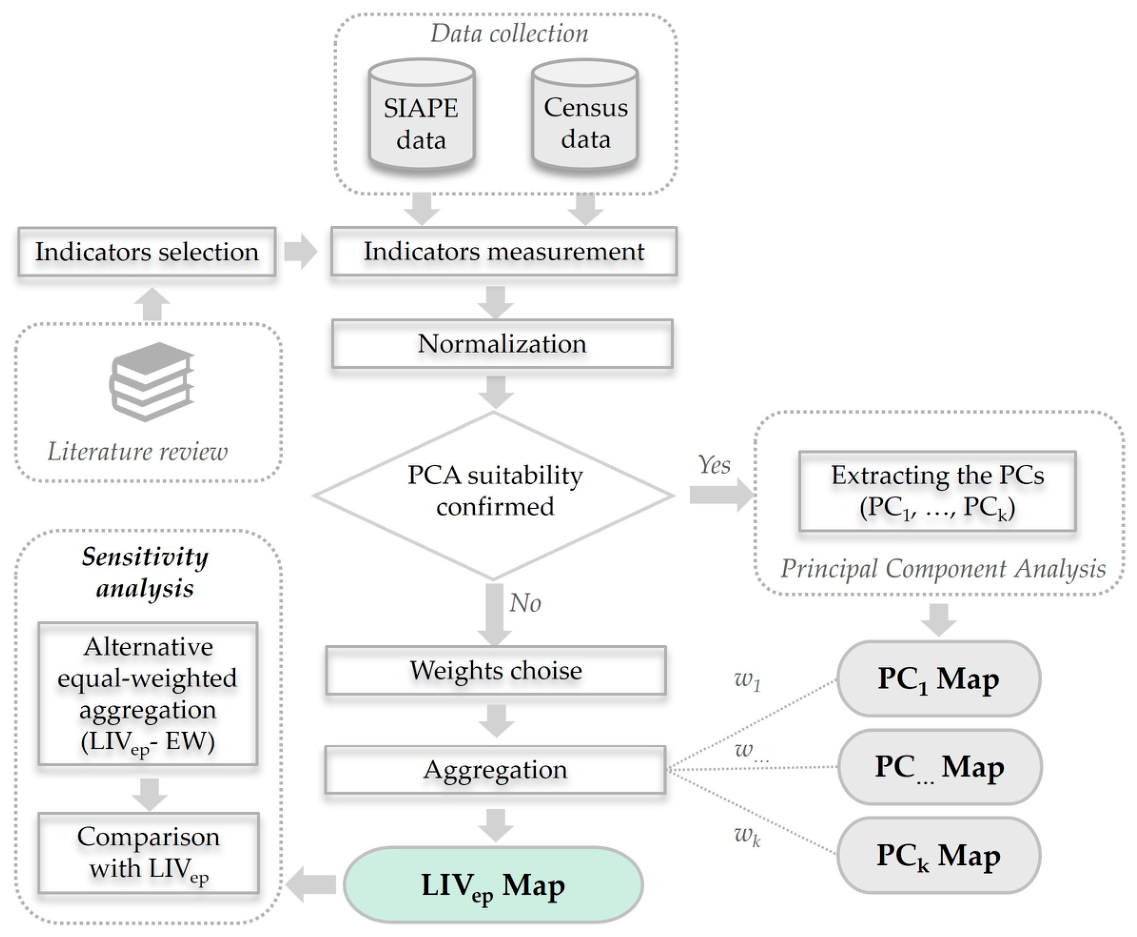
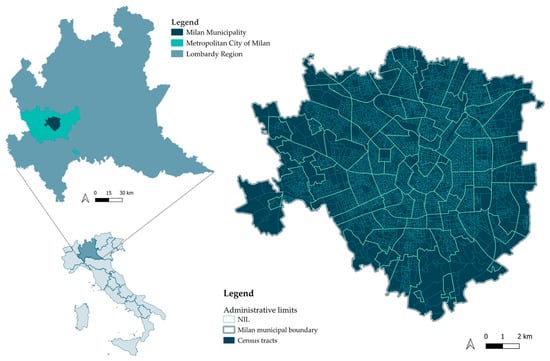
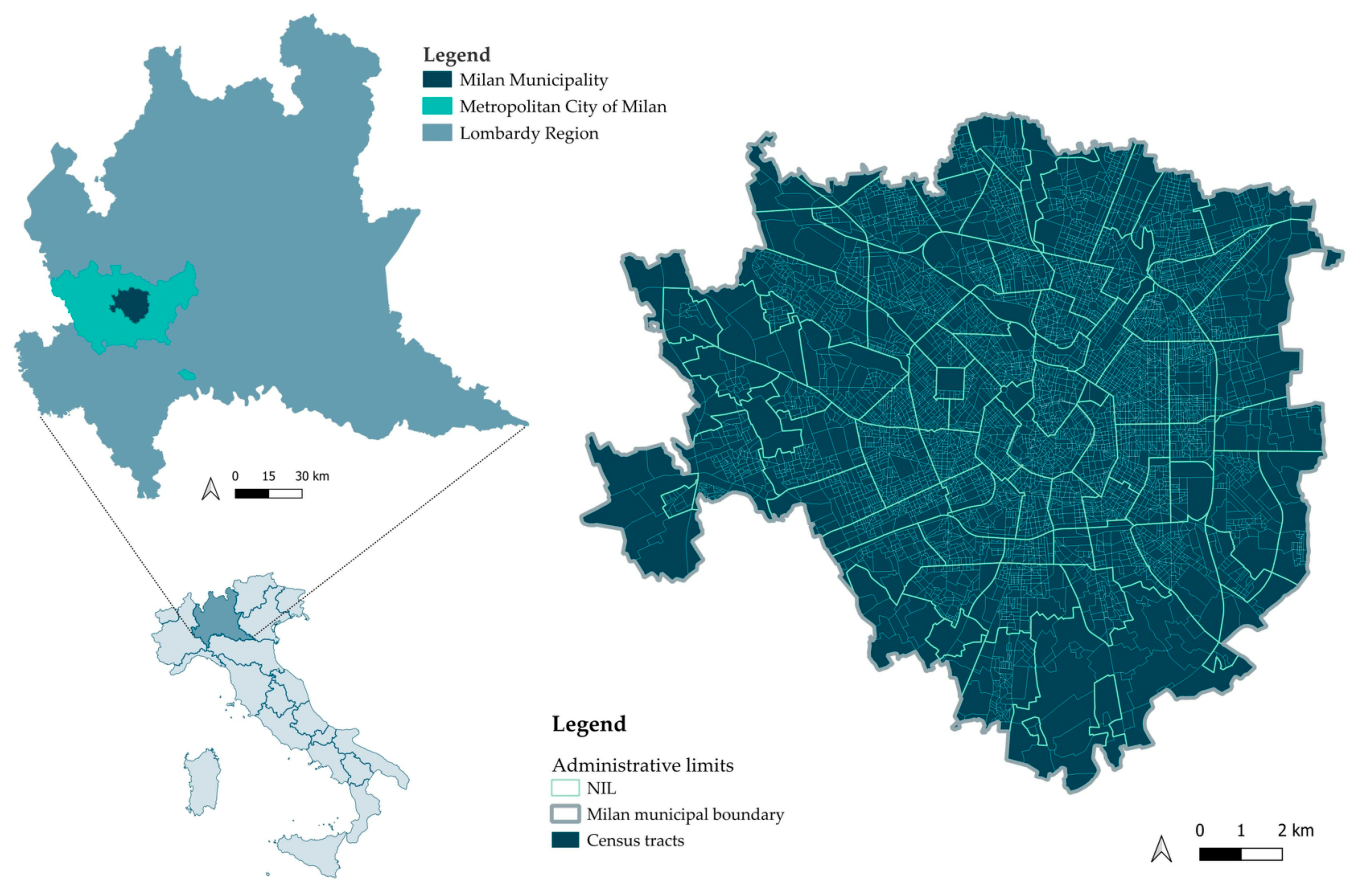
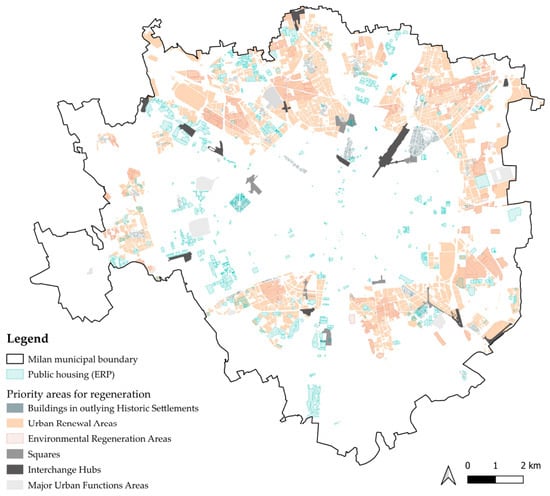
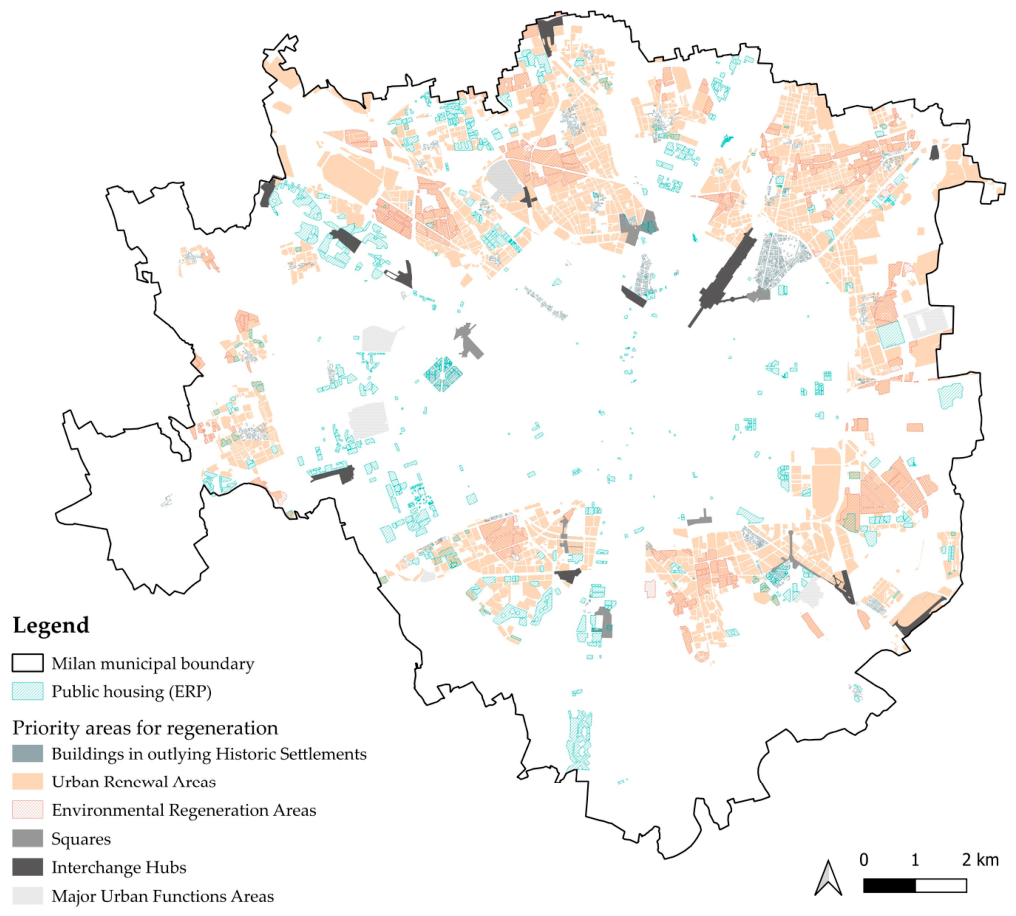
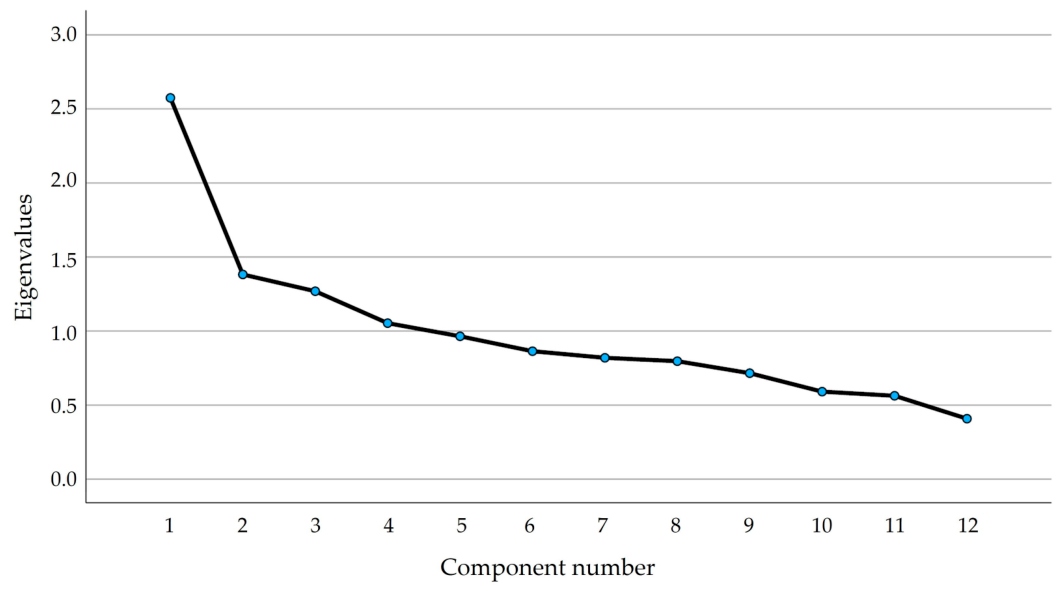
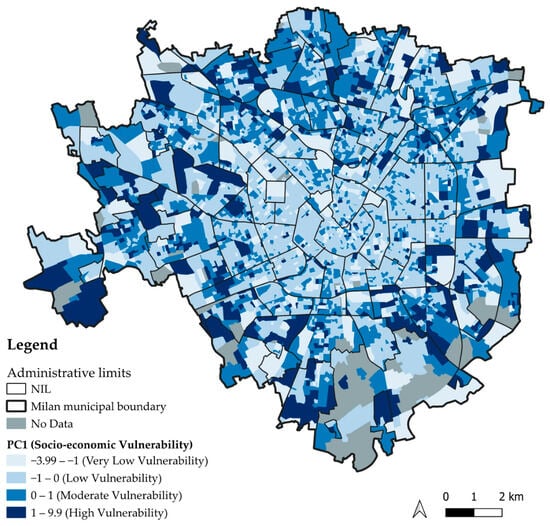
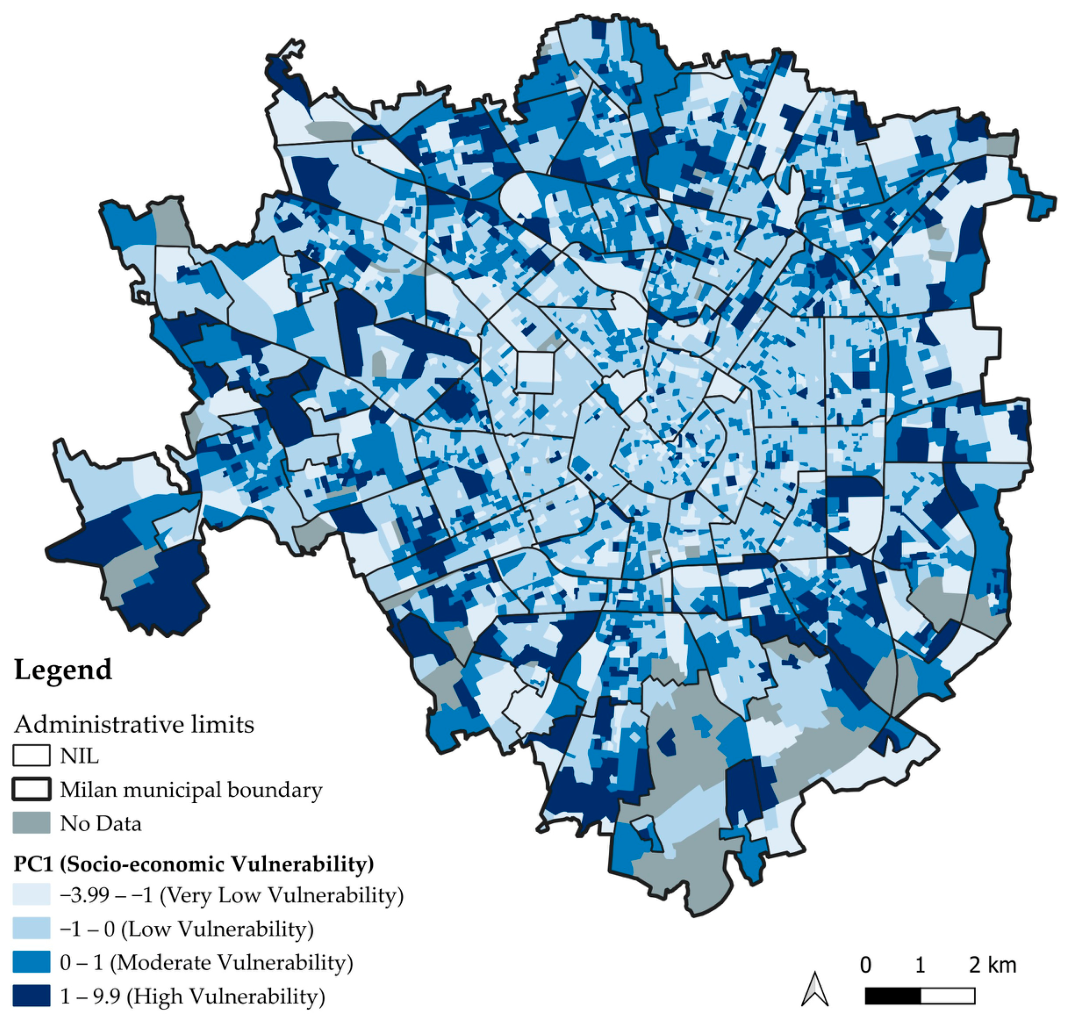
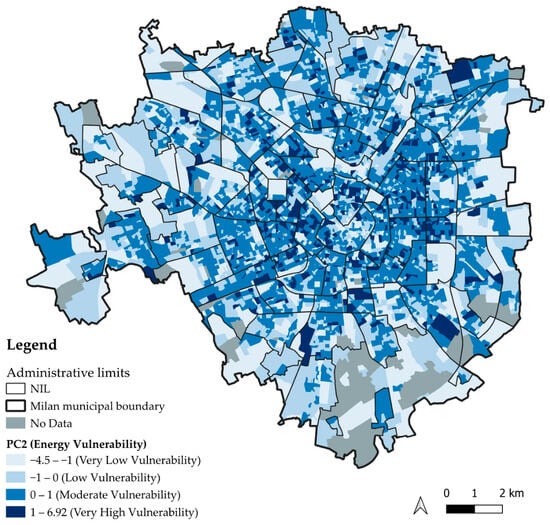
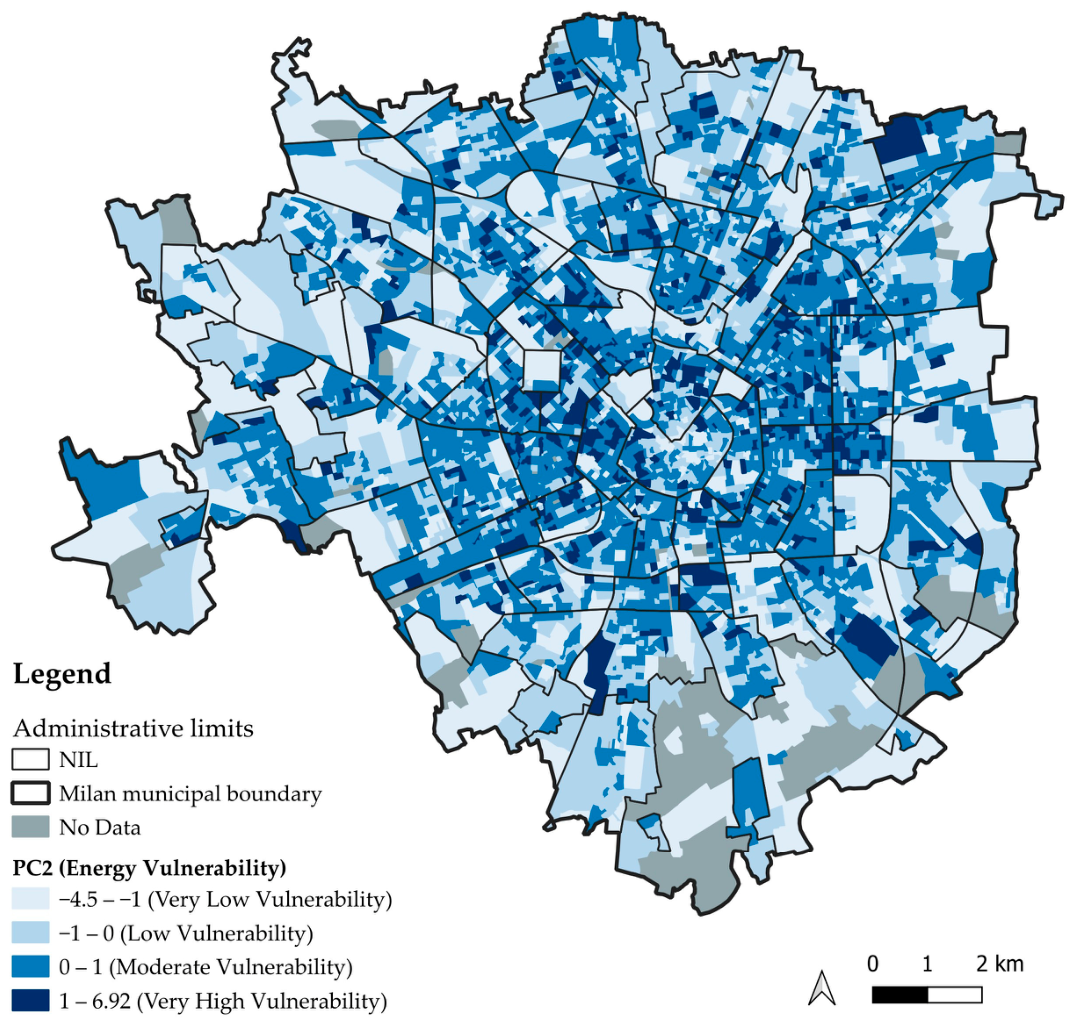
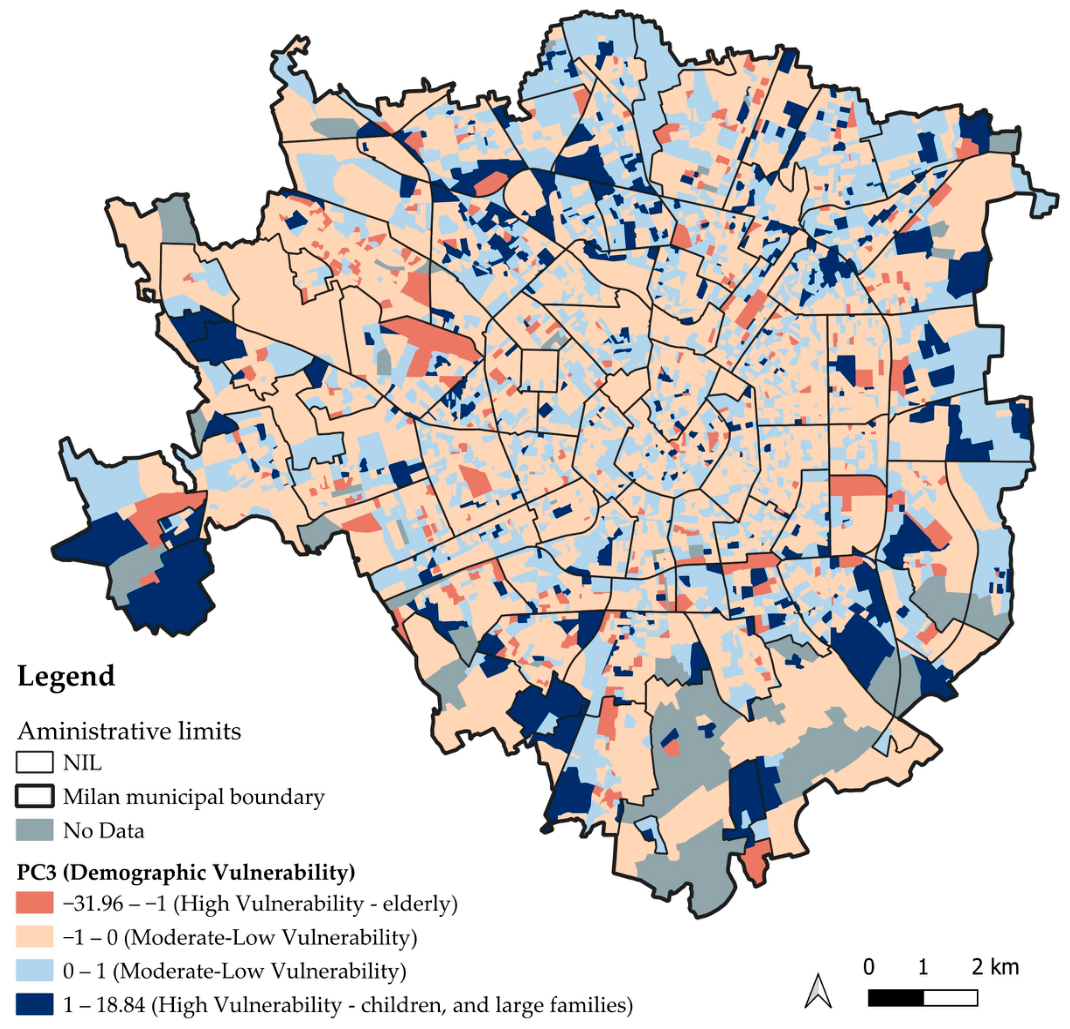
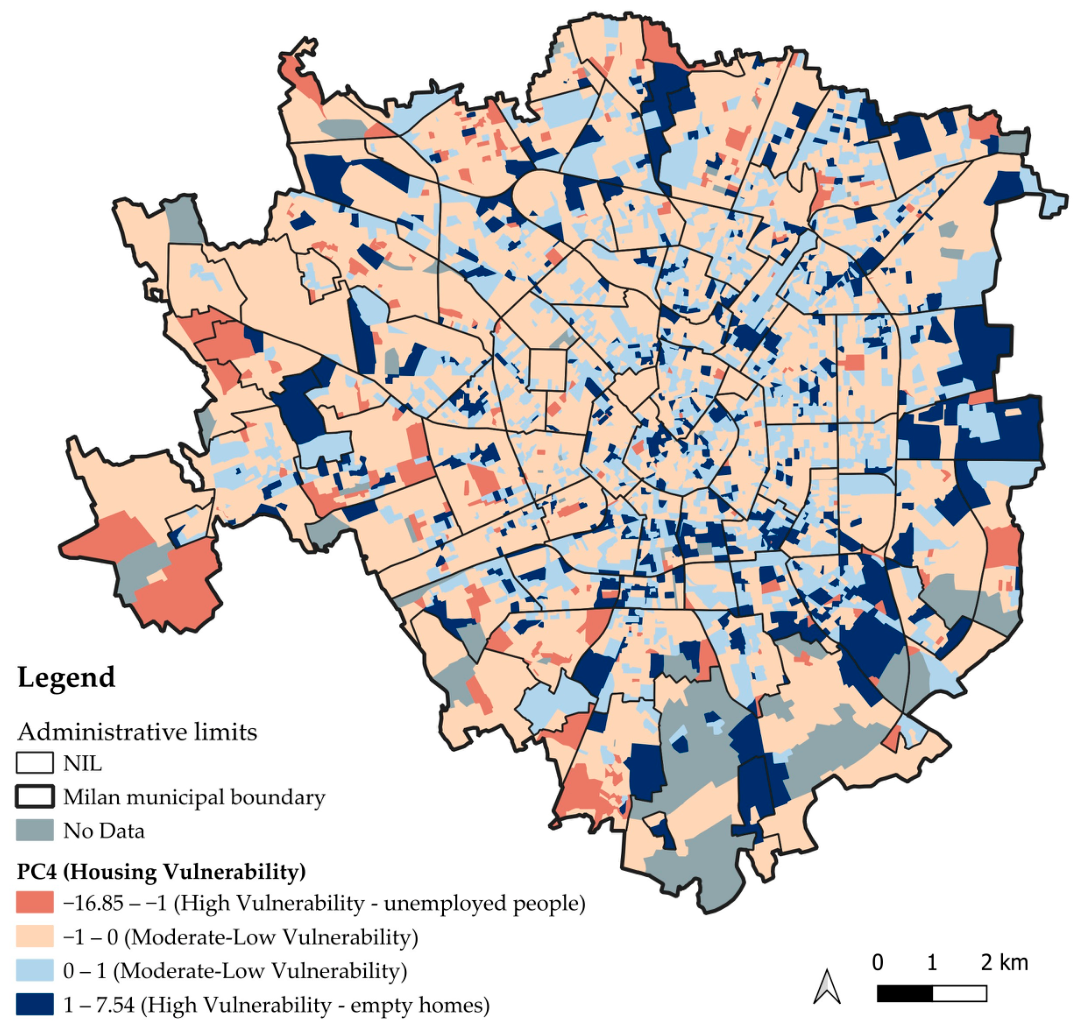
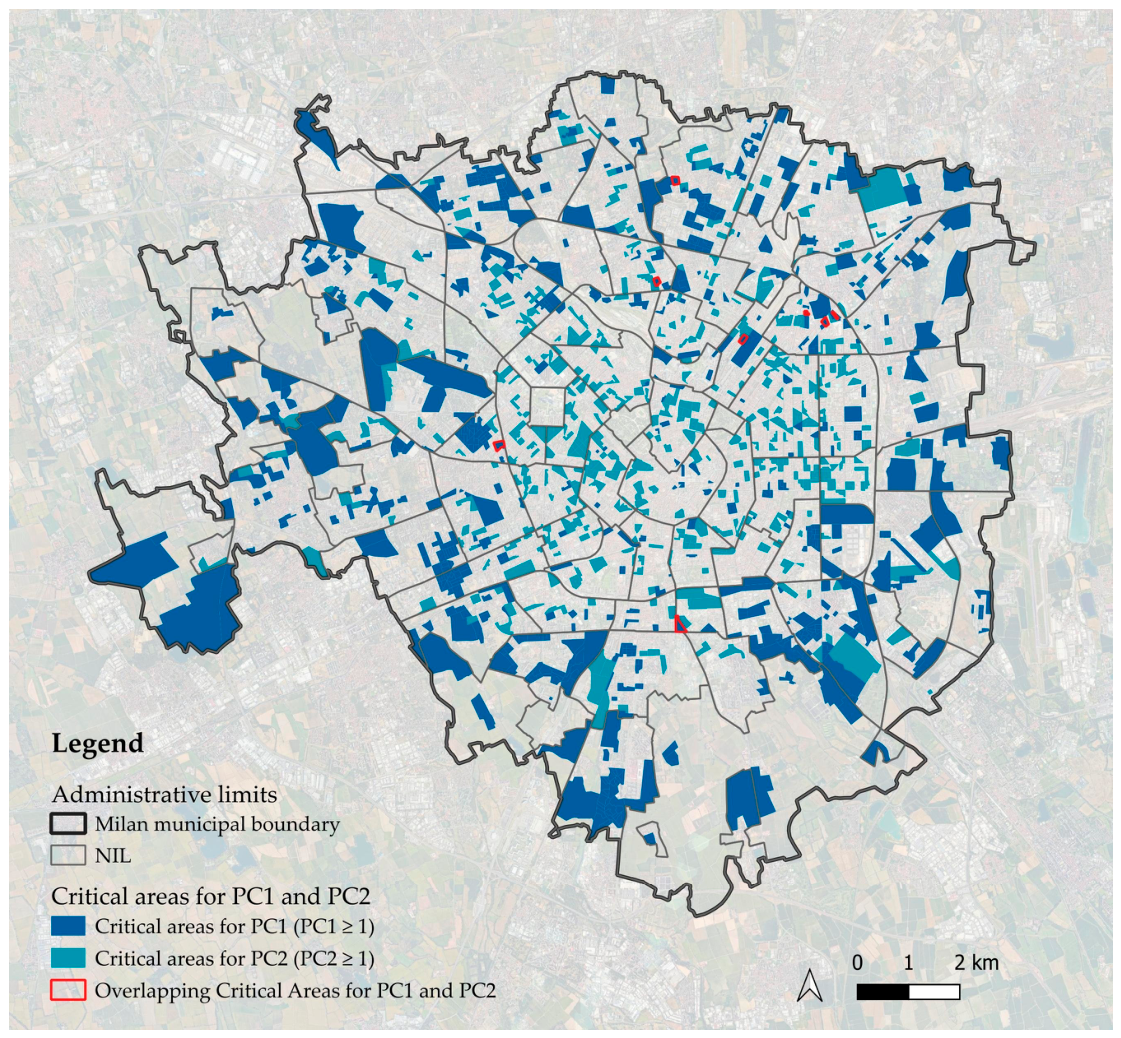
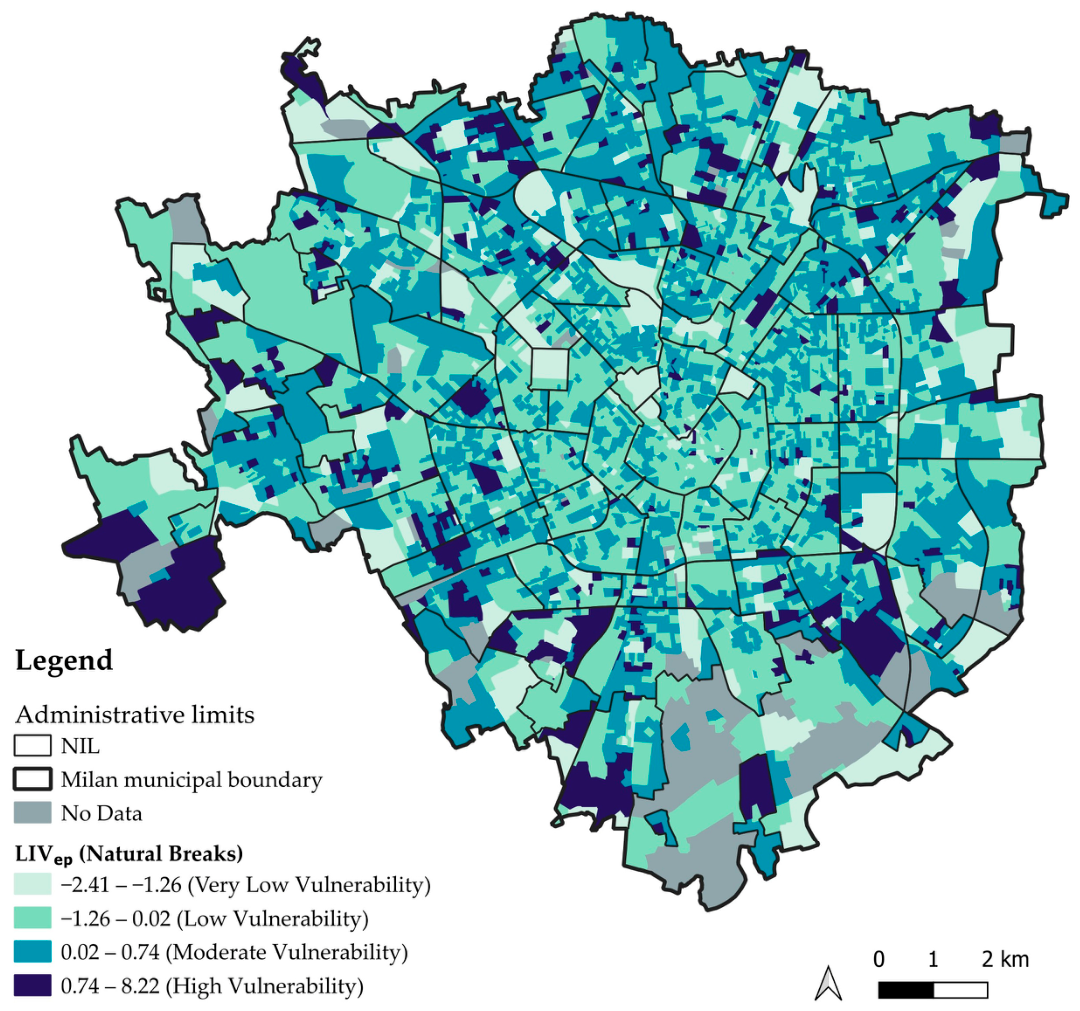
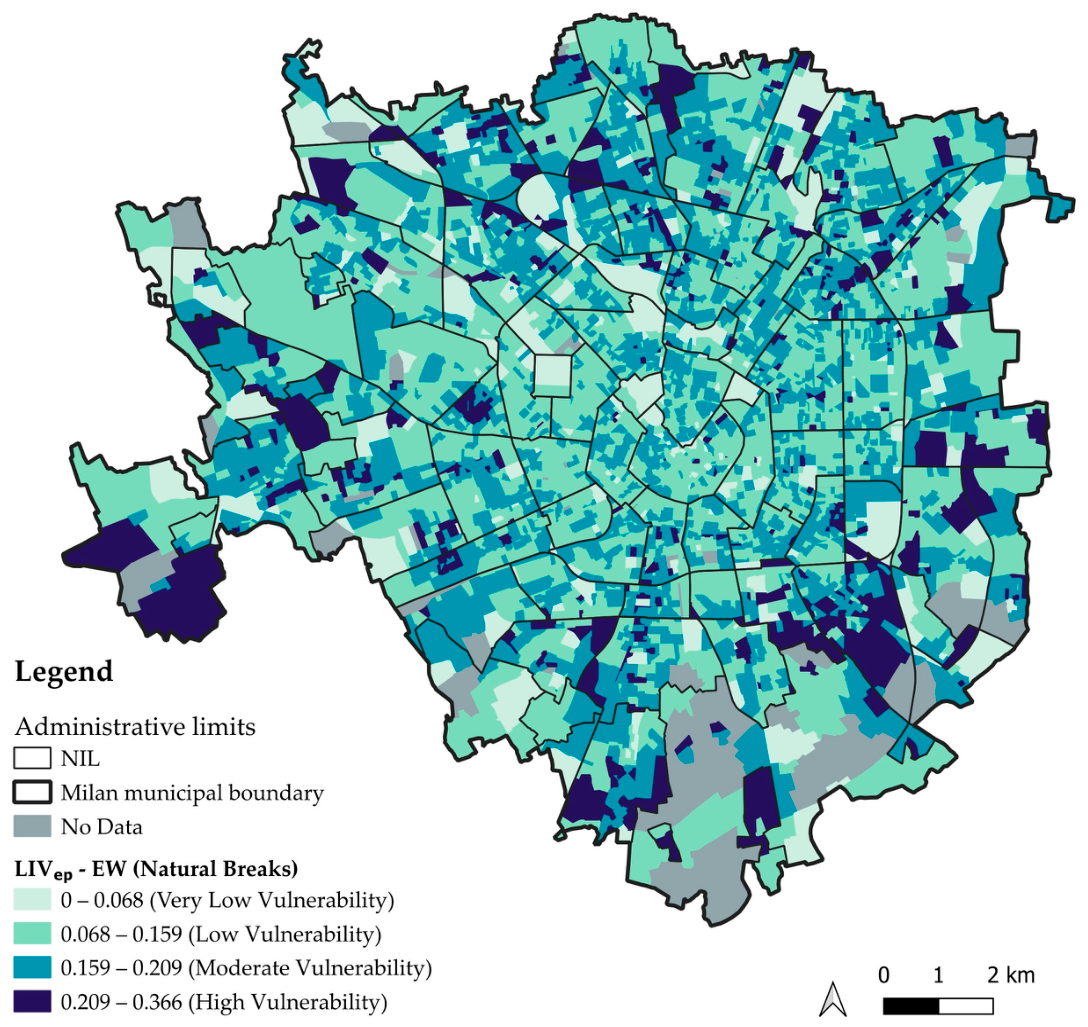
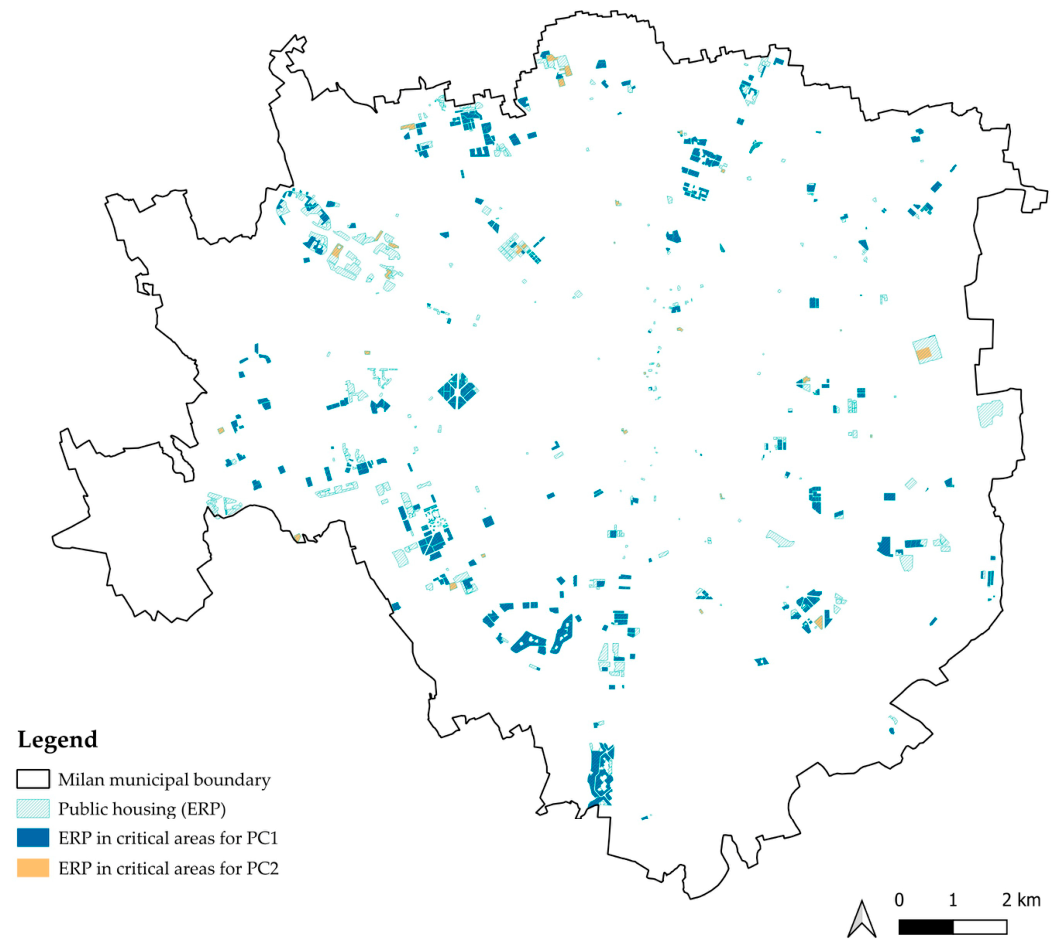
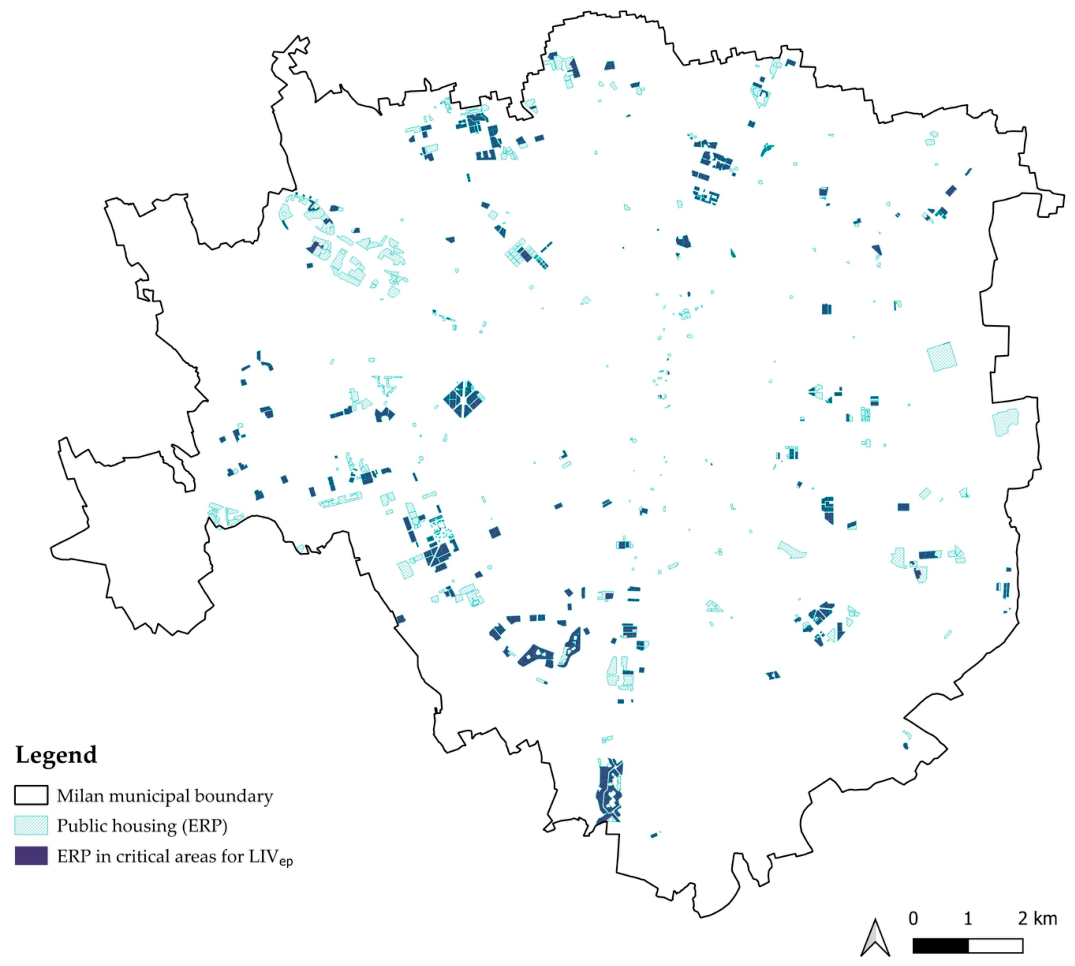
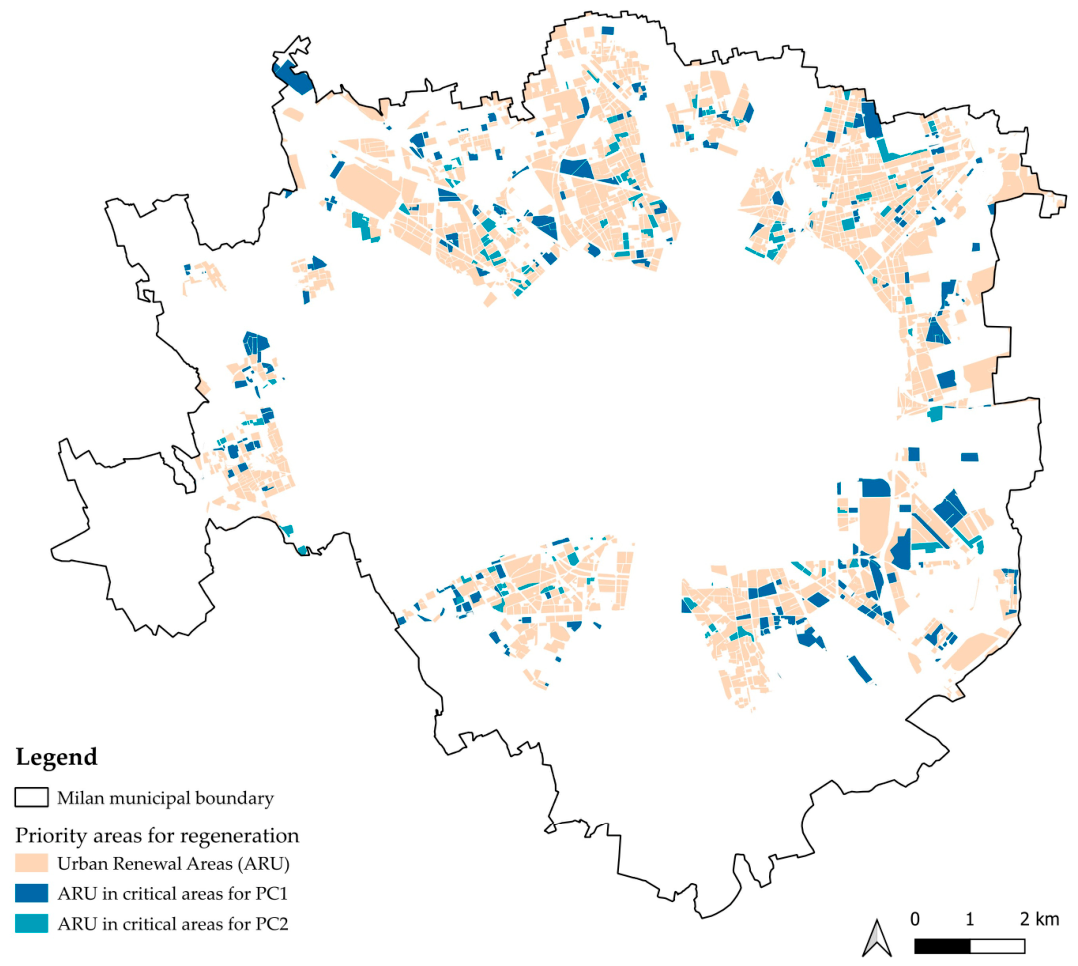
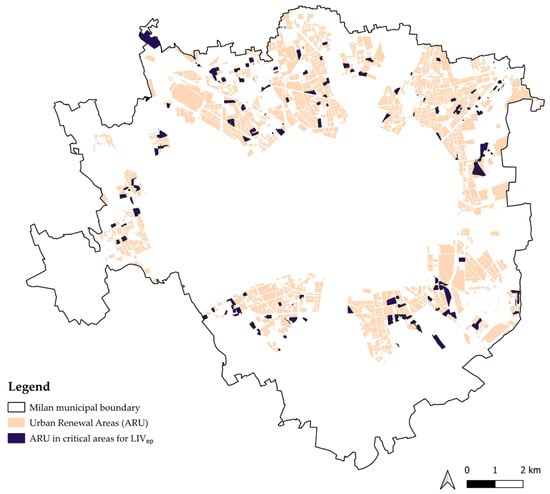
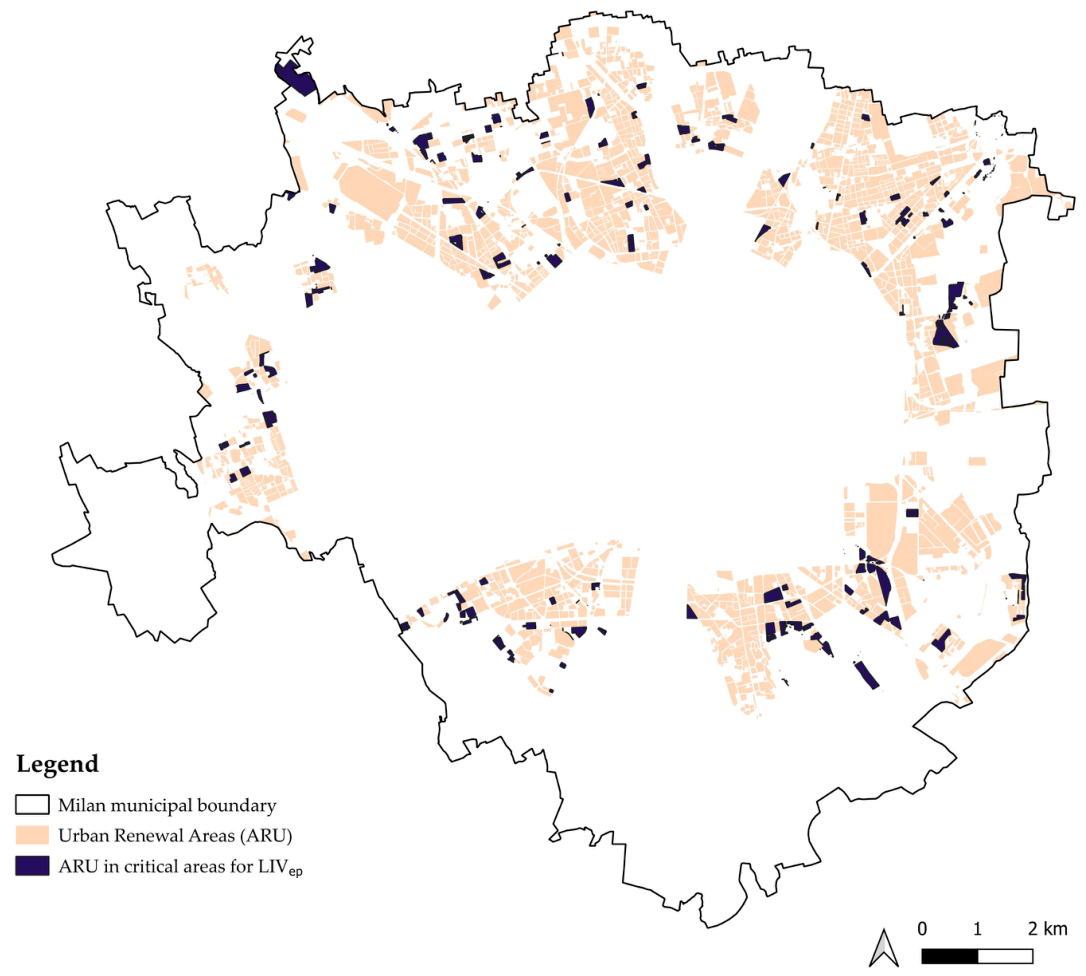

Disclaimer/Publisher’s Note: The statements, opinions and data contained in all publications are solely those of the individual author(s) and contributor(s) and not of MDPI and/or the editor(s). MDPI and/or the editor(s) disclaim responsibility for any injury to people or property resulting from any ideas, methods, instructions or products referred to in the content. |
© 2026 by the authors. Licensee MDPI, Basel, Switzerland. This article is an open access article distributed under the terms and conditions of the Creative Commons Attribution (CC BY) license.