


Abstract
In the current context of urban regeneration, how to sustainably revitalize historic districts through balancing commercial development and historical conservation is a critical issue. As an indicator reflecting the comprehensive quality of the built environment, pedestrian behavior predicts the efficacy of urban regeneration. To seek the best practice of balancing commercial and historical elements, evaluations on the influence of different façade color relationships on pedestrian behaviors are needed. Focusing on the color dimension of street facades, this study constructs a systematic research framework linking facade color relationships and micro-scale pedestrian behaviors. In the aspect of color relationship evaluation, color is decomposed into Commercial Color Harmony (CHc), Complexity (Cc), and Order (Oc) to describe facade color relationships. In the aspect of pedestrian behavior measurement, trajectory detection technology is leveraged to describe micro-scale behaviors, focusing on Trajectory Diversity (TD), Trajectory Complexity (TC), Ratio of Searching Behaviors (Rs), Stay Intensity (Is) and Average Velocity (Va). Taking typical historic districts in Nanjing as a case study, this study first employs fuzzy-set Qualitative Comparative Analysis (fsQCA) to reveal the associations between facade color relationships and pedestrian behaviors. Then regression analysis is included to verify the numeric associations between color relationships and pedestrian behaviors. The results suggest that CHc exhibits an inverted U-shaped relationship with pedestrian behaviors, indicating that an optimal range of balance between commercial and historical colors, together with active storefronts, is associated with richer pedestrian activities. This research provides evidence-based insights for sustainable historic district conservation and regeneration by suggesting that color management should avoid excessive constraints on commercial vitality.
1. Introduction
Sustainable conservation and regeneration of historic districts bear the dual tasks of cultural heritage transmission and vitality enhancement. In historic districts, street facades serve as critical carriers of cultural heritage information and media for pedestrian-space interaction, among which facade colors play a critical role in cultural heritage transmission and vitality enhancement. Achieving commercial implantation while preserving historical colors has long been a black box in either practice or research of historic district conservation and regeneration.
Currently, quantitative color research on the regeneration of historic urban areas and historic districts focuses on three aspects: color quality evaluation, pedestrian perception, and the impact of color evolution. In terms of color quality evaluation, existing studies mostly start from urban and district scales, converting built environment colors from SVI or field photographs into color spaces such as RGB/HSV/Munsell. They then explore color configurations in historic urban areas and historic districts, evaluating color quality through dimensions such as color harmony and color complexity [1,2,3,4,5]. In terms of pedestrian perception and behavior measurement, mainstream studies focus on the symbolic meaning of color in cultural and historical dimensions, either by exploring pedestrians’ visual preferences through questionnaire surveys or by examining the relationship between color configuration and factors such as perceived authenticity and cultural appeal [6,7,8,9]. Several studies also apply pedestrian trajectory detection to pedestrian behavior measurement. Based on the multi-object detection technology and K-means algorithm, Niu et al. clustered the trajectory data into several groups and calculated behavior indicators [10]. In terms of color evolution driven by urban regeneration, current studies focus on the mechanisms of color evolution in historic building facades during urban regeneration and the impacts of post-regeneration colors [3,11].
However, the definition of color harmony in current studies remains insufficiently validated, and color attributes are seldom linked to pedestrian behavior. In addition, color data are rarely acquired under controlled conditions with rigorous calibration, which limits the validity of the measurements obtained. As for pedestrian behavior clustering, morphologically similar trajectories are either split into redundant clusters or merged, although they convey different behavioral meanings, which in turn introduces instability into the calculation of the indicators.
As typical linear public spaces in cities, historic districts feature a high degree of interweaving between historical building facades and commercial elements [2,3,6,8]. In many historic districts, pedestrians are primarily composed of tourists, whose activities are mostly optional and social, thereby avoiding interference from necessary activities on observation samples. This allows color organization and corresponding pedestrian behaviors to be directly observed and compared within the same spatial unit.
Therefore, this study takes five streets in two typical historic districts of Nanjing, China—Fuzimiao and Laomendong—as research objects, and constructs a comprehensive research framework integrating quantitative color evaluation, pedestrian trajectory detection, behavior classification, and configurational effect analysis, ultimately addressing three core questions:
- How to quantitatively evaluate the direction and intensity of commercial elements’ color influence on historical building facades in historic districts?
- How are diverse color indicators of street facades in historic districts related to different pedestrian behaviors?
- How to strike a balance between tourism development and historic landscape preservation in urban conservation and regeneration?
2. Literature Review
2.1. Urban Conservation and Color Control in Urban Development Process
2.1.1. Global Urban Conservation in Urban Development Process
The rapid growth of cities over the past fifty years has caused intense competition for urban land for housing, infrastructure and services in historic inner cities around the globe [12,13]. Within the context of such land competition, real estate development and historic district preservation present an inherent tension [12]. The traditional way of urban heritage conservation was often limited to individual buildings with extremely high artistic or historical value, namely architectural monuments [14]. Nevertheless, approximately one-third of World Heritage sites are urban, and more than half of conservation reports examined relate to heritage in urban areas [14]. Urban conservation has thus acquired connotations radically different from past conservation approaches: Architecture is no longer confined to isolated structures; rather, it is understood as a constituent element of the broader urban fabric [14].
UNESCO brought about the “historic urban landscape approach” (HUL), which divides urban heritage into tangible and intangible components [14]. Ballarat, with both the characteristics of a regional center and of a historic city, is the first city that formally operated the HUL approach in Australia. The Imagining Main Road project took multiple dimensions into the conservation practice: As for the tangible components, the project changed traffic structure and promoted historic building conservation. For the intangible components, heritage interpretation and placemaking methods like audio units, viewing posts and artworks were included [15].
UNESCO also advocates introducing new functions such as services and tourism as important economic initiatives [14]. The city of Bath is known for its thermal spa in Roman times. To address the contradiction between a dynamic city center and heritage conservation, the management plan dispersed tourist attention from the city’s main center to various locations across the city, thus enabling the entire city to share the economic benefits [16].
In many cases, the commercial city center shares the same space with the historic core of a city; thus, balancing the development with the conservation has become a challenge [17]. Conservative approaches—restricting the introduction of commercial functions to preserve the original appearance is not a long-term solution. Actively introducing new functions such as commerce and tourism can partly enhance the physical environmental quality and social value of historic urban areas, yet might tend to bring about over-tourism [3,18].
2.1.2. Conflicts Between Historical and Commercial Elements in Historic Districts
The coexistence of historical remnants and modern development results in spatial and visual disconnection in urban landscapes, which is called “time rupture” [19]. In the tourism region of many cities, visitors spent a great share of their budget outside the tourism sites, particularly on shopping and dining [20]. In response, local stakeholders have increasingly catered to this consumer culture: advertisers and shop owners in historic areas devote their efforts to designing and displaying commercial signs to fulfill the evolving visual demands associated with this commercial symbolism [18]. The function of commercial signs has commercial and aesthetic aspects: the former serves the utilitarian needs of local authorities and retailers, while the latter serves the visual quality of public spaces. Driven by market mechanisms, the long-term value of aesthetic functionality often yields to the immediate gains from commercial effect [18].
However, the commercial signs embedded in the street facades of historic districts have a fundamentally different color logic [6,18]: the construction of historical building facades often uses locally sourced materials, resulting in visual harmony across different periods [16]. Historical building facades in south of the Yangtze River are usually dominated by low saturation colors such as gray, white, and brown [6]. As for commercial signs, existing research on the historic districts of Suzhou has shown that commercial signs and building facades generally exhibit visual conflict in terms of color, with approximately 30–60% of commercial sign colors and building facade colors showing a substantial color difference. These colors have high color purity and brightness, which are far from the central tone of the buildings [6]. In many cases, the commercial city center coincides with the historic core of a city [18]. Therefore, conflicts between historic and commercial elements have intensified.
Both commercial signs and historical building facades contribute to the commercial and social value of the built environment to certain degrees, and their colors have been proved to be related to human behaviors and perceptions [6,7,8,21]. In the former practices of historic urban area conservation, historical building facades were usually seen as the background of commercial signs. However, the direction and intensity of commercial signs’ color influence on historical building facades remains unknown. In this research, the color dimension is selected to evaluate the direction and intensity of commercial signs’ effect on historical building facades.
2.1.3. Color Evaluation of Historical and Commercial Elements
Accurately quantifying color relationships is the first step toward balancing historical and commercial elements. Current quantitative research on such relationships in the built environment frequently involves color harmony evaluation [1,3,5,9,11,22], whose theoretical basis largely derives from the CIEDE2000 [23,24] color difference formula or M-S Theory. Theoretically, although the CIEDE2000 color difference formula can accurately measure the distance between different colors, it cannot precisely explain the concept of “harmony”. Current studies employing CIEDE2000 for color evaluation assumed that the greater the difference between colors, the higher the degree of disharmony [1,3,6,11]. However, in classical color theory, color harmony and color distance are not positively correlated.
Color harmony, as Munsell (1919) defined, describes a state in which color arrangements present a varied, well-proportioned, and orderly composition that is aesthetically pleasing [25]. In 1933, Birkhoff proposed the aesthetic measure formula “M = O/C” in Aesthetic Measure, explicitly stating that the essence of beauty is the trade-off between order and complexity—under constant complexity, higher order yields greater beauty [26]. Based on Birkhoff’s theoretical framework, Moon and Spencer systematically constructed the M-S Theory in a series of three papers published in 1944 [27,28,29]. M-S Theory classifies color relationships into three harmony zones and two ambiguity zones. The harmony zones include three intervals: Identity (two colors’ difference ≈ 0), Similarity (two colors differ somewhat but are close), and Contrast (two colors are distinctly different, such as complementary colors). This theory indicates that colors with substantial differences can also achieve harmony [27]. In 1961, Itten claimed that complementary pairs of colors can be mixed into medium gray, thus bringing about color harmony [30].
Color control in historic districts should address both commercial and social value. Color evaluation cannot remain merely at the visual perception, but also consider the relationship between color and pedestrian behaviors. Existing research has shown that different color attributes have different associations with human behavior [21,31]. Therefore, color evaluation should comprehensively consider color attributes. M-S Theory provides a relatively comprehensive color evaluation framework that can holistically output three indicators: Color Order, Complexity, and Harmony [29].
2.2. Measurement and Classification of Pedestrian Behavior
2.2.1. Trajectory Data as a Proxy for Pedestrian Behavior
Research on quantifying pedestrian behavior in the fields of urban design and architecture mostly focuses on the group state of pedestrians at macro and meso scales, while quantitative research on fine-grained pedestrian behaviors at the micro scale is relatively scarce. Traditional pedestrian activity data collection, represented by Gehl’s PSPL method, relies on manual pedestrian counting and behavioral mapping [32,33]. This approach can capture pedestrians’ behavioral motivations and activity states with relatively high precision. Constrained by manual and time costs, it is difficult to achieve large-scale or long-term data monitoring and to avoid subjective bias between different observers. With the development of wearable devices and mobile phone signaling technology, location data derived from Wi-Fi probes and Location-Based Services (LBS) have become a prominent focus in urban research in recent years [34,35,36]. This type of data has relatively low acquisition cost and extremely broad coverage, and is therefore frequently used in urban research at macro and meso scales. However, the data resolution still cannot adequately reflect pedestrian behaviors at the micro street scale.
In recent years, with the advancement of object detection and tracking technologies, pedestrian trajectory extraction based on video data has become an important research method in the fields of urban design and traffic engineering [10,37,38]. This method can provide high-precision spatiotemporal information of pedestrian and is suitable for quantifying pedestrian behaviors at the micro scale. In the field of urban design, Niu et al. proposed a multi-dimensional vitality quantification framework based on trajectory data extracted from video, comprising five pedestrian behavior indicators: number of people (num), dwell time (dur), movement speed (sp), Trajectory Diversity (TD), and Trajectory Complexity (TC) [10]. In the field of traffic engineering, video-based trajectory data analysis is primarily used to understand the mechanisms of crowd movement. Lee et al. proposed an algorithm for measuring pedestrian congestion and safety based on pedestrian trajectories extracted from CCTV footage [37]. Mo et al. explored pedestrian flow through different transition bottlenecks using pedestrian trajectories extracted from digital cameras [38].
2.2.2. Existing Problems in Behavior Classification Algorithms
A Clustering trajectory morphology can efficiently transform abstract point data into micro-scale behavior metrics [10,39]. As proposed by Niu et al., straight trajectories lacking pauses correspond to Gehl’s “necessary activities”, while complex trajectories full of detours and wandering strongly suggest the occurrence of “optional or social activities” [10]. Yet, clustering faces two main limitations: (1) Constrained by highly complex built environment factors and social interaction rules, clustering based solely on the dimension of trajectory morphological complexity can easily lead to misjudgment of walking motivations. (2) Current unsupervised techniques (e.g., k-means) typically produce clusters that lack clear physical or social meaning. To resolve this gap, new dimensions need to be introduced to interpret the clustering results.
In the fields of traffic engineering and pedestrian dynamics, the fundamental diagram is recognized as an effective tool to describe pedestrian movement characteristics, among which speed, flow and density are important dimensions [40,41,42]. As these dimensions partially capture group behavioral states, they are less suited to revealing behavioral preferences and psychological motivations. Research from biology and behavioral ecology provides new insights for interpreting pedestrian trajectories in the built environment. According to Allen’s three-category scheme, pedestrian walking behavior in historic districts falls under exploratory behavior [43], the efficiency and motivation of which can be predicted by measuring trajectory tortuosity [44,45]. This proxy can be extracted using Benhamou’s two-step method: first, determining whether a pedestrian performed an orientation behavior or a searching behavior; second, applying the straightness index for orientation behavior, or the sinuosity index for searching behavior [45]. As both straightness and sinuosity indexes provide behavioral motivation predictions, the explainability of the clustering results is reinforced.
3. Materials and Methods
To explore the associations between façade color relationships and pedestrian behaviors, this study employed image and video data of 5 pedestrian streets from two historic districts in Nanjing, China. Data pre-processing and formula adjustment was first conducted. In the next phase, indicators of color relationships and pedestrian behavior, together with the commercial activity indicator, were calculated separately. In the end, configurational and regression analysis were adapted and the further results were proposed and explained. The methodological workflow is presented in Figure 1. During the preparation of this manuscript, we used Gemini 3.1 Pro, DeepSeek-V4-flash and Claude Code v2.1.63 for the purposes of python scripts generating (python version: 3.9.25 for semantic segmentation and 3.12.12 for the image processing pipeline). We have reviewed and edited the output and take full responsibility for the content of this publication.
Figure 1.
Methodological framework.
3.1. Site Selection and Data Collection
This study selected five streets within the Fuzimiao and Laomendong Historic Districts in Qinhuai District, Nanjing as research sites (Figure 2a,b). Historic districts in Nanjing show significant concentration in Qinhuai District [46]. Against the dual background of tourism development and historic urban conservation, these two historic districts now exhibit visual characteristics in which traditional architectural style and modern commercial development are interwoven [47,48]. The functional composition of the two districts is relatively similar, both covering business types such as retail, photography services, formal dining, and casual snacks.
Figure 2.
Site analysis (map data source: www.openstreetmap.org): (a) the location of Qinhuai District, (b) the locations of the two sampled region, (c) the locations of the sampled streets in Fuzimiao Historic District, (d) the locations of the sampled streets in Laomendong Historic District, and (e) on-site condition of the sampled streets.
Within these two districts, this study selected a total of five streets for color and pedestrian behavior data collection. The street facades of the selected streets exhibit significant differential distributions in the color relationships between historical elements and commercial elements, thus making the capture of diverse facade color conditions possible. Within the Fuzimiao Historic District, three streets were selected: Gongyuan Street, West Gongyuan Street, and Dashiba Street. Within the Laomendong Historic District, two streets were selected: the western section of Santiaoying Street and Gutong Street. The spatial distribution of the five streets is shown in Figure 2c–e.
Open-source Street View Image (SVI) data are widely adopted in current quantitative evaluations of urban color. However, when it comes to the micro-scale color research, SVIs face the following three critical issues: (1) SVIs are mostly collected via vehicle-mounted panoramic cameras, which means that data for pedestrian streets are unavailable. Even for studies on open roads, the environment observed from a vehicle-mounted perspective differs substantially from that observed from the human-eye perspective [49]. (2) Currently, large-scale open-source SVI data in China are mostly in JPG format, which can easily cause color information loss. (3) Constrained by long collection cycles, SVIs at different geographical locations are captured under varying solar illumination conditions, leading to color distortion of the built environment. Existing studies either ignore the influence of weather variations or adopt fixed-parameter Automatic White Balance (AWB) algorithms [1,3,4,5]. However, image correction using AWB algorithms fails to capture actual human visual perception or account for the complex, changing weather conditions during SVI collection.
To avoid the above problems, the acquisition of street facade images in this experiment was carried out through on-site photography and color checker calibration. The data collection of street facade images was completed between March and May, 2026. To minimize the influence of direct sunlight and tourists’ occlusion on facade colors, facade image acquisition was uniformly conducted during weekday mornings under overcast and cloudy weather conditions; for shops that were not open in the morning, supplementary photography was carried out during weekday afternoons under the same weather conditions. To ensure that color indicators and pedestrian behavior indicators could be easily aligned, this study divided each street into 7–20 spatial units, and used a DJI Action 5 pro camera (made by SZ DJI Osmo Technology Co., Ltd., Shenzhen, China) held parallel to the street facade to capture the facade image of each spatial unit (Figure 3a,c–g). For each spatial unit, the color indicator values were first extracted from individual facade images. These values were then averaged separately for the left and right sides of the street, and the mean values of the two sides were further averaged to obtain the final color indicator value representing that spatial unit. Some video-recorded street segments encompassed multiple spatial units; in such cases, the indicator value for the segment was calculated as the average of the corresponding spatial-unit values.
Figure 3.
Way and results of street facade image collection: (a) way of street facade image collection; (b) illustration of historical element and commercial element; (c) collection result of West Gongyuan Street; (d) collection result of Gongyuan Street; (e) collection result of Dashiba Street; (f) collection result of Santiaoying Street; (g) collection result of Gutong Street (map data source: www.openstreetmap.org).
In this study, historical elements refer to the historical street-facing building facades in historic districts that have undergone unified planning, design, and construction, and have not been subjected to secondary renovation by commercial operators and merchants, including building exterior walls, roofs, eaves, traditional-style doors and windows (Figure 3b). Commercial elements refer to architectural decorations independently designed and added by merchants for their own operational needs after the completion of the main building construction, including commercial signs attached to the building facades and the internal window displays visible through transparent storefronts (Figure 3b).
To avoid tourists’ occlusion and traffic congestion caused by crowds during peak hours, all the videos of pedestrian behavior were recorded within 15:00–17:30 of weekday afternoons under sunny and cloudy weather conditions. Comprehensively assessing the ease of installing recording equipment and the color condition of the facades, 3–6 street units were chosen from each street for pedestrian behavior video recording. To avoid the Hawthorne Effect caused by recording equipment being exposed within pedestrians’ view and self-occlusion, elevated mounting points of 2.2 m and above were sought on both sides of the selected street segments (Figure 4). DJI Action 2/3/5 pro devices (made by SZ DJI Osmo Technology Co., Ltd., Shenzhen, China) were fixed in place and used to record video in the direction of the street depth from a slightly downward viewing angle, with each street segment continuously recorded for 30 min.
Figure 4.
Two ways of video recording: (a) attaching to a streetlight pole using a magnet; (b) securing to a tree trunk with a strap.
Ultimately, this study collected pedestrian trajectory data from a total of 24 street segments across 5 streets. After excluding an outlier sample caused by operators distributing goods for free on the street, a total of 23 video segments were included in the final data analysis (Appendix A).
3.2. Street Facade Image Rectification and Semantic Segmentation
3.2.1. Pre-Processing of Street Façade Images
This study established an image processing pipeline for all collected street view images, ensuring the accuracy and continuity. With the exception of the custom camera profile generated by Calibrite PROFILER 3.0.4, the color calibration and geometric distortion correction tasks of this pipeline were all centrally completed on the Adobe Lightroom Classic 13.1.
To maintain consistent ambient lighting, the study selected overcast weather for field photography, and incorporated a color checker into the process (Figure 5). The baseline calibration relied on the standard X-Rite ColorChecker Classic (24-patch, made by X-Rite Incorporated, Grand Rapids, MI, USA). The study first performed preliminary white balance adjustment by anchoring on the 18% neutral gray patch (the fourth patch from the left in the gray-scale strip) to neutralize the image color temperature. By continuously monitoring the histogram data in Lightroom, the exposure parameters were fine-tuned until the RGB readings of the neutral gray patch stabilized at approximately R 46%, G 46%, B 46%.
Figure 5.
Pipeline of façade image processing: (a) pre-processing the façade images; (b) semantically segmenting the façade images; (c) separating the pixels of commercial and historical elements by Boolean calculation.
After completing the precise color calibration of the images, the established parameters were batch-applied to the remaining datasets. To strictly control the lighting condition, this protocol was applied only to image sequences captured under continuous, equivalent lighting conditions. Any significant change in ambient light necessitated re-capturing the reference color checker and establishing an independent processing batch [50,51].
To guarantee the geometric precision of color area calculations for different street facades, rigorous distortion control was applied to the original images in LR. First, the device-matched DJI Lens Profile Configuration was introduced to effectively eliminate the barrel distortion; second, the Guided Upright Transform tool was employed, which, by precisely anchoring horizontal and vertical reference lines in the physical environment, eliminated the Vertical Perspective Distortion caused by the camera’s upward shooting angle (Figure 5a). Considering the equipment’s computational cost and the consistency of the computational dimension, portions of building facades exceeding three stories were uniformly excluded.
3.2.2. Semantic Segmentation
Currently, a large number of urban color studies rely on pre-trained semantic segmentation models (e.g., the ADE20k or Mapillary Vistas datasets) [1,3,4,5]. However, these datasets are primarily developed for autonomous driving scenarios, and their label systems are unable to comprehensively cover the rich and diverse commercial elements found in real historic commercial streets. If the traditional Transfer Learning approach were adopted, massive amounts of self-collected data are necessary. Considering the time and hardware costs, this study employed a hybrid use of two models in the extraction of commercial and historical elements: Firstly, the SegFormer model weights pre-trained on the Cityscapes was used to detect the building mask from the image. Secondly, the SegFormer model weights pre-trained on the Cityscapes Dataset were used for transfer training on the CMP-Façade Dataset. Model transfer learning was executed using MMSegmentation v1.2.0. The CMP-Façade Dataset contains detailed annotations of the various constituent parts of building facades, and the model after transfer training was capable of effectively identifying shopfronts (Figure 5b) on building facades [52]. This model can not only detect the architecture part of the image, but also extract ground-floor shopfronts and upper-floor windows, thus providing a foundation for the subsequent extraction of commercial elements and the filtering of glass material.
Thirdly, to address other commercial elements lacking in general-purpose datasets, this study used the YOLOE Model combined with prompts as a supplement (Figure 5b). This model is capable of flexibly switching recognition targets according to user-specified prompts (“lantern”, “banner”, “poster”, “advertisement” were used in this study) without the need for transfer learning, and in this study, it was suitable for accurately identifying small-scale commercial elements attached to facades [53]. Finally, the ground-floor shopfronts and small-scale commercial elements segmented in the two stages were merged to form the complete image of commercial elements on the street facade. Then, the historical elements were obtained by subtracting the commercial elements from the pure facade image (Figure 5c).
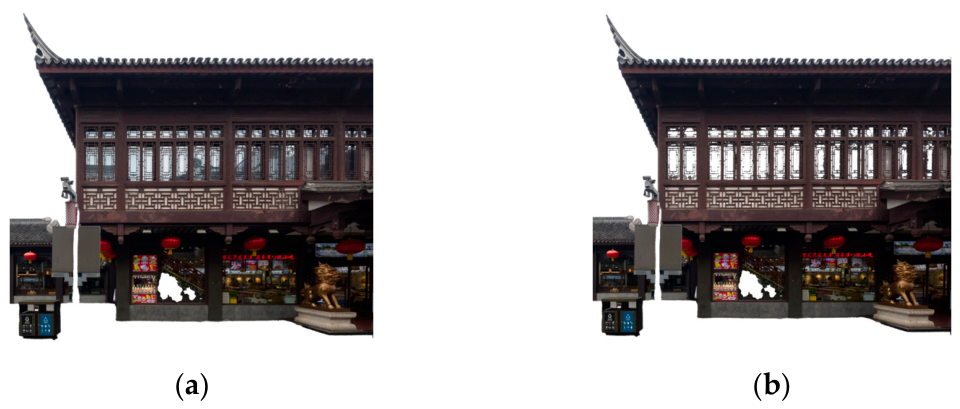
Glass material on the second floor and above of street facades reflects the colors of the surrounding built environment, exerting a considerable influence on the color results. Existing methods mostly employ semantic segmentation models to identify and remove window portions from building facades [54]. However, as a unique artistic symbol in traditional Chinese architecture, window lattice has an important influence on the visual perception of the human eye [55,56]. Existing pre-trained segmentation models are mostly trained on modern or European classical architecture, making it difficult for them to accurately identify window lattice in traditional Chinese architecture. Considering the time and hardware costs of model training, this study used a Python (v3.9.25) script based on the color difference between window lattice and glass to filter the window masks extracted in the preceding step (Figure 6):
- First, for the wooden window lattice and window frames on building facades, the standard color values and tolerance ranges (Hue, Saturation, Value) of the target material were set in the HSV Color Space, and matched non-glass material pixels were removed from the mask.
- Second, the processed initial mask was subjected to column-by-column and row-by-row pixel density scanning from both horizontal and vertical directions. Taking the column (or row) with the most pixels in the image as the 100% baseline, the effective pixel count threshold was set at 20% of the baseline value; all columns and rows with effective pixel counts below this threshold were removed. Ultimately, a clean glass material mask was obtained.
- Finally, majority of the commercial element and glass material pixels were removed from the complete building facade image to obtain a clean historical element image.
Figure 6.
Street façade image before and after filtering: (a) image before filtering; (b) image after filtering.
3.3. Color Extraction and Evaluation of Historical and Commercial Elements
This study utilized Color Harmony (CH) to evaluate how commercial element colors influence historical element colors in street facades, in terms of the direction and intensity [29]. The calculation of CH depends on two secondary indicators: Color Complexity (C) and Color Order (O). In M-S Theory, Color Complexity measures the amount of information transmitted to the observer by all colors in the surrounding environment [29]; in this study, this indicator can reflect the amount of information transmitted to the viewer by all historical–commercial element color combinations in the street facade. Color Order reflects the degree of clarity in the organizational rules of color information in the surrounding environment [29]; in this study, this indicator can reflect the degree of clarity in the organizational rules of all historical–commercial element color combinations in the street facade.
In this study, the primary purpose of color evaluation is to measure the influence of commercial element colors on historical element colors in the street facades of historic districts. Therefore, the historical element colors of the street facade are taken as the reference object for color evaluation. Although the colors of the historical elements themselves also affect the visual perception of pedestrians, in this study they are treated as a constant. To prevent the mutual comparison of colors within historical and within commercial elements from affecting the calculation results, the study first classified all color pairs in the street facade into three categories: historical–historical element color pairs Phh, commercial–commercial element color pairs Pcc, and historical–commercial element color pairs Phc. In alignment with the research objective, only historical–commercial element color pairs Phc were retained for subsequent indicator calculations (Figure 7b).
Figure 7.
Pipeline of Color Extraction and Evaluation: (a) extracting the main color from historical and commercial elements’ pixels; (b) evaluating the extracted main colors.
3.3.1. Dominant Color Extraction of Historical and Commercial Elements
Considering the hardware and time costs required for calculating color indicators, this study first performed sampling and clustering processing on the historical and commercial element images [3,5]. For the millions of pixels in the RGB color facade images, this study conducted color format conversion and random sampling without replacement. First, to ensure that the color distances calculated during the color clustering process conform to human visual perception, all image pixels were converted from the RGB Color Space to the CIE LAB Color Space (L*, a*, b**). To ensure that the pixel samples were statistically representative, the baseline sampling rate was set at 5%. Simultaneously, to avoid the situation of having too few initial pixels when analyzing smaller-scale commercial elements, a lower limit of 100,000 pixels was set during the sampling process.
For historic residential buildings in the middle and lower reaches of the Yangtze River, their building facades are usually composed of typical color combinations like gray, white, and brown [6]. Therefore, when clustering the colors of historical elements, this study uniformly set the number of dominant colors to 3. This approach both maximally extracts the color characteristics of historical elements and ensures the uniformity of dimensions across different color schemes (Figure 7a).
In contrast to the regularity of historical building facade colors, commercial elements, influenced by modern commercial concepts and the subjective preferences of operators, exhibit extremely strong randomness [6,18]. The colors used by different shops vary greatly in Hue (H), Value (V), and Chroma (C), and different colors often appear in a fragmented manner. Based on the color characteristics of commercial elements, this study extracted the dominant colors of commercial elements in two steps: First, the number of cluster centroids for the k-means algorithm was set to 12 to capture all colors in the image; second, the CIEDE2000 Color Difference ΔE00 was calculated pairwise for all cluster center colors. When ΔE00 < 5, the two colors were merged using a weighted average method according to their actual area ratios in the image; finally, all merged colors were sorted from largest to smallest according to their actual area ratios in the image, and the top 8 colors with the highest area ratios were taken as the dominant colors of the commercial elements (Figure 7a).
Since Munsell color coordinates are discrete while ω coordinates are continuous, the calculations in M-S Theory are performed in different spaces [25,27,29]. The color Adaptation Point (Pa) and the Scalar Moment balance score (Atotal) are computed in the ω space, whereas Color Complexity (C) and the Geometric Relationship Score are evaluated in the Munsell space. Therefore, to perform subsequent indicator calculations, the color coordinates of all dominant colors must be mapped to the ω space and the Munsell space. Since existing algorithms cannot achieve direct mapping from the CIE LAB space to the Munsell space or the ω space, this study converted colors through three steps:
First, the CIE LAB color coordinates (, , ) obtained from clustering were converted to RGB coordinates (R, G, B). This process required the CIE XYZ Color Space as a computational intermediary, with the transformation formula as follows:
Here, Xn,Yn,Zn represent the tristimulus values of the reference white point, and f−1 represents the standard piecewise inverse mapping function.
Subsequently, the RGB coordinates of the CIE XYZ colors were obtained through the standardization matrix (Ms) and gamma correction (γ):
Here, Ri,Gi,Bi represent color coordinate in RGB space, and Xi,Yi,Zi represent color coordinate in CIE XYZ space.
Then, the RGB coordinates were mapped to the Munsell space to obtain the Munsell coordinates (Hi, Vi, Ci) of the color. Since the Munsell space is established on psychological experiments of human visual perception, its color coordinates are a set of discrete values. Following the ASTM D1535 Standard [57], the nonlinear mapping from RGB coordinates to Munsell coordinates was achieved through a three-dimensional interpolation algorithm (Look-up Table Interpolation, LUT) based on the XYZ/xyY space:
(Hi,Vi,Ci) = FASTM(Ri,Gi,Bi)
Finally, according to M-S Theory, the Munsell coordinates (Hi, Vi, Ci) were converted to polar coordinates (ri, θi, zi) in the ω space:
ri = Ci
zi = 8Vi
3.3.2. Calculation Method of the Adaptation Point (Pa)
In this study, the historical element colors of the street facade are taken as the reference object for color evaluation. According to M-S Theory, the adaptation point reflects the adaptation state of the human eye in the current visual field and is regarded as the reference object for measuring the visual prominence of different colors [28]. Therefore, to accurately measure the influence of commercial element colors on historical element colors in the street facade, it is necessary to calculate the Adaptation Point of the human eye to the historical element colors.
According to M-S Theory, Adaptation Point (Pa) of the human eye varies under different conditions. Moon and Spencer illustrate the calculation method of the Adaptation Point through two examples [28]:
- When several small color patches are viewed against a large, uniform background, the patches are so small that the background color serves as the Pa.
- When every color patch in the visual field is large, the Pa becomes a new color formed by mixing all color patches according to their area ratios. This new color is called the Balance Point of all color patches.
For the historical elements in the street facades of Chinese historic districts, the use of color is relatively restrained, and the area distribution of different colors also exhibits strong regularity [2]. Therefore, in calculating the Pa, this study adopts the Balance Point of all historical element colors in the same facade. According to the above definitions, Pa is equivalent to the geometric centroid formed by multiple colors in the ω space. To calculate the position of the color centroid, this study first projects the polar coordinates (r, θ, z) of each dominant color in the ω space into a three-dimensional Cartesian coordinate system, and combines the area weight of each dominant color to obtain the color centroid coordinates (X, Y, Z):
Here, Nh is the number of extracted historical dominant colors (set to Nh = 3 in this study), ri, θi, and zi respectively represent the radial distance, polar angle, and height of the i-th dominant color in the ω space, and wi is the area weight of that dominant color among all effective historical pixels in the same façade ().
To facilitate the calculation of distances between other colors and the color centroid in the ω space, the color centroid coordinates need to be converted back to the ω space. Ultimately, the street facade visual Adaptation Point Pa(Ro,θo,Zo) is obtained.
θo = arctan2(Y,X)
Zo = Z
3.3.3. Commercial Color Complexity (Cc)
In M-S Theory, color complexity (C) measures the amount of information transmitted to the individual by all colors in the observer’s environment. Its calculation formula is as follows [29]:
C = Ntotal + Npairs(ΔH ≠ 0) + Npairs(ΔV ≠ 0) + Npairs(ΔC ≠ 0).
Here, Ntotal is the total number of commercial colors in the image; Npairs(ΔH ≠ 0), Npairs(ΔV ≠ 0) and Npairs(ΔC ≠ 0) respectively represent the number of pairs that exhibit differences in Hue, Value, and Chroma among all color pairs.
Since this study only considers historical–commercial element color pairs (Hi,Cj), the original formula is therefore not entirely applicable to this study and requires adjustment:
Here, Cc represents Commercial Color Complexity, Nh is the number of extracted historical dominant colors (Nh = 3 in this study), and Nc is the number of extracted commercial dominant colors (Nc ≤ 8 in this study). δ is the indicator function, which takes the value 1 when the attribute within the brackets exhibits a difference, and 0 when the two are completely identical; Hi, Vi, Ci respectively denote the hue, value, and chroma of the i-th historical element color; Hj, Vj, Cj respectively denote the hue, value, and chroma of the j-th commercial element color.
In the new formula, Commercial Color Complexity (Cc) equals the total number of extracted commercial colors (Nc), plus the sum of the number of pairs with inconsistent Hue, the number of pairs with inconsistent Value, and the number of pairs with inconsistent Chroma, across all historical–commercial element color pairs Phc. After adjustment, this indicator accurately reflects the amount of information transmitted to the viewer by all historical element–commercial element color combinations in the street facades of historic districts.
3.3.4. Commercial Color Order (Oc)
In M-S Theory, Color Order (O) reflects the degree of clarity in the organizational rules and visual logic of color information in the observer’s surrounding environment. Its calculation formula is as follows [29]:
Here, O represents Color Order; Atotal includes the scalar moment balance scores of all color pairs calculated based on the neutral gray (N5) Adaptation Point (Pa) in the ω space; OH,V,C(total) represents the geometric relationship score of all color pairs in the Munsell space.
Since this study only considers historical–commercial element color pairs Phc, and the Pa must adopt the Balance Point of the historical element colors, this formula therefore requires adjustment:
Here, Oc represents Commercial Color Order; A(Hi,Cj) represents the Scalar Moment balance scores of commercial and historical colors relative to the current Adaptation Point (Pa); OH,V,C(Hi,Cj) represents the geometric relationship score of historical–commercial element color pairs in the Munsell space. After adjustment, this indicator accurately reflects the degree of clarity in the visual organizational rules of all historical–commercial element color combinations in the street facades of historic districts. Please refer to Appendix B for the detailed calculation method of A(Hi,Cj) and OH,V,C(Hi,Cj).
3.3.5. Commercial Color Harmony (CHc)
In M-S Theory, Color Harmony (CH) is inherited from Birkhoff’s general aesthetic formula, defining Aesthetic Measure (Ma) as equal to visual order (O) divided by visual complexity (C), and is used to evaluate the overall aesthetic value of paintings or other visual designs [26,29]:
However, the core purpose of introducing Color Harmony in this study is not to evaluate how beautiful the street facade is, but to measure the direction and intensity of commercial element colors’ influence on historical element colors. If the original formula were directly introduced into the color evaluation of historic district street facades, the purpose of the evaluation would shift to measuring the overall aesthetic quality formed by commercial element colors and historical element colors, which clearly deviates from the research objective.
Therefore, by substituting the Commercial Color Order (Oc) and Commercial Color Complexity (Cc) extracted above into the original formula, a shift in the physical meaning is achieved. The revised new formula is as follows:
Here, CHc represents Commercial Color Harmony, Oc represents Commercial Color Order, and Cc represents Commercial Color Complexity. After adjustment, this formula accurately reflects the direction and intensity of commercial element colors’ influence on historical element colors in the street facades of historic districts.
3.4. Video Data Processing and Street Vitality Indicator Calculation
3.4.1. Video Data Cleaning
The study employed the Ultralytics YOLO26L pre-trained model to detect pedestrian movement trajectories in the video [58]. Multi-Object Tracking adopted the ByteTrack Algorithm, with the sampling rate set at 5 fps to balance computational efficiency and tracking quality. Based on the actual conditions of the survey sites, a global Region of Interest and time-windowed Exclusion Zones were drawn for each video segment to filter out irrelevant individuals such as security guards. For vehicles such as pedicabs and sightseeing vehicles appearing on the pedestrian street, a Trajectory Separation Algorithm was designed in the script: when the spatial average distance between a small vehicle and a pedestrian across shared frames was less than 1.5 times the mean of the vehicle’s width and height, and the number of shared frames was no fewer than 10, the pair was identified as a “vehicle + person” bound group and removed.
After obtaining the initial trajectory data, to map them into real physical space, a homography matrix was used for planar perspective correction. The researcher selected four corner points forming a rectangle on the ground in each video segment and input their real physical dimensions, then calculated the perspective transformation matrix via OpenCV’s getPerspectiveTransform. The matrix was applied to the midpoint of the bottom edge (xcenter,ybottom) of each detection box for batch perspective transformation; subsequently, the perspective transformation matrix was applied to the initial trajectories to obtain the real physical coordinates (xreal,yreal) of each trajectory point. Each trajectory point corresponds to the center point of the bottom edge of the pedestrian detection box, corresponding to the contact area between the pedestrian’s foot and the ground. After a second round of cleaning of the trajectories, to eliminate the problem of trajectory point drift caused by mutual target occlusion and detection model accuracy, the Ramer-Douglas-Peucker (RDP) polyline simplification algorithm was applied [59,60], with a perpendicular distance tolerance of 30 cm to extract the geometric turning points of the trajectories, ensuring that spatial turning features such as turns were not swallowed by the smoothing operation.
3.4.2. Pedestrian Behavior Classification
In the pre-experiment phase, this study clustered the trajectory data into several behavior clusters following the approach of Niu et al. [10]. In order to enhance the interpretability of the clustering results, this study added a decision model on the trajectory clustering algorithm based on Benhamou’s theory [45], classifying the clusters derived from k-means clustering into five behavioral patterns. The model consists of three steps of progressive discrimination: First, trajectories exhibiting pronounced stationary characteristics were identified and separated. The remaining trajectories were then divided into orientation behaviors and searching behaviors according to their directional persistence and turning characteristics. Finally, searching behaviors were further subdivided based on trajectory sinuosity into Wander, Area-Restricted Search (ARS), and Pacing. Accordingly, five behavioral patterns were identified: Stop, Orientation, Wander, ARS, and Pacing (Figure 8). It should be noted that this trajectory classification is intended to describe collective movement patterns rather than inferring underlying motivations directly.
Figure 8.
Decision model of behavioral patterns classification.
3.4.3. Calculation of Pedestrian Behavior and Commercial Activity Indicators
To measure the actual effect of facade colors on pedestrians, indicators in Table 1 were selected to characterize pedestrian behaviors:
Table 1.
Behavior indicators used in this study.
To distinguish the influence of facade color characteristics from the contextual effects of commercial activities, this study considers commercial intensity as an important contextual condition. Previous studies have demonstrated that commercial functions can influence pedestrian activities [61,62,63], and different commercial functions may generate heterogeneous pedestrian flows across time periods [64,65]. Therefore, this study introduces the Ratio of Active Storefronts (Ra) as a criterion for sample classification to characterize the commercial activity intensity of street segments. Ra is calculated as the number of active storefronts, excluding entrances and exits, divided by the total number of storefronts within each street segment. In this study, a storefront is defined as “active” only when the video-recording period overlaps with the store’s primary business hours. Considering the observed patterns of tourists and the functional composition of business in the study area, the primary business hours are defined as follows:
- For formal dining establishments, storefronts are considered active from 17:00 to 19:30.
- For businesses with functions of snacks, small commodities and other services, storefronts are considered active from 10:30 to 23:00.
- For businesses that have ceased operations, their storefronts are never considered active.
3.5. Complementary Analytical Approaches for Exploring Asymmetric and Nonlinear Relationships
Univariate linear regression models generally assume a symmetrical relationship between predictors and outcomes, in which changes in independent variables correspond to systematic changes in dependent variables. Such models are effective for estimating the net effects of individual environmental attributes on behavioral outcomes [66]. However, pedestrian behavior in micro-scale street environments is often shaped by the interaction of multiple environmental factors and contextual conditions [9]. Therefore, the same environmental characteristic may correspond to different behavioral responses, while similar behavioral outcomes may also result from different environmental configurations [67,68].
Therefore, this study adopts a complementary analytical framework combining configurational analysis (fsQCA) and quantitative regression-based approaches. First, according to the behavior cluster of pedestrians, this study divides the pedestrians into total pedestrians (Pt), orienting pedestrians (Po), and searching pedestrians (Ps), and calculates the pedestrian behavior indicators for these three groups separately. Second, in Section 4.1, fuzzy-set Qualitative Comparative Analysis (fsQCA) is used to identify combinations of variables conducive to promoting pedestrian behavior. Unlike regression models that focus on the net effects of individual variables, fsQCA examines whether specific conditions or combinations of conditions are necessary or sufficient for producing an outcome [69]. fsQCA 4.1 for Windows is adopted for calculation [70]. However, fsQCA does not estimate the individual’s response trend to environmental attributes. Therefore, in Section 4.2, the Ratio of Active Storefronts (Ra) is used to group the samples, and polynomial fitting is employed to explore the influence trends of facade color relationships on pedestrian behaviors.
4. Results
4.1. Configurational Effects of Facade Color Relationships on Pedestrian Behavior
4.1.1. Variable Necessity Testing and Screening
The fsQCA algorithm was introduced to explore combinations of indicators that serve as sufficient conditions for high vitality. Therefore, it is necessary to test whether any indicators constitute necessary conditions for high vitality so as to avoid affecting the analysis results. Since TC focuses on quantifying the complexity of individual pedestrian movement trajectories, it was not included in the calculation of total pedestrian behavior indicators. Results in Table 2 and Table 3 show that no independent variable had Consistency >0.90; therefore, none of the four indicators constitute a necessary condition for high-vitality outcomes, and all can be included in the subsequent sufficiency analysis.
Table 2.
Necessity analysis of indicators TD, Rs and Is.
Table 3.
Necessity analysis of indicators sIs, Va and sVa.
However, the truth table analysis for Va and sVa showed that no empirical configurations simultaneously met the minimum sufficiency criteria adopted in this study (Raw Consistency > 0.8 and PRI Consistency > 0.65). Among them, the overall Solution Coverage of Va was merely 0.354, indicating that its paths lack sufficient empirical explanatory power; whereas for non-necessary behavior average velocity, no path reached the 0.8 Consistency threshold. Therefore, to ensure the robustness of the research conclusions, this study excluded the velocity variables in the configurational interpretation, focusing on the indicators with stronger empirical explanatory power: Trajectory Diversity (TD), Ratio of Searching Behaviors (Rs), Stay Intensity (Is), and Stay Intensity of Searching Pedestrians (sIs).
4.1.2. Configurational Analysis of Trajectory Diversity (TD) and Ratio of Searching Behaviors (Rs)
First, the influence of color indicators (CHc, Cc, Oc) and the Ratio of Active Storefronts (Ra) on TD was explored. Figure 9 and Figure 10 present the analysis results using solution tables [52,53]. The upper half of the solution table presents the intermediate solution of TD and Rs, while the lower half presents three quantitative indicators for each path: Consistency, indicating the degree of reliability of the path as a sufficient condition for the outcome; Raw Coverage, indicating the proportion of samples that the path can explain; and Unique Coverage, indicating the proportion of samples exclusively explained by the path after deducting those redundantly explained by other paths. In this study, the Consistency threshold for each path participating in the outcome calculation was set at 0.8. The PRI Consistency threshold was determined within the range of 0.65–0.70 based on the distribution of PRI consistency scores.
Figure 9.
Configurational diagram of the influence pathways of Rb, CHc, Cc, Oc on TD and Ros (Note: ● indicates the presence of a condition, ⊗ indicates the absence of a condition; large circles represent core conditions, small circles represent peripheral conditions; blank spaces indicate that the presence or absence of the condition does not affect the outcome; detailed information on the fsQCA model is in Appendix C).
Figure 10.
Configurational diagram of the influence pathways of Rb, CHc, Cc, Oc on Is and sIs. (Note: ● indicates the presence of a condition, ⊗ indicates the absence of a condition; large circles represent core conditions, small circles represent peripheral conditions; blank spaces indicate that the presence or absence of the condition does not affect the outcome; detailed information on the fsQCA model is in Appendix C).
The left side of Figure 9 presents the fsQCA intermediate solution with high TD as the outcome variable. fsQCA identified two influence pathways as the intermediate solution, with an overall Solution Consistency of 0.89 and an overall Solution Coverage of 0.58. In configuration 1a and 1b, both Ra and Oc are recognized as “core condition absent”. Cc and CHc are recognized as “peripheral condition absent” in configuration 1a and 1b separately. It can be concluded that the two influence pathways leading to high TD are:.
- 1a. Low Ratio of Active Storefronts (core condition) + Low Color Complexity (peripheral condition) + Low Color Order (core condition)
- 1b. Low Ratio of Active Storefronts (core condition) + Low Color Harmony (peripheral condition) + Low Color Order (core condition)
The core influence pathway reflected by the two paths is: Low Ratio of Active Storefronts + Low Color Order = High Trajectory Diversity.
The right side of Figure 9 presents the fsQCA intermediate solution with high Ratio of Rs as the outcome variable. fsQCA identified two influence pathways as the intermediate solution, with an overall Solution Consistency of 0.90 and an overall Solution Coverage of 0.55. In configuration 2a and 2b, Oc is recognized as “core condition absent”. Both Ra and CHc are recognized as “core condition present” in configuration 2a and 2b separately. Cc is recognized as “condition absent” in both configurations, but only recognized as a core condition in 2a. It can be concluded that the two influence pathways leading to high Rs are:
- 2a. High Ratio of Active Storefronts (core condition) + Low Color Complexity (core condition) + Low Color Order (core condition)
- 2b. High Color Harmony (core condition) + Low Color Complexity (peripheral condition) + Low Color Order (core condition)
4.1.3. Configurational Analysis of Overall Stay Intensity (Is) and Stay Intensity of Searching Pedestrians (sIs)
The left side of Figure 10 presents the fsQCA intermediate solution with high total pedestrian Is as the outcome variable. fsQCA identified two influence pathways as the intermediate solution, with an overall Solution Consistency of 0.83 and an overall Solution Coverage of 0.47. In configuration 3a and 3b, Ra and Oc are recognized as core conditions with different states: Ra is recognized as present while Oc is recognized as absent. Cc and CHc are recognized as “peripheral condition absent” in configuration 3a and 3b separately. It can be concluded that the two influence pathways leading to high Is are:
- 3a. High Ratio of Active Storefronts (core condition) + Low Color Complexity (peripheral condition) + Low Color Order (core condition)
- 3b. High Ratio of Active Storefronts (core condition) + Low Color Harmony (peripheral condition) + Low Color Order (core condition)
The core influence pathway jointly reflected by the two paths is: high Ratio of Active Storefronts + low Color Order = High overall Stay Intensity (Is).
The right side of Figure 10 presents the fsQCA intermediate solution with high Stay Intensity of searching pedestrians (sIs) as the outcome variable. fsQCA identified two influence pathways as the intermediate solution, with an overall Solution Consistency of 0.91 and an overall Solution Coverage of 0.53. In configuration 4a and 4b, both Ra and Oc are recognized as core conditions, neither of them shows consistency in different configurations. CHc and Cc are recognized as “core condition present” in configuration 4a and 4b separately. It can be concluded that the two influence pathways leading to high sIs are:
- 4a. Low Ratio of Active Storefronts (core condition) + High Color Harmony (core condition) + High Color Order (core condition)
- 4b. High Ratio of Active Storefronts (core condition) + Low Color Harmony (peripheral condition) + High Color Complexity (core condition) + Low Color Order (core condition)
4.2. Influence Trend Analysis Based on Ratio of Active Storefronts (Ra)
The configurational analysis results of fsQCA in the previous section indicated that Ra is a core condition influencing TD, Rs, Is, sIs. Based on the median Ra value of 0.73, this section divides the 23 samples participating in the nonlinear trend exploration into a “High Ra Group” (red data points in the figures) and a “Low Ra Group” (gray data points in the figures), to explore the influence trends of CHc, Cc, and Oc on TD, TC, Rs, Is, and Va.
Among these, TD and Rs both need to be calculated based on the classification of the total pedestrians; therefore, TD and Rs do not participate in the analysis of orienting and searching pedestrians. Meanwhile, TC of total pedestrians did not exhibit any correlation with any color indicators in the regression. Therefore, TC does not participate in the analysis of total pedestrians. Ultimately, four behavior indicators for total pedestrians (TD, Rs, Is, Va), three behavior indicators for orienting pedestrians (oTC, oIs, oVa), and three behavior indicators for searching pedestrians (sTC, sIs, sVa) were determined, and regression analyses were conducted sequentially.
4.2.1. Influence Trends of Facade Color Relationships on Total Pedestrian Behaviors
Figure 11 presents the influence trends of facade color relationships (CHc, Oc, Cc) on total pedestrian behavior indicators (TD, Rs, Is, Va). Detailed model estimates and fit statistics can be found in Table A1 of Appendix C. In Plots 11-a1, 11-b1 and 11-c1, the relatively high TD of the outliers is mainly associated with temporary attractions. In Video C17, a performance on the second-floor attracted visitors to stop and watch, while the decorative carriage in Video E2–3 encouraged visitors to stop and take photographs. In Plots 11-a3, 11-b3 and 11-c3, the relatively low Is in Videos A17 and A9–10 may be attributed to the homogeneous souvenir and snack retail, which provided limited attraction for pedestrians. In Plots 11-a4, 11-b4 and 11-c4, the low Va in Videos B1–2 and D3 may be related to high pedestrian flows and active commercial interactions, including product demonstrations, free tastings, shopkeepers engaging with pedestrians, and takeaway service windows. Detailed street layouts and video recording area are presented in Appendix A.
Figure 11.
Regression results for color features and total pedestrian behavioral indicators: (a1–a4) relationships of CHc with TD, Rs, Is, and Va; (b1–b4) relationships of Oc with TD, Rs, Is, and Va; and (c1–c4) relationships of Cc with TD, Rs, Is, and Va. (Note: The red cures represent the regression results, illustrating the statistical relationships. Red scatter points represent samples in the high Ra group, gray scatter points represent those in the low Ra group, and blue scatter points indicate outliers. The shaded gray region denotes the 95% confidence interval for the fitted curve).
With regard to the data point information in the first row and first column, the samples in the High Ra Group are more convergent than those in the Low Ra Group, indicating that in the sampled streets, when the Ratio of Active Storefronts Ra is at a relatively high level (≥0.73 in this study), the polynomial fitting between color indicators and pedestrian behavior exhibits stronger explanatory power; in contrast, in the Low Ra Group, the scatter distribution between color indicators and pedestrian behavior is more dispersed, and the fitted curves lack reliable explanatory power. On the one hand, this finding supports the analytical conclusions of fsQCA, indicating that built environment color cannot easily influence behavior in isolation; on the other hand, this finding also indicates that color can only exhibit a significant correlation with pedestrian behavior when ground-floor street facades are relatively active.
Each column from left to right presents the regression results for the four indicators TD, Rs, Is, Va, and each row from top to bottom presents the regression results for the three indicators CHc, Oc, Cc. Comparing the results across columns, TD exhibits certain degree of correlation with CHc and Cc, however Rs, Is and Va only exhibit correlation with CHc. Comparing the results across rows, CHc demonstrates the strongest explanatory power among all color indicators for pedestrian behavior indicators. This result supports the validity of the two indicator calculation methods developed in this study—Commercial Color Harmony CHc and Trajectory Diversity TD.
For CHc, a1, a2, and a3 of Figure 11 demonstrate that the influence of CHc on TD, Rs, and Is exhibits a pronounced nonlinear pattern. As CHc increases, TD initially shows a weak upward trend, while Rs and Is display clear upward trends; when CHc reaches a threshold between 1.07 and 1.15, TD, Rs, and Is transits to clear downward trends. This phenomenon indicates that in commercially active street segments where the color condition of the street facade is relatively chaotic, enhancing Commercial Color Harmony is associated with diversification of activity types; however, once CHc exceeds a certain threshold, further increases in CHc may instead correspond to formulaic commercial color coordination, which is then associated with a decline in street vitality. Figure 11(a4) demonstrates that CHc and Va exhibit a clear positive correlation—an increase in Color Harmony leads to an increase in pedestrian walking speed. This implies that in commercially active streets, overly regular commercial element colors may be associated with pedestrian aesthetic fatigue, thereby prompting pedestrians to expedite their transit rather than linger.
For Cc, Figure 11(c1) indicates that Cc and TD exhibit a clear positive linear correlation, indicating that the increase in Color Complexity is positively associated with diverse pedestrian activities.
4.2.2. Influence Trends of Facade Color Relationships on Orienting and Searching Pedestrian Behaviors
Figure 12 presents the influence trends of facade color relationships (CHc, Oc, Cc) on the behavior indicators of orienting pedestrians (oTC, oIs, oVa). Detailed model estimates and fit statistics can be found in Table A2 of Appendix C. In Plots a1,b1,c1 and a2,b2,c2, outliers are both recorded in Video A9–10 and A17. These recording sites are situated at a considerable distance from the primary source of pedestrian flow. These two segments are located farther from the main pedestrian flow and their commercial functions and facade styles are comparatively homogeneous, resulting in a significantly lower oTC and oIs. Detailed street layouts and video recording area are presented in Appendix A.
Figure 12.
Regression results for color features and orienting pedestrian behavioral indicators: (a1–a3) relationships of CHc with oTC, oIs, and oVa; (b1–b3) relationships of Oc with oTC, oIs, and oVa; (c1–c3) relationships of Cc with oTC, oIs, and oVa. (Note: The red cures represent the regression results, illustrating the statistical relationships. Red scatter points represent samples in the high Ra group, gray scatter points represent those in the low Ra group, and blue scatter points indicate outliers. The shaded gray region denotes the 95% confidence interval for the fitted curve).
Comparing the data across rows, only CHc exhibits a clear correlation with the behavior indicators of orienting pedestrians. Specifically, the relationships between CHc and oTC and oIs display a clear inverted U-shaped pattern. Initially, CHc shows a pronounced positive influence on oTC and oIs; as CHc continues to increase, after surpassing a threshold of approximately 1.13, the influence of CHc on oTC and oIs shifts to negative. The relationship between CHc and oVa exhibits a U-shaped pattern—as CHc rises, oVa first experiences a decline, and once CHc surpasses a threshold of approximately 1.11, oVa begins to rise correspondingly. For orienting pedestrians, whose routes are less contingent on the local environment, an increase in Commercial Color Harmony CHc is associated with somewhat lower walking speed within the observed range; however, once CHc exceeds a certain threshold, a more regular commercial color scheme is associated with higher walking speed.
Figure 13 presents the influence trends of facade color relationships (CHc, Oc, Cc) on the behavior indicators of searching pedestrians (sTC, sIs, sVa). Detailed model estimates and fit statistics can be found in Table A3 of Appendix C. In Plots a1,b1,c1, outliers recorded in Video A14–16 and E2–3 result from either significantly higher or lower level of pedestrian flow. In Plots a3,b3,c3, outliers recorded in Video A4–5 and C8–9 result from significantly higher level of pedestrian flow. Detailed street layouts and video recording area are presented in Appendix A.
Figure 13.
Regression results of color features and searching pedestrian behavioral indicators: (a1–a3) relationships of CHc with sTC, sIs, and sVa; (b1–b3) relationships of Oc with sTC, sIs, and sVa; (c1–c3) relationships of Cc with sTC, sIs, and sVa;. (Note: The red cures represent the regression results, illustrating the statistical relationships. Red scatter points represent samples in the high Ra group, gray scatter points represent those in the low Ra group, and blue scatter points indicate outliers. The shaded gray region denotes the 95% confidence interval for the fitted curve).
A notable difference from the preceding analyses is that Color Order Oc exhibits a clear correlation with sTC and sVa. Specifically, Oc and sTC display an inverted U-shaped pattern—initially, sTC increases with the rise of Oc, but once Oc surpasses a threshold of approximately 75, sTC decreases with further increases in Oc. Oc and sVa exhibit a clear positive linear correlation. With regard to CHc, its correlation with sTC and sIs is not significant; it exhibits a positive linear correlation with sVa.
A comprehensive comparison of the regression results when discussing total pedestrians versus subgroup pedestrians yields the following conclusions: (1) Except for searching pedestrians, the influence of CHc on Is consistently exhibits an inverted U-shaped relationship: as CHc increases, Is first experiences a rise, and once CHc surpasses a threshold, Is begins to decline. (2) For total and searching pedestrians, CHc and Va both exhibit a positive linear correlation; whereas for orienting pedestrians, CHc and Va exhibit a U-shaped relationship.
5. Discussion
5.1. Associations Between Street Facade Color Relationships and Pedestrian Behavior
The study observed non-linear, inverted U-shaped relationships between Commercial Color Harmony (CHc) and multiple pedestrian behavior indicators (TD, Rs, and Is), with inflection points clustering tightly around 1.07–1.13 for overall pedestrians and 1.13 for orienting groups (oTC and oIs). Previous psychological experiments have shown that excessive color complexity and inappropriate color combinations can increase visual processing demands and cognitive load [71,72,73]. For example, EEG-based studies have demonstrated that excessive color quantity increases cognitive burden, while research on visual search has indicated that color complexity affects attentional allocation and visual fatigue. This provides a possible explanation for the observed inverted U-shaped relationship. Similar to the Yerkes-Dodson Law, which suggests that moderate arousal levels facilitate task performance [74,75], moderate color harmony may maintain sufficient visual order while avoiding both excessive visual interference and insufficient stimulation.
Furthermore, in commercially active streets, CHc and Va exhibit a positive linear correlation (Figure 11(a4) and Figure 13(a3))—a more regular color coordination is accompanied by faster pedestrian movement. This finding further indicates that, in the current landscape preservation of historic districts, overly mechanical color control strategies are negatively associated with commercial vitality.
Second, the weaker explanatory power of Oc and Cc compared with CHc suggests that pedestrian responses are more closely related to an integrated measure of the streetscape than to single-dimensional properties of color organization or information load. A parallel may be drawn with the general idea that an overall balance between Oc and Cc is not captured by either dimension alone, which is consistent with the definition of CHc.
The contrasting associations of Oc and Cc indicate that Commercial Color Order and Complexity are not interchangeable properties of the streetscape. The inverted U-shaped relationship between Oc and pedestrian behavior (Figure 13(b1)) resembles the trade-off between legibility and stimulation. Within the observed range, intermediate Oc (around 75 in this study) associates with higher intensity of pedestrian activity, whereas higher Oc associates with faster walking velocity, as reflected in the positive association between Oc and sVa among searching pedestrians (Figure 13(b3)). By contrast, the positive linear relationship between Cc and TD suggests that greater Commercial Color Complexity associates with more diverse pedestrian behaviors within the observed range (Figure 11(c1)).
The differences among pedestrian groups further indicate that the association between facade color and pedestrian behavior is not uniform across groups. CHc remains relevant across pedestrian groups, suggesting that Commercial Color Harmony is a relatively fundamental component of streetscape perception. However, Oc shows stronger associations with searching pedestrians. Orienting pedestrians, in contrast, are more strongly constrained by their existing destinations and show the weakest association with Oc and Cc.
Overall, the findings indicate that effective historic-district color management should seek neither maximum Oc nor maximum Cc, but an appropriate balance between them. CHc provides a more consistent representation of how pedestrians perceive the street facade, while Oc and Cc tend to become salient only under specific visual conditions. Increasing Commercial Color Order and increasing Commercial Color Complexity should not be regarded as equivalent strategies for enhancing pedestrian engagement in historic districts. To better explain the associations between facade color relationships and pedestrian behavior, Figure 14 lists four cases of commercial color design.
Figure 14.
Four commercial color schemes and their predicted pedestrian response. (Note: Predicted responses are read from CHc alone; Oc and Cc are shown for reference only. All four indicators belong to the total-pedestrian group. Is, Rs, TD are classed as high when CHc falls inside the paper’s preferred band of 1.07–1.15 and as low when it falls outside. Va, which rises linearly with CHc, is classed as high when its fitted value exceeds the median of dependent variables in the fitted sample.).
5.2. Role of the Business Function Structures in Color Relationships’ Effects
Both fsQCA configurational analysis and regression analysis consistently indicate that the Ra plays an important role in the influence of color relationships on pedestrian behavior. Considering that all videos were recorded in a fixed time period (15:00–17:30) of a day, variation of Ra across different street segments reflects discrepancy in the structure of business functions. The level of Ra divides street space into two distinctly different types:
In environments with a high Ratio of Active Storefronts (Ra ≥ 0.73), facade color relationships exert a stable and significant influence on pedestrian behaviors. The fsQCA analysis results in Section 4.1 show that the combination of high Ra and low Oc is a core condition for high Rs (Configuration 2a) and Is (Configuration 3a, 3b). Subsequently, the regression analysis in Section 4.2 also corroborates this finding: regardless of the pedestrian group, for the samples in the High Ra Group, the scatter plots are always more convergent. Whereas the scatter plots of the Low Ra Group show virtually no discernible pattern. Across the investigated street segments, Ra appears to be a context within which facade color relationships and pedestrian behavior are more consistently associated. Functioning analogously to a visual buffer, a lower Oc mitigates the extent to which commercial elements dominate pedestrians’ attention. However, an excessively high Ratio of Active Storefronts can lead to the homogenization of pedestrian behaviors. Configuration 1a and 1b in Figure 9 indicate that while high commercial density enhances the proportion of exploratory activities (high Rs), it also leads to a reduction in Trajectory Diversity (TD). This case indicates that overly active storefronts concentrate the majority of pedestrians into a small number of behavioral patterns (such as pausing to watch), reducing other types of behaviors in the street. fsQCA reveals that the core condition triggering high TD is low Ra (Configuration 1a, 1b), indicating that Rs and TD cannot be simultaneously achieved in environments with an active commercial facade.
In environments with a low Ratio of Active Storefronts (Ra < 0.73), the influence of facade color on pedestrian behavior depends more on the combinatory effects of multiple conditions. Notably, the trend analysis in Section 4.2 shows that in the Low Ra Group, the scatter plots between color indicators and pedestrian behavior are relatively dispersed, and the explanatory power of polynomial fitting is weak. However, the fsQCA configurational analysis demonstrates that the role of color relationships in low Ra environments has not vanished. Rather, it no longer follows the simple linear logic and instead operates through combinations of multiple conditions. This finding at the methodological level is particularly important: it indicates that in micro-spaces where diverse environmental elements interweave, examining the linear or nonlinear relationships between isolated variables may be misleading, and a comprehensive analytical perspective is indispensable.
5.3. Recommendations for Sustainable Conservation of Historic Districts
Based on the findings, the following recommendations are proposed for the sustainable conservation of historic districts. Conservation methods should not pursue mechanical color management. Rather, they should be precisely aligned with the regeneration purpose and functional programming:
When the regeneration purpose is to enhance commercial vitality and prolong consumer dwell time, priority should be given to ensure a relatively high Ra. For streets with high Ratio of Active Storefronts, relaxing the control of Color Order while controlling Color Harmony within a specific range is necessary. Street facade colors may therefore retain a degree of variety, thus enhancing overall Stay Intensity (Is) and Ratio of Searching Behaviors (Rs). It should be noted that the inverted U-shaped relationship between CHc and multiple behavior indicators emphasizes the importance of guarding against “over-design”—Commercial Color Harmony is not higher the better, and should be controlled within a specific range (approximately 1.07–1.15 in this study).
When the regeneration purpose is to create a space for culture display or public life, Ra should be kept at a relatively low level, and color management has two options:
- Enhance the visual intervention centered on facade color relationships. Enhance Color Harmony and Color Order, creating a highly unified and rhythmically rich facade color system. Spatial nodes with strong visual appeal can be formed, thus providing environmental support for optional and social activities like photographing and chatting.
- Preserve the casual visual state of the original built environment and tolerate a certain degree of disorder in color relationships. In Streets with low Ratio of Active Storefronts, a less restrictive control of Color Order is associated with more diverse pedestrian behaviors. In such cases, spatial quality should be enhanced by adding rest facilities and activity venues rather than large-scale facade renovation.
6. Conclusions
From a behavioral perspective, this research investigates how color relationships between new commercial elements and existing historical elements can be organized to balance urban regeneration and heritage preservation under a context of sustainable development. The application of Moon–Spencer (M-S) Color Harmony provides an objective, quantitative method for evaluating the relationships between commercial and historical elements [27,28,29]. Benhamou’s trajectory classification method enables a precise, multi-dimensional assessment of pedestrian behavior by distinguishing orienting behaviors from searching behaviors, thereby enhancing the semantic explainability of pedestrian motivation within historic streetscapes [45]. The main conclusions of this research are as follows:
- Moderate color harmony effectively balances historical landscape preservation with street vitality. In our research context, Commercial Color Harmony (CHc) exhibits a non-linear, inverted U-shaped relationship with pedestrian behaviors (TD, Rs, and Is), where peak pedestrian engagement was observed at moderate harmony levels (CHc ≈ 1.07–1.15 in this study). This empirical range is specific to the studied streets in Nanjing and requires further validation.
- Commercial activation (Ra) can fundamentally alter how facade colors influence pedestrian behaviors. In highly activated commercial contexts (Ra ≥ 0.73), lower Oc was associated with longer dwell time and a higher proportion of searching behaviors. Conversely, in low commercial activation contexts (Ra < 0.73), behavior responds to multi-variable configurations rather than isolated variables—low Oc is associated with greater spatial exploration (TD), whereas high CHc combined with high Oc is associated with stationary behaviors (sIs).
- Behavioral responses to color configurations vary significantly across pedestrian types, highlighting the necessity of segmenting user groups or behavior types in color–behavior research. Comprehensive indicators like CHc capture shared behavioral traits across diverse groups, whereas Color Order (Oc) affects exploratory and wandering crowds—exerting a distinct impact on their Trajectory Complexity (sTC) and Average Velocity (sVa).
Given the limited sample size, our findings should be interpreted as a form of post-occupancy evaluation within the selected historic cultural districts. Pursuing visual harmony and uniformity alone may not necessarily lead to more active pedestrian behavior. Moreover, behavioral responses measured in this study (e.g., TD and Rs) may vary with changes in the pedestrian trajectory recording period, as pedestrian activities and environmental interactions differ across time contexts. Even with a substantially expanded dataset, identifying a universal curve that characterizes the relationship between visual harmony and pedestrian behavior may remain difficult. Nevertheless, context-specific ranges of visual harmony can exist, varying across cultural settings, urban environments, and types of pedestrian activities [76].
This study establishes a quantitative, micro-scale framework that uses pedestrian behavior as an empirical baseline to calibrate the optimal balance between commercial elements and historical elements. For planners and architects, these findings highlight the importance of considering other environmental characteristics, such as functional organization and spatial configuration [63], rather than relying solely on visual consistency. Within historic district regeneration and conservation, color control should neither be dogmatically managed by prescribing specific colors, nor should it demand that new interventions endlessly emulate existing color profiles toward absolute uniformity. Introducing an appropriate degree of visual contrast may help enrich environmental stimuli and support diverse pedestrian activities.
Further research could expand in three directions: (1) validating and recalibrating empirical thresholds across diverse historic contexts to provide evidence-based guidance for planning and design governance; (2) extending evaluation beyond behavioral indicators to assess longer-term socio-economic impacts; and (3) incorporating additional street environmental elements, such as street trees and other physical features.
Author Contributions
Conceptualization, F.L., C.Y. and Y.T.; methodology, C.Y., H.Z. and Y.T.; software, C.Y. and H.Z.; validation, F.L. and Y.T.; formal analysis, F.L., C.Y. and H.Z.; investigation, C.Y. and H.Z.; resources, F.L., C.Y. and H.Z.; data curation, C.Y.; writing—original draft preparation, C.Y.; writing—review and editing, F.L., C.Y., H.Z. and B.S.; visualization, C.Y.; supervision, F.L., Y.T. and B.S.; project administration, F.L., Y.T. and B.S.; funding acquisition, F.L., C.Y. and B.S. All authors have read and agreed to the published version of the manuscript.
Funding
This research study was funded by the 2026 Postgraduate Research & Practice Innovation Program of Jiangsu Province (grant number 26CXJH2837) and the National Natural Science Foundation of China (grant number 52308023).
Institutional Review Board Statement
Ethical review and approval were waived for this study in accordance with the Measures for Ethical Review of Science and Technology Activities of the People’s Republic of China, as the study involved only the collection and analysis of anonymized photographs and videos from public spaces and did not involve the recruitment or direct involvement of human participants.
Informed Consent Statement
Informed consent for participation was not required for this study, as no participants were recruited or directly involved, and the study used only anonymized observational data collected in public spaces.
Data Availability Statement
The original data presented in this study are openly available in Figshare at https://doi.org/10.6084/m9.figshare.33769897.
Acknowledgments
Many thanks to Zheng Sun, Jitao Sun, Junjie Yan, Jun Zhou, Yi Zhao, and Yiping Guan for their assistance during the data collection process. During the preparation of this manuscript, the authors used Gemini 3.1 Pro, DeepSeek-V4-flash and Claude Code v2.1.63 for the purposes of generating python scripts. The authors have reviewed and edited the output and take full responsibility for the content of this publication.
Conflicts of Interest
The authors declare no conflicts of interest.
Appendix A
Figure A1.
Detailed street layouts and video recording area: (a) collection result of West Gongyuan Street; (b) collection result of Gongyuan Street; (c) collection result of Dashiba Street; (d) collection result of Santiaoying Street; (e) collection result of Gutong Street. (map data source: www.openstreetmap.org).
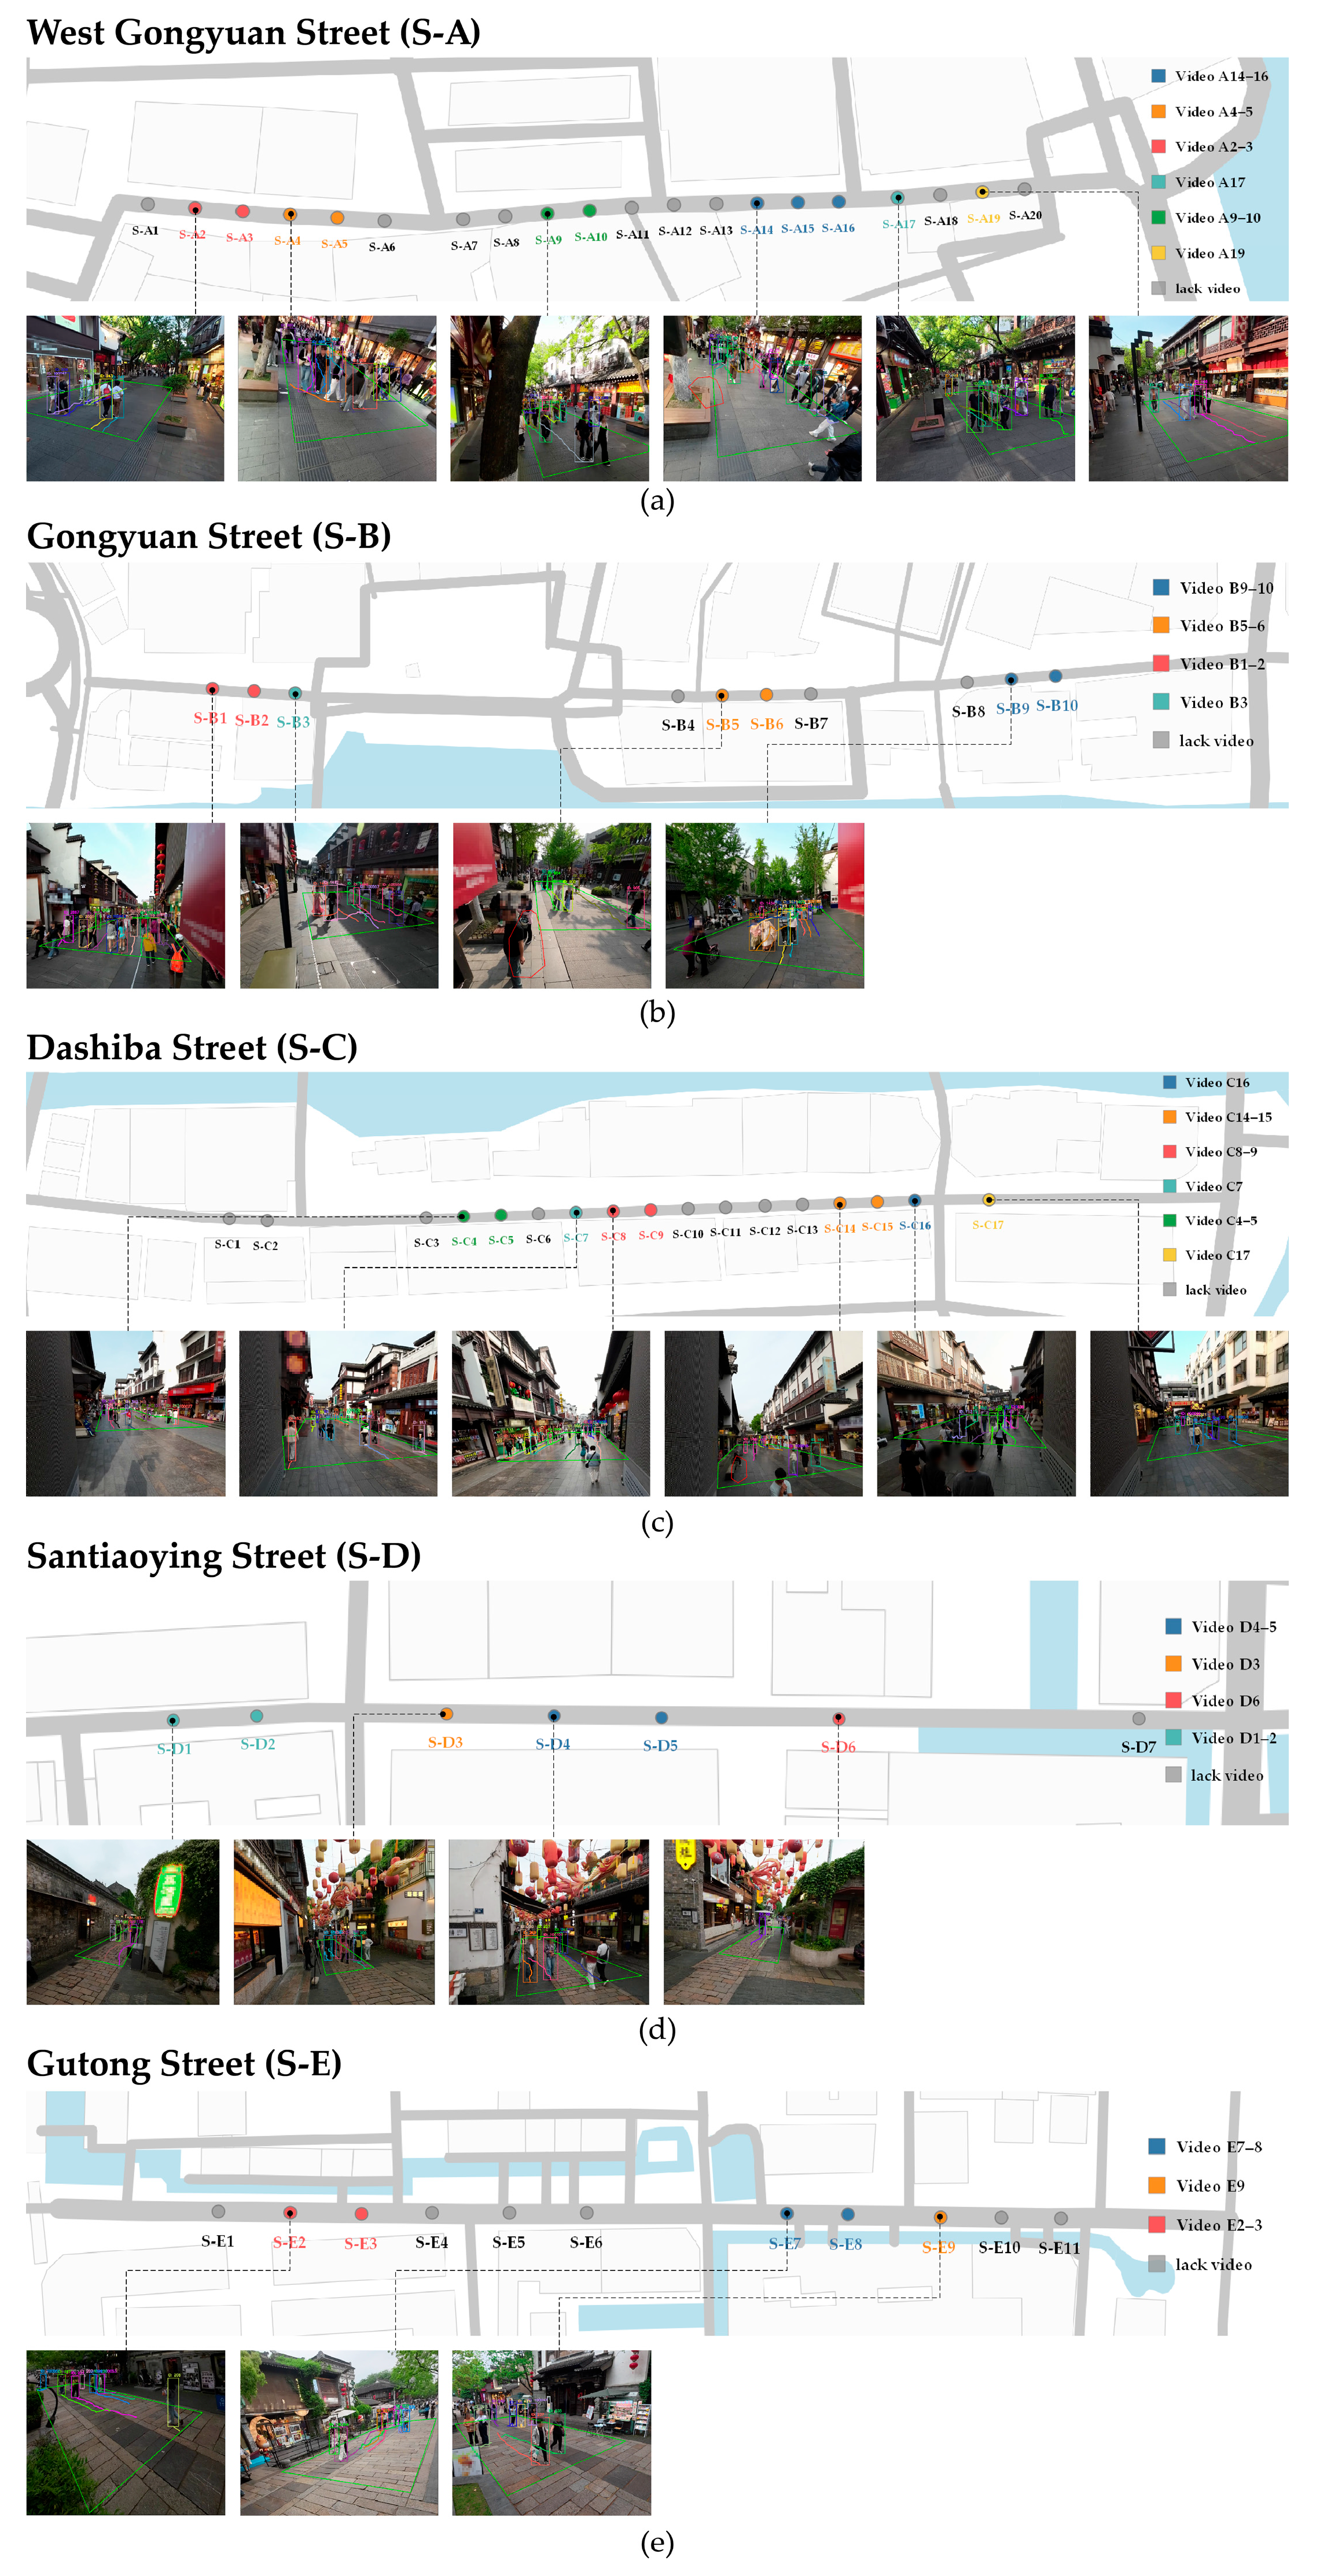
Appendix B
To calculate the scalar moment balance score A(Hi,Cj), it is first necessary to clarify the method for computing the scalar moment. Analogous to the lever law in physics, Moon and Spencer regarded the absolute distance (Δs) between one color in the image and the current Adaptation Point (Pa) in ω space as the magnitude of the force, the area (A) occupied by that color in the image as the lever arm, and defined the product of the two as the scalar moment (M) of that color [26]. For the historical and commercial element colors in this study, Δs is calculated as follows:
Here, Δsi and Δsj respectively represent the absolute distance between the i-th historical dominant color (or the j-th commercial dominant color) and the adaptation point of the current façade in ω space. (Ro,θo,Zo) denotes the ω space coordinates of Pa. (ri,θi,zi) denotes the ω space coordinates of the i-th historical dominant color, and (rj,θj,zj) denotes the ω space coordinates of the j-th commercial dominant color.
The calculation formulas for the color scalar moment M and the moment ratio ρ are as follows:
Mi = Ai × Δsi,
Mj = Aj × Δsj,
Here, ρij denotes the color scalar moment ratio between the i-th historical dominant color and the j-th commercial dominant color in the street facade image; Mi and Mj respectively represent the scalar moments (M) of the i-th historical dominant color and the j-th commercial dominant color; Ai and Aj respectively represent the absolute areas occupied by the i-th historical dominant color and the j-th commercial dominant color in the same facade; and Δsi and Δsj respectively represent the distances in ω space between the i-th historical dominant color (or the j-th commercial dominant color) and the Adaptation Point Pa of the current facade.
According to M-S theory, Color Order arises from three scalar moment ratios: 1:1, 1:2, and 1:3 [29]. The weighting of the color order formula is derived by scoring discrete Munsell color values. To enable the criteria based on discrete values to accommodate continuous real-world color, this study constructs a piecewise function with a dynamic tolerance mechanism for scoring the scalar moment ratios.
Here, Sarea(ρij) denotes the scalar moment ratio score between the i-th historical dominant color and the j-th commercial dominant color in the current facade; ρij denotes the scalar moment ratio between the i-th historical dominant color and the j-th commercial dominant color in the current façade. ϵ denotes the standard tolerance, which is set to 0.15 in this study.
To compute the geometric relationship score, Moon and Spencer first established the cognition of human vision on color relationships: Identity, Similarity, and Contrast produce aesthetic appeal, whereas Ambiguity—state lying between any two adjacent comforting relationships—induces aversion [27]. They scored each type of color relationship through psychological experiments, and this study has organized their scoring results.
In the hue dimension, if either of the colors under comparison belongs to Neutral Gray, its hue characteristic is visually invalid; in this case, a base harmony score of 1.0 is assigned. Otherwise, stepped scoring is performed according to the interval span of:
Here, OH(ΔHij) denotes the score in the hue dimension of the i-th historical dominant color and the j-th commercial dominant color; ΔHij denotes the hue difference between the i-th historical dominant color and the j-th commercial dominant color.
Among the three dimensions of color, human eyes are most sensitive to the value dimension, where slight deviations in lightness can easily induce visual discomfort. Consequently, the “Ambiguity” interval and the overly close “Identity” interval of lightness are both assigned severe negative scores according to the theory:
Here, OV(ΔVij) denotes the score in the value dimension of the i-th historical dominant color and the j-th commercial dominant color; ΔVij denotes the value difference between the i-th historical dominant color and the j-th commercial dominant color.
Compared with the hue and value dimension, the human eye has a higher tolerance for chroma, and its order score exhibits relatively moderate positive or zero-valued feedback:
Here, OC(ΔCij) denotes the score in the chroma dimension of the i-th historical dominant color and the j-th commercial dominant color; ΔCij denotes the value difference between the i-th historical dominant color and the j-th commercial dominant color.
Finally, the geometric relationship score OH,V,C(Hi,Cj) is obtained by summation:
OH,V,C(Hi,Cj) = OH(ΔHij) + OV(ΔVij) + OC(ΔCij)
Here, OH,V,C(Hi,Cj) represents the total geometric relationship score of the traditional–commercial color pairs in Munsell space. OH(ΔHij), OV(ΔVij), OC(ΔCij) represent the geometric relationship scores of color pairs in the hue, value, and chroma dimensions respectively.
References
- Cao, X.; Yun, Y.; Ren, L. Research on the Assessment of Architectural Colors in Cultural Heritage Blocks Based on Computer Vision: A Case Study of Tianjin. Land 2025, 14, 1159. [Google Scholar] [CrossRef] [Scilit]
- Miao, M.; Feng, L.; Wu, Y.; Zhu, R.; Xu, D. Color Authenticity for the Sustainable Development of Historical Areas: A Case Study of Shiquan. Sustainability 2024, 16, 2417. [Google Scholar] [CrossRef] [Scilit]
- Feng, L.; Yu, G.; Miao, M.; Sun, J. Sustainable Color Development Strategies for Ancient Chinese Historical Commercial Areas: A Case Study of Suzhou’s Xueshi Street–Wuzounfang Street. Sustainability 2025, 17, 4756. [Google Scholar] [CrossRef] [Scilit]
- Zhai, Y.; Gong, R.; Huo, J.; Fan, B. Building Façade Color Distribution, Color Harmony and Diversity in Relation to Street Functions: Using Street View Images and Deep Learning. ISPRS Int. J. Geo-Inf. 2023, 12, 224. [Google Scholar] [CrossRef] [Scilit]
- Yang, R.; Deng, X.; Shi, H.; Wang, Z.; He, H.; Xu, J.; Xiao, Y. A Novel Approach for Assessing Color Harmony of Historical Buildings via Street View Image. Front. Archit. Res. 2024, 13, 764–775. [Google Scholar] [CrossRef] [Scilit]
- Yao, W.; Mingrui, M.; Zirong, D.; Yonglan, W.; Mengshan, Z. Commercial color impact on traditional heritage features in Suzhou Shiquan historic district. npj Herit. Sci. 2025, 13, 395. [Google Scholar] [CrossRef] [Scilit]
- Wang, Z.; Sun, H.; Li, J. Research on Architectural Color and Visual Comfort in Historic Landscape Areas. Buildings 2023, 13, 1004. [Google Scholar] [CrossRef] [Scilit]
- Liao, W.; Liu, P.; Chen, Z.; Liu, S. Investigating Impacts of Renovated Exteriors in Historic Districts on Visitor Vitality through Space Syntax Reflection. npj Herit. Sci. 2025, 13, 336. [Google Scholar] [CrossRef] [Scilit]
- Wu, T.; Chen, Z.; Li, S.; Xing, P.; Wei, R.; Meng, X.; Zhao, J.; Wu, Z.; Qiao, R. Decoupling Urban Street Attractiveness: An Ensemble Learning Analysis of Color and Visual Element Contributions. Land 2025, 14, 979. [Google Scholar] [CrossRef] [Scilit]
- Niu, T.; Qing, L.; Han, L.; Long, Y.; Hou, J.; Li, L.; Tang, W.; Teng, Q. Small Public Space Vitality Analysis and Evaluation Based on Human Trajectory Modeling Using Video Data. Build. Environ. 2022, 225, 109563. [Google Scholar] [CrossRef] [Scilit]
- Xue, X.; Tian, Z.; Yang, Y.; Wang, J.; Cao, S. Sustaining the local color of a global city. Nat. Cities 2025, 2, 400–412. [Google Scholar] [CrossRef] [Scilit]
- Bandarin, F.; van Oers, R. The Historic Urban Landscape: Managing Heritage in an Urban Century; Wiley-Blackwell: Hoboken, NJ, USA, 2012. [Google Scholar]
- UNESCO. New Life for Historic Cities: The Historic Urban Landscape Approach Explained; UNESCO World Heritage Centre: Paris, France, 2013. [Google Scholar]
- UNESCO. Recommendation on the Historic Urban Landscape. Available online: https://whc.unesco.org/en/hul/ (accessed on 2 July 2026).
- Silva, K. (Ed.) The Routledge Handbook on Historic Urban Landscapes in the Asia-Pacific; Routledge: London, UK, 2019. [Google Scholar]
- Rodwell, D. Managing Historic Cities. J. Archit. Conserv. 2006, 12, 41–61. [Google Scholar] [CrossRef] [Scilit]
- Miles, M.; Hall, T.; Borden, I. The City Cultures Reader; Routledge: London, UK, 2004. [Google Scholar]
- Portella, A. Visual Pollution: Advertising, Signage and Environmental Quality; Ashgate Pub Co.: Surrey, UK, 2014. [Google Scholar]
- Wang, K.; Fouseki, K. Sustaining the Fabric of Time: Urban Heritage, Time Rupture, and Sustainable Development. Land 2025, 14, 193. [Google Scholar] [CrossRef] [Scilit]
- Russo, A.P. The “vicious circle” of tourism development in heritage cities. Ann. Tour. Res. 2002, 29, 165–182. [Google Scholar] [CrossRef] [Scilit]
- Xu, G.; Zhong, L.; Wu, F.; Zhang, Y.; Zhang, Z. Impacts of Micro-Scale Built Environment Features on Tourists’ Walking Behaviors in Historic Streets: Insights from Wudaoying Hutong, China. Buildings 2022, 12, 2248. [Google Scholar] [CrossRef] [Scilit]
- Lyu, M.; Qu, G.; Shi, J.; Sun, D.; Tian, Y. A Method for Studying Building Color Harmony in Coastal Historic and Cultural Districts: A Case Study of Mojiko, Japan. Buildings 2025, 15, 1496. [Google Scholar] [CrossRef] [Scilit]
- ISO/CIE 11664-6:2022(E); Colorimetry-Part 6: CIEDE2000 Colour-Difference Formula. International Commission on Illumination: Vienna, Austria, 2022.
- Luo, M.R.; Cui, G.; Rigg, B. The Development of the CIE 2000 Colour-Difference Formula: CIEDE2000. Color Res. Appl. 2001, 26, 340–350. [Google Scholar] [CrossRef] [Scilit]
- Munsell, A.H. A Color Notation; Munsell Color Company: Boston, MA, USA, 1919. [Google Scholar]
- Birkhoff, G.D. Aesthetic Measure; Harvard University Press: Cambridge, MA, USA, 1933. [Google Scholar]
- Moon, P.; Spencer, D.E. Geometric Formulation of Classical Color Harmony. J. Opt. Soc. Am. 1944, 34, 46–59. [Google Scholar] [CrossRef] [Scilit]
- Moon, P.; Spencer, D.E. Area in Color Harmony. J. Opt. Soc. Am. 1944, 34, 93–103. [Google Scholar] [CrossRef] [Scilit]
- Moon, P.; Spencer, D.E. Aesthetic Measure Applied to Color Harmony. J. Opt. Soc. Am. 1944, 34, 234–242. [Google Scholar] [CrossRef] [Scilit]
- Itten, J. The Art of Color; Van Nostrand Reinhold: New York, NY, USA, 1961. [Google Scholar]
- Zhu, Z.; Liu, Y.; Chen, Y. The Influence of Emotional Response and Aesthetic Perception of Shopping Mall Facade Color on Entry Decisions—Evidence from the Yangtze River Delta Region of China. Buildings 2024, 14, 2302. [Google Scholar] [CrossRef] [Scilit]
- Gehl, J.; Svarre, B. How To Study Public Life; Island Press: Washington, DC, USA, 2013; ISBN 978-1-59726-445-7. [Google Scholar]
- Gehl, J. Life Between Buildings: Using Public Space; Island Press: Washington, DC, USA, 2011. [Google Scholar]
- Zheng, G.; Ding, L.; Zheng, J. A Multi-Dimensional Evaluation of Street Vitality in a Historic Neighborhood Using Multi-Source Geo-Data: A Case Study of Shuitingmen, Quzhou. ISPRS Int. J. Geo-Inf. 2025, 14, 240. [Google Scholar] [CrossRef] [Scilit]
- Li, J.; Kong, N.; Lin, S.; Zeng, J.; Ke, Y.; Chen, J. Spatial Nonlinear Effects of Street Vitality Constrained by Construction Intensity and Functional Diversity—A Case Study from the Streets of Shenzhen. ISPRS Int. J. Geo-Inf. 2024, 13, 238. [Google Scholar] [CrossRef] [Scilit]
- Wu, W.; Liu, X.; Zhou, Y.; Zhao, K. Spatial Heterogeneity of Built Environment’s Impact on Urban Vitality Using Multi-Source Big Data and MGWR. Sci. Rep. 2025, 15, 23459. [Google Scholar] [CrossRef] [Scilit] [PubMed]
- Lee, J.; Kang, Y. A Dynamic Algorithm for Measuring Pedestrian Congestion and Safety in Urban Alleyways. ISPRS Int. J. Geo-Inf. 2024, 13, 434. [Google Scholar] [CrossRef] [Scilit]
- Mo, Y.; Qiu, S.; Tang, J.; Li, Z. Investigating the Dynamics of Pedestrian Flow through Different Transition Bottlenecks. Sustainability 2024, 16, 1391. [Google Scholar] [CrossRef] [Scilit]
- Zhang, J.; Zhou, W.; Lian, H.; Hu, R. Research on Optimization Strategy of Commercial Street Spatial Vitality Based on Pedestrian Trajectories. Buildings 2024, 14, 1240. [Google Scholar] [CrossRef] [Scilit]
- Steffen, B.; Seyfried, A. Methods for Measuring Pedestrian Density, Flow, Speed and Direction with Minimal Scatter. Physica A Stat. Mech. Its Appl. 2010, 389, 1902–1910. [Google Scholar] [CrossRef] [Scilit]
- Weidmann, U. Transporttechnik der Fussgänger: Transporttechnische Eigenschaften des Fussgängerverkehrs, Literaturauswertung; ETH Zurich: Zurich, Switzerland, 1992; p. 84 S. [Google Scholar]
- Duives, D.C.; Daamen, W.; Hoogendoorn, S.P. Quantification of the Level of Crowdedness for Pedestrian Movements. Physica A Stat. Mech. Its Appl. 2015, 427, 162–180. [Google Scholar] [CrossRef] [Scilit]
- Allen, G.L. Spatial Abilities, Cognitive Maps, and Wayfinding: Bases for Individual Differences in Spatial Cognition and Behavior. In Wayfinding Behavior: Cognitive Mapping and Other Spatial Processes; Golledge, R.G., Ed.; Johns Hopkins University Press: Baltimore, MD, USA, 1999; pp. 46–80. [Google Scholar]
- Baumann, V.; Dambacher, J.; Ruitenberg, M.F.L.; Schomaker, J.; Krauel, K. Towards a Characterization of Human Spatial Exploration Behavior. Behav. Res. Methods 2025, 57, 65. [Google Scholar] [CrossRef] [Scilit] [PubMed]
- Benhamou, S. How to Reliably Estimate the Tortuosity of an Animal’s Path:: Straightness, Sinuosity, or Fractal Dimension? J. Theor. Biol. 2004, 229, 209–220. [Google Scholar] [CrossRef] [Scilit] [PubMed]
- Fan, J.; Gu, T. Comparative Analysis of Spatial Patterns and Driving Factors of Historic Districts in the Chinese Four Ancient Capitals. npj Herit. Sci. 2025, 13, 245. [Google Scholar] [CrossRef] [Scilit]
- Chen, T.; Wang, F.; Zhang, H.; Li, G.; Hu, L. A Computational Evaluation of Visitor Perception in a Historic District: Implications for Built Heritage Conservation and Spatial Management in Nanjing Fuzimiao. Buildings 2026, 16, 2416. [Google Scholar] [CrossRef] [Scilit]
- Shao, L.; Ma, P.; Zhou, Z. Research on the Impact of Landscape Planning on Visual and Spatial Perception in Historical District Tourism: A Case Study of Laomendong. Land 2024, 13, 1134. [Google Scholar] [CrossRef] [Scilit]
- Ki, D.; Park, K.; Chen, Z. Bridging the Gap between Pedestrian and Street Views for Human-Centric Environment Measurement: A GIS-Based 3D Virtual Environment. Landsc. Urban Plan. 2023, 240, 104873. [Google Scholar] [CrossRef] [Scilit]
- Lei, Z.; Apollonio, F.I.; Gaiani, M. A Technique for Urban Color Mapping Starting from the Case Study of Marco Zanuso’s Collegio Di Milano. Sci. Res. Inf. Technol. 2021, 11, 17–32. [Google Scholar] [CrossRef]
- Gaiani, M.; Apollonio, F.I.; Ballabeni, A.; Remondino, F. Securing Color Fidelity in 3D Architectural Heritage Scenarios. Sensors 2017, 17, 2437. [Google Scholar] [CrossRef] [Scilit] [PubMed]
- Tyleček, R.; Ara, R.Š. Spatial Pattern Templates for Recognition of Objects with Regular Structure. In Proceedings of the 35th German Conference on Pattern Recognition (GCPR 2013), Saarbrucken, Germany, 3–6 September 2013. [Google Scholar]
- Wang, A.; Liu, L.; Chen, H.; Lin, Z.; Han, J.; Ding, G. YOLOE: Real-Time Seeing Anything. In Proceedings of the 2025 IEEE/CVF International Conference on Computer Vision (ICCV), Honolulu, Hawaii, 19–23 October 2025. [Google Scholar]
- Wei, J.; Hu, Y.; Zhang, S.; Liu, S. Irregular Facades: A Dataset for Semantic Segmentation of the Free Facade of Modern Buildings. Buildings 2024, 14, 2602. [Google Scholar] [CrossRef] [Scilit]
- Zhao, H.; He, L.; Cao, R.; Lu, Y. From Pattern to Position: Identifying Spatial Configuration Logic of Traditional Window Lattice Patterns in Zhaoyu Ancient City, China. Buildings 2026, 16, 3395. [Google Scholar] [CrossRef] [Scilit]
- Yi, H. The Application of Traditional Window Lattice Culture into Modern Interior Design. In Proceedings of the Proceedings of the 2018 8th International Conference on Management, Education and Information (MEICI 2018), Shenyang, China, 21–23 September 2018; Atlantis Press: Dordrecht, The Netherlands, 2018; pp. 606–611. [Google Scholar]
- Standard Practice for Specifying Color by the Munsell System. Available online: https://store.astm.org/d1535-14r23.html (accessed on 30 August 2026).
- Jocher, G.; Qiu, J.; Liu, M.; Lyu, S.; Akyon, F.C.; Kalfaoglu, M.E. Ultralytics YOLO26: Unified Real-Time End-to-End Vision Models. arXiv 2026, arXiv:2606.03748. [Google Scholar]
- Ramer, U. An iterative procedure for the polygonal approximation of plane curves. Comput. Graph. Image Process. 1972, 1, 244–256. [Google Scholar] [CrossRef] [Scilit]
- Douglas David, H.; Peucker Thomas, K. Algorithms for the Reduction of the Number of Points Required to Represent a Digitized Line or Its Caricature. Cartographica 1973, 10, 112–122. [Google Scholar] [CrossRef] [Scilit]
- Chen, Z.; Zhang, Z.; Wang, X.; Furuya, N. Interactive Contact Interface Elements and Correlations with Social Behavior in Historic Commercial Streets: A Study of Qushuiting Street, Jinan. J. Asian Archit. Build. Eng. 2025, 24, 3654–3679. [Google Scholar] [CrossRef] [Scilit]
- Zhang, R.; Martí Casanovas, M.; Bosch González, M.; Sun, S. Revitalizing Heritage: The Role of Urban Morphology in Creating Public Value in China’s Historic Districts. Land 2024, 13, 1919. [Google Scholar] [CrossRef] [Scilit]
- Liu, F.; Zhou, H.; Yang, C.; Tang, Y. Revisiting Functional Diversity: The Stratified Structure of Functions and Its Impact on Street Vitality. Buildings 2026, 16, 3018. [Google Scholar] [CrossRef] [Scilit]
- Wei, H.; Wang, G. Investigating the Spatiotemporal Pattern between Street Vitality in Historic Cities and Built Environments Using Multisource Data in Chaozhou, China. J. Urban Plan. Dev. 2024, 150, 05024027. [Google Scholar] [CrossRef] [Scilit]
- Wang, X.; Zhang, Y.; Yu, D.; Qi, J.; Li, S. Investigating the spatiotemporal pattern of urban vibrancy and its determinants: Spatial big data analyses in Beijing, China. Land Use Policy 2022, 119, 106162. [Google Scholar] [CrossRef] [Scilit]
- Fiss, P.C. Building Better Causal Theories: A Fuzzy Set Approach to Typologies in Organization Research. Acad. Manag. J. 2011, 54, 60263120. [Google Scholar] [CrossRef] [Scilit]
- Chan, E.T.H.; Schwanen, T.; Banister, D. The role of perceived environment, neighbourhood characteristics, and attitudes in walking behaviour: Evidence from a rapidly developing city in China. Transportation 2021, 48, 431–454. [Google Scholar] [CrossRef] [Scilit]
- Lu, B.; Liu, Q.; Liu, H.; Long, T. Exploring nonlinear and interaction effects of urban campus built environments on exercise walking using crowdsourced data. Front. Public Health 2025, 13, 1549786. [Google Scholar] [CrossRef] [Scilit] [PubMed]
- Ragin, C.C. Redesigning Social Inquiry: Fuzzy Sets and Beyond; University of Chicago Press: Chicago, IL, USA, 2009; ISBN 978-0-226-70279-7. [Google Scholar]
- Ragin, C.C.; Davey, S. Fuzzy-Set/Qualitative Comparative Analysis 4.0; Department of Sociology, University of California: Irvine, CA, USA, 2022. [Google Scholar]
- Ma, C.; Wang, H.; Wu, J.; Xue, C. Applying Gestalt Similarity to Improve Visual Perception of Interface Color Quantity: An EEG Study. Int. J. Ind. Ergon. 2024, 100, 103521. [Google Scholar] [CrossRef] [Scilit]
- Tao, D.; Ren, X.; Liu, K.; Mao, Q.; Cai, J.; Wang, H. Effects of Color Scheme and Visual Fatigue on Visual Search Performance and Perceptions under Vibration Conditions. Displays 2024, 82, 102667. [Google Scholar] [CrossRef] [Scilit]
- Andersen, E.; Maier, A. The Attentional Guidance of Individual Colours in Increasingly Complex Displays. Appl. Ergon. 2019, 81, 102885. [Google Scholar] [CrossRef] [Scilit] [PubMed]
- Beerendonk, L.; Mejías, J.F.; Nuiten, S.A.; de Gee, J.W.; Fahrenfort, J.J.; van Gaal, S. A disinhibitory circuit mechanism explains a general principle of peak performance during mid-level arousal. Proc. Natl. Acad. Sci. USA 2024, 121, e2312898121. [Google Scholar] [CrossRef] [Scilit] [PubMed]
- Yerkes, R.M.; Dodson, J.D. The Relation of Strength of Stimulus to Rapidity of Habit-Formation. J. Comp. Neurol. Psychol. 1908, 18, 459–482. [Google Scholar] [CrossRef] [Scilit]
- Yahia, M.W.; Mushtaha, E.; Yassin, S.A.; AlFoudari, K.A.; Atoum, Y.A.; Opoku, A.; Dirar, S.; Maksoud, A.M. Cohousing Design Guidelines for Better Social Integration in the United Arab Emirates. Front. Built Environ. 2023, 9, 1155179. [Google Scholar] [CrossRef] [Scilit]
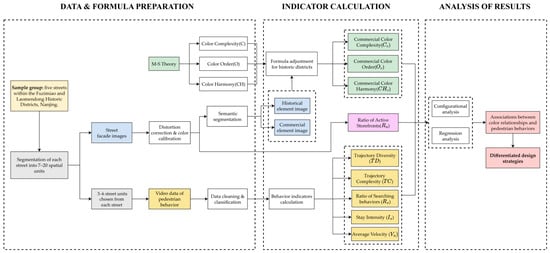
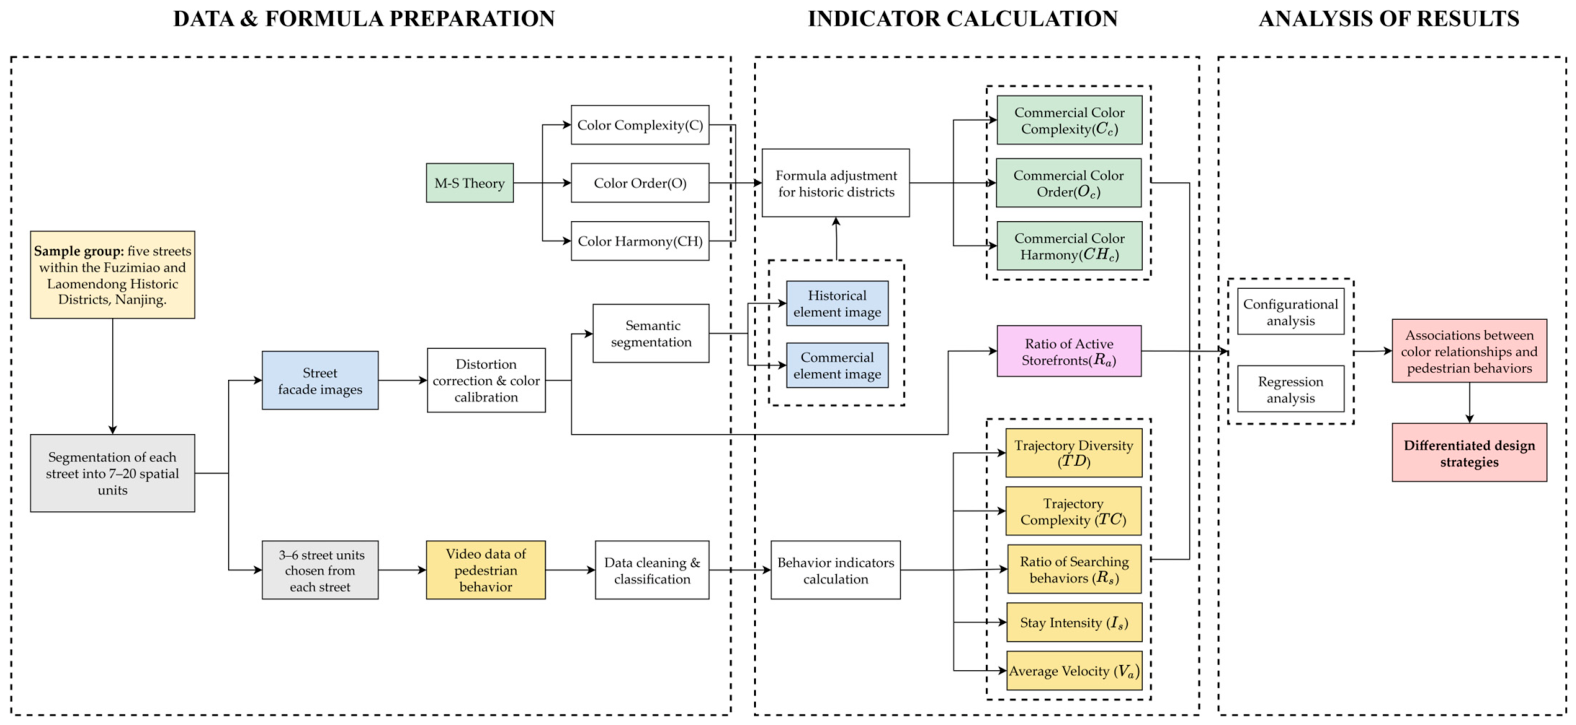
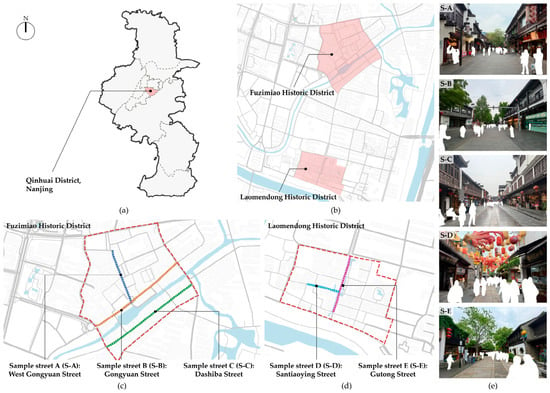
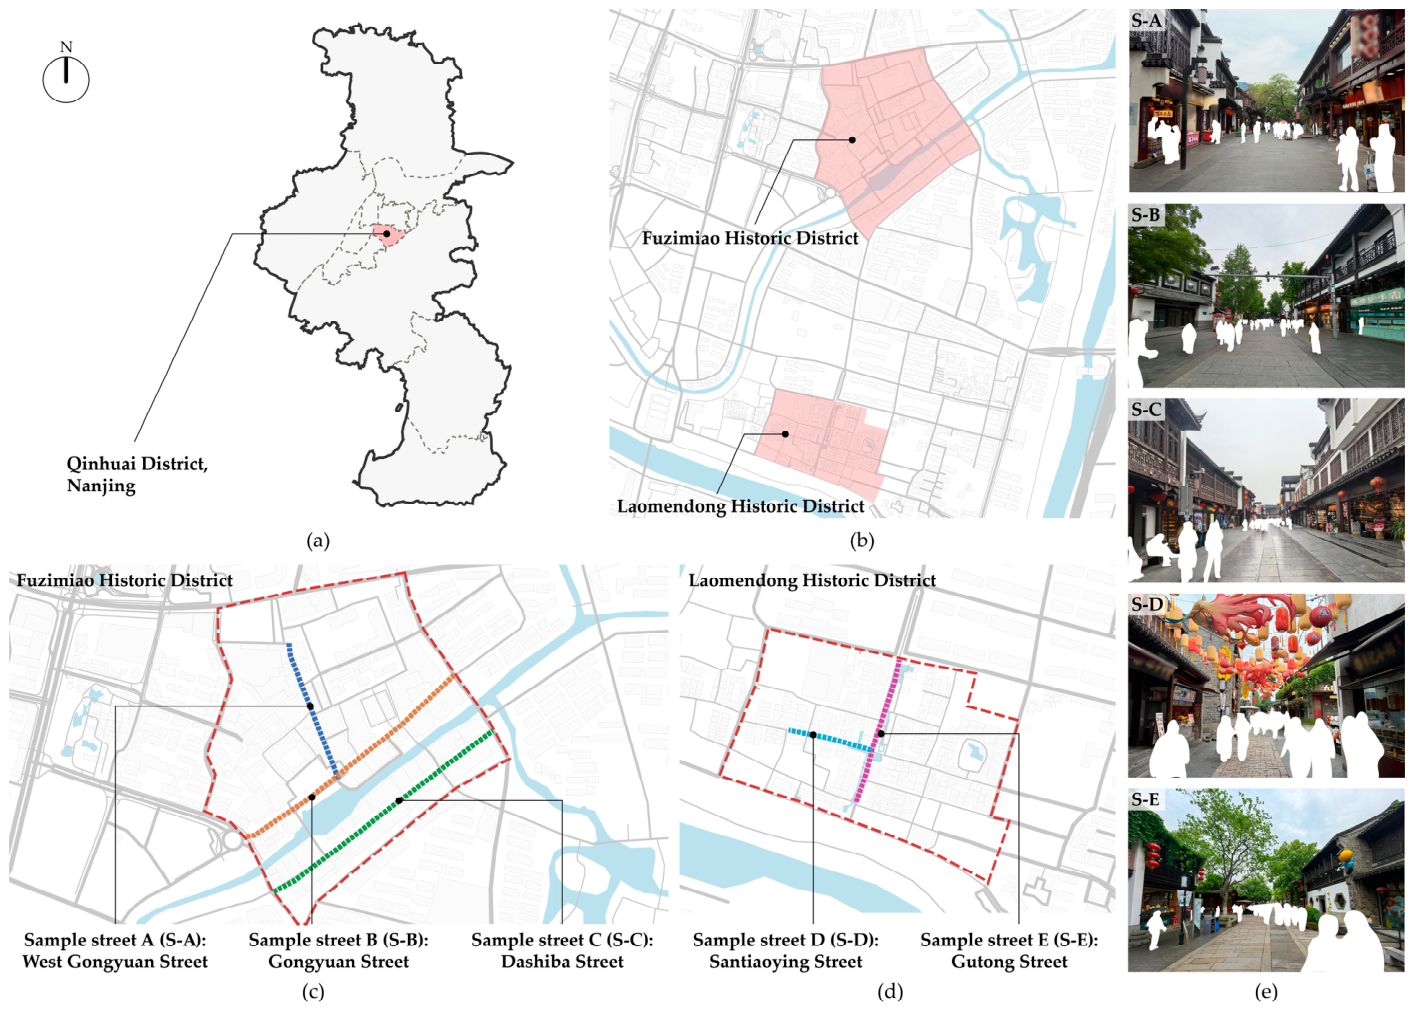
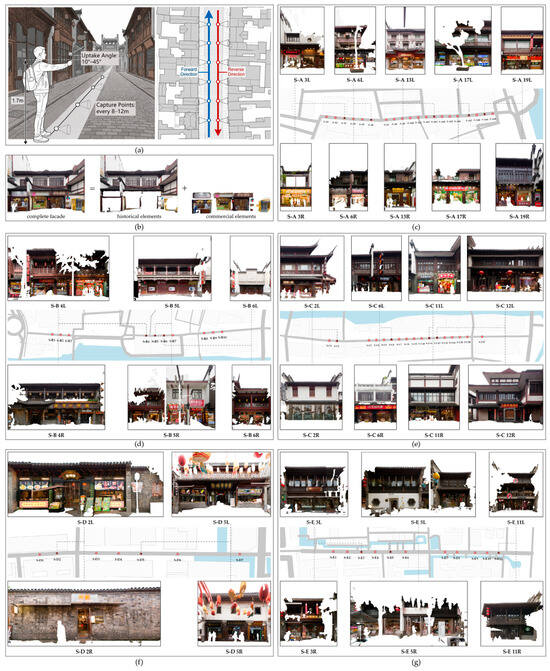
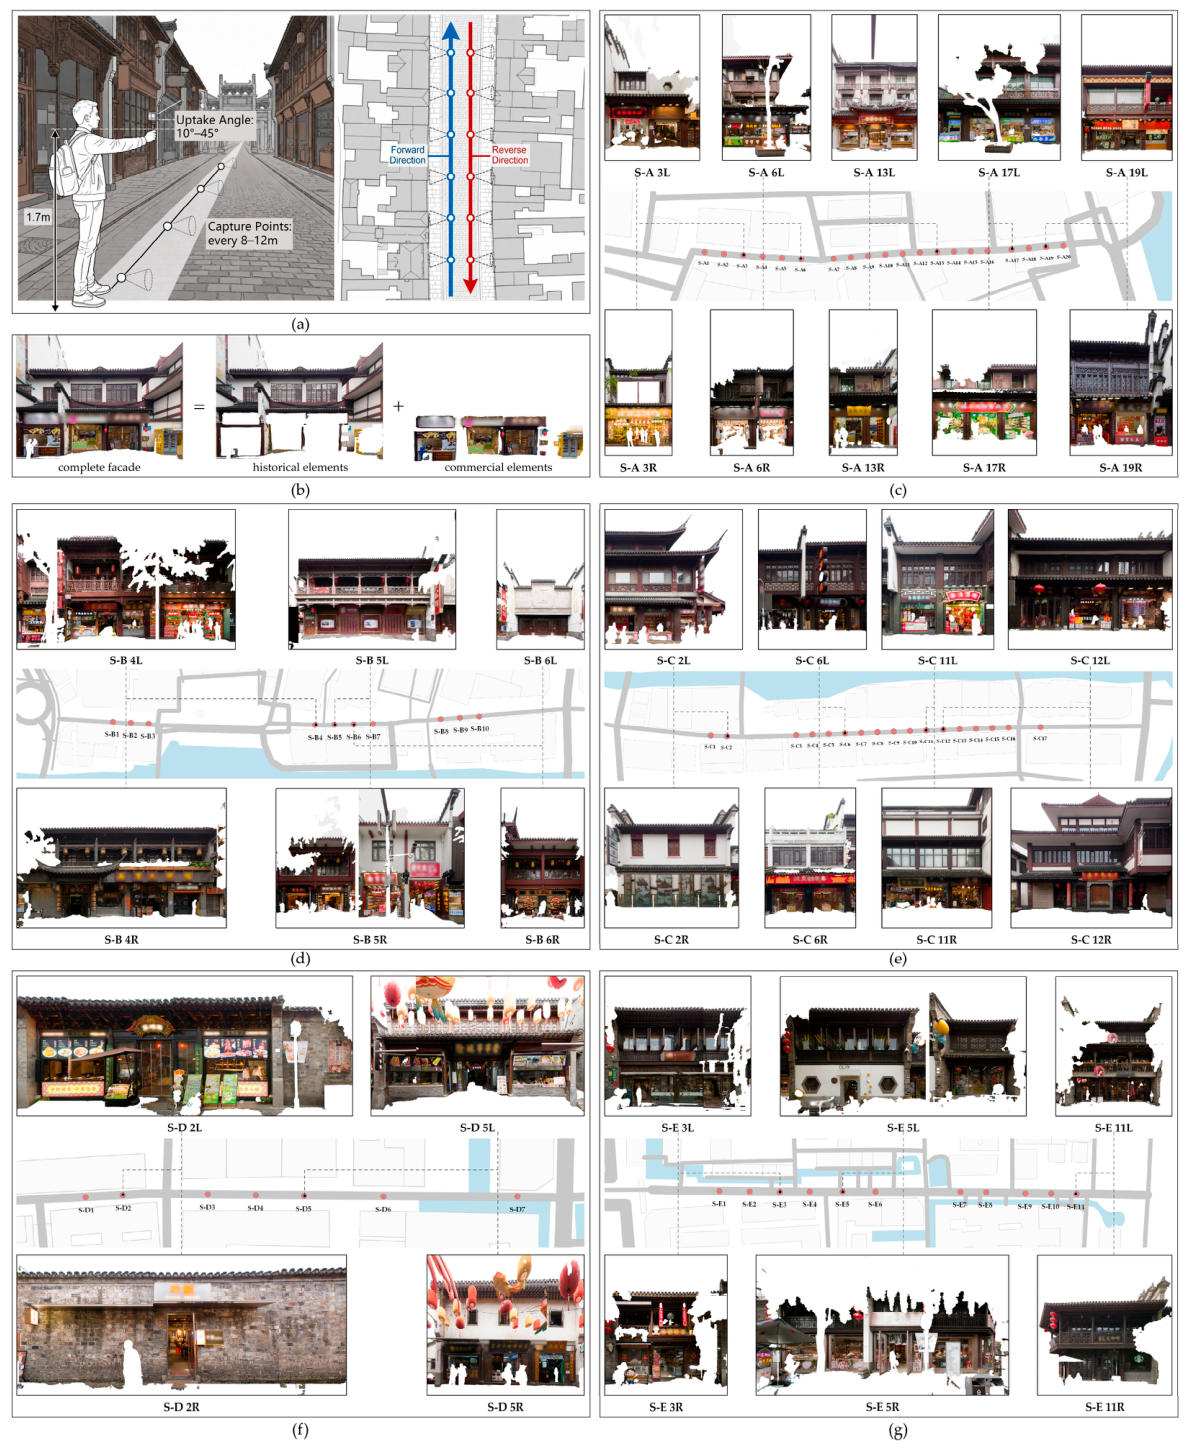
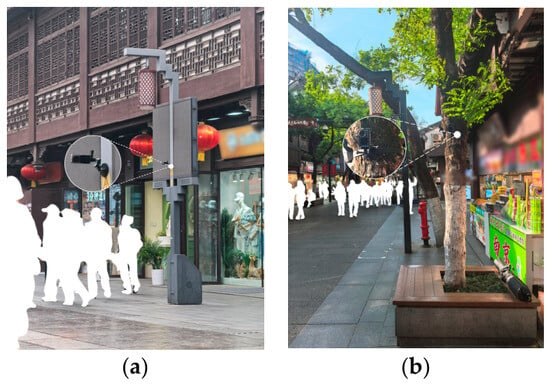
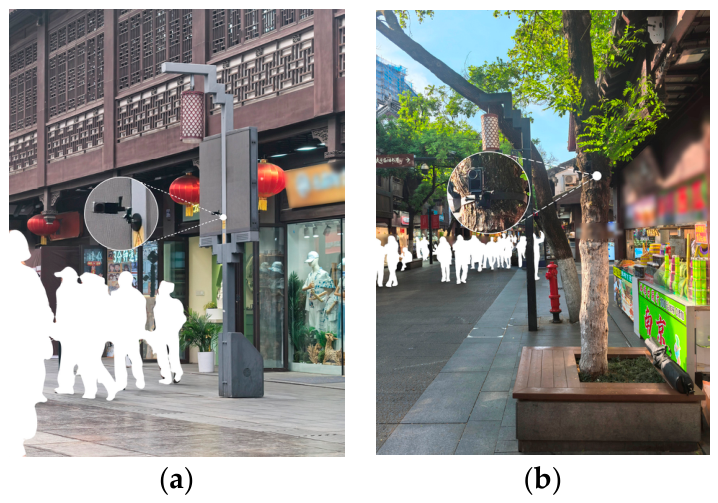
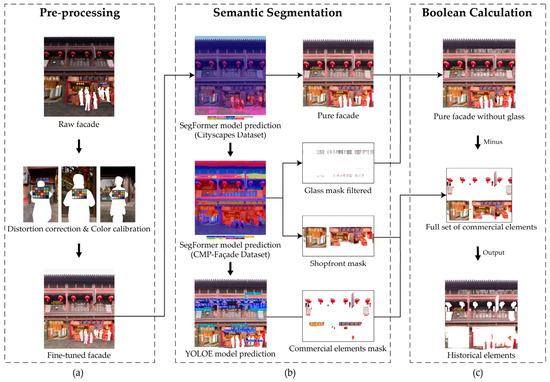
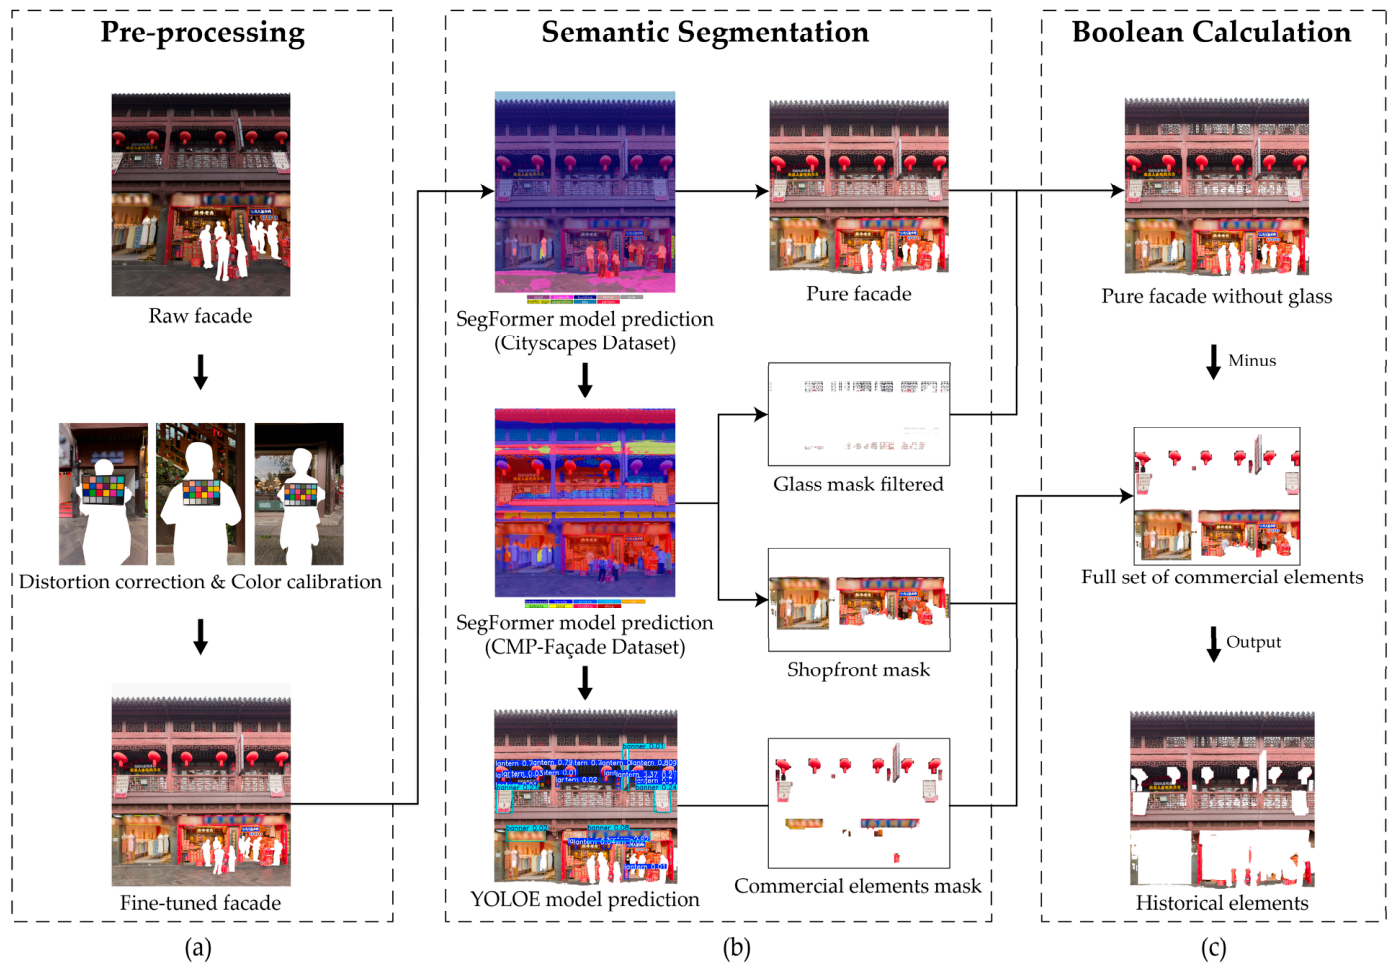
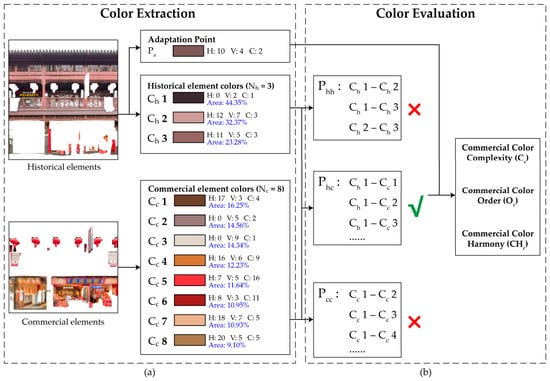
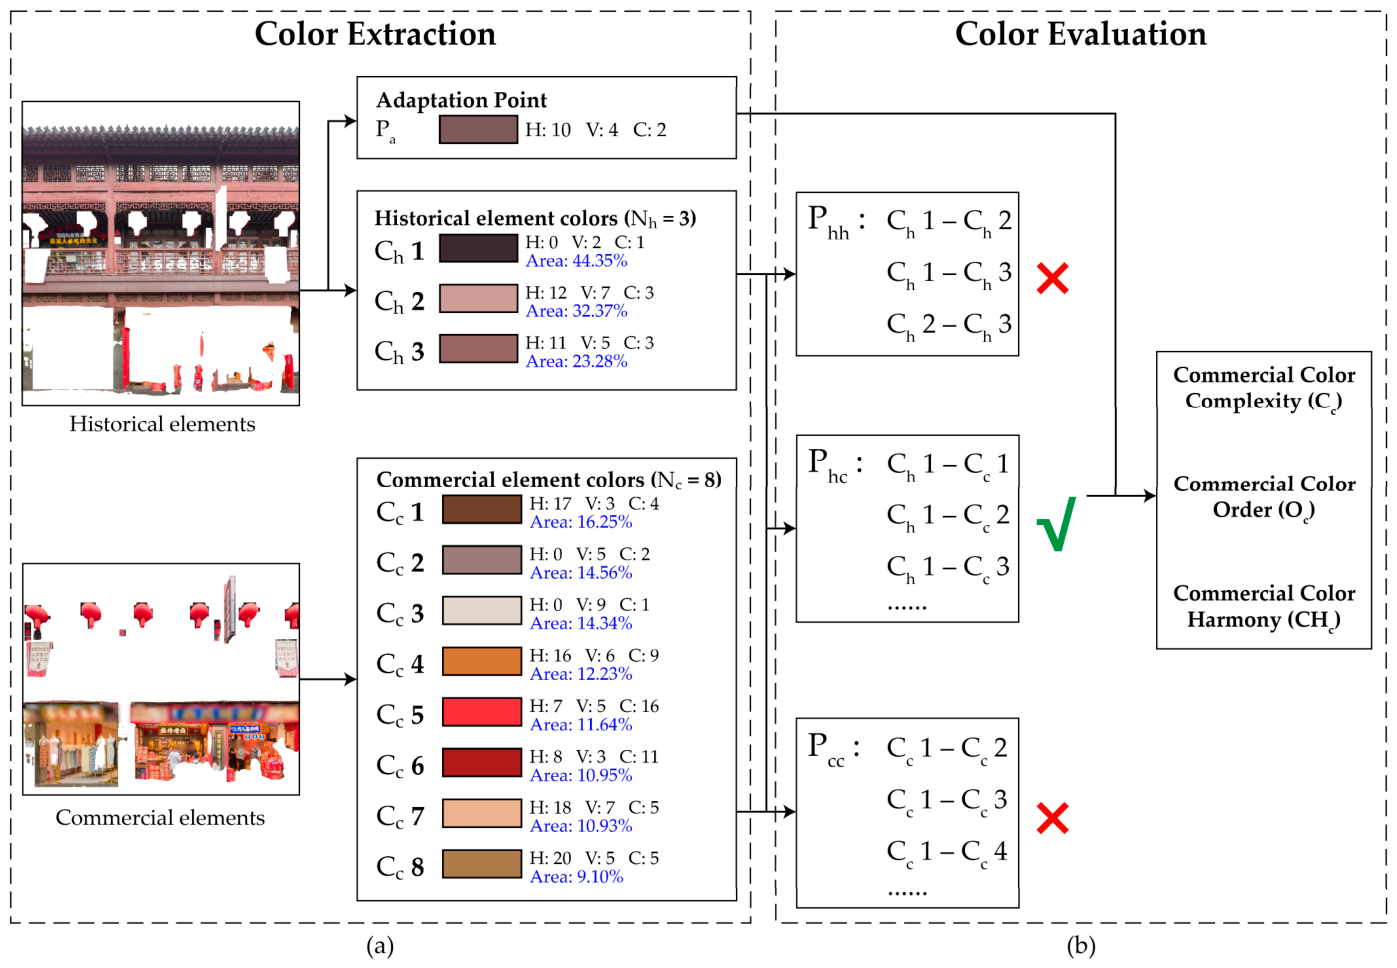
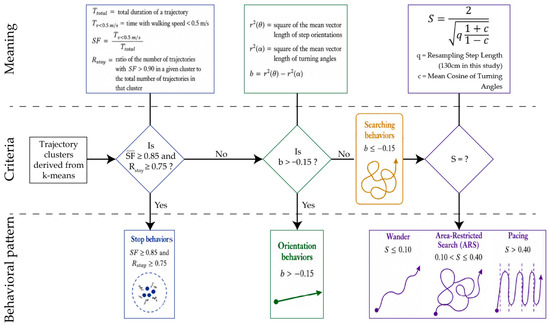
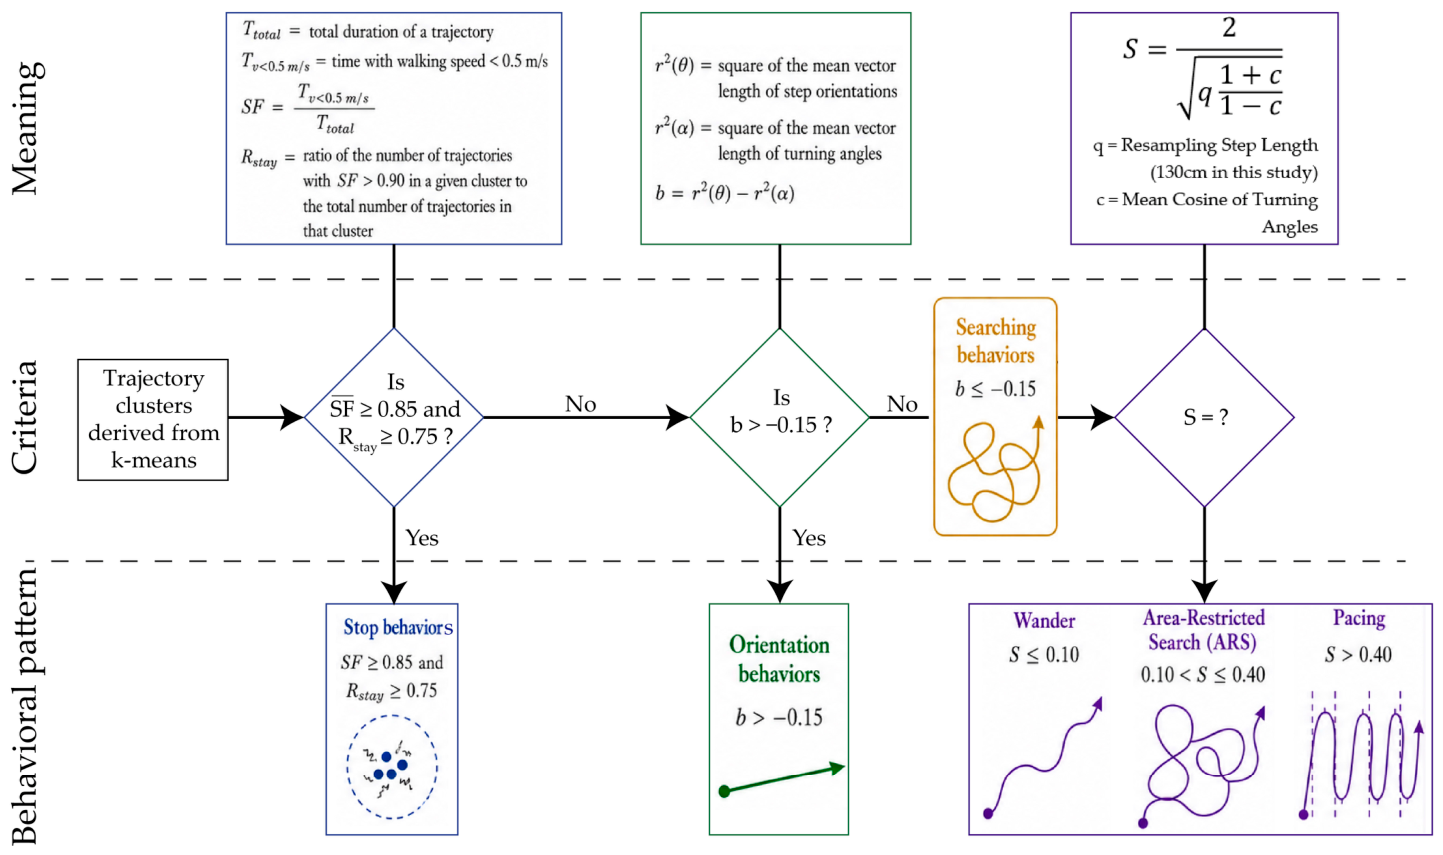
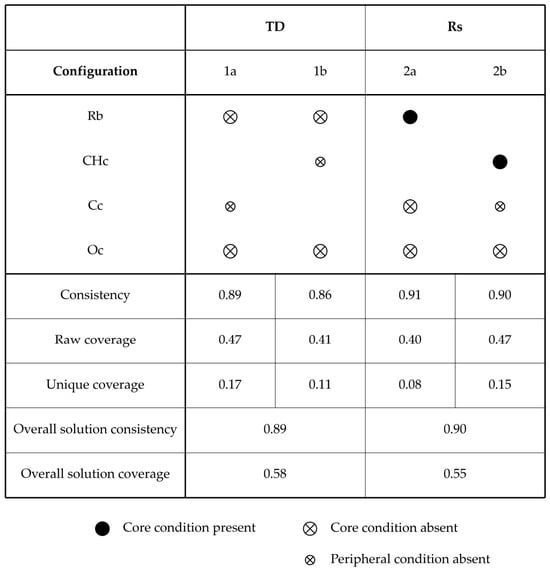
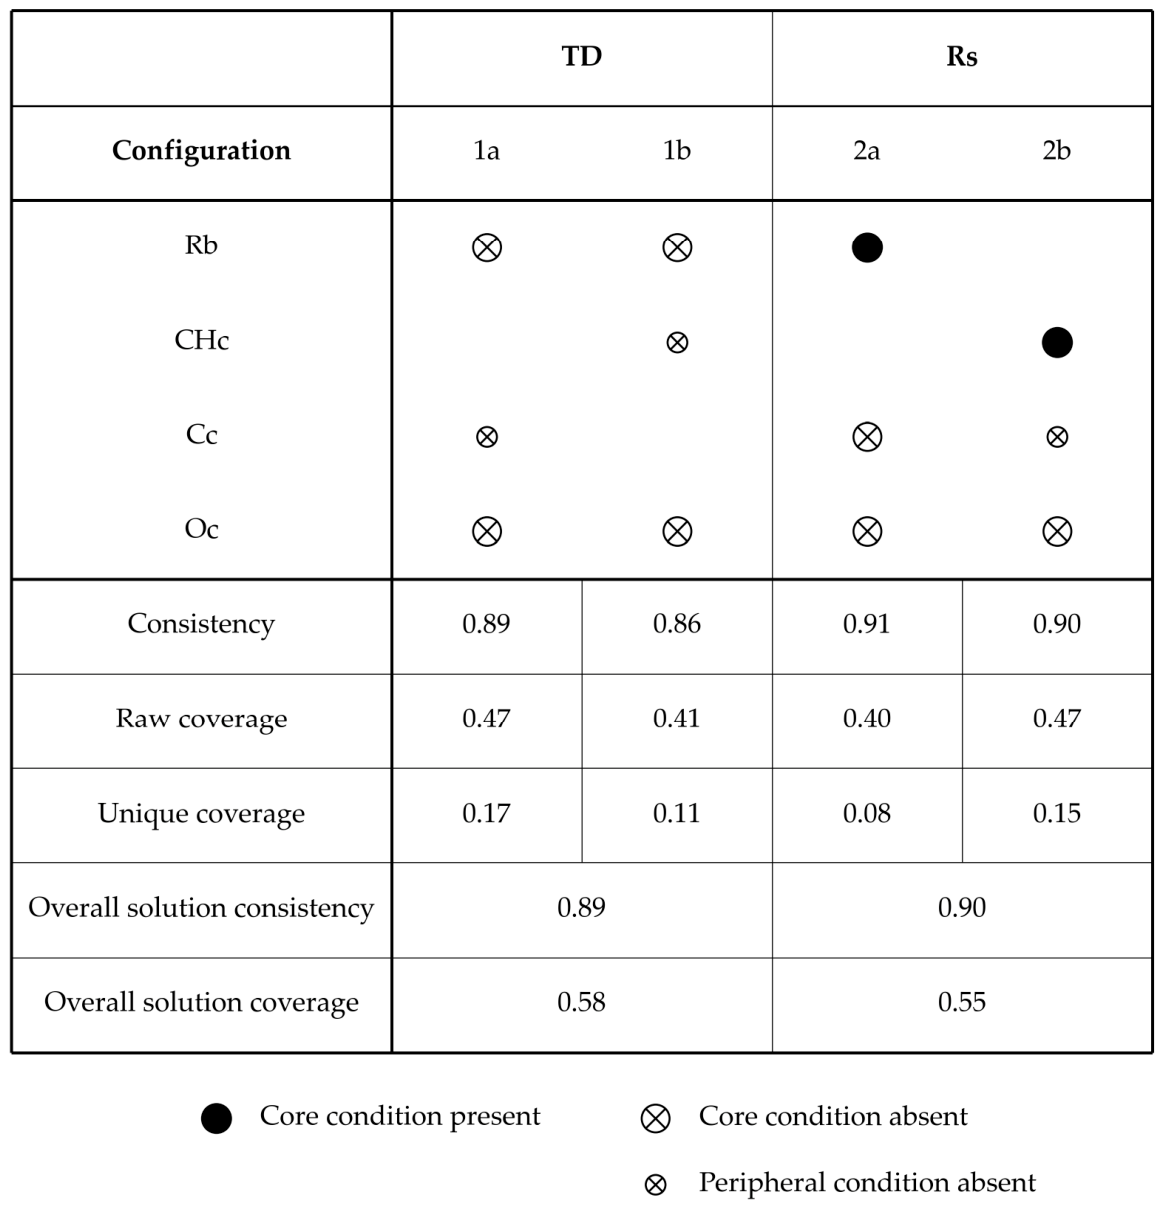
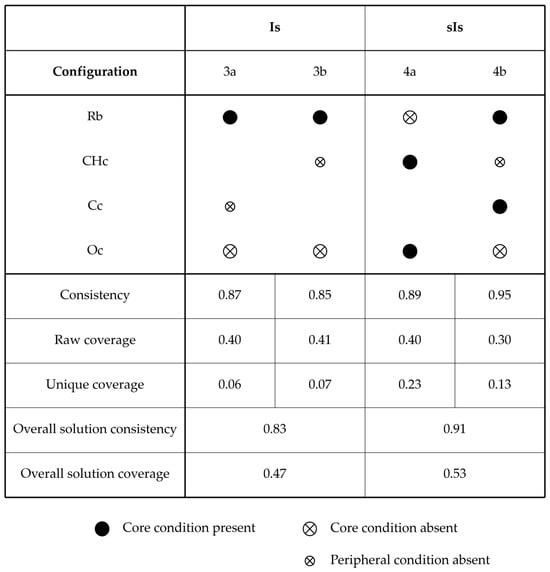
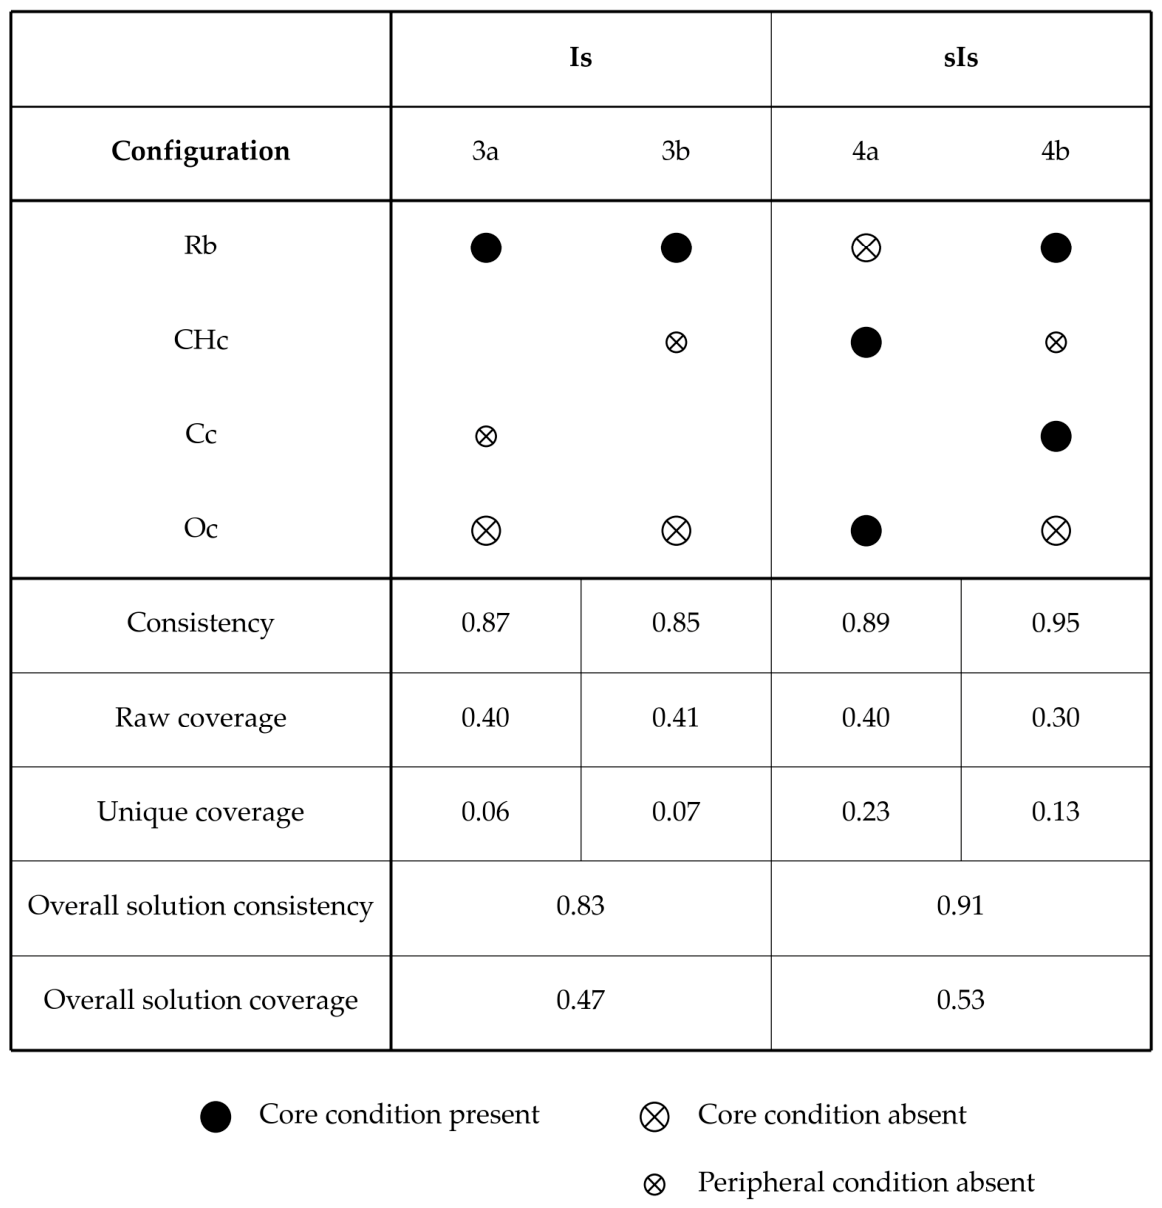
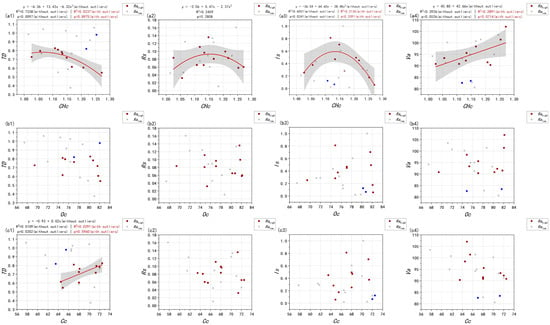
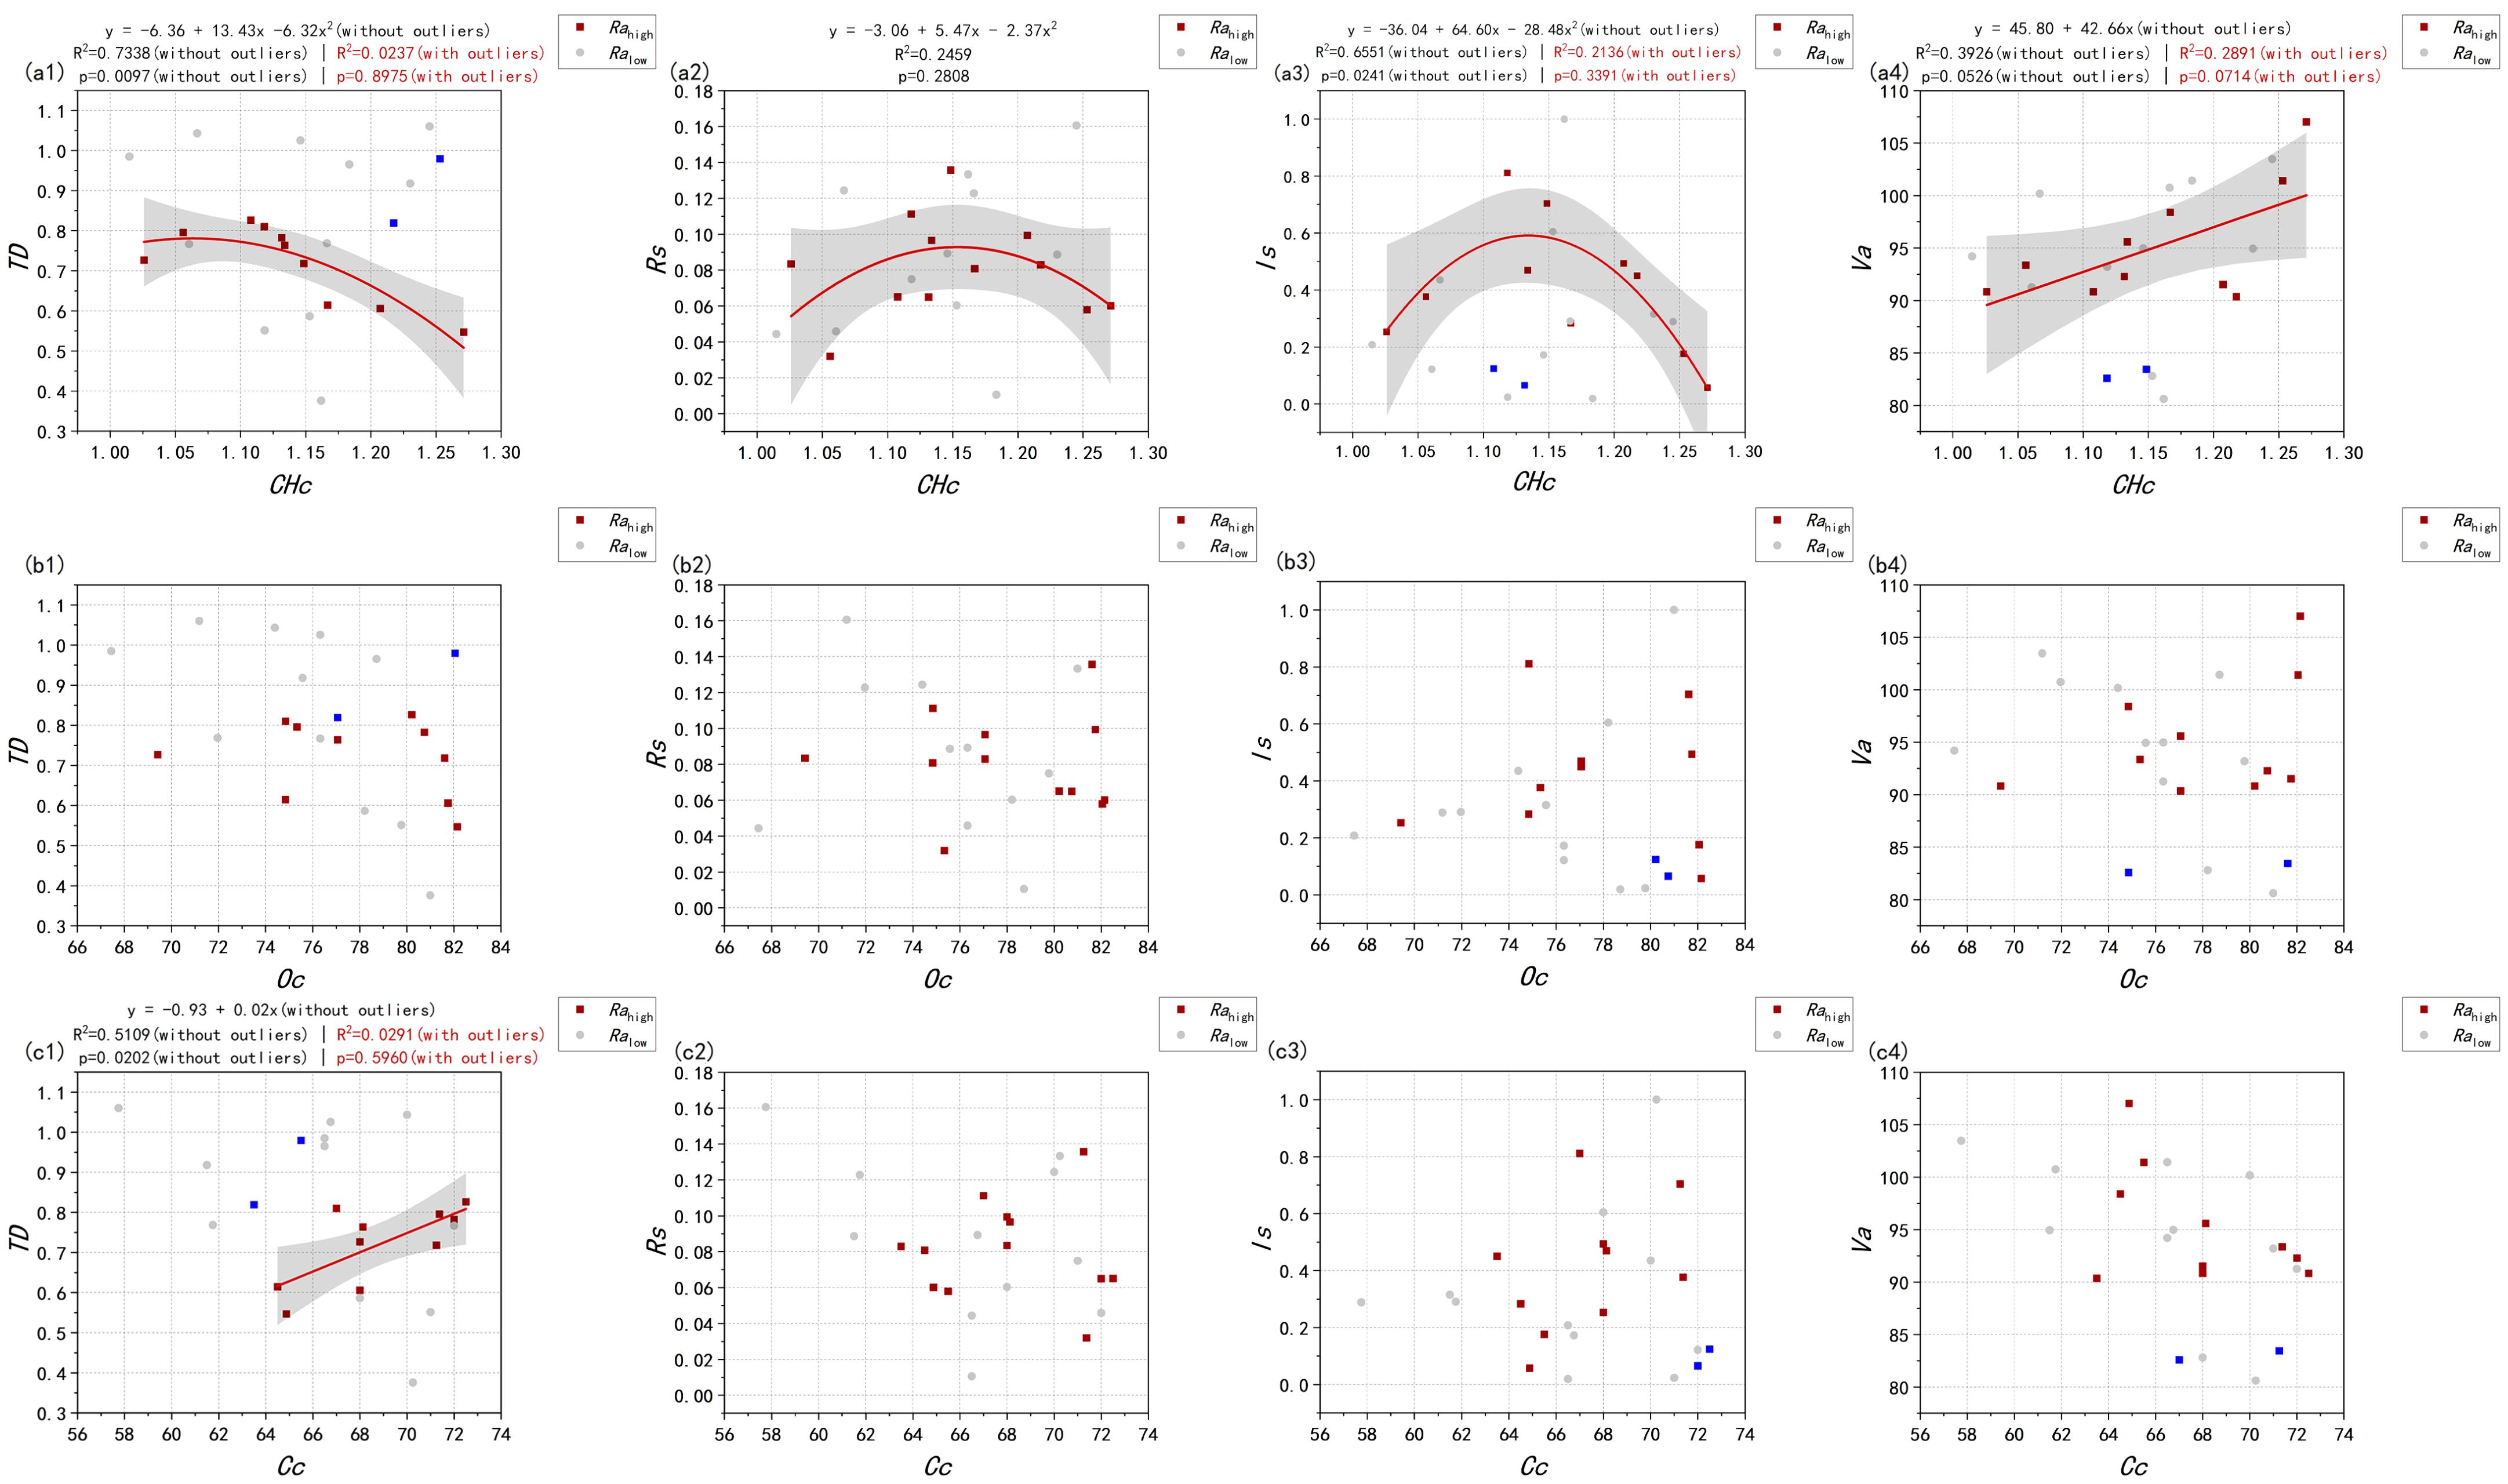
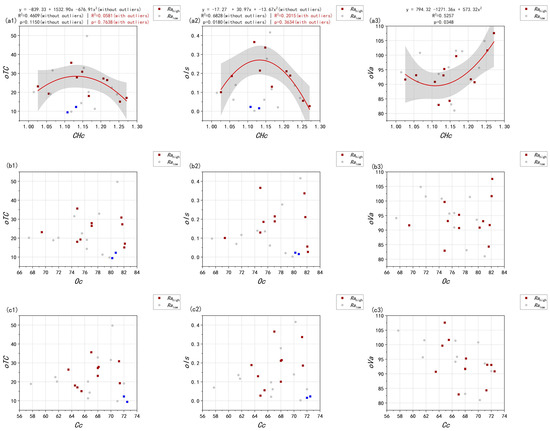
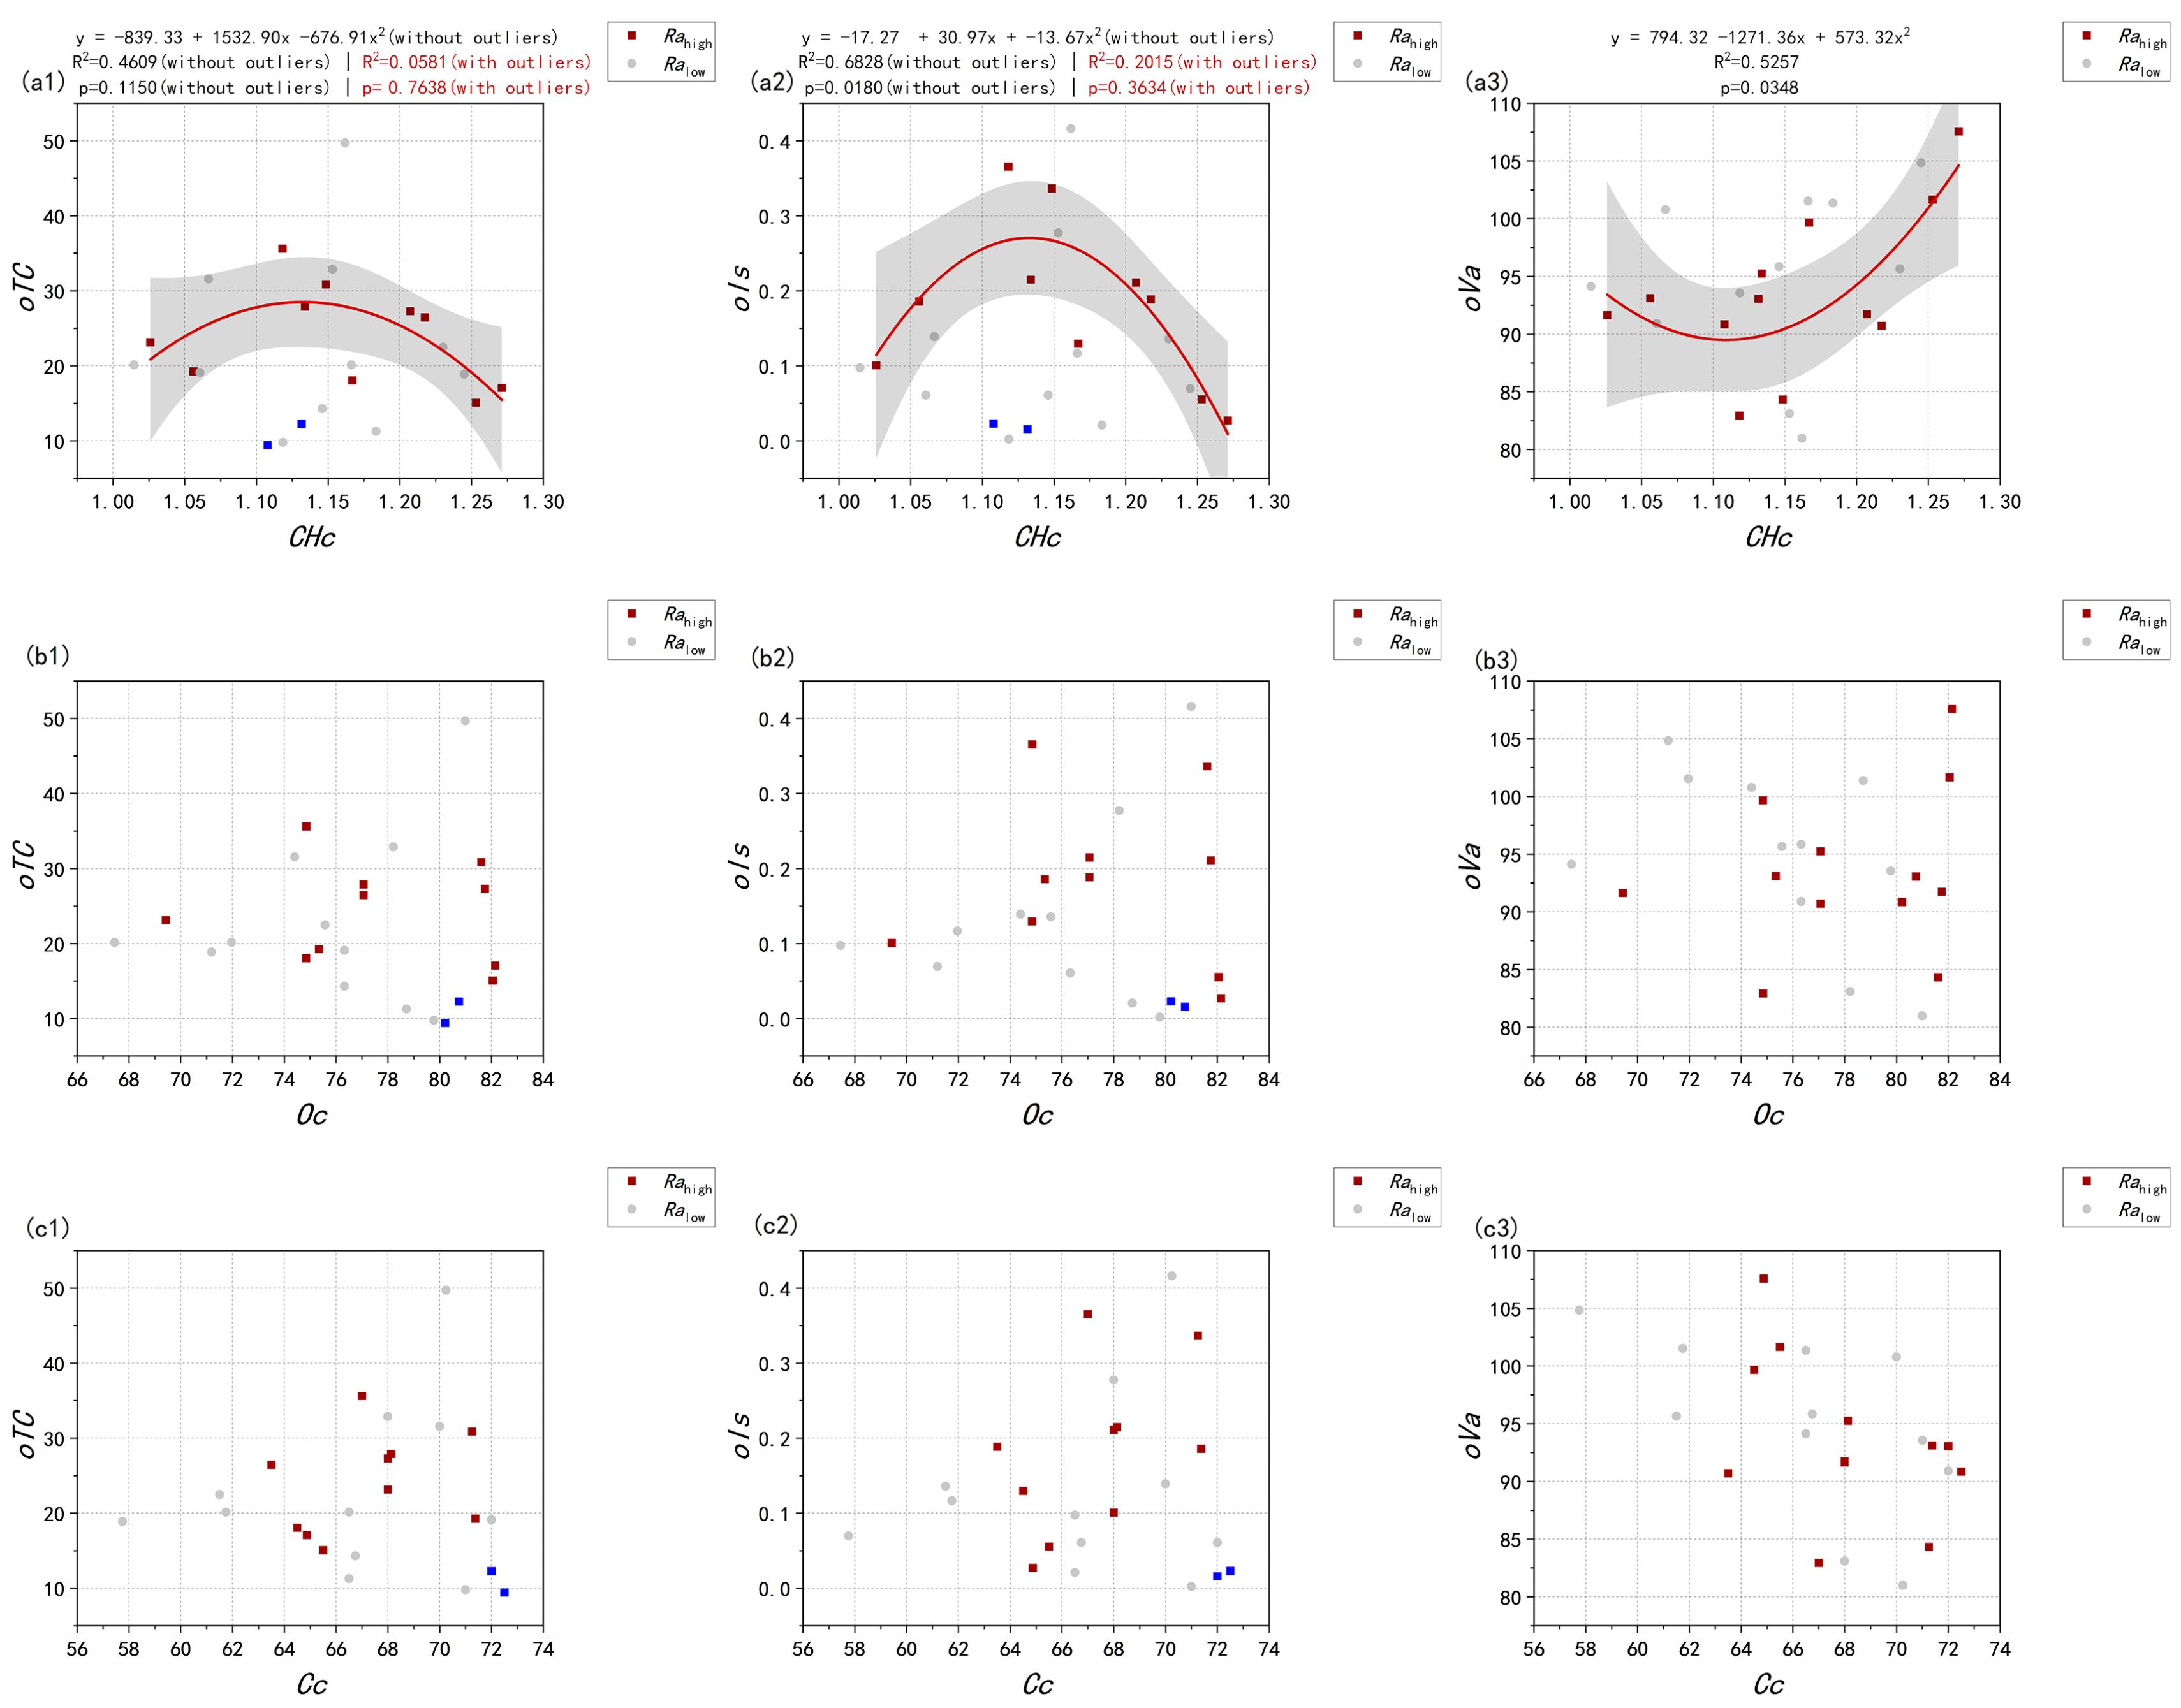
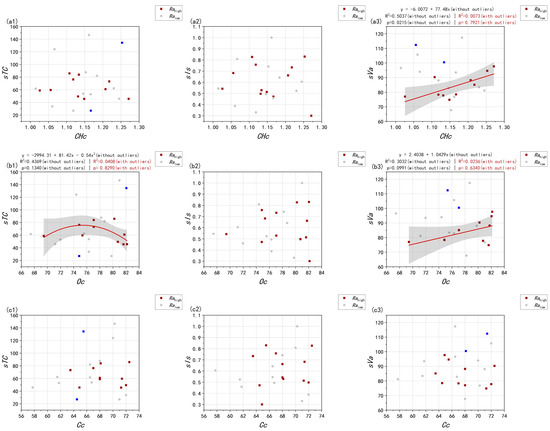
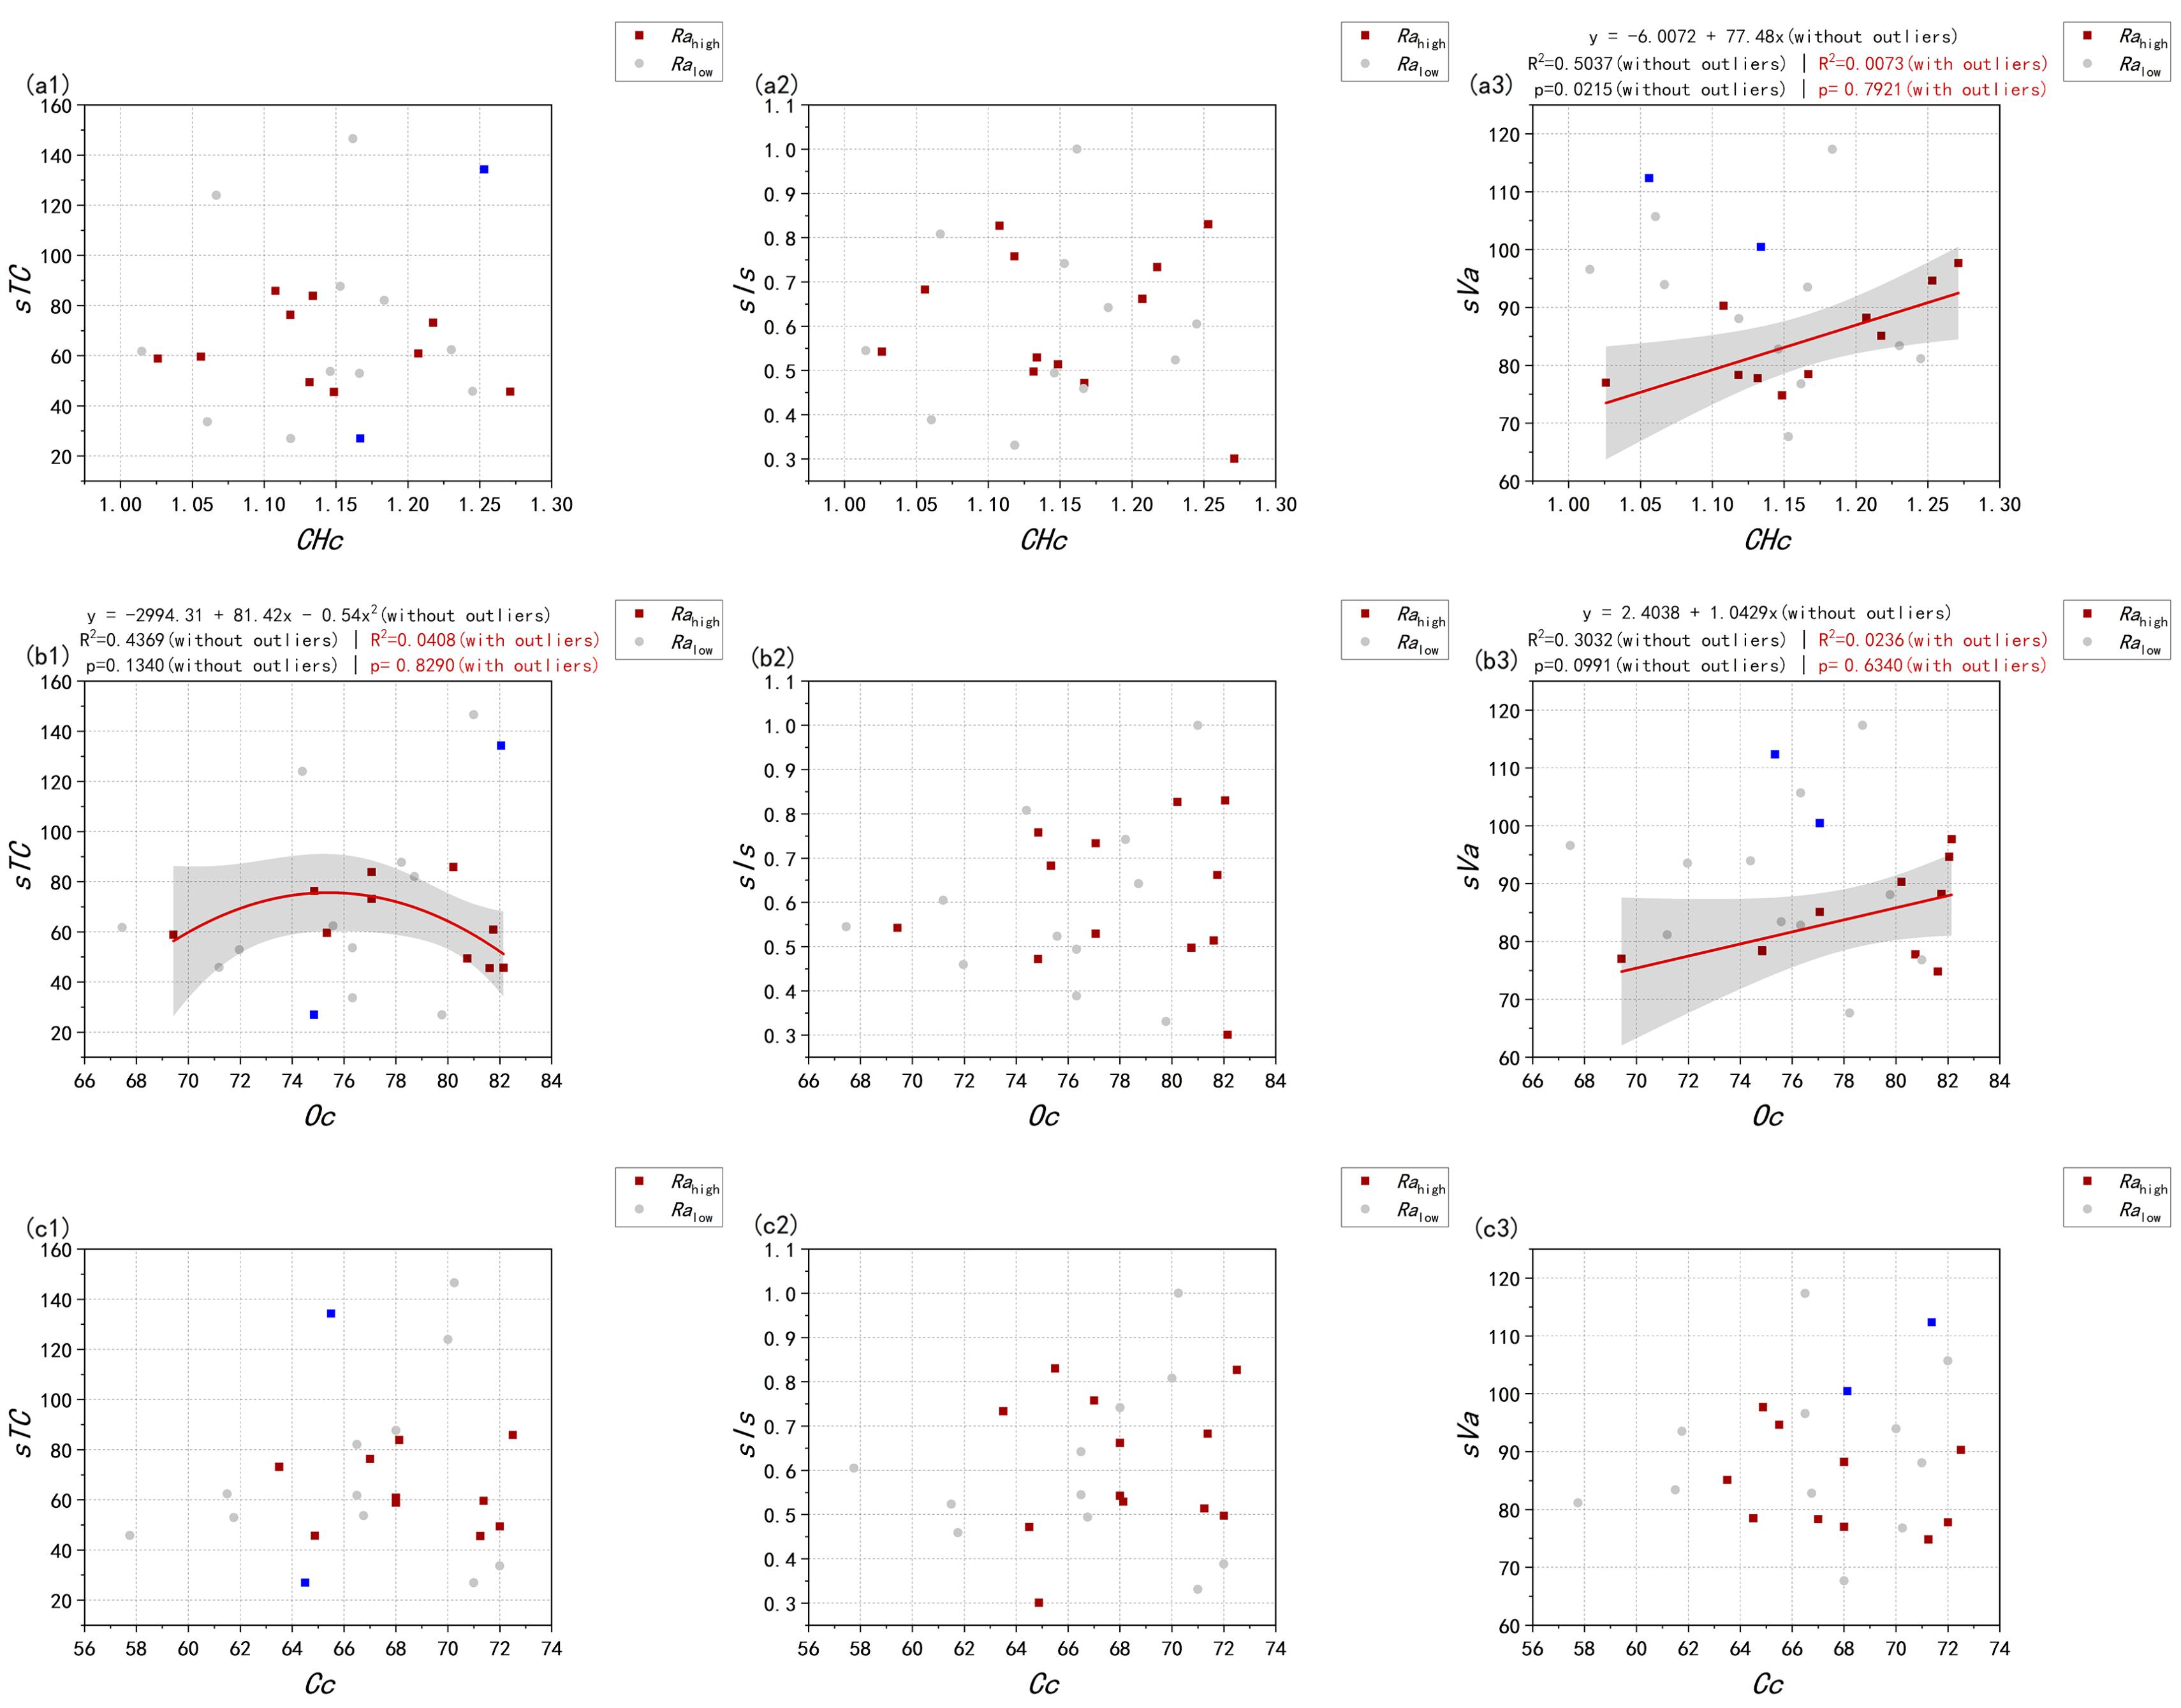
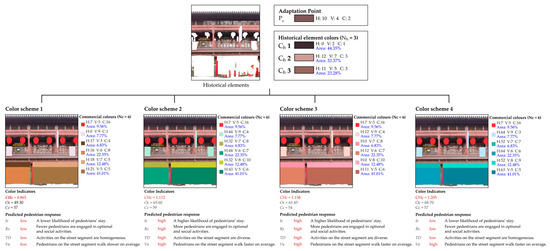
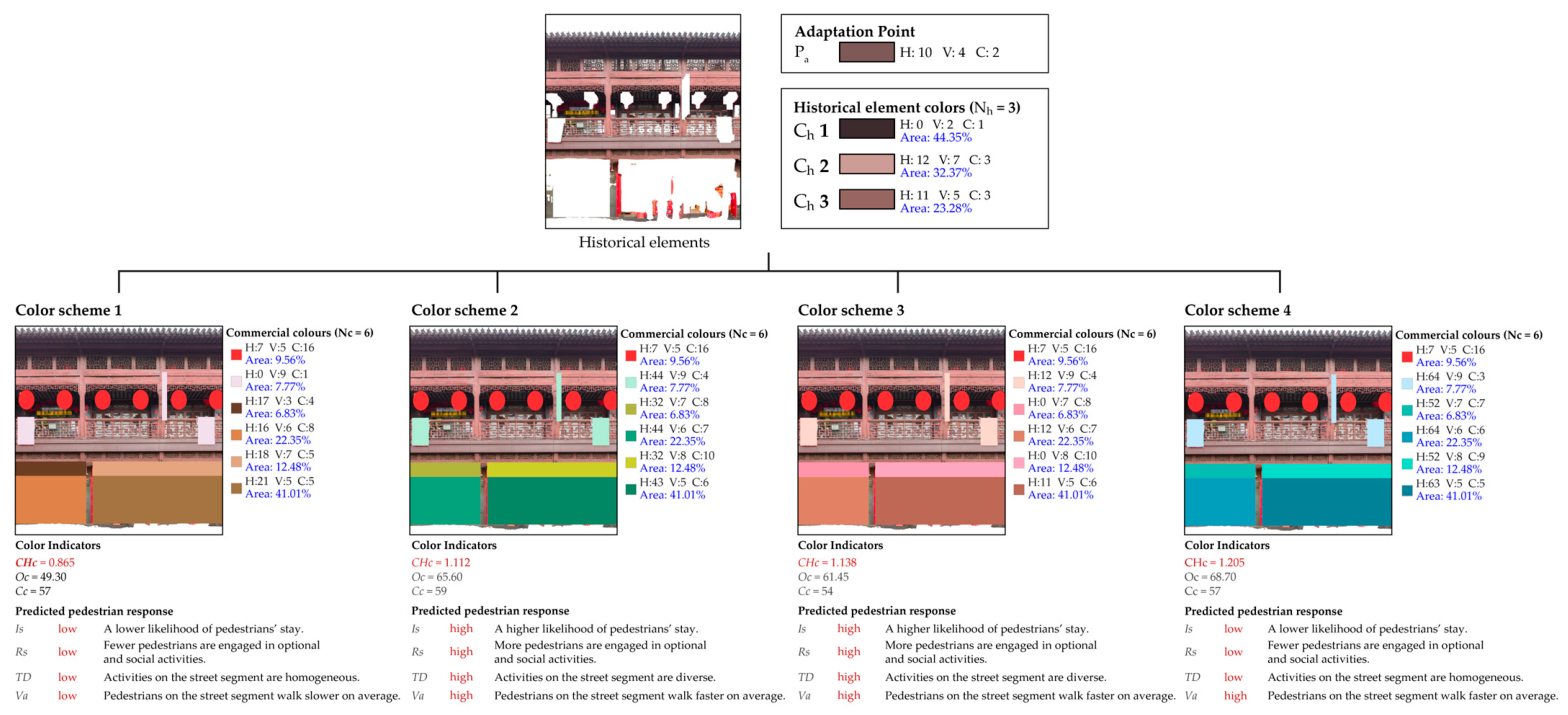

Disclaimer/Publisher’s Note: The statements, opinions and data contained in all publications are solely those of the individual author(s) and contributor(s) and not of MDPI and/or the editor(s). MDPI and/or the editor(s) disclaim responsibility for any injury to people or property resulting from any ideas, methods, instructions or products referred to in the content. |
© 2026 by the authors. Licensee MDPI, Basel, Switzerland. This article is an open access article distributed under the terms and conditions of the Creative Commons Attribution (CC BY) license.