


Abstract
Digital technology is profoundly transforming the experiential landscape of tourism. However, its application does not necessarily produce cultural experiences, creating a critical bottleneck that constrains the sustainable development of the cultural tourism industry and broader societal culture. To address this gap, this study introduces psychological ownership theory as an overarching explanatory framework. It constructs and validates an integrated model that examines how digital technology characteristics (interactivity and innovativeness) influence cultural experience through three parallel mediating pathways: cognitive evaluation (perceived usefulness and ease of use), scenario construction, and flow experience. Based on 540 visitor questionnaires, structural equation modeling validated the theoretical model. Findings reveal that the interactivity and innovation of digital technology jointly stimulate visitors’ psychological ownership through three parallel pathways. Specifically, technological innovativeness exhibited the strongest effect on perceived ease of use (β = 0.387, p < 0.001), while the indirect effect via the flow experience path was also significant (effect size = 0.036). This process stimulates visitors’ psychological ownership, ultimately leading to cultural experiences. The study systematically reveals the pathways through which digital technology empowers cultural experiences across three dimensions: as a rational tool, an emotional narrative medium, and an intrinsic psychological catalyst. It highlights that strategically allocating technological resources to cultivate visitors’ psychological ownership is crucial for driving high-quality industrial development. Furthermore, the research offers significant implications for cultural sustainability, suggesting that such internally motivated identification provides a more effective foundation for the living transmission of culture and socio-cultural sustainability than external regulations or imposed norms.
1. Introduction
The digital economy is reshaping industrial structures [1], shifting them beyond the standardized, scaled models of the industrial era toward a new phase centered on personalization, service orientation, and experiential value. Within this transition, the cultural and tourism sector, central to the experience economy [2], has gained prominence while undergoing significant shifts in value-creation models and industrial forms [3]. This shift is evident in the widespread application of digital technologies such as virtual reality (VR), augmented reality (AR), holographic projection, and interactive installations in tourism performances [4,5]. which are evolving from traditional formats into immersive experience-driven models [3]. However, it is essential to clarify that technology represents only the visible force driving this transformation. As a key arena for integrating cultural heritage with tourism consumption [5], the long-term development of tourism performances relies not only on generating economic benefits but, more fundamentally, on attaining social and cultural sustainability. This objective ultimately rests on the construction of cultural identity, which constitutes the core psychological foundation of sustainable tourism [5]. However, current practice often encounters the dilemma of “high investment, low experience.” A significant efficiency gap exists between intensive technological input and the generation of cultural identity [6], meaning that high investment does not necessarily translate into high-quality experience. This paradox underscores a critical gap between the economic cost of technological adoption and its experiential and cultural return. While prior research has begun to examine the economic returns or consumer behavioral intentions (e.g., revisit, recommendation) driven by smart tourism technologies [7], few studies delve into the specific mechanisms that translate technological features into cultural value, the very outcome that justifies long-term investment and ensures socio-cultural sustainability in heritage-focused contexts like tourism performances. Without understanding these mechanisms, investments risk being inefficient, focusing on technological spectacle rather than cultural resonance, and failing to achieve a sustainable return on investment (ROI) that encompasses both economic and cultural dimensions [8].
Theoretical clarification of this question is essential. Extant research affirms the value of digital technology (e.g., VR/AR, intelligent systems) in enhancing general tourism experiences by boosting immersion, satisfaction, and information efficiency [2,9,10]. However, a significant gap emerges when focusing on tourism performances, where the paramount objective is the transmission and internalization of cultural identity [11]. Most studies either examine generic tourism services [12] or emphasize technology’s instrumental attributes (e.g., utility, entertainment) without explicating the psychological mechanisms that translate technological stimuli into profound cultural experiences [13]. This leaves a critical black box: how do digital characteristics ultimately foster a sense of cultural belonging?
This theoretical shortcoming is evident when examining three relevant yet individually insufficient theoretical lenses: The Technology Acceptance Model (TAM) effectively explains adoption via perceived usefulness and ease of use [14,15], yet its focus on rational cognition overlooks the emotional resonance and identity formation central to cultural experiences [16,17]. A technology can be deemed “useful” without fostering cultural identification. Servicing Scenario Theory addresses environmental impact [18] but traditionally prioritizes static physical cues [19], underplaying digital technology’s role as a dynamic narrative medium crucial for storytelling in performances [20,21]. Scenarios lacking narrative depth fail to elicit deep cultural engagement. Flow Theory delineates the state of optimal experience [22], but its link to enduring cultural identity remains theoretically underdeveloped [23]. A visitor may achieve flow through technology without that state translating into lasting cultural connection.
Collectively, these theories suffer from explanatory discontinuities in the tourism performance context. TAM addresses the “cognitive why” of use, Scenario Theory the “environmental how,” and Flow Theory the “psychological state,” but none fully captures the journey from technology exposure to cultural internalization. An integrated framework is needed to link technological stimuli, multi-dimensional mediating processes, and deep experiential outcomes.
To bridge this gap, this study introduces Psychological Ownership (PO) Theory as a powerful integrative and explanatory lens [24]. PO theory posits that individuals develop a sense of “mine-ness” through control over and intimate knowledge of a target [25]. This directly parallels the desired outcome in tourism performances: visitors gaining control over their experience and deep understanding of cultural content, thereby cultivating a personal sense of belonging [26]. While PO itself is a complex latent state, its core tenets provide a robust rationale for why specific, measurable pathways should be effective. We argue that digital technology can foster the precursors of PO, which is control, intimate knowledge, and self-investment, through three distinct avenues: the cognitive evaluation path (via TAM, offering control and understanding), the scenario construction path (offering narrative self-investment), and the flow experience path (offering immersive control and focus). Prior research has often examined these dimensions—technology, experience, performance—in isolation [27,28,29], leading to fragmented understanding and practical guidance [30].
Therefore, synthesizing these elements, this study constructs and empirically tests a “Three-Path Mediation Model” using PO theory as its explanatory foundation. The model proposes that digital technology characteristics (interactivity and innovativeness) enhance cultural experience through three parallel mediators: cognitive evaluation (perceived usefulness/ease of use), scenario construction, and flow experience. This design aims to achieve three objectives:
- (1)
- To propose an integrated framework that uses PO theory to interpret the efficacy of the three paths;
- (2)
- To empirically validate the parallel mediating roles of these cognitive, narrative, and psychological pathways;
- (3)
- To derive actionable insights for managing and designing technology-enhanced performances.
The core research question is: How do the interactivity and innovativeness of digital technology in tourism performances jointly drive visitors’ cultural experience through the parallel mechanisms of cognitive evaluation, scenario construction, and flow experience? By testing this model with data from 540 visitors, we aim to provide a systematic explanation for the technology to experience transformation [31], contributing to both theory and the practice of sustainable cultural tourism [32].
2. Theoretical Analysis and Research Hypotheses
2.1. Theoretical Positioning and Focal Technology Characteristics
This study positions Psychological Ownership (PO) theory as the overarching explanatory framework for understanding how digital technology fosters deep cultural experiences. PO posits that feelings of ownership arise from control, intimate knowledge, and self-investment [25]. Instead of measuring PO directly as a mediator, a complex endeavor with cross-sectional data, we derive from its core tenets three measurable, parallel pathways that serve as its proximate antecedents and operational manifestations in the tourism performance context. Within this PO-informed framework, we focus on two fundamental characteristics of digital technology: interactivity and innovativeness [33]. This focus is justified on both theoretical and contextual grounds:
- (1)
- Theoretical Grounding: Interactivity is a primary affordance of digital media that directly shapes user control and agency, a cornerstone of PO [34]. Innovativeness, reflecting novelty and “relative advantage” [35], is key to creating the compelling challenges and novel stimuli that foster deep cognitive/emotional engagement (intimate knowledge) and self-investment.
- (2)
- Contextual Relevance to Tourism Performances [36]: In live, narrative-driven performances, the critical gap lies not in delivering static information but in transforming passive spectators into active participants. Interactivity is central to this role transformation, enabling co-creation. Innovativeness is crucial for transcending physical limits and creating the “wow” factor that underpins immersive, memorable narrative spaces [37]. While other characteristics (e.g., personalization, presence) are valuable, we argue that interactivity and innovativeness are more foundational, second-order drivers that enable many specific features and are most directly aligned with the PO mechanisms critical for deep cultural engagement in this setting.
2.2. Hypotheses Development
Building upon the theoretical positioning outlined above, we develop a set of hypotheses that delineate the three parallel pathways, cognitive, narrative, and psychological, through which digital technology characteristics are proposed to influence cultural experience, along with their potential direct effects.
This pathway elucidates the mechanism rooted in instrumental rationality and ease of use. Grounded in the Technology Acceptance Model (TAM) [38], it posits that the external attributes of technology shape key cognitive beliefs, which are fundamental precursors to the sense of control and understanding emphasized by psychological ownership theory.
The interactivity of digital technology empowers users with real-time control and feedback, transforming information acquisition into an efficient and agentic process [39]. This enhancement of experiential goals directly bolsters perceived usefulness. Simultaneously, an intuitive interface reduces operational effort, thereby reinforcing perceived ease of use. Similarly, technological innovativeness offers a relative advantage by creating unique value, which heightens perceived usefulness. Well-designed innovation also aims to simplify interaction logic, thus enhancing perceived ease of use [40]. These activated cognitive states are critical: perceived ease of use grants a sense of control, while perceived usefulness fosters a deeper understanding of cultural content—both being core antecedents to a psychological sense of ownership. Consequently, we hypothesize that heightened perceived usefulness and perceived ease of use will support a more profound cultural experience [41].
H1.
Digital technology interactivity positively influences perceived usefulness.
H2.
Digital technology interactivity positively influences perceived ease of use.
H3.
Digital technology innovativeness positively influences perceived usefulness.
H4.
Digital technology innovativeness positively influences perceived ease of use.
H5.
Perceived usefulness positively influences cultural experience.
H6.
Perceived ease of use positively influences cultural experience.
This pathway captures the role of digital technology as a dynamic narrative medium that constructs an immersive story field [42]. It extends service scenario theory into digital environments, focusing on how technology facilitates narrative transportation, a state of deep immersion into a story world that fosters emotional connections and identification.
In this process, innovativeness and interactivity play complementary roles. Innovativeness provides the compelling audiovisual content and novel presentation methods, defining what story is told and how it is shown. Interactivity, by allowing visitors to converse with characters or influence plots, addresses how visitors engage, transferring narrative control and transforming them from passive observers into active co-creators. This synergy creates a coherent, immersive narrative space. From a psychological ownership perspective, this immersive narrative journey facilitates deep self-investment of emotional and cognitive resources and cultivates an intimate understanding of the cultural context. This process is posited to instill a sense of belonging, thereby deepening the cultural experience.
H7.
Digital technology interactivity positively influences scenario construction.
H8.
Digital technology innovativeness positively influences scenario construction.
H9.
Scenario construction positively influences cultural experience.
This pathway highlights the induction of optimal psychological states. Flow Theory describes a state of complete absorption and focused enjoyment, characterized by a balance between challenge and skill, clear goals, and immediate feedback.
In digitally enhanced performances, innovativeness creates sensory and cognitive challenges [43], while interactivity provides the skills and instant feedback necessary to meet these challenges, systematically fulfilling the prerequisites for a flow state. The characteristics of the flow state exhibit profound isomorphism with the foundations of psychological ownership. The heightened sense of control within flow directly mirrors one key pathway to ownership, while the deep cognitive engagement with the cultural content fosters an efficient form of intimate familiarity. Thus, the flow state serves as a potent psychological catalyst, transforming technological immersion into a stronger personal connection with the culture.
H10.
Digital technology interactivity positively influences flow experience.
H11.
Digital technology innovativeness positively influences flow experience.
H12.
Flow experience positively influences cultural experience.
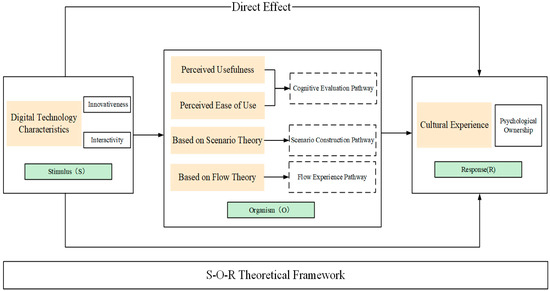
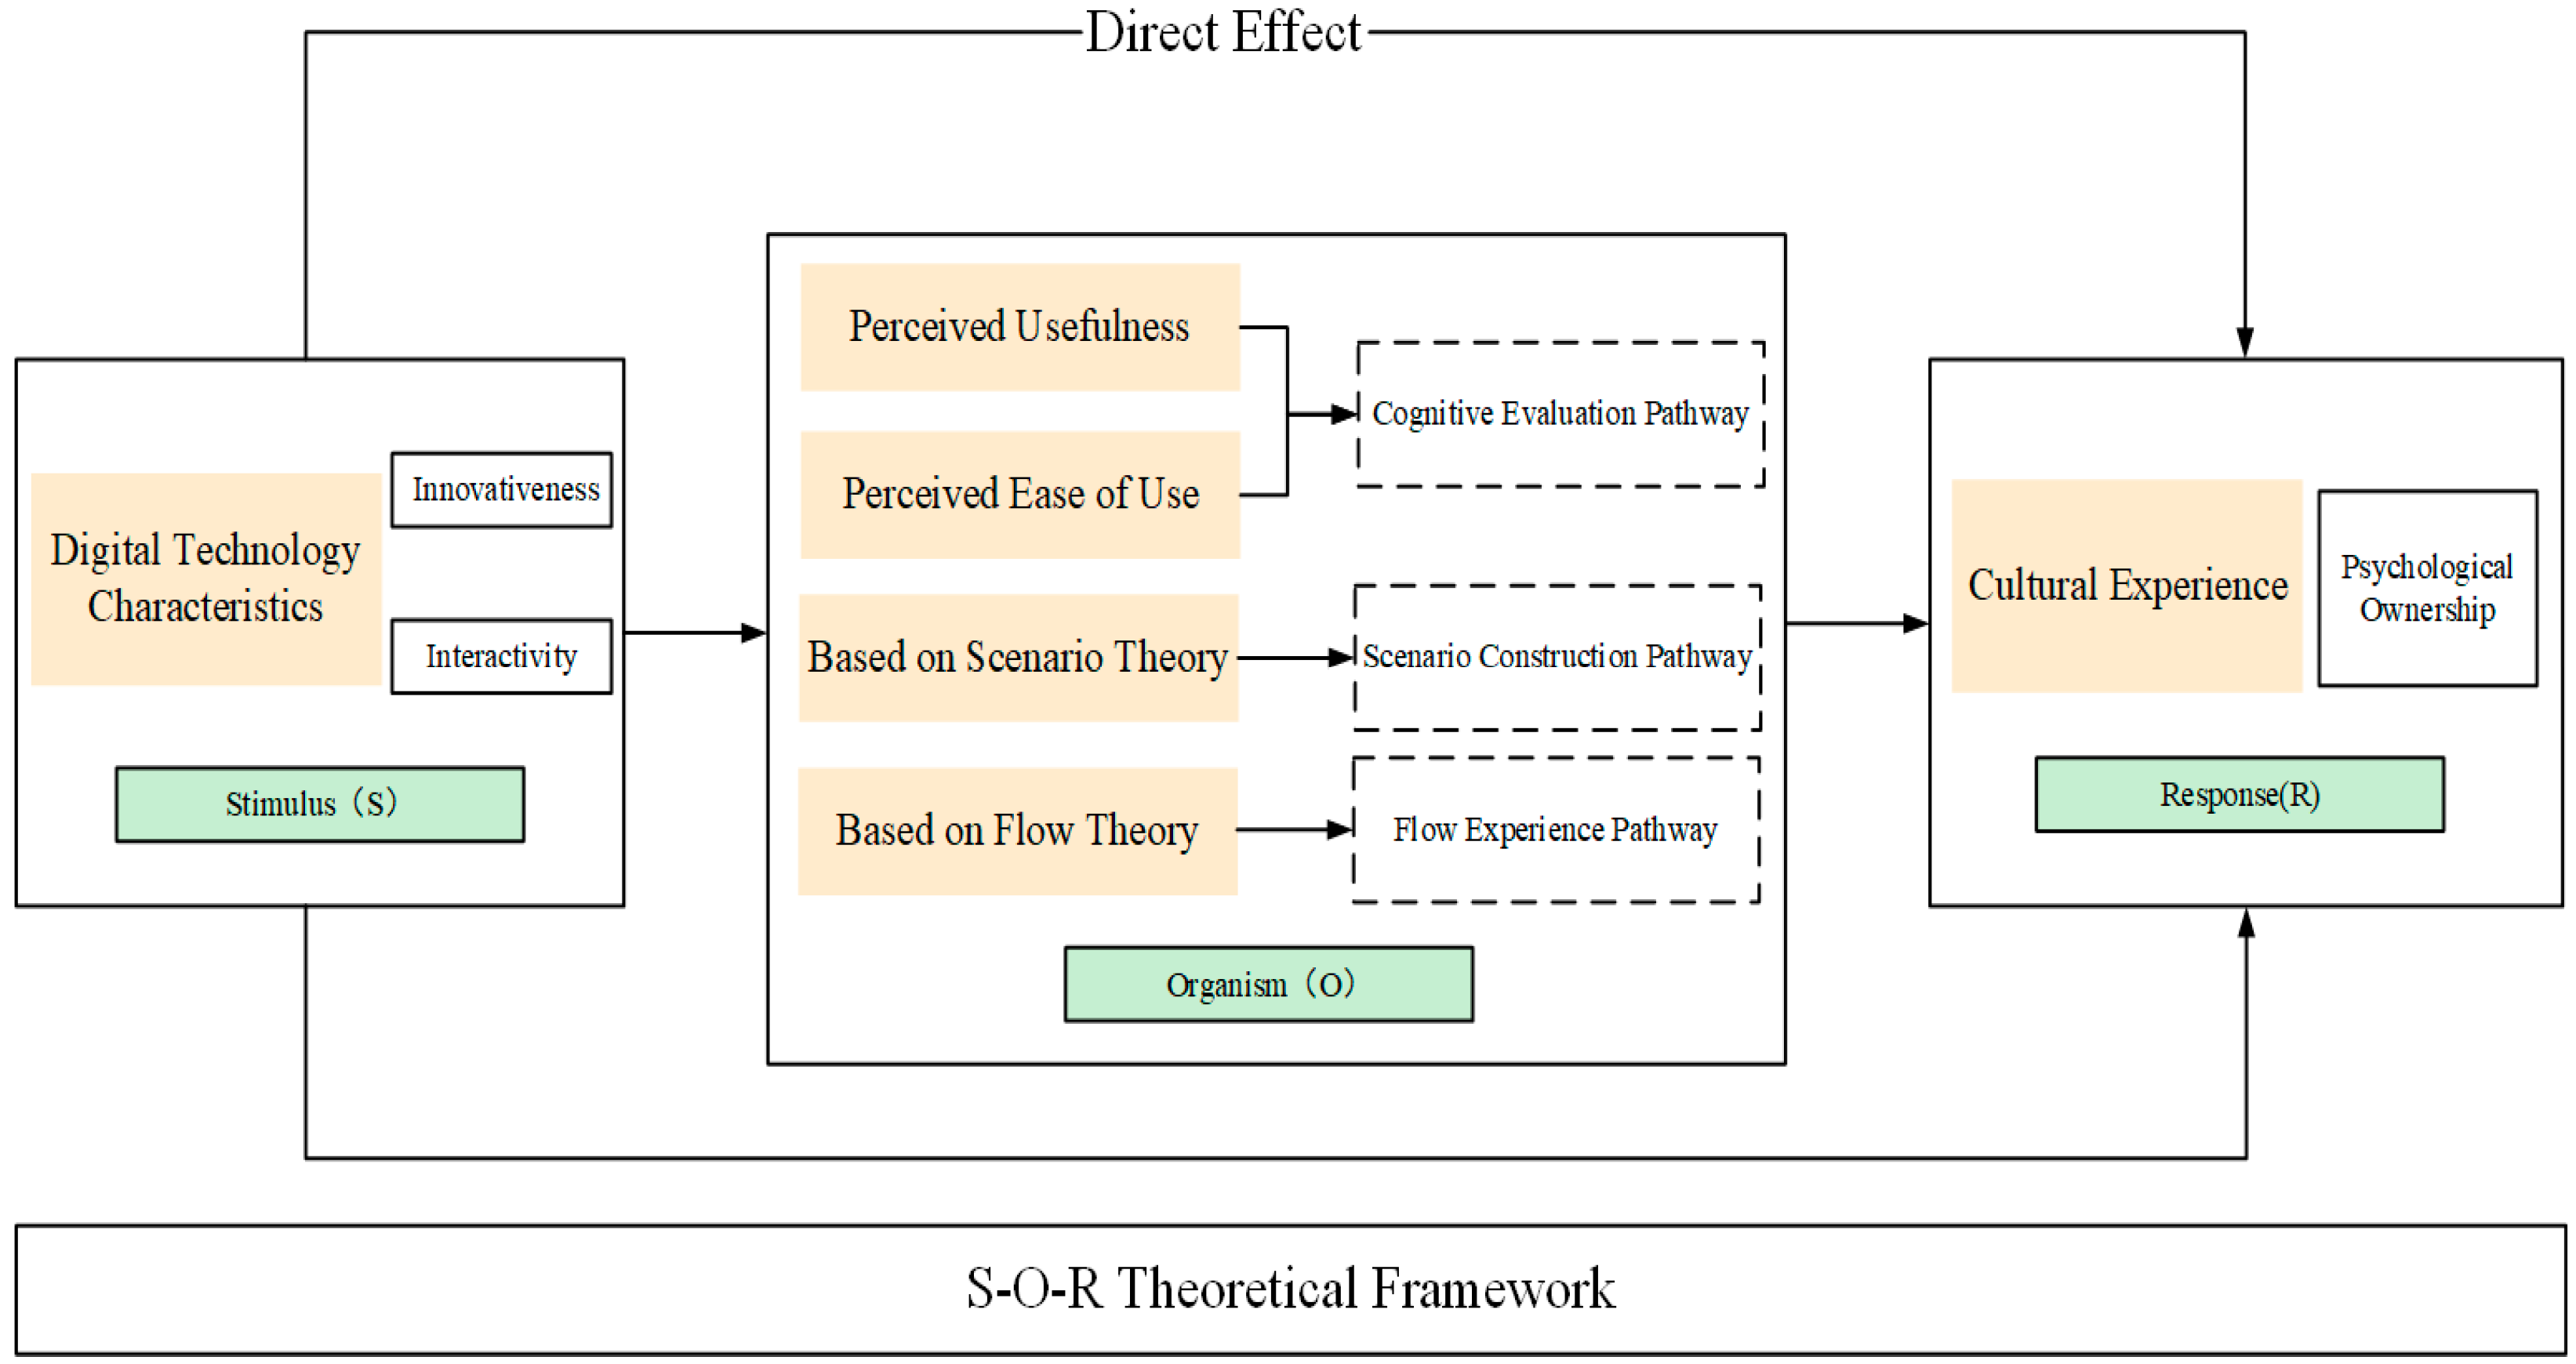
Beyond the articulated mediating pathways, digital technology, as a core component of the experiential environment, may also exert direct influences. According to the Stimulus-Organism-Response framework, environmental stimuli can affect responses both through internal organismic states and via direct routes [44]. The fundamental sense of participation from interactivity and the sensory impact of innovativeness themselves constitute potent stimuli that may directly shape visitors’ initial affective engagement and overall evaluation of the cultural experience, independent of more complex cognitive or psychological transformations. Therefore, we propose the following (Figure 1):
Figure 1.
Analytical framework.
H13.
Digital technology interactivity has a direct positive effect on cultural experience.
H14.
Digital technology innovativeness has a direct positive effect on cultural experience.
3. Methods
3.1. Theoretical Positioning and Operationalization of Psychological Ownership
This study introduces psychological ownership theory as the overarching explanatory framework for understanding how digital technology leads to cultural experience. Psychological ownership, defined as a state in which individuals feel as though the target of ownership is ‘theirs’ [25], is a complex, internalized psychological state. Rather than directly measuring it as a latent mediator—which can be challenging in cross-sectional surveys—we operationalize its core theoretical tenets (i.e., feelings of control, intimate knowledge, and self-investment) into three measurable, parallel mediating pathways. Specifically:
The cognitive evaluation pathway (perceived usefulness and ease of use) captures the sense of control and understanding-based intimacy that fosters psychological ownership.
The scenario construction pathway captures the narrative immersion and self-investment that are key precursors to psychological ownership.
The flow experience pathway captures the heightened control and focused immersion that mirror the state of psychological ownership.
By empirically validating these three pathways, we provide robust, indirect evidence for the mechanism through which psychological ownership is cultivated, thereby ‘opening the black box’ between technological stimuli and profound experiential outcomes.
3.2. Variable Measurement
The core variables examined in this study include digital technology interactivity, digital technology innovation, perceived usefulness, perceived ease of use, scenario construction, flow experience, and cultural experience. Each variable is measured using established scales from domestic and international research, adapted to the specific context of digitally enhanced tourism performances to ensure content validity and contextual relevance. The operational definitions and item designs for each variable are as follows. Digital technology interactivity was measured based on McMillan and Hwang [24], using four items across four dimensions—real-time dialogue, latency-free experience, attractiveness, and sense of control. It assesses audience perceptions of interactive digital technology within performances. Digital technology innovation was measured using the “perceived visual innovation” construct proposed by Turel et al. [45], with three items assessing creativity, novelty, and uniqueness. For the Cognitive Evaluation Pathway, perceived usefulness and perceived ease of use were derived from Chung et al. [22] in the context of augmented reality applications in cultural heritage. Six items were developed to capture these dimensions, covering aspects such as information acquisition, experience enhancement, and operational convenience. For the Scenario Construction Pathway, this research draws on Li’s et al. [46] Tourism Experience Scenario Scale, which assesses two dimensions: thematic narrative and social engagement. Thematic narrative encompasses story appeal, plot coherence, and visual immersion, while social engagement includes emotional connection and cultural extension, resulting in a total of eight items. For measuring the Flow Experience Pathway, the study uses the Flow State Scale (FSS) developed by Jackson and Marsh [47], a well-established instrument with high reliability and validity.
Tailored to tourism performances, this study assessed five dimensions of flow: challenge-skill balance, action-consciousness fusion, focused attention, sense of control, and distorted sense of time, resulting in five items. Cultural Experience was measured by integrating psychological ownership dimensions, Pine and Gilmore’s [32] experience economy theory, and findings from multiple localized studies. It includes five items across five aspects: emotional resonance, cultural cognition, cultural identification, immersive experience, and recommendation intention. To ensure measurement reliability and validity, the scale items were developed by drawing on established scales from both domestic and international scholars in related fields. These items were then appropriately adapted to the specific context of tourism performances, resulting in a scale tailored to the content of this study, as shown in Table 1 below.
Table 1.
Measurement scales and items.
To ensure measurement quality, this study employed several methods. First, English scales were translated into Chinese using the back-translation method to minimize language-induced differences and maintain conceptual equivalence. Second, an expert panel from relevant fields evaluated the content validity, wording, and semantic clarity of each item, and revisions were made accordingly. Third, a pilot study was conducted prior to the formal survey, with potential tourists from various age groups randomly selected on the streets of Xi’an for small-scale testing. Based on their feedback, the questionnaire’s wording and structure were finalized. All items were measured on a 5-point Likert scale, where 1 = Strongly Disagree, 2 = Disagree, 3 = Somewhat Agree, 4 = Agree, and 5 = Strongly Agree.
The target participants were domestic tourists who had attended at least one tourism performance in the past six months. In the questionnaire instructions and pre-screening, participants were explicitly asked to recall and base all their evaluations on one specific, recent, and impressive tourism performance they had attended.
3.3. Sample Collection Overview
This study employed an online questionnaire survey for data collection. The target participants were domestic tourists with prior experience of tourism performances. The questionnaire was administered via the “Wen Juanxing” platform and included pre-screening questions to ensure respondent eligibility. To ensure comprehensive coverage of the target population, a multi-channel convenience sampling strategy was employed. First, the questionnaire was distributed within online tourism communities, social media platforms, and relevant forums. Second, QR codes were placed at exit points and rest areas of several popular tourism performance venues, inviting visitors who had just completed a performance to voluntarily scan and complete the survey. All respondents were informed of the study’s purpose and provided consent prior to participation. Data collection was conducted between 1 October and 7 October 2025.
To ensure data quality, the following standard procedures were implemented during the data cleaning phase. First, based on pre-test results, questionnaires completed in an excessively short time (less than 2 min) were deemed careless responses and excluded. Second, attention-testing items (e.g., reverse-scored questions) were incorporated into the questionnaire; responses failing these tests were removed. Finally, questionnaires exhibiting obvious patterned responses (e.g., selecting the same option consecutively or showing wave-like response patterns) were also excluded.
To address potential common method bias, several procedural remedies were implemented in the survey design phase:
- Psychological Separation: The questionnaire was designed to separate the measurement of predictor and criterion variables by placing them in different sections with distinct headers.
- Anonymity and Confidentiality: We assured respondents of complete anonymity and data confidentiality to reduce evaluation apprehension and social desirability bias.
- Item Wording Improvements: We avoided ambiguous or leading questions and used both positively and negatively worded items where appropriate to break response patterns.
- Pilot Testing and Expert Review: The pilot study and expert panel review helped ensure item clarity, reducing item ambiguity as a potential source of bias.
- Attention Checks: We incorporated attention-check items to identify and exclude careless respondents.
Following this screening process, the study collected 600 questionnaires, yielding 540 valid responses with a recovery rate of 90.0%. Analysis of the sample’s basic characteristics indicates a balanced distribution across key demographic variables, including gender, age, and educational background (see Section 3.3), providing a reliable foundation for subsequent empirical analysis.
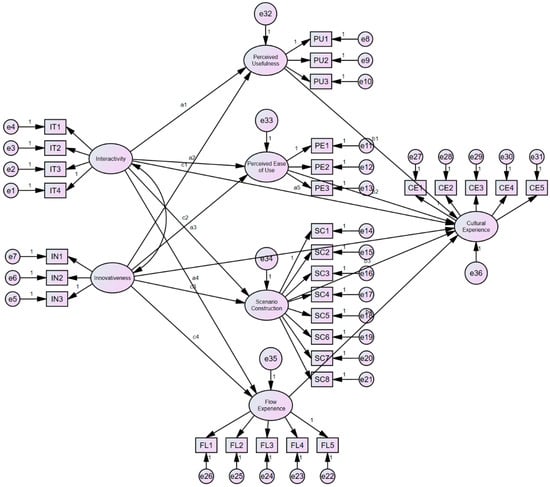
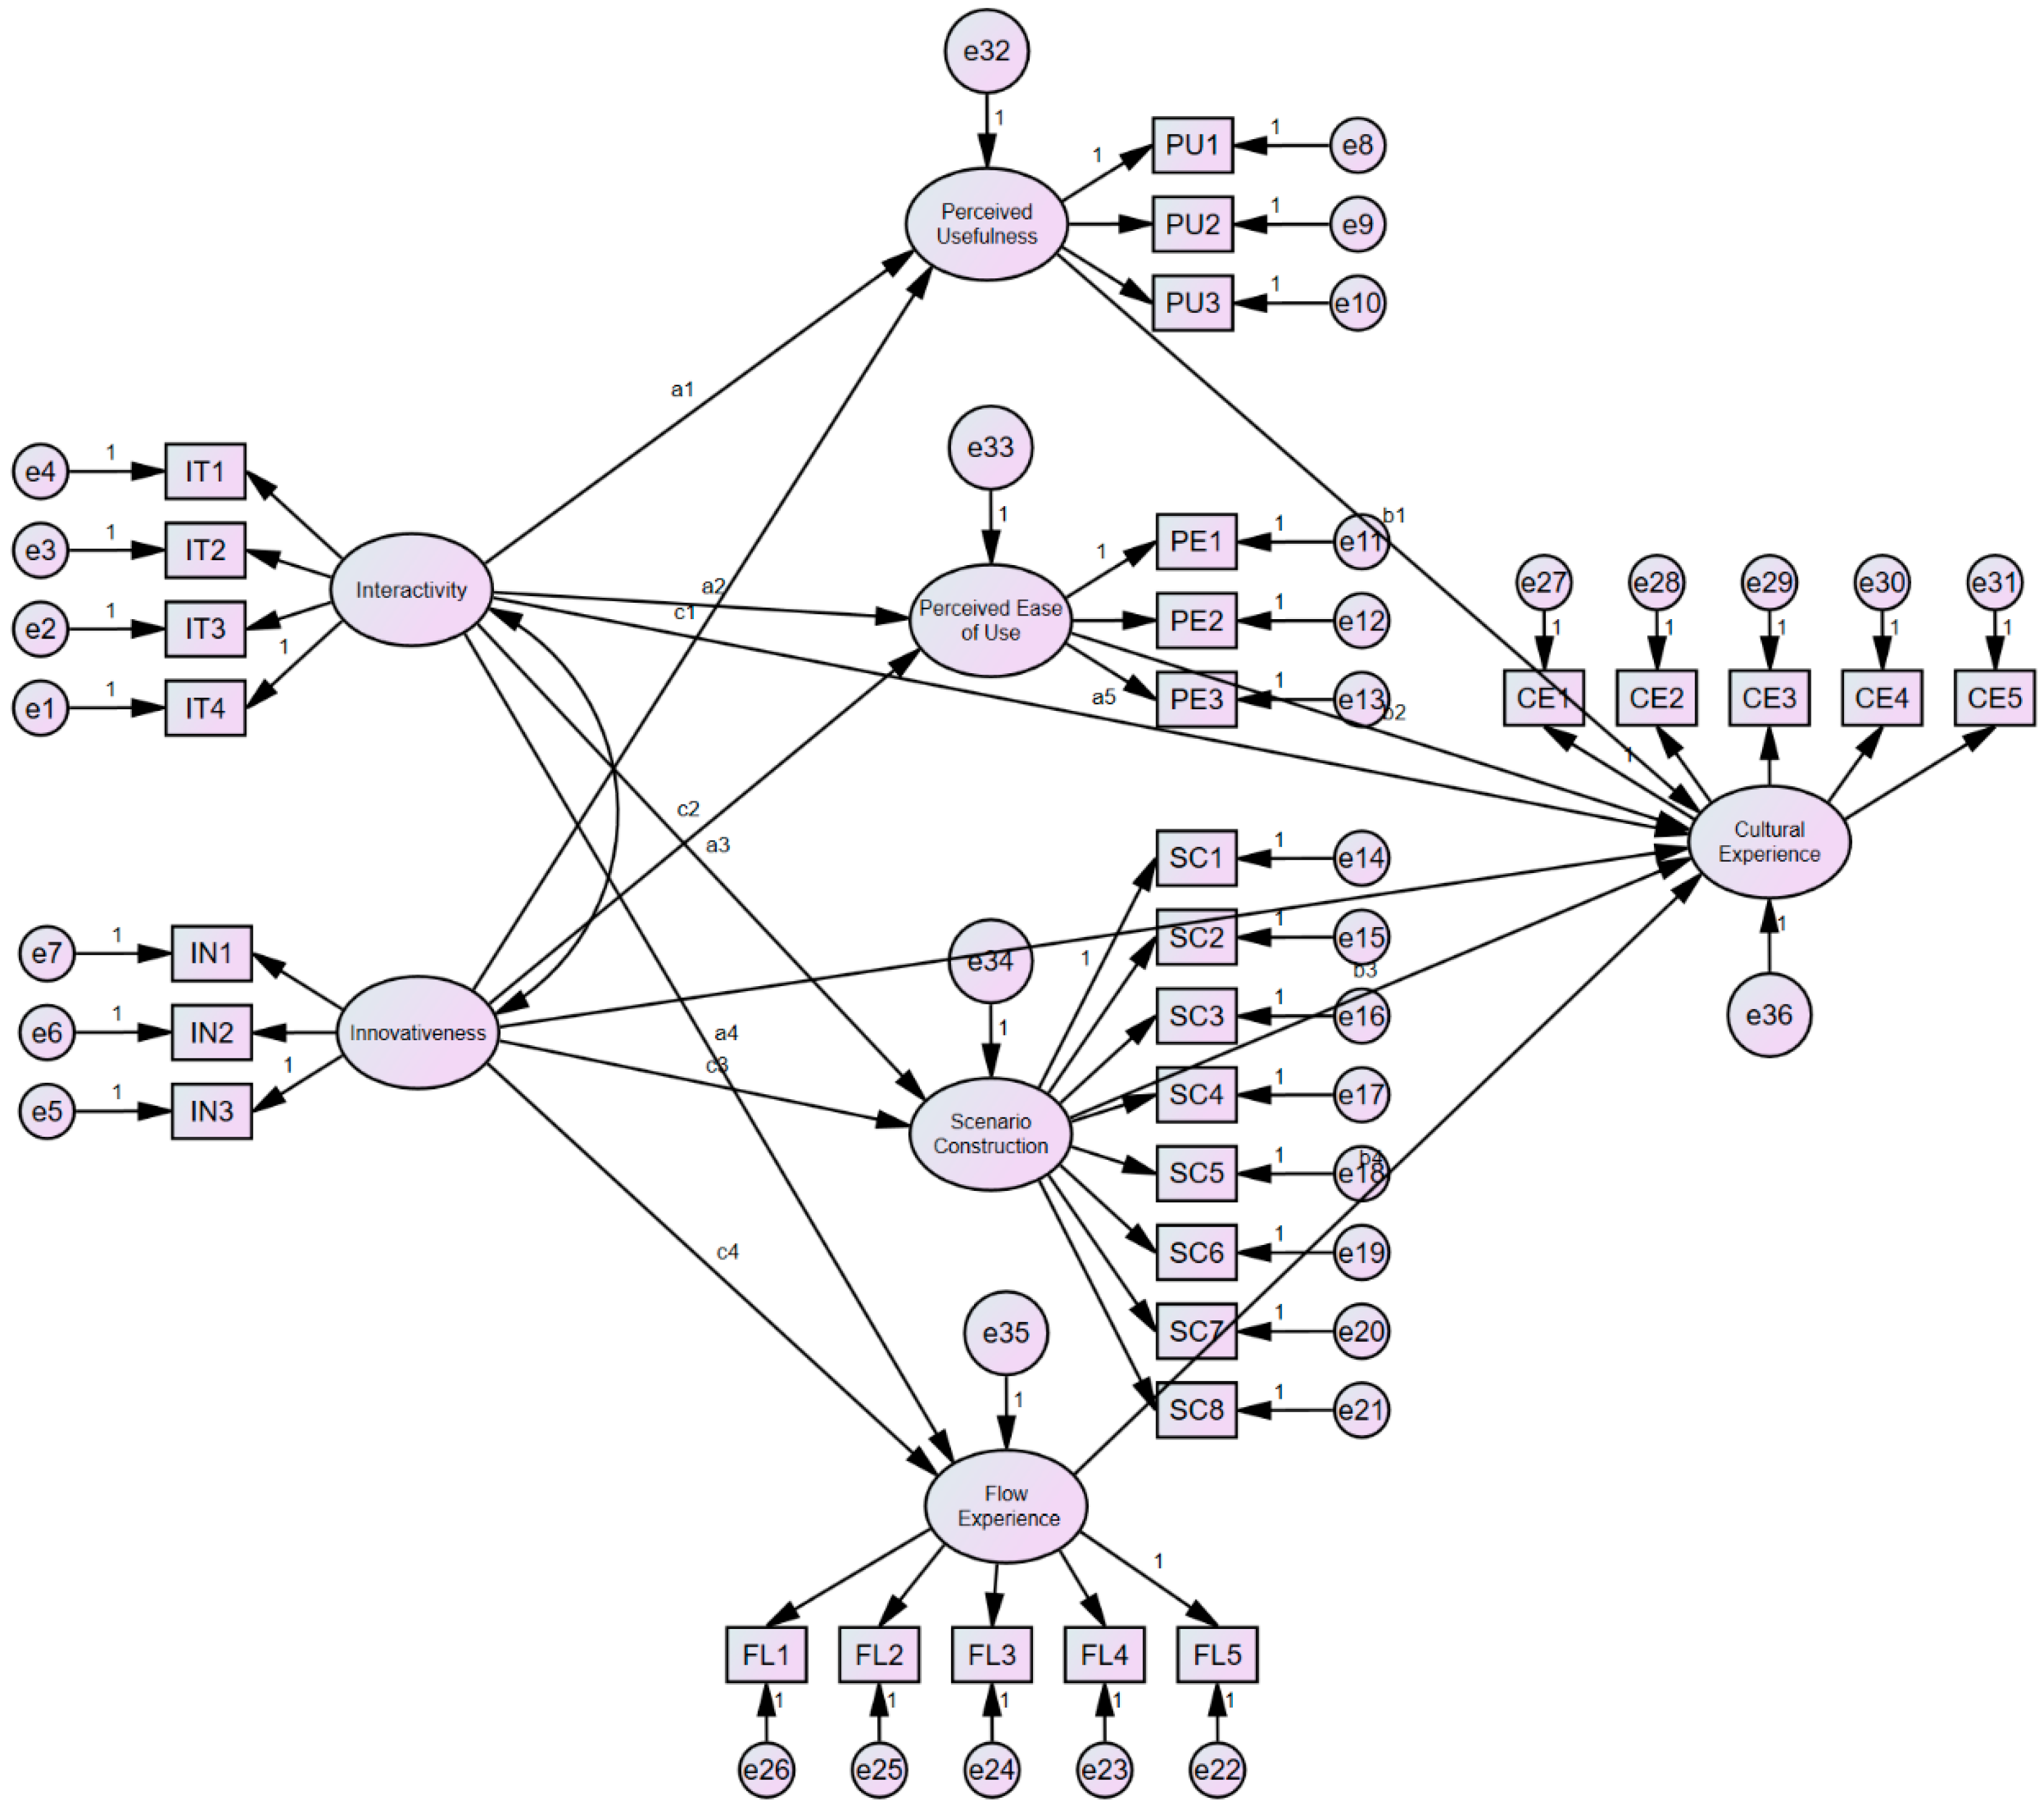
The relationship diagram of the structural model in this study is shown in Figure 2.
Figure 2.
Structural equation model.
Figure 2 shows the proposed structural equation model. This model illustrates the hypothesized relationships. The interactivity and innovativeness of digital technology are posited as exogenous variables, influencing the cultural experience both directly and indirectly through three parallel mediators: perceived usefulness (PU) and perceived ease of use (PEOU) (cognitive evaluation), scenario construction, and flow experience. All constructs are modeled as latent variables measured by their respective indicators (see Table 1).
4. Results
4.1. Descriptive Statistical Analysis
Basic Sample Characteristics
Based on the 540 valid responses, descriptive statistical analyses were conducted on respondents’ demographic characteristics, including gender, age, educational background, and frequency of attending performances. Table 2 represents the result, which indicates a balanced distribution across all dimensions, supporting sample representativeness and providing a foundation for examining the influence of demographic variables on perceptions of digital cultural experiences.
Table 2.
Basic information statistics.
From a demographic perspective, the sample exhibits strong representativeness. Gender distribution is balanced, minimizing structural bias. The age structure is dominated by the 18–35 age group, who are both “digital natives” and primary drivers of cultural consumption, aligning closely with the technological and experiential focus of this study. Educational attainment is predominantly at the bachelor’s level or higher, consistent with typical digital technology adoption patterns, and the gradient distribution across educational levels allows for exploring potential influences of education. Overall, the sample combines broad societal representativeness with research-specific relevance, providing a robust foundation for subsequent data analysis.
4.2. Reliability Testing
Table 3 represents the reliability analysis results. Based on the table, the Cronbach’s alpha coefficients of all the variables are above 0.7, confirming the reliability of using the variables in the model. The overall scale coefficient is 0.894, demonstrating high internal consistency and great reliability of the measurement scales, thereby meeting the requirements for subsequent analysis.
Table 3.
Reliability analysis results.
4.3. Validity Testing
4.3.1. Exploratory Factor Analysis
To assess data validity for factor analysis, this study conducted KMO sampling adequacy measures and Bartlett’s sphericity test. Table 4 shows a KMO value of 0.889, indicating high partial correlation among variables. The estimated statistic of Bartlett’s sphericity test is significant at 1% level (χ2 = 6761.882, df = 465, p < 0.001), indicating the presence of shared latent structure among variables. Both metrics confirm the reliability of data for subsequent exploratory factor analysis, supporting the validity of the scale’s construct.
Table 4.
KMO and bartlett’s test results.
To assess the potential threat of common method bias (CMB) due to the cross-sectional, self-reported data, we performed Harman’s single-factor test. An exploratory factor analysis including all measurement items revealed that the first unrotated factor accounted for 24.25% of the total variance, which is well below the commonly accepted threshold of 50%. This suggests that common method variance is not a severe issue in the present dataset.
Table 5 shows the total variance explained by exploratory factor analysis. Using Kaiser’s criterion (eigenvalue > 1), seven common factors were extracted, accounting for a cumulative variance of 63.642%, exceeding the empirical benchmark of 60% and indicating good factor representativeness. After maximum variance rotation, the cumulative variance remained unchanged, suggesting no information loss, while the rotation optimized the distribution of factor loadings, facilitating subsequent analysis.
Table 5.
Total variance explained.
Principal Component Analysis (PCA) was employed for the initial exploratory factor analysis. PCA was chosen for its goal of extracting maximum variance and providing a clear preliminary factor structure for scale refinement, which is a common practice in the early stages of scale validation in psychological and behavioral research. The subsequent Confirmatory Factor Analysis (CFA) tests the hypothesized factor structure based on theory, complementing the PCA.
Table 6 provides the results of exploratory factor analysis, which confirm the scale’s strong construct validity. Using principal component analysis with maximum variance rotation, the seven extracted factors corresponded precisely to the theoretical constructs. Item loadings on their respective factors ranged from 0.693 to 0.829, which are above the 0.6 threshold, rejecting cross-loading issues. These results indicate that all items are effectively aggregated onto their predefined dimensions, demonstrating a clear factor structure and good discriminant validity.
Table 6.
Exploratory factor analysis results.
The narrative now explicitly highlights: The EFA yielded a clean seven-factor structure. All items loaded strongly (>0.65) on their intended factors with no significant cross-loadings (<0.40), indicating excellent discriminant validity at the exploratory stage. The factor correlation matrix (available upon request) showed moderate inter-factor correlations, consistent with our theoretical model.
4.3.2. Confirmatory Factor Analysis
Confirmatory factor analysis examined the structural validity of the measurement model. The model, constructed in AMOS, explicitly defined the relationships between latent and observed variables and allowed correlations among latent variables. The model demonstrated a good fit, as shown in Table 7: χ2/df = 1.163, RMSEA = 0.017, with GFI, CFI, IFI, NFI, and other indices all above 0.93, and PCFI = 0.879. All fit indices met the thresholds, indicating a high alignment between the theoretical model and the observed data, and confirming the scale’s strong structural validity.
Table 7.
Model fit for confirmatory factor analysis.
As shown in Table 8, the results of the confirmatory factor analysis indicate that standardized factor loadings for all items on their corresponding latent variables ranged from 0.656 to 0.777, all above 0.5 and statistically significant (t-statistic > 1.96). Average variance extracted (AVE) values ranged from 0.507 to 0.577, surpassing the 0.5 threshold. Composite reliability (CR) ranged between 0.759 and 0.892, exceeding the 0.7 standard. These results collectively confirm adequate convergent validity, meaning that items within each construct are highly correlated and effectively reflect their latent variables.
Table 8.
Convergent validity.
Discriminant validity was assessed by comparing the square root of the average variance extracted (AVE) for each latent variable with the correlation coefficients between variables. As shown in Table 9, the square root of the AVE for all latent variables (bolded values on the diagonal) exceeded their correlations with any other variable (values below the diagonal). For example, the square root of AVE for Digital Technology Interactivity (0.725) is substantially higher than its highest correlation with Digital Technology Innovation (r = 0.375). These results indicate good discriminant validity, confirming the meaningful distinction of the constructs.
Table 9.
Distinctive validity.
4.4. Structural Equation Model and Hypothesis Testing
Table 10 presents the model fit indices for the structural equation model. Based on the table, χ2/df is 1.371, and RMSEA is 0.026, indicating a parsimonious model with minimal fit error. All relative fit indices—GFI, CFI, IFI, and NFI—exceed 0.9, and PCFI is greater than 0.5, indicating that the theoretical model fits the observed data well and is reliable to be used for subsequent hypothesis testing.
Table 10.
Structural model fit.
Table 11 provides the results of examining the path analyses using the structural equation model. The estimates support all 14 research hypotheses. The interactivity and innovativeness of digital technology significantly and positively influenced perceived usefulness, perceived ease of use, scenario construction, flow experience, and cultural experience, confirming Hypotheses H1–H10. In addition, perceived usefulness, perceived ease of use, scenario construction, and flow experience all show significant and positive effects on cultural experience, confirming Hypotheses H11–H14. Notably, technological innovation demonstrates relatively stronger effects on perceived ease of use and flow experience, and interactivity has a more pronounced impact on scenario construction. These findings comprehensively illustrate both the direct and multiple indirect mechanisms through which digital technology influences cultural experiences.
Table 11.
Path coefficient analysis.
To assess the explanatory power of the structural model, the squared multiple correlations (R2) for all endogenous latent variables were examined. As shown in Table 11, the model explains 31.1% of the variance in Cultural Experience (R2 = 0.311), indicating that the combined influence of the antecedent and mediating variables accounts for a substantial portion of the outcome. The variances explained in the key mediating variables are as follows: Perceived Ease of Use (19.9%, R2 = 0.199), Scenario Construction (15.6%, R2 = 0.156), Perceived Usefulness (14.3%, R2 = 0.143), and Flow Experience (10.8%, R2 = 0.108). These R2 values demonstrate that the model captures meaningful variance in both the ultimate outcome and the proposed parallel mediating mechanisms.
4.5. Mediating Effects Test
Based on the estimates, digital technology significantly influences cultural experience not only directly but also through a network of parallel mediating pathways. The analysis confirms the existence of three core mechanisms—cognitive evaluation, scenario construction, and flow experience—through which technology exerts its impact. To provide a comprehensive view, Table 12 presents a detailed breakdown of effects, including total, direct, and indirect effect estimates for the two core technological antecedents.
Table 12.
Results of Effect Decomposition and Mediating Pathway Analysis.
The findings strongly support the core argument that digital technology influences cultural experience through three parallel pathways. Both interactivity and innovation exert significant total effects (0.233 and 0.364, respectively), which are meaningfully decomposed into direct and indirect components. Notably, indirect effects account for a substantial portion of the total influence (~49% for interactivity and ~41% for innovativeness), underscoring the critical role of the mediating mechanisms. Specifically, all eight hypothesized mediating paths are significant. Technological innovativeness exhibits its strongest indirect effect via the perceived ease of use pathway (Ind6, effect size = 0.047), highlighting that novel technologies enhance experience primarily by reducing usage barriers. In contrast, interactivity demonstrates comparable and significant indirect effects through both scenario construction (Ind3, 0.032) and perceived ease of use (Ind2, 0.032), emphasizing its dual role in facilitating narrative immersion and user control. These results systematically validate the parallel operation of the cognitive evaluation, scenario construction, and flow experience mechanisms, providing a clarified and quantified map of the intrinsic pathways through which digital technology shapes cultural experiences.
To further examine the nature of the ‘parallel’ mechanisms, we conducted pairwise contrast tests between the aggregated indirect effects of the three conceptual pathways (Cognitive, Scenario, Flow). The results showed that the differences between these pathways were not statistically significant (e.g., Cognitive vs. Scenario: contrast = 0.005, p = 0.215; Cognitive vs. Flow: contrast = 0.003, p = 0.178; Scenario vs. Flow: contrast = −0.002, p = 0.312). This indicates that, while all three pathways are significant, no single pathway exerts a dominantly stronger indirect effect than the others in this context.
5. Discussion
The structural model explains a substantial 31.1% of the variance in cultural experience (R2 = 0.311). This level of explained variance is considerable for a model predicting a complex psychological and behavioral outcome in a real-world tourism context. The significant R2 values for the mediating variables—particularly for perceived ease of use (19.9%) and scenario construction (15.6%)—confirm that these pathways are not only statistically significant but also capture meaningful systematic variance, reinforcing their roles as substantive mechanisms. The moderate R2 for flow experience (10.8%) suggests that while it is a valid and significant path, its activation may be more subject to individual differences or situational factors not fully captured in this model. Collectively, these findings affirm the robustness of the proposed three-path framework while appropriately acknowledging the role of unmeasured variables, thus providing a balanced and credible account of digital technology’s impact.
5.1. Interpretation of Key Findings
The empirical results provide robust support for the proposed “cognition-scenario-flow” triadic pathway model. Beyond confirming statistical significance, several nuanced patterns emerge that offer deeper insights into the technology-experience nexus in tourism performances. First, the finding that digital technology innovativeness exerts the strongest influence on perceived ease of use (β = 0.387, p < 0.001) is particularly instructive. It challenges the potential misconception that technological sophistication inherently creates complexity. Instead, it validates the TAM principle within a high-immersion context: truly impactful innovation in tourism performances—such as intuitive AR overlays or seamless holographic integration—functions by reducing cognitive and operational friction, thereby lowering the barrier to cultural engagement rather than raising it Second, the strong effects of both interactivity and innovativeness on scenario construction (β = 0.272 and 0.257, respectively) underscore their complementary roles. Interactivity provides the “verbs”—the actions and choices that give visitors agency. Innovativeness provides the “nouns and adjectives”—the novel audiovisual elements and story forms. Their synergy is essential for transforming a passive viewing space into an active, immersive “story world” where the narrative is not only told but also felt and influenced. Third, among the mediating variables, flow experience demonstrated a significant direct effect on cultural experience (β = 0.173, p = 0.002). This underscores that the psychological state of flow is not merely a pleasant byproduct but a critical catalytic mechanism. When visitors enter a state of deep focus and intrinsic motivation facilitated by well-balanced digital interactions, their processing of cultural content shifts from superficial observation to personal, embodied identification, facilitating internalization.
5.2. Synthesizing the Pathways Through the Lens of Psychological Ownership
The mediation analysis reveals that all three pathways function effectively, with digital technology innovativeness showing its strongest indirect effect via the perceived ease of use path (effect size = 0.047). The validity of these parallel paths collectively provides compelling, albeit indirect, empirical support for our overarching psychological ownership theoretical framework [48]. The cognitive evaluation pathway (via PU/PEOU) operationalizes the development of control and intimate knowledge—two core antecedents of psychological ownership. When technology is seen as useful and easy to use, it grants visitors mastery over the experience and deepens their understanding, laying the cognitive groundwork for “owning” the cultural narrative. The scenario construction pathway operationalizes self-investment and emotional belonging. A compelling narrative space demands and rewards emotional and cognitive investment from the visitor, creating a sense of personal stake and connection to the story, mirroring the development of possession feelings [49]. The flow experience pathway operationalizes a heightened state of control and focused immersion simultaneously. The flow state inherently combines deep concentration with a sense of agency, efficiently fostering both the intimate familiarity and control central to psychological ownership.
Thus, the three paths are not merely alternative routes to a positive experience; they are discernible, parallel processes through which digital technology cultivates the foundational elements of psychological ownership, which in turn manifests as the cultural experience measured in this study.
6. Conclusions and Outlook
6.1. Research Findings
This study, grounded in the S-O-R framework [49], construct and empirically validates a parallel three-pathway model that explains how digital technology empowers cultural experiences in tourism performances, with psychological ownership serving as the overarching theoretical lens. Analysis of 540 valid questionnaires confirms that the interactivity and innovativeness of digital technology stimulate a profound cultural experience through three distinct yet complementary mediating pathways: the cognitive evaluation pathway (enhancing perceived usefulness and ease of use), the scenario construction pathway (building immersive narrative spaces), and the flow experience pathway (inducing deep psychological engagement). The findings further reveal differentiated impacts: technological innovativeness exhibits the strongest effect on fostering perceived ease of use, while both attributes significantly drive scenario construction and flow states.
6.2. Theoretical Contributions
This study makes several distinct contributions to the literature. First, it moves beyond the prevalent single-theory approaches (e.g., TAM-only, or flow-only studies) in tourism technology research by integrating three key theoretical perspectives into a cohesive, parallel-mediation model. This provides a more holistic explanation of how technology functions as a tool, a narrative medium, and a psychological catalyst simultaneously. Second, it advances the application of psychological ownership theory from organizational and consumer behavior contexts into the realm of digital cultural heritage and experience. We demonstrate its utility as a powerful explanatory framework for understanding the “depth” in cultural experiences, shifting the focus from surface-level satisfaction to deeper mechanisms of identity and belonging. Third, by empirically distinguishing and validating the parallel nature of the three pathways, our study clarifies that their effects are complementary rather than mutually exclusive. This offers a more nuanced framework for both researchers and practitioners, suggesting that technological strategies can be designed to target specific pathways (e.g., optimizing ease of use vs. enhancing narrative) based on desired experiential outcomes [45,50].
6.3. Practical Implications
The validated three-pathway model provides a clear “decision navigation map” for stakeholders, translating theoretical insights into actionable strategies to overcome the “high investment, low experience” dilemma.
- For Government and Regulatory Bodies: Establish a Differentiated Funding and Evaluation System Policymakers should abandon a “one-size-fits-all” approach to supporting digital cultural projects. Instead, funding and evaluation criteria must align with a project’s primary objective by prioritizing the most relevant experiential pathway: For projects emphasizing cultural education and heritage transmission, the policy focus should be on the cognitive evaluation pathway. Support should target technologies that enhance the clarity, accessibility, and depth of cultural information (e.g., AR knowledge annotation, intelligent context-aware guides). Evaluation metrics should prioritize cognitive gains and understanding. For projects aiming at market impact and memorable peak experiences, support should emphasize the scenario construction and flow experience pathways. Incentives should be directed toward R&D and application of technologies that create emotional resonance and deep immersion (e.g., immersive theaters, interactive large-scale installations). Evaluation systems should incorporate metrics for narrative engagement, emotional impact, and flow intensity. A new “experience value”-centered evaluation framework is recommended, incorporating indicators like psychological ownership and flow state to guide the industry from mere “technology accumulation” to genuine “value deepening [45,50].
- For Tourism Performance Operators: Implement Precision Diagnostics and Optimize Resource Allocation. Operators can use the three-pathway framework as a diagnostic tool to identify experiential bottlenecks and make targeted investments: If visitor feedback indicates “low comprehension or detachment,” the bottleneck likely lies in the cognitive pathway. Investments should optimize interface usability and the explanatory depth of digital content. If feedback points to “lack of immersion or weak emotional connection,” the issue may reside in the scenario pathway. Collaboration with storytellers and directors should be strengthened to ensure technology seamlessly serves a compelling narrative. If feedback suggests “low engagement or a lackluster experience,” the flow pathway may need enhancement. Service design should apply flow theory principles to optimize challenge-skill balance and provide immediate, meaningful feedback at key interaction touchpoints [51].
- For Technology Developers: Design Modular and Customizable Digital Toolkits. Developers should shift from offering rigid, standardized solutions to providing flexible, modular digital toolkits. These toolkits should allow venue managers to adjust key parameters along the different experiential pathways: Adjustable Interactivity Levels: To cater to the cognitive pathway (ease of use/control) and flow pathway (challenge-feedback). Configurable Narrative Depth: To support the scenario pathway (immersion) and cognitive pathway (usefulness/understanding). Such design enables the same technological platform to be tailored for projects with different goals (educational vs. entertainment-focused), enhancing the adaptability and return on investment of digital solutions in the cultural tourism sector. This targeted approach maximizes experiential value within budget constraints and mitigates the risk of misguided technological investment.
- For policymakers and investors aiming to promote socio-cultural sustainability, the study highlights that the ultimate value of digital investment lies not in spectacle alone but in its capacity to foster visitors’ psychological ownership of cultural heritage. When visitors feel a sense of personal connection and responsibility towards the culture presented the likelihood of respectful engagement, advocacy, and long-term cultural preservation increases [52]. Therefore, funding and evaluation criteria should evolve from measuring technological adoption (e.g., number of VR headsets) to assessing experiential depth and the cultivation of ownership-related outcomes, thereby aligning technological innovation with sustainable cultural goals.
In summary, this study not only uncovers the “mechanism black box” of how digital technology influences cultural experiences but also offers evidence-based guidance for stakeholders. In the digital economy era, driving high-quality development in cultural tourism requires a deep understanding and strategic application of the principles underlying technology-enabled experiences—from macro policy to micro-level management—thereby optimizing resource allocation and maximizing customer value.
6.4. Research Limitations and Future Directions
This study has several limitations that suggest avenues for future research. First, the cross-sectional design, while validating correlational relationships, cannot establish causality or capture the dynamic evolution of cultural experiences over time. Future research could employ longitudinal designs (e.g., tracking changes in visitors’ cultural identity before and after a performance) or controlled experiments (e.g., A/B testing different technological features) to strengthen causal inferences and understand experience dynamics.
Second, limitations exist regarding sampling and context specificity. (1) Although respondents were instructed to evaluate a specific, recent performance, the sample encompasses various performance types (e.g., large-scale real scene shows, indoor theater productions). While this enhances ecological validity, the inherent heterogeneity may obscure nuances. Future studies should control for or explicitly examine performance type/genre as a moderating variable. (2) The use of a multi-channel convenience sampling strategy during a national holiday period [53], while efficient, may bias the sample toward leisure-focused tourists and specific crowd conditions, limiting the generalizability of findings to other tourist segments or seasonal contexts. (3) The model does not differentiate between first-time and repeat visitors, a factor known to influence technology adoption and experience depth. Future research with controlled sampling on these visitor characteristics is warranted.
Third, the study focuses on two core technology characteristics (interactivity and innovativeness). As digital technologies evolve rapidly, future research should explore the impact of emerging attributes such as personalization, bio-sensing interactivity, and applications of Artificial Intelligence-Generated Content (AIGC) or the metaverse on the proposed pathways.
Fourth, this study focuses on the experiential outcomes of technology application. It does not address the broader practical trade-offs and ethical considerations associated with implementing advanced digital technologies in cultural settings, such as the digital divide (ensuring equitable access), the resource intensity and environmental footprint of installations, or the potential risks to cultural authenticity (e.g., over-commercialization or distortion). Investigating how to balance these critical practical constraints with experiential optimization presents a vital and complex avenue for future interdisciplinary research.
Fifth, despite employing procedural remedies (e.g., anonymization, reversed items) and statistical controls (Harman’s single-factor test), the common method bias inherent in cross-sectional, self-reported data cannot be entirely ruled out. While the complex model structure with differential path strengths makes it unlikely that the entire pattern of results is a methodological artifact, future multi-method or multi-source study would be valuable to corroborate the findings.
Author Contributions
Conceptualization, Y.G.; methodology, Y.G. and S.Z.; investigation, Y.G. and D.Y.; resources, S.Z.; data curation, Y.G.; writing—original draft preparation, Y.G.; writing—review and editing, Y.G. and S.Z.; supervision, S.Z.; project administration, S.Z.; funding acquisition, S.Z. All authors have read and agreed to the published version of the manuscript.
Funding
This research was supported by National Natural Science Foundation of China “Research on the Red Cultural Tourism Industry Chain Group in the Old Revolutionary Base Area: Horizontal Measurement, Evolutionary Dynamics and Regional Collaborative Governance” (72474172); and the National Natural Science Foundation of China “Research on the mechanism and influence effect of high-quality content generation of digital creative enterprises driven by knowledge innovation under AIGC participation” (72474170).
Institutional Review Board Statement
This study is waived for ethical review by Institution Committee as the experimental design and methodology of this study are scientifically sound and fair. The research does not involve any animal or human subjects and poses no harm or risk to participants. Participant recruitment adheres to principles of resource allocation and informed consent, safeguarding participants’ rights and privacy. The study content presents no conflicts of interest and does not violate ethical standards or legal prohibitions.
Informed Consent Statement
Informed consent for participation was obtained from all subjects involved in the study.
Data Availability Statement
The original contributions presented in this study are included in the article. Further inquiries can be directed to the corresponding author.
Acknowledgments
The authors thank the anonymous reviewers for their valuable suggestions.
Conflicts of Interest
The authors declare no conflicts of interest.
References
- Chai, M. Digital technology boosts the prosperity of sports industry. In Chinese Social Sciences Today; Social Sciences in China Press: Beijing, China, 2021. [Google Scholar]
- Marlina, E.; Sukmawati, A.M.; Wahyuhana, R.T.; Ratriningsih, D.; Amrullah, A. Gen Z’s Travel Preferences: Reflective and Nature-Rooted Tourism with the Concept of Eco-Experiential Tourism. Tour. Hosp. 2026, 7, 15. [Google Scholar] [CrossRef] [Scilit]
- Torabi, Z.A.; Shalbafian, A.A.; Allam, Z.; Ghaderi, Z.; Murgante, B.; Khavarian-Garmsir, A.R. Enhancing memorable experiences, tourist satisfaction, and revisit intention through smart tourism technologies. Sustainability 2022, 14, 2721. [Google Scholar] [CrossRef] [Scilit]
- Loureiro, S.M.C.; Japutra, A.; Molinillo, S.; Bilro, R. Stand by Me: Analyzing the Tourist–Intelligent Voice Assistant Relationship Quality. Int. J. Contemp. Hosp. Manag. 2021, 33, 3840–3859. [Google Scholar] [CrossRef] [Scilit]
- Loureiro, S.M.C. Managerial Challenges and Social Impacts of Virtual and Augmented Reality; IGI Global: Hershey, PA, USA, 2020; pp. 1–280. ISBN 9781799828747. [Google Scholar]
- Shi, S.; Huang, X.; Zhang, M. Research on the influencing factors of tourists’ immersive experience in tourism performing arts. Tour. Trib. 2021, 36, 46–59. [Google Scholar] [CrossRef]
- Balakrishnan, J.; Dwivedi, Y.K.; Malik, F.T.; Baabdullah, A.M. Role of smart tourism technology in heritage tourism development. J. Sustain. Tour. 2023, 31, 2506–2525. [Google Scholar] [CrossRef] [Scilit]
- Sigala, M. New technologies in tourism: From multi-disciplinary to anti-disciplinary advances and trajectories. Tour. Manag. Perspect. 2018, 25, 151–155. [Google Scholar] [CrossRef] [Scilit]
- Tavitiyaman, P.; Qu, H.; Tsang, W.S.L.; Lam, C.W.R. The influence of smart tourism applications on perceived destination image and behavioral intention: The moderating role of information search behavior. J. Hosp. Tour. Manag. 2021, 46, 476–487. [Google Scholar] [CrossRef] [Scilit]
- Torabi, Z.A.; Pourtaheri, M.; Hall, C.M.; Sharifi, A.; Javidi, F. Smart tourism technologies, revisit intention, and word-of-mouth in emerging and smart rural destinations. Sustainability 2023, 15, 10911. [Google Scholar] [CrossRef] [Scilit]
- Loureiro, S.M.C.; Nascimento, J. Shaping a View on the Influence of Technologies on Sustainable Tourism. Sustainability 2021, 13, 12691. [Google Scholar] [CrossRef] [Scilit]
- Peng, G.; Zhu, L.; Chen, R. Research on the production accounting of China’s digital economy from the perspective of SNA. Stat. Res. 2021, 38, 19–31. [Google Scholar] [CrossRef]
- Buhalis, D.; Amaranggana, A. Smart tourism destinations enhancing tourism experience through personalisation of services. In Proceedings of the Information and Communication Technologies in Tourism 2015, Lugano, Switzerland, 3–6 February 2015; pp. 377–389. [Google Scholar]
- Guttentag, D.A. Virtual reality: Applications and implications for tourism. Tour. Manag. 2010, 31, 637–651. [Google Scholar] [CrossRef] [Scilit]
- Zhang, Y.; Sotiriadis, M.; Shen, S. Investigating the impact of smart tourism technologies on tourists’ experiences. Sustainability 2022, 14, 3048. [Google Scholar] [CrossRef] [Scilit]
- Liao, B.; Wang, Y.; Zhang, M.; Zhou, B. A study on tourists’ motivation, perception and satisfaction of tourism performing arts: A case study of “Song of the Song Dynasty: Dream of the East Capital. J. Ningbo Univ. (Lib. Arts Ed.) 2017, 30, 94–99. [Google Scholar] [CrossRef]
- He, Y.; Xu, F.; Lai, L.; Liu, J. Research on the driving mechanism of cultural tourism consumption based on the S-O-R theory. Tour. Sci. 2023, 37, 116–132. [Google Scholar] [CrossRef]
- Davis, F.D. Perceived usefulness, perceived ease of use, and user acceptance of information technology. MIS Q. 1989, 13, 319–340. [Google Scholar] [CrossRef] [Scilit]
- Venkatesh, V.; Davis, F.D. A theoretical extension of the technology acceptance model: Four longitudinal field studies. Manag. Sci. 2000, 46, 186–204. [Google Scholar] [CrossRef] [Scilit]
- Zhang, X.; Chen, H.; Ma, Y. When you feel you own ai assistants: How consumer ownership enhances consumers’ adoption intention. J. Consum. Behav. 2025, 24, 1669–1684. [Google Scholar] [CrossRef] [Scilit]
- Fan, Y.; Xie, Y. Exploration of the connotation and attributes of “Experience” and tourism experience. Tour. Trib. 2017, 32, 16–25. [Google Scholar]
- Chung, N.; Han, H.; Joun, Y. Tourists’ intention to visit a destination: The role of augmented reality (AR) application for a heritage site. Comput. Human Behav. 2015, 50, 588–599. [Google Scholar] [CrossRef] [Scilit]
- Bitner, M.J. Services capes: The impact of physical surroundings on customers and employees. J. Mark. 1992, 56, 57–71. [Google Scholar] [CrossRef] [Scilit]
- McMillan, S.J.; Hwang, Y. Measures of perceived interactivity: An exploration of the role of direction of communication, user control, and time in shaping perceptions of interactivity. J. Advert. 2002, 31, 29–42. [Google Scholar] [CrossRef] [Scilit]
- Green, M.C.; Brock, T.C. The role of transportation in the persuasiveness of public narratives. J. Pers. Soc. Psychol. 2000, 79, 701–721. [Google Scholar] [CrossRef]
- Li, M.; Chen, G.; Hu, X.; Huo, Z. Tourists’ perceived destination romantic attributes (PDRAs): Scale development and validation. Tour. Sci. 2022, 36, 63–85. [Google Scholar] [CrossRef]
- Pai, C.K.; Liu, Y.; Kang, S.; Dai, A. The role of perceived smart tourism technology experience for tourist satisfaction, happiness and revisit intention. Sustainability 2020, 12, 6592. [Google Scholar] [CrossRef] [Scilit]
- Czikszentmihalyi, M. Flow: The Psychology of Optimal Experience; Harper & Row: New York, NY, USA, 1990. [Google Scholar]
- Ghani, J.A.; Deshpande, S.P. Task characteristics and the experience of optimal flow in human—Computer interaction. J. Psychol. 1994, 128, 381–391. [Google Scholar] [CrossRef] [Scilit]
- Pierce, J.L.; Kostova, T.; Dirks, K.T. Toward a theory of psychological ownership in organizations. Acad. Manag. Rev. 2001, 26, 298–310. [Google Scholar] [CrossRef] [Scilit]
- Chen, W.; Wu, M. Exploring the role of psychological ownership in tourists’ shift toward sustainable behavior in cultural tourism. J. Sustain. Tour. 2024, 32, 2403–2422. [Google Scholar] [CrossRef] [Scilit]
- Pine, J.; Gilmore, J.H. Welcome to the experience economy. Health Forum J. 2001, 44, 10–16. [Google Scholar]
- Tian, X.; Li, R. Digital technology empowering the transformation and development of the real economy: An analytical framework based on schumpeter’s endogenous growth theory. J. Manag. World 2022, 38, 59–73. [Google Scholar] [CrossRef]
- MacCannell, D. The Tourist: A New Theory of the Leisure Class; University of California Press: Berkeley, CA, USA, 2013. [Google Scholar]
- Verduzco Villaseñor, M.D.C.; Cornejo Ortega, J.L.; Espinoza Sánchez, R. Governmental strategies and policies in the projection of smart tourist destination: An approach to the conceptual and theoretical qualitative analysis. Sustainability 2023, 15, 7166. [Google Scholar] [CrossRef] [Scilit]
- Zhao, T.; Zhang, Z.; Liang, S. Digital economy, entrepreneurship, and high-quality economic development: Empirical evidence from urban China. Front. Econ. China 2022, 17, 393–426. [Google Scholar] [CrossRef]
- Huang, W.; Meng, F.; Zhu, Z.; Zheng, L. An empirical study on the endogenous development driving forces of the tourism performing arts industry: A case study of Zhangjiajie. Tour. Trib. 2018, 33, 87–98. [Google Scholar]
- Jeong, M.; Shin, H.H. Tourists’ experiences with smart tourism technology at smart destinations and their behavior intentions. J. Travel Res. 2020, 59, 1464–1477. [Google Scholar] [CrossRef] [Scilit]
- Yao, Y.; Luan, W. Factors influencing yachting tourism consumption behavioral intention based on TAM-IDT model. Tour. Trib. 2019, 34, 60–71. [Google Scholar] [CrossRef]
- Cardozo, R.N. An experimental study of customer effort, expectation, and satisfaction. J. Mark. Res. 1965, 2, 244–249. [Google Scholar] [CrossRef] [Scilit]
- Pomfret, G.; Sand, M.; May, C. Conceptualising the power of outdoor adventure activities for subjective well-being: A systematic literature review. J. Outdoor Recreat. Tour. 2023, 42, 100641. [Google Scholar] [CrossRef] [Scilit]
- Williams, D.R.; Patterson, M.E.; Roggenbuck, J.W.; Watson, A.E. Beyond the commodity metaphor: Examining emotional and symbolic attachment to place. Leis. Sci. 1992, 14, 29–46. [Google Scholar] [CrossRef] [Scilit]
- Mehrabian, A.; Russell, J.A. An Approach to Environmental Psychology; The MIT Press: Cambridge, MA, USA, 1974. [Google Scholar]
- Sultan, P.; Wong, H.Y.; Azam, M.S. How perceived communication source and food value stimulate purchase intention of organic food: An examination of the stimulus-organism-response (SOR) model. J. Clean. Prod. 2021, 312, 127807. [Google Scholar] [CrossRef] [Scilit]
- Turel, O.; Serenko, A.; Bontis, N. User acceptance of hedonic digital artifacts: A theory of consumption values perspective. Inf. Manag. 2010, 47, 53–59. [Google Scholar] [CrossRef] [Scilit]
- Li, H.; Zhang, M. Development of a red tourism experience scenario scale: Application of a mixed-methods approach. Tour. Sci. 2023, 36, 71–89. [Google Scholar]
- Jackson, S.A.; Marsh, H.W. Development and validation of a scale to measure optimal experience: The Flow State Scale. J. Sport Exer. Psychol. 1996, 18, 17–35. [Google Scholar] [CrossRef] [Scilit]
- Ma, L.; Bao, J. Traditional festival tourism experience from a perceived value perspective: A case study of the Water-Splashing Festival of the Dai people in Xishuangbanna. Geogr. Res. 2012, 31, 269–278. [Google Scholar]
- Qiu, H.; Wang, X.; Wu, M.-Y.; Wei, W.; Morrison, A.M.; Kelly, C. The effect of destination source credibility on tourist environmentally responsible behavior: An application of stimulus-organism-response theory. J. Sustain. Tour. 2023, 31, 1797–1817. [Google Scholar] [CrossRef] [Scilit]
- Huang, S.; Shi, L.; Sheng, D.; He, T.; Guo, X.; Xiao, J. Perceived value, awe, and place attachment: Influencing tourists’ environmentally responsible behavior in desert tourism. Res. Cold Arid. Reg. 2025, 17, 261–268. [Google Scholar] [CrossRef] [Scilit]
- Minazzi, R.; Grechi, D. Exploring Gen Z Sustainable Behavior in the Hospitality Industry. Adm. Sci. 2025, 15, 266. [Google Scholar] [CrossRef] [Scilit]
- Nian, S.; Zhang, H.; Mao, L.; Zhao, W.; Zhang, H.; Lu, Y.; Zhang, Y.; Xu, Y. How outstanding universal value, service quality and place attachment influences tourist intention towards world heritage conservation: A case study of Mount Sanqingshan National Park, China. Sustainability 2019, 11, 3321. [Google Scholar] [CrossRef] [Scilit]
- Lim, C.C.; Bendle, L.J. Arts tourism in Seoul: Tourist-orientated performing arts as a sustainable niche market. J. Sustain. Tour. 2012, 20, 667–682. [Google Scholar] [CrossRef] [Scilit]

Disclaimer/Publisher’s Note: The statements, opinions and data contained in all publications are solely those of the individual author(s) and contributor(s) and not of MDPI and/or the editor(s). MDPI and/or the editor(s) disclaim responsibility for any injury to people or property resulting from any ideas, methods, instructions or products referred to in the content. |
© 2026 by the authors. Licensee MDPI, Basel, Switzerland. This article is an open access article distributed under the terms and conditions of the Creative Commons Attribution (CC BY) license.