


Abstract
This study optimizes fertilization schemes through the emergy analysis of different nutrient reduction treatments in maize cropping ecosystems in Xinjiang, thereby providing technical support for improving chemical fertilizer use efficiency and maintaining the stability of farmland ecosystems. The study was conducted in 2024 at Huaxing Farm in Changji Hui Autonomous Prefecture, Xinjiang Uyghur Autonomous Region. The experiment used the local conventional nitrogen and phosphorus fertilization rates as the control treatment N0P0 (applying P 183 kg·hm−2 and N 246 kg·hm−2), with eight different N and P nutrient reduction treatments: N0P1 (10% reduction in P only), N0P2 (20% reduction in P only), N1P0 (10% reduction in N only), N2P0 (20% N reduction), N1P1 (10% N and P reduction), N1P2 (10% N and 20% P reduction), N2P1 (20% N and 10% P reduction), and N2P2 (20% N and P reduction). Each treatment was replicated three times. Based on biomass data of maize plant components under different fertilization treatments, emergy analysis of farmland ecosystems and integration of economic benefit indicators led to the optimization of an optimal fertilization scheme. Results indicate that the N0P1 treatment performed optimally: maize plant biomass reached 251.09 g, significantly higher than other treatments. The N0P1 treatment exhibited the highest energy output (3.23 × 10¹⁶ sej·hm−2), the highest net energy yield ratio (EYR) of 1.45, and an energy sustainability index (ESI) of 3.34, representing a high level. It also delivered the highest economic benefit, with a net profit of 8571.95 CNY·hm−2 and a production–investment ratio of 1.71. In conclusion, the N0P1 treatment (10% reduction in phosphorus alone) demonstrated superior performance in biomass yield, energy utilization efficiency, ecological sustainability, and economic benefits, making it the optimal fertilization strategy for maize fields in this region.
1. Introduction
Maize is one of the world’s three major grain crops and is also one of China’s main crops. It has now surpassed rice to become a primary grain crop, and its high and stable yield directly affects the total grain production in China [1,2,3]. Xinjiang has long been one of China’s primary maize-producing regions, playing a crucial role in ensuring national food security [4]. At the same time, Xinjiang is also one of the regions in China with the most concentrated distribution of saline–alkali land. The nitrogen and phosphorus deficiency characteristics of saline–alkali land severely restricts the growth and development of maize [5]. To compensate for the deficiency of nitrogen and phosphorus in saline–alkali soils, the fertilization method involving excessive application of nitrogen and phosphorus based on empirical formulas is widely adopted. However, excessive application of nitrogen and phosphorus fertilizers not only exacerbates soil salinization and degrades the soil microbial environment but also restricts crop uptake of nutrients and water. This leads to reduced fertilizer utilization efficiency and diminished agricultural yield and quality, posing a serious threat to the stability and sustainability of farmland ecosystems [6,7,8,9,10,11].
Regarding this issue, scholars have conducted research on optimizing nitrogen and phosphorus over-fertilization patterns in Xinjiang farmland. However, existing findings exhibit notable limitations: Yu Zhuo et al. [12] optimized fertilizer application for cotton by reducing inputs based on ecological stoichiometric ratios, while He Xiaoju et al. [13] optimized winter wheat fertilization by reducing inputs to improve soil physicochemical and microbial properties. Both studies proposed relatively mature optimization treatments. Both approaches focus on specific crops and single evaluation dimensions, and neither has yet conducted fertilization optimization research from an energy flow perspective for maize cultivation in saline–alkali soils. The rationality of energy flow within agricultural ecosystems serves as a core criterion for evaluating the maturity of fertilization schemes. As an effective method for quantifying ecosystem energy flows and assessing sustainability, energy value analysis enables a comprehensive balance of ecological and economic benefits. However, this method has yet to be applied in optimizing nitrogen and phosphorus reduction in fertilization of saline–alkali maize fields in Xinjiang. The absence of research on precise maize fertilization schemes based on energy value analysis has resulted in existing optimization approaches struggling to comprehensively balance maize yield, economic benefits, and farmland ecological sustainability. Consequently, they fail to provide more integrated fertilization technical support for maize-producing regions in Xinjiang.
In recent years, emergy analysis has been applied to studies of various agricultural ecosystems and their subsystems. For instance, Hu Xiaodong et al. [14] employed emergy analysis to compare the development potential and environmental load of agricultural ecosystems across multiple provinces, municipalities, and autonomous regions in western China, thereby offering constructive recommendations for sustainable agricultural development in the region. Zheng Erwei et al. [15] conducted an emergy analysis of Henan Province’s agricultural ecosystem, revealing that while the province maintains a sound state of sustainable agricultural development, it exhibits a strong dependence on non-renewable resources. Regarding subsystems, Yang Hailong et al. [16] analyzed the energy balance of two rice production systems in Guizhou Province—pure rice cultivation and rice–fish co-cultivation—and clearly demonstrated that the rice–fish co-cultivation model exhibits superior energy utilization efficiency and environmental carrying capacity compared to pure rice cultivation. Zhong Ying et al. [17] analyzed the energy value status of the rice–frog ecological farming system in Qingpu District, Shanghai, and found that this system experiences relatively low environmental pressure and possesses significant potential for sustainable development, making it a green production model worthy of promotion. Zhou Jiang et al. [18] employed energy value analysis to examine the development status and comprehensive development level of rice-growing systems in Hunan Province from 2002 to 2016. They found that as production methods became increasingly modernized, the development potential of rice-growing systems progressively declined. These studies provide established methodological references for applying energy value analysis in optimizing agricultural fertilization practices.
Based on this, this study focuses on maize cultivated in saline–alkali soils in Xinjiang. By applying nitrogen and phosphorus reduction treatments at different gradients, the energy value analysis method was employed to systematically quantify the energy flow characteristics within the agroecosystem under each treatment. By integrating economic benefit indicators to establish a dual-dimensional “ecological–economic” evaluation system, the study identifies the optimal fertilization regimen, balancing maize biomass yield with ecological sustainability. This research aims to fill the gap in applying emergy analysis to fertilization optimization in Xinjiang’s saline–alkali maize fields, providing technical guidance and theoretical basis for reducing chemical fertilizer use, enhancing fertilization efficiency, and promoting agricultural ecological sustainability in the region.
2. Materials and Methods
2.1. Test Site
This experiment was conducted in 2024 at Huaxing Farm (87.2515° N, 44.1770° E) in Changji Hui Autonomous Prefecture, Xinjiang Uyghur Autonomous Region. The site features a temperate continental climate characterized by cold winters, hot summers, significant diurnal temperature fluctuations, abundant sunlight, and a long frost-free period. The region receives 2700 h of annual sunshine, with an average annual precipitation of 190 mm and an average annual temperature of 6.8 °C. The soil nutrient status of the experimental plots is shown in Table 1:
Table 1.
Soil nutrient status of experimental plots.
2.2. Experimental Design
The maize variety tested in this experiment is “Xinyu 74,” which is currently widely cultivated in Northern Xinjiang. This variety has a growth period of approximately 120 days. The fertilizers selected for the trial were urea (N: 46.3%), monoammonium phosphate (N: 12.17%, P2O5: 61.74%), potassium sulfate (K2O: 51%), and a water-soluble compound fertilizer containing macronutrients (N: 6%, P2O5: 30%, K2O: 30%).
This experiment used the conventional fertilization rate in local maize cultivation as the control treatment N0P0 (applying 183 kg·hm−2 of P and 246 kg·hm−2 of N). Eight different levels of N and P nutrient reduction treatments were established: N0P1 (10% reduction in P only), N0P2 (20% reduction in P only), N1P0 (10% reduction in N only), N2P0 (20% N reduction), N1P1 (10% N and P reduction), N1P2 (10% N and 20% P reduction), N2P1 (20% N and 10% P reduction), and N2P2 (20% N and P reduction). The experiment comprised 9 treatments (Table 2), each replicated three times, totaling 27 plots. Each plot measured 23 m2 (2.3 m × 10 m), and a two-factor randomized block design was employed. During the trial period, in addition to the base fertilizer, three top-dressing applications were conducted (at the seedling emergence stage, the small bell mouth stage, and the grain filling stage). The fertilizer application rate for each treatment was implemented according to the above proportions.
Table 2.
Fertilization treatment schemes. (kg·hm−2).
2.3. Samples Collection
During maize harvest, 3 uniformly developed plants per plot were sampled, totaling 9 plants per treatment. The six plant components—stalk, leaves, husks (the leafy bracts enclosing the ear of maize), tassels, kernels, and cob—were placed separately into sample bags, each clearly labeled with the treatment code. The biomass of each component was determined using the oven-drying method. Each component was first placed in an oven at 120 °C for 2 h to kill microorganisms, then dried at 80 °C until constant weight was achieved. Subsequently, each sample was ground, sieved, bagged, and labeled.
2.4. Emergy Analysis
2.4.1. Emergy Data Collection
Emergy analysis data mainly involves statistical calculations of the system’s inputs and outputs for the year 2024. The data used in this study includes ① Regional trial data; ② Literature and statistical data, including publicly available government statistics (e.g., soil erosion data of Changji City from the Master Plan for Soil and Water Conservation of Changji City, and data released by the Bureau of Statistics of the Xinjiang Uyghur Autonomous Region); and relevant research data from He et al. [18].
2.4.2. Calculation of Emergy Indicators
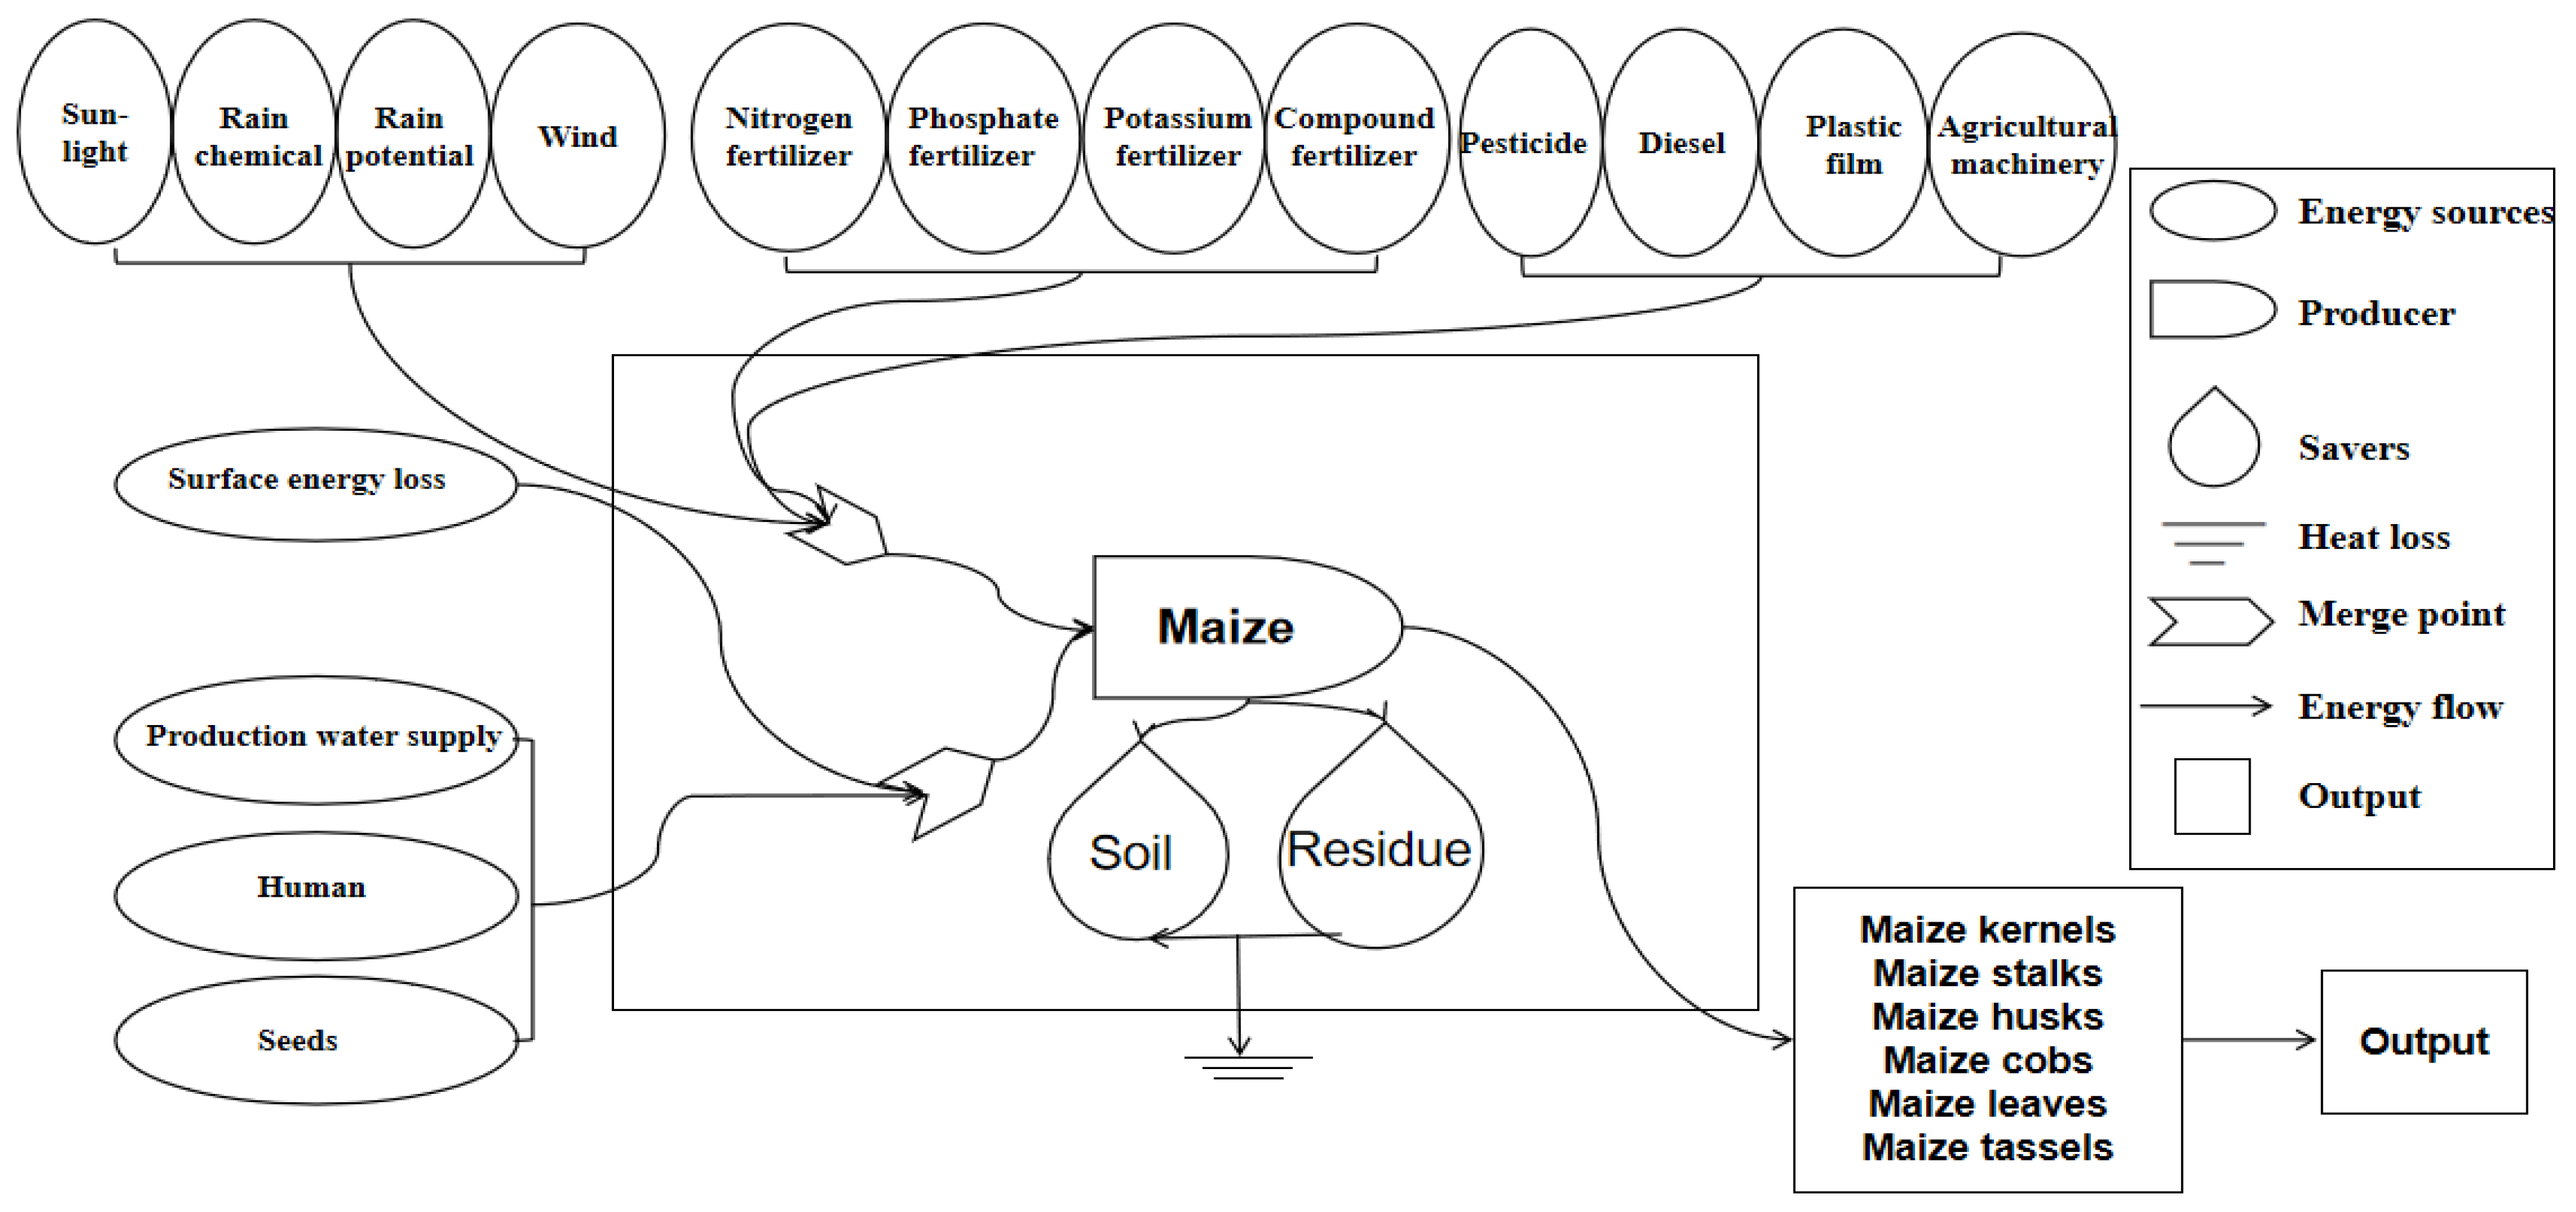
This study details all inputs and outputs throughout the entire maize growth cycle. System inputs mainly include renewable environmental resources (EmR), non-renewable environmental resources (EmN), non-renewable industrial auxiliary emergy (EmF), and renewable organic emergy (EmT). The sum of these components constitutes the total emergy input (EmU). Total emergy output (EmY) mainly includes maize kernels, stalks, leaves, husks, tassels, and cobs (Figure 1).
Figure 1.
Emergy flow diagram of maize farmland ecosystems.
The collected and recorded input and output data were calculated using the latest global emergy baseline (1.20 × 1025 sej·a−1) [19], where emergy conversion coefficients and emergy conversion ratios were uniformly converted to solar emergy values (Table 3).
Table 3.
Emergy conversion ratios and their sources in maize farmland ecosystems.
The calculation formulas referenced relevant studies [23,24,25]. The primary emergy calculation formulas for key inputs are as follows:
The emergy values of renewable resources—solar emergy, wind emergy, rainfall potential emergy, rainfall chemical emergy, and net emergy loss from topsoil erosion—were calculated using the following formulas:
Solar emergy = Crop planting area (m2) × Solar radiation per unit area during the growing season (J·m−2)
Wind emergy = Crop planting area (m2) × Height (m) × Air density (1.29 × 10³ g·m−3) × Eddy diffusion coefficient (12.95 m3·s−1) × Wind speed gradient (3.93 × 10⁻³ m·s−1) × Wind emergy conversion efficiency
Rainfall potential emergy = Crop planting area (m2) × Average rainfall during the crop growing period (m) × Rainfall density (106 g·m−3) × Elevation (m) × Gravitational acceleration (9.8 m·s−2) × Rainfall potential emergy conversion rate
Rainfall chemical emergy = Crop planting area (m2) × Average rainfall during the crop growing period (m) × Rainfall density (106 g·m−3) × Rainfall free emergy (4.94 J·g−1) × Rainfall chemical emergy conversion efficiency
Net emergy loss from topsoil erosion = Soil erosion modulus (g·hm−2) × Organic matter emergy (J·g−1) × Soil organic matter content (g·kg−1) × Cultivated area (hm2) × Emergy conversion rate
The calculation formulas for renewable organic emergy, total emergy output, and diesel emergy are as follows:
Emergy = Material quantity × Emergy conversion coefficient × Emergy conversion ratio
The calculation formula for non-renewable industrial auxiliary emergy (excluding diesel) is as follows:
Emergy = Material quantity × Emergy conversion rate
Finally, the emergy-based sustainability indicators were calculated, as presented in Table 4.
Table 4.
Emergy-based sustainability indicators and their definitions.
2.4.3. Data Processing
Data were organized using Excel 2021 software. One-way ANOVA was performed on experimental data using IBM SPSS Statistics 26.0 software. Homogeneity of variance tests were conducted prior to comparisons. When variances were homogeneous, the Least Significant Difference (LSD) method was applied; when variances were heterogeneous, Tamhane’s Ta method was used (p < 0.05 indicated significant differences). All data in the tables are presented as mean ± standard error.
In the energy input data, natural energy sources (solar energy, rainwater energy, wind energy, etc.) are derived from meteorological monitoring data of the study area. Artificial energy inputs (fertilizers, pesticides, agricultural machinery operations, etc.) are recorded through field trials and uniformly converted into input quantities per unit area (hm2). Referencing conversion rates from classical literature on energy value analysis, all materials and energy inputs are uniformly converted into solar energy units (sej). The energy value output data represents the dry matter mass of various components of maize plants (kernels, stalks, leaves, etc.), which is converted into corresponding energy values through energy density calculations to ensure comparability among different types of energy value indicators. Using Excel 2021 software, descriptive statistics were conducted on the core energy value indicators for each treatment. With the (full fertilization) treatment as the control, the relative change rates of energy value indicators for each treatment were calculated to visually demonstrate the extent to which nitrogen and phosphorus reduction modulates the system’s energy value characteristics.
3. Results and Analysis
3.1. Biomass of Individual Components and Total Biomass of Maize Plants Under Different Treatments
As shown in Table 5, different nitrogen and phosphorus nutrient reduction treatments exerted significant effects on the biomass of individual maize components and total biomass. Compared with the control N0P0 treatment, the N0P1 treatment showed the most favorable performance. with significant increases in stem, grain, leaf, glume, rachis biomass, and total biomass at 19.0%, 16.1%, 23.5%, 18.5%, 21.7%, and 18.6%, respectively. Only tassel biomass showed no significant increase. The N1P0 treatment significantly increased grain, leaf, glume, tassel, rachis biomass, and total biomass. Specifically, leaf biomass increased by 47.5%, ear biomass by 43.2%, and total biomass by 13.6%. Only stalk biomass showed a slight, non-significant decrease. Both economic yield and total biomass achieved simultaneous significant increases. Under N1P1 treatment, leaf and spike biomass increased significantly by 15.4% and 39.3%, respectively, while no significant changes were observed in other components or total biomass; N2P0 treatment significantly increased stem and ear biomass by 10.6% and 25.0%, respectively, while total biomass and economic yield showed no significant difference compared to the control. Stem biomass and total biomass significantly decreased by 10.3% and 5.1% in N0P2-treated plants, while leaf sheath and ear biomass significantly increased by 12.0% and 18.8%, respectively. No significant changes were observed in economic yield; stem, leaf, bract, and ear biomass significantly increased under N1P2 treatment, while grain biomass decreased significantly by 21.0%. Total biomass showed no significant change. The N2P1 and N2P2 treatments performed poorly, with the former showing significant reductions of 8.6% and 16.4% in grain and rachis biomass, respectively. The latter exhibited significant decreases of 15.8% and 5.3% in grain biomass and total biomass, respectively. Both treatments demonstrated significant declines in total biomass and economic yield.
Table 5.
Biomass of individual components and total biomass of maize plants under different treatments (g·plant−1).
3.2. Emergy Flow Analysis of Maize Farmland Ecosystems Under Different Management Practices
3.2.1. Emergy Input and Output
As shown in Table 6 and Table 7, different nitrogen and phosphorus nutrient reduction treatments exert significant effects on the energy input and output within maize farmland ecosystems. In terms of energy input, the N0P0 treatment exhibited the highest total energy input (EmU), reaching 1.52 × 10¹⁶ sej·hm−2. For the remaining treatments, total energy input gradually decreased with increasing nitrogen and phosphorus reduction levels, with the N2P2 treatment showing the lowest value (1.46 × 10¹⁶ sej·hm−2). It is noteworthy that the total quantities of all processed renewable resource energy (EmR, 5.05 × 10¹⁴ sej·hm−2), non-renewable resource energy (EmN, 1.10×10¹⁴ sej·hm−2), and renewable organic energy (EmT, 1.00 × 10¹⁶ sej·hm−2) are identical, with only slight variations in their respective proportions: EmR accounted for 3.33–3.47%, EmN remained stable at 0.72–0.75%, while EmT increased to 65.84–68.62% as nutrient reduction intensified.
Table 6.
Emergy inputs and outputs of maize farmland ecosystems under different nutrient management treatments (×1015 sej·hm−2).
Table 7.
Proportion of emergy value in inputs and outputs of maize farmland ecosystems under different treatments (%).
Non-renewable industrial auxiliary energy (EmF) is the core factor driving variations in total energy input values, with both its total volume and proportion showing a decreasing trend alongside reductions in nitrogen and phosphorus inputs. The N0P0 treatment exhibited the highest EmF (4.57 × 10¹⁵ sej·hm−2, accounting for 30.11%), while the N2P2 treatment showed the lowest (3.96 × 10¹⁵ sej·hm−2, accounting for 27.16%). The remaining treatments exhibited EmF values ranging from 4.06 × 10¹⁵ to 4.45 × 10¹⁵ sej·hm−2, accounting for 27.68% to 29.54%. Further analysis indicates that differences in EmF primarily stem from varying fertilizer application rates, while other industrial auxiliary energy inputs such as pesticides, agricultural films, and machinery remained consistent. Nitrogen fertilizer energy value accounted for 8.20–11.21% of total inputs, with phosphorus fertilizer energy value representing 5.65–7.32%. Both energy values showed a pronounced downward trend as corresponding nutrient levels decreased.
In terms of energy output, different processing methods exhibit significant performance variations. The N0P1 and N1P0 treatments demonstrated optimal performance: both the energy content of individual components (maize stalks, kernels, leaves, etc.) and the total energy output significantly increased under the N0P1 treatment, with a cumulative increase of 18.0%. This treatment achieved a synergistic enhancement in the energy content of both vegetative and reproductive organs. N1P0 treatment increased total output energy by 15.7%, with leaf energy increasing by 47.6% and ear energy increasing by 73.4%, achieving optimal energy allocation. The total output energy of N1P1 and N2P0 treatments showed no significant difference from the control, with energy allocation patterns between vegetative and reproductive organs resembling those of the N0P0 treatment. Nutrient and reproductive organs in the N0P2, N2P1, and N2P2 treatments all showed a downward trend in energy value. Among these, the N2P2 treatment exhibited a significant 9.0% reduction in total energy output, with grain energy value decreasing by 16.0%. The N1P2 treatment exhibited an imbalance in energy allocation, with a significant increase in the energy value of vegetative organs such as stems and leaves, but a significant decrease of 21.3% in grain energy value, resulting in an 8.4% reduction in total energy output.
In summary, moderate reduction in a single nutrient (N0P1 treatment, N1P0 treatment) can enhance the system’s energy value output efficiency and rationality of energy allocation while reducing industrial auxiliary energy input. Conversely, high-ratio nutrient reduction or dual-factor synergistic reduction tends to lead to decreased energy value output or imbalanced allocation.
3.2.2. Comparative Analysis of the Emergy Sustainability Development Index (ESDI) Across Different Nutrient Management Treatments
This study calculated the Emergy Sustainability Development Index (ESDI) for different treatment schemes based on multiple solar energy value indicators and compared the results. As shown in Table 8, different nutrient reduction treatments significantly influenced the ESDI of each treatment scheme.
Table 8.
Comparison of emergy-based sustainability indicators across different nutrient management treatments.
Renewable Energy Utilization Rate (REN) reflects the efficiency with which agricultural ecosystems utilize renewable resources. In this study, nutrient reduction treatments at different levels did not significantly affect REN across various treatments. Non-renewable industrial auxiliary energy utilization rate (NR) reflects the degree of dependence of farmland ecosystems on the energy value of external inputs. In this experiment, the REN and NR values under different fertilization treatments were similar, ranging from 0.66 to 0.69 and 0.27 to 0.30, respectively.
Energy Self-Sufficiency Ratio (ESR) reflects the capacity of agricultural ecosystems to be self-sufficient. The ESR values for all fertilization treatments in this experiment were identical at 0.04.
Energy value density reflects the intensity of energy utilization in a system’s economic development. In this experiment, the energy density gradually decreased with reduced nutrient levels. The N0P0 treatment exhibited the highest energy density at 1.52 × 10¹² sej·m−2, while the N2P2 treatment showed the lowest at 1.46 × 10¹² sej·m−2.
The Environmental Load Rate (ELR) reflects the degree of environmental pressure exerted by an ecosystem during its production processes. In this experiment, the ELR values across different fertilization treatments were similar, ranging from 0.39 to 0.45. The N0P0 treatment exhibited the highest ELR at 0.45, while the N2P2 treatment showed the lowest ELR at 0.39.
The net energy yield ratio (EYR) reflects the productivity of agricultural ecosystems. Significant differences in EYR were observed among different fertilization treatments in this experiment. Compared to the N0P0 treatment, EYR increased by 18.62%, 17.55, 4.26%, and 3.72% in the N0P1, N1P0, N1P1, and N2P0 treatments, respectively. The EYR in the N0P2, N1P2, N2P1, and N2P2 treatments decreased by 3.19%, 5.85%, 2.22%, and 5.32%, respectively, compared to the N0P0 treatment.
The Ecological Sustainability Index (ESI) is a commonly used metric for assessing the sustainability of agricultural ecosystems. In this experiment, the ESI values for different fertilization treatments showed varying degrees of increase compared to the N0P0 treatment. Among them, the N1P0 and N0P1 treatments exhibited relatively high ESI values of 3.40 and 3.34, respectively.
In summary, moderate reduction in a single nutrient (N0P0 treatment and N1P0 treatment) can significantly enhance system productivity and sustainability while reducing environmental load.
3.3. Economic Benefits
Table 9 indicates that the economic benefits of different treatments vary significantly. According to the investigation, the maize purchase price in Xinjiang for 2024 is 2.1 yuan·kg−1. The commercialization rate of maize in the Xinjiang region is approximately 92%. Other production costs (labor, machinery, water and electricity, seeds, etc.) amount to 8838 CNY·hm−2. After comprehensively considering all expenses, the economic benefits per hectare for different maize treatments are calculated as shown in Table 9. Research findings indicate that the output value of the N0P1 and N1P0 treatments increased by 13.91% and 9.93%, respectively, compared to the N0P0 treatment. The output value of the N0P2, N1P1, N1P2, N2P0, N2P1, and N2P2 treatments all decreased to varying degrees relative to the N0P0 treatment, with the N0P1 treatment yielding the highest output value. The net yield under different nutrient reduction treatments varied by −58.77% to 45.50% compared to the N0P0 treatment. Compared to the N0P0 treatment, the net profits of the N0P1 and N1P0 treatments increased by 45.50% and 33.69%, respectively, showing positive growth. However, the net profits of the N0P2, N1P1, N1P2, N2P0, N2P1, and N2P2 treatments decreased by 8.42%, 0.76%, 58.77%, 11.84%, 27.82%, and 46.01%, respectively, compared to the N0P0 treatment. Among them, the N0P1 treatment yielded the highest net profit. Compared with the N0P0 treatment, the output-to-input ratios for the N0P1, N1P0, and N1P1 treatments increased by 16.33%, 12.24%, and 1.36%, respectively. The output-to-input ratios for the N0P2, N1P2, N2P0, N2P1, and N2P2 treatments decreased by 2.04%, 18.37%, 2.72%, 6.80%, and 12.93%, respectively. Comprehensive analysis indicates that the N0P1 treatment outperforms all other treatments in terms of output value, net profit, and production–investment ratio. It not only increases production revenue but also reduces production costs.
Table 9.
Comparison of economic benefits across different treatments. (CNY·hm−2).
4. Discussion
4.1. Effects of Different Nutrient Reduction Treatments on Emergy Flow in Maize Farmland Ecosystems
Nitrogen and phosphorus, as key nutrients for maize growth and development, directly determine the synthesis, distribution, and accumulation efficiency of photosynthetic products in plants, thereby affecting the function of various organs and the formation of final yield. This study systematically analyzed the regulatory effects of different fertilization patterns on maize material production and allocation by integrating stem, leaf, bract, grain, rachis, tassel, and total biomass data from eight nitrogen–phosphorus reduction treatments and a full-rate control (N0P0). Results indicate that the N0P1 treatment exhibited significantly higher total biomass than the control and other reduced-application treatments. This represents the optimal nutrient reduction strategy, balancing yield and efficient nutrient utilization. Its advantage likely stems from the synergistic effects of enhanced soil nutrient conversion efficiency and optimized maize physiological metabolism.
From the perspective of soil nutrient transformation pathways, the 10% phosphorus reduction in the N0P1 treatment enhanced nitrogen–phosphorus conversion efficiency by regulating the soil microbial community structure. Moderate phosphorus stress significantly enhances the activity of functional microorganisms such as soil ammonia-oxidizing bacteria and phosphorus-solubilizing bacteria. This promotes the mineralization of soil organic nitrogen into readily available nitrogen while converting insoluble phosphorus into readily available phosphorus that maize can absorb. It also avoids the antagonistic effect of excessive phosphorus on nitrogen uptake, providing a sustained and stable nutrient supply for maize growth. This aligns with findings by Wang Yan et al. [26] that moderate phosphorus reduction can alter soil microbial community structure and enhance nutrient activation functions. Meanwhile, the activating effect of moderate fertilizer reduction on soil functional microorganisms has been validated in multiple studies. Moderate nutrient stress can enhance the adaptability of soil nutrient supply by altering the soil microenvironment and directing the enrichment of microorganisms involved in nitrogen and phosphorus transformation [27]. The N0P2, N2P2, and other severe nutrient reduction treatments, due to insufficient nutrient supply, directly limited root absorption and transport, resulting in a significant reduction in biomass.
From the perspective of maize physiological processes, the full nitrogen supply under the N0P1 treatment ensured efficient photosynthetic metabolism, while the 10% phosphorus reduction optimized nutrient allocation between source and sink. Nitrogen is a core component of chlorophyll and photosynthetic enzymes. Full nitrogen supply maintains high chlorophyll content and photosynthetic enzyme activity in maize leaves, enhancing the capacity for photosynthetic product synthesis. Moderate phosphorus reduction can regulate source–sink relationships, promote the transport of photosynthetic products to core components such as stems and grains, and enhance biomass accumulation efficiency. Research by Meng Tiantian et al. [28] confirmed that nitrogen supply levels exhibit a significant positive correlation with maize photosynthetic characteristics and dry matter accumulation. Optimal nitrogen supply maintains photosynthetic efficiency during critical growth stages, providing material support for biomass accumulation. In contrast, under other nitrogen reduction treatments, the total synthesis of photosynthetic products was constrained. Under severe phosphorus reduction treatments, insufficient phosphorus impaired energy metabolism, inhibited grain filling, and ultimately reduced total biomass.
In summary, the N0P1 treatment achieved precise alignment between soil nutrient supply and maize physiological demands by moderately reducing phosphorus application by 10% to enhance soil nutrient conversion efficiency, while full nitrogen supply optimized photosynthetic and material allocation physiological processes.
4.2. Emergy Sustainability Development Index (ESDI) Analysis: A Comparative Study Across Different Nutrient Management Treatments
The Energy Structure Diversity Index (ESDI) reflects the structure, function, and efficiency of energy flows within ecosystems, as well as the relationships between the economy and ecosystems, and between humans and nature [29]. This study systematically analyzed the effects of different nitrogen and phosphorus reduction fertilization schemes on the energy flow characteristics of the Xinjiang maize farmland ecosystem based on energy value theory. It aims to reveal the sustainable development potential of farmland systems under nitrogen and phosphorus regulation from an ecological energy perspective. This experiment uses the N0P0 treatment as a control to focus on investigating the response patterns of core energy indicators such as renewable organic energy utilization rate (REN) and non-renewable industrial auxiliary energy utilization rate (NR). It aims to provide a theoretical basis for reducing chemical fertilizer use and optimizing ecological conditions in Xinjiang maize cultivation.
Reduced nitrogen and phosphorus fertilization exerts a significant regulatory effect on the energy value utilization structure of farmland ecosystems. Renewable Energy Utilization Rate (REN) is the ratio of renewable organic energy value to total input energy value in farmland ecosystems. A higher ratio indicates greater utilization of renewable resources and stronger sustainable development capacity within the system [30]. In this experiment, REN showed a steady upward trend as nitrogen and phosphorus application rates decreased. The REN value under the N2P2 treatment reached 0.69, representing a 4.55% increase compared to the control. This change may stem from increased reliance on renewable organic energy sources—such as soil organic matter and microbial metabolites—within the agricultural system following reduced nitrogen and phosphorus inputs. Plants have enhanced their utilization efficiency of endogenous soil energy by optimizing root morphology and nutrient uptake strategies. This finding aligns with research by Meng Yue et al. [31], which concluded that appropriately reducing chemical fertilizer application can significantly enhance soil microbial carbon utilization efficiency while increasing the content of dissolved organic carbon, nitrogen, and other substances in the soil. Non-renewable industrial auxiliary energy utilization rate (NR) is the ratio of non-renewable industrial auxiliary energy input to total energy input in farmland ecosystems. A higher ratio indicates greater dependence of the farmland ecosystem’s normal functioning on external energy inputs [32]. In this experiment, NR showed a significant downward trend across different treatments. The NR value for the N2P2 treatment was 0.27, representing a 10.00% reduction compared to the control. This indicates that reduced nitrogen and phosphorus fertilization effectively decreased the system’s consumption of industrial auxiliary energy sources such as chemical fertilizers and pesticides, thereby lowering reliance on fossil fuels during production processes. This aligns with the findings of Li Shuqiang et al. [33], who concluded that reducing nitrogen and phosphorus fertilizer application can decrease auxiliary energy consumption in industrial processes. Energy Self-Sufficiency Ratio (ESR) reflects the self-sufficiency capacity of agricultural ecosystems [34]. In this experiment, the NR values under different nutrient reduction treatments all stabilized at 0.04, showing no significant difference from the control. This may be related to the practical situation in Xinjiang maize production where the proportion of renewable energy inputs such as irrigation water remains relatively fixed. It indicates that adjustments to nitrogen and phosphorus fertilization schemes did not alter the energy self-sufficiency foundation of the farmland system, but only optimized the internal structure of energy utilization.
Energy value density represents the ratio of total energy input to area in agricultural ecosystems, reflecting the intensity of energy utilization in the system’s economic development [30]. Environmental Load Ratio (ELR) refers to the ratio of non-renewable to renewable resource capacity, reflecting the magnitude of environmental pressure exerted by ecosystems during production processes [35]. Changes in ED and ELR reflect the dual effects of reduced nitrogen and phosphorus fertilization on both resource intensity and environmental pressure within the system. The ED value exhibited a continuous downward trend with decreasing nitrogen and phosphorus application rates. The ED value for the N2P2 treatment was 1.46 × 10¹² seJ·hm−2, representing a 3.95% reduction compared to the control. This indicates that reduced fertilizer application led to a decrease in the total energy input per unit area of farmland, resulting in a lower level of resource intensity within the system. The change in ELR value demonstrated a positive effect, decreasing from 0.45 to 0.39 as nitrogen and phosphorus application rates were reduced, representing a 13.33% decline. This reduction in industrial auxiliary energy inputs directly lowers the intensity of ecological disturbances caused by energy consumption, such as carbon emissions from fertilizer production and pollution risks from nitrogen and phosphorus runoff in farmland, demonstrating the ecological benefits of reduced fertilizer application. This aligns with the findings of Fu Liu et al. [36], who concluded that reducing nitrogen fertilizer application rates in conjunction with optimized fertilization practices can decrease nitrogen loss, mitigate environmental risks, and simultaneously maintain crop yields and economic benefits.
The net energy yield ratio (EYR) reflects the productivity of agricultural ecosystems; a higher ratio indicates greater system productivity [37]. The Ecological Sustainability Index (ESI) is defined as the ratio of EYR to ELR within a system and serves as a commonly used metric for assessing the sustainability of agricultural ecosystems [38]. The combined changes in EYR and ESI reflect the ecological and economic synergistic effects of reduced nitrogen and phosphorus fertilization. Changes in EYR values exhibit a distinct fertilization gradient pattern. Single-factor reduction treatments (N0P1, N1P0) showed significantly higher EYR values than the control, indicating that moderately reducing nitrogen or phosphorus application can lower energy input while maintaining system energy output, thereby maximizing input–output efficiency. The EYR values for dual-factor high-ratio reduction treatments (e.g., N1P2, N2P2) were lower than the control, indicating that excessively low nitrogen and phosphorus application rates restrict maize growth and development, thereby reducing the system’s energy yield potential. This finding is consistent with the conclusion reached by Wang et al. [39] that excessive reduction in fertilizer application inhibits maize carbon and nitrogen metabolism and reduces dry matter accumulation. As a core indicator for evaluating the sustainability of the system, the trend of ESI is basically consistent with EYR. The ESI value was highest in the N1P0 treatment, showing a 23.64% increase compared to the control, while the ESI value in the N2P2 treatment increased by only 8.73%.This result indicates that single-factor moderate fertilizer reduction (such as N0P1 and N1P0) represents the optimal approach for balancing ecological benefits and production efficiency. In contrast, while high-proportion reduction in both factors can reduce environmental load, it comes at the cost of sacrificing part of the emergy output efficiency, which is detrimental to the sustainable development of the system. This conclusion aligns with the sustainability evaluation principle proposed by Li Yiming et al. [40], which emphasizes that fertilizer optimization in arid-region crop cultivation must balance resource inputs and output efficiency.
This study systematically and comprehensively evaluated the energy flow status of maize farmland ecosystems under different nitrogen and phosphorus reduction treatments through energy value analysis. By measuring field biomass and analyzing economic efficiency indicators, recommended fertilization schemes were proposed. However, several issues warrant further investigation. First, the experiment was a short-term study and did not reflect the cumulative effects of long-term fertilization on soil fertility, microbial communities, and energy flow. Second, the experiment was confined to specific saline–alkali soil and climatic conditions in Changji, Xinjiang, and to the “Xinyu 74” maize variety, limiting its regional and varietal applicability and reducing its generalizability. Third, the study only employed 10% and 20% reduction gradients for nitrogen and phosphorus, without addressing potassium or the combined application of organic and inorganic fertilizers. These limitations do not affect the reliability of the core conclusions but only restrict the scope and depth of their generalizability. Future research could expand multi-site trials across different regions of Xinjiang, incorporate multiple maize varieties, and conduct cross-regional collaborative studies to further enhance the conclusions’ universality and practical value.
5. Conclusions
This study used the maize variety “Xinyu 74” as the experimental material and conducted field trials at the Huaxing Farm in Changji, Xinjiang. By comparing the biomass accumulation characteristics of maize under different fertilization treatments and combining energy value analysis methods, the study systematically explored the energy flow patterns of maize farmland ecosystems under each treatment, while simultaneously accounting for their economic benefits. The aim was to select the optimal fertilization scheme suitable for maize production in this region. The research conclusions are as follows:
In terms of biomass performance, maize biomass under the N0P1 fertilization treatment was significantly higher than in other treatments, laying the foundation for high yields. Energy value analysis results indicate that the N0P1 fertilization treatment not only exhibits the highest energy value utilization efficiency but also maintains a high level of sustainable development in the farmland ecosystem. This approach achieves efficient energy conversion while simultaneously ensuring ecosystem stability and long-term sustainability. Economic benefit calculations indicate that the N0P1 fertilization treatment ranked first in both net profit and production–investment ratio, demonstrating outstanding economic viability and input–output advantages.
Based on the three core evaluation dimensions of total biomass, energy value efficiency, and economic benefits, the N0P1 fertilization treatment effectively balances the objectives of high maize yield, ecological efficiency, and economic gains. It aligns with the production requirements for the “Xinyu 74” maize variety at Changji Huaxing Farm in Xinjiang and can be promoted as the optimal fertilization strategy for maize cultivation in this region.
Author Contributions
K.L. designed the research protocol, performed the experimental procedures, analyzed the data, and drafted the initial manuscript. W.F. conceived the project, supervised the research work, performed critical revisions to the manuscript regarding key academic content, and secured funding support. All authors have read and agreed to the published version of the manuscript.
Funding
This research was supported by the National Key R&D Program of China, “Group Intelligence-Based Autonomous Operations for Smart Farming Decision-Making” (2022ZD0115801).
Institutional Review Board Statement
Not applicable.
Informed Consent Statement
Not applicable.
Data Availability Statement
All data utilized in this work are accessible. Citations provided throughout the text identify the sources of referenced data.
Conflicts of Interest
The authors declare no competing interests. The references included are relevant to the content presented.
References
- Wang, H.; Wu, Y. Major Problems Facing World Food Security. China Investig. Mag. 2021, 3, 42–43. [Google Scholar]
- Gong, J.J.; Liu, Z.J.; Zhu, G.X.; Shi, D.; Zhang, Z.; Fu, Z.; Lu, X.; Qu, H.; Yang, X. Effects of climate change on maize productivity in China during 2015 to 2100 based on APSIM model. Trans. Chin. Soc. Agric. Eng. 2023, 39, 167–178. [Google Scholar]
- Li, S.; Wang, C. Analys is on Change of Production and Factors Promoting Yield Increase of Maize in China. J. Maize Sci. 2008, 16, 26–30. [Google Scholar] [CrossRef]
- Xu, H. Analysis of Suitable Sowing Date of Spring Maize in Northern Xinjiang Based on Both APSIM Model and Field Sowing Date Experiment. Master’s Thesis, Shihezi University, Shihezi, China, 2018. [Google Scholar]
- Heng, T.; Wang, Z.; Zhang, J.; Li, W. Development of Farmland Drainage Technology to Control Saline-land in Xinjiang. J. Agric. Sci. Technol. 2019, 21, 161–169. [Google Scholar] [CrossRef]
- Pan, Z.L.; Liu, H.F.; Zhao, S.X.; Ma, H.L.; Zhang, C.Y.; Duan, Z.P. The influence of nitrogen fertilizer input on electrical conductivity of different soil types. J. Fujian Agric. For. Univ. (Nat. Sci. Ed.) 2021, 50, 5. [Google Scholar]
- Huang, J.; Kong, Y.; Xu, Q. Progresses for Characteristics and Amelioration Measures of Saline Soil. Soils 2022, 54, 6. [Google Scholar]
- Zhu, H.Y.; Gan, B.; Xu, J.B.; Liang, F.; Zhou, B.B.; Sun, Y.; Duan, M.L.; Bai, Y.H. Effect of Soil Salinity on Nitrogen Transformation in Soil with Nitrogen Fertilizer Application. Appl. Ecol. Environ. Res. 2023, 21, 5625–5642. [Google Scholar] [CrossRef] [Scilit]
- Jin, L.; Zhou, J.M.; Wang, H.Y.; Chen, X.Q.; Du, C.W. Transformation and translocation of fertilizer-P with DAP application at fertisphere in calcareous soil. Phosphate Compd. Fertil. 2008, 23, 14–18. [Google Scholar]
- Barrow, N.J.; Hartemink, A.E.E. The effects of pH on nutrient availability depend on both soils and plants. Plant Soil 2023, 487, 21–37. [Google Scholar] [CrossRef] [Scilit]
- Ye, Q. Negative impacts of chemical fertiliser application on agro-ecological environment and countermeasures. Sci. Dev. Res. 2023, 3, 31–33. [Google Scholar] [CrossRef]
- Zhuo, Y. Research on Fertilization Optimization In Xinjiang Cotton Fields Based on Ecological Stoichiometry and Dssat Model. Master’s Thesis, Jiangsu University, Zhenjiang, China, 2025. [Google Scholar]
- He, X. Investigating The Soil-Microbe-Winter Wheat Coupling Relationship Under Reduced Nitrogen and Phosphorus Fertilization. Master’s Thesis, Jiangsu University, Zhenjiang, China, 2025. [Google Scholar]
- Hu, X.; Wang, L.; Xue, L.; Zou, C.; Zhang, Y. Study on Sustainable Development of Agro-Ecosystem in China’s Western Region Based on EMA and GIS. J. Southwest Univ. 2010, 32, 712. [Google Scholar]
- Zheng, E.W.; Zhou, H.S.; Lü, C.M.; Ling, M.H.; Gu, C.K.; Li, Y. Emergy evaluation of agricultural ecosystems in Henan Province considering non-point source pollution. J. Agric. Resour. Environ. 2020, 37, 689–694. [Google Scholar] [CrossRef]
- Yang, H.L.; Lv, Y.; Min, Q.W.; Zhang, D.; Jiao, W.J.; He, L.; Liu, S.; Sun, Y.H. Energy Comparison of Rice-fish Agriculture and Rice Monocropping: A Case Study of Xiaohuang Village, CongJiang County, Guizhou Province. Resour. Sci. 2009, 31, 48–55. [Google Scholar]
- Zhong, Y.; Sha, Z.; Gu, M.; Weng, D.; Du, J.; Cao, L. Emergy-based benefit analysis of integrated rice-frog farming. Chin. J. Eco-Agric. 2021, 29, 572–580. [Google Scholar] [CrossRef]
- Zhou, J.; Xiang, P. Ecological emergy analysis of different paddy ecosystems in Hunan Province. Sci. Agric. Sin. 2018, 51, 4496–4513. [Google Scholar]
- Lan, S.F.; Qin, P.; Lu, H.F. Emergy Analysis of Eco-Economic System; Chemical Industry Press: Beijing, China, 2002. [Google Scholar]
- Li, K. Nutrient Cycle and Ecological Evaluation of Rice-Crab Culture and Aquaculture Integrated System. Master’s Thesis, Shanghai Ocean University, Shanghai, China, 2022. [Google Scholar]
- Zhou, J.; Xie, Y.; Xiang, P. Emergy Analysis of Inputs and Outputs of Major Field Crop Ecosystems in Hunan Province. Crops 2021, 1, 175–181. [Google Scholar]
- Chen, W.; Liu, W.; Geng, Y.; Brown, M.T.; Gao, C.; Wu, R. Recent progress on emergy research: A bibliometric analysis. Renew. Sustain. Energy Rev. 2017, 73, 1051–1060. [Google Scholar] [CrossRef] [Scilit]
- Lei, Y. Energy Flow and Emergy Analysis of Maize/Soybean Strip Intercropping Model. Master’s Thesis, Sichuan Agricultural University, Chengdu, China, 2023. [Google Scholar]
- Qin, C.; Yu, C.; Aohui, S.; Li, K.; Hu, H.; Hu, T.; Ye, Y.; Wang, H. Benefit evaluation of double cropping rice-fish breeding model based on emergy analysis. J. Agric. Resour. Environ. 2025, 42, 218–227. [Google Scholar] [CrossRef]
- Li, X. Study on Emergy Analysis of Xinjiang Agro-ecosystem. Master’s Thesis, Xinjiang University, Urumqi, China, 2015. [Google Scholar]
- Yan, W.; Qian, Z.; Ming, D. Reducing phosphorus alters the soil microbial community structure and function, promoting cotton root growth. Chin. J. Eco-Agric. 2025, 33, 913. [Google Scholar]
- Yan, W.Y.; Yi, X.Z.; Hai, L.D.; Fang, W.Z.; Ming, G. Effects of Chemical Fertilizer Reduction Substitute with Organic Fertilizer on Soil Functional Microbes and Lemon Yield and Quality. Environ. Sci. 2023, 44, 12. [Google Scholar]
- Tian, M.T.; Nan, L.Y.; Qian, Z.X.; Yuan, L.Z.; Yu, C.L.; Long, L.J.; Ni, W.W.; He, H.Y. Effects of Slow-release Nitrogen Application Rate on Daily Photosynthetic Characteristics and Dry Matter Accumulation of Maize During Spinning—Tasseling Stage. Acta Agric. Boreali-Sin. 2024, 39, 126–135. [Google Scholar]
- Shen, Y.; Tao, Y.; Dong, L.; Shi, L.; Lu, C.; Wang, H.; Jin, M.; Zhou, X.; She, M. Evaluation on construction and optimization of modern agro-pastoral circular system based on emergy analysis. Acta Ecol. Sin. 2023, 43, 3057–3067. [Google Scholar] [CrossRef] [Scilit]
- Wang, J.; Luo, X.; Liu, Z.; Tang, L. Spatial-temporal variation and influencing factors of farmland ecological value in the Yangtze River Economic Belt. Chinese J. Eco-Agric. 2024, 32, 505–517. [Google Scholar]
- Meng, Y.; Wu, K.; Gong, P.; Zhang, Z.; Han, M.; Wei, Z.; Wang, L.; Lv, N.; Bai, W.; Zhang, L. Effects of maize stalks returning on soil microbial carbon use efficiency and maize yield in semi-arid cropland. BioResources 2023, 19, 103–115. [Google Scholar] [CrossRef] [Scilit]
- Huang, H.; Shi, Y.; Raan, S.S.; Su, H.R.; Liu, J.E. Dynamic research on sustainable development of farmlandlivestock production system based on emergy theory. J. Nat. Resour. 2020, 35, 869–883. [Google Scholar] [CrossRef] [Scilit]
- Qiang, L.S.; Xiang, G.Y. Study on the Optimal Fertilizer Application with Ecological Benefits in mind—A Case of Apple Fertilizer Input in China. Guangdong Agric. Sci. 2019, 46, 8. [Google Scholar]
- Hsieh, C.H.; Lin, H.W.; Liu, W.Y. Assessing the ecosystem services provided by conventional and organic farmlands: A better outcome for organic farmlands? Ecosyst. Serv. 2023, 60, 101514. [Google Scholar] [CrossRef] [Scilit]
- Huang, S.L.; Odum, H.T. Ecology and economy: Emergy synthesis and public policy in Taiwan. J. Environ. Manag. 1991, 32, 313–333. [Google Scholar] [CrossRef] [Scilit]
- Liu, F.; Hu, H.; Li, X.; Jia, Z.; Mo, F. Reducing nitrogen application through deep placement to optimize the nitrogen balance in a dryland maize cropping system. J. Clean. Prod. 2010, 528, 14. [Google Scholar] [CrossRef] [Scilit]
- Shi, H.; Zheng, W.; Zhang, X.; Zhu, M.; Ding, D. Ecological–economic assessment of monoculture and integrated multi-trophic aquaculture in Sanggou Bay of China. Aquaculture 2013, 410–411, 172–178. [Google Scholar] [CrossRef] [Scilit]
- Ulgiati, S.; Brown, M.T. Monitoring patterns of sustainability in natural and man-made ecosystems. Ecol. Model. 1998, 108, 23–36. [Google Scholar] [CrossRef] [Scilit]
- Wang, L.; Zhou, H.; Fei, C. Substituting partial chemical nitrogen fertilizers with organic fertilizers maintains grain yield and increases nitrogen use efficiency in maize. Front. Plant Sci. 2024, 15, 1442123. [Google Scholar] [CrossRef] [Scilit] [PubMed]
- LI, Y.M.; Chen, C.; Pu, S.; Zhang, H. Effect of combined application of organic and inorganic fertilizer on the sustainable development of agricultural production systems: A case study of Xinjiang Production and Construction Corps. Chin. J. Eco-Agric. 2025, 33, 1761–1770. [Google Scholar] [CrossRef]

Disclaimer/Publisher’s Note: The statements, opinions and data contained in all publications are solely those of the individual author(s) and contributor(s) and not of MDPI and/or the editor(s). MDPI and/or the editor(s) disclaim responsibility for any injury to people or property resulting from any ideas, methods, instructions or products referred to in the content. |
© 2026 by the authors. Licensee MDPI, Basel, Switzerland. This article is an open access article distributed under the terms and conditions of the Creative Commons Attribution (CC BY) license.