


Abstract
In horizontal condominiums, where standardised designs are often implemented without considering the surroundings, thermal discomfort can be significant. This study compares two thermal discomfort assessment approaches (mean degree-hour and bioclimatic chart) using computer simulations in the EnergyPlus programme, considering different building solar orientations and use patterns. The comparison of approaches allowed the annual percentage of time outside the comfort zone to be quantified. According to the bioclimatic chart, in the most critical room, the proportion of discomfort hours was 16.2%, which could be reduced to 12.3% by changing the solar orientation. According to the mean degree-hour approach, the room with the highest discomfort registered 1.8 mean degree-hours, a value that could decrease to 0.91 by changing the solar orientation. However, it was observed that the use patterns of the rooms may limit the potential for reducing discomfort. Overall, both approaches indicated that north and south orientations tend to lead to less discomfort. However, in some cases, the bioclimatic chart identified east, northeast, and southeast orientations as more suitable alternatives. The differences between the methods were mainly attributed to the parameters adopted by each approach. By analysing different thermal comfort assessment approaches, the study highlights how methodological choices influence the interpretation of thermal discomfort while confirming that solar orientation remains a relevant passive strategy whose effectiveness depends on room use patterns, thereby supporting occupants’ well-being and contributing to environmental and energy sustainability in residential buildings.
1. Introduction
Thermal comfort is essential to environmental quality in buildings, directly influencing the health, well-being, and productivity of occupants [1,2]. In hot-climate countries such as Brazil, its relevance becomes even more pronounced, as a substantial share of thermal discomfort arises from inadequate construction solutions. This issue is particularly evident in social housing, where economic and technical constraints often result in buildings poorly adapted to local climatic conditions [3,4]. However, this problem is not restricted to buildings intended for low-income populations. In recent years, there has also been an expansion of horizontal condominiums intended for the middle class [5,6], in which units with standardised architectural typologies, replicated at scale, are often deployed in a dispersed manner and with insufficient regard for surrounding conditions.
Several strategies have been studied to improve the thermal performance of buildings, such as natural ventilation [7,8], thermal insulation [9] and appropriate choice of materials [10,11]. Among these strategies, solar orientation stands out as a low-cost solution that can be effective, especially in hot climates. Liping et al. [12] examined the influence of façade design on naturally ventilated buildings in Singapore. They found that north- and south-facing façades provide more favourable indoor conditions than east- and west-facing façades. Habibi [13], analysing buildings in two climatically distinct cities in the United States, demonstrated that the effect of solar orientation on thermal performance is not uniform, varying according to climate and building size. Benica et al. [14] further advanced this discussion by showing that the extent to which solar orientation shapes energy performance depends on building typology and surrounding structures. The authors found that while substantial reductions in energy demand were achievable in isolated scenarios, these reductions were attenuated when the influence of the surrounding built environment was introduced. However, improvements in thermal performance do not depend solely on the building’s physical characteristics. User behaviour, such as occupancy patterns, window opening, and equipment use, directly influences indoor conditions [15,16,17], which may enhance or reduce the effect of the design strategies adopted.
To assess thermal comfort, different methodological approaches have been employed, varying in complexity and level of detail. In addition to more robust methods, such as adaptive models and PMV/PPD (Predicted Mean Vote/Predicted Percentage of Dissatisfied) [18], more direct approaches, such as the mean degree-hour method, also stand out [19], which quantifies the deviation of internal conditions from comfort limits, and the bioclimatic chart [20], which allows the identification of appropriate architectural strategies based on temperature and humidity limits.
The literature indicates that although the Predicted Mean Vote (PMV) model remains widely used for thermal comfort assessment, many studies have adopted alternative approaches [21]. Within this context, recent research has employed multiple assessment approaches to provide a more comprehensive understanding of thermal comfort. Some studies have compared subjective evaluations with objective measurements [22], while others have combined simulations, in situ measurements, and occupant surveys, showing that different approaches can lead to contrasting interpretations of thermal conditions and perceived discomfort [23]. Mustapha et al. [24] compared subjective evaluations with field measurements and simulation-based assessments in naturally ventilated scholar buildings in Nigeria. Their findings indicate that, relative to the Actual Mean Vote (AMV), the PMV framework, whether derived from in situ measurements or computational simulation, consistently overestimated occupants’ thermal sensation and consequently underestimated the temperature at which thermal neutrality is actually perceived.
Similarly, Holopainen et al. [25] demonstrated that adaptive and physiologically based models (in this case, the adaptive predicted mean vote, a Human Thermal Model integrated in a building simulation environment and the adaptive control algorithm) allow a broader range of acceptable indoor conditions than the traditional PMV, highlighting the risk of overestimating the need for active heating or cooling. By demonstrating that occupants may remain comfortable beyond the narrow limits defined by Fanger’s model, the study highlights that unnecessary heating and cooling can often be avoided. Rupp and Ghisi [26] comparatively assessed three thermal comfort methods (ASHRAE 55 for conditioned spaces, ASHRAE 55 for naturally ventilated spaces, and Givoni’s chart) to analyse how each approach estimates the annual hours of air-conditioning required in hybrid commercial buildings in a hot–humid climate. Their results showed that their assumptions can lead to markedly different estimates of cooling demand, with the ASHRAE 55 criteria for conditioned and naturally ventilated spaces diverging substantially from observed patterns, whereas Givoni’s chart aligned more closely with actual use. These studies show that the method used to assess thermal comfort may significantly influence how indoor conditions are interpreted.
In this context, this study aims to compare two approaches for assessing thermal discomfort in a typical Brazilian horizontal condominium dwelling: the mean degree-hour method and the bioclimatic chart method. By applying both approaches under different solar orientations and use patterns, the study investigates how the choice of approach influences the interpretation of results and decision-making in residential designs. Highlighting the implications of different assessment approaches supports assessments of passive thermal performance, which is directly related to sustainability. Thermal comfort is a central component of the social dimension of sustainability, as inadequate indoor conditions affect occupants’ well-being and health. Enhancing passive thermal performance also provides environmental and economic benefits. Reducing the frequency and intensity of thermal discomfort is likely to decrease the demand for air-conditioning and associated energy consumption. Furthermore, understanding how different assessment approaches frame the benefits of strategies such as solar orientation is essential for design decisions. As a resource-efficient strategy that requires no additional materials or technologies and relies solely on appropriate site positioning, the effective use of solar orientation supports more sustainable residential design practices.
2. Materials and Methods
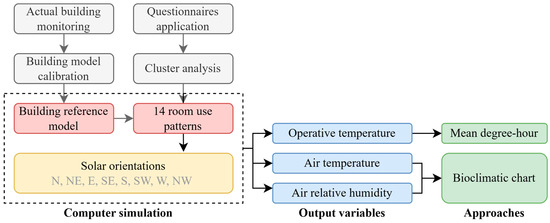
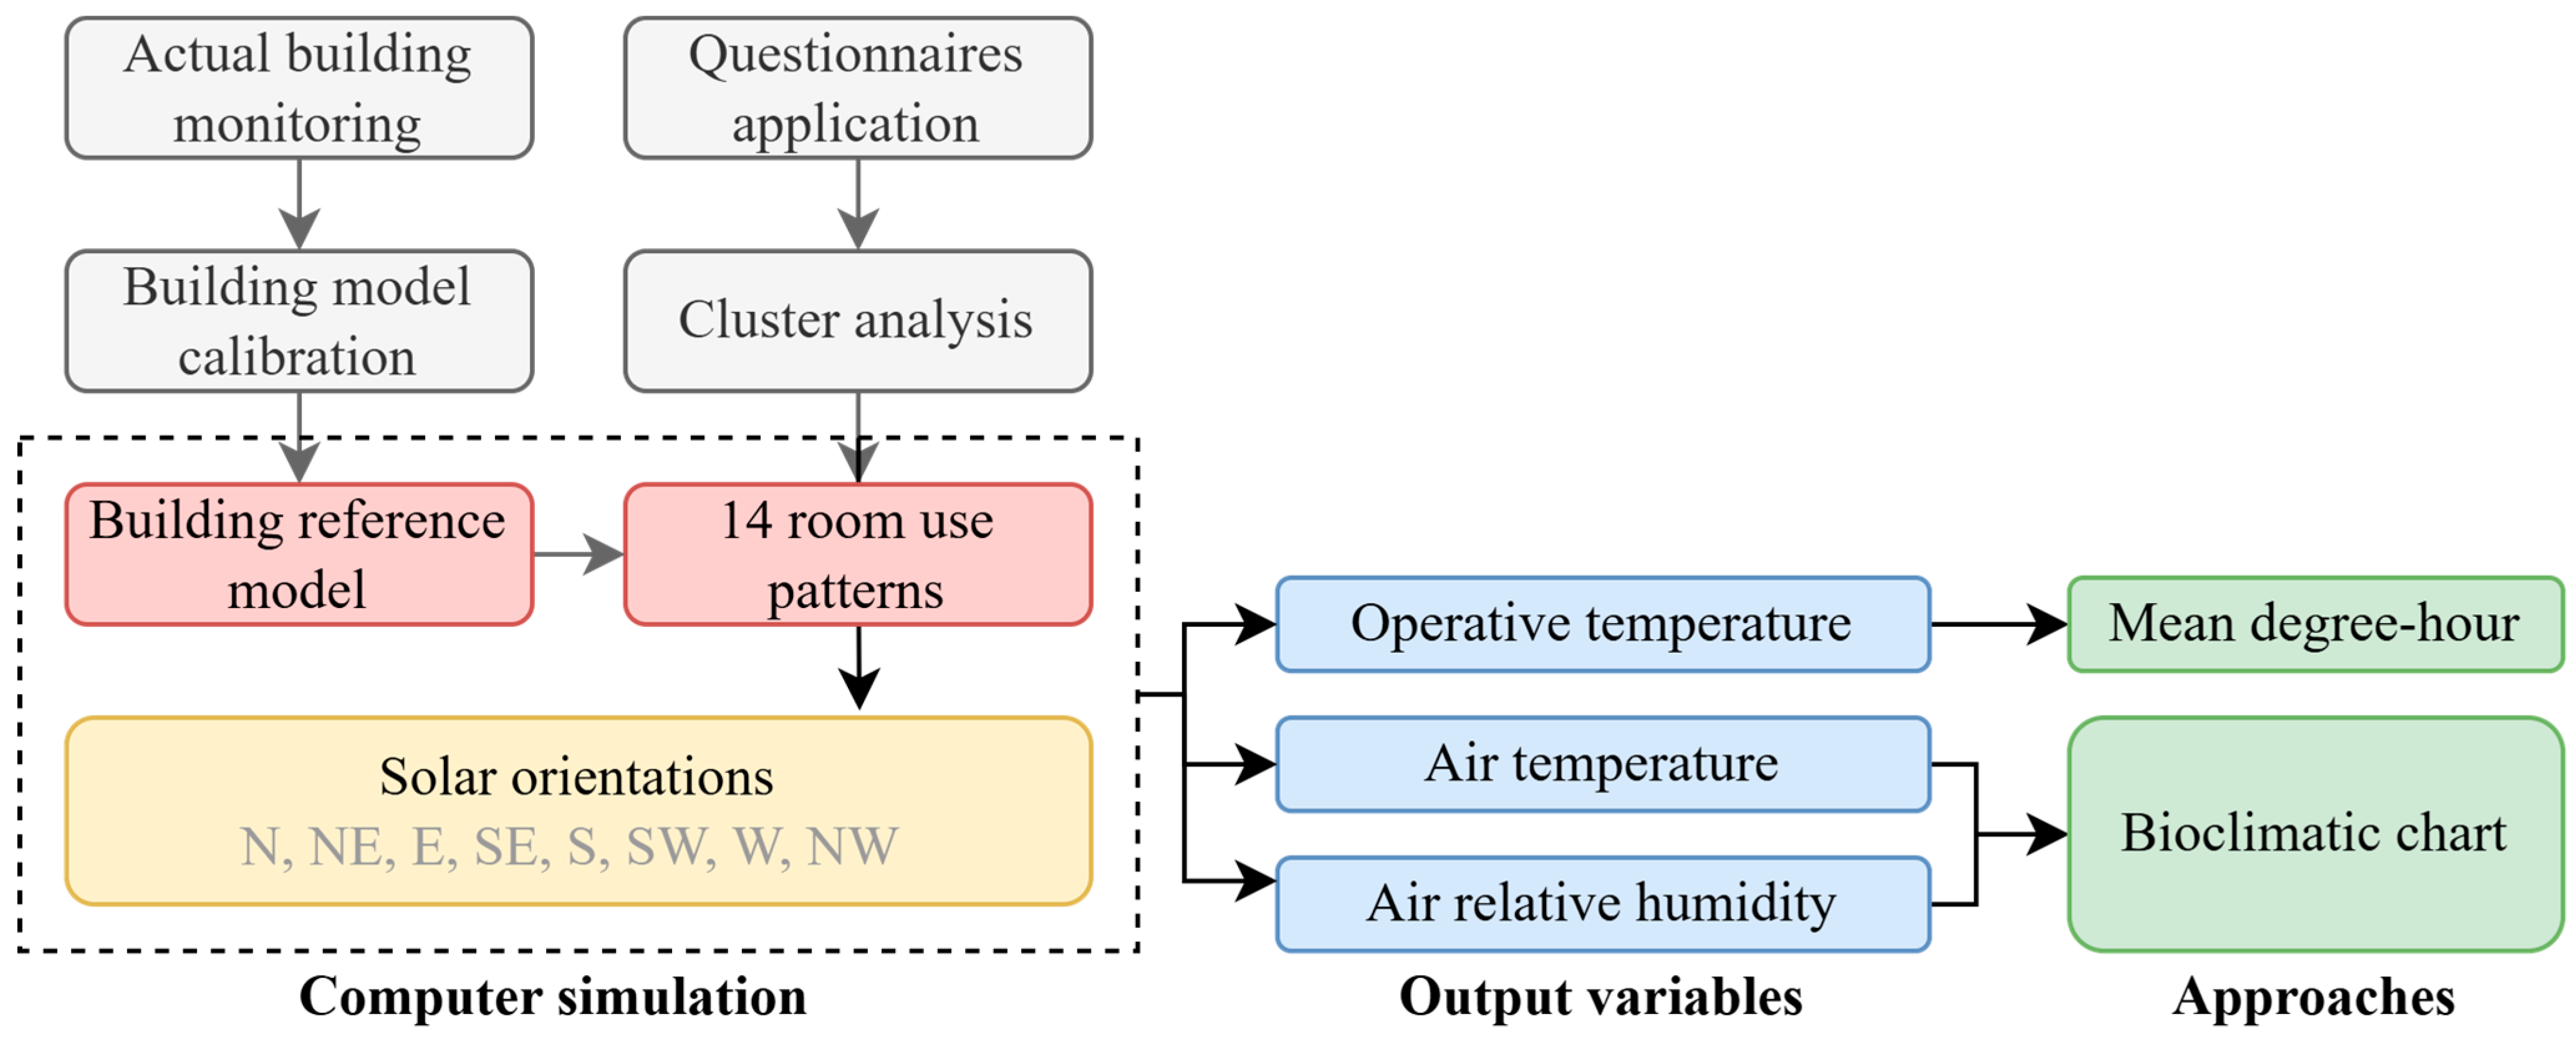
Based on a reference model of a single-family dwelling, EnergyPlus version 8.4 was used to simulate scenarios combining different solar orientations and pre-determined use patterns. These scenarios provided a basis for comparing two thermal discomfort assessment approaches (mean degree-hours and bioclimatic chart), allowing the influence of methodological choice on the interpretation of thermal comfort to be examined. Figure 1 shows the main steps of the method.
Figure 1.
Main steps of the method. The steps in grey were developed in a previous study.
The model monitoring and calibration steps, as well as the application of questionnaires and cluster analysis, are detailed in [27]. For calibration, a dwelling located in a horizontal condominium characterised by standardised architectural typologies and homogeneous envelope materials was selected. In this dwelling, air temperature and humidity were measured indoors and outdoors to adjust the model for computer simulations. This procedure ensured consistency between measured and simulated thermal behaviour under actual-use conditions.
The definition of use patterns for the rooms was based on the application of questionnaires designed to characterise user behaviour. The questionnaires were applied in different dwellings within the condominium, allowing the capture of occupant use patterns exposed to similar climatic and environmental conditions. Cluster analysis enables the identification of groups with similar use profiles, which were subsequently incorporated into the simulations.
The accuracy of the computational simulations was ensured through this combined monitoring, calibration, and behavioural characterisation process, increasing confidence in the model’s ability to reproduce actual indoor thermal conditions. Given that the objective of the study is a relative comparison between scenarios rather than absolute prediction, the calibrated model provides a robust and reliable basis for assessing differences in thermal discomfort across solar orientations, use patterns and assessment approaches.
The computational simulations of the reference model were conducted by combining the identified use patterns with different solar orientations. The output variables (i.e., operative temperature, air temperature, and relative humidity) supported the assessment of thermal discomfort, which was carried out using the mean degree-hour and the bioclimatic chart. The variables refer to the six rooms analysed (bedrooms 1, 2, and 3; living rooms 2 and 3; and kitchen). Finally, a comparative analysis was conducted to identify the most appropriate solar orientation, accounting for the room’s different use patterns.
2.1. Study Location
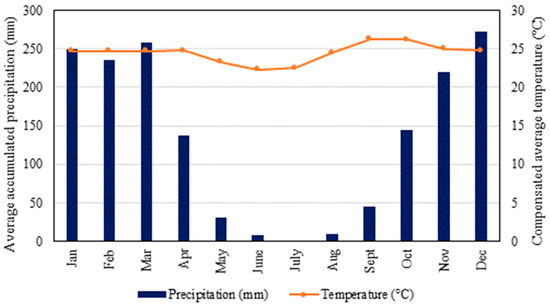
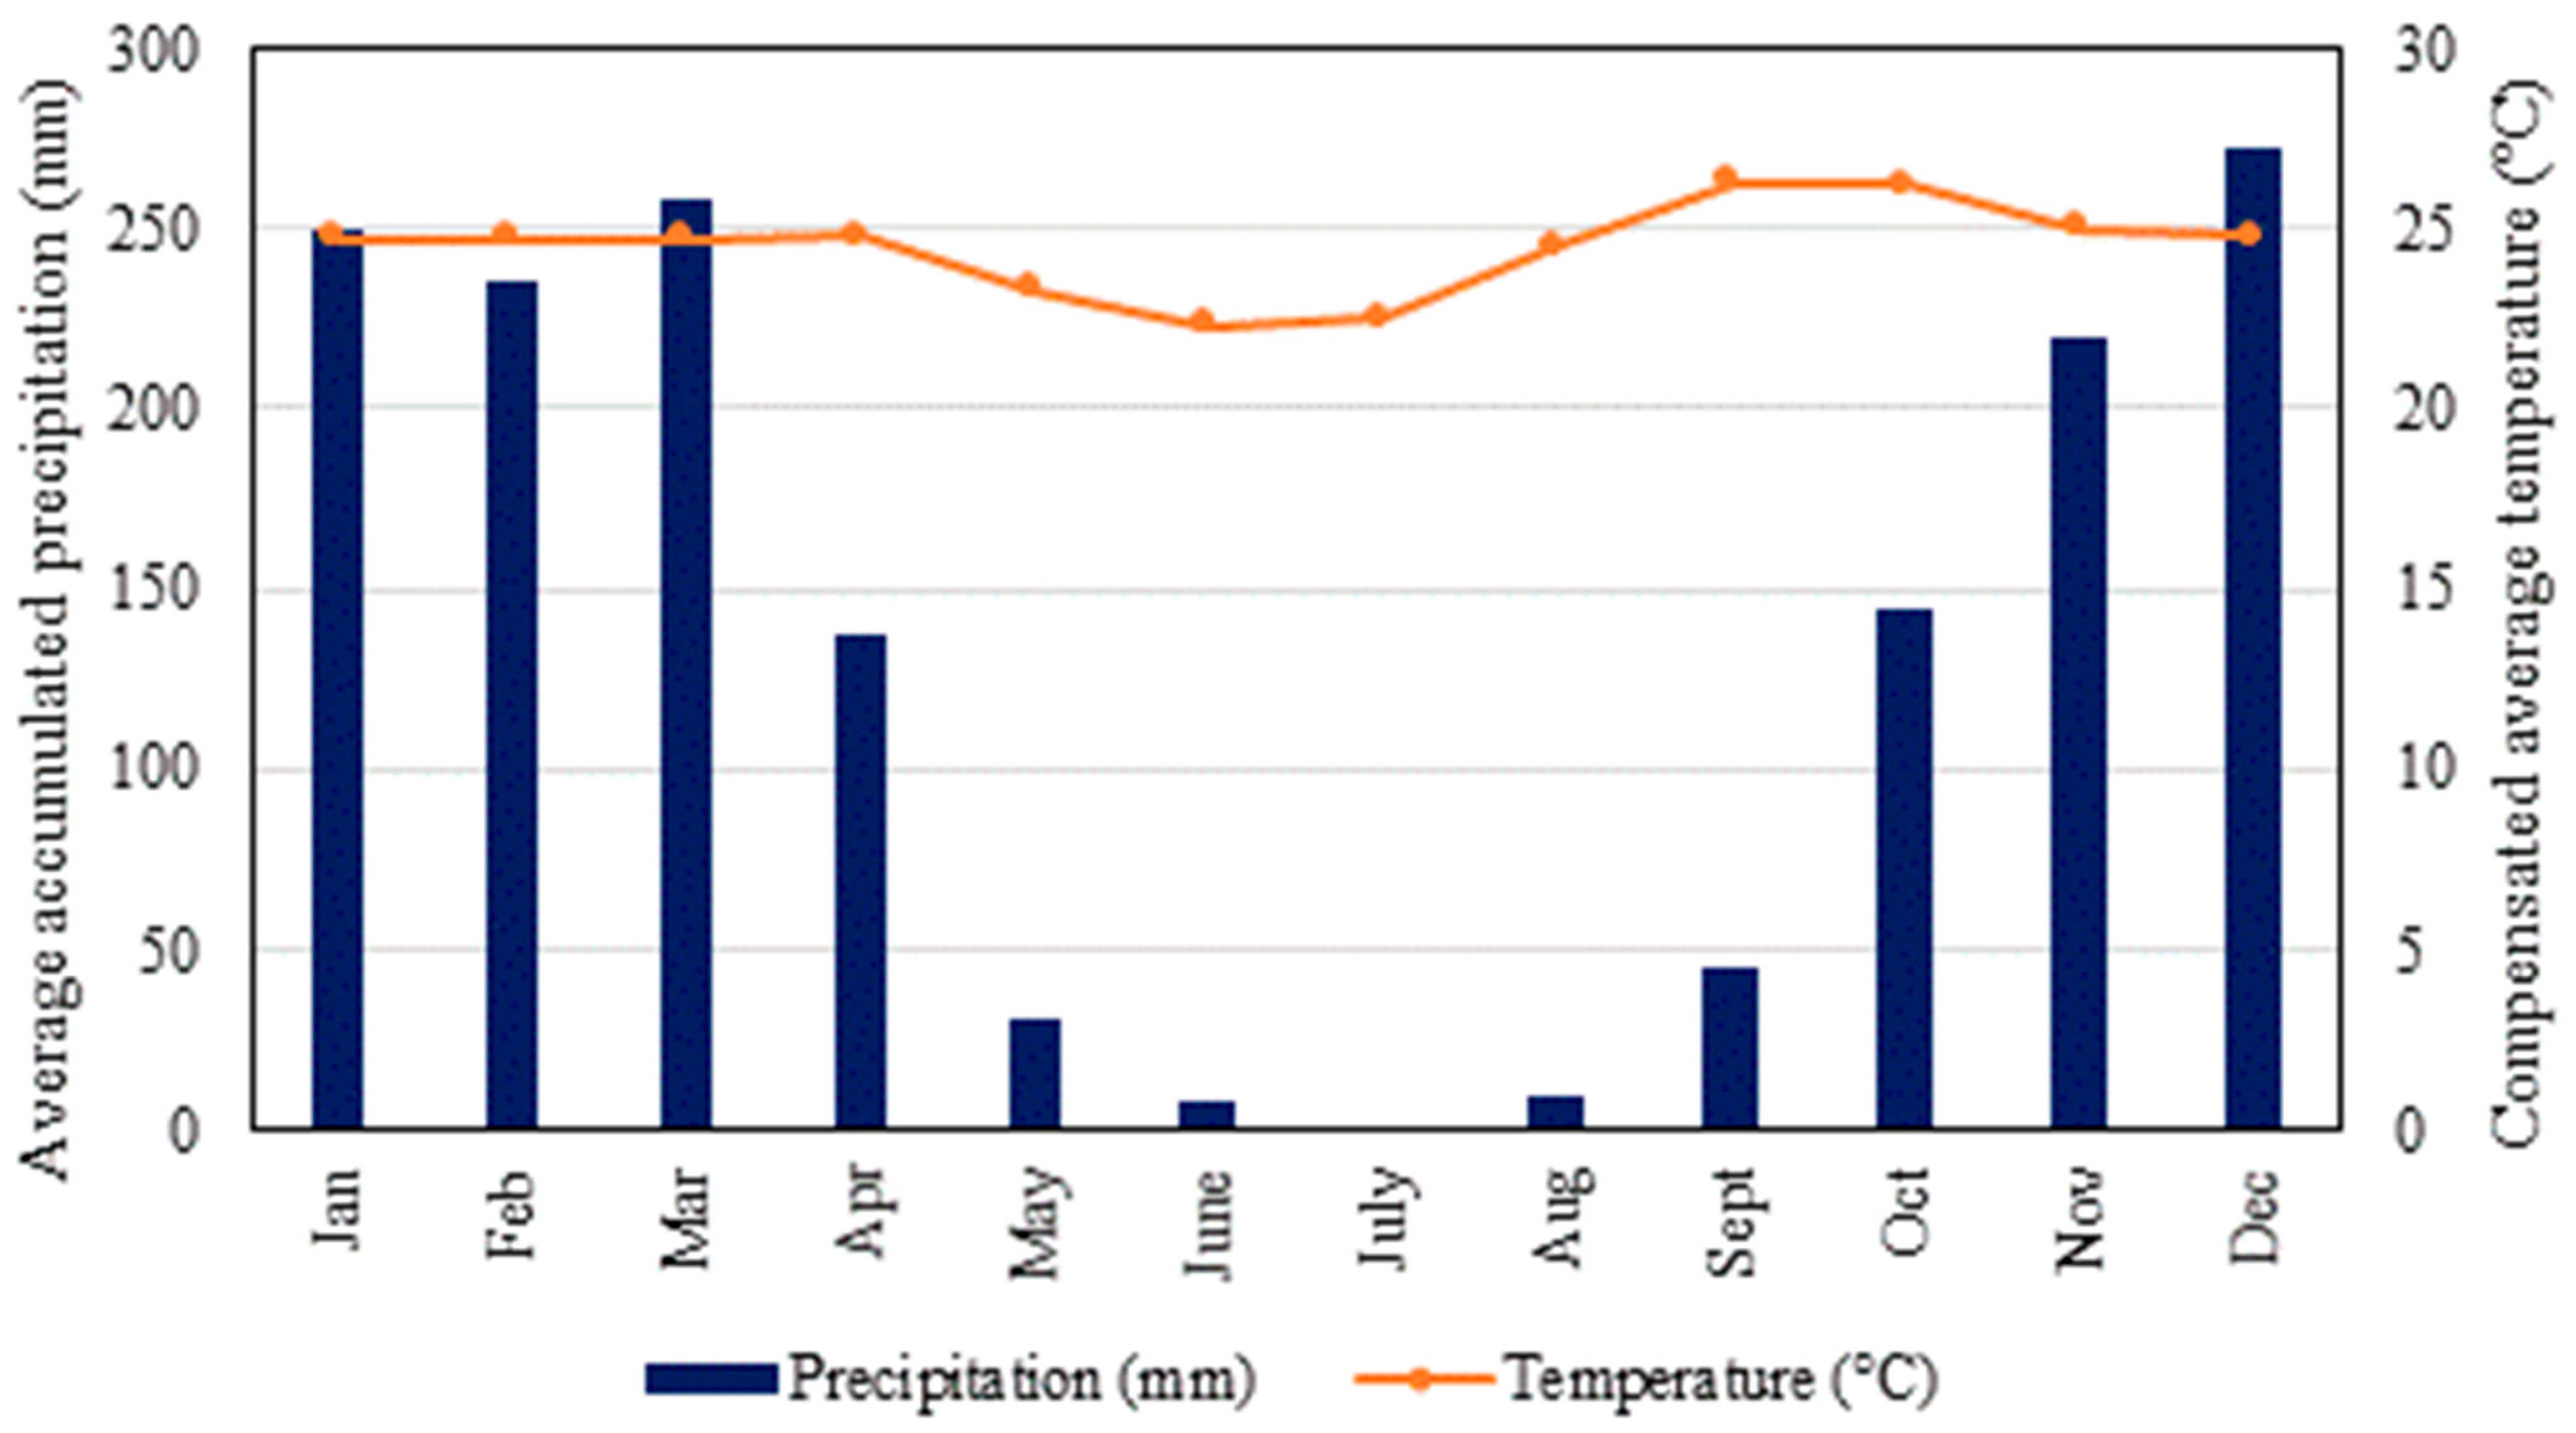
Goiânia is located in the Central-West region of Brazil, at latitude 16°41′ S and longitude 49°17′ W, at altitudes ranging from 600 to 1000 metres. The city has a tropical climate with two distinct seasons: hot-humid summers and hot-dry winters, with rainfall concentrated in the summer. During winter, there is a greater daily temperature range and lower relative humidity, but average daily temperatures are equivalent throughout the year. Average monthly temperatures range from 22.3 to 26.3 °C, and annual rainfall is 1610 mm, as shown in Figure 2. Monthly relative humidity ranges from 40.8 to 2.6% [28]. The climate file used in the simulations was the EPW (EnergyPlus Weather Data) for Goiânia.
Figure 2.
Average temperature and monthly accumulated precipitation in Goiânia, Brazil. Source: INMET [28].
2.2. Building Reference Model
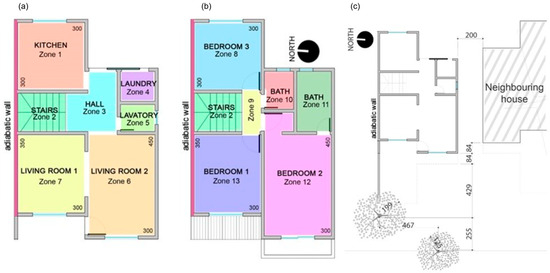
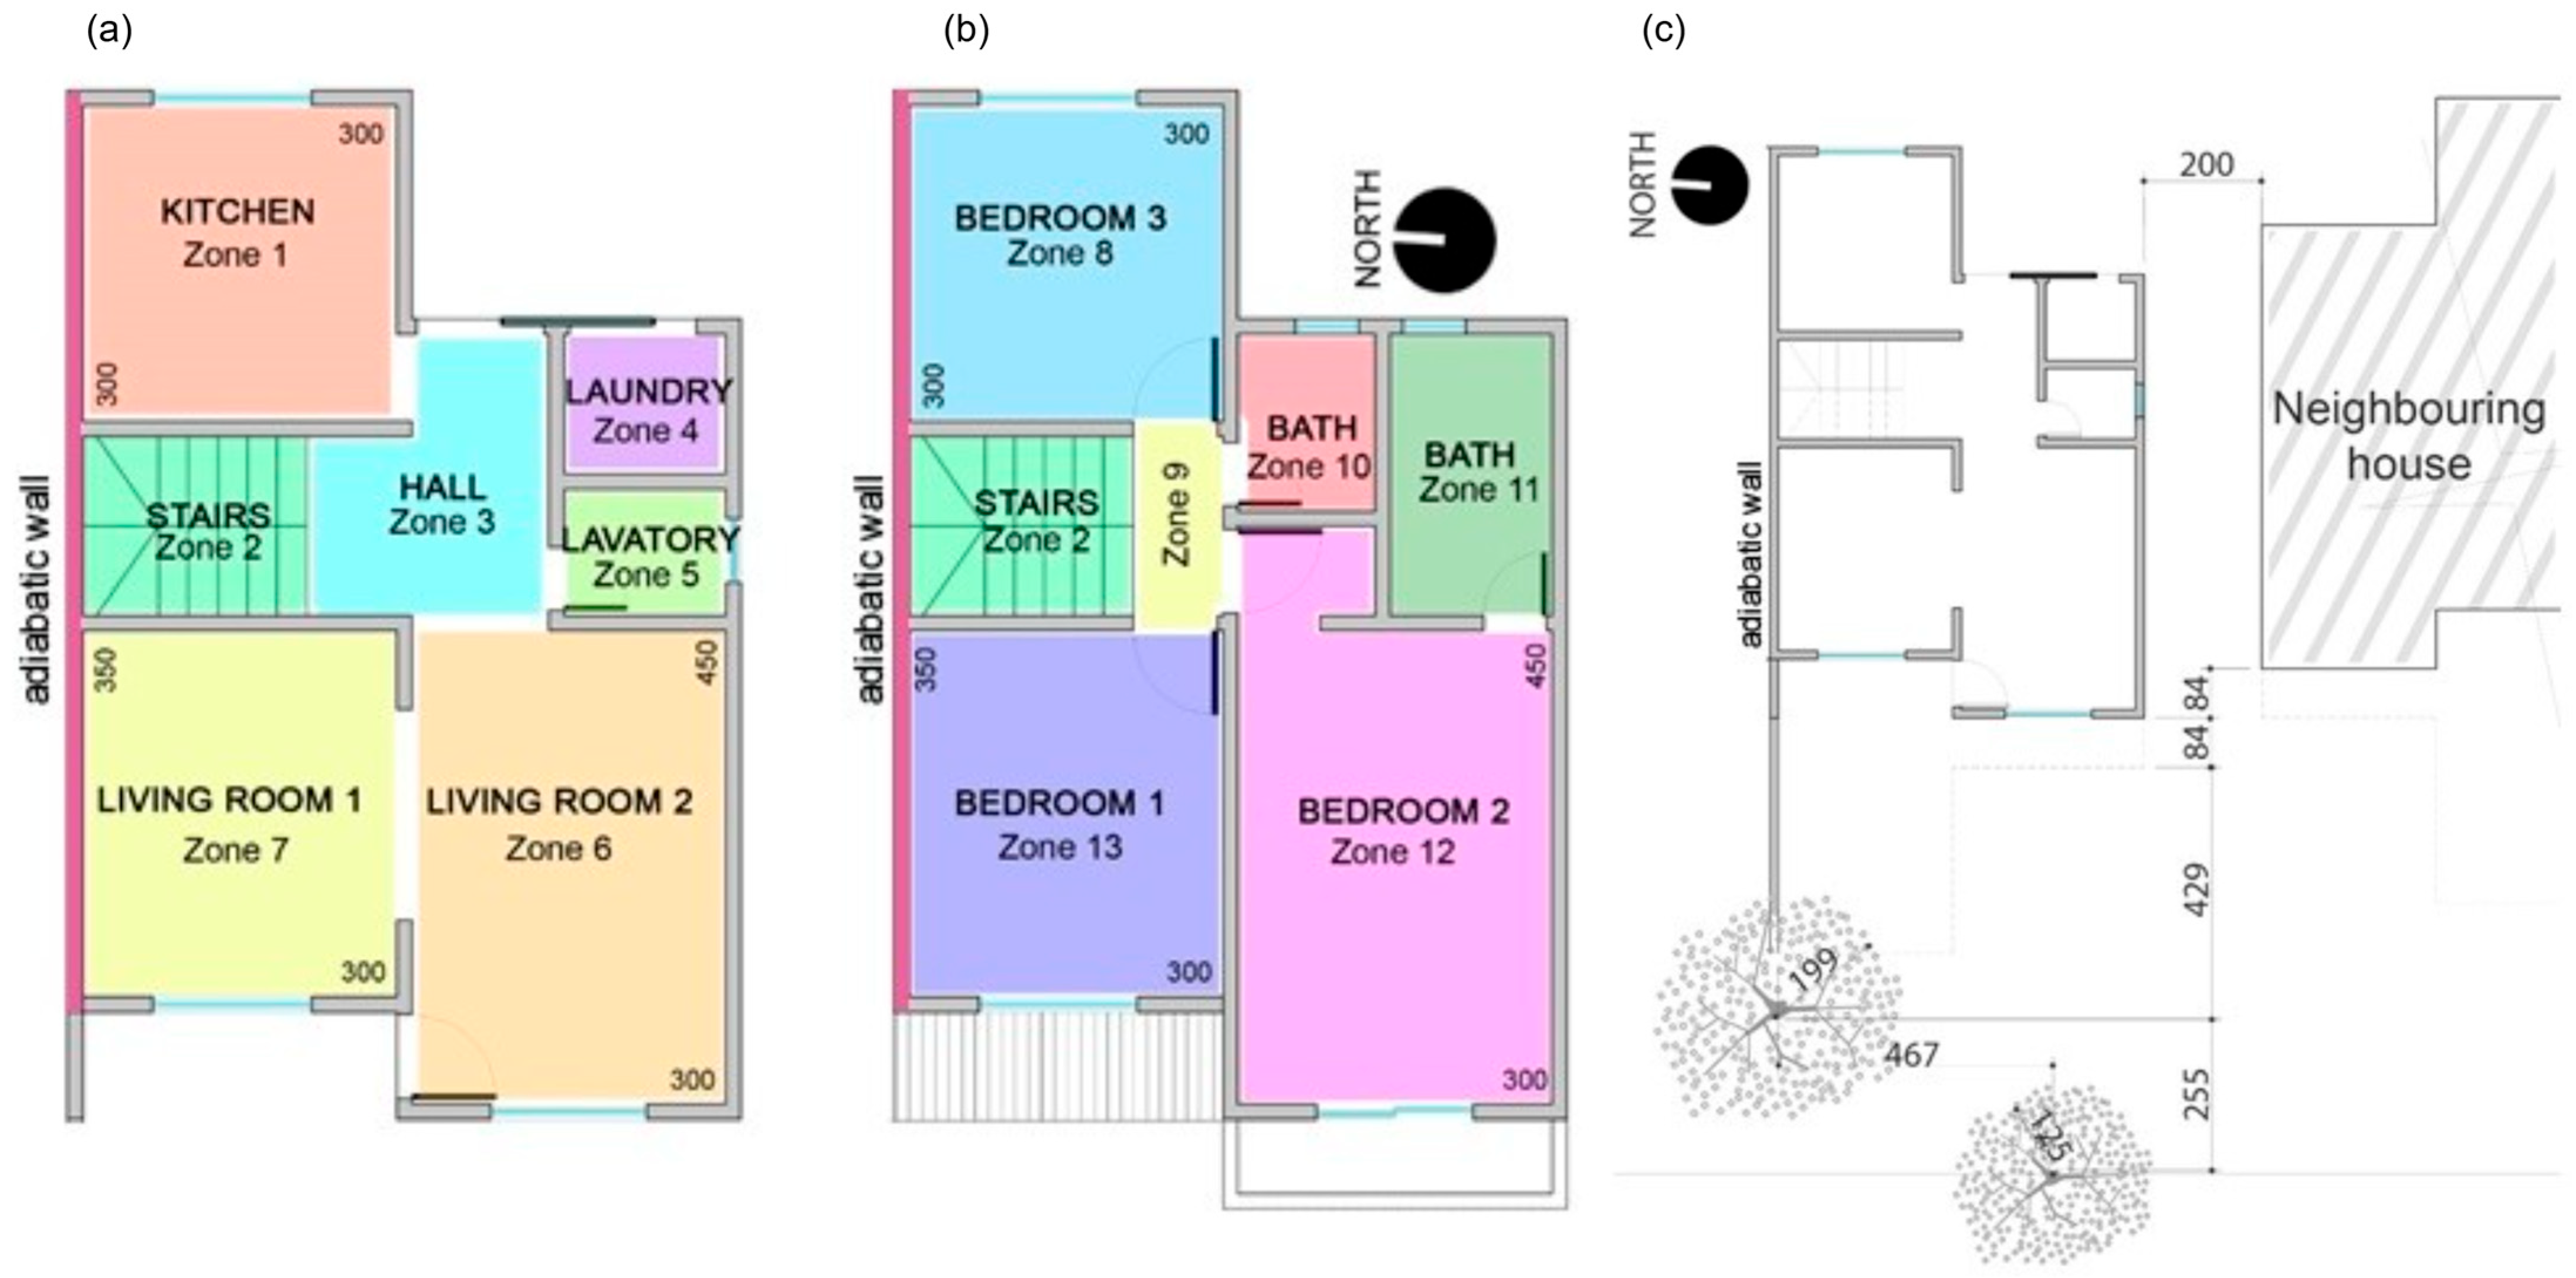
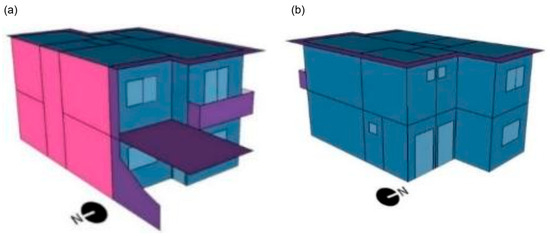
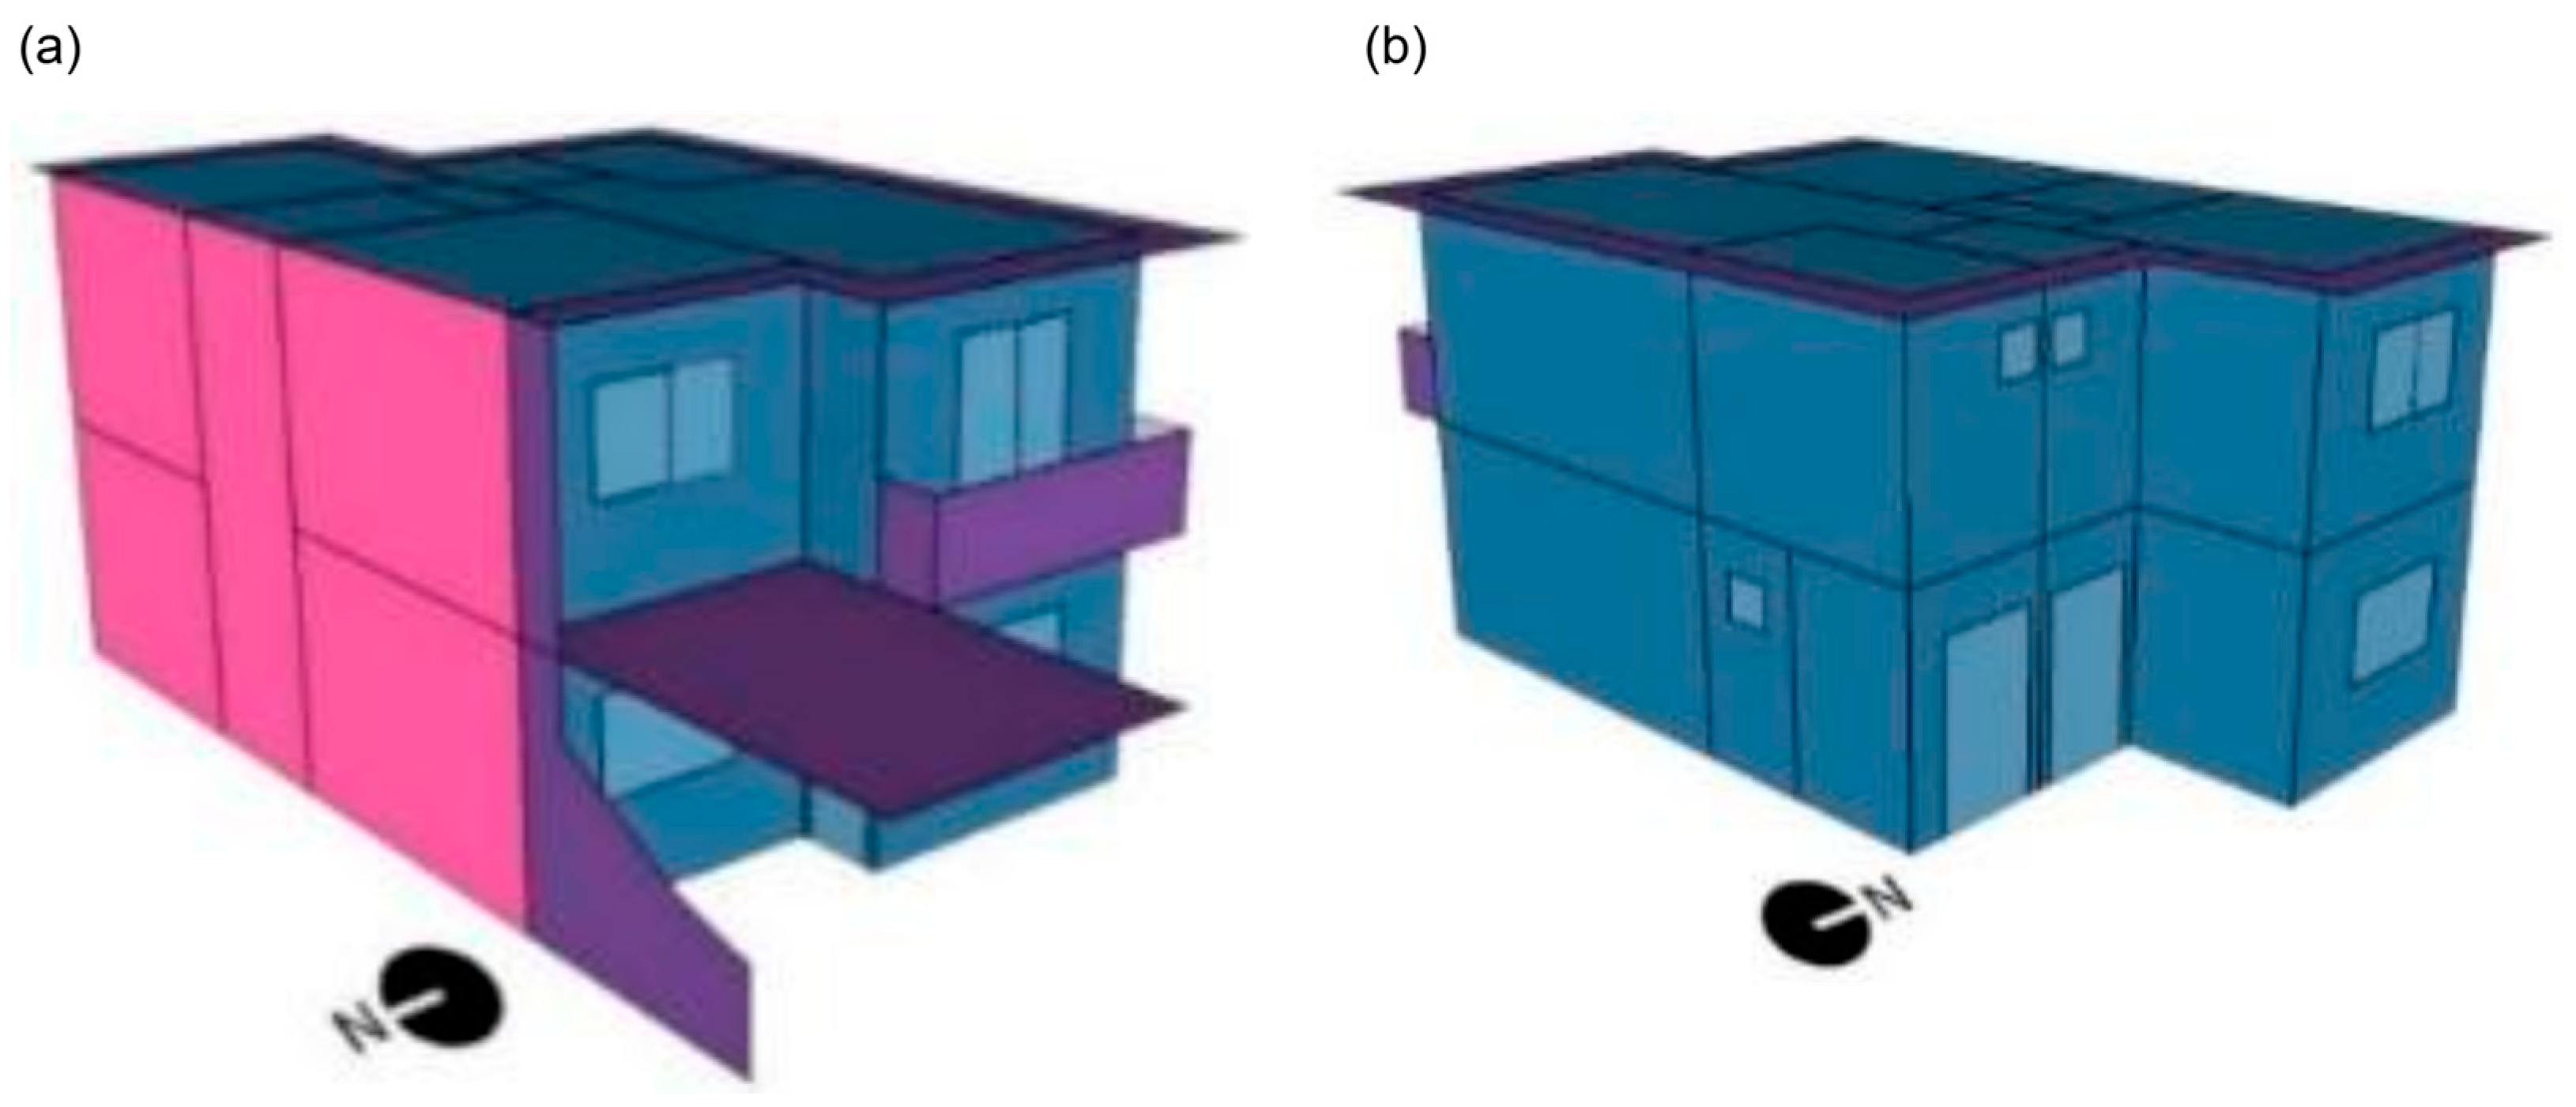
The reference model used was a single-family dwelling with an area of 104.24 m2, divided into thirteen thermal zones corresponding to the total number of rooms in the building, as shown in Figure 3a,b. The model represents dwellings in horizontal residential condominiums. Thus, the modelling of the surroundings considered a neighbouring building and large vegetation that shades the dwelling (Figure 3c). As it is a semi-detached building, one of the external walls was considered adiabatic, while the others were considered exterior walls (Figure 4).
Figure 3.
Floor plan of the (a) ground floor and (b) upper floor, respectively, showing the location of the thermal zones, and (c) surroundings of the building.
Figure 4.
Front (a) and rear (b) views of the reference building model. Note: the pink surfaces represent adiabatic walls. Note: the adiabatic wall is in pink colour.
Ground contact was modelled in the Ground Domain object using the Kusuda-Achenbach model, as described in [29]. The input data for monthly average ground temperatures were obtained from the Goiânia climatic file and used to represent shallow ground conditions in the model. Ground heat transfer through the slab was simulated using the Kusuda–Achenbach formulation, while undisturbed ground temperature conditions were represented using the default values provided by the simulation software. The roof was modelled considering an air chamber with thermal resistance of 0.21 m2K/W. The physical properties of the materials used in the reference model are shown in Table 1.
Table 1.
Properties of the reference model materials.
In bedroom 2, it was assumed that the occupants use air-conditioning. A cooling setpoint of 24 °C was adopted for this room based on the literature for the Brazilian context [30,31]. The device was considered switched on only when the room was occupied and when the doors and windows were closed. The operation of the split-type air-conditioning was modelled, considering an airflow rate per person of 0.0075 m3/s, continuous fan operation mode, fan motor efficiency of 0.8, cooling capacity determined by self-dimensioning, serpentine performance coefficient (COP) of 3.5 W/W, and an electric coil.
Based on the reference model, different combinations of room use patterns and solar orientations (0° N, 45° NE, 90° E, 135° SE, 180° S, 225° SW, 270° W and 315° NW were simulated.
2.3. Building Use Patterns
The use patterns used were those established by Barbosa et al. [27] through questionnaires administered to residents of horizontal condominiums and cluster analysis. Table S1 in the Supplementary Material shows the different use patterns representative of each room in the building, considering occupancy, window and door operation, equipment use, and lighting. In total, fourteen use patterns were used (one use pattern for bedroom 1, three for bedroom 2, two for bedroom 3, two for living room 1, two for living room 2, and four for the kitchen). Thus, fourteen models were established considering all representative patterns for each room, combined with the patterns named “1” for the other rooms.
The metabolic activities of the occupants were standardised for all simulations and are presented in Table 2. The air infiltration value used in the simulation was one exchange/hour.
Table 2.
Metabolic activity of occupants by room.
2.4. Data Analysis
Two approaches were used to analyse thermal discomfort during occupied periods: the mean degree-hour methodology, which uses the operative temperature, and the bioclimatic chart, which allows comfort conditions to be verified based on air temperature and relative humidity. Thus, data on external air temperature and relative humidity, and on internal air temperature, relative humidity, and operative temperature, were obtained from the simulations.
For the calculation of mean degree-hours, base temperatures of 18 °C for cold and 26 °C for heat were used, which represent common limits for assessing thermal deviation in Brazilian studies [32,33]. Mean degree-hours are the ratio between the sum of degree-hours and the number of hours during which the internal temperature exceeds or falls below the base temperature. This indicator expresses, on average, how much the internal temperatures deviate from this limit, allowing for the assessment of temperature fluctuations. The conditions of least thermal discomfort correspond to mean degree-hour values closest to zero, indicating less thermal excess. Thus, the solar orientation associated with the highest thermal comfort for each room and use patterns was determined. The analysis of mean degree-hours was performed separately for discomfort due to cold and heat.
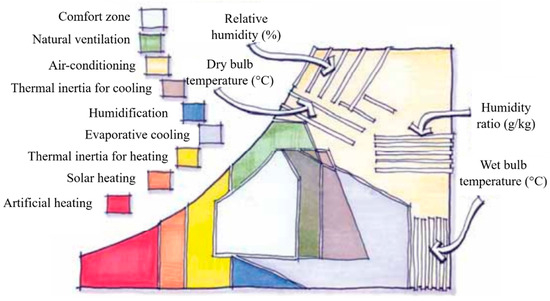
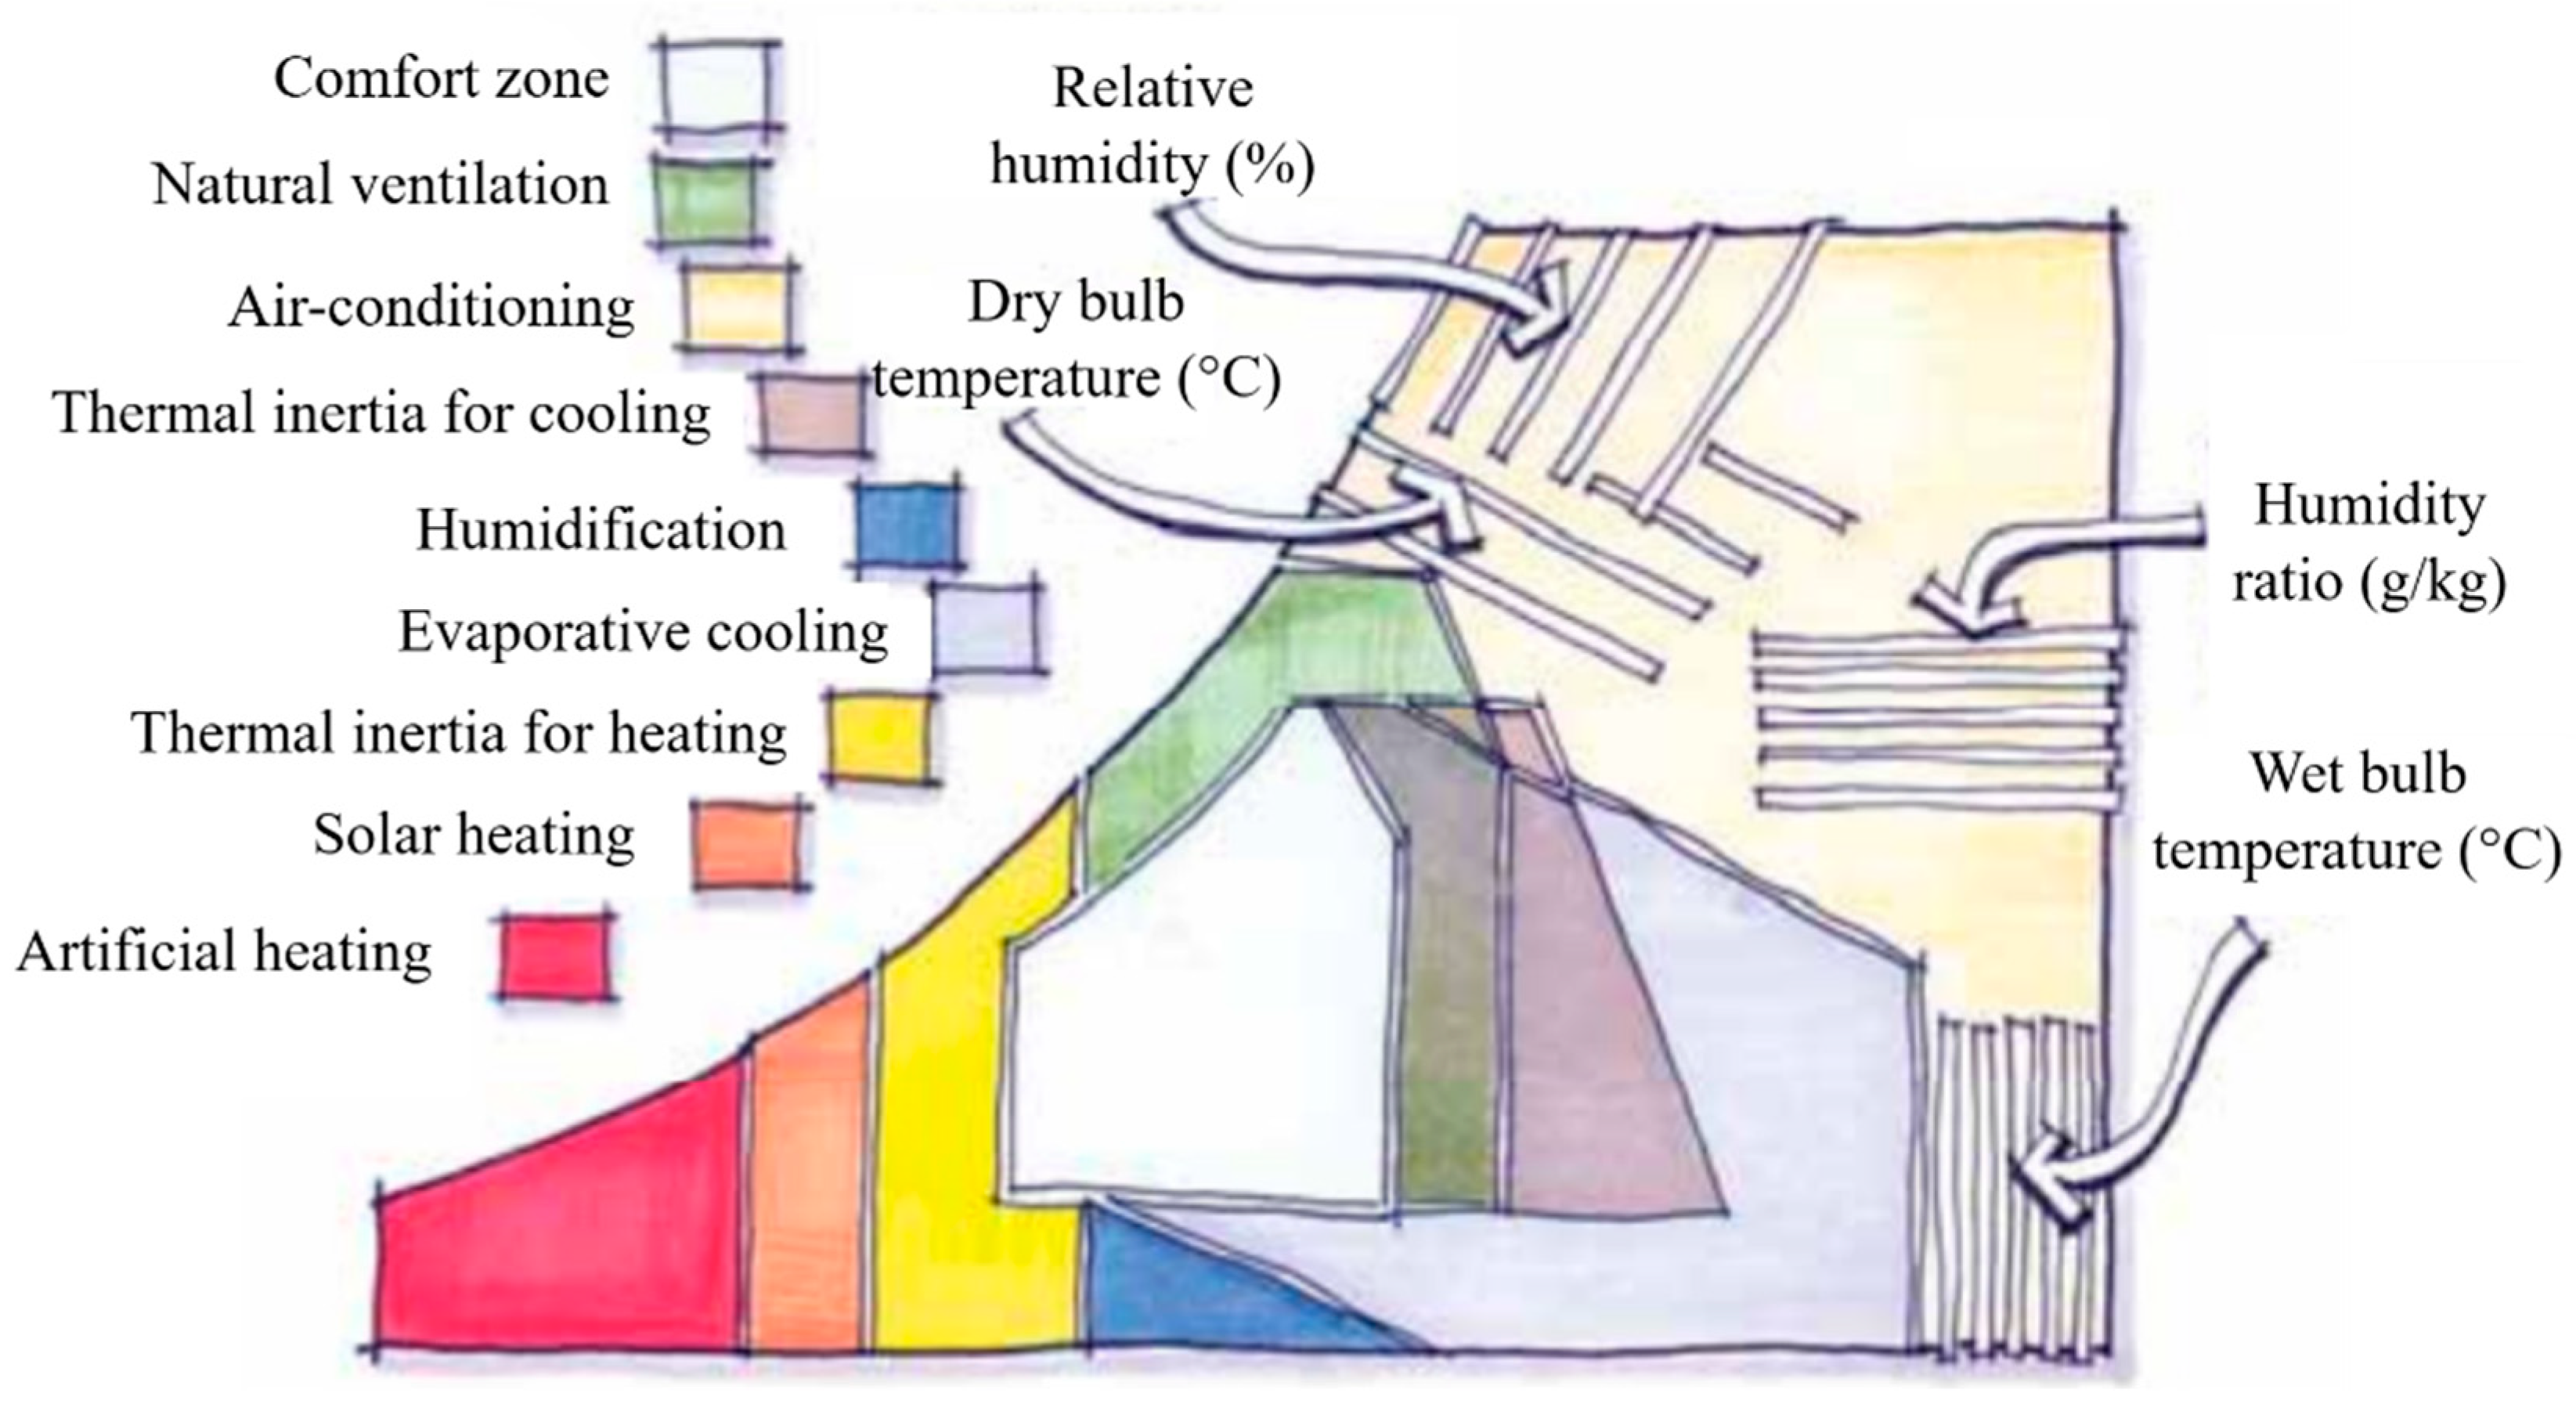
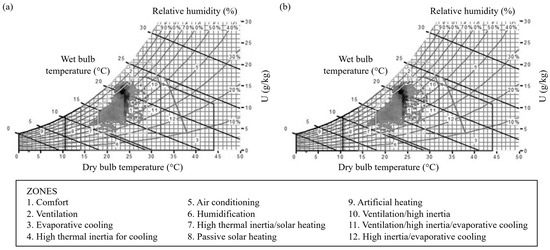
For the bioclimatic chart approach, the method developed by Givoni [20] was used, considering the comfort temperature limits between 18 °C and 29 °C and relative humidity between 20 and 80%. The chart comprises nine zones, each associated with specific passive design strategies, enabling the identification of thermal comfort conditions based on the combined effect of temperature and humidity (Figure 5). Hourly indoor air temperature and relative humidity obtained from the simulations were analysed using the Analysis Bio programme [34], which plots these variables on Givoni’s bioclimatic chart adapted for hot, humid climates. Only the occupied hours of the rooms were considered. Each hourly data point represents a specific indoor condition, allowing the distinction between comfort and discomfort periods. For each room, solar orientation, and use pattern, thermal discomfort was quantified as the percentage of occupied hours falling outside the defined comfort limits. The solar orientation associated with the lowest proportion of hours outside the comfort zone was therefore identified as the most favourable.
Figure 5.
Bioclimatic chart adopted for Brazil. Source: Based on [35].
The parameters adopted in this study (e.g., cooling setpoints for air-conditioning and base temperatures used in the bioclimatic chart) are grounded in values reported in the literature that are particularly relevant to the Brazilian context. These parameters are employed to define simulation inputs and assessment thresholds, rather than to represent formal thermal comfort standards.
The results were evaluated through a comparative analysis, as they are derived from deterministic data and, therefore, inferential statistical analysis is not applicable. The solar orientations indicated in the analyses correspond to the solar orientation relative to the opening of the analysed room.
3. Results and Discussion
3.1. Influence of the Assessment Approach and Use Pattern on Thermal Discomfort
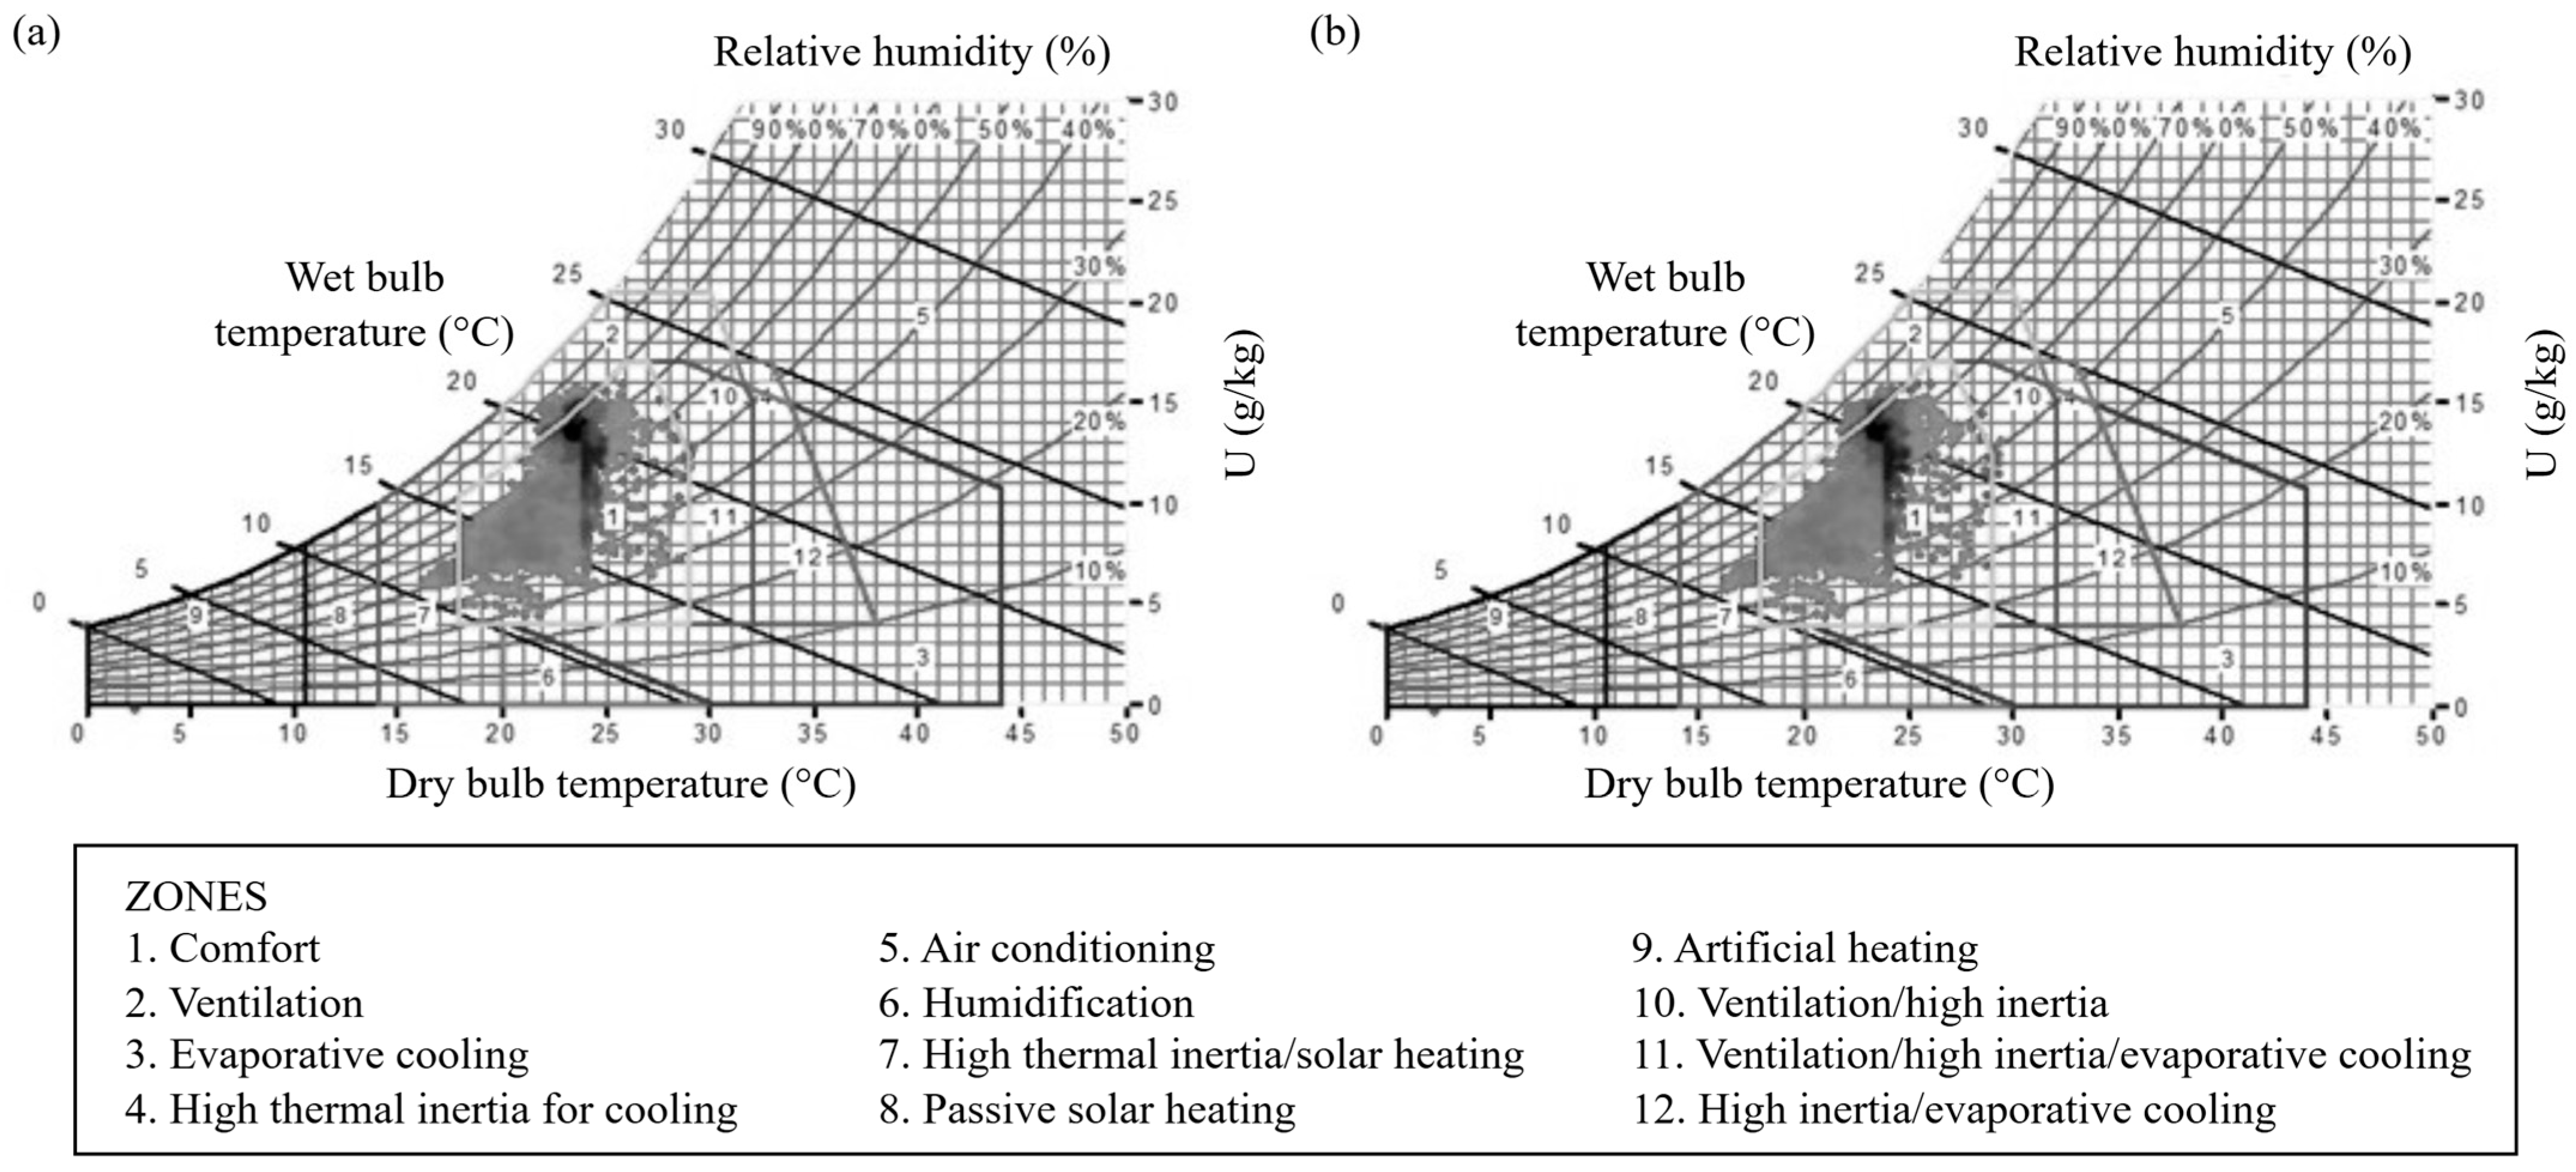
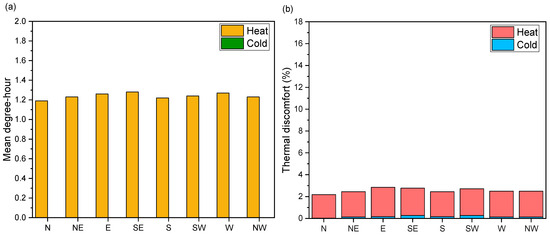
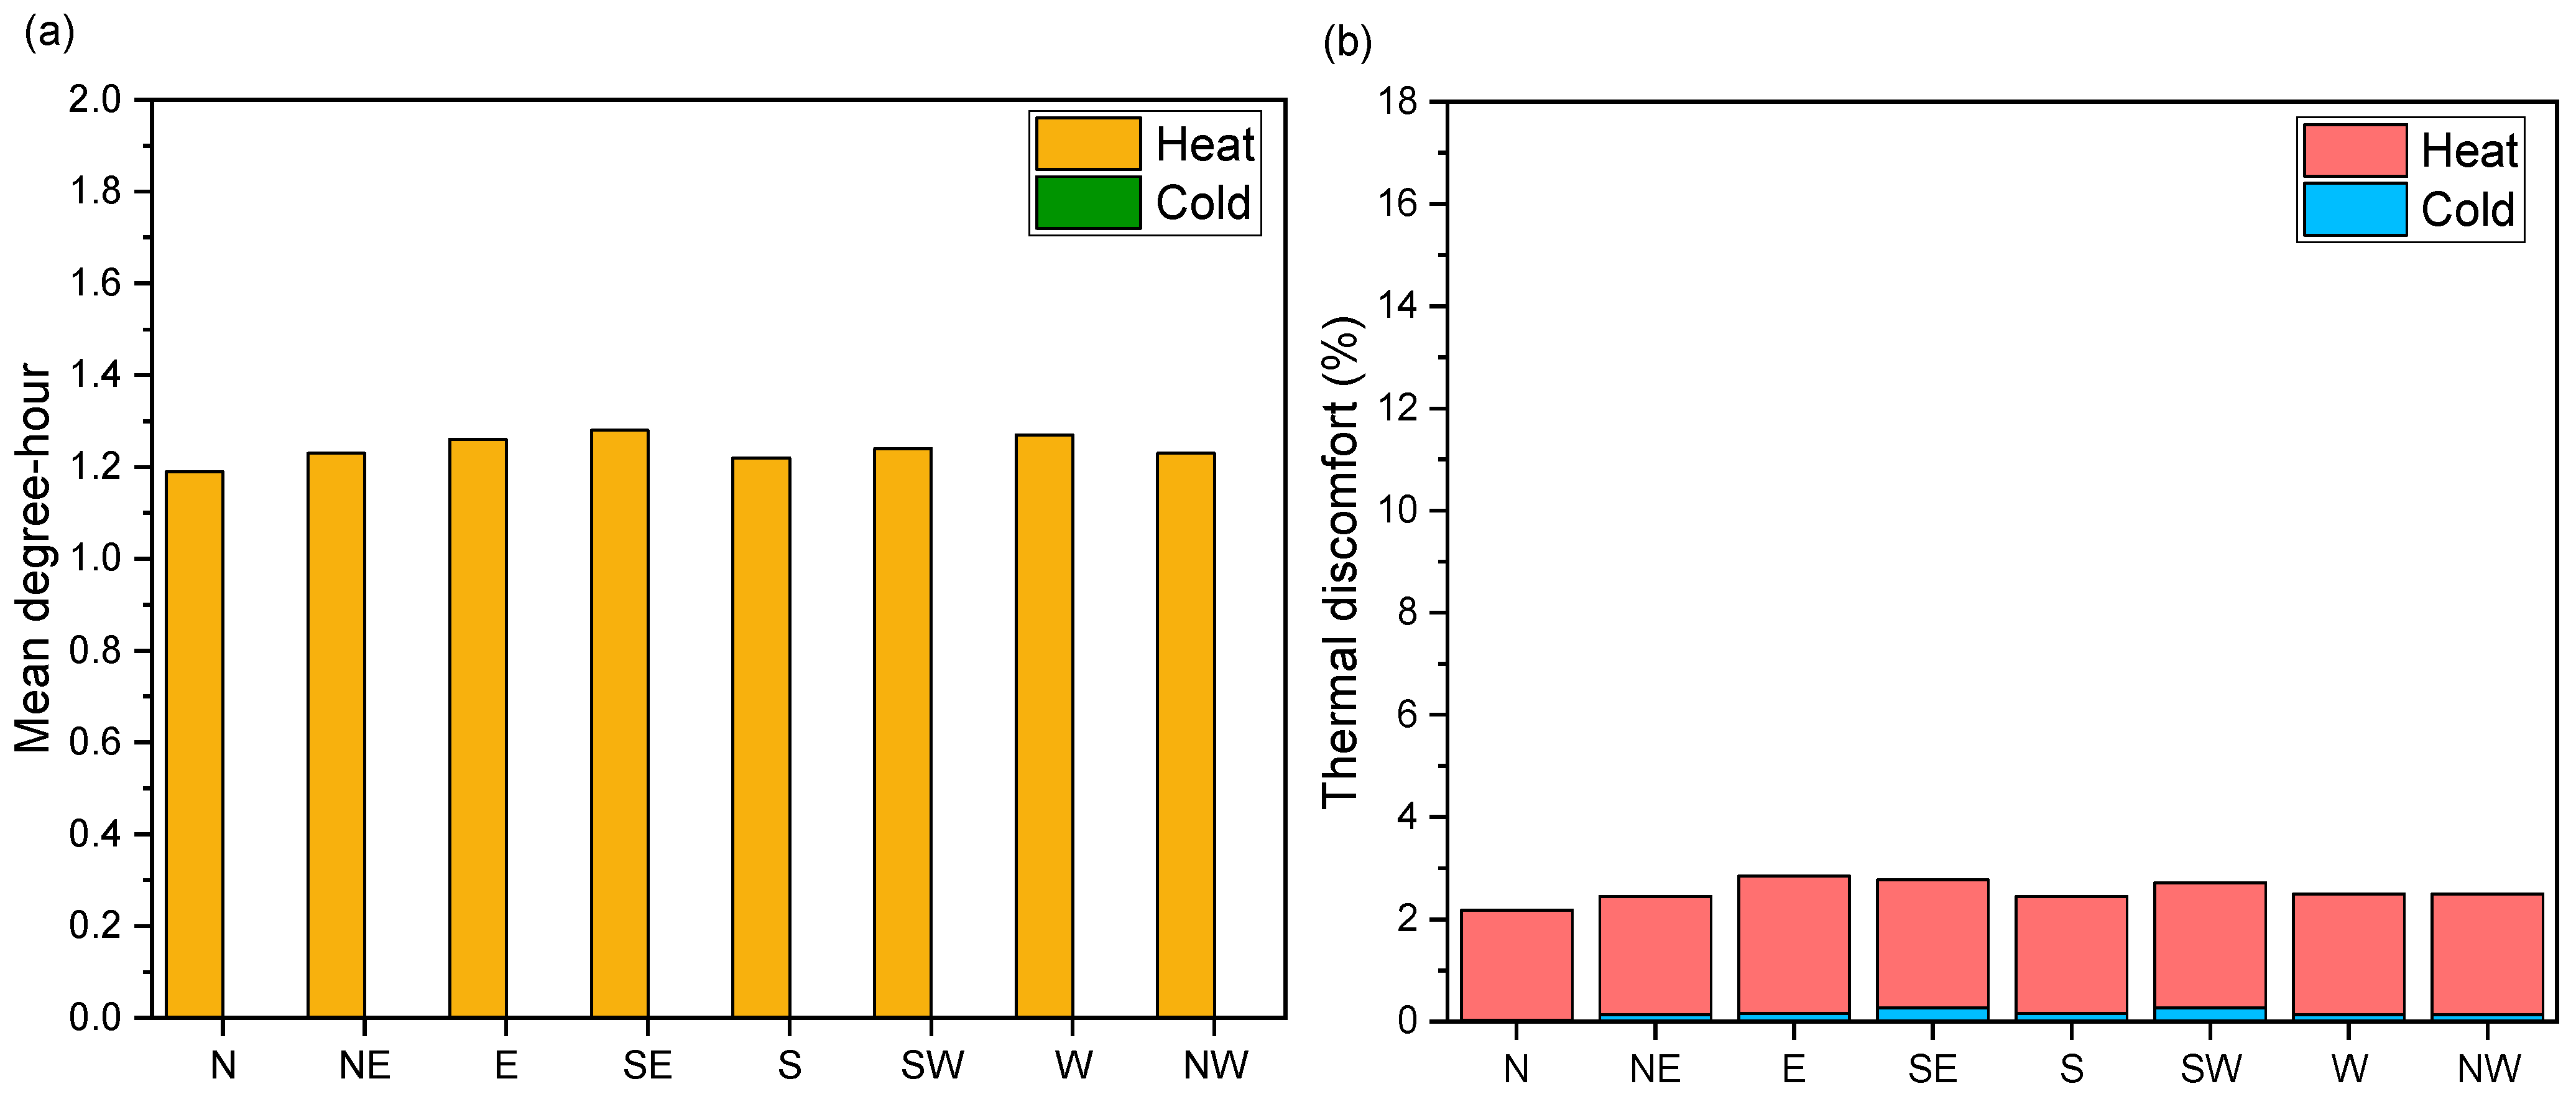
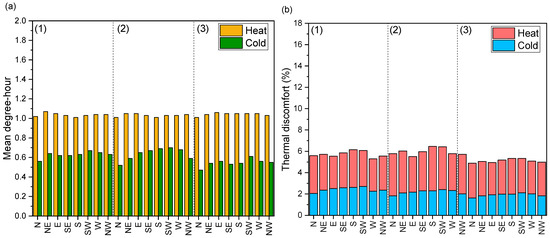
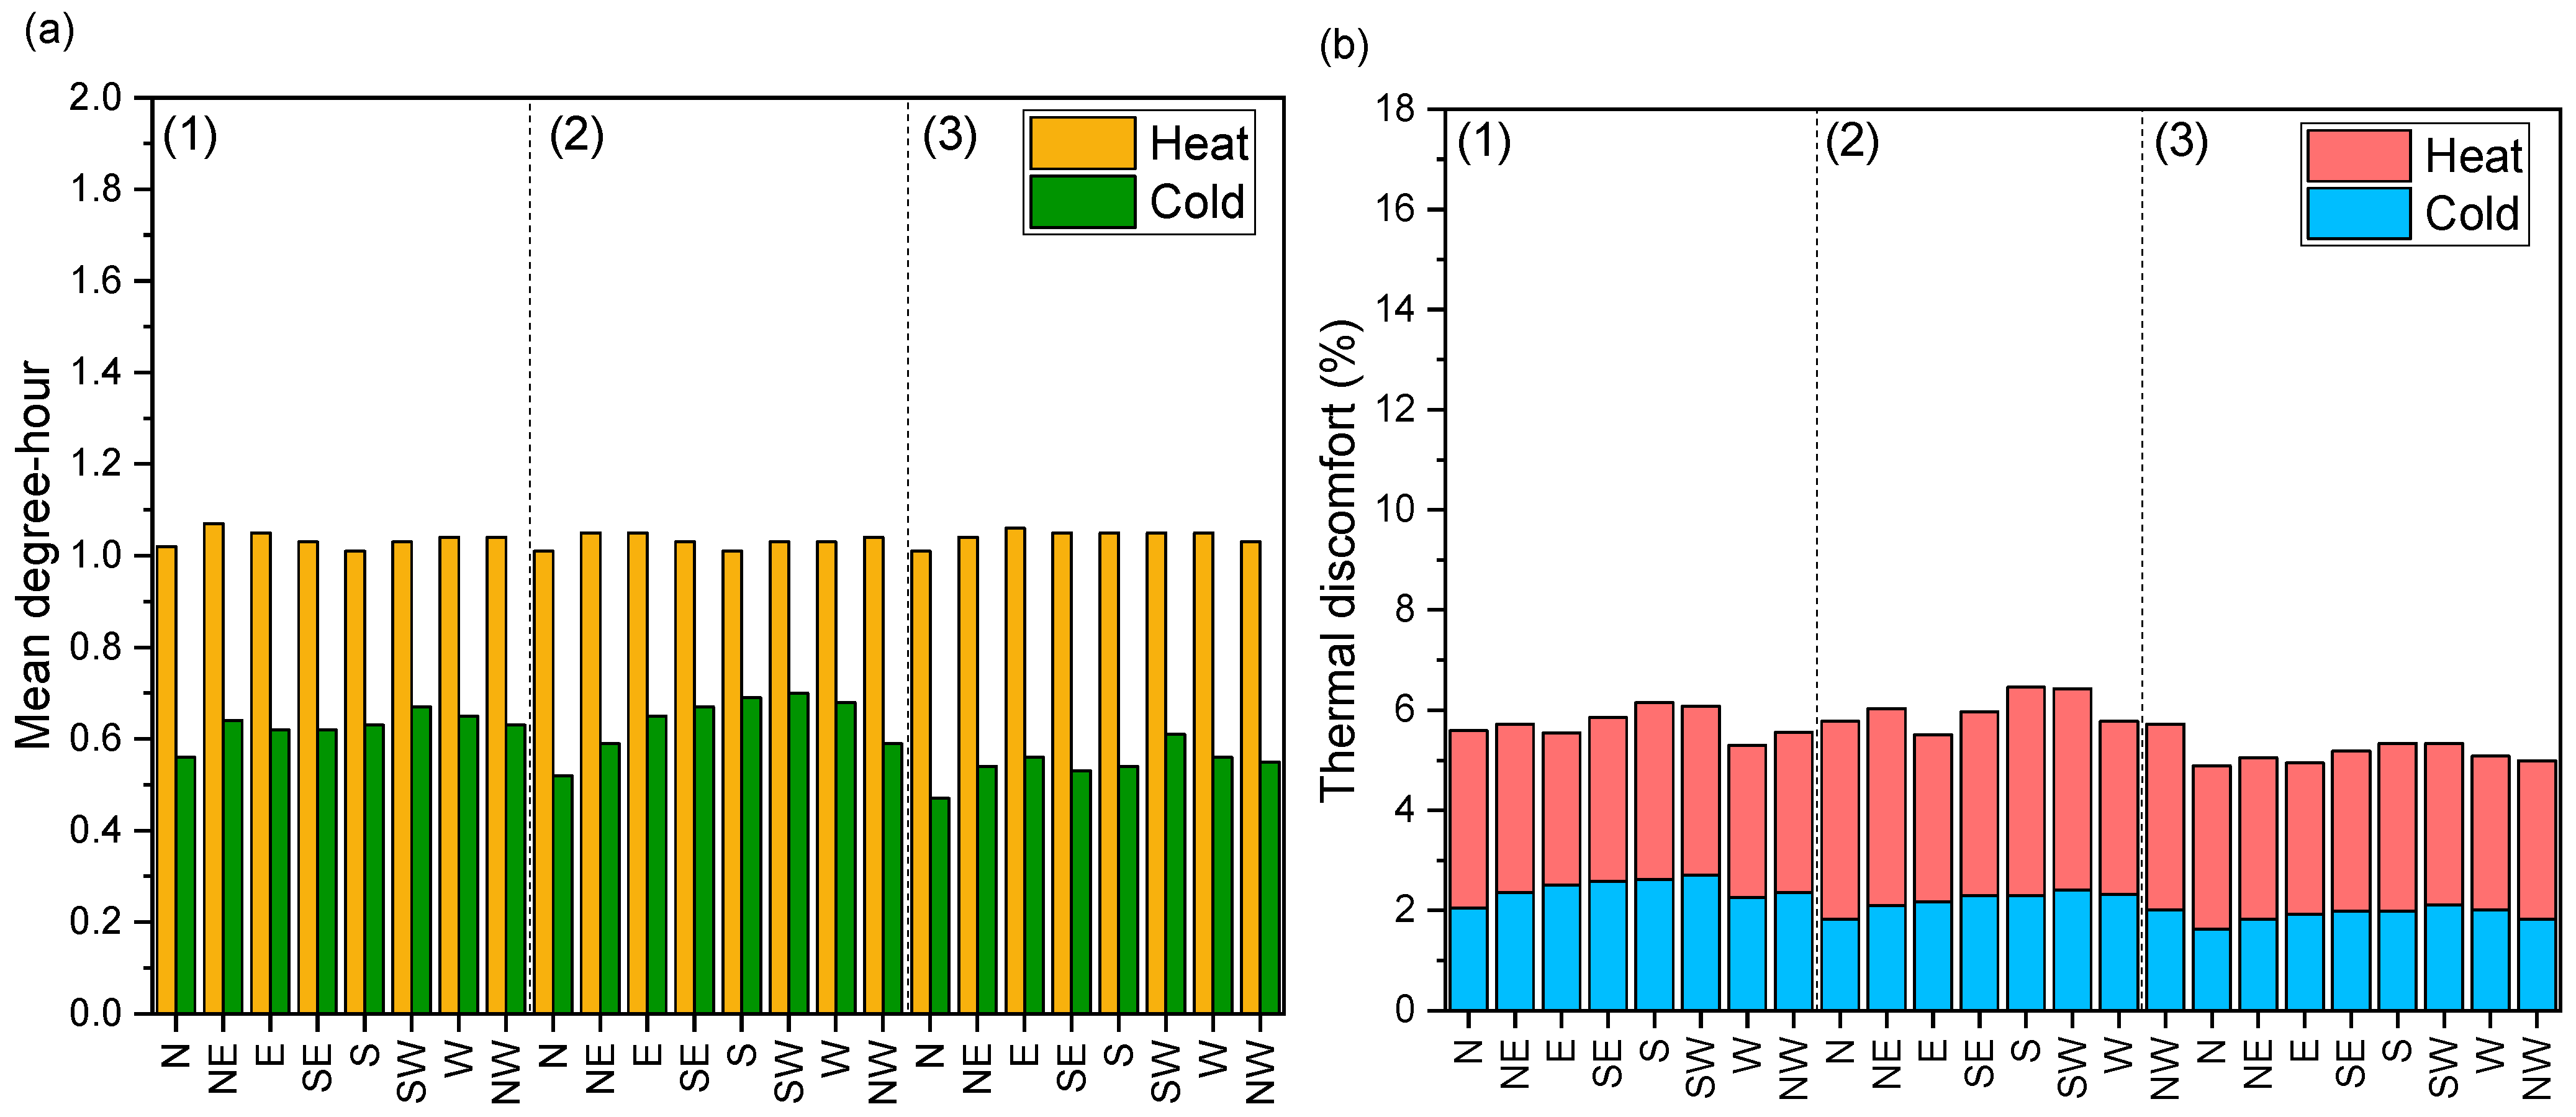
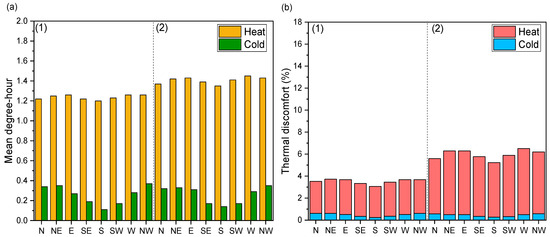
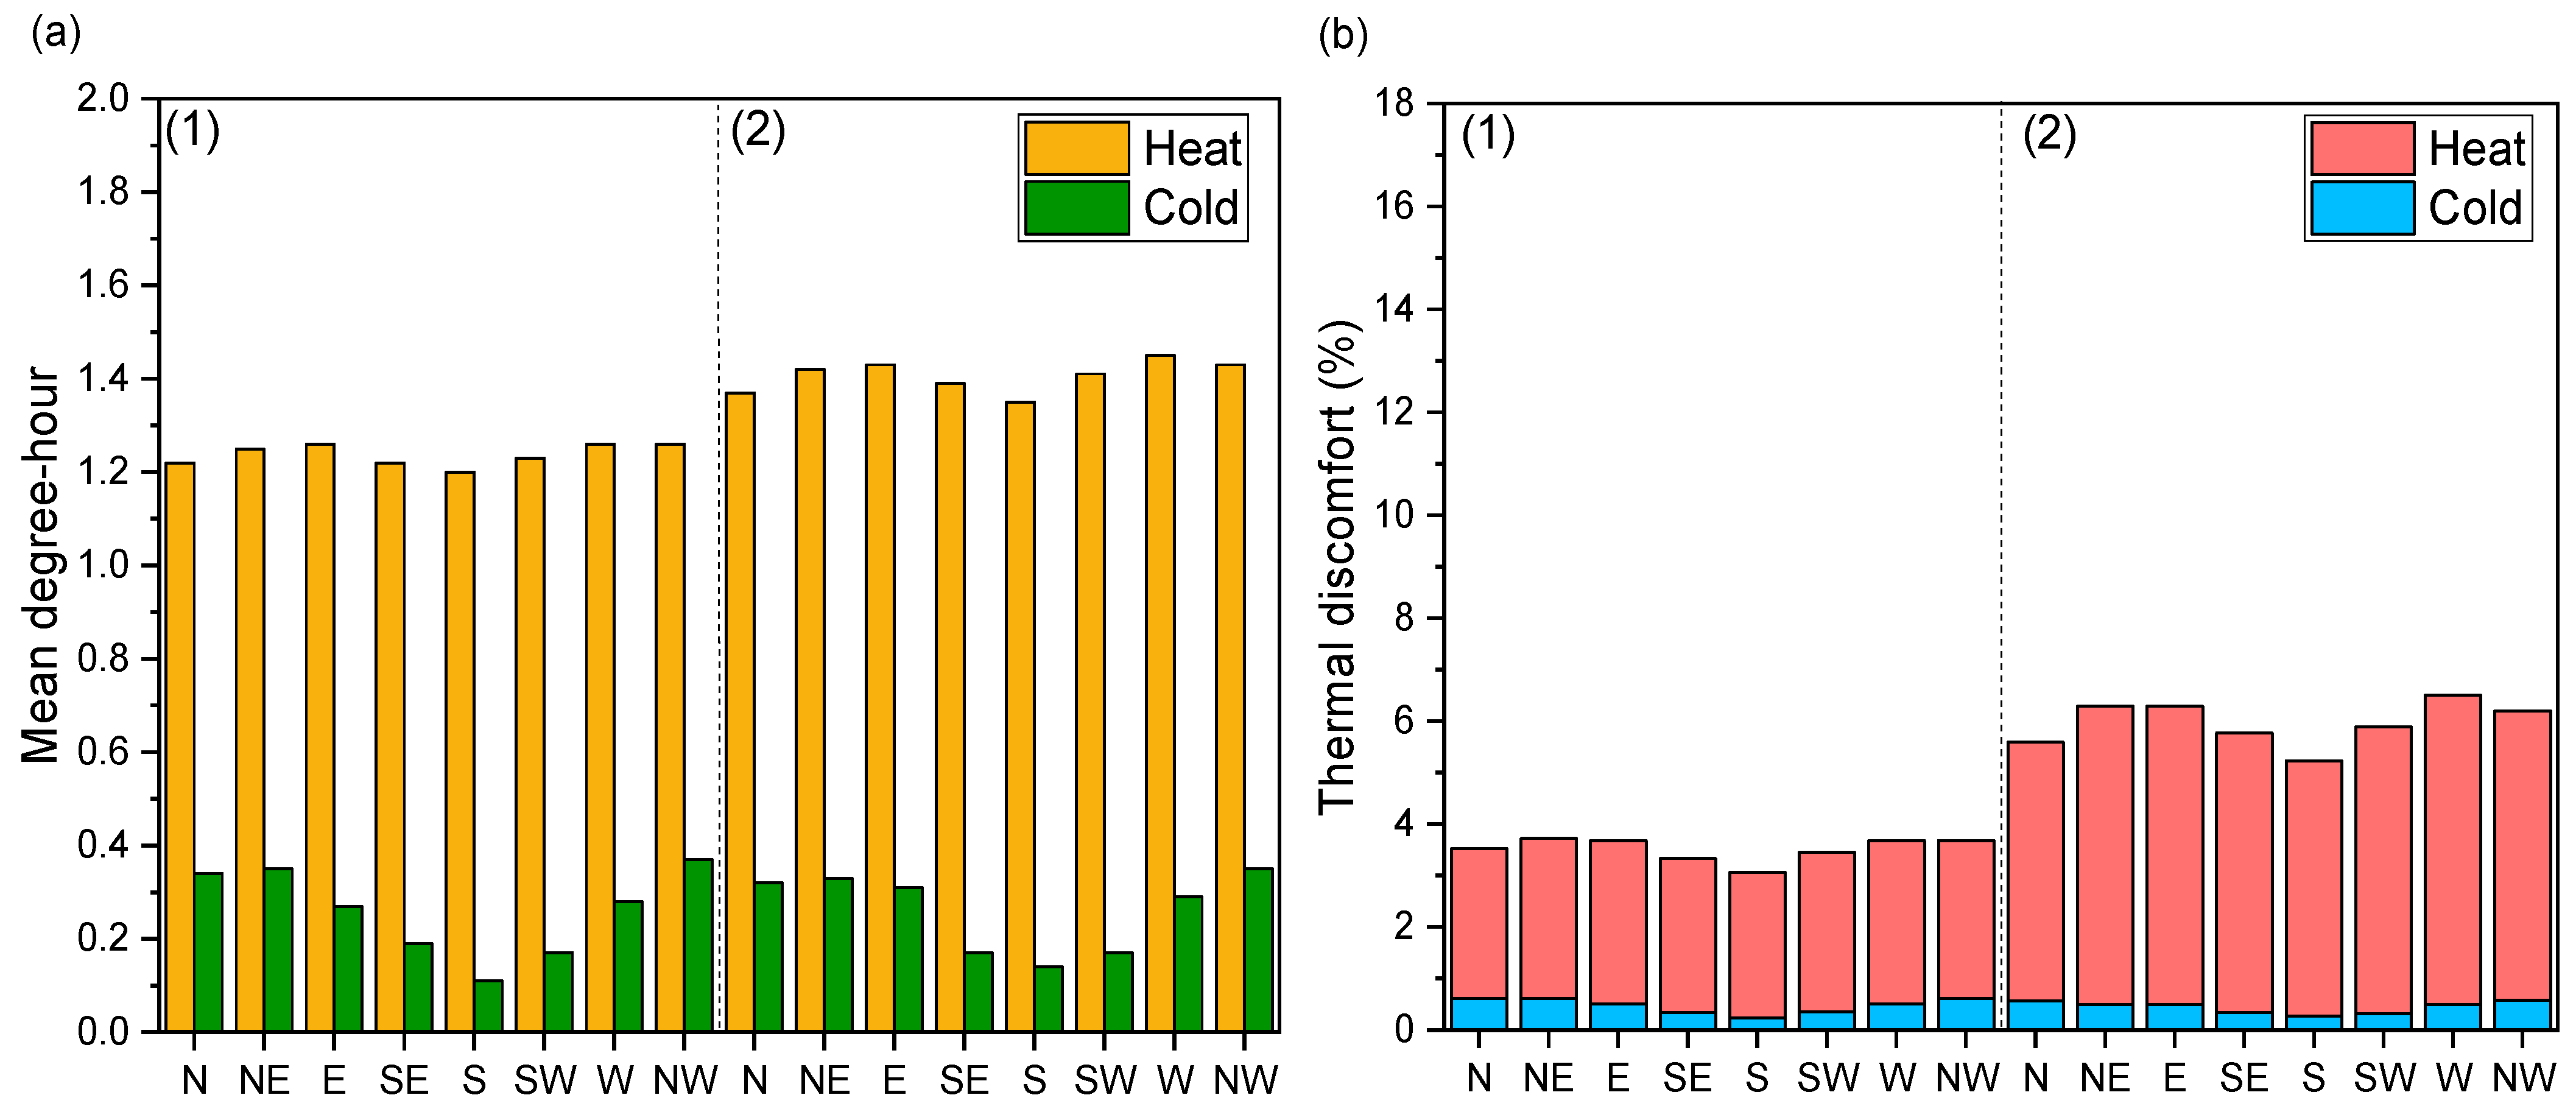
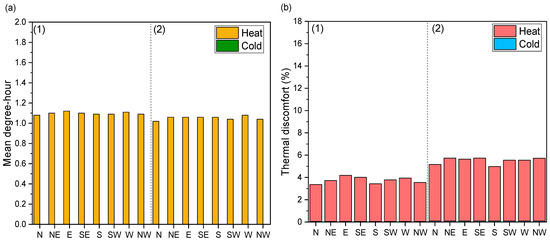
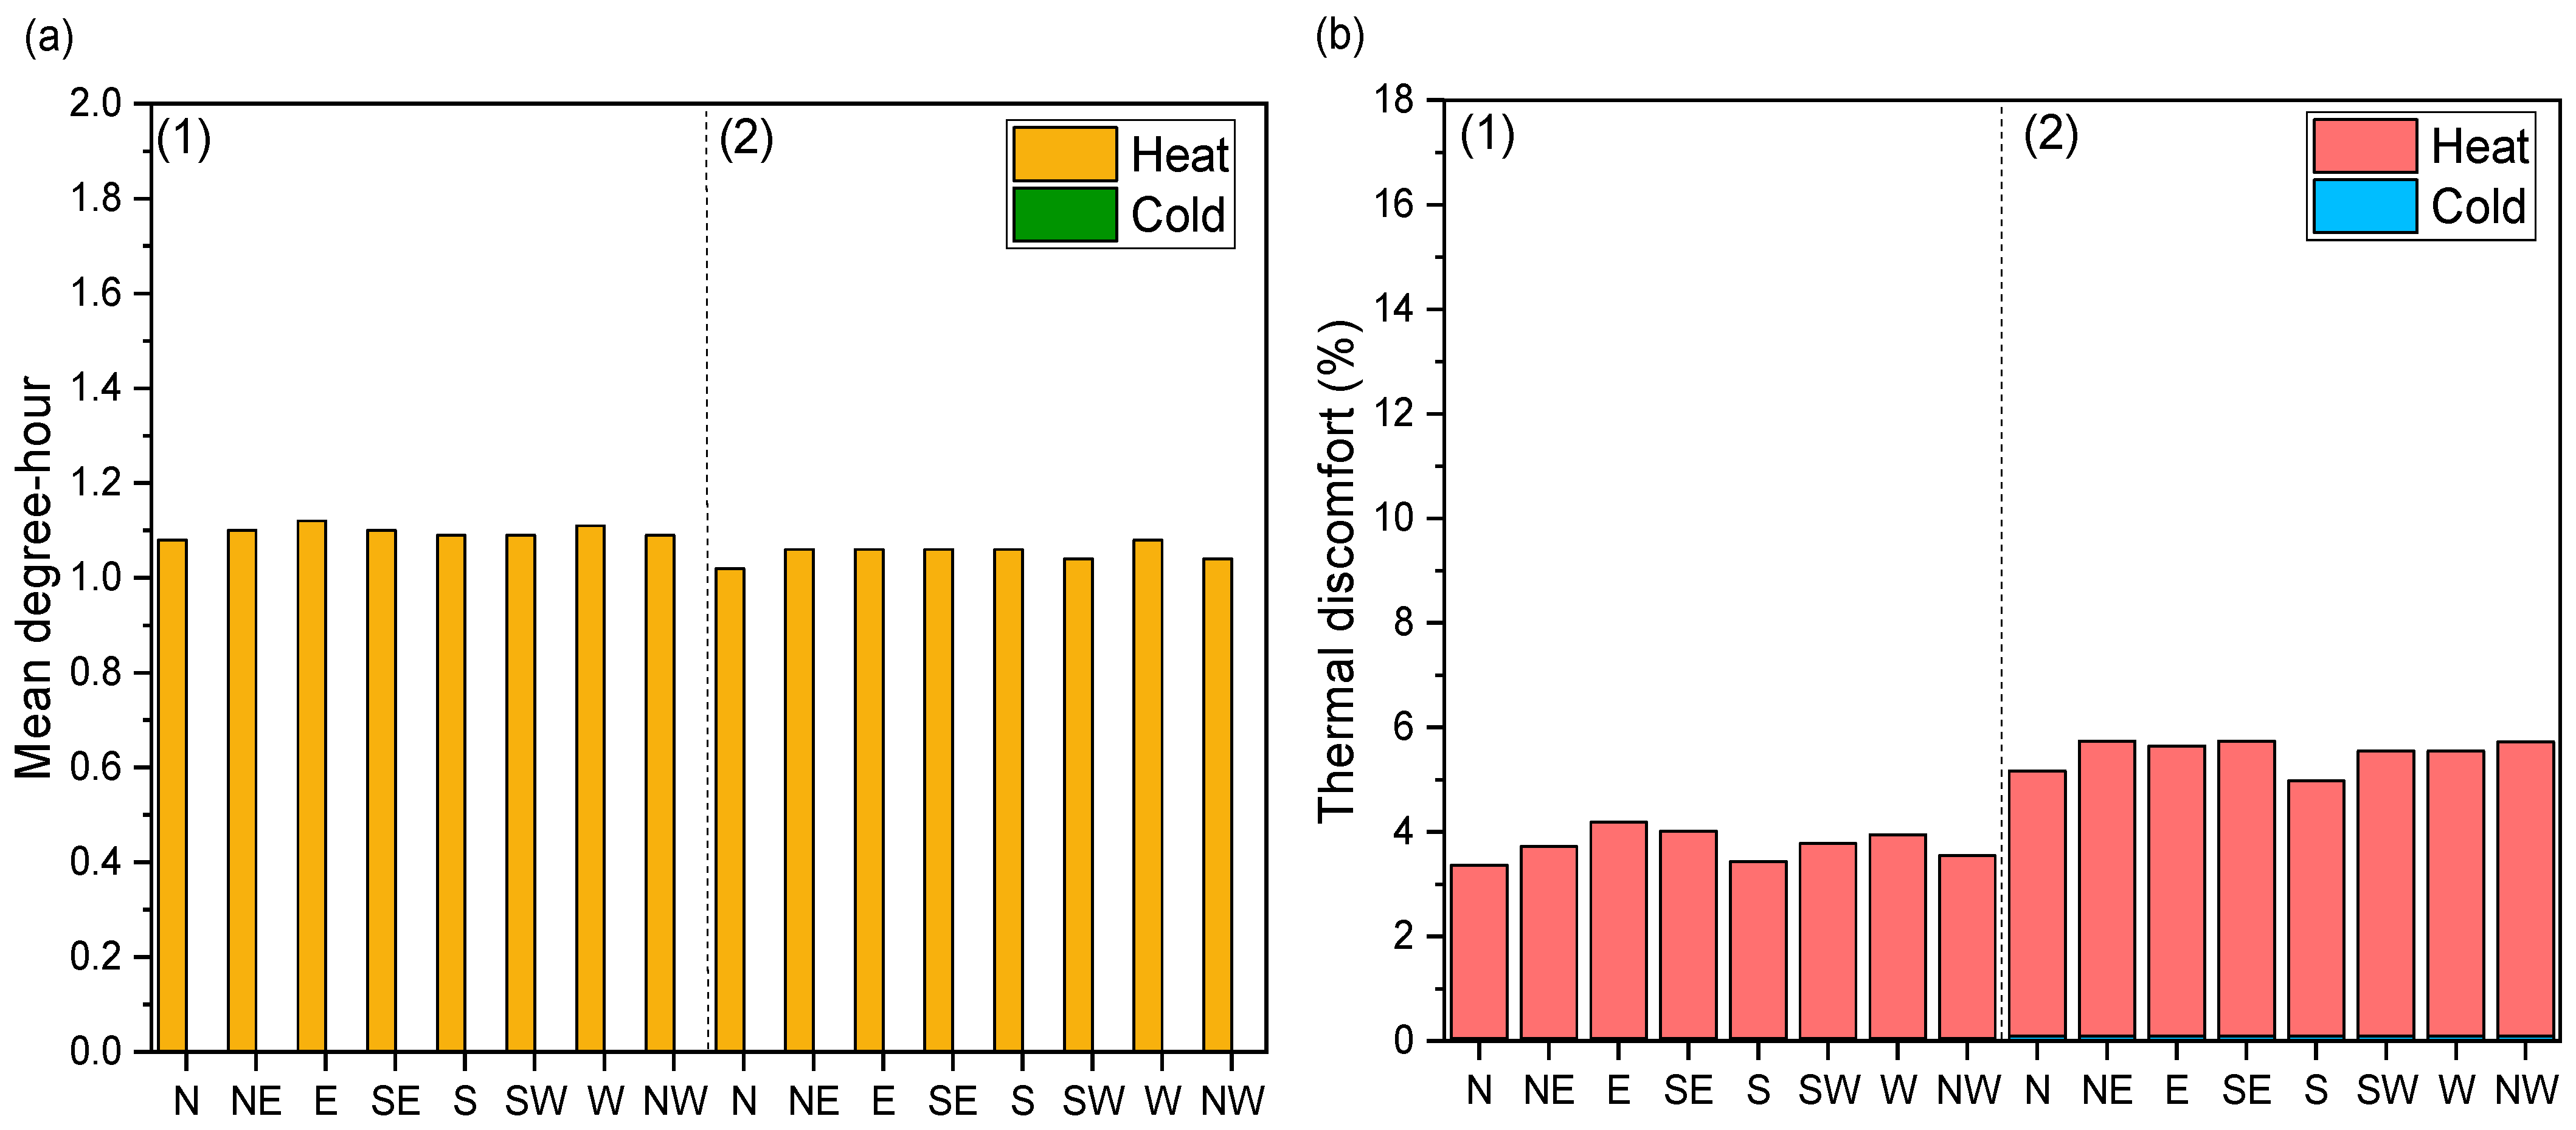
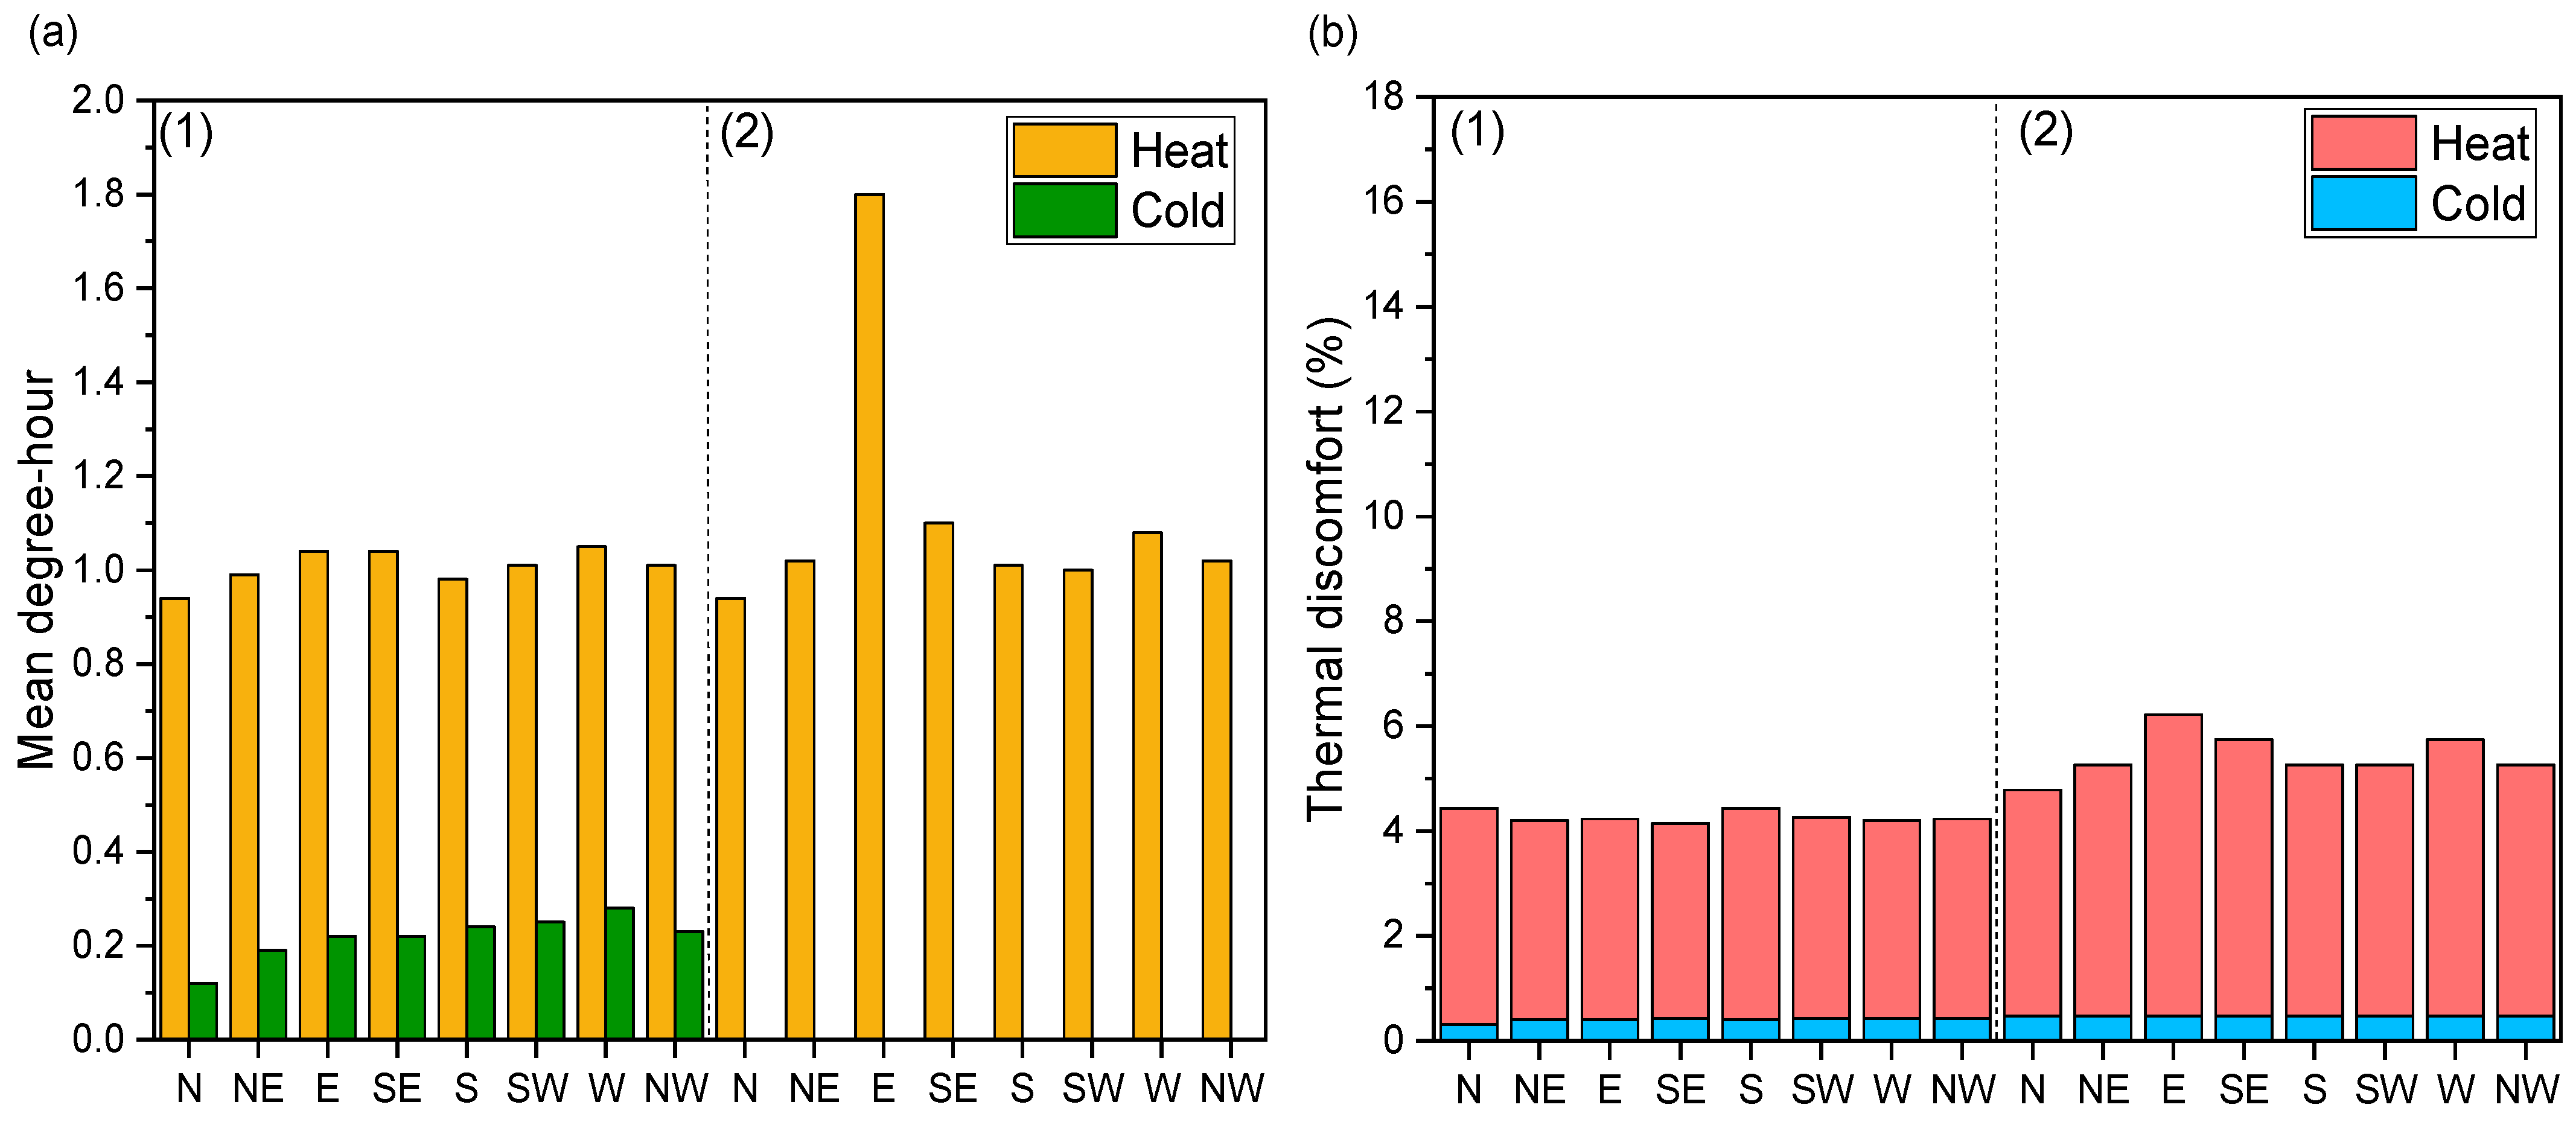
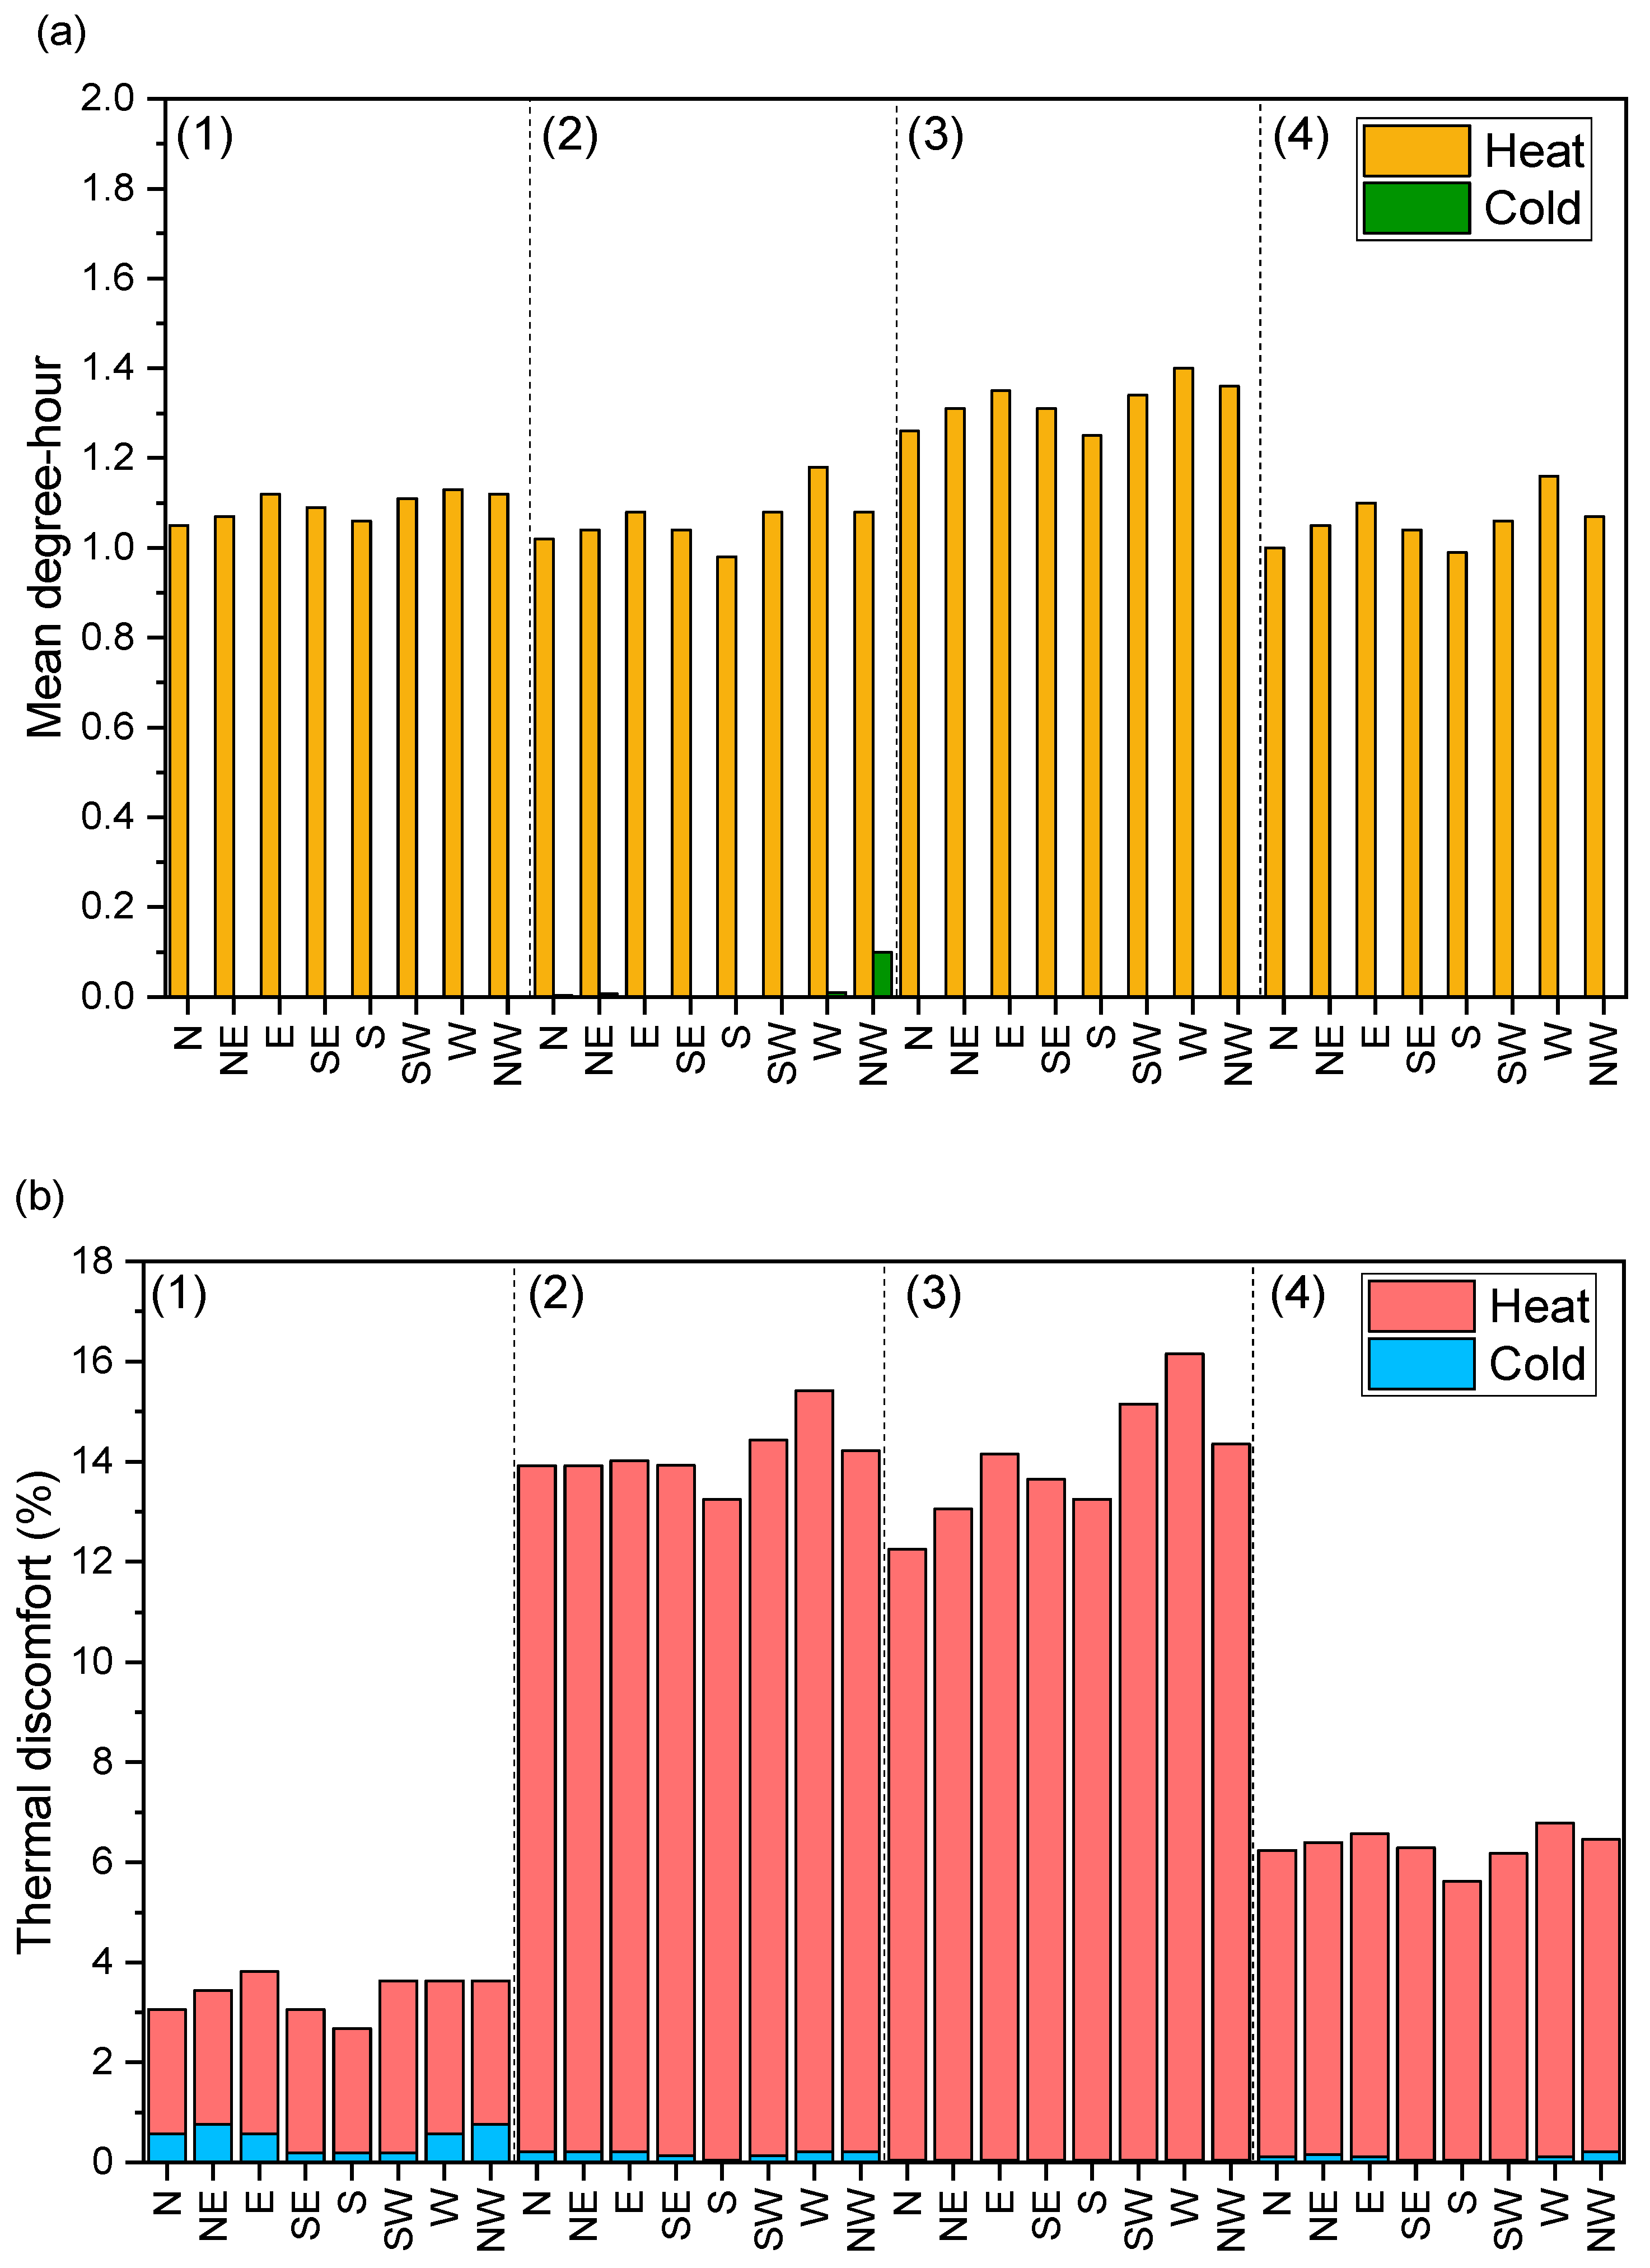
Figure 6 shows, as an example, the bioclimatic charts for bedroom 2 with use pattern 2 for north (0°) and east (90°) orientations. The bioclimatic charts for all rooms in the dwelling, for the eight solar orientations, are shown in the Supplementary Material. The charts illustrate the distribution of temperature and relative humidity throughout the year for each orientation, allowing the percentage of hours spent within or outside the thermal comfort zone to be identified. Figure 7, Figure 8, Figure 9, Figure 10, Figure 11 and Figure 12 show the mean degree-hours and the percentage of discomfort obtained using the bioclimatic chart for the building’s room, considering the different use patterns and the eight solar orientations.
Figure 6.
Bioclimatic chart for bedroom 2 with use pattern 2 with solar orientation (a) north and (b) east.
Figure 7.
Thermal discomfort in bedroom 1 for different solar orientations considering the approach of (a) mean degree-hours and (b) bioclimatic chart.
Figure 8.
Thermal discomfort in bedroom 2 for different solar orientations considering the approach of (a) mean degree-hours and (b) bioclimatic chart. The numbers (1, 2, and 3) indicate the use patterns of this room.
Figure 9.
Thermal discomfort in bedroom 3 for different solar orientations considering the approach of (a) mean degree-hours and (b) bioclimatic chart. The numbers (1 and 2) indicate the use patterns of this room.
Figure 10.
Thermal discomfort in living room 1 for different solar orientations considering the approach of (a) mean degree-hours and (b) bioclimatic chart. The numbers (1 and 2) indicate the use patterns of this room.
Figure 11.
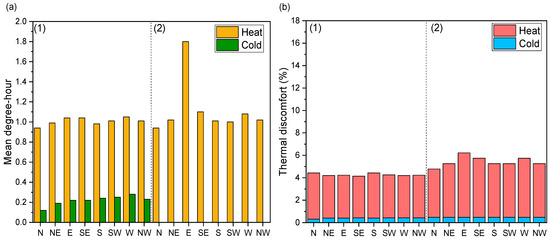
Thermal discomfort in living room 2 for different solar orientations considering the approach of (a) mean degree-hours and (b) bioclimatic chart. The numbers (1 and 2) indicate the use patterns of this room.
Figure 12.
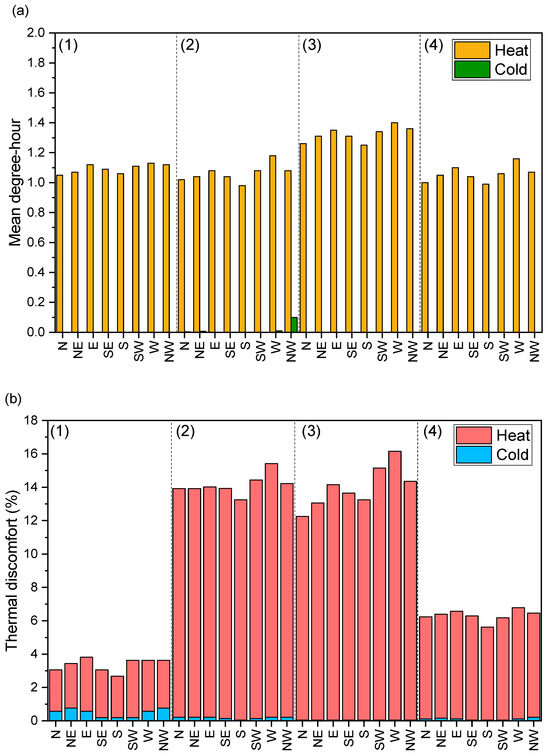
Thermal discomfort in the kitchen for different solar orientations considering the approach of (a) mean degree-hours and (b) bioclimatic chart. The numbers (1, 2, 3 and 4) indicate the use patterns of this room.
In bedroom 1, only one use pattern was considered. The north orientation provided the best thermal comfort conditions according to both approaches evaluated, while the east and southeast orientations performed the worst. In bedroom 2, the change in solar orientation resulted in slight variations in thermal discomfort for the three use patterns, especially using the mean degree-hour approach. This behaviour is due to the air-conditioning, which regulates the internal temperature when occupants are present. Even so, discomfort across all use patterns indicates that air-conditioning does not guarantee adequate thermal comfort. According to the bioclimatic chart approach, the east orientation provided less thermal discomfort for use patterns 1 and 2, and the north orientation for use pattern 3. In bedroom 3, both approaches indicated south orientation as the most favourable for the two simulated use patterns, showing the lowest mean degree-hour values and lowest discomfort percentages on the bioclimatic chart. For use pattern 2, characterised by longer occupancy periods and more intensive equipment use, thermal discomfort increased, predominantly due to heat, as a result of higher internal loads.
In living room 1, with both use patterns, north orientation performed best according to the mean degree-hours approach. According to the bioclimatic chart, however, this orientation was only favourable with use pattern 1. With use pattern 2, the south orientation performed better, possibly because occupancy is concentrated between 6 p.m. and 10 p.m., while pattern 1 includes occupancy throughout several periods of the day. Thus, a south orientation tends to provide milder temperatures in the late afternoon and early evening, due to the lower radiation throughout the day. In living room 2, the mean degree-hour approach also indicated north orientation as the most favourable for both use patterns. According to the bioclimatic chart, a southeast orientation was the most suitable for use pattern 1, while a north orientation performed better for use pattern 2.
In the kitchen, the mean degree-hour approach indicated north orientation as the most suitable for use pattern 1, while south orientation proved more favourable for the other patterns. According to the bioclimatic chart, north orientation performed best in use pattern 3, while south orientation was more suitable for patterns 1, 2 and 4. Among the simulated use patterns, pattern 1 presented the lowest levels of thermal discomfort in both approaches. Although all patterns include periods of occupancy distributed throughout the day, pattern 1 combines reduced occupancy times with the absence of window opening for natural ventilation, highlighting the direct influence of user behaviour on comfort conditions.
The highest discomfort percentage estimated by the bioclimatic chart was 16.2% (kitchen, use pattern 3, west orientation). Simply changing the orientation would reduce this value to 12.3%. Using the mean degree-hour approach, the most uncomfortable room was living room 2 with use pattern 2, with a mean degree-hour of 1.8 in the east orientation. Changing to the north orientation would reduce this value to 0.91 mean degree-hours. These results of both approaches reinforce the relevance of solar orientation for the thermal performance of rooms.
Nevertheless, it was observed that the influence of solar orientation depends directly on the use pattern. In living room 2, for example, use pattern 2 showed the highest variation in discomfort, ranging from 6.2% (east orientation) to 4.8% (north orientation). On the other hand, with use pattern 1, which has the highest occupancy rate throughout the day, the minimum and maximum percentages were closer, ranging from 4.2% (southeast orientation) to 4.4% (south orientation).
3.2. Solar Orientation Associated with Optimal Thermal Comfort Performance
Comparing rooms with the same use pattern but facing different solar orientations enabled identification of the orientations associated with the best thermal performance using both approaches (Table 3 and Table 4). Based on the mean degree-hour approach, seven of the fourteen analysed cases showed the lowest discomfort levels for the north orientation. In six cases, the best performance was associated with the south orientation, while one case (bedroom 2, use pattern 2) exhibited equivalent performance for both north and south orientations.
Table 3.
Solar orientation that provided the best performance (lowest thermal discomfort) in each room of the dwelling.
Table 4.
Number of cases in which each solar orientation provided the best performance (lowest thermal discomfort).
The bioclimatic chart analysis also indicated a predominance of north (five cases) and south (six cases) orientations among those that resulted in more comfortable conditions. However, this approach showed greater variability in the most favourable orientation. The east orientation was identified as the most suitable in bedroom 2 with use pattern 2 (as shown in Figure 5), while in bedroom 2 with use pattern 1, the east and northwest orientations performed equally well. In addition, living room 2 with use pattern 1 performed better under a southeast orientation. It should be noted that the east- and southeast-facing rooms exceeded the 80% relative humidity limit less frequently, which contributed to their superior relative performance in these specific cases.
The differences between the approaches were mainly due to the parameters adopted. The calculation of mean degree-hours was based on the operative temperature, with 26 °C set as the base temperature to characterise heat discomfort. On the other hand, the bioclimatic chart considered air temperature relative to relative humidity and set 29 °C as the limit temperature. These methodological distinctions help explain the variations in results and reinforce the importance of using different approaches for a comprehensive assessment of thermal comfort.
Overall, the results of both approaches confirm that north- and south-facing orientations provide higher thermal comfort, corroborating the literature. Previous studies indicate that north and south tend to be more favourable for thermal comfort when compared to east and west orientations [12], and that, in the southern hemisphere, north-facing orientation is particularly suitable for larger glazed areas, provided that efficient shading is implemented and local urban conditions are considered [14]. Both approaches also indicated that heat discomfort has a more pronounced effect on the overall thermal performance of the building than cold discomfort, even though the latter is not negligible in Goiânia.
4. Conclusions
This study compared two thermal discomfort assessment approaches (mean degree-hour and bioclimatic chart) applied to a two-storey single-family dwelling, considering different solar orientations and use patterns. Based on the analysis of mean degree-hours, north (0°) and south (180°) orientations showed the best thermal performance in most of the simulated scenarios. According to the bioclimatic chart, in some cases, the east (90°) and southeast (135°) orientations were favoured because they exceeded the upper humidity limit adopted by this approach (80%) to a lesser extent. Thus, given that occupants consider humidity levels above this threshold acceptable, the bioclimatic chart also points to superior performance for north- and south-facing orientations.
Despite differences between the results obtained with each approach in some cases, the comparative analysis confirms that both approaches identify solar orientation as a relevant design parameter for improving thermal performance and potentially reducing air-conditioning energy demand. Furthermore, the results show that outcomes from both approaches are conditioned by room-use patterns.
From a methodological perspective, the findings also emphasise that thermal comfort outcomes are sensitive to the assessment approach adopted. The mean degree-hour approach and the bioclimatic chart rely on fixed assessment criteria that focus on deviations from predefined temperature and humidity limits. In contrast, methods based on adaptive thermal comfort define acceptable indoor conditions as a function of outdoor climate and occupants’ adaptive capacity, while indices such as PMV/PPD predict thermal sensation based on steady-state heat-balance assumptions. As a result, the interpretation of thermal discomfort could differ under an adaptive framework, particularly during periods of climatic transition or high outdoor temperatures. Future research could apply adaptive comfort models and PMV/PPD indices to enable a comprehensive comparison with fixed-threshold approaches, further strengthening the understanding of methodological influences on thermal comfort assessment.
Supplementary Materials
The following supporting information can be downloaded at: https://www.mdpi.com/article/10.3390/su18020892/s1, Table S1: Representative use patterns for each room. Figure S1: Bioclimatic chart for bedroom 1 with use pattern 1 with different solar orientations. Figure S2: Bioclimatic chart for bedroom 2 with use pattern 1 with different solar orientations. Figure S3: Bioclimatic chart for bedroom 2 with use pattern 2 with different solar orientations. Figure S4: Bioclimatic chart for bedroom 2 with use pattern 3 with different solar orientations. Figure S5: Bioclimatic chart for bedroom 3 with use pattern 1 with different solar orientations. Figure S6: Bioclimatic chart for bedroom 3 with use pattern 2 with different solar orientations. Figure S7: Bioclimatic chart for living room 1 with use pattern 1 with different solar orientations. Figure S8: Bioclimatic chart for living room 1 with use pattern 2 with different solar orientations. Figure S9: Bioclimatic chart for living room 2 with use pattern 1 with different solar orientations. Figure S10: Bioclimatic chart for living room 2 with use pattern 2 with different solar orientations. Figure S11: Bioclimatic chart for the kitchen with use pattern 1 with different solar orientations. Figure S12: Bioclimatic chart for the kitchen with use pattern 2 with different solar orientations. Figure S13: Bioclimatic chart for the kitchen with use pattern 3 with different solar orientations. Figure S14: Bioclimatic chart for the kitchen with use pattern 4 with different solar orientations.
Author Contributions
Conceptualization, K.H.B. and E.G.; methodology, K.H.B.; validation, K.H.B.; formal analysis, K.H.B. and T.P.S.; investigation, K.H.B. and T.P.S.; data curation, K.H.B.; writing—original draft preparation, K.H.B. and T.P.S.; writing—review and editing, E.G.; visualisation, K.H.B. and T.P.S.; supervision, E.G. All authors have read and agreed to the published version of the manuscript.
Funding
This research received no external funding.
Institutional Review Board Statement
Not applicable.
Informed Consent Statement
Not applicable.
Data Availability Statement
The original contributions presented in this study are included in the article and Supplementary Material. Further inquiries can be directed to the corresponding author(s).
Conflicts of Interest
The authors declare no conflicts of interest.
References
- Kawakubo, S.; Sugiuchi, M.; Arata, S. Office Thermal Environment That Maximizes Workers’ Thermal Comfort and Productivity. Build. Environ. 2023, 233, 110092. [Google Scholar] [CrossRef] [Scilit]
- van Hoof, J.; Schellen, L.; Soebarto, V.; Wong, J.K.W.; Kazak, J.K. Ten Questions Concerning Thermal Comfort and Ageing. Build. Environ. 2017, 120, 123–133. [Google Scholar] [CrossRef] [Scilit]
- Simões, G.M.F.; Leder, S.M.; Labaki, L.C. How Uncomfortable and Unhealthy Can Social (Low-Cost) Housing in Brazil Become with Use? Build. Environ. 2021, 205, 108218. [Google Scholar] [CrossRef] [Scilit]
- Triana, M.A.; Lamberts, R.; Sassi, P. Characterisation of Representative Building Typologies for Social Housing Projects in Brazil and Its Energy Performance. Energy Policy 2015, 87, 524–541. [Google Scholar] [CrossRef] [Scilit]
- Alves, P.B.R.; Silva, A.C.N.; Morais, J.M.S.C.; Rufino, I.A.A. Indicadores de Qualidade Ambiental Em Condomínios Horizontais: Um Estudo de Caso Em Campina Grande/PB [Environmental Quality Indicators in Horizontal Condominiums: A Case Study in Campina Grande, Paraíba]. In Proceedings of the 7° Congresso Luso Brasileiro para o Planejamento Urbano, Regional, Integrado e Sustentável, Maceió, Brazil, 5–7 October 2016. (In Portuguese) [Google Scholar]
- Bernardes, G.D.; Soares Júnior, A.A. Condomínios Horizontais Fechados: Reflexão Sobre a Configuração Do Espaço Intrametropolitano de Goiânia [Gated Horizontal Condominiums: Reflections on the Configuration of Goiânia’s Intrametropolitan Space]. Soc. Cult. 2008, 10, 209–225. (In Portuguese) [Google Scholar]
- Kyritsi, E.; Michael, A. An Assessment of the Impact of Natural Ventilation Strategies and Window Opening Patterns in Office Buildings in the Mediterranean Basin. Build. Environ. 2020, 175, 106384. [Google Scholar] [CrossRef] [Scilit]
- Park, B.; Lee, S. Investigation of the Energy Saving Efficiency of a Natural Ventilation Strategy in a Multi-story School Building. Energies 2020, 13, 1746. [Google Scholar] [CrossRef] [Scilit]
- Zilberberg, E.; Trapper, P.; Meir, I.A.; Isaac, S. The Impact of Thermal Mass and Insulation of Building Structure on Energy Efficiency. Energy Build. 2021, 241, 110954. [Google Scholar] [CrossRef] [Scilit]
- Tripathi, B.M.; Shukla, S.K. A Comprehensive Review of the Thermal Performance in Energy Efficient Building Envelope Incorporated with Phase Change Materials. J. Energy Storage 2024, 79, 110128. [Google Scholar] [CrossRef] [Scilit]
- Scolaro, T.P.; Ghisi, E.; Silva, C.M. Effectiveness of Cool and Green Roofs Inside and Outside Buildings in the Brazilian Context. Sustainability 2024, 16, 8104. [Google Scholar] [CrossRef] [Scilit]
- Liping, W.; Hien, W.N. The Impacts of Ventilation Strategies and Facade on Indoor Thermal Environment for Naturally Ventilated Residential Buildings in Singapore. Build. Environ. 2007, 42, 4006–4015. [Google Scholar] [CrossRef] [Scilit]
- Habibi, S. The Effect of Building Orientation on Energy Efficiency. Clean Technol. Environ. Policy 2024, 26, 1315–1330. [Google Scholar] [CrossRef] [Scilit]
- Benincá, L.; Crespo Sánchez, E.; Passuello, A.; Karini Leitzke, R.; Grala da Cunha, E.; Maria González Barroso, J. Multi-Objective Optimization of the Solar Orientation of Two Residential Multifamily Buildings in South Brazil. Energy Build. 2023, 285, 112838. [Google Scholar] [CrossRef] [Scilit]
- Yousefi, F.; Gholipour, Y.; Yan, W. A Study of the Impact of Occupant Behaviors on Energy Performance of Building Envelopes Using Occupants’ Data. Energy Build. 2017, 148, 182–198. [Google Scholar] [CrossRef] [Scilit]
- Eli, L.G.; Krelling, A.F.; Olinger, M.S.; Melo, A.P.; Lamberts, R. Thermal Performance of Residential Building with Mixed-Mode and Passive Cooling Strategies: The Brazilian Context. Energy Build. 2021, 244, 111047. [Google Scholar] [CrossRef] [Scilit]
- Pierozan, E.; Scolaro, T.P.; Watzko, E.S.; Ghisi, E. Influência Do Padrão de Uso e Ocupação de Habitações Multifamiliares No Consumo Energético da Edificação [Influence of Multifamily Housing Use and Occupancy Patterns on Building Energy Consumption]. Ambient. Constr. 2023, 23, 43–61. (In Portuguese) [Google Scholar] [CrossRef] [Scilit]
- ASHRAE Standard 55; Thermal Environmental Conditions for Human Occupancy; ASHARE: Atlanta, GA, USA, 2020.
- Durmayaz, A.; Kadoǧlu, M.; En, Z. An Application of the Degree-Hours Method to Estimate the Residential Heating Energy Requirement and Fuel Consumption in Istanbul. Energy 2000, 25, 1245–1256. [Google Scholar] [CrossRef] [Scilit]
- Givoni, B. Man Climate and Architecture, 2nd ed.; Applied Science Publishers: London, UK, 1976. [Google Scholar]
- Grassi, B.; Piana, E.A.; Lezzi, A.M.; Pilotelli, M. A Review of Recent Literature on Systems and Methods for the Control of Thermal Comfort in Buildings. Appl. Sci. 2022, 12, 5473. [Google Scholar] [CrossRef] [Scilit]
- Chkeir, A.; Bouzidi, Y.; El Akili, Z.; Charafeddine, M.; Kashmar, Z. Assessment of Thermal Comfort in the Traditional and Contemporary Houses in Byblos: A Comparative Study. Energy Built Environ. 2024, 5, 933–945. [Google Scholar] [CrossRef] [Scilit]
- Abd Rahman, N.M.; Haw, L.C.; Fazlizan, A.; Hussin, A.; Imran, M.S. Thermal Comfort Assessment of Naturally Ventilated Public Hospital Wards in the Tropics. Build. Environ. 2022, 207, 108480. [Google Scholar] [CrossRef] [Scilit]
- Mustapha, T.D.; Hassan, A.S.; Nasir, M.H.A.; Khozaei, F.; Arab, Y. From Perception to Prediction: A Comparative Study of Thermal Comfort Assessment Techniques in School Facilities. Energy Build. 2024, 313, 114233. [Google Scholar] [CrossRef] [Scilit]
- Holopainen, R.; Tuomaala, P.; Hernandez, P.; Häkkinen, T.; Piira, K.; Piippo, J. Comfort Assessment in the Context of Sustainable Buildings: Comparison of Simplified and Detailed Human Thermal Sensation Methods. Build. Environ. 2014, 71, 60–70. [Google Scholar] [CrossRef] [Scilit]
- Rupp, R.F.; Ghisi, E. What Is the Most Adequate Method to Assess Thermal Comfort in Hybrid Commercial Buildings Located in Hot-Humid Summer Climate? Renew. Sustain. Energy Rev. 2014, 29, 449–462. [Google Scholar] [CrossRef] [Scilit]
- Barbosa, K.H.; Scolaro, T.P.; Ghisi, E. Enhancing Building Sustainability: Integrating User Behaviour and Solar Orientation in the Thermal Performance of Houses. Sustainability 2024, 16, 8349. [Google Scholar] [CrossRef] [Scilit]
- INMET. Normais Climatológicas Do Brasil. Período 1991–2020 [Climatological Normals for Brazil. Period 1991–2020]; Ministério da Agricultura, Pecuária e Abastecimento: Brasília, Brazil, 2022. (In Portuguese)
- Melo, A.P.; Lamberts, R.; Mazzafero, L. Manual de Simulação Computacional de Edifícios Com o Uso Do Objeto Ground Domain No Programa EnergyPlus [Manual for Computer Simulation of Buildings Using the Ground Domain Object in the EnergyPlus Programme]; Universidade Federal De Santa Catarina: Florianópolis, Brazil, 2015. (In Portuguese) [Google Scholar]
- Brandalise, M.; Cunha, E.; Avila, V.; Oliveira, L. Análise Da Sensibilidade Do Método Prescritivo Do RTQ-C Quanto à Va-riação de Densidade de Carga Interna [Sensitivity Analysis of the Prescriptive Method of RTQ-C Regarding Variation in Internal Load Density]. In Proceedings of the XV Encontro Nacional de Tecnologia do Ambiente Construído, Maceió, Brazil, 12–14 November 2014; Volume 1. (In Portuguese) [Google Scholar]
- Mizgier, M.O.; Penso, E.A. Desempenho Térmico De Fachadas Ventiladas Como Proposta De Retrofit Em Edifícios Comerciais Na Cidade De São Paulo [Thermal Performance of Ventilated Facades as a Retrofit Proposal for Commercial Buildings in the City of São Paulo]. In Proceedings of the XVI Encontro Nacional de Tecnologia do Ambiente Construído, São Paulo, Brazil, 21–23 September 2016. (In Portuguese) [Google Scholar]
- Triana, M.A.; Lamberts, R.; Sassi, P. Should We Consider Climate Change for Brazilian Social Housing? Assessment of Energy Efficiency Adaptation Measures. Energy Build. 2018, 158, 1379–1392. [Google Scholar] [CrossRef] [Scilit]
- Melo, A.P.; Fossati, M.; Versage, R.S.; Sorgato, M.J.; Scalco, V.A.; Lamberts, R. Development and Analysis of a Metamodel to Represent the Thermal Behavior of Naturally Ventilated and Artificially Air-Conditioned Residential Buildings. Energy Build. 2016, 112, 209–221. [Google Scholar] [CrossRef] [Scilit]
- LabEEE Analysis Bio. Programa Computacional Desenvolvido Pelo LabEEE—Laboratório de Eficiência Energética Em Edi-ficações Da Universidade Federal de Santa Catarina. (In Portuguese) Available online: https://labeee.ufsc.br/downloads/softwares (accessed on 2 December 2025).
- Lamberts, R.; Dutra, L.; Pereira, F.O.R. Eficiência Energética Na Arquitetura; ELETROBRAS/PROCEL: São Paulo, Brazil, 2014. (In Portuguese) [Google Scholar]

Disclaimer/Publisher’s Note: The statements, opinions and data contained in all publications are solely those of the individual author(s) and contributor(s) and not of MDPI and/or the editor(s). MDPI and/or the editor(s) disclaim responsibility for any injury to people or property resulting from any ideas, methods, instructions or products referred to in the content. |
© 2026 by the authors. Licensee MDPI, Basel, Switzerland. This article is an open access article distributed under the terms and conditions of the Creative Commons Attribution (CC BY) license.