


Abstract
Soil salinity is recognized as a critical abiotic stress that limits plant growth on marginal lands. The cup plant (Silphium perfoliatum L.), a perennial bioenergy species with high biomass potential, has been proposed for cultivation on saline-degraded soils; however, its physiological responses to different types of salinity stress, particularly alkaline and neutral salt stress, remain insufficiently characterized. In the present study, the physiological responses of the cup plant to neutral (NaCl) and alkaline (NaHCO3) salt stress at concentrations of 100, 200, and 300 mM were evaluated in a pot experiment conducted under controlled conditions. The assessed indicators included relative chlorophyll content (CCI), chlorophyll fluorescence parameters (Fv/Fm, Fv/F0, PI), and gas exchange characteristics, namely net photosynthetic rate (PN), stomatal conductance (gs), transpiration rate (E), and intercellular CO2 concentration (Ci). Salinity reduced most physiological parameters, although some, such as maximum photochemical efficiency of PSII (Fv/Fm) and transpiration rate (E), did not show a clear dose-dependent response. Alkaline salt stress induced more pronounced reductions in the physiological parameters than neutral salt stress. At the first measurement, at the highest salt concentration, the chlorophyll content decreased by 49.0% and the PN parameter by 77.8% under NaHCO3 treatment, whereas under NaCl conditions the decreases were 29.0% and 51.3%, respectively, compared to the control. At 300 mM NaHCO3, the chlorophyll content and photosynthetic rate were substantially reduced compared with those recorded under the corresponding NaCl treatment. Even at the moderate salinity level of 100 mM NaHCO3, reductions in photosynthetic performance were detected relative to the control. Overall, photosynthetic efficiency and gas exchange in the cup plant were markedly impaired by salinity, particularly under conditions of high bicarbonate concentration. The results offer a deeper understanding of the physiological limitations of S. perfoliatum under acute salt stress and demonstrate that alkaline salinity, associated with elevated pH due to HCO3−, exacerbates stress effects beyond the osmotic and ionic impacts of neutral salinity. These results highlight the potential of S. perfoliatum for sustainable biomass production on salt-affected soils, supporting renewable energy generation and environmentally responsible land use.
1. Introduction
In response to the growing challenges of climate change, soil degradation, and the imperative to limit greenhouse gas emissions, the transformation of global energy systems has become a strategic priority for many countries and international organizations [1,2]. Achieving climate neutrality requires the diversification of energy sources and a shift from fossil fuels to low-emission renewable technologies. In this context, biomass is particularly valuable because it can be locally sourced and integrated into agricultural systems and is readily converted into heat, electricity, and biofuels [3,4,5]. Among biomass feedstocks, energy crops are gaining increasing attention because they provide a stable and predictable supply of raw material, even in areas with limited agricultural suitability [6,7].
In this context, Silphium perfoliatum L. (S. perfoliatum), commonly known as the cup plant, is a particularly promising species. This perennial herb has high biomass productivity, is well adapted to variable environmental conditions, and has relatively low agronomic requirements. Previous studies have demonstrated its high yield potential on marginal soils [8,9]. S. perfoliatum exhibits considerable habitat flexibility and a strong ability to adapt to less fertile or marginal soils. Field trials conducted on heavy soil under Central European climatic conditions have shown that this species can produce substantial yields of both green and dry biomass even under limited soil resources and variable water availability [9]. Thus, cup plants represent a promising alternative to traditional energy crops such as giant miscanthus or willow, particularly in areas unsuitable for intensive agriculture. The species can also be integrated into agro energy systems, contributing to soil quality improvement and carbon sequestration and ecosystem service enhancement [8,10]. Research has shown that perennial cultivation of S. perfoliatum increases water retention, reduces erosion, and supports soil organism development [11]. Moreover, its extended flowering period benefits pollinator populations, aligning with biodiversity conservation efforts in agricultural landscapes. Therefore, integrating the cup plant into agricultural practices can contribute both to renewable energy production and broader environmental sustainability goals [12]. Additionally, S. perfoliatum biomass can be utilized in various conversion technologies, including agricultural biogas plants, combustion, or as a component in solid fuels, further enhancing its potential role in sustainable energy systems [13].
On the other hand, excessive soil salinity is one of the most severe stress conditions impeding plant growth and development [14,15]. Soil salinity induces osmotic stress, preventing water uptake from the substrate, leading to cellular dehydration, reduced turgor, and inhibited shoot elongation. Simultaneously, ionic stress arises from excessive sodium (Na+) and chloride (Cl−), potentially causing ion toxicity, nutrient imbalances, and deficiencies in critical macronutrients, including K+ and Ca2+ [16,17]. At the physiological level, salt stress significantly affects plant–water relations, including reduced hydraulic conductivity and limited root water uptake [17]. Photosynthesis is also impaired due to the decreased chlorophyll content, reduced photosystem activity, and lower CO2 assimilation rates. Salt stress additionally influences metabolic enzyme activity and the production of reactive oxygen species (ROS), which may damage cell membranes, chloroplasts, and mitochondria [18,19]. Another adaptive mechanism involves the modulation of plant hormone levels. Elevated abscisic acid (ABA) promotes stomatal closure and reduces transpiration. Changes in cytokinin and auxin concentrations regulate growth and cell division by influencing cell proliferation, elongation, and differentiation, contributing to overall plant development under stress conditions [20,21]. Prolonged salinity can also modify osmolyte composition, including the accumulation of proline and soluble sugars, which protect cells under osmotic stress conditions [22,23]. It should be noted that salinity stress can be classified into neutral and alkaline types, which differ in their chemical properties and physiological effects on plants [24,25]. Neutral salt stress, typically caused by salts such as NaCl, primarily induces osmotic and ionic stress [26,27]. In contrast, alkaline salt stress, associated with salts such as NaHCO3 or Na2CO3, additionally increases the soil pH, which can reduce nutrient availability and further disrupt cellular homeostasis [25]. Consequently, alkaline stress is often reported to impose more severe limitations on plant growth and physiological processes than neutral salinity stress. Despite the cup plant’s broad environmental adaptability, detailed information on its tolerance to soil salinity—especially under different types of salt stress—is still limited. The majority of studies investigating plant responses to salinity have concentrated on neutral salts (primarily NaCl), whereas many salt-affected soils also contain alkaline salts (such as NaHCO3) which can increase soil pH and further stress plants, and these have received less attention. How S. perfoliatum copes with alkaline versus neutral salinity is an open question and represents a clear research gap. Addressing this gap is particularly important from a sustainable development perspective, because understanding these responses can inform the environmentally responsible cultivation of cup plants on salt-affected soils, optimize biomass production for renewable energy, and support multifunctional agricultural landscapes. Therefore, this study aimed to assess the physiological responses of the cup plant to salt stress induced by two distinct salt types (neutral NaCl and alkaline NaHCO3) applied at equal concentrations. We formulated a specific hypothesis that salt type would significantly influence the severity of plant stress responses. In particular, we hypothesized that alkaline salinity (NaHCO3) would exert more deleterious effects on cup plant physiology than an equivalent concentration of neutral salinity (NaCl), due to the additional high-pH (bicarbonate) stress. A proportional, concentration-dependent decline in plant performance was expected under both salt types, with higher salt levels causing more pronounced reductions in chlorophyll content, photosynthetic efficiency, and gas exchange rates.
2. Materials and Methods
2.1. Pot Experiment
The pot experiment was conducted at the University of Rzeszów, Poland. S. perfoliatum seeds used in this study were kindly provided by Dr. Włodzimierz Majtkowski from the Institute of Plant Breeding and Acclimatization—National Research Institute (Bydgoszcz, Poland). Plants were grown from seeds under controlled conditions. The experiment was conducted in a growth chamber (model GC-300/1000, JEIO Tech Co., Ltd., Daejeon, Republic of Korea) under the following conditions: temperature 22 ± 2 °C, relative humidity 60 ± 3%, photoperiod 16/8 h (day/night), and maximum light intensity of approximately 300 µE m−2 s−1. Seeds were sown in seed trays. Seedlings were relocated to 15 × 15 cm plastic pots after germination with three per pot. The pots were filled with a slightly acidic substrate (pH: KCl 6.35; H2O 6.52) with a sandy-loam consistency. Substrate moisture was maintained at 60% of field water capacity. One month after transplanting (plant height 8–12 cm), salt stress was induced by watering the soil with neutral (NaCl) or alkaline (NaHCO3) salt solutions. Salt solutions were applied at concentrations of 100, 200, and 300 mM, at 100 mL per pot. Control plants were watered with the same volume of deionized water. The experiment was conducted until plants reached a physiologically relevant stage, and all details of watering, substrate, and environmental conditions are provided to ensure reproducibility.
The salt concentrations of 100, 200, and 300 mM were selected to encompass a range from moderate to severe salinity stress in a short-term pot study. These levels ensured that both threshold effects (at the lower end) and extreme stress responses (at the higher end) could be observed. It is noted that 300 mM represents an unusually high salinity that would rarely occur homogeneously in field soils; however, such a concentration serves as a model stress condition to probe the upper limits of the plant’s physiological tolerance in controlled settings. Using NaCl and NaHCO3 as salt sources allowed us to simulate two distinct types of saline soils: neutral salinity (dominated by chloride, with minimal direct effect on soil pH) versus alkaline salinity (dominated by bicarbonate, causing elevated soil pH). By applying equal molar concentrations of Na+ in these two chemical forms, we could directly compare plant responses to neutral vs. alkaline salt stress under equivalent ionic strength.
The experiment was conducted with four biological replicates per treatment; each replicate consisted of three plants grown in a separate pot. All measurements were performed on each replicate pot (or its soil) with an appropriate technical replicate.
2.2. Physiological Measurements
The physiological status of the plants was assessed four times in the first or second fully developed leaves at intervals of 7 (Term I), 14 (Term II), 21 (Term III), and 28 (Term IV) days after the application of the salt solution to the soil. For physiological traits, repeated measurements within a pot were treated as technical replicates (subsamples), while pots were treated as biological replicates. Specifically, relative chlorophyll content and chlorophyll fluorescence parameters were recorded five times for each pot during each sampling period. Gas exchange parameters were recorded three times for each pot during each sampling period. Physiological parameters were assessed using methods previously described by Jańczak-Pieniążek et al. [28].
2.2.1. Relative Chlorophyll Content
Relative chlorophyll content of the leaves was determined with the help of CCM-200 plus chlorophyll content meter (Opti-Sciences, Hudson, NH, USA). For each pot, measurements were performed on fully developed leaves five times, and the mean value was calculated for that pot at each sampling term.
2.2.2. Chlorophyll Fluorescence
Measurements of chlorophyll fluorescence were conducted using a Pocket PEA fluorimeter (Hansatech Instruments, King’s Lynn, Norfolk, UK) equipped with dark-adaptation clips. Before measurement, leaves were dark-adapted for 30 min using these clips, which were attached to the upper part of the leaf blade while avoiding the main vein [29]. Fluorescence was recorded using a saturating pulse of red actinic light (peak wavelength 627 nm, maximum intensity of 3500 μmol m−2 s−1 PAR) applied for 1 s to induce chlorophyll fluorescence. The following parameters were evaluated: maximum efficiency of water-splitting on the donor side of PSII (Fv/F0), maximum photochemical efficiency of PSII (Fv/Fm), and the performance index (PI). For repeated measurements on the same pot, the same fully expanded leaf was used to ensure consistency of fluorescence readings.
2.2.3. Gas Exchange
Gas exchange parameters were measured using an LCpro-SD photosynthesis system (ADC Bioscientific Ltd., Herts, UK). The following parameters were recorded: net photosynthetic rate (PN), stomatal conductance (gs), transpiration rate (E), and intercellular CO2 concentration (Ci). Measurements were performed on fully developed leaves, using the same leaf for repeated measurements on each pot to ensure consistency. During measurements, PAR intensity was set to 300 μmol m−2 s−1 and chamber temperature was maintained at 23 °C. Three measurements per pot were taken, and the mean value was calculated for each pot and sampling term to provide representative and reproducible results.
2.3. Soil Analysis
The soil samples were dried at room temperature, thoroughly mixed, and passed through a 2 mm sieve. Representative subsamples were collected for the determination of soil pH and electrical conductivity (EC). Soil pH was measured potentiometrically in distilled water and in 1 M KCl solution, representing active and exchangeable acidity, respectively [30]. Soil suspensions were prepared at a 1:5 (w/w) ratio (soil/solution). Briefly, 5 g of soil were placed in 100 cm3 beakers and mixed with 25 cm3 of distilled water or 1 M KCl. The suspensions were stirred thoroughly and left to equilibrate for 24 h. After re-mixing, pH was measured using a pH meter (HI 4221, Hanna Instruments, Woonsocket, RI, USA) at 20 °C. EC was measured in soil–water suspensions using a conductivity meter (HI 2316, Hanna Instruments). EC values, expressed in mS, were used as an indicator of soil salinity [31]. Soil samples were collected and measurements performed at the end of the experiment, after all physiological measurements on plants were completed. For each pot, soil pH was measured three times both in distilled water (pHH2O) and in 1 M KCl (pHKCl). Soil electrical conductivity (EC) was also measured three times per pot, and mean values were used for further analyses.
2.4. Statistical Analysis
Data were analyzed using TIBCO Statistica version 13.3.0 (TIBCO Software Inc., Palo Alto, CA, USA). Normality of distribution was assessed using the Shapiro–Wilk test (α = 0.05) and homogeneity of variance was confirmed using Levene’s test (α = 0.05). A two-way analysis of variance (ANOVA) with repeated measures, including time as a factor, was performed. Salinity effects were also assessed using one-way ANOVA. Significant differences between means were identified using Tukey’s post hoc test at α ≤ 0.05.
3. Results
3.1. Relative Chlorophyll Content
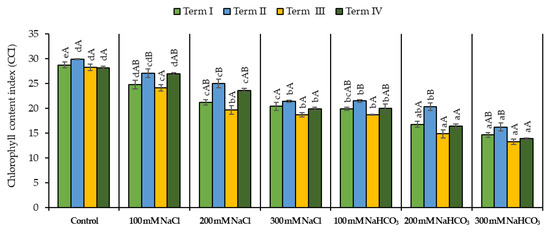
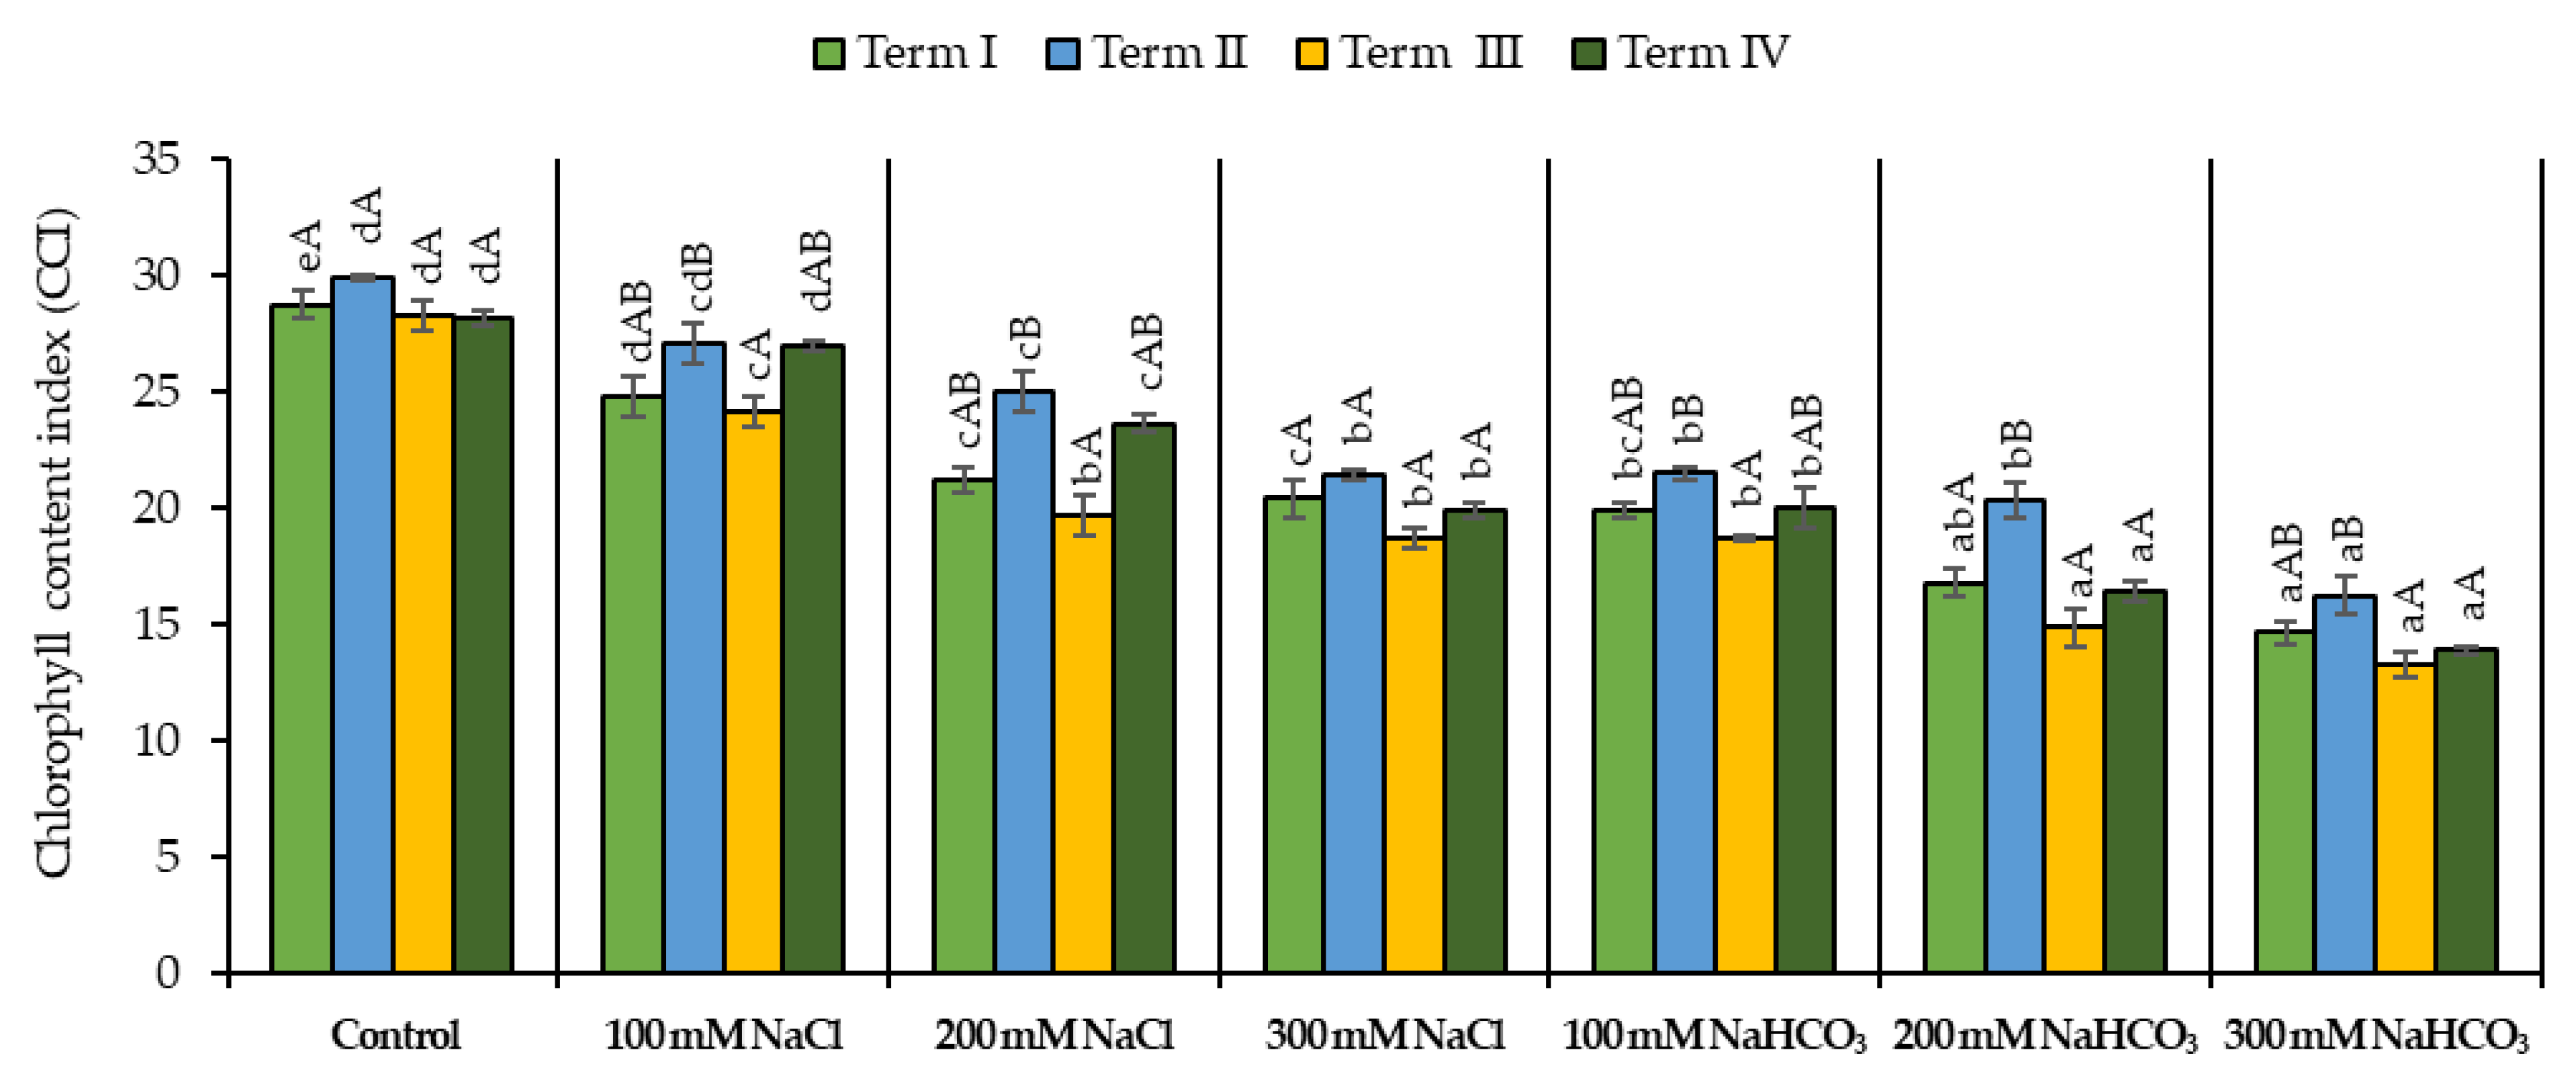
Chlorophyll content decreased under salt stress (Figure 1). In the control treatment, chlorophyll content ranged from 28.1 to 29.9 CCI across the experimental terms. Irrigation with 100 mM NaCl caused a significant reduction in chlorophyll content only in Term III, where the value decreased to 24.1 CCI compared to 28.2 CCI in the control. In the remaining terms, this concentration did not significantly affect chlorophyll content, with values remaining within the range of 24.8–27.1 CCI. Higher NaCl concentrations (200 and 300 mM) led to a significant decrease in chlorophyll content at all terms. At 200 mM NaCl, chlorophyll content ranged from 19.7 CCI (Term III) to 25.0 CCI (Term II), whereas at 300 mM NaCl values ranged from 18.7 to 21.4 CCI. Differences between these two concentrations were observed only in Terms II and IV, where chlorophyll content was higher at 200 mM than at 300 mM NaCl. The application of NaHCO3 reduced chlorophyll content relative to the control, and this effect was more pronounced than that of NaCl. At 100 mM NaHCO3, chlorophyll content ranged from 18.7 to 21.5 CCI, which was comparable to values recorded under 300 mM NaCl. The lowest chlorophyll values were recorded at 200 and 300 mM NaHCO3, reaching 14.8–20.3 CCI and 13.3–16.2 CCI, respectively. During Term I, most treatments showed lower chlorophyll content compared with the control (28.7 CCI), with values decreasing to 14.6–24.8 CCI depending on stress intensity, although differences between Term I, Term II, and Term IV were not statistically significant for several treatments. Chlorophyll content increased in Term II across most treatments, reaching maximum values of 27.1 CCI (100 mM NaCl) and 21.5 CCI (100 mM NaHCO3); however, statistically significant differences between terms were detected only for 200 mM NaHCO3. In Term III, chlorophyll content generally decreased compared to Term IV (e.g., 18.7 vs. 19.9 CCI at 300 mM NaCl), although these differences were not statistically significant.
Figure 1.
Impact of NaCl and NaHCO3 salt stress and sampling time on relative chlorophyll content. Within each treatment, uppercase letters denote statistically significant differences between sampling dates, whereas lowercase letters indicate significant differences among treatments at the same sampling date, as determined by ANOVA and Tukey’s HSD test (p ≤ 0.05).
3.2. Chlorophyll Fluorescence
3.2.1. Maximum Efficiency of Water-Splitting on the Donor Side of PSII (Fv/F0)
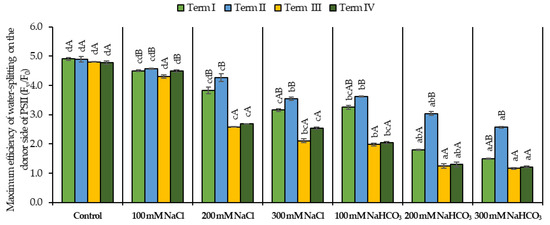
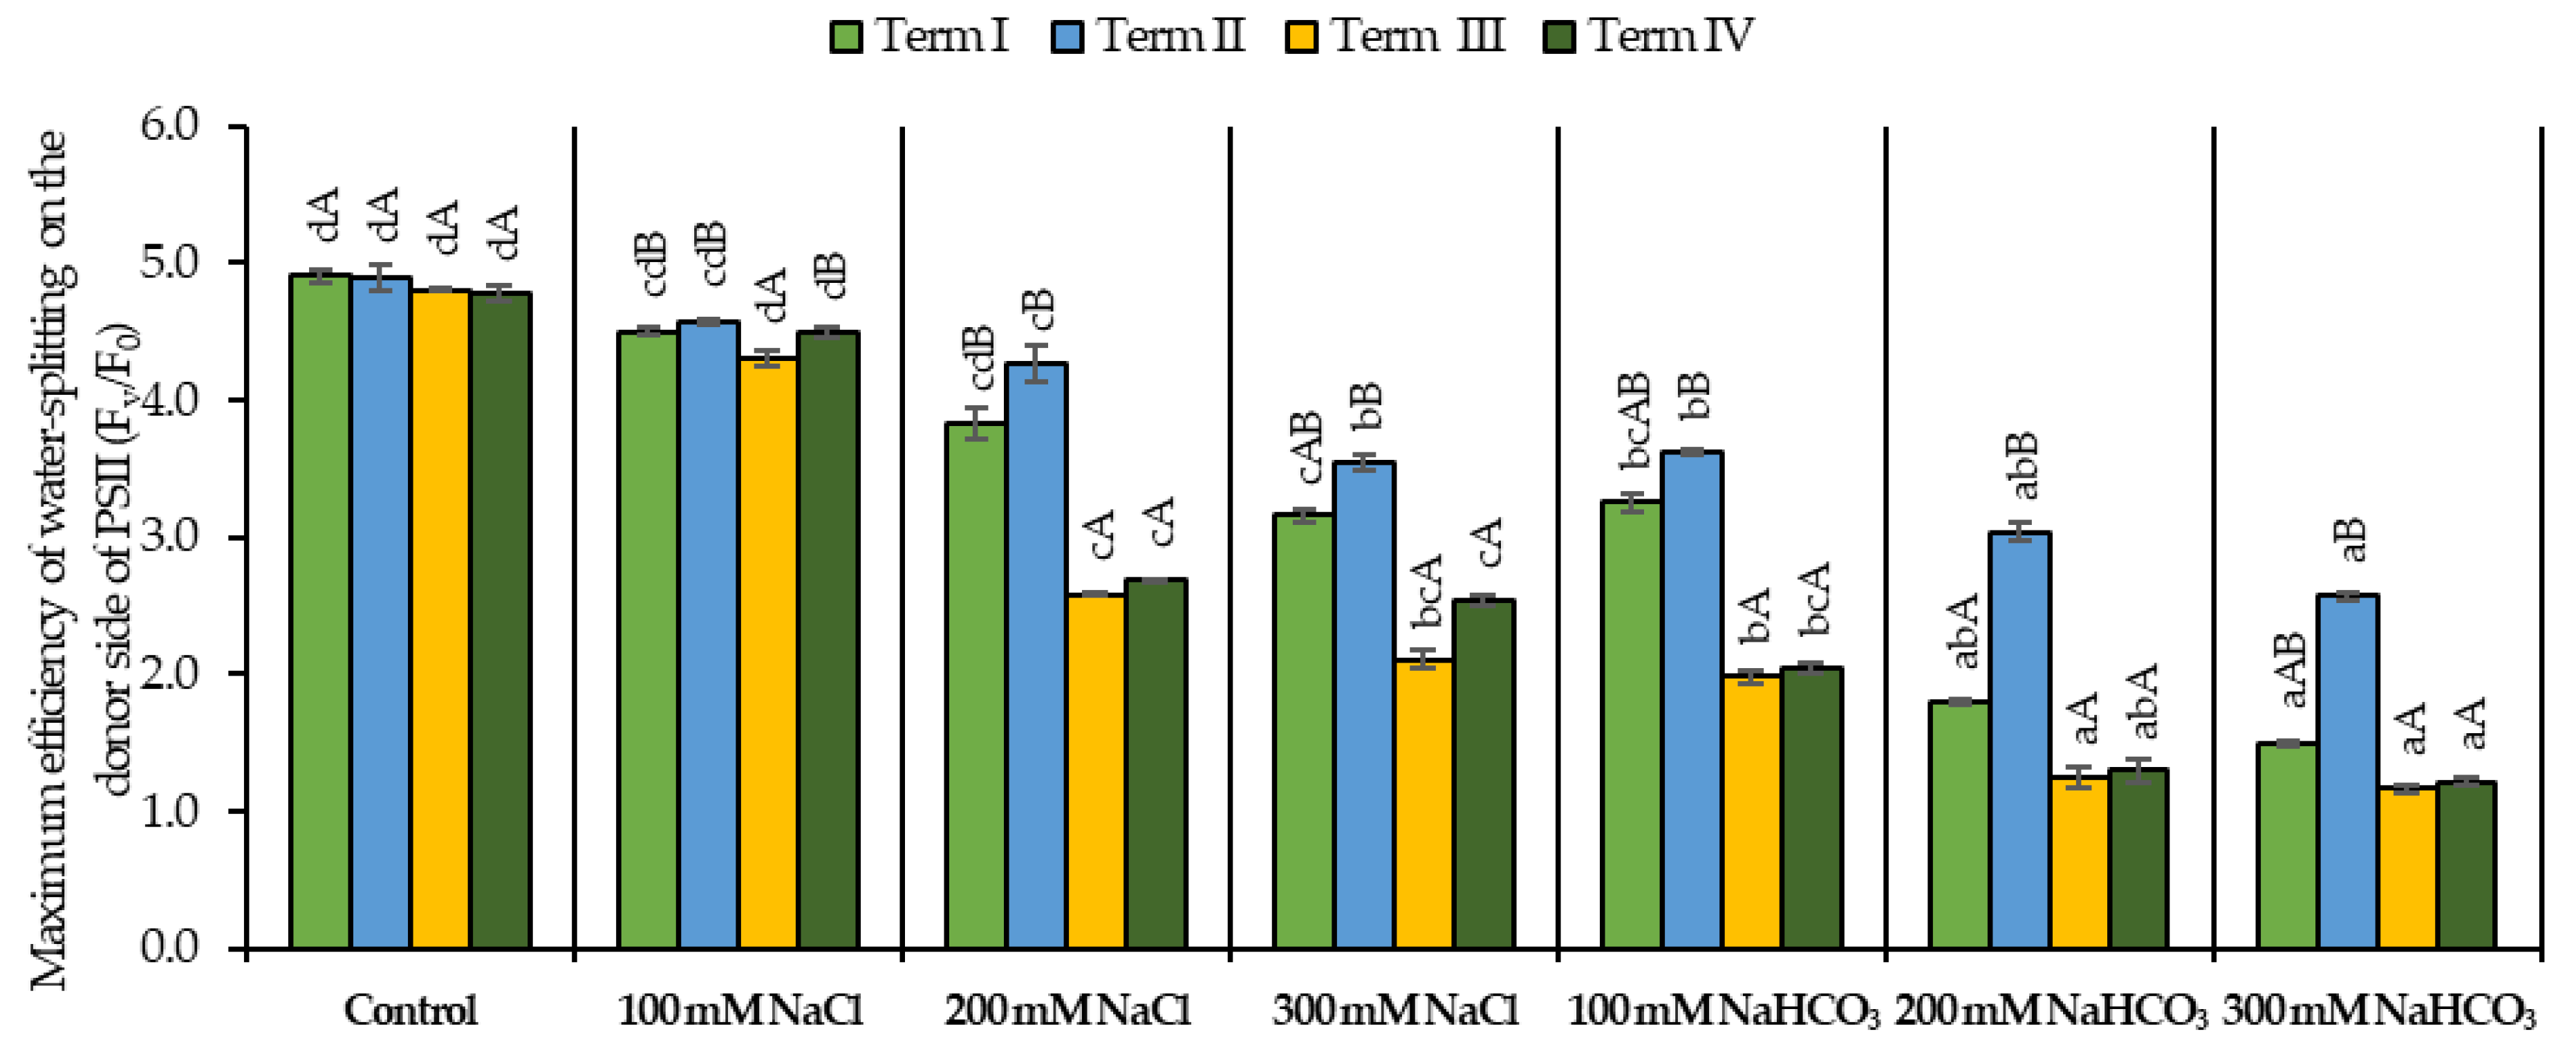
Under salt stress, a decrease in the Fv/F0 parameter was observed (Figure 2). In the control treatment, Fv/F0 values ranged from 4.78 to 4.91 across the experimental terms. Irrigation with neutral salt (NaCl) caused a significant reduction in Fv/F0 only at concentrations of 200 and 300 mM, which was observed across all terms, with values decreasing to 2.58–4.27 at 200 mM and to 2.11–3.54 at 300 mM NaCl. Alkaline salt induced a stronger decline in Fv/F0 compared to neutral salt. At 100 mM NaHCO3, Fv/F0 values ranged from 1.98 to 3.62, whereas at 200 and 300 mM NaHCO3 they further decreased to 1.25–3.04 and 1.17–2.57, respectively. No significant differences in Fv/F0 were detected between 300 mM NaCl and 100 mM NaHCO3, for which comparable values were recorded. The greatest decrease in Fv/F0 was observed at 200 and 300 mM for both salts, with the lowest absolute values recorded under alkaline stress at 300 mM NaHCO3 (1.17–1.50). However, statistically significant differences compared to 100 mM were only found for 300 mM treatments. In Term III, the lowest Fv/F0 values were recorded across all salinity treatments, reaching 2.11 at 300 mM NaCl and 1.17–1.98 under NaHCO3 treatments, although statistical significance between terms was observed only for 100 mM NaCl. The highest Fv/F0 values were consistently recorded in Term II, with maximum values of 4.57 in the 100 mM NaCl treatment and 3.62 in the 100 mM NaHCO3 treatment; however, statistically significant differences between terms were detected only for 200 mM NaHCO3.
Figure 2.
Impact of NaCl and NaHCO3 salt stress and sampling time on maximum efficiency of water-splitting on the donor side of PSII (Fv/Fo). Within each treatment, uppercase letters denote statistically significant differences between sampling dates, whereas lowercase letters indicate significant differences among treatments at the same sampling date, as determined by ANOVA and Tukey’s HSD test (p ≤ 0.05).
3.2.2. Maximum Photochemical Efficiency of PSII (Fv/Fm)
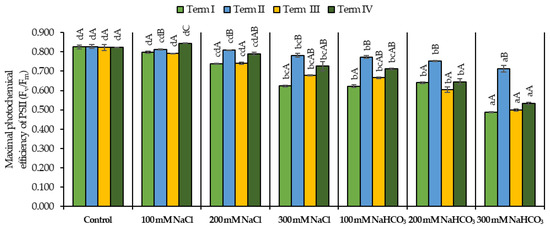
Salt stress resulted in a reduction in the Fv/Fm parameter (Figure 3). In the control treatment, Fv/Fm values were high and stable across the experimental terms, ranging from 0.822 to 0.827. Irrigation with neutral salt (NaCl) at 100 and 200 mM did not cause statistically significant differences compared to the control, with Fv/Fm values remaining within the range of 0.791–0.844 at 100 mM and 0.737–0.808 at 200 mM NaCl. Only the application of 300 mM NaCl led to a significant decrease in Fv/Fm across all terms, with values declining to 0.623–0.782, depending on the term. Alkaline salt further reduced Fv/Fm values. Irrigation with 100 and 200 mM NaHCO3 resulted in Fv/Fm values ranging from 0.622 to 0.773 and from 0.604 to 0.752, respectively, and did not differ significantly from those recorded at 300 mM NaCl. A significant reduction in Fv/Fm was observed only after the application of 300 mM NaHCO3, particularly in Terms I, III, and IV, where the lowest values were recorded (0.488–0.533). In Term II, the highest Fv/Fm values were consistently observed across treatments, reaching up to 0.827 in the control and 0.713 under 300 mM NaHCO3; however, statistically significant differences between terms were detected only for 200 and 300 mM NaHCO3 compared to the other terms.
Figure 3.
Impact of NaCl and NaHCO3 salt stress and sampling time on maximum photochemical efficiency of PSII (Fv/Fm). Within each treatment, uppercase letters denote statistically significant differences between sampling dates, whereas lowercase letters indicate significant differences among treatments at the same sampling date, as determined by ANOVA and Tukey’s HSD test (p ≤ 0.05).
3.2.3. Performance Index (PI)
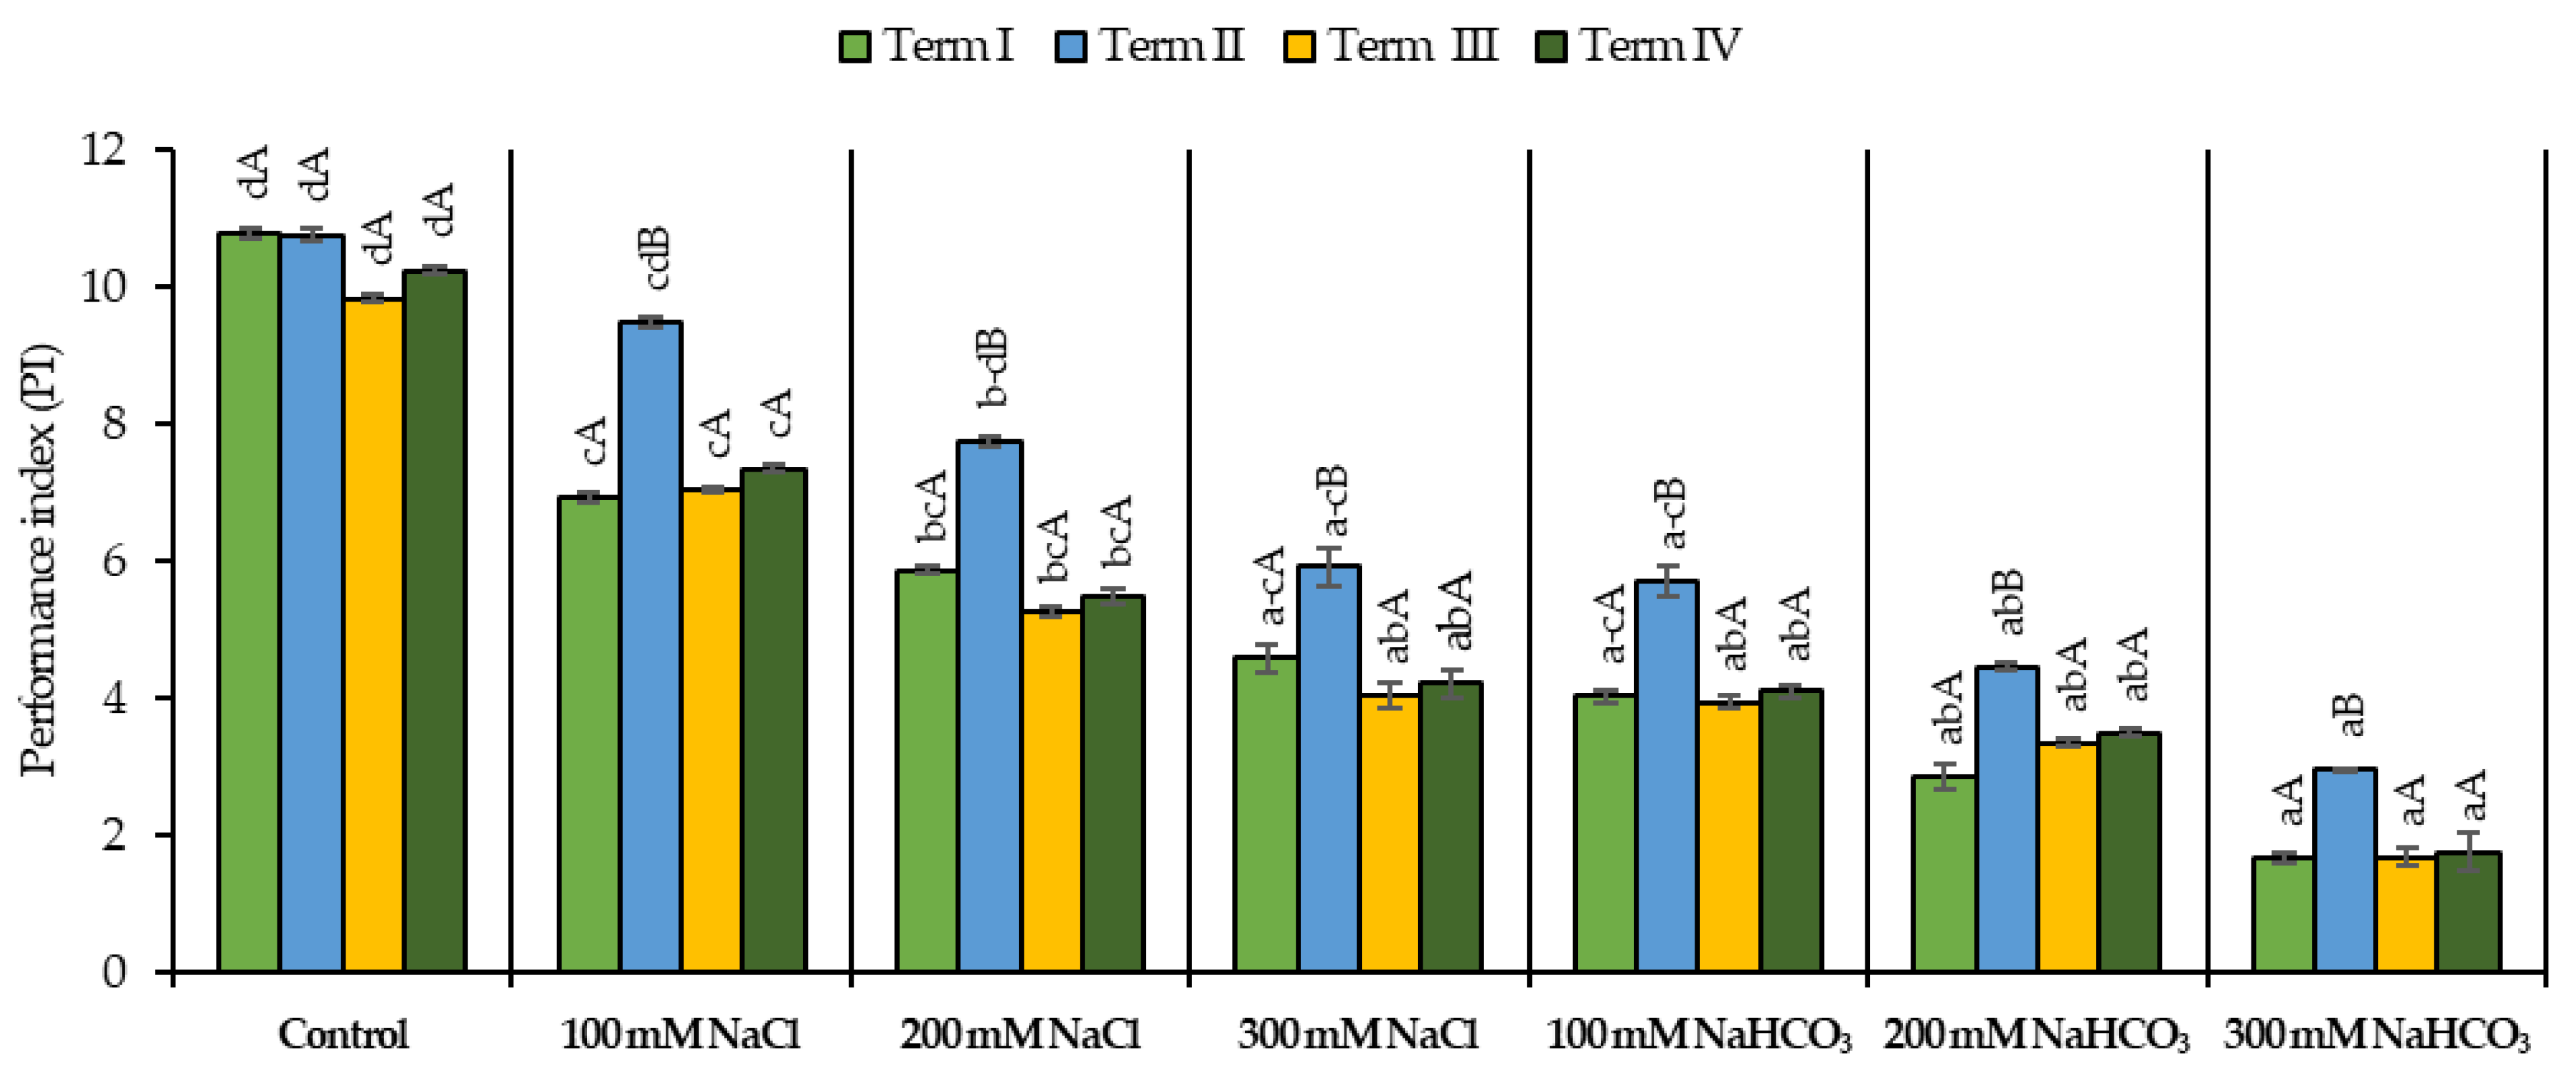
As a result of applying salt stress, a decrease in the PI parameter value was observed relative to the control (Figure 4), except for the 100 mM and 200 mM concentrations of NaCl in Term II. In the control treatment, PI values were high and stable across the experimental terms, ranging from 9.82 to 10.78. Irrigation with neutral salt at 100 and 200 mM resulted in a reduction in PI values, which ranged from 6.91 to 9.47 at 100 mM NaCl and from 5.25 to 7.74 at 200 mM NaCl, depending on the term. A significant decrease was recorded when using the 300 mM concentration of neutral salt compared to the 100 mM concentration, with PI values further declining to 4.04–5.91. A further reduction in the PI parameter value was found following the application of NaHCO3. At 100 mM NaHCO3, PI values ranged from 3.94 to 5.71, while at 200 mM they decreased to 2.85–4.45. Differences compared with the 200 mM neutral salt concentration were observed only at 300 mM NaHCO3, for which the lowest PI values were recorded (1.66–2.95). In Term II, the significantly highest PI value was recorded compared to the remaining terms in all variants, reaching up to 9.47 at 100 mM NaCl and 5.71 at 100 mM NaHCO3, except for the control, in which no significant differences were observed in this parameter between the terms.
Figure 4.
Impact of NaCl and NaHCO3 salt stress and sampling time on performance index (PI). Within each treatment, uppercase letters denote statistically significant differences between sampling dates, whereas lowercase letters indicate significant differences among treatments at the same sampling date, as determined by ANOVA and Tukey’s HSD test (p ≤ 0.05).
3.3. Gas Exchange
3.3.1. Net Photosynthetic Rate (PN)
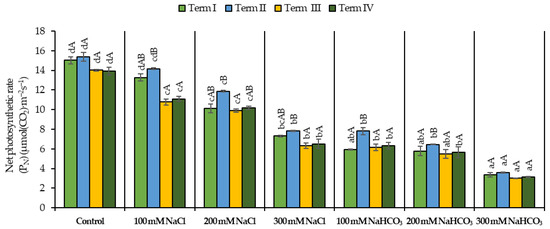
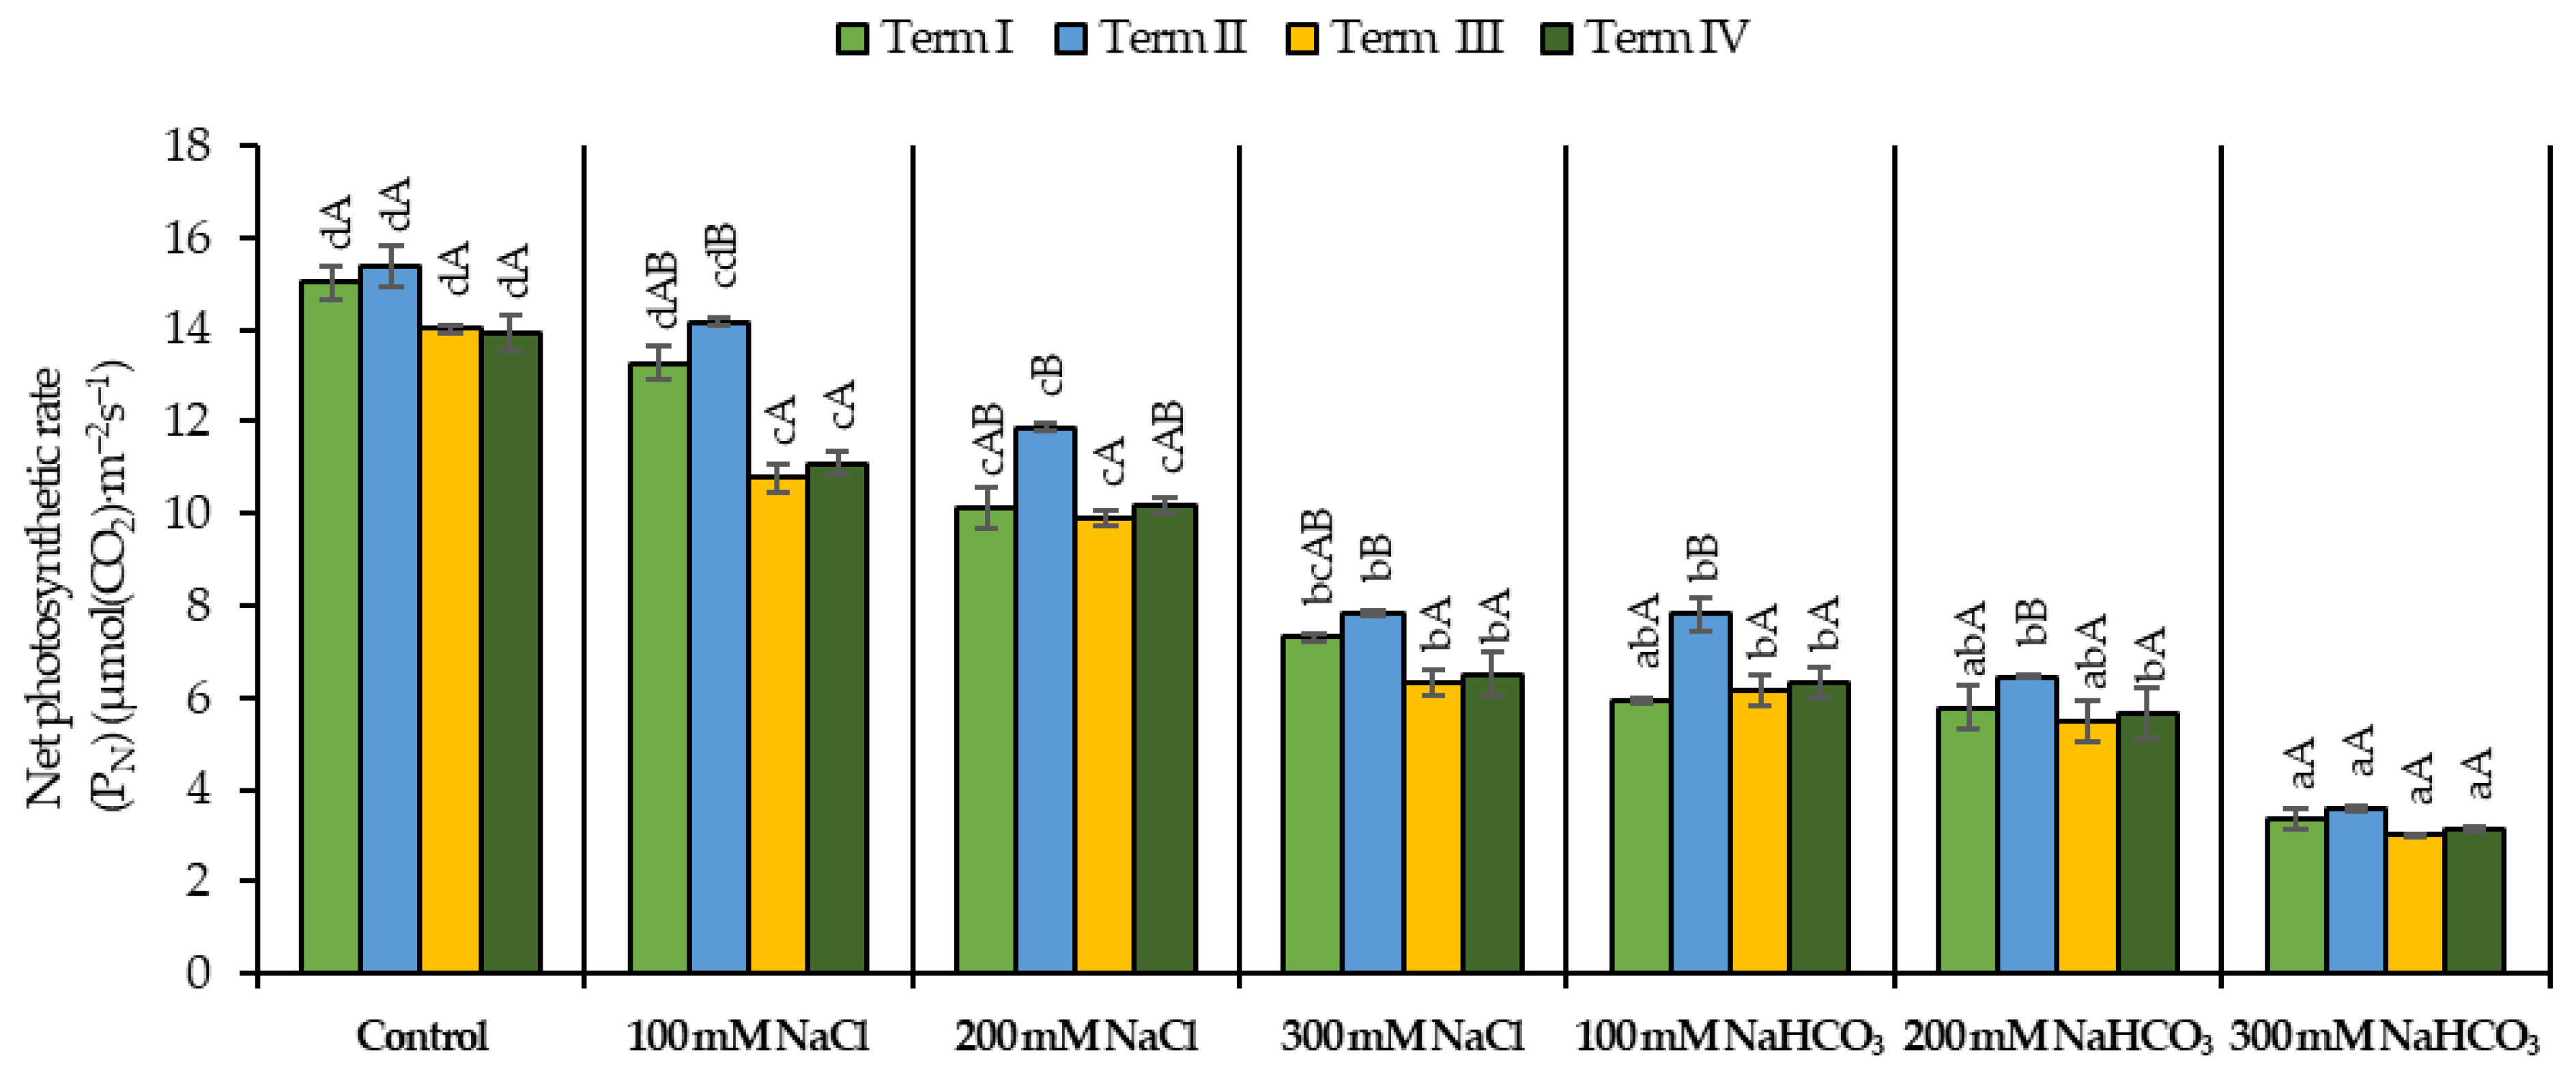
Soil salinity resulted in a reduction in the gas exchange parameter PN (Figure 5) compared to plants not subjected to this stress (control), for which PN values ranged from 13.9 to 15.4 µmol (CO2) m−2 s−1 across the experimental terms. The use of NaCl at a concentration of 100 mM did not result in a significant decrease in PN in Term I and Term II, with values remaining at 13.3 and 14.2 µmol (CO2) m−2 s−1, respectively. Increasing NaCl concentration led to a progressive decline in PN. At 200 mM NaCl, PN values decreased to 9.9–11.9 µmol (CO2) m−2 s−1, whereas at 300 mM NaCl they further declined to 6.3–7.8 µmol (CO2) m−2 s−1, depending on the term. The application of NaHCO3 caused a further decrease in PN values. At 100 and 200 mM NaHCO3, PN ranged from 5.9 to 7.8 and from 5.5 to 6.5 µmol (CO2) m−2 s−1, respectively. No statistically significant differences were found between the use of 300 mM neutral salt and the concentrations of 100 and 200 mM alkaline salt, for which comparable PN values were recorded. The application of 300 mM alkaline salt resulted in the lowest PN values among all salinity treatments, reaching 3.0–3.6 µmol (CO2) m−2 s−1. In Term II, the highest PN values among salinity treatments were observed only in the variants with 100 mM and 200 mM alkaline salt, reaching 7.8 and 6.5 µmol (CO2) m−2 s−1, respectively.
Figure 5.
Impact of NaCl and NaHCO3 salt stress and sampling time on net photosynthetic rate (PN). Within each treatment, uppercase letters denote statistically significant differences between sampling dates, whereas lowercase letters indicate significant differences among treatments at the same sampling date, as determined by ANOVA and Tukey’s HSD test (p ≤ 0.05).
3.3.2. Stomatal Conductance (gs)
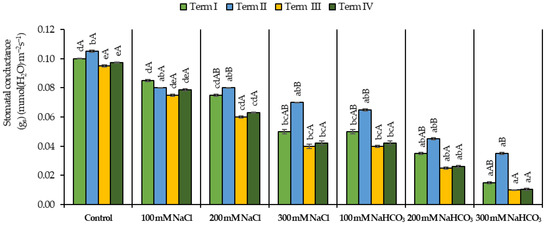
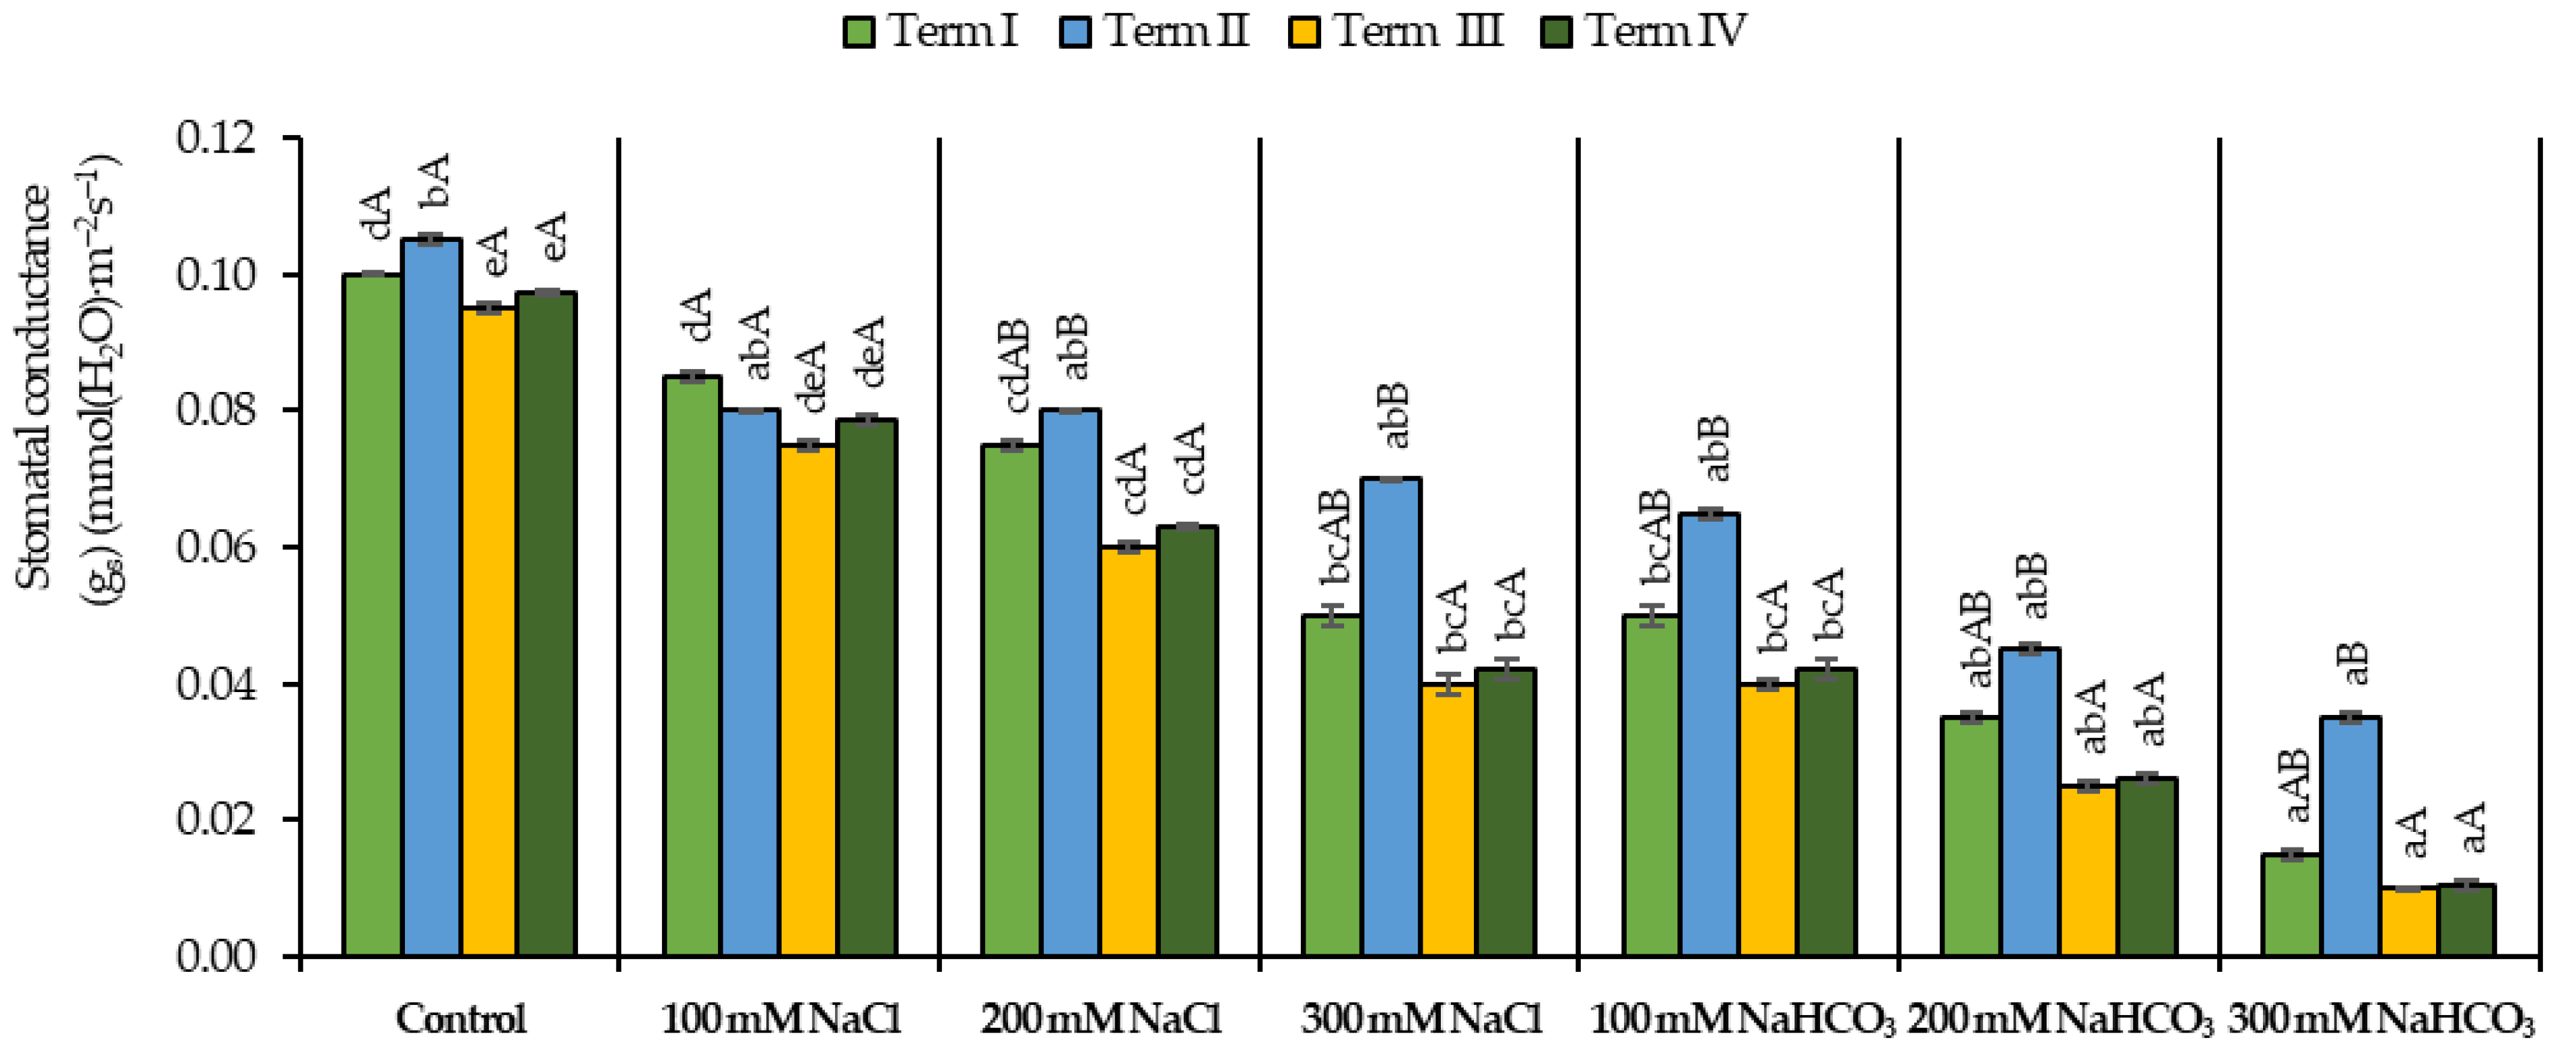
Under salt stress, a decrease in the gs parameter value (Figure 6) was recorded relative to the control, in which gs values ranged from 0.095 to 0.105 mmol (H2O) m−2 s−1 across the experimental terms. However, when 100 mM NaCl was applied, no significant effect of salinity on gs was observed, with values remaining within the range of 0.075–0.085 mmol (H2O) m−2 s−1. The use of 200 mM and 300 mM NaCl caused a significant decrease in gs compared to the control, with values declining to 0.060–0.080 mmol (H2O) m−2 s−1 at 200 mM and to 0.040–0.070 mmol (H2O) m−2 s−1 at 300 mM, depending on the term, except for 200 mM NaCl in Term III and Term IV. The application of NaHCO3 led to a further reduction in gs values. At 100 mM NaHCO3, gs values ranged from 0.040 to 0.065 mmol (H2O) m−2 s−1, which did not differ from those recorded at 300 mM neutral salt. At higher alkaline salt concentrations, gs further declined to 0.025–0.045 mmol (H2O) m−2 s−1 at 200 mM and to 0.010–0.035 mmol (H2O) m−2 s−1 at 300 mM NaHCO3. The lowest gs values were recorded under the 300 mM NaHCO3 treatment, reaching as low as 0.010 mmol (H2O) m−2 s−1, compared to all other salinity variants except for the alkaline salt concentrations of 200 mM and 100 mM in Term II. The highest gs values were observed in Term II across treatments; however, no statistically significant differences between terms were detected for this parameter.
Figure 6.
Impact of NaCl and NaHCO3 salt stress and sampling time on stomatal conductance (gs). Within each treatment, uppercase letters denote statistically significant differences between sampling dates, whereas lowercase letters indicate significant differences among treatments at the same sampling date, as determined by ANOVA and Tukey’s HSD test (p ≤ 0.05).
3.3.3. Transpiration Rate (E)
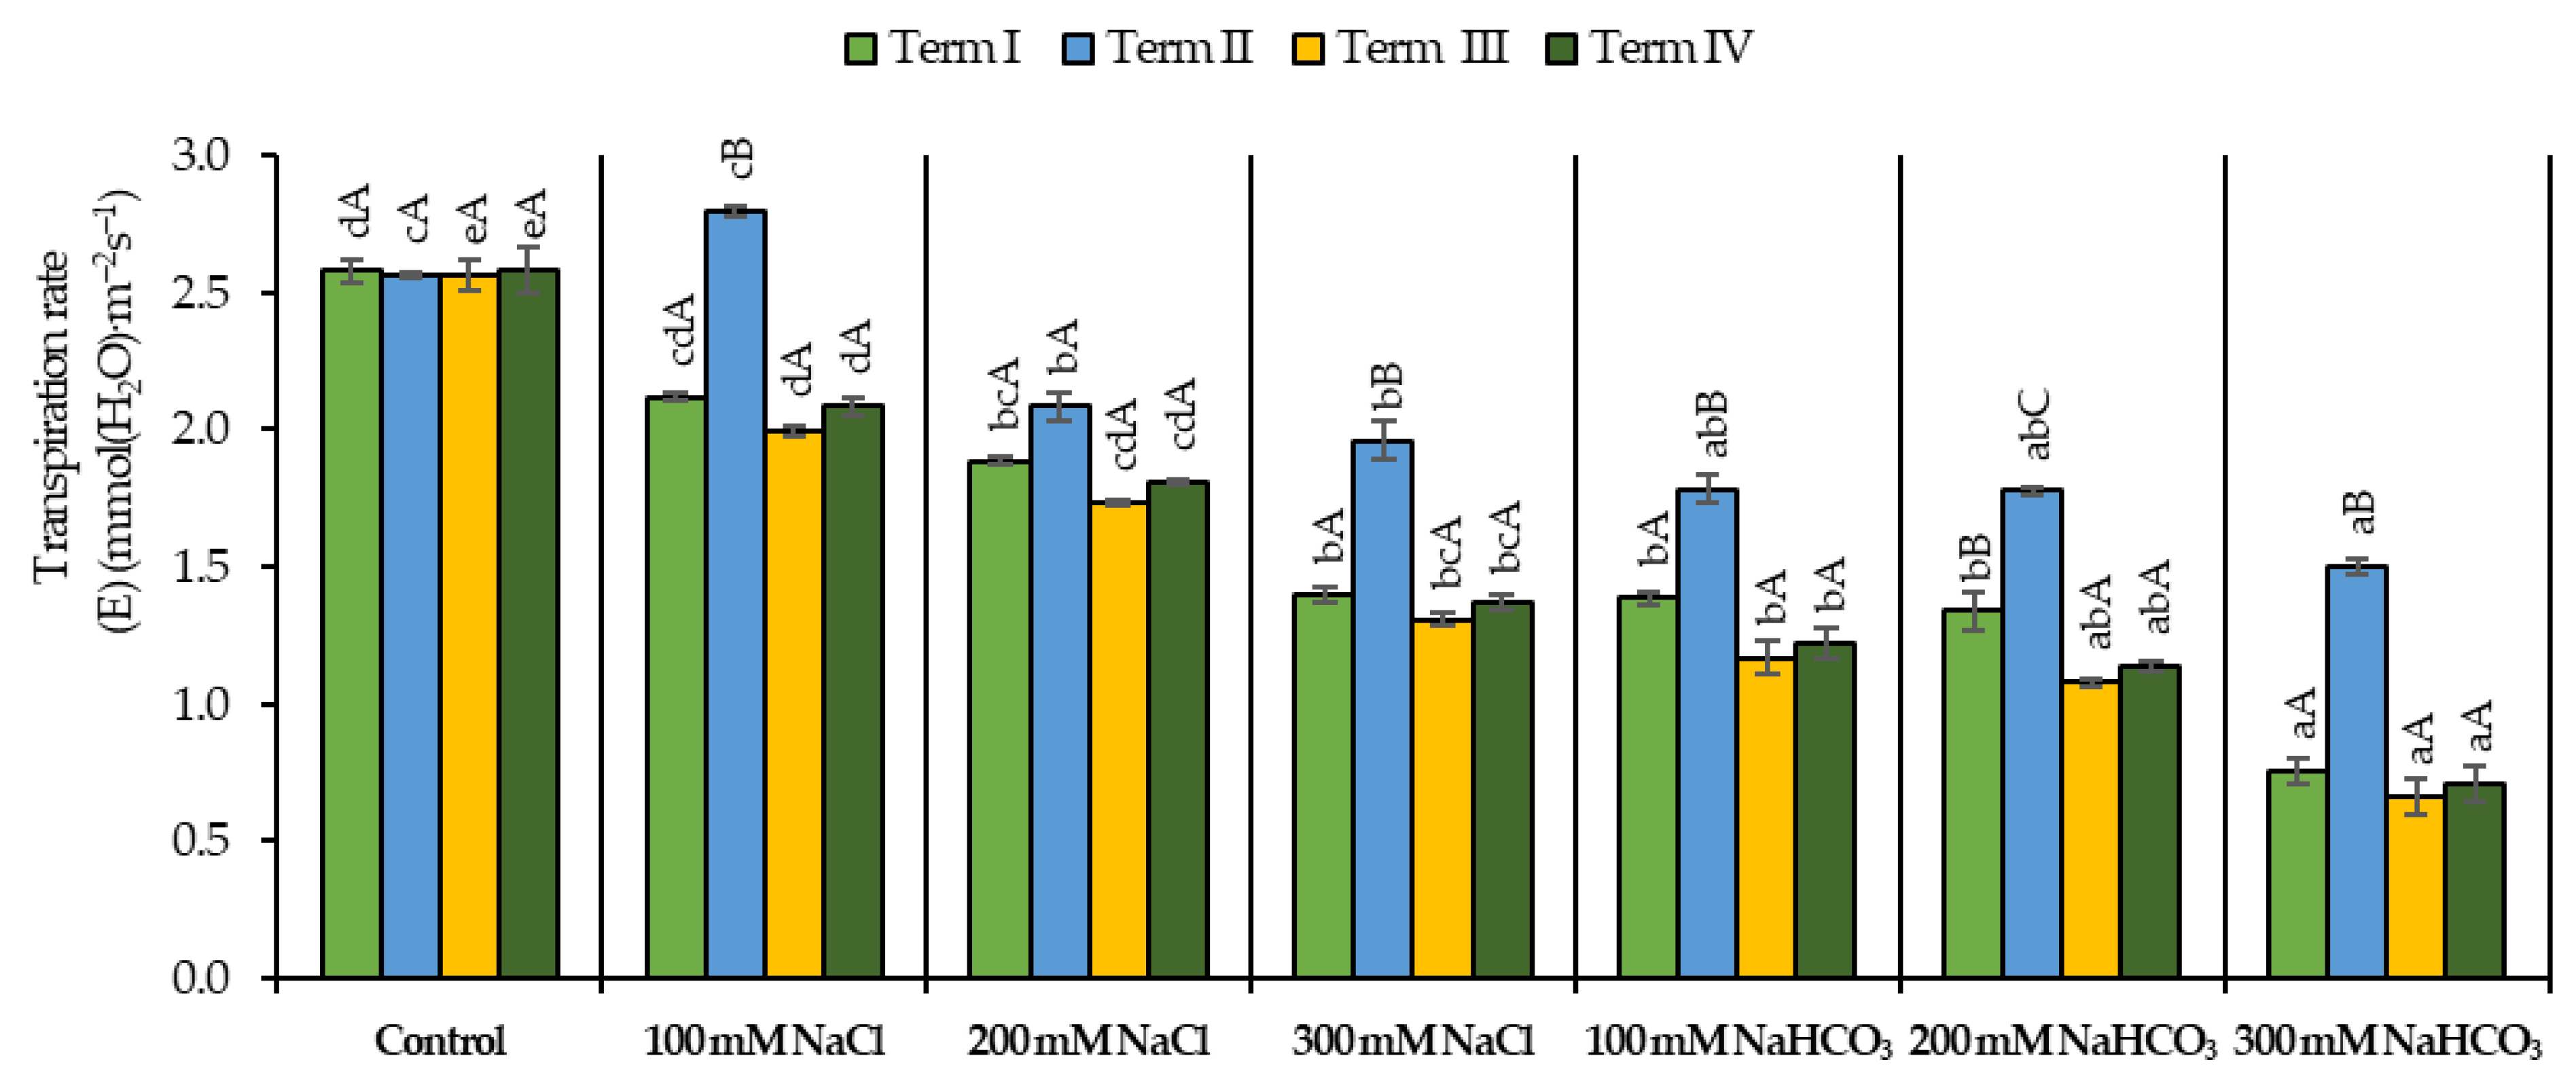
Soil salinity caused a decrease in the value of the E parameter (Figure 7) compared with the control, in which the transpiration rate ranged from 2.56 to 2.58 mmol (H2O) m−2 s−1 across the experimental terms. No significant reduction in E was observed for the variant with 100 mM NaCl in Term I and Term II, where values reached 2.12 and 2.80 mmol (H2O) m−2 s−1, respectively. Higher concentrations of neutral salt resulted in a further decline in E relative to the control. At 200 mM NaCl, the transpiration rate decreased to 1.74–2.09 mmol (H2O) m−2 s−1, while at 300 mM NaCl it further declined to 1.31–1.96 mmol (H2O) m−2 s−1, depending on the term; however, no statistically significant differences were found between these two concentrations. No significant effect on the value of the analyzed parameter was observed between 300 mM neutral salt and the application of 100 or 200 mM NaHCO3, for which E values ranged from 1.17 to 1.79 and from 1.08 to 1.78 mmol (H2O) m−2 s−1, respectively. The significantly lowest E value was recorded only under the 300 mM NaHCO3 treatment, reaching 0.67–1.50 mmol (H2O) m−2 s−1, which was lower than that observed at 100 mM, except in Term II. In Term II, the lowest E values relative to the remaining terms were recorded in all salinity variants, except for the 200 mM neutral salt concentration, although differences between terms were not statistically significant in most treatments.
Figure 7.
Impact of NaCl and NaHCO3 salt stress and sampling time on transpiration rate (E). Within each treatment, uppercase letters denote statistically significant differences between sampling dates, whereas lowercase letters indicate significant differences among treatments at the same sampling date, as determined by ANOVA and Tukey’s HSD test (p ≤ 0.05).
3.3.4. Intercellular CO2 Concentration (Ci)
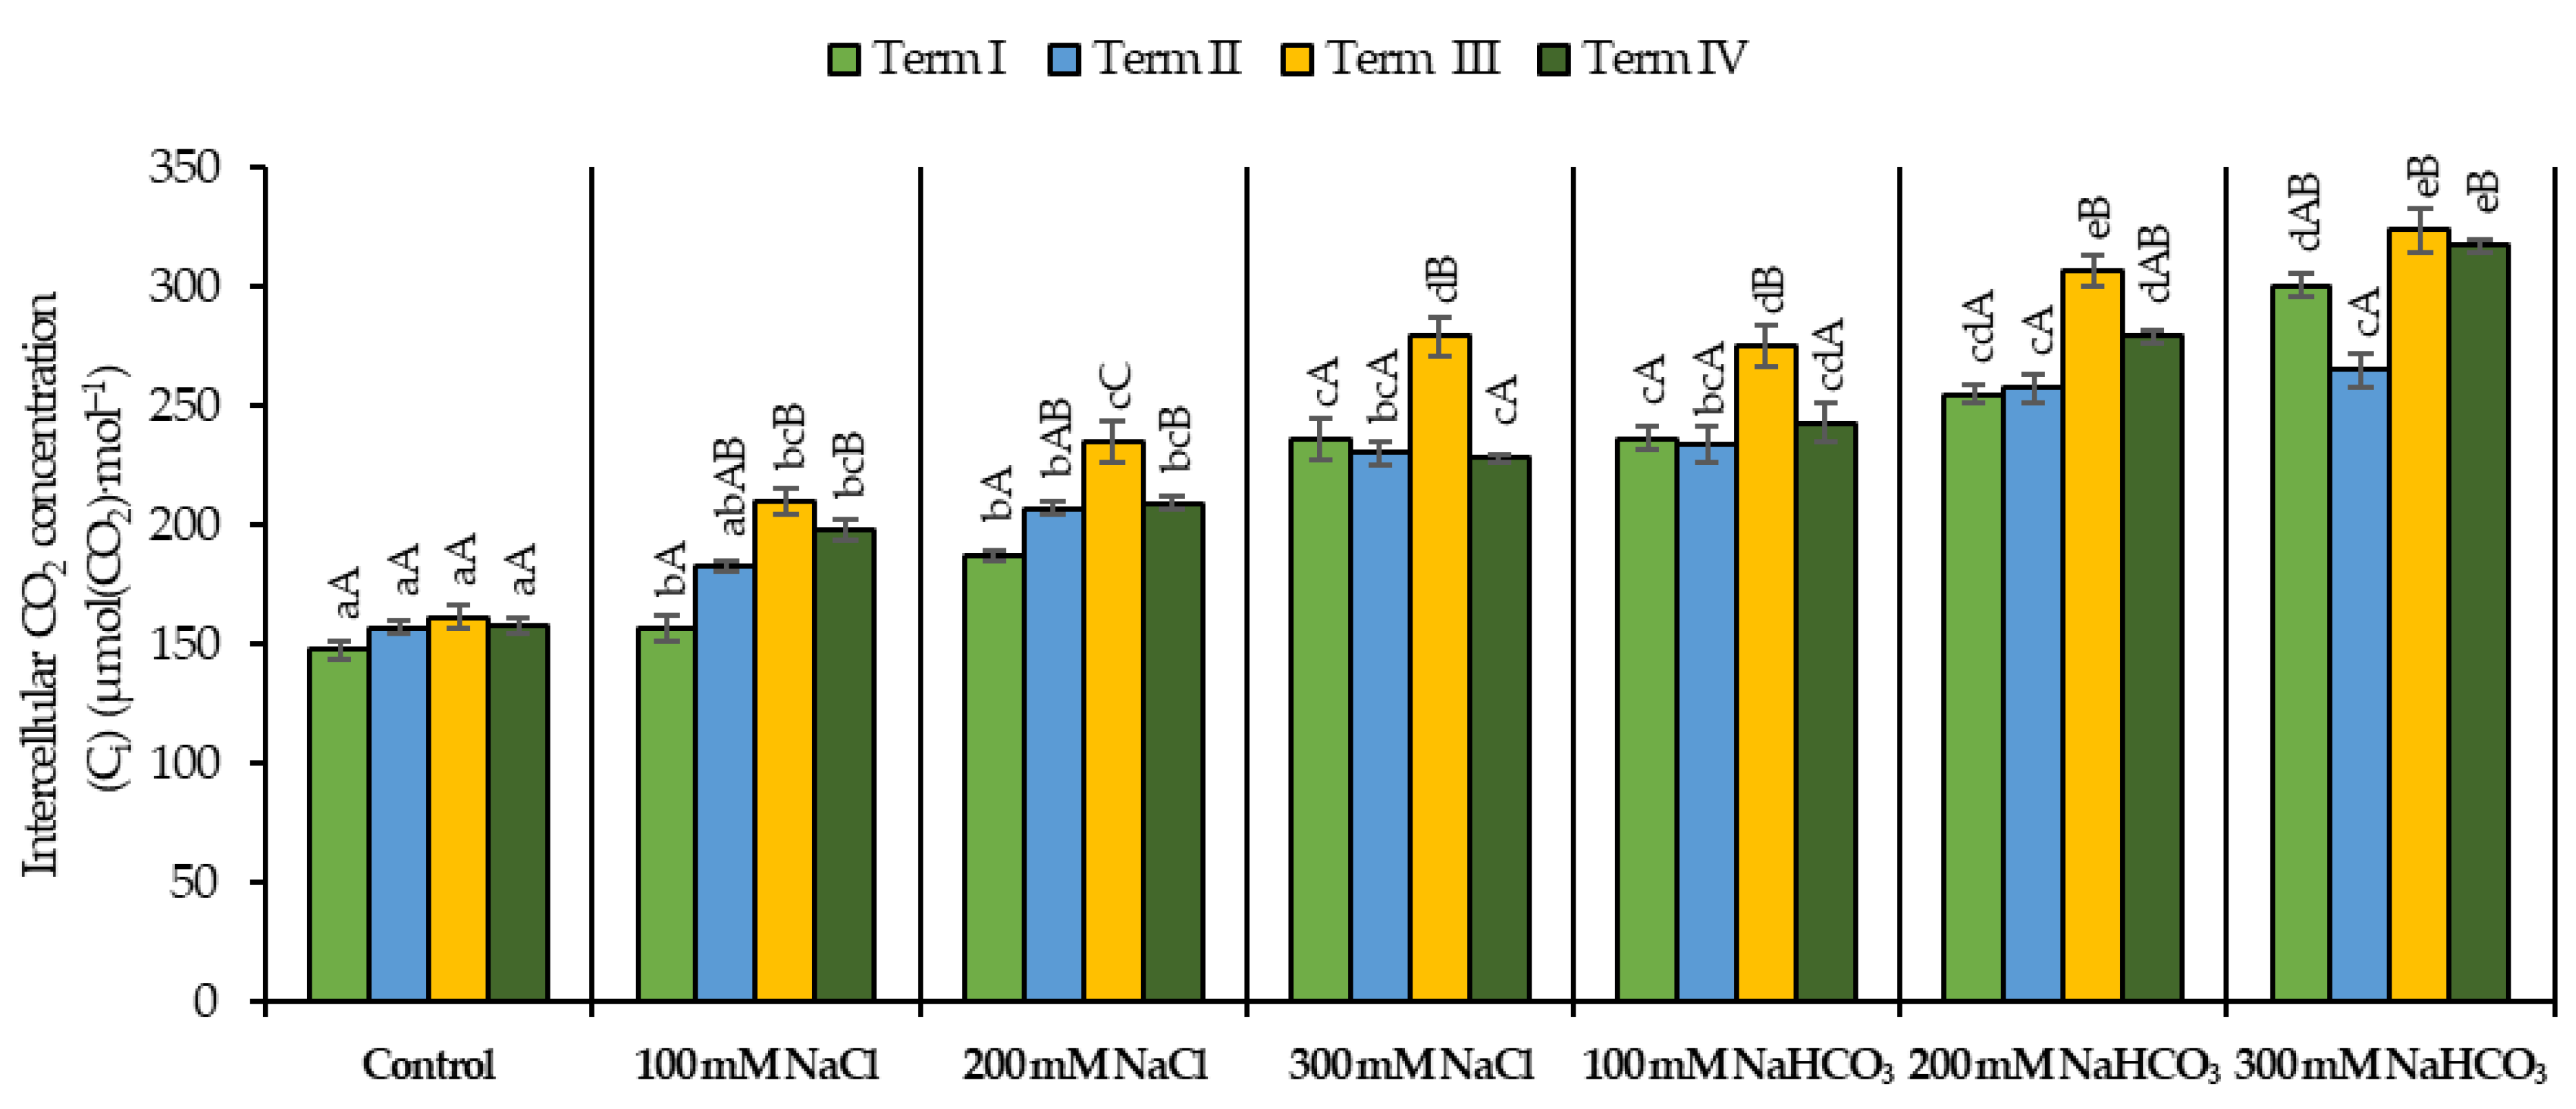
Under soil salinity, an increase in the Ci parameter value was observed compared with the control (Figure 8). In the control treatment, Ci values ranged from 147.5 to 161.5 µmol (CO2) mol−1 across the experimental terms. An exception was noted for the variant with 100 mM NaCl in Term II, where Ci reached 182.5 µmol (CO2) mol−1 and did not differ significantly from the control. Increasing the concentrations of neutral salt resulted in a progressive rise in Ci. At 200 mM NaCl, Ci values increased to 187.5–235.0 µmol (CO2) mol−1, while at 300 mM NaCl they further increased to 228.0–279.0 µmol (CO2) mol−1, depending on the term. A significant increase in Ci at 300 mM compared with 200 mM NaCl was observed only in Term I (236.0 vs. 187.5 µmol (CO2) mol−1) and Term III (279.0 vs. 235.0 µmol (CO2) mol−1). The application of 300 mM neutral salt did not result in changes in Ci compared with 100 mM NaHCO3, for which similar values were recorded (233.5–275.0 µmol (CO2) mol−1). Higher alkaline salt concentrations caused a further increase in the analyzed parameter. At 200 mM NaHCO3, Ci ranged from 255.0 to 306.5 µmol (CO2) mol−1, while at 300 mM it increased to 265.0–323.5 µmol (CO2) mol−1. Under the 300 mM alkaline salt concentration, a significant increase in Ci compared with the 100 mM concentration was recorded, except in Term II. In Term III, the highest Ci values were observed across all salinity treatments, reaching up to 323.5 µmol (CO2) mol−1; however, this was statistically confirmed only for the variants with 200 and 300 mM neutral salt and 100 mM alkaline salt.
Figure 8.
Impact of NaCl and NaHCO3 salt stress and sampling time on intercellular CO2 concentration (Ci). Within each treatment, uppercase letters denote statistically significant differences between sampling dates, whereas lowercase letters indicate significant differences among treatments at the same sampling date, as determined by ANOVA and Tukey’s HSD test (p ≤ 0.05).
3.4. Soil Analysis
3.4.1. Soil pH
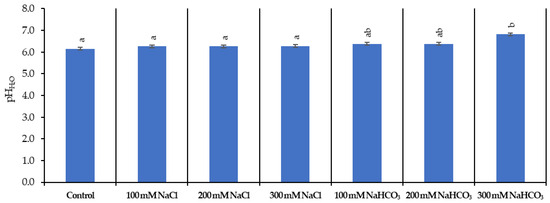
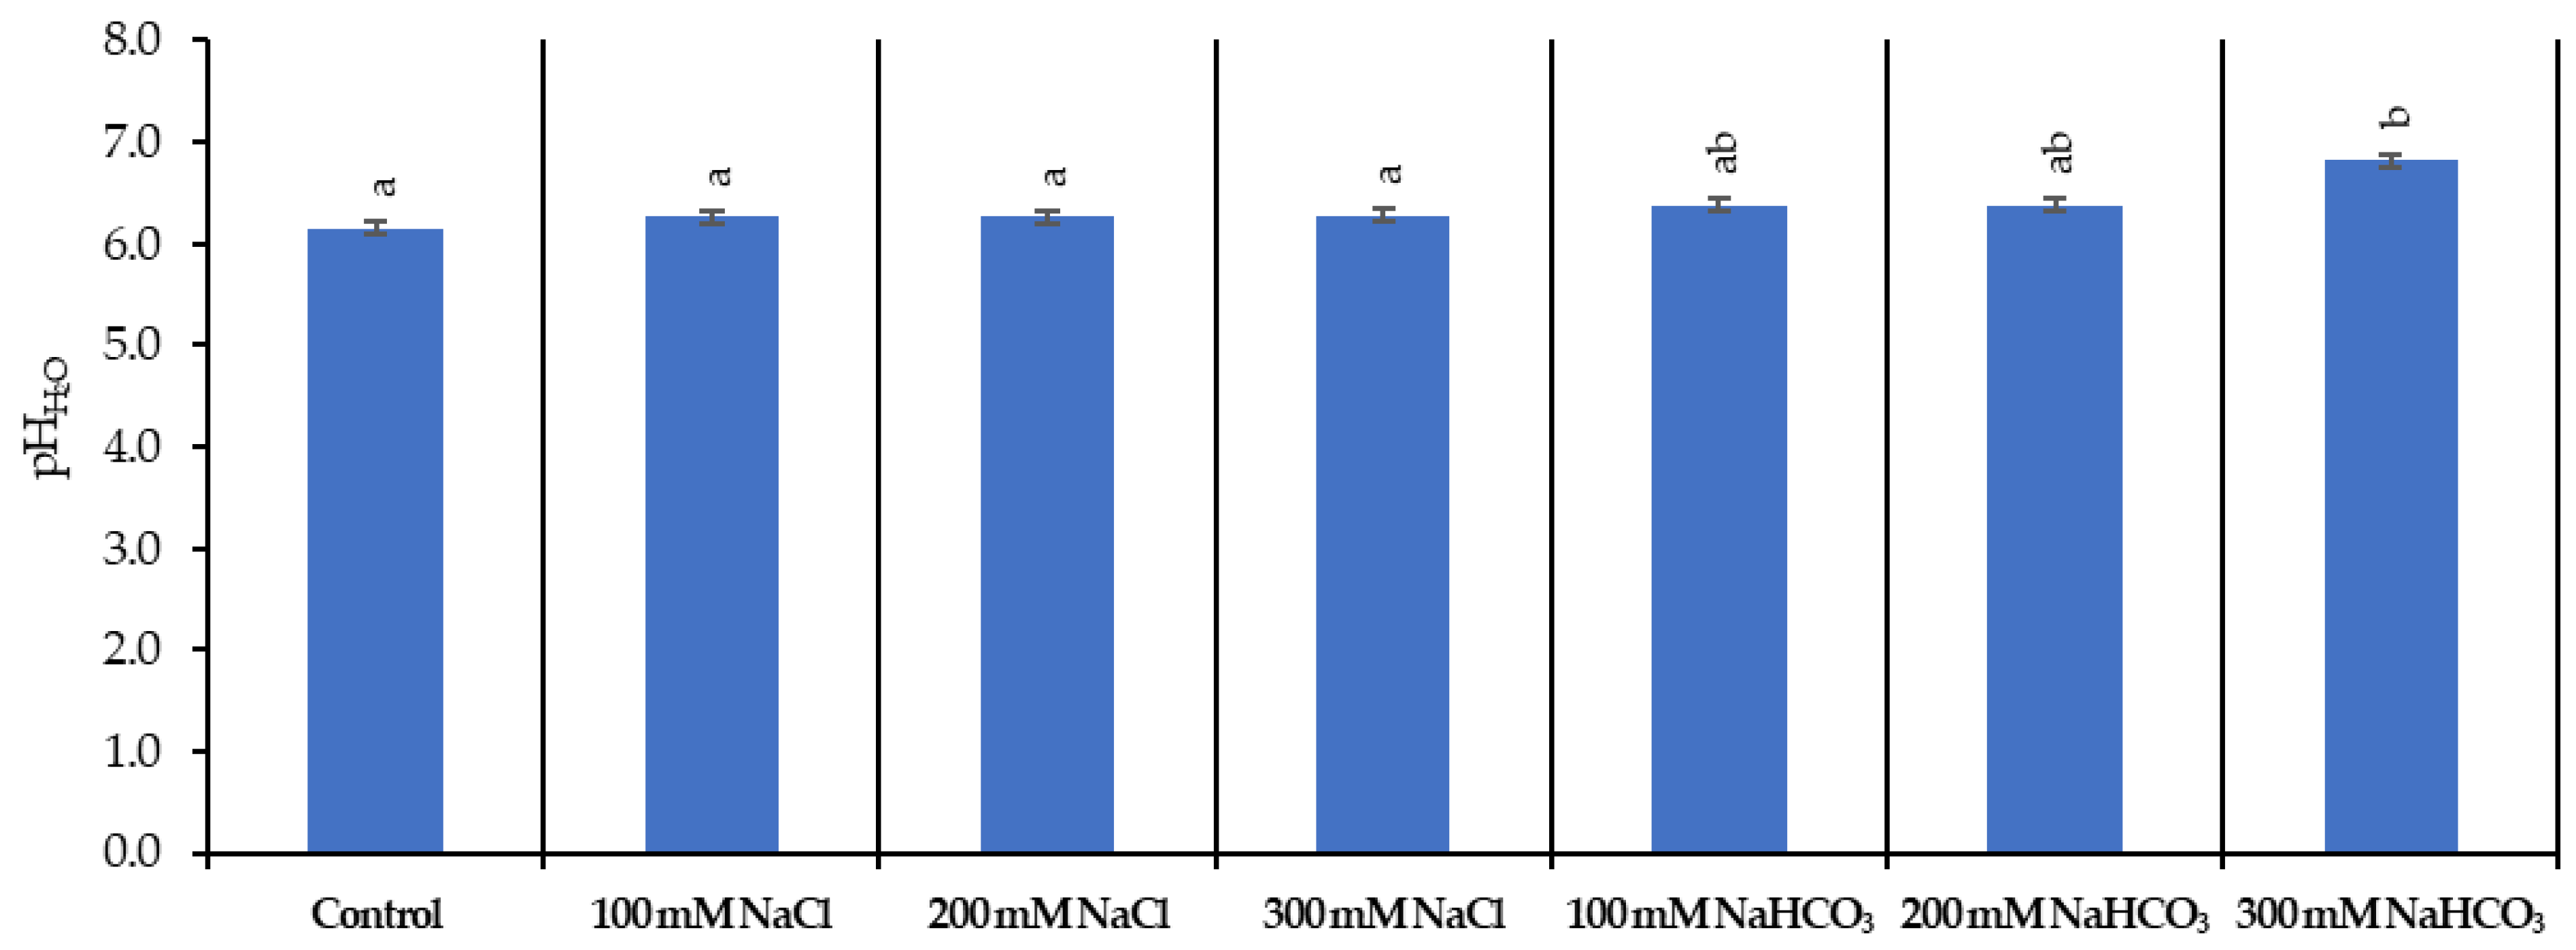
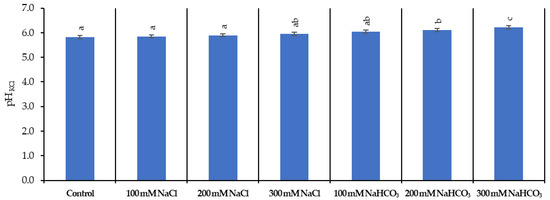
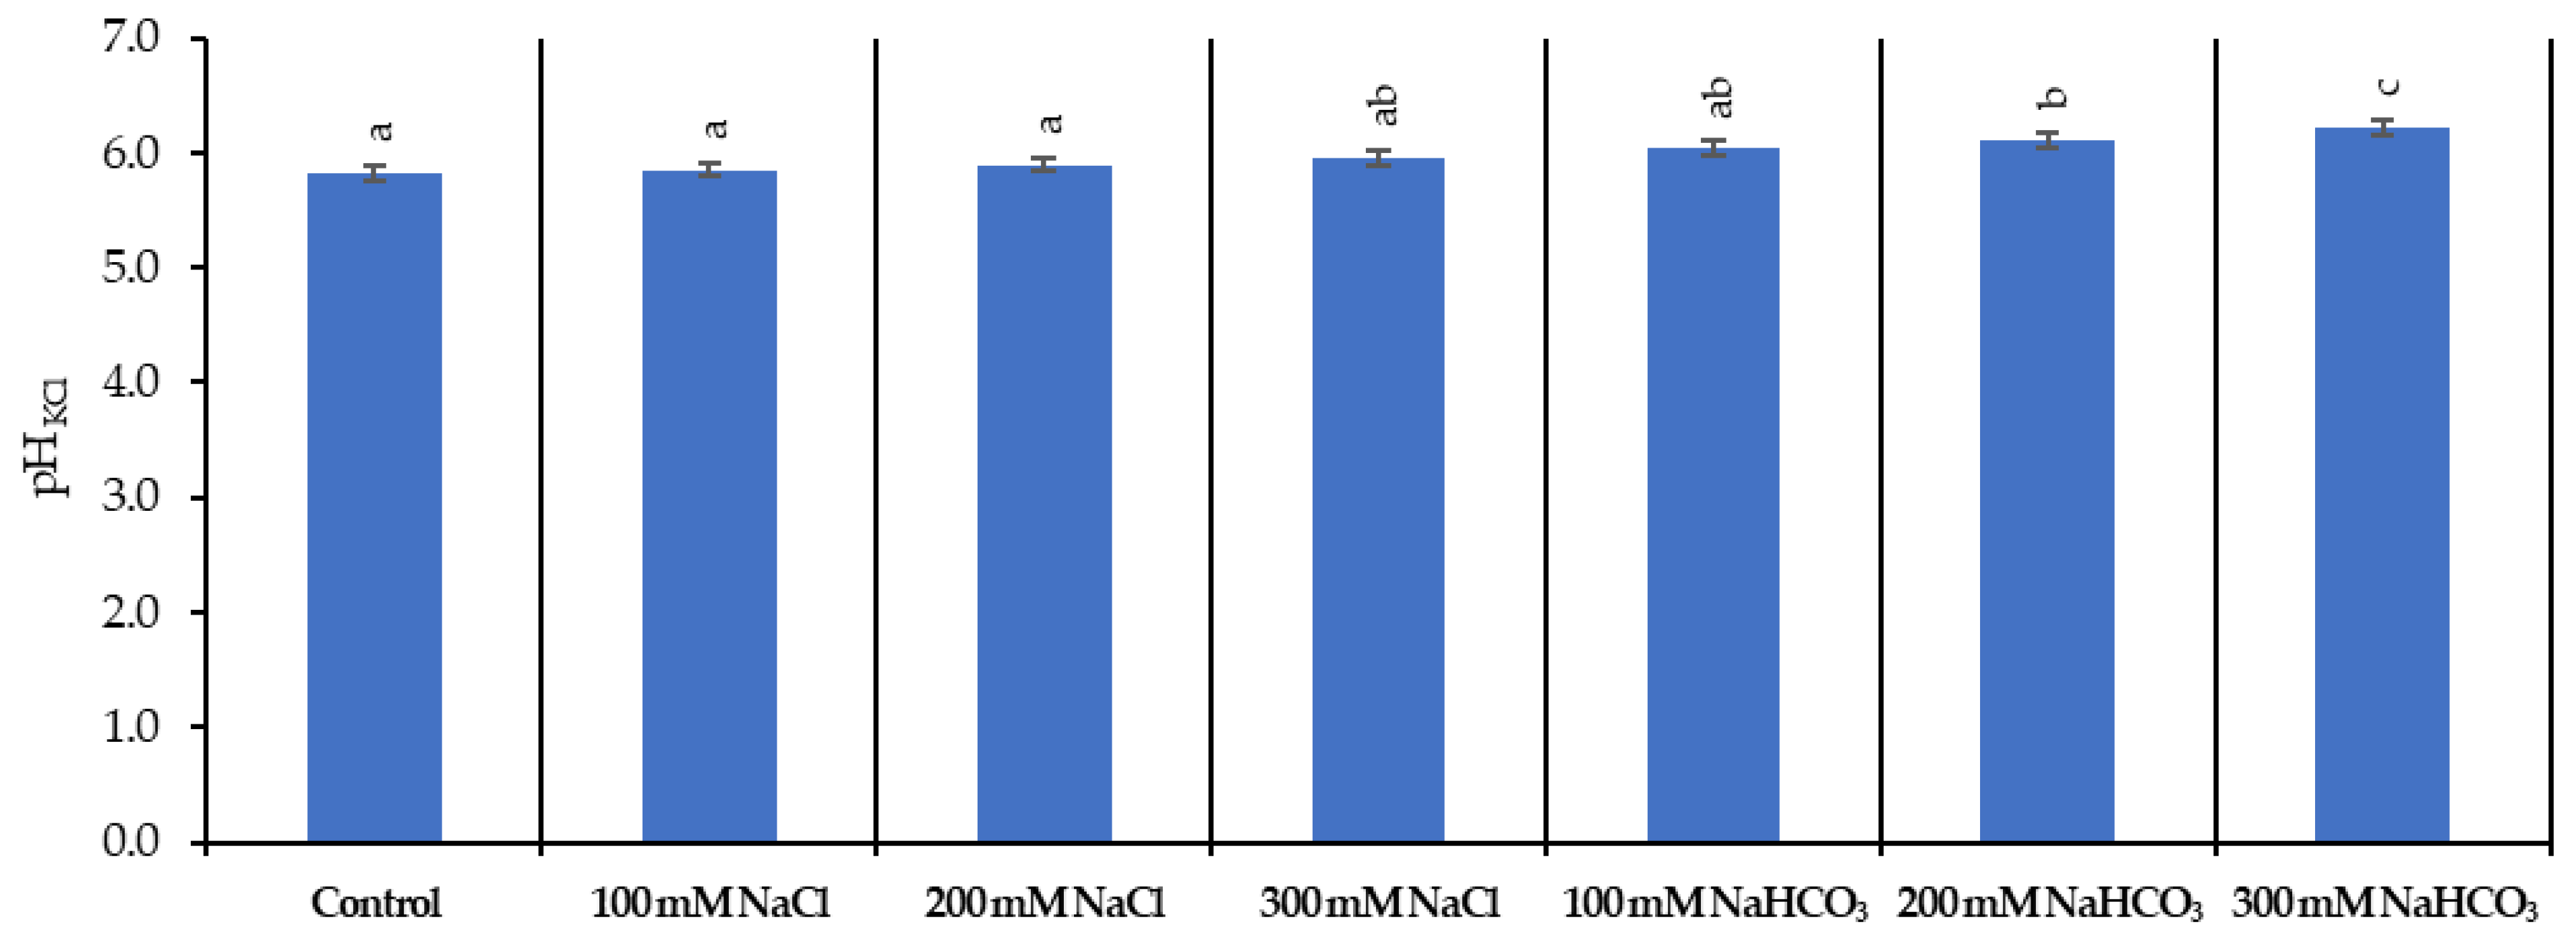
Soil pH and salinity levels changed in response to the applied salt treatments, with clear differences between neutral and alkaline salt addition (Figure 9 and Figure 10). In the control soil, the pH measured in H2O was 6.16. The application of NaCl had little effect on soil pH, with pHH2O values remaining close to the control across all concentrations, ranging from 6.27 at 100 and 200 mM NaCl to 6.28 at 300 mM NaCl. In contrast, NaHCO3 tended to increase soil pH measured in H2O. At 100 and 200 mM NaHCO3, pHH2O increased slightly to 6.38 and 6.39, respectively; however, these changes were not statistically significant compared to the control. Only the highest NaHCO3 treatment (300 mM) caused a statistically significant rise in pHH2O, reaching 6.82. Soil pH measured in KCl (pHKCl) was consistently lower than pHH2O and exhibited smaller absolute changes. In the control soil, pHKCl was 5.82, while NaCl application resulted in similar values ranging from 5.85 to 5.95 across concentrations, with no significant differences relative to the control. The application of NaHCO3 caused a moderate increase in pHKCl, with values rising to 6.04 at 100 mM, 6.10 at 200 mM, and 6.21 at 300 mM. A statistically significant elevation in pHKCl was observed only at 200 mM and 300 mM NaHCO3, corresponding to increases of approximately 4.8% and 6.7% relative to the control, respectively.
Figure 9.
Soil pH in H2O on the applied NaCl and NaHCO3 salt solutions. Lowercase letters indicate statistically significant differences among treatments, as determined by ANOVA followed by Tukey’s HSD test (p ≤ 0.05).
Figure 10.
Soil pH in KCl on the applied NaCl and NaHCO3 salt solutions. Lowercase letters indicate statistically significant differences among treatments, as determined by ANOVA followed by Tukey’s HSD test (p ≤ 0.05).
3.4.2. Soil Electrical Conductivity (EC)
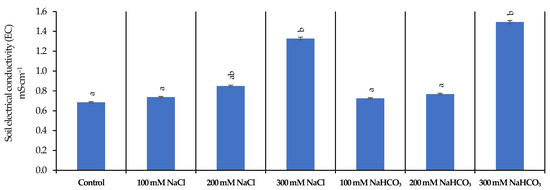
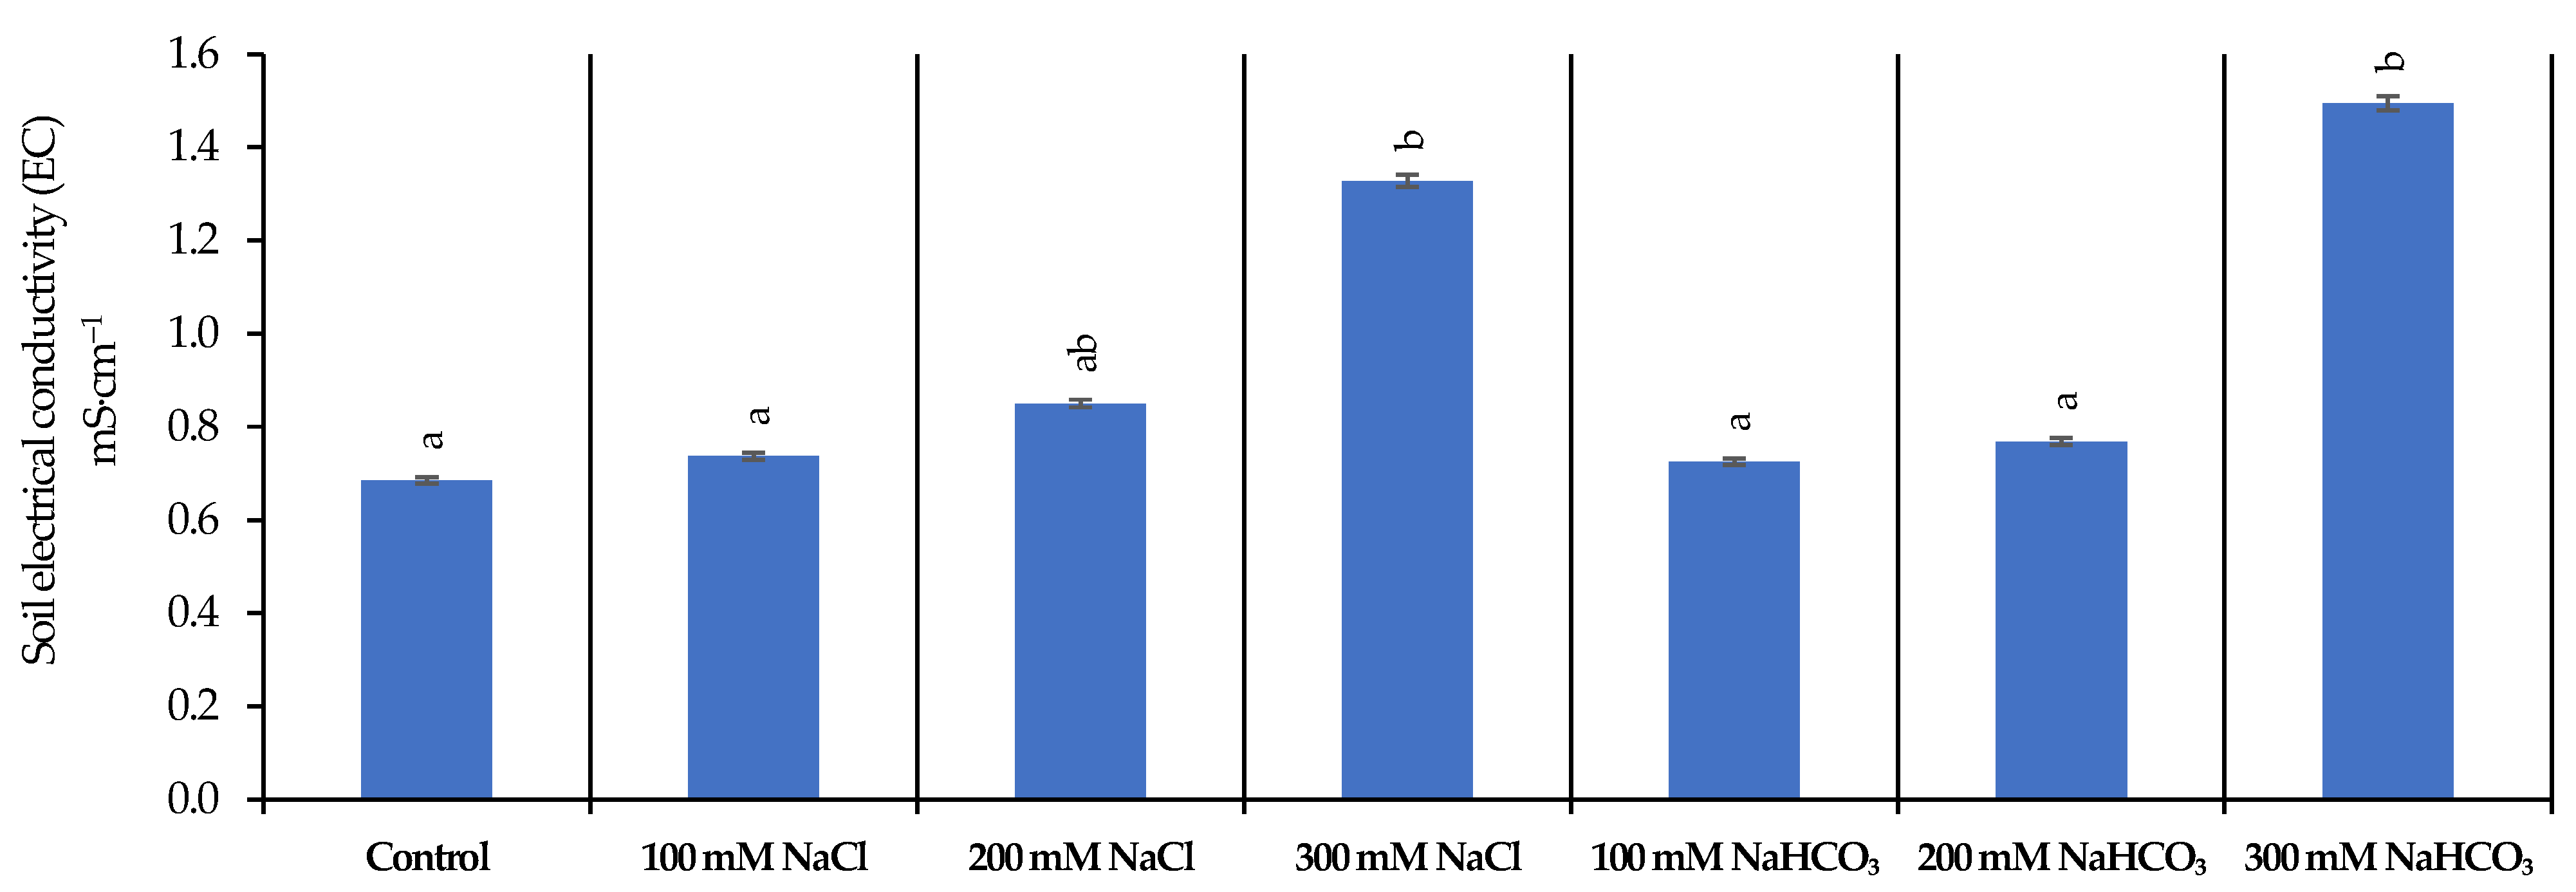
Soil electrical conductivity increased as a result of soil salinization (Figure 11). In the control soil, EC was 0.69 mS cm−1. EC increased with increasing salt concentration for both salt types, reflecting a higher soluble salt content. At 100 and 200 mM NaCl, EC rose slightly to 0.74 and 0.85 mS cm−1, respectively, whereas at 300 mM NaCl it increased markedly to 1.33 mS cm−1. A similar trend was observed for NaHCO3. At 100 and 200 mM NaHCO3, EC values were 0.73 and 0.77 mS cm−1, remaining close to the control. However, the highest alkaline salt concentration (300 mM) resulted in a pronounced increase in EC, reaching 1.50 mS cm−1. A statistically significant jump in EC compared to the control was detected only at the highest concentration (300 mM). At 300 mM NaCl, soil EC was approximately 92.8% higher than the control, whereas 300 mM NaHCO3 led to an increase of about 117.4% relative to the control. These results indicate that substantial soil salinization occurred only under the most severe treatment, with NaHCO3 contributing slightly more to the increase in EC than NaCl at the same molarity.
Figure 11.
Soil electrical conductivity depending on the applied NaCl and NaHCO3 salt solutions. Lowercase letters indicate statistically significant differences among treatments, as determined by ANOVA followed by Tukey’s HSD test (p ≤ 0.05).
4. Discussion
In the conducted study, the effects of salt stress induced by neutral and alkaline salts at concentrations of 100, 200, and 300 mM on the physiological responses of S. perfoliatum were evaluated. This species, due to its high biomass productivity and perennial growth habit, is considered a crop with strong potential for bioenergy systems [10]. Therefore, assessing its response to soil salinity is important in the context of future cultivation on degraded, marginal, and salinizing lands [32]. At the highest salinity level, chlorophyll content decreased by 29.0% under NaHCO3 treatment and by 27.5% under NaCl, while PN value declined by 51.3% and 48.7%, respectively, compared to the control. The stronger impact of NaHCO3 compared to NaCl is likely due to the combined effects of ionic toxicity and increased pH, a phenomenon not fully addressed in previous studies on the cup plant. Our findings provide novel insights into the species’ physiological tolerance, highlighting that chlorophyll content and photosynthetic efficiency are more sensitive to alkaline stress. Moreover, the proportional, concentration-dependent decline in gas exchange parameters observed in this study confirms the hypothesis that higher salinity levels exacerbate physiological stress. These results expand the understanding of S. perfoliatum’s adaptive mechanisms and suggest that the species could be strategically integrated into marginal or salt-affected lands for bioenergy production, with careful consideration of the soil salinity type.
The results demonstrated that salt stress induced by both NaCl and NaHCO3 significantly reduced the physiological parameters. Soil salinity, as a typical abiotic stressor, disrupts key physiological and biochemical processes in plants. Excessive accumulation of Na+ ions leads to ionic imbalance, a decrease in soil water potential, and difficulties in water uptake, as confirmed by previous studies [33,34,35]. High salt concentrations also adversely affect photosynthesis. Components necessary for the functioning of the photosynthetic apparatus, such as chlorophylls, photosystems, and carbon metabolism enzymes, undergo degradation under salt stress [36].
In the present study, reductions in chlorophyll content and fluorescence parameters were observed, indicating impaired photosystem II efficiency and disturbances in photochemical processes. At the same time, salinity decreased gas exchange parameters PN, gs, and E, confirming the constraints on CO2 uptake and plant water regulation [37,38]. These effects intensified with increasing salt concentrations, particularly under NaHCO3 treatment, consistent with previous findings that alkaline salts are more toxic than neutral [39,40]. The negative impact of salinity on photosynthesis is multilevel, encompassing osmotic, ionic, and biochemical stress [22,34,41]. Osmotic stress limits water availability and induces stomatal closure, leading to reduced gs and PN [20,21,22]. Ionic stress, caused by excess Na+ and Cl−, disrupts the transport of ions essential for chlorophyll biosynthesis, destabilizes cell membranes, and damages thylakoids, thereby reducing the efficiency of light energy conversion [42,43,44]. Similar damage to the photosynthetic apparatus under high salinity has been reported in seedlings of Robinia pseudoacacia [39].
Alkaline salts such as NaHCO3 are more toxic than neutral salts because they induce both ionic stress and substrate alkalization. Elevated soil pH reduces the availability of key ions (Mg2+, Fe2+, Mn2+) necessary for chlorophyll biosynthesis and photosystem functioning. Consequently, chlorophyll content, chlorophyll fluorescence, and CO2 assimilation decrease, as confirmed by other studies [38,39]. Additionally, the HCO3− ion can destabilize cellular and thylakoid membranes, contributing to pigment degradation and reduced photosystem efficiency [38]. Under alkaline stress, the increased production of ROS leads to lipid peroxidation, chlorophyll degradation, and damage to Calvin cycle enzymes, including RuBisCO [19,45]. These further decrease the photosynthetic parameters (PN, gs, E). Stomatal closure, a protective response, additionally limits CO2 uptake, intensifying the decline in photosynthetic performance [39,44].
At later measurement dates, a partial improvement in physiological parameters was observed, indicating the activation of multilayered adaptive mechanisms that enable plant functioning under prolonged salt stress. In the adaptive phase, plants enhance the activity of enzymatic components of the antioxidant system, such as superoxide dismutase (SOD) and catalase (CAT). These enzymes effectively neutralize excess ROS, which accumulate rapidly during the initial phase of stress and cause damage to membrane lipids, proteins, and photosynthetic structures [46]. Earlier studies by Rohman et al. [47] and Rohman et al. [48] also reported increased SOD activity under salt stress, confirming the activation of protective mechanisms aimed at reducing oxidative damage. Simultaneously, plants intensify the synthesis of osmolytes proline, glycine betaine, soluble sugars, and osmoregulatory proteins. These compounds decrease the osmotic potential of the cytoplasm, allowing the maintenance of turgor and the continuation of metabolic processes despite limited water availability [49,50]. During later measurement periods, a partial recovery of physiological parameters was again observed, suggesting further activation of adaptive mechanisms enabling plant functioning under prolonged salt exposure. A similar trend was reported by Jańczak-Pieniążek et al. [51] in wheat seedlings, where improved physiological parameters at later stages were attributed to repair processes. Together, these mechanisms indicate that plants not only respond defensively to salt stress but also undergo physiological and biochemical adaptations that enable relatively stable functioning despite persistent environmental stressors [52].
In all treatments, soil pH measured in KCl was lower than pH in H2O. This is a well-known effect of using a saline extract, which displaces exchangeable H+ from soil colloids and thus produces a lower pH reading. Notably, adding NaHCO3 significantly increased the soil pH in H2O, while causing only a small increase in pHKCl. This indicates that much of the added alkalinity was buffered by exchangeable soil acidity (H+ ions at cation exchange sites), so the net increase in exchangeable pH was limited. Electrical conductivity (EC) values reflected the degree of salinity: only the 300 mM treatments caused a sharp increase in EC, confirming that these soils had become highly saline. Such a high EC corresponds to a very low soil water potential, effectively inducing osmotic drought for plants [53]. This means that at a concentration of 300 mM, in addition to specific ionic effects, plants likely experienced severe limitations in water uptake due to the high salt concentration in the soil solution. Besides osmotic stress, the type of salt imposed qualitatively different stresses on plants. Neutral salt (NaCl) supplies an excess of Na+ and Cl− ions, which can lead to ion-specific toxicity and nutrient imbalances (e.g., Na+ competes with K+ uptake, Cl− antagonizes NO3− uptake) [54,55], along with the osmotic effects of elevated solute concentrations. Alkaline salt (NaHCO3) also introduces Na+ but also drastically raises the pH of the soil solution. High environmental pH can cause precipitation or a reduced availability of essential nutrients such as iron, calcium, and magnesium. For example, Fe2+ can precipitate as Fe(OH)3 under alkaline conditions [56]. This induced nutrient deficiency (often manifested by iron chlorosis and other symptoms) adds an additional layer of stress to the plant. Consequently, NaHCO3 treatments were more detrimental to the plant than NaCl treatments at equivalent salt levels. In our results, chlorophyll content and photosynthetic efficiency decreased more under NaHCO3 treatment, consistent with the combination of stresses (salinity and alkalinity) in these treatments. In summary, the presence of bicarbonate and the resulting high soil pH intensified the negative effects of salinity, making alkaline salt stress significantly more detrimental to S. perfoliatum than neutral salt stress under the conditions of this experiment.
The limitations of this study should also be noted. This study was conducted in a growth chamber pot environment, which, while allowing tight control of variables, does not fully replicate field conditions. The controlled setting (uniform soil medium, constant climate) lacks the complexity of natural habitats. Factors such as rainfall variability, soil heterogeneity, and microbial interactions were not represented. The salt levels used (100–300 mM NaCl or NaHCO3) were relatively high and imposed acutely; these concentrations effectively induced stress responses, but such extreme salinity might seldom occur homogeneously in open-field soils. The experiment also focused on short-term physiological responses and did not assess longer-term adaptation, growth, or reproductive effects under salinity.
In this context, the present study evaluated the photosynthetic performance of S. perfoliatum under salinity stress using selected chlorophyll fluorescence and gas exchange parameters. However, several methodological limitations should be acknowledged. The study did not include non-photochemical and photochemical quenching parameters (NPQ and qP), indicators of oxidative stress and membrane damage (e.g., malondialdehyde content, reactive oxygen species, electrolyte leakage), or detailed growth-related traits such as biomass accumulation and leaf area. These parameters provide complementary information on stress-induced energy dissipation, cellular damage, and whole-plant performance. Consequently, the absence of biochemical and growth-related measurements limits the possibility of directly linking physiological responses to overall plant performance under salinity stress.
Additionally, we measured primarily physiological and growth indicators; other parameters like tissue ion accumulation, osmolyte levels, or antioxidant enzyme activities were not examined and could be topics for future research to elucidate the plant’s internal tolerance mechanisms. These limitations should be kept in mind when extrapolating our findings. Nonetheless, the controlled approach and replicated design provided clear, comparative insights into how neutral vs. alkaline salinity affect cup plant physiology. The results serve as a valuable baseline for understanding S. perfoliatum’s responses to salt stress and will inform subsequent studies under more complex or long-term conditions.
5. Conclusions
This experiment demonstrated that soil salinity whether caused by NaCl or NaHCO3 markedly impairs the photosynthetic performance and physiological status of the cup plant (Silphium perfoliatum). At the highest salinity level, chlorophyll content decreased by 27.5% under NaCl and by 29.0% under NaHCO3, while PN declined by 48.7% and 51.3%, respectively. Alkaline salt NaHCO3 caused slightly stronger stress than neutral salt, highlighting the species’ sensitivity to high bicarbonate levels. All measured indicators of plant function (chlorophyll content, chlorophyll fluorescence parameters, gas exchange rates, etc.) showed significant declines with increasing soil salt concentration, confirming that salinity stress directly limits the species’ photosynthetic efficiency and overall vigor in a controlled setting. Importantly, the type of salinity influenced the severity of the response: NaHCO3 consistently caused more pronounced physiological disruptions than an equivalent concentration of NaCl. In other words, high bicarbonate levels (alkaline pH) exacerbated the detrimental effects of salinity beyond the osmotic and ionic stress imposed by NaCl alone. From a sustainable development perspective, these findings contribute to the early-stage evaluation of S. perfoliatum as a potential crop for cultivation on saline and marginal soils, where conventional crops are often unproductive. Although further field-based and long-term studies are required, the physiological insights obtained under controlled conditions provide a necessary foundation for assessing resource-efficient biomass production and adaptive crop strategies under the increasing soil salinization associated with climate change.
Author Contributions
Conceptualization, M.J.-P. and D.M.; methodology, M.J.-P., K.S. and D.M.; formal analysis, M.J.-P. and D.M.; investigation, M.J.-P., M.K., K.S., and D.M.; writing—original draft preparation, M.J.-P., M.K., K.S. and D.M.; writing—review and editing, M.J.-P., K.S. and D.M.; supervision, M.J.-P.; funding acquisition, M.J.-P. and D.M. All authors have read and agreed to the published version of the manuscript.
Funding
This research was supported by the Minister of Science of the Republic of Poland under the Program “Regional initiative of excellence”, Agreement No. RID/SP/0010/2024/1, and by funds from the Minister of Science of the Republic of Poland allocated to the activities of the Faculty of Technology and Life Sciences of the University of Rzeszów.
Institutional Review Board Statement
Not applicable.
Informed Consent Statement
Not applicable.
Data Availability Statement
The original contributions presented in this study are included in the article. Further inquiries can be directed to the corresponding author.
Acknowledgments
The authors gratefully acknowledge Włodzimierz Majtkowski (Institute of Plant Breeding and Acclimatization—National Research Institute, Bydgoszcz, Poland) for providing the plant material of the cup plant (Silphium perfoliatum L.).
Conflicts of Interest
The authors declare no conflicts of interest.
Abbreviations
The following abbreviations are used in this manuscript:
| Fv/Fm | maximum photochemical efficiency of PSII |
| Fv/Fo | maximum efficiency of water-splitting on the donor side of PSII |
| PI | PSII performance index |
| PN | net photosynthetic rate |
| E | transpiration rate |
| gs | stomatal conductance |
| Ci | intercellular CO2 concentration |
References
- Cronin, J.; Anandarajah, G.; Dessens, O. Climate change impacts on the energy system: A review of trends and gaps. Clim. Change 2018, 151, 79–93. [Google Scholar] [CrossRef] [Scilit] [PubMed]
- Zhou, P.; Lv, Y.; Wen, W. The low-carbon transition of energy systems: A bibliometric review from an engineering management perspective. Engineering 2023, 29, 147–158. [Google Scholar] [CrossRef] [Scilit]
- Yang, C.; Kwon, H.; Bang, B.; Jeong, S.; Lee, U. Role of biomass as low-carbon energy source in the era of net zero emissions. Fuel 2022, 328, 125206. [Google Scholar] [CrossRef] [Scilit]
- Mignogna, D.; Szabó, M.; Ceci, P.; Avino, P. Biomass energy and biofuels: Perspective, potentials, and challenges in the energy transition. Sustainability 2024, 16, 7036. [Google Scholar] [CrossRef] [Scilit]
- Katerla, J.; Sornek, K. Biomass for residential heating: A review of technologies, applications, and sustainability aspects. Energies 2025, 18, 5875. [Google Scholar] [CrossRef] [Scilit]
- Gerwin, W.; McBratney, A.; Tóth, G.; Montanarella, L.; Gardi, C.; van der Meijden, G. Assessment and quantification of marginal lands for biomass production in Europe using soil quality indicators. Soil Discuss. 2018, 4, 267–287. [Google Scholar] [CrossRef] [Scilit]
- Cossel, M.V.; Lewandowski, I.; Elbersen, B.; Staritsky, I.; Van Eupen, M.; Iqbal, Y.; Mantel, S.; Scordia, D.; Testa, G.; Cosentino, S.L.; et al. Marginal agricultural land low-input systems for biomass production. Energies 2019, 12, 3123. [Google Scholar] [CrossRef] [Scilit]
- Bury, M.; Możdżer, E.; Kitczak, T.; Siwek, H.; Włodarczyk, M. Yields, calorific value and chemical properties of cup plant Silphium perfoliatum L. biomass, depending on the method of establishing the plantation. Agronomy 2020, 10, 851. [Google Scholar] [CrossRef] [Scilit]
- Tóth, Š. The yield of green phytomass of Silphium perfoliatum L., newly-introduced energy crop tested on marginal heavy soils under Central European continental climate. J. Cent. Eur. Agric. 2023, 24, 374–390. [Google Scholar] [CrossRef] [Scilit]
- Peni, D.; Stolarski, M.J.; Bordiean, A.; Krzyżaniak, M.; Dębowski, M. Silphium perfoliatum—A herbaceous crop with increased interest in recent years for multi-purpose use. Agriculture 2020, 10, 640. [Google Scholar] [CrossRef] [Scilit]
- Auerswald, K.; Oberneder, A.; Wiesmeier, M.; Ebertseder, F.; Fritz, M. Erosion impact of cup plant (Silphium perfoliatum L.) stands established with and without nurse crop. Soil Use Manag. 2025, 41, e70047. [Google Scholar] [CrossRef] [Scilit]
- Gansberger, M.; Montgomery, L.F.R.; Liebhard, P. Botanical characteristics, crop management and potential of Silphium perfoliatum L. as a renewable resource for biogas production: A review. Ind. Crops Prod. 2015, 63, 362–372. [Google Scholar] [CrossRef] [Scilit]
- Koniuszy, A.; Hawrot-Paw, M.; Podsiadło, C.; Sędłak, P.; Możdżer, E. Gasification of cup plant (Silphium perfoliatum L.) biomass–Energy recovery and environmental impacts. Energies 2020, 13, 4960. [Google Scholar] [CrossRef] [Scilit]
- Isayenkov, S.V.; Maathuis, F.J.M. Plant salinity stress: Many unanswered questions remain. Front. Plant Sci. 2019, 10, 80. [Google Scholar] [CrossRef] [Scilit]
- Balasubramaniam, T.; Shen, G.; Esmaeili, N.; Zhang, H. Plants’ response mechanisms to salinity stress. Plants 2023, 12, 2253. [Google Scholar] [CrossRef] [Scilit]
- Zhao, S.; Zhang, Q.; Liu, M.; Zhou, H.; Ma, C.; Wang, P. Regulation of plant responses to salt stress. Int. J. Mol. Sci. 2021, 22, 4609. [Google Scholar] [CrossRef] [Scilit]
- dos Santos, T.B.; Ribas, A.F.; de Souza, S.G.H.; Budzinski, I.G.F.; Domingues, D.S. Physiological responses to drought, salinity, and heat stress in plants: A review. Stresses 2022, 2, 113–135. [Google Scholar] [CrossRef] [Scilit]
- Gupta, B.; Huang, B. Mechanism of salinity tolerance in plants: Physiological, biochemical, and molecular characterization. Int. J. Genom. 2014, 2014, 701596. [Google Scholar] [CrossRef] [Scilit]
- Hameed, A.; Ahmed, M.Z.; Hussain, T.; Aziz, I.; Ahmad, N.; Gul, B.; Nielsen, B.L. Effects of salinity stress on chloroplast structure and function. Cells 2021, 10. [Google Scholar] [CrossRef] [Scilit]
- Liu, C.; Jiang, X.; Yuan, Z. Plant responses and adaptations to salt stress: A review. Horticulturae 2024, 10, 1221. [Google Scholar] [CrossRef] [Scilit]
- Mahajan, M.; Poor, P.; Kaur, H.; Aher, R.R.; Palakolanu, S.R.; Khan, M.I.R. Salt stress tolerance and abscisic acid in plants: Associating role of plant growth regulators and transcription factors. Plant Physiol. Biochem. 2025, 228, 110303. [Google Scholar] [CrossRef] [Scilit]
- Hao, S.; Wang, Y.; Yan, Y.; Liu, Y.; Wang, J.; Chen, S. A review on plant responses to salt stress and their mechanisms of salt resistance. Horticulturae 2021, 7, 132. [Google Scholar] [CrossRef] [Scilit]
- Singh, P.; Choudhary, K.K.; Chaudhary, N.; Gupta, S.; Sahu, M.; Tejaswini, B.; Sarkar, S. Salt stress resilience in plants mediated through osmolyte accumulation and its crosstalk mechanism with phytohormones. Front. Plant Sci. 2022, 13, 1006617. [Google Scholar] [CrossRef] [Scilit] [PubMed]
- Shi, D.; Wang, D. Effects of Various Salt–Alkaline Mixed Stresses on Aneurolepidium chinense (Trin.) Kitag. Plant Soil 2005, 271, 15–26. [Google Scholar] [CrossRef] [Scilit]
- Yang, C.; Chong, J.; Li, C.; Kim, C.; Shi, D.; Wang, D. Osmotic Adjustment and Ion Balance Traits of an Alkali-Resistant Halophyte Kochia sieversiana during Adaptation to Salt and Alkali Conditions. Plant Soil 2007, 294, 263–276. [Google Scholar] [CrossRef] [Scilit]
- Zhu, J.-K. Plant Salt Tolerance. Trends Plant Sci. 2001, 6, 66–71. [Google Scholar] [CrossRef] [Scilit]
- Munns, R.; Tester, M. Mechanisms of Salinity Tolerance. Annu. Rev. Plant Biol. 2008, 59, 651–681. [Google Scholar] [CrossRef] [Scilit]
- Jańczak-Pieniążek, M.; Migut, D.; Piechowiak, T.; Balawejder, M. Enhancement of photosynthetic efficiency and antioxidant response in wheat under drought stress by quercetin–copper complex. Int. J. Mol. Sci. 2025, 26, 10365. [Google Scholar] [CrossRef] [Scilit]
- Maxwell, K.; Johnson, G.N. Chlorophyll fluorescence—A practical guide. J. Exp. Bot. 2000, 51, 659–668. [Google Scholar] [CrossRef]
- Zondo, N.; Ntuli, N.R.; Mavengahama, S.; Van Jaarsveld, C.M. Improving growth and yield of Cucurbita argyrosperma with goat manure. Front. Plant Sci. 2025, 16, 1658365. [Google Scholar] [CrossRef] [Scilit]
- Hmidi, O.; Srarfi, F.; Brahim, N.; Bambina, P.; Lo Papa, G. Predicting Soil Electrical Conductivity of Saturated Paste Extract Using Pedotransfer Functions in Northeastern Tunisia. Sustainability 2025, 17, 9177. [Google Scholar] [CrossRef] [Scilit]
- Gazoulis, I.; Pyliou, K.; Kokkini, M.; Danaskos, M.; Kanatas, P.; Travlos, I. Cup plant (Silphium perfoliatum): Agronomy, uses, and potential role for land restoration. Land 2025, 14, 1307. [Google Scholar] [CrossRef] [Scilit]
- Arif, Y.; Singh, P.; Siddiqui, H.; Bajguz, A.; Hayat, S. Salinity induced physiological and biochemical changes in plants: An omic approach towards salt stress tolerance. Plant Physiol. Biochem. 2020, 156, 64–77. [Google Scholar] [CrossRef] [Scilit] [PubMed]
- Shelar, P.V.; Mankar, G.D.; Sontakke, O.P.; Wayase, U.R.; Bhosale, K.S.; Nikalje, G.C.; Ahire, M.L.; Nikam, T.D.; Barmukh, R.B. A review on physio-biochemical and molecular mechanisms of salt tolerance in crops. Curr. Agri Res 2024, 12, 2. [Google Scholar] [CrossRef] [Scilit]
- Soliman, W.S.; El-Soghayer, M.H.; Salaheldin, S.; Abbas, A.M.; Gahory, A.-A. Salinity Stress in Calendula officinalis: Negative Growth Impacts Offset by Increased Flowering Yield and the Mitigating Role of Zinc. Horticulturae 2024, 10, 1357. [Google Scholar] [CrossRef] [Scilit]
- Tsai, Y.C.; Chen, K.C.; Cheng, T.S.; Lee, C.; Lin, S.H.; Tung, C.W. Chlorophyll fluorescence analysis in diverse rice varieties reveals the positive correlation between the seedlings salt tolerance and photosynthetic efficiency. BMC Plant Biol. 2019, 19, 403. [Google Scholar] [CrossRef] [Scilit]
- Hnilickova, H.; Kraus, K.; Vachova, P.; Hnilicka, F. Salinity stress affects photosynthesis, malondialdehyde formation, and proline content in Portulaca oleracea L. Plants 2021, 10, 845. [Google Scholar] [CrossRef] [Scilit]
- Shen, C.; Yang, W.; Kang, Y.; Qin, S.; Zhang, W.; Liu, Y.; Qian, S.; Han, Y. Effect of alkaline salt stress on photosynthetic activities of potato plants (Solanum tuberosum L.). Plants 2025, 14, 2979. [Google Scholar] [CrossRef] [Scilit]
- Guo, R.; Shi, L.; Yan, C.; Zhong, X.; Gu, F.; Liu, Q.; Xia, X.; Li, H. Ionomic and metabolic responses to neutral salt or alkaline salt stresses in maize (Zea mays L.) seedlings. BMC Plant Biol. 2017, 17, 41. [Google Scholar] [CrossRef] [Scilit]
- Yu, S.; Yu, L.; Hou, Y.; Zhang, Y.; Guo, W.; Xue, Y. Contrasting effects of NaCl and NaHCO3 stresses on seed germination, seedling growth, photosynthesis, and osmoregulators of the common bean (Phaseolus vulgaris L.). Agronomy 2019, 9, 409. [Google Scholar] [CrossRef] [Scilit]
- Wang, X.; Chen, Z.; Sui, N. Sensitivity and responses of chloroplasts to salt stress in plants. Front. Plant Sci. 2024, 15, 1374086. [Google Scholar] [CrossRef] [Scilit]
- Zhang, Y.; Kaiser, E.; Li, T.; Marcelis, L.F.M. NaCl affects photosynthetic and stomatal dynamics by osmotic effects and reduces photosynthetic capacity by ionic effects in tomato. J. Exp. Bot. 2022, 73, 3637–3650. [Google Scholar] [CrossRef] [Scilit]
- Shu, S.; Guo, S.R.; Sun, J.; Yuan, L.Y. Effects of salt stress on the structure and function of the photosynthetic apparatus in Cucumis sativus and its protection by exogenous putrescine. Physiol. Plant. 2012, 146, 285–296. [Google Scholar] [CrossRef] [Scilit] [PubMed]
- Lu, X.; Ma, L.; Zhang, C.; Yan, H.; Bao, J.; Gong, M.; Wang, W.; Li, S.; Ma, S.; Chen, B. Grapevine (Vitis vinifera) responses to salt stress and alkali stress: Transcriptional and metabolic profiling. BMC Plant Biol. 2022, 22, 528. [Google Scholar] [CrossRef] [Scilit] [PubMed]
- Wang, X.; Wang, W.; Huang, J.; Peng, S.; Xiong, D. Diffusional conductance to CO2 is the key limitation to photosynthesis in salt-stressed leaves of rice (Oryza sativa). Physiol. Plant. 2018, 163, 45–58. [Google Scholar] [CrossRef] [Scilit] [PubMed]
- Noctor, G.; Foyer, C.H. Ascorbate and glutathione: Keeping active oxygen under control. Annu. Rev. Plant Physiol. Plant Mol. Biol. 1998, 49, 249–279. [Google Scholar] [CrossRef] [Scilit]
- Rohman, M.M.; Talukder, M.Z.A.; Hossain, M.G.; Uddin, M.S.; Amiruzzaman, M.; Biswas, A.; Ahsan, A.F.M.S.; Chowdhury, M.A.Z. Saline sensitivity leads to oxidative stress and increases the antioxidants in presence of proline and betaine in maize (Zea mays L.) inbred. Plant Omics J. 2016, 9, 35–47. [Google Scholar]
- Rohman, M.M.; Islam, M.R.; Monsur, M.B.; Amiruzzaman, M.; Fujita, M.; Hasanuzzaman, M. Trehalose protects maize plants from salt stress and phosphorus deficiency. Plants 2019, 8, 568. [Google Scholar] [CrossRef] [Scilit]
- Parvin, K.; Hasanuzzaman, M.; Bhuyan, M.H.M.B.; Nahar, K.; Mohsin, S.M.; Fujita, M. Comparative physiological and biochemical changes in tomato (Solanum lycopersicum L.) under salt stress and recovery: Role of antioxidant defense and glyoxalase systems. Antioxidants 2019, 8, 350. [Google Scholar] [CrossRef] [Scilit]
- Wang, D.; Gao, Y.; Sun, S.; Lu, X.; Li, Q.; Li, L.; Wang, K.; Liu, J. Effects of salt stress on the antioxidant activity and malondialdehyde, solution protein, proline, and chlorophyll contents of three Malus species. Life 2022, 12, 1929. [Google Scholar] [CrossRef] [Scilit]
- Jańczak-Pieniążek, M.; Migut, D.; Piechowiak, T.; Balawejder, M. Assessment of the impact of the application of a quercetin–copper complex on the course of physiological and biochemical processes in wheat plants (Triticum aestivum L.) growing under saline conditions. Cells 2022, 11, 1141. [Google Scholar] [CrossRef] [Scilit]
- Song, L.; Yu, Y.; Chen, H.; Feng, Y.; Chen, S.; Zhang, H.; Zhou, H.; Meng, L.; Wang, Y. Response of photosynthetic characteristics and antioxidant system in the leaves of safflower to NaCl and NaHCO3. Plant Cell Rep. 2024, 43, 146. [Google Scholar] [CrossRef] [Scilit]
- Wang, G.; Shen, W.; Zhang, Z.; Guo, S.; Hu, J.; Feng, R.; Zhao, Q.; Du, J.; Du, Y. The Effect of Neutral Salt and Alkaline Stress with the Same Na+ Concentration on Root Growth of Soybean (Glycine max (L.) Merr.) Seedlings. Agronomy 2022, 12, 2708. [Google Scholar] [CrossRef] [Scilit]
- Guo, J.; Liu, L.; Du, M.; Tian, H.; Wang, B. Cation and Zn Accumulation in Brown Seeds of the Euhalophyte Suaeda salsa Improves Germination Under Saline Conditions. Front. Plant Sci. 2020, 11, 602427. [Google Scholar] [CrossRef] [Scilit]
- Lin, J.; Hua, X.; Peng, X.; Dong, B.; Yan, X. Germination Responses of Ryegrass (Annual vs. Perennial) Seed to the Interactive Effects of Temperature and Salt-Alkali Stress. Front. Plant Sci. 2018, 9, 1458. [Google Scholar] [CrossRef] [Scilit]
- Chen, H.; Zhang, Q.; Cai, H.; Xu, F. Ethylene Mediates Alkaline-Induced Rice Growth Inhibition by Negatively Regulating Plasma Membrane H(+)-ATPase Activity in Roots. Front. Plant Sci. 2017, 8, 1839. [Google Scholar] [CrossRef] [Scilit] [PubMed]
Disclaimer/Publisher’s Note: The statements, opinions and data contained in all publications are solely those of the individual author(s) and contributor(s) and not of MDPI and/or the editor(s). MDPI and/or the editor(s) disclaim responsibility for any injury to people or property resulting from any ideas, methods, instructions or products referred to in the content. |
© 2026 by the authors. Licensee MDPI, Basel, Switzerland. This article is an open access article distributed under the terms and conditions of the Creative Commons Attribution (CC BY) license.