Article

Identifying Structural Risks in China’s Agricultural Global Value Chain Network: An Aggregated Analysis of Mainland China, Hong Kong, and Taiwan

1
School of Business Administration, Hunan University of Technology and Business, Changsha 410000, China
2
Academy for Advanced Interdisciplinary Studies, Hunan University of Technology and Business, Changsha 410000, China
3
Institute for Entrepreneurship and Innovation, Loughborough University London, London E20 3BS, UK
*
Author to whom correspondence should be addressed.
Sustainability 2026, 18(2), 1082; https://doi.org/10.3390/su18021082
Submission received: 28 November 2025 / Revised: 3 January 2026 / Accepted: 14 January 2026 / Published: 21 January 2026

Abstract

Global agricultural value chains (GVCs) face growing structural risks that threaten long-term sustainability, yet traditional methods often miss these systemic risks. Using complex network analysis and OECD data, this study examines the structural risks in China (Mainland China, Hong Kong, and Taiwan)’s agricultural GVC network from 2001 to 2020. By analyzing both supply and demand sides, we reveal a growing asymmetry in network risks and find that risk sources are shifting from direct trading partners to hidden, indirect ones. On the upstream demand side (imports), we observe that risks have turned into a strong reliance on a few core partners, creating a rigid structure that is difficult to change. In contrast, the downstream supply side (exports) exhibits high volatility, involving frequent shifts across uncertain new markets. These results suggest that agricultural security policies should shift from passive crisis response to active structural optimization. This study aims to provide a practical reference for China and other economies seeking to build a safer and more stable agricultural trade system.

1. Introduction

The deep integration of Global Value Chains (GVCs) has reshaped modern production systems and enhanced the efficiency of resource allocation. However, this “efficiency-first” orientation has inadvertently eroded system’s safety buffers, stripping away the buffers needed to withstand disruptions. This makes supply chain vulnerability increasingly prominent [1,2]. Today, network security has shifted from a theoretical discussion to a tangible challenge. External shocks have become the new normal. These range from logistical stagnation caused by the COVID-19 pandemic and trade barriers triggered by geopolitical frictions to production fluctuations induced by climate anomalies [3]. These external pressures do not act in isolation. They intertwine with internal network structural characteristics, such as dependence on specific sources and the concentration of critical links. In such environments, minor local disturbances can easily trigger cascading effects. These chain reactions amplify local shocks into systemic volatility, thereby introducing deep uncertainty to the global economy [4,5].
Against this backdrop, agricultural GVCs exhibit a distinct “Dual Vulnerability” due to the dual constraints of economic and natural systems [6]. On the upstream demand side (i.e., import dependence), agricultural production is characterized by high rigidity and dependence on global inputs such as seeds and fertilizers. Here, supply chain stability directly determines production capacity. On the downstream supply side (i.e., export markets), the deep integration of agricultural products with international trade allows demand side changes, such as trade policy adjustments, to propagate upstream to the production end [7]. This two-way connection, compounded by agriculture’s inherent reliance on biological cycles and climatic conditions, implies that structural risks concern not only economic returns but also directly impact food security and social stability [8].
Addressing these systemic challenges requires transcending traditional linear perspectives to deeply understand the complex interdependent relationships underlying global trade. The existing literature has achieved substantial progress in measuring trade volatility and single-dimensional concentration. This lays a solid foundation for understanding GVC risks. However, regarding the dynamic evolutionary characteristics of risk in the temporal dimension and its systemic transmission mechanism within the network, there remains significant room for further exploration. Current analytical approaches predominantly focus on static cross-sectional or aggregate perspectives. Consequently, the discussion on asymmetric transmission mechanisms across both supply and demand sides is less developed and warrants deeper analysis [9,10,11].
Therefore, this study explores the evolution of risk during the two decades of China’s deep integration into the global agricultural value chain. We seek to determine whether, from a structural perspective, risk has truly dispersed within China’s agricultural GVC network or formed a more hidden structural concentration. We further aim to uncover the distinct differences in transmission paths and intensities between the upstream demand side (e.g., import dependence) and the downstream supply side (e.g., export obstruction), and to identify exactly which key hub nodes could trigger cascading reactions.
To address these issues, this study applies Complex Network Analysis (CNA) using international input–output data from the OECD to build a multi-tier risk measurement framework. We develop the Structural Risk Exposure Index (SREI), which extends the standard concentration view from simple scale metrics to structural dependency by measuring the paradox of “breadth expansion and depth lock-in.” At the same time, the backbone network diagnosis extends the centrality view from direct trade links to the deeper network structure by revealing the “implicit” nature of risk shifting toward indirect connections. This framework captures measurable structural vulnerability, characterizes the “risk transmission structure” of China’s agricultural value chain network, and assesses the risk profile of key nodes. Based on these insights, we translate theoretical analysis into practical policy guidance. We aim to support the transformation of China’s agricultural security policy from passive crisis response to active network structure reshaping, providing a scientific reference for China and other economies seeking to enhance the sustainability of their food systems.

2. Literature Review

2.1. The “Efficiency-Security” Paradox: General Risks in GVCs

The deep integration of GVCs has profoundly reshaped the international division of labor. This process has significantly enhanced the efficiency of global production by optimizing cross-border resource configuration [12]. However, this “efficiency-first” architecture operates as a double-edged sword. While the pursuit of “zero inventory” eliminates waste, it effectively strips away the system’s safety buffers. This erodes the elasticity needed to cope with disruptions, leading to an increasingly acute trade-off between efficiency and security [13,14].
Global supply chains have now entered a high-risk “new normal.” Risk patterns have evolved from single market fluctuations to composite shocks. In this current landscape, de-globalization and surging trade barriers are driving a strategic shift. Nations are prioritizing geopolitical stability over economic efficiency in supply chain design [15]. Trade barriers between major powers have severed the flow paths of critical technologies. This imbues risks with a distinct political economy dimension [16,17]. At the same time, sudden events like the COVID-19 pandemic have caused physical interruptions while exposing the systemic fragility inherent in overly centralized layouts [18,19]. Crucially, these shocks often generate cascading effects. Within highly interconnected networks, these chain reactions amplify local fractures into global systemic crises [4,20]. This implies that understanding GVC risks requires moving beyond the shock source itself to focus on the transmission mechanisms of the network structure.

2.2. Dual Vulnerability: The Unique Risk Profile of Agricultural GVCs

In the context of widespread macroeconomic fragility, the agricultural sector encounters unique structural challenges driven by the interplay of economic and natural constraints [21].
On the upstream demand side (i.e., import dependence), the sector is heavily reliant on natural endowments. Contemporary literature indicates that escalating climate change generates risk events capable of permanently impairing regional production capacities [22,23]. Industry evidence also reveals how biological cycle constraints lead to protracted lags in production recovery [24]. Moreover, modern agriculture’s dependence on key inputs increases the vulnerability of the system [25]. The fertilizer industry is highly concentrated and susceptible to external shocks. Recent studies show that fertilizer prices frequently fluctuate severely, directly affecting agricultural production costs and profitability [26,27,28]. In contrast, although seed prices are relatively stable, the market remains controlled by a few companies [29]. The risk of severe price volatility, combined with overly concentrated supply sources, jointly increases the vulnerability of the upstream supply chain.
On the downstream supply side (i.e., export markets), agricultural products are directly linked to social stability. Since supply and demand elasticities are low, the sector is extremely sensitive to external environmental changes [30]. Minor adjustments in international trade policies or shifts in consumer markets can rapidly transmit inversely. These shifts often trigger drastic price shocks [31]. This intertwining of “inflexible demand” and “fragile supply” constitutes the unique dual vulnerability characteristic of agricultural GVCs.

2.3. Theoretical Shift: From External Shocks to Internal Structure

Facing complex challenges, academic research is shifting focus from external shocks to internal network vulnerabilities [32,33]. Current research observes that in internal networks, micro-shocks rarely dissipate. Instead, they amplify into macro-fluctuations via cascading effects [34,35]. This internal risk stems from an economy’s position in the network. Economies occupying hub positions or those overly dependent on specific nodes face higher risks of structural lock-in [36,37]. Empirical analysis suggests that such concentration acts as a conduit for directional risk propagation [38].

2.4. Limitations of Linear Perspectives and the Necessity of Network Analysis

While there is a consensus on the importance of structural risk, existing empirical research remains methodologically limited. Mainstream literature mostly employs linear econometric models or focuses on aggregate trade volumes [39,40]. These approaches isolate industries from their complex interdependent connections, making it difficult to capture cross-industry contagion and indirect path risks in multi-tier supply chains [41,42,43,44]. Most studies lack a unified framework to assess the varied impacts of network structure on both the supply and demand sides [45,46]. This is particularly true regarding the identification of industrial roles at the intersection of domestic and international economic flows [11,47].
Given the “emergence” characteristics of agricultural systems, CNA and Input–Output Networks (IONs) offer a new perspective based on relationships. Related research confirms the value of transforming input–output data into networks [48]. This approach not only identifies hidden transmission backbones but also quantifies structural vulnerability through value-added evolution indicators [49,50,51].

2.5. Research Review and Commentary

Research on GVC risks has significantly expanded from single-market dimensions to network structural perspectives, offering robust theoretical foundations for understanding systemic risk. Yet, the specific evolutionary mechanisms within the agricultural context warrant deeper investigation. Current literature often emphasizes economic attributes while overlooking how agriculture’s unique biological constraints interact with network structures to reshape risk profiles. Additionally, most analyses prioritize unidirectional trade dependence, leaving a gap in unified frameworks that compare the different risk transmission paths between upstream inputs and downstream markets. Moreover, compared to static structural snapshots, there is a pressing need for empirical research on the dynamic evolutionary trajectory of risk and the precise identification of pivotal nodes over time.
To bridge these gaps, this study constructs a supply-demand dual-perspective network framework. We investigate China’s agricultural GVC network through the lenses of dynamic evolution and structural lock-in, aiming to provide a supplement to the existing body of knowledge on agricultural GVC risks.

3. Data and Methods

3.1. Data Sources and Processing

This study drew upon the 2021 edition of the Inter-Country Input–Output (ICIO) database released by the OECD. This dataset provides comprehensive annual cross-country input–output data covering 45 industrial sectors across 77 economies from 1995 to 2020. We selected 2001 to 2020 as the specific observation window. This timeframe is strategically chosen because China’s accession to the WTO in 2001 marked a pivotal milestone in its deep integration into GVCs. Starting from this juncture allows for the most accurate capture of the complete risk evolution trajectory. This enables us to trace the path of China’s agriculture from its initial large-scale embedding in the global division of labor to its recent exposure to complex external shocks.
To ensure the precise identification of structural risks originating from the global market, we summed the input–output vectors of Mainland China, Hong Kong, and Taiwan and internalized the bilateral trade flows between these regions as internal circulation, thereby constructing an aggregated economic entity. This methodological approach is grounded in regional economic realities. Specifically, Hong Kong exhibits an extremely high degree of market integration and policy synergy with the Mainland, functioning effectively as an integral part of China’s internal economic circulation. For Taiwan, our goal is to separate global economic trends from Taiwan’s unique geopolitical situation. Without this separation, we might mistake regional political tension for external market instability, which distorts the final results. Therefore, consolidating these regions allows for a more robust and objective characterization of China’s aggregate status and true risk exposure within the global agricultural value chain.
We grouped sectors with similar production methods and economic roles together, reducing the original 45 sectors to 26 analytical sectors. The correspondence details are provided in Appendix A, and the aggregation results are shown in Table 1. The “Agriculture” sector serves as the core proxy variable for China’s agricultural GVC activities. While this data granularity precludes the distinction of specific product categories, it remains the optimal choice for examining structural risks from a macro-network perspective.

3.2. Network Construction Method

This study constructs the linkage network of China’s agricultural GVC from the dual dimensions of supply and demand, aiming to reveal structural risks inherent in the network by quantifying inter-industry economic dependencies. Statistical analysis of the data from 2001 to 2020 reveals a significant “heavy-tailed” distribution. A vast number of edges represent trivial trade volumes, creating excessive noise that masks the critical structure of the network. To retain network edges with research value, we applied a noise reduction method widely used in complex network analysis [52,53]. We set the filtration threshold at $100,000. Conceptually, this threshold represents the ‘minimum economic scale’ required for a trade link to act as a transmission channel. In the context of macro-level input–output data, flows below this magnitude typically represent sporadic transactions lacking continuity. Therefore, they are insufficient to constitute the Structural Dependencies needed to propagate cascading risks. Empirical tests confirm that this threshold removes approximately 70% of redundant edges while retaining over 99.9% of the total economic flow, thereby ensuring both the research focus and the economic integrity of risk identification.(See Appendix B for details)
To specifically isolate “international” structural risks, we excluded China’s domestic circulation during matrix construction by setting the domestic input–output block to zero. This methodological treatment removes the overwhelming influence of China’s massive domestic market, ensuring that the model remains sensitive to the subtle signals of external shocks.
The nodes of the downstream supply-side network and the upstream demand-side network represent the downstream consumption sectors and the upstream input sectors of China’s agricultural product industry, respectively. Through this dual-dimensional construction, we comprehensively identify the sector nodes related to China’s agricultural product industry.
Following the standard mapping paradigm between input–output economics and network science [48], the edge weights are determined by two core input–output metrics: the Direct Allocation Coefficient and the Direct Consumption Coefficient. These coefficients serve to precisely characterize the direction and intensity of economic dependencies within the network [52].
The direct allocation coefficient r i j measures the dependence of industry j on industry i , and its calculation formula is
r i j = Y i j Y i
In Equation (1), Y i j represents the supply from industry i to industry j , Y i is the total output of industry i , and this coefficient reflects the impact of downstream consumption from other industrial sectors on China’s agricultural product industry.
On the other hand, the direct consumption coefficient a i j measures the dependence of industry i on industry j , and its calculation formula is
a i j = X i j X j
In Equation (2), X i j represents the direct consumption of industry i by industry j , X j is the total output of industry j , and this coefficient reflects the upstream input impact of other industrial sectors on China’s agricultural product industry.
Based on these two coefficients, we define the nodes and edge weights for the supply and demand networks, respectively. By quantifying these coefficients, we accurately map the intensity of economic dependency between industrial sectors.

3.3. Analytical Framework for Structural Risks

3.3.1. Structural Measurement of Risk Exposure

In complex global networks, economic links vary in importance. Structural risk largely stems from the concentration of dependencies. This means the network relies too heavily on a few specific connections. Therefore, to accurately measure risk exposure, we must look beyond simple trade volume and analyze the core group within the network. This requires identifying “Strong Associations”. We define a “strong association” as a critical link where the actual trade intensity significantly exceeds the theoretical “random flow.” Conceptually, this difference proves that the connection is not accidental. It represents a stable, structural preference in the supply chain. To identify these strong association nodes, we employ a data-driven approach combining Entropy Difference Contribution and the Weaver Index (WI).
Drawing on information theory [54], we introduce the concept of “Entropy Difference Contribution” to quantify the marginal contribution of individual nodes to the overall structural diversity of the system. Information entropy serves as a metric for system uncertainty and order; a significant decline in system entropy following the removal of a specific node indicates its critical supporting role in maintaining network structural stability. Crucially, information entropy measures the degree of concentration within a distribution rather than its absolute magnitude. This scale-invariant property eliminates inherent scale discrepancies between supply side and demand side coefficients, ensuring the theoretical comparability of risk levels across both network dimensions.
Assuming a core node connects with N partners with a connection strength set W = w 1 , w 2 , , w N , we first normalize these strengths into a probability distribution p i , calculated as
p i = w i j = 1 N w j
In Equation (3), w i represents the raw connection strength with partner i , and the denominator represents the total connection strength of the core node. Consequently, p i reflects the relative importance or proportion of partner i within the node’s total economic dependency structure.
The initial system information entropy ( H t o t a l ) is calculated as
H t o t a l = i = 1 N p i ln p i
In Equation (4), N denotes the total number of partners, and p i is the probability derived from the normalized weights. This entropy value quantifies the overall dispersion of the node’s dependencies. A higher value implies a more balanced distribution of connections, whereas a lower value indicates a highly concentrated structure.
Subsequently, we simulate a scenario of node i failure (i.e., removal of the connection) to derive the Entropy Difference Contribution Δ H i of node i , calculated as
Δ H i = H t o t a l H i
In Equation (5), H i represents the network entropy after the failure of node i . A larger Δ H i indicates that the node bears a higher level of structural risk.
The calculated entropy difference contribution sequence is normalized, and the WI is then employed to adaptively determine the optimal cutoff number k for strongly connected nodes.(See Appendix C for details) The WI seeks an optimal partition point such that the contribution distribution of the selected top k nodes most closely approximates a uniform distribution model (assuming equal dependency of the core node on these k partners, i.e., a contribution rate of 1 k ), while the contributions of the remaining nodes approach zero. Its calculation formula is
W k = i = 1 k Δ H i 1 k 2 + j = k + 1 N Δ H j 2
In Equation (6), Δ H i is the normalized entropy difference contribution and W k represents the goodness-of-fit variance. By iteratively calculating and minimizing the W k . value ( min W k ), we identify k strongly connected nodes.
Based on this identified core set, we synthesize the two dimensions of breadth and depth to calculate the Structural Risk Exposure Index (SREI).
The breadth risk ( R s t r o n g ) corresponds to the group size of strongly connected nodes. It is calculated as
R s t r o n g = k N
In Equation (7), k is the number of strongly connected nodes identified by the WI, and N is the total number of connected nodes. This ratio reveals the concentration level of the value chain in terms of connection breadth. A lower value implies that dependency is concentrated on fewer partners.
The depth risk ( I strong ) corresponds to the connection strength held by these core nodes. It is calculated as
I strong = i k w i j N w j
In Equation (8), w i and w j represent the connection strength (i.e., direct consumption or allocation coefficient value) of individual associations, respectively. i k w i is the sum of the connection strengths of all k nodes identified as strong associations, while j N w j is the total connection strength of all N associated nodes. A higher I strong value indicates deeper dependence on a few key partners.
Finally, the SREI is defined as
S R E I = 1 R strong × I strong
In Equation (9), the SREI ranges from [0, 1]. A value of 1 characterizes a network with an absolutely monopolized structure. This indicates maximum risk exposure. Conversely, a value of 0 implies a perfectly balanced dependency structure. The index satisfies dual monotonicity. It strictly increases with depth risk ( I strong ) and strictly decreases with breadth risk ( R strong ).
Given the “heavy-tailed” distribution characteristic identified earlier, traditional metrics such as the Herfindahl–Hirschman Index (HHI) or Entropy are prone to distortion due to “dilution bias.” In these metrics, the influx of numerous low-volume partners mechanically dilutes the concentration values, thereby generating a “false sense of security.”
SREI addresses this problem by introducing a penalty mechanism for “ineffective expansion.” By contrasting the effective core ( k ) with the total number of partners ( N ), it exposes the structural paradox of “breadth expansion and depth lock-in.” Operationally, if the network only expands at the periphery where N increases while the core remains static where k remains constant, the SREI value will rise. This signals a “structural illusion of safety.” It represents a superficial form of diversification that fails to dilute the substantive reliance on a few dominant nodes. This specific vulnerability is exactly what traditional metrics often ignore.
To intuitively show this mechanism, we constructed a comparative experiment using an “illustrative network.” We simulated a structural shift from a “Multi-Polar Balanced Network” to a “Monopolistic Fragmented Network.”
As illustrated in Figure 1a, Scenario A represents a stable structure with 5 partners. Trade dependency is evenly distributed among three core pillars (each holding a 30% share). In this state, the SREI stands at 0.36, reflecting a balanced dependency on multiple strong nodes.
As shown in Figure 1b, Scenario B simulates a deceptive expansion. The network size expands to 15 partners, creating an illusion of diversification. However, the internal structure deteriorates: the top partner strengthens its monopoly (share rising to 50%), while the other original pillars collapse and are replaced by 14 trivial micro-partners.
The calculation results in Table 2 reveal how SREI penetrates this illusion. While the total number of partners increases, the effective core shrinks from 3 to 1. Consequently, the collapse in breadth amplifies the breadth risk factor, which interacts with the intensified depth. This drives the SREI up significantly to 0.47, correctly flagging the transition to a high-risk structure.

3.3.2. Risk Transmission Backbone Network Extraction

The overall network on both the supply and demand sides is highly dense. It contains redundant information that makes it difficult to directly identify the core channels of risk transmission. To address this, we extract a “Risk Transmission Backbone Network.” Functioning as the system’s ‘highways,’ this structure filters out the background noise of trivial trade to isolate the critical arteries where risk transmission is most intense and destructive. The intensity of risk spillover is often positively correlated with the strength of the association [43]. Based on this, we infer that the key paths of risk transmission closely align with those exhibiting the strongest cumulative economic dependencies. Standard graph theory algorithms like the Dijkstra algorithm are designed to solve “shortest path” problems rather than “strongest path” problems. To leverage these mature and efficient algorithms, we apply a Logarithmic Transformation. This converts the economic problem of identifying the “strongest economic dependency paths” into a “shortest path” problem. We transform the original economic linkage strength ( w i j ) into the path distance ( d i j ). The calculation formula is
d i j = log 1 w i j
In Equation (10), d i j is the path distance from node i to node j . w i j is the original economic connection strength. Through this transformation, a higher value of economic strength ( w i j ) results in a lower value of path distance ( d i j ). Simultaneously, edges with zero or near-zero weights are transformed into infinite distances, ensuring they are automatically excluded from the backbone network.
This transformation is not merely a mathematical technique but is grounded in the economic logic of risk propagation. In the context of GVCs, risk transmission behaves as a cascading chain reaction where the impact intensity accumulates multiplicatively across links (e.g., A B C ). According to the properties of logarithms, minimizing the sum of path distances ( d i j ) is mathematically equivalent to maximizing the product of edge weights ( w i j ) along the path. Therefore, this approach ensures that the extracted backbone represents the channel with the highest cumulative transmission probability, accurately capturing the multiplicative nature of chain reactions rather than simply counting the fewest physical steps.
We designate “Chinese Agriculture” as the core node and apply Dijkstra’s algorithm to the distance-weighted directed network. Crucially, the path-solving direction depends on the risk transmission logic. For the downstream supply-side network, we compute the shortest paths from the core to all global consumption sectors. This maps the outward propagation of supply shocks. Conversely, for the upstream demand-side network, we trace the shortest paths from global input sectors to the core. This reverse mapping identifies the origins of input risks. These two parallel processes construct the “Downstream Supply-Side Risk Transmission Backbone” and the “Upstream Demand-Side Risk Transmission Backbone,” respectively.
The analysis of risk transmission focuses on identifying its core pathways and distinguishing its transmission modes. The nature of risks varies significantly depending on the level of transmission. Direct risks originating from first-tier partners differ markedly from indirect risks transmitted through multiple levels. These differences appear in early warning difficulty, impact lag, and intervention strategies. Therefore, based on the backbone network, we employ the Breadth-First Search (BFS) algorithm to systematically calculate the shortest distance ( d t o p o ) from all other nodes to the source point.
The algorithm initializes at the core node and expands outward. In the first iteration, it identifies all immediately adjacent nodes, assigning them a distance of d t o p o = 1 . These constitute the direct transmission nodes, forming the immediate impact interface. Subsequently, the algorithm advances to the neighbors of these nodes. Any node not previously visited is assigned a distance of d t o p o 2 and classified as indirect transmission nodes. This iterative discovery process mathematically segregates the network into distinct risk layers, where deeper layers imply longer reaction buffers and transmission delays.

3.3.3. Identification of Key Risk Transmission Nodes

To accurately identify key transmission nodes that exert critical influence on risk transmission within the network, we construct a comprehensive identification framework. This framework extends from static importance measurement to dynamic risk diagnosis. At the static level, we adopt Weighted Degree Centrality (WDC) as the fundamental metric for screening key transmission nodes. Unlike traditional degree metrics that merely count the number of edges, WDC fully accounts for the variations in connection strengths. This enables a more accurate measurement of the substantive economic flow carried by nodes within Input–Output Networks [48]. For any node i in the network, its weighted degree centrality, W D C ( i ) , is defined as the sum of all inflow and outflow weights associated with that node. The calculation formula is expressed as
W D C ( i ) = j = 1 N w j i + k = 1 N w i k
In Equation (11), N represents the total number of network nodes, w j i represents the input weight flowing from node j to node i , and w i k represents the output weight flowing from node i to node k .
However, as a typical Complex Adaptive System (CAS), China’s agricultural GVC network exhibits significant “emergence” and “cascading effects” in its risk evolution [4]. Relying solely on static snapshots cannot reveal the full picture of risks. In light of this, we introduce a Rolling Window mechanism to extend static slices into dynamic continuous diagnosis [55]. We set the observation window at 5 years. This choice is grounded in both China’s economic cycles and a necessary methodological balance. Structural changes in China’s agriculture often follow the pace of the national “Five-Year Plans.” A 5-year span aligns with this policy rhythm. This allows us to accurately capture cyclical changes driven by government policies. Simultaneously, this duration strikes a balance between sensitivity and stability. It avoids the short-term random fluctuations that come with smaller windows. It also prevents the loss of key evolutionary details that can happen with larger windows. This ensures we can reveal the true path of risk evolution.
Building on this mechanism, dynamic risk is decomposed into trend risk and uncertainty risk. Trend risk focuses on the evolutionary direction of nodal influence. It is calculated by performing a simple linear regression fit on the WDC of node i within observation phase T . The formula is
C i T ( t ) = α i T + β i T t + ε i T
In Equation (12), α i T is the intercept, ε i T is the random disturbance term, and β i T is the trend risk coefficient of node i in observation phase T . The nature of this coefficient directly reflects the structural characteristics of nodal evolution: if β i T > 0 , it indicates that the node’s status in the network is on a continuous upward trajectory. This monotonic increase in dependence on a single node reveals the “Lock-in” effect warned of in industrial cluster theory [37], implying the network is gradually losing its space for diversified choices; conversely, if β i T 0 , it implies the node’s influence is becoming marginalized.
Uncertainty risk measures the stability of a node as a hub, identifying vulnerable points where intense fluctuations disrupt supply chain expectations. The calculation of this metric introduces a relative perspective, based on the degree of deviation between the variance of the node’s own WDC and the average WDC variance of all key nodes within observation phase T . Its calculation formula is
U i T = S i T 2 S T 2 ¯
In Equation (13), U i T represents the uncertainty risk of node i in observation phase T ; S i T 2 is the WDC variance of node i , reflecting its own fluctuation amplitude; and S T 2 ¯ is the average WDC variance of all key nodes in the same period, representing the system’s benchmark fluctuation level. When U i T > 0 , it means node i ‘s volatility exceeds the core network’s average. Such abnormal oscillation seriously weakens supply chain predictability, running counter to the goal of building a “Resilient Supply Chain,” thus classifying it as a high-risk node. Conversely, when U i T 0 , it indicates the node is relatively robust. This suggests it plays a role in maintaining network stability.

4. Results

Drawing upon the methodology and data framework established previously, this chapter presents an empirical study on the structural risks of China’s agricultural GVC network. We first quantify the structural characteristics of risk exposure. Subsequently, we identify the risk transmission backbone network responsible for carrying risk flows. We then examine its transmission structure and diagnose the key risk nodes within this critical sub-network.

4.1. Structural Characteristics of Risk Exposure

We outline the basic structure and core characteristics of risk exposure in China’s agricultural GVC network by examining the breadth and depth of associations, along with the dynamic evolution of the SREI determined by these two dimensions.
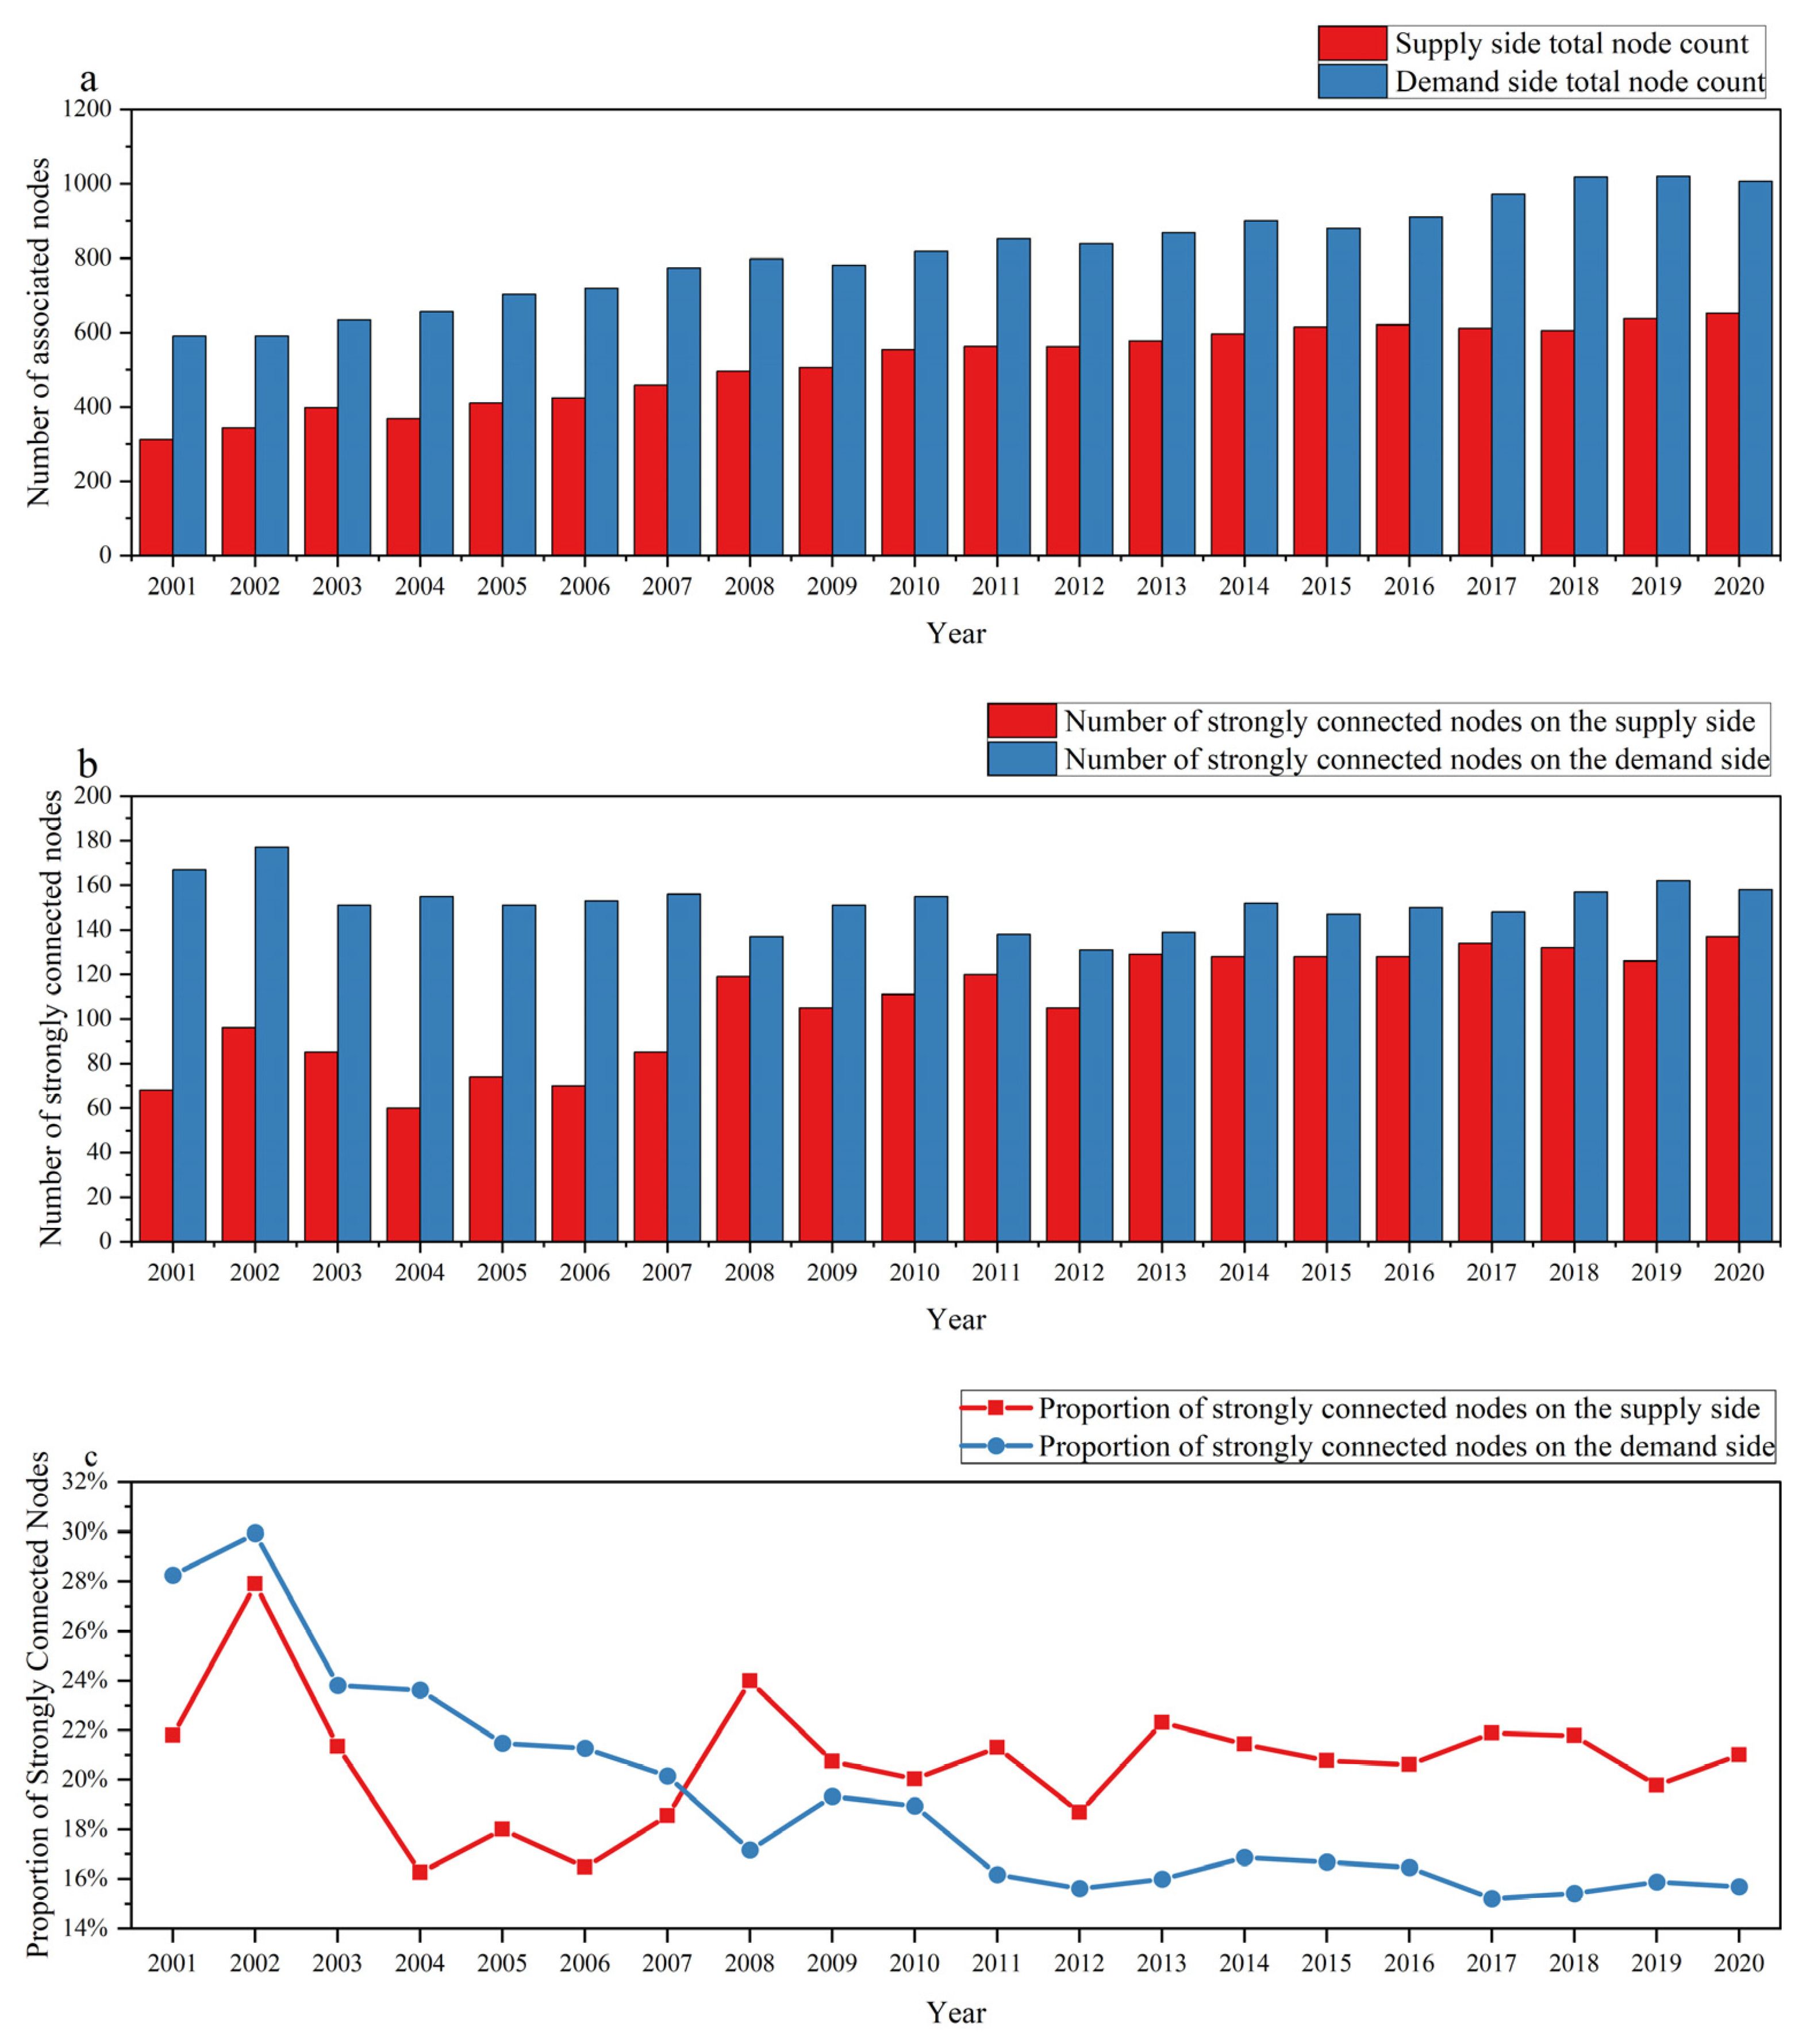
The scope of China’s agricultural product participation in GVCs expanded significantly between 2001 and 2020. As shown in Figure 2a, the number of associated nodes on the downstream supply side increased from 312 in 2001 to 652 in 2020. Meanwhile, the upstream demand side saw an increase from 591 to 1007. This indicates that the number of international partners for China’s agricultural products is continuously increasing. A distinct structural feature is that the scale of the upstream demand-side network consistently exceeds that of the downstream supply side. This implies that the sources of upstream inputs for China’s agricultural products are much broader than the destination markets for its downstream consumption.
However, the expansion of associated partners does not equate to the dispersion of dependencies. As shown in Figure 2b,c, the number of core partners identified as “strongly associated” exhibits different evolutionary patterns within the expanding overall network. The number of strongly associated nodes on the downstream supply side fluctuates but grows synchronously with the overall network. Their proportion relative to the total number of nodes fluctuates around 20%. This shows no significant trend toward centralization. In contrast, the number of strongly associated nodes on the upstream demand side remained stable at around 150 over the 20-year period. It did not increase significantly as the overall network expanded. This phenomenon led to a significant long-term decline in the proportion of strongly associated nodes on the upstream demand side. This ratio shrank from nearly 30% in 2002 to approximately 16% after 2017. This reveals a key structural shift. China’s agricultural upstream input dependency is increasingly concentrated on a core group of partners. While the size of this group remains stable, its relative proportion is continuously shrinking.
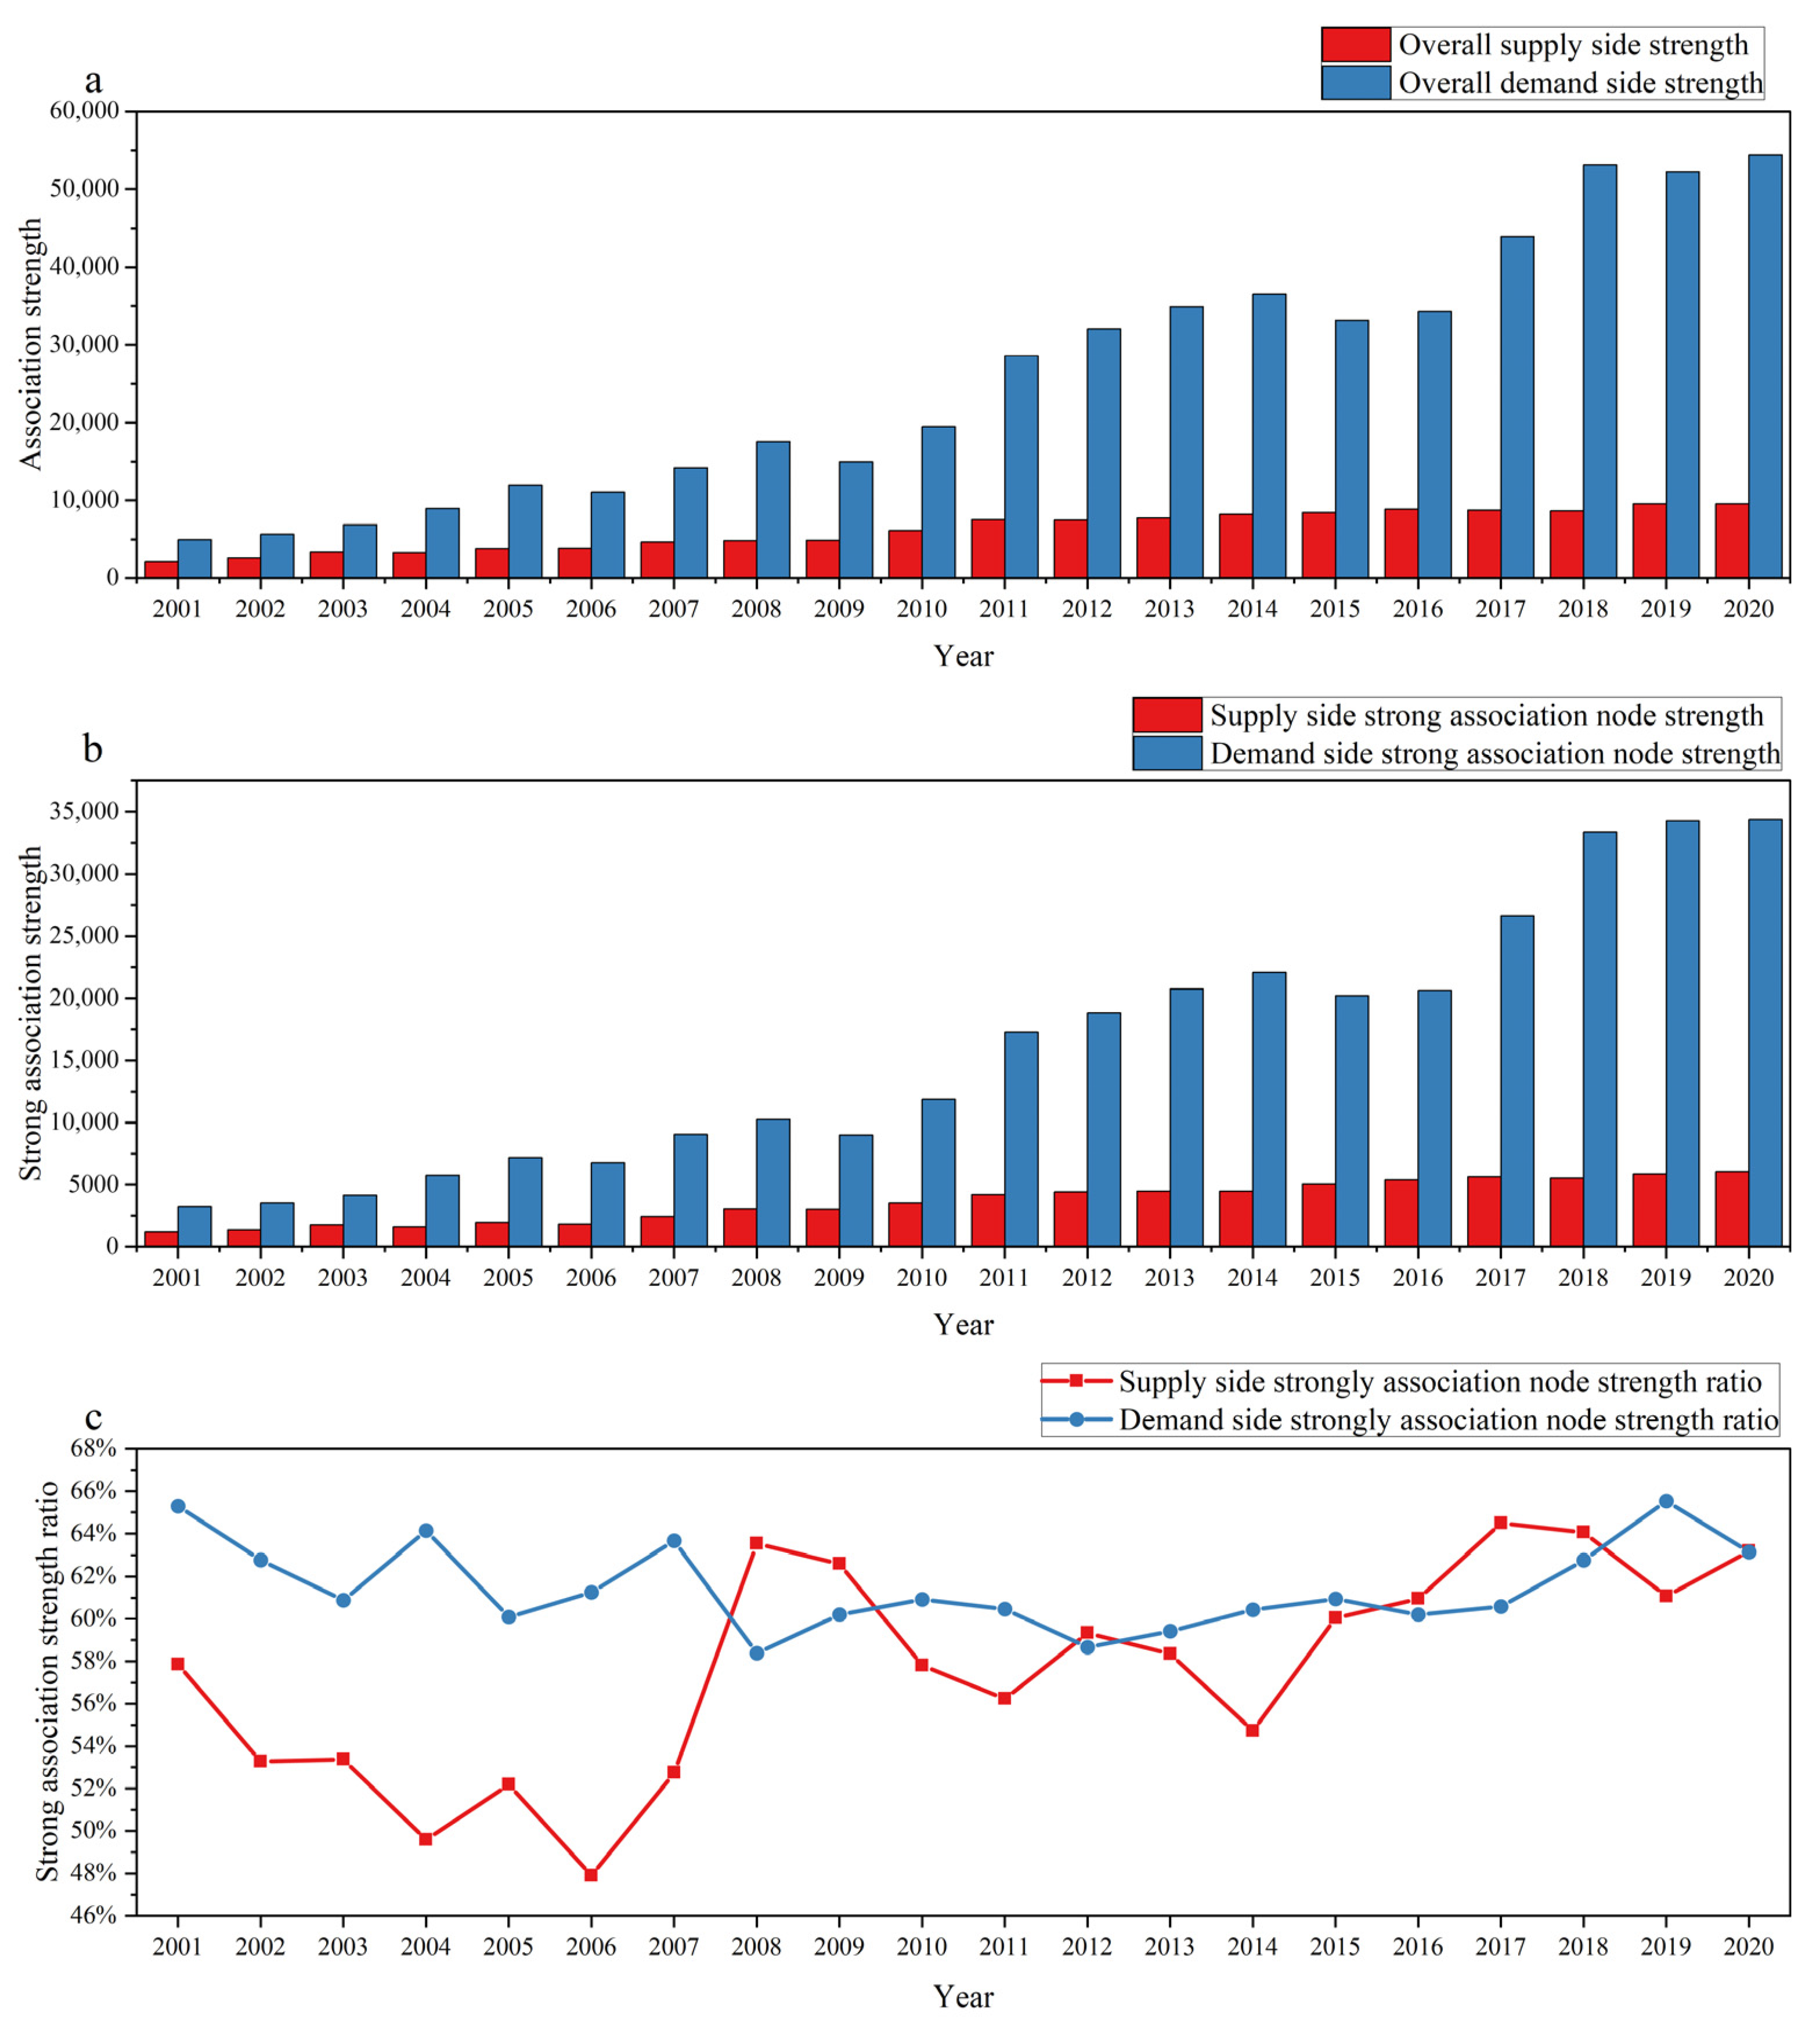
From the perspective of network depth, the total economic linkages of China’s agricultural GVC are also continuously rising. As shown in Figure 3a, the total linkage strength of both the downstream supply side and the upstream demand side shows a clear growth trend. The growth of the upstream demand side is particularly rapid. Its total strength consistently remains several times that of the downstream supply side. However, as shown in Figure 3b,c, the majority of this growth is contributed by a few strongly linked nodes. On the upstream demand side, the strength held by strongly linked nodes has remained stable at over 60% for a long period. This means that about 16% of core suppliers contribute more than 60% of the total input dependence. Although the proportion on the downstream supply side fluctuates significantly, it also generally remains above 50%. This result indicates that the stability of China’s agricultural product value chain largely depends on a few key trading partners. This forms a dependency structure dominated by the “critical few.”
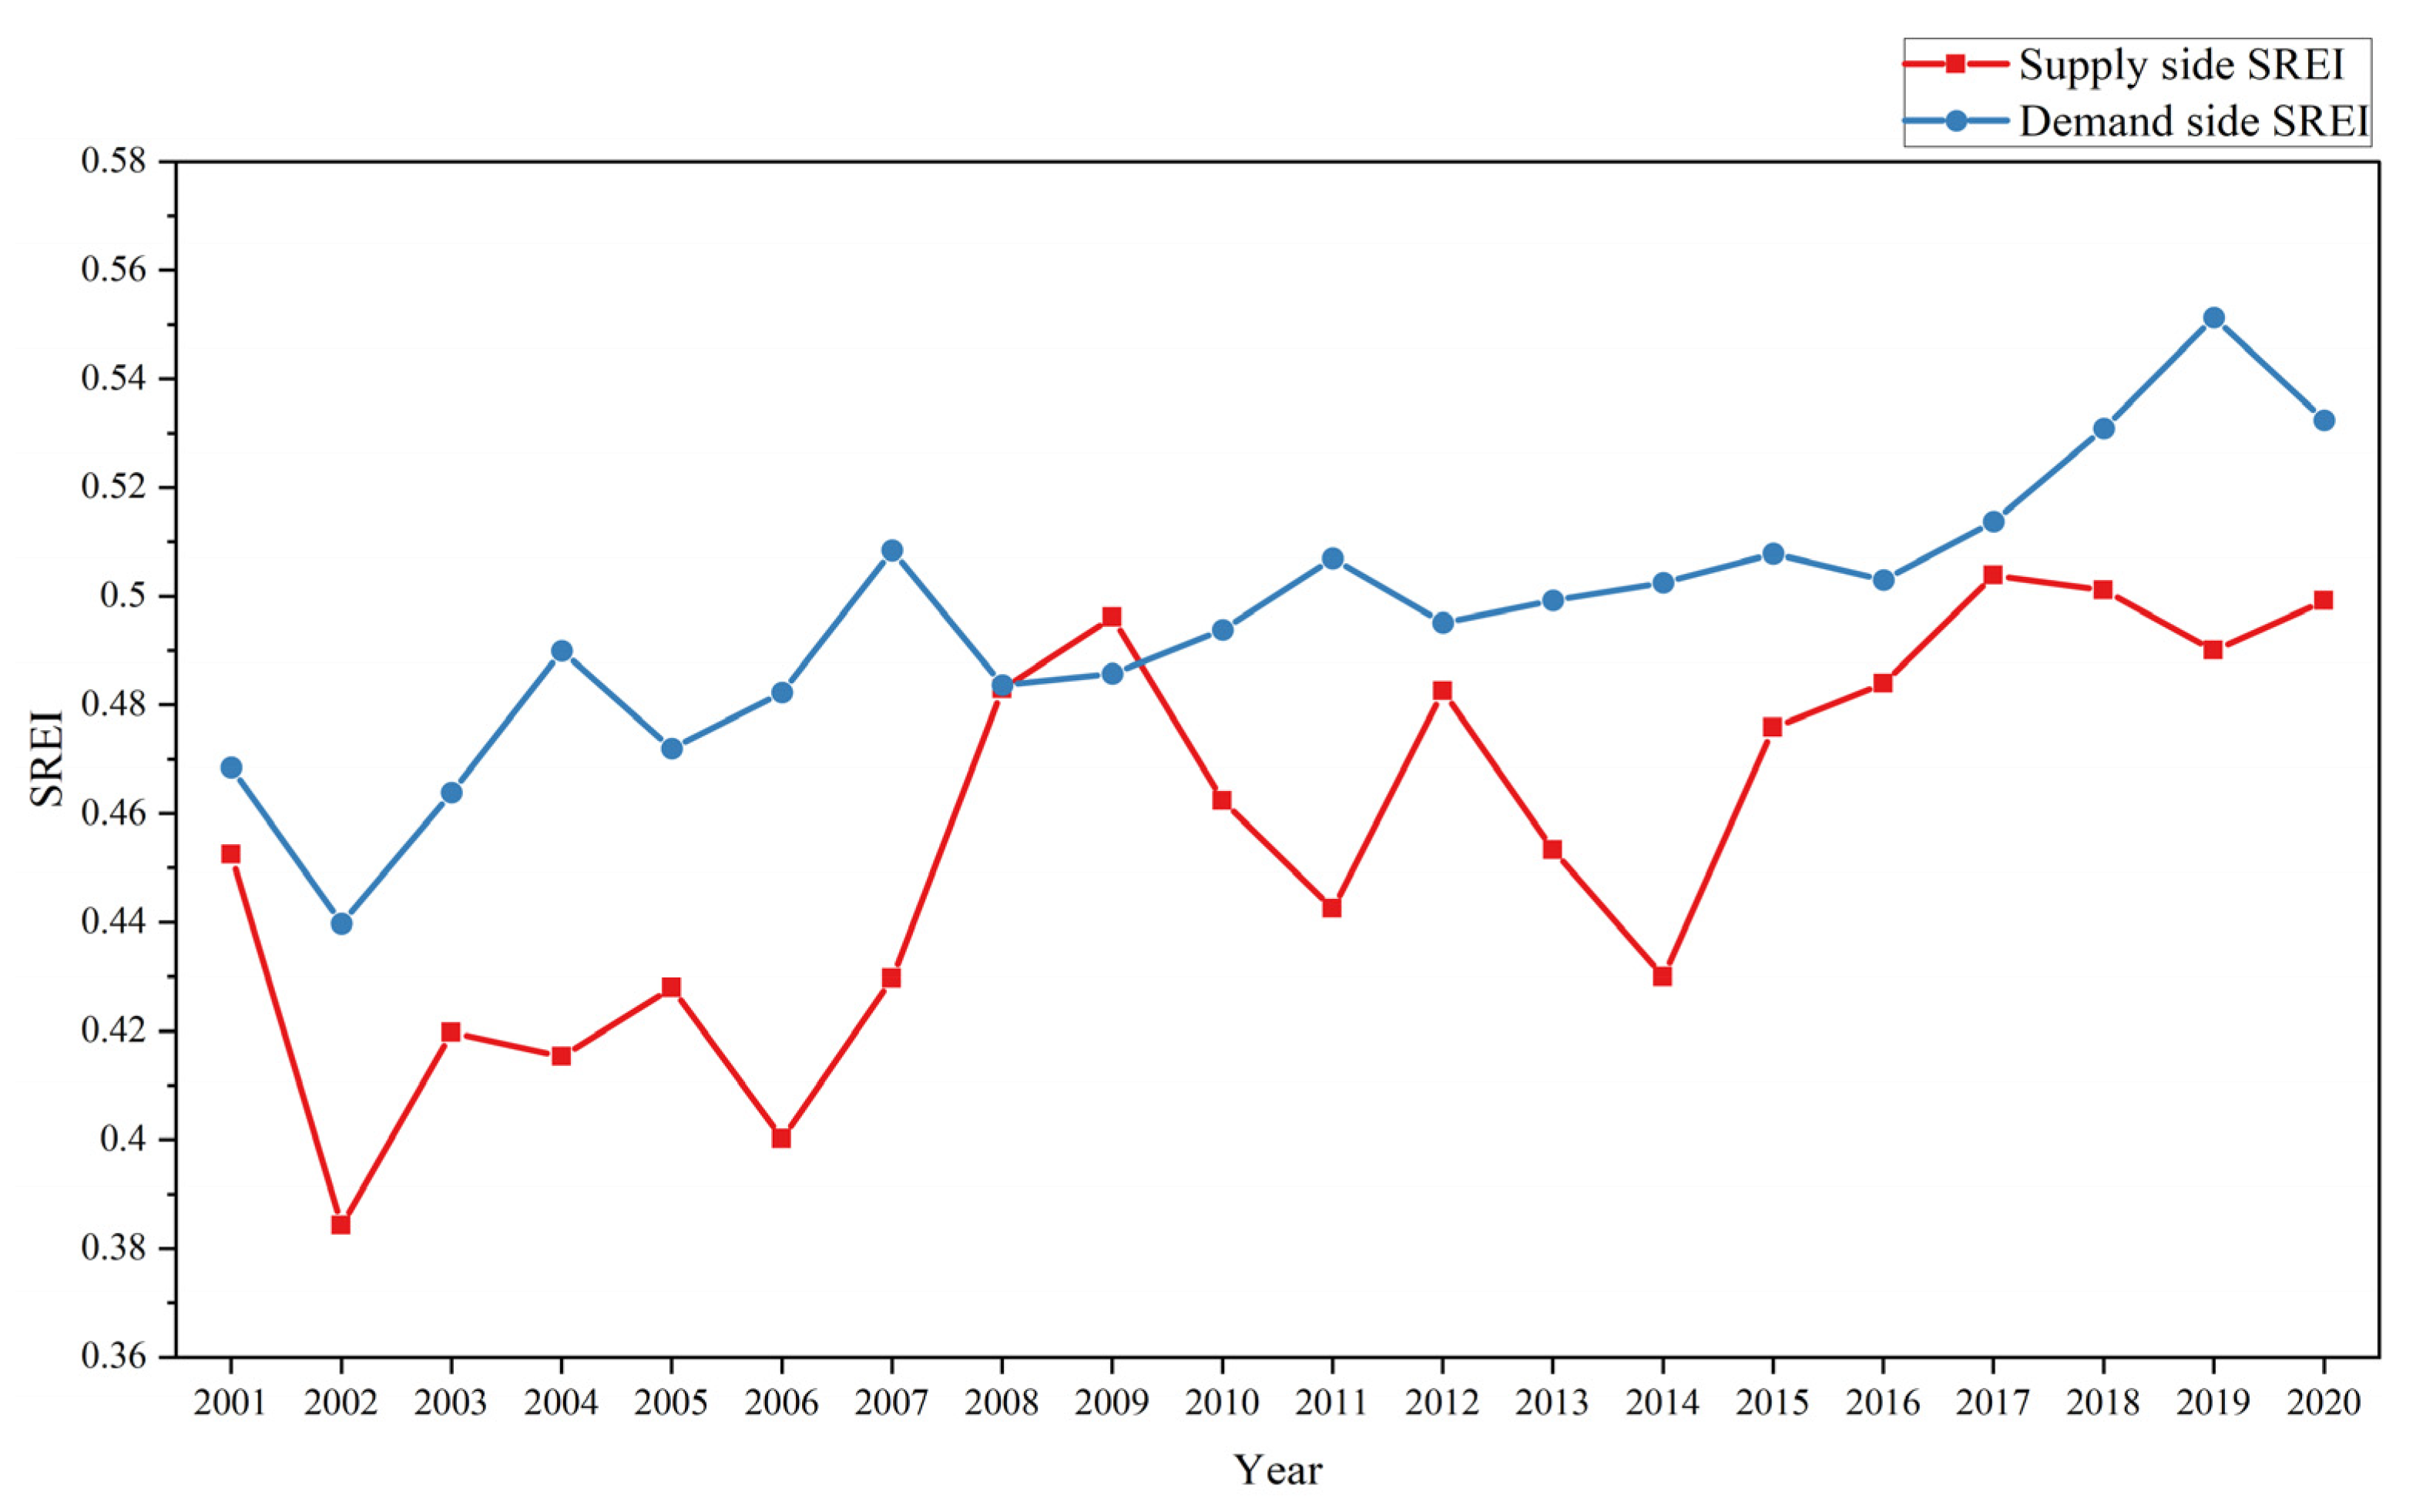
We integrated the breadth and depth perspectives to measure the risk exposure of China’s agricultural GVC network through the SREI. As shown in Figure 4, between 2001 and 2020, the risk exposure on both the supply and demand sides showed a significant upward trend. The SREI on the upstream demand side fluctuated and rose from around 0.47 to over 0.53. In most years, it was higher than that on the downstream supply side. The core driving force behind this trend is the combined effect of the continuous increase in the concentration of upstream partners and the sustained high level of economic connection strength. Although the SREI on the downstream supply side fluctuated sharply, it has shown a clear upward shift in its central level since 2012. Overall, the structural risk exposure of China’s agricultural products continued to expand during the research period. This is especially evident on the upstream demand side. The network has formed a pattern of “concentrated dependency” on a few core partners. This makes the value chain more sensitive and vulnerable to external shocks originating from these key nodes.

4.2. Risk Transmission Backbone Network Analysis

Having identified the structural characteristics of overall risk exposure, we now delve into the backbone network of risk transmission. We analyze its transmission distance and compositional evolution.
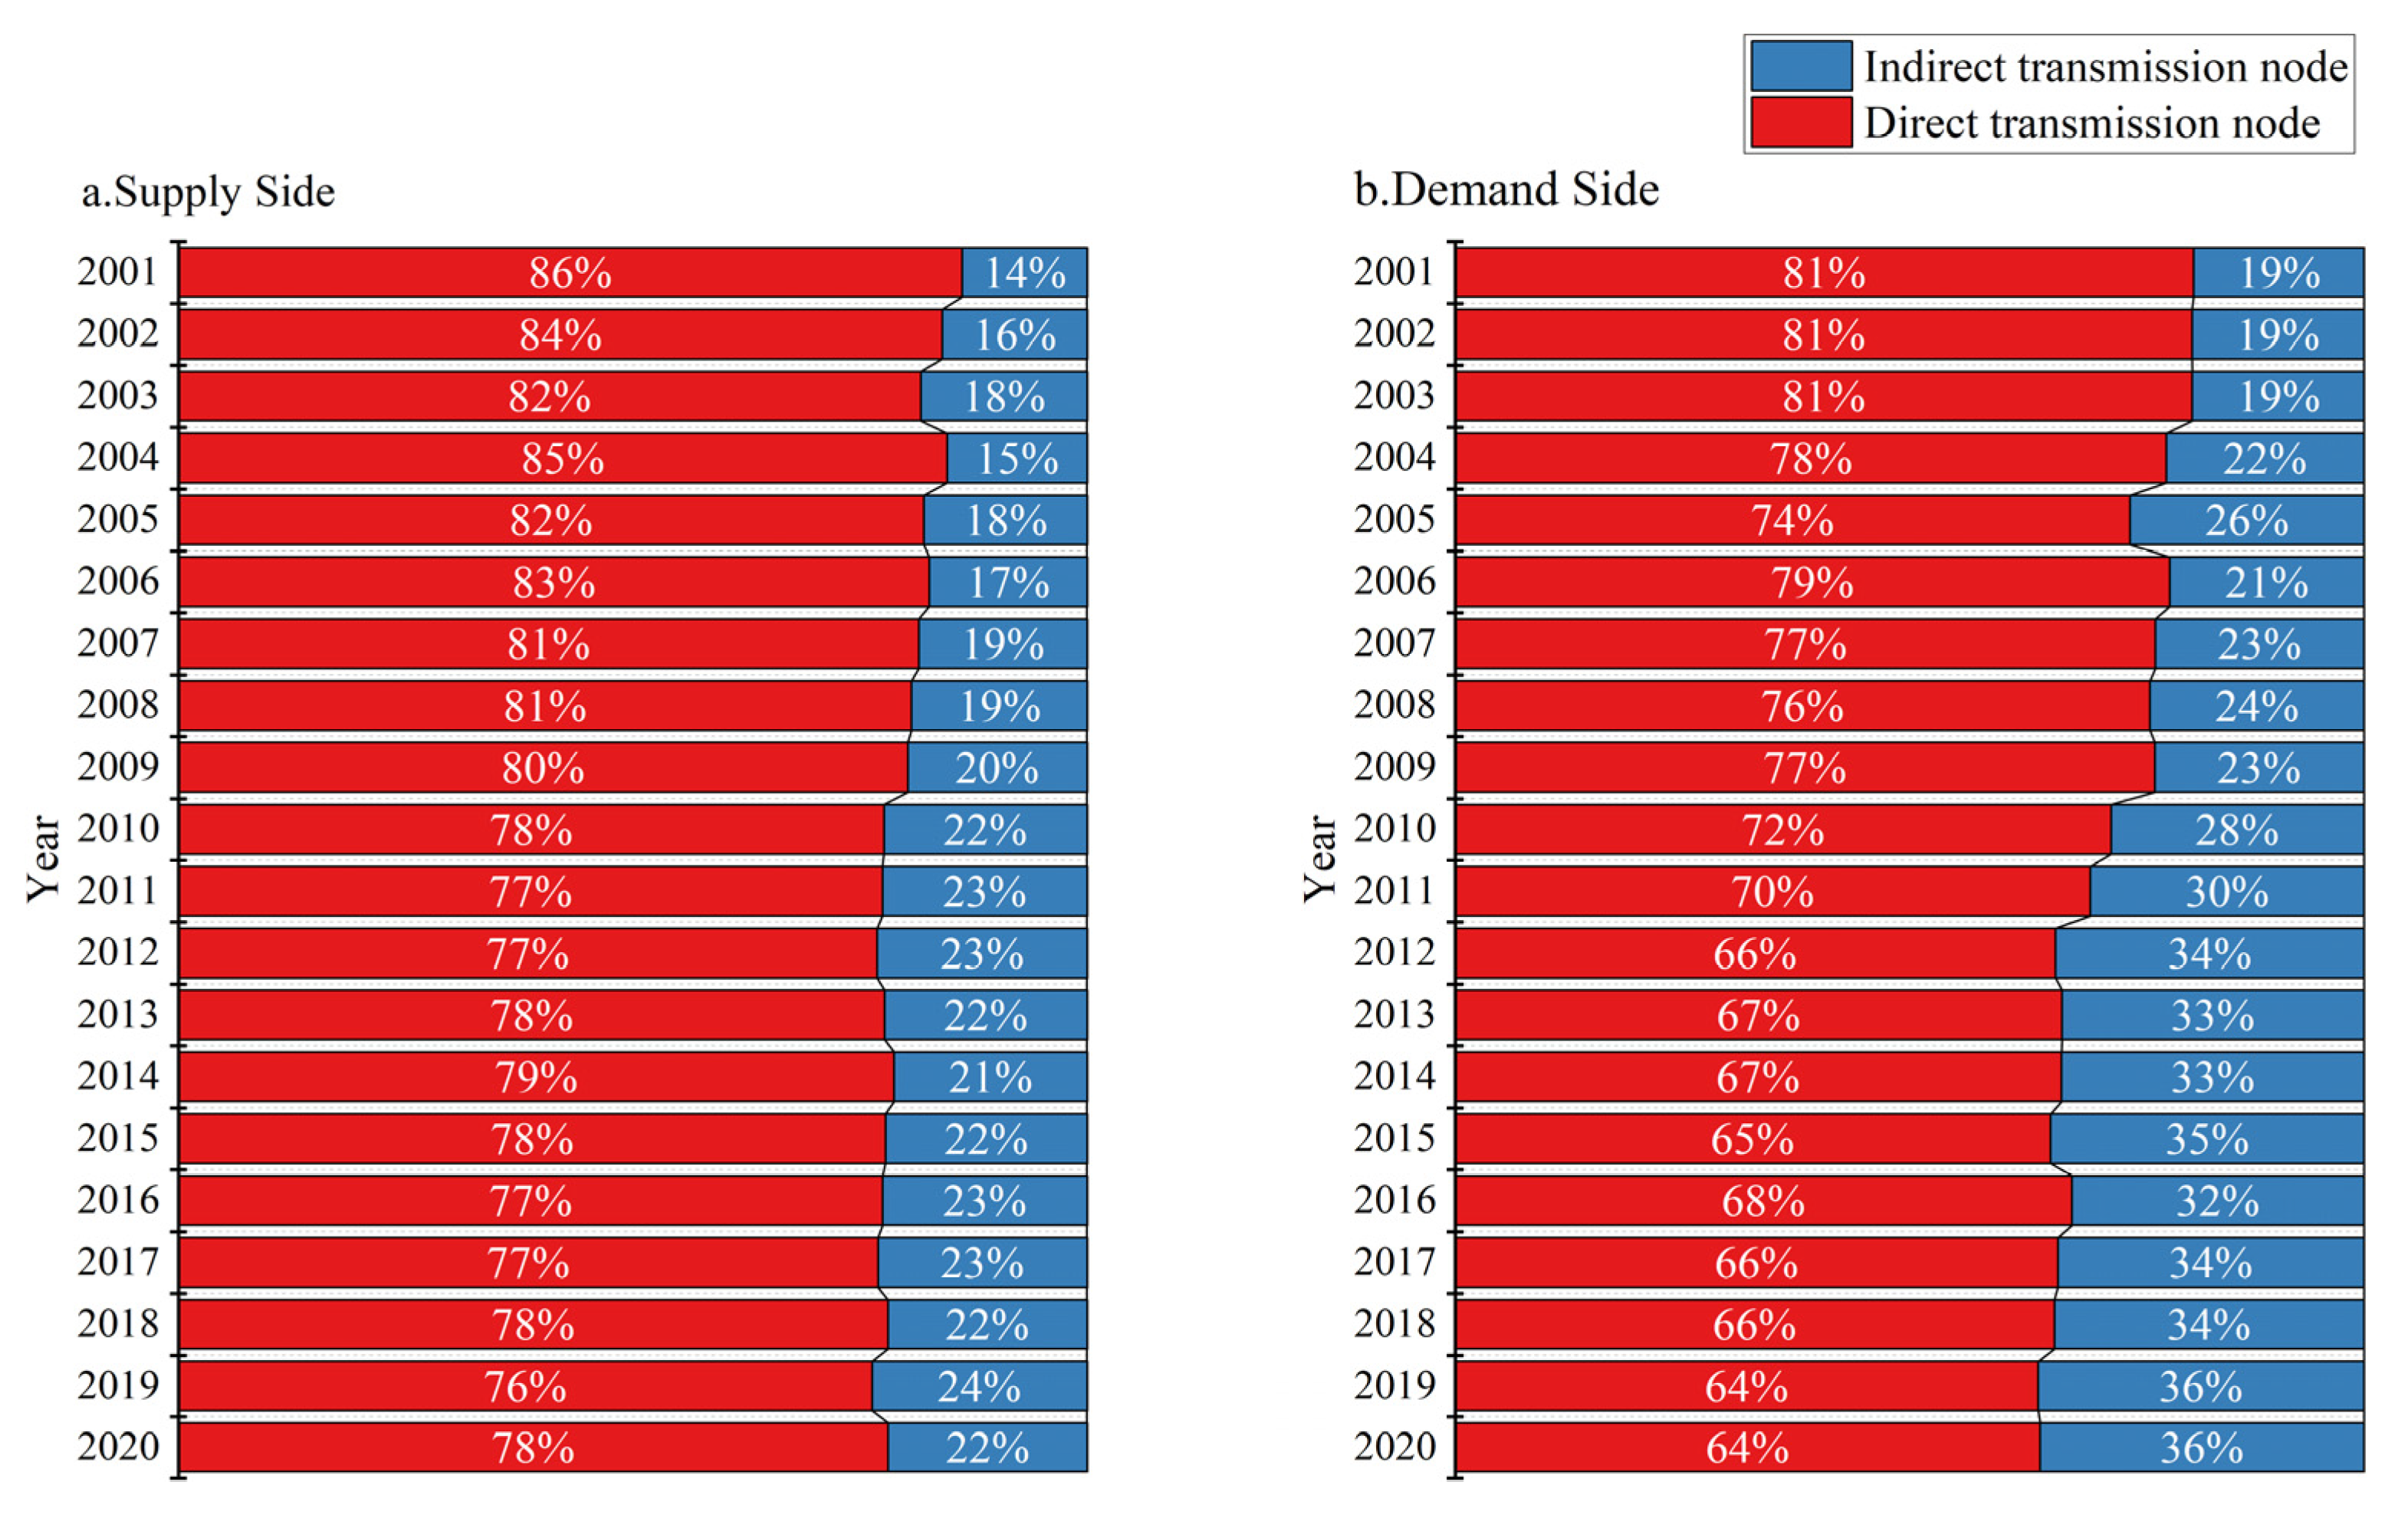
Risk transmission in China’s agricultural GVC presents a noteworthy structural characteristic. Although risk exposure on both the supply and demand sides continues to expand, the proportion of direct risk transmission is declining. This is particularly evident on the upstream demand side. As shown in Figure 5, the proportion of direct transmission nodes in the upstream backbone network continuously decreased from over 81% in 2001 to about 64% in 2020. Conversely, the proportion of indirect transmission nodes rose from less than 19% to around 36%. The downstream supply side exhibits a similar trend. The proportion of direct transmission nodes slowly decreased from 86.22% to 78.07%.
This structural shift reveals the underlying driver of the overall increase in risk exposure. The sources of risk are shifting from explicit and directly observable first-tier partners to more concealed and harder-to-track multi-tier indirect partners. Simultaneously, the supply chain of China’s agricultural GVC is becoming longer and more complex. This increases the uncertainty and fragility of the entire system. It indicates that the potential for supply chain disruption faced by China’s agricultural products is becoming increasingly indirect. Consequently, the difficulty of tracing and controlling these risks is also rising.
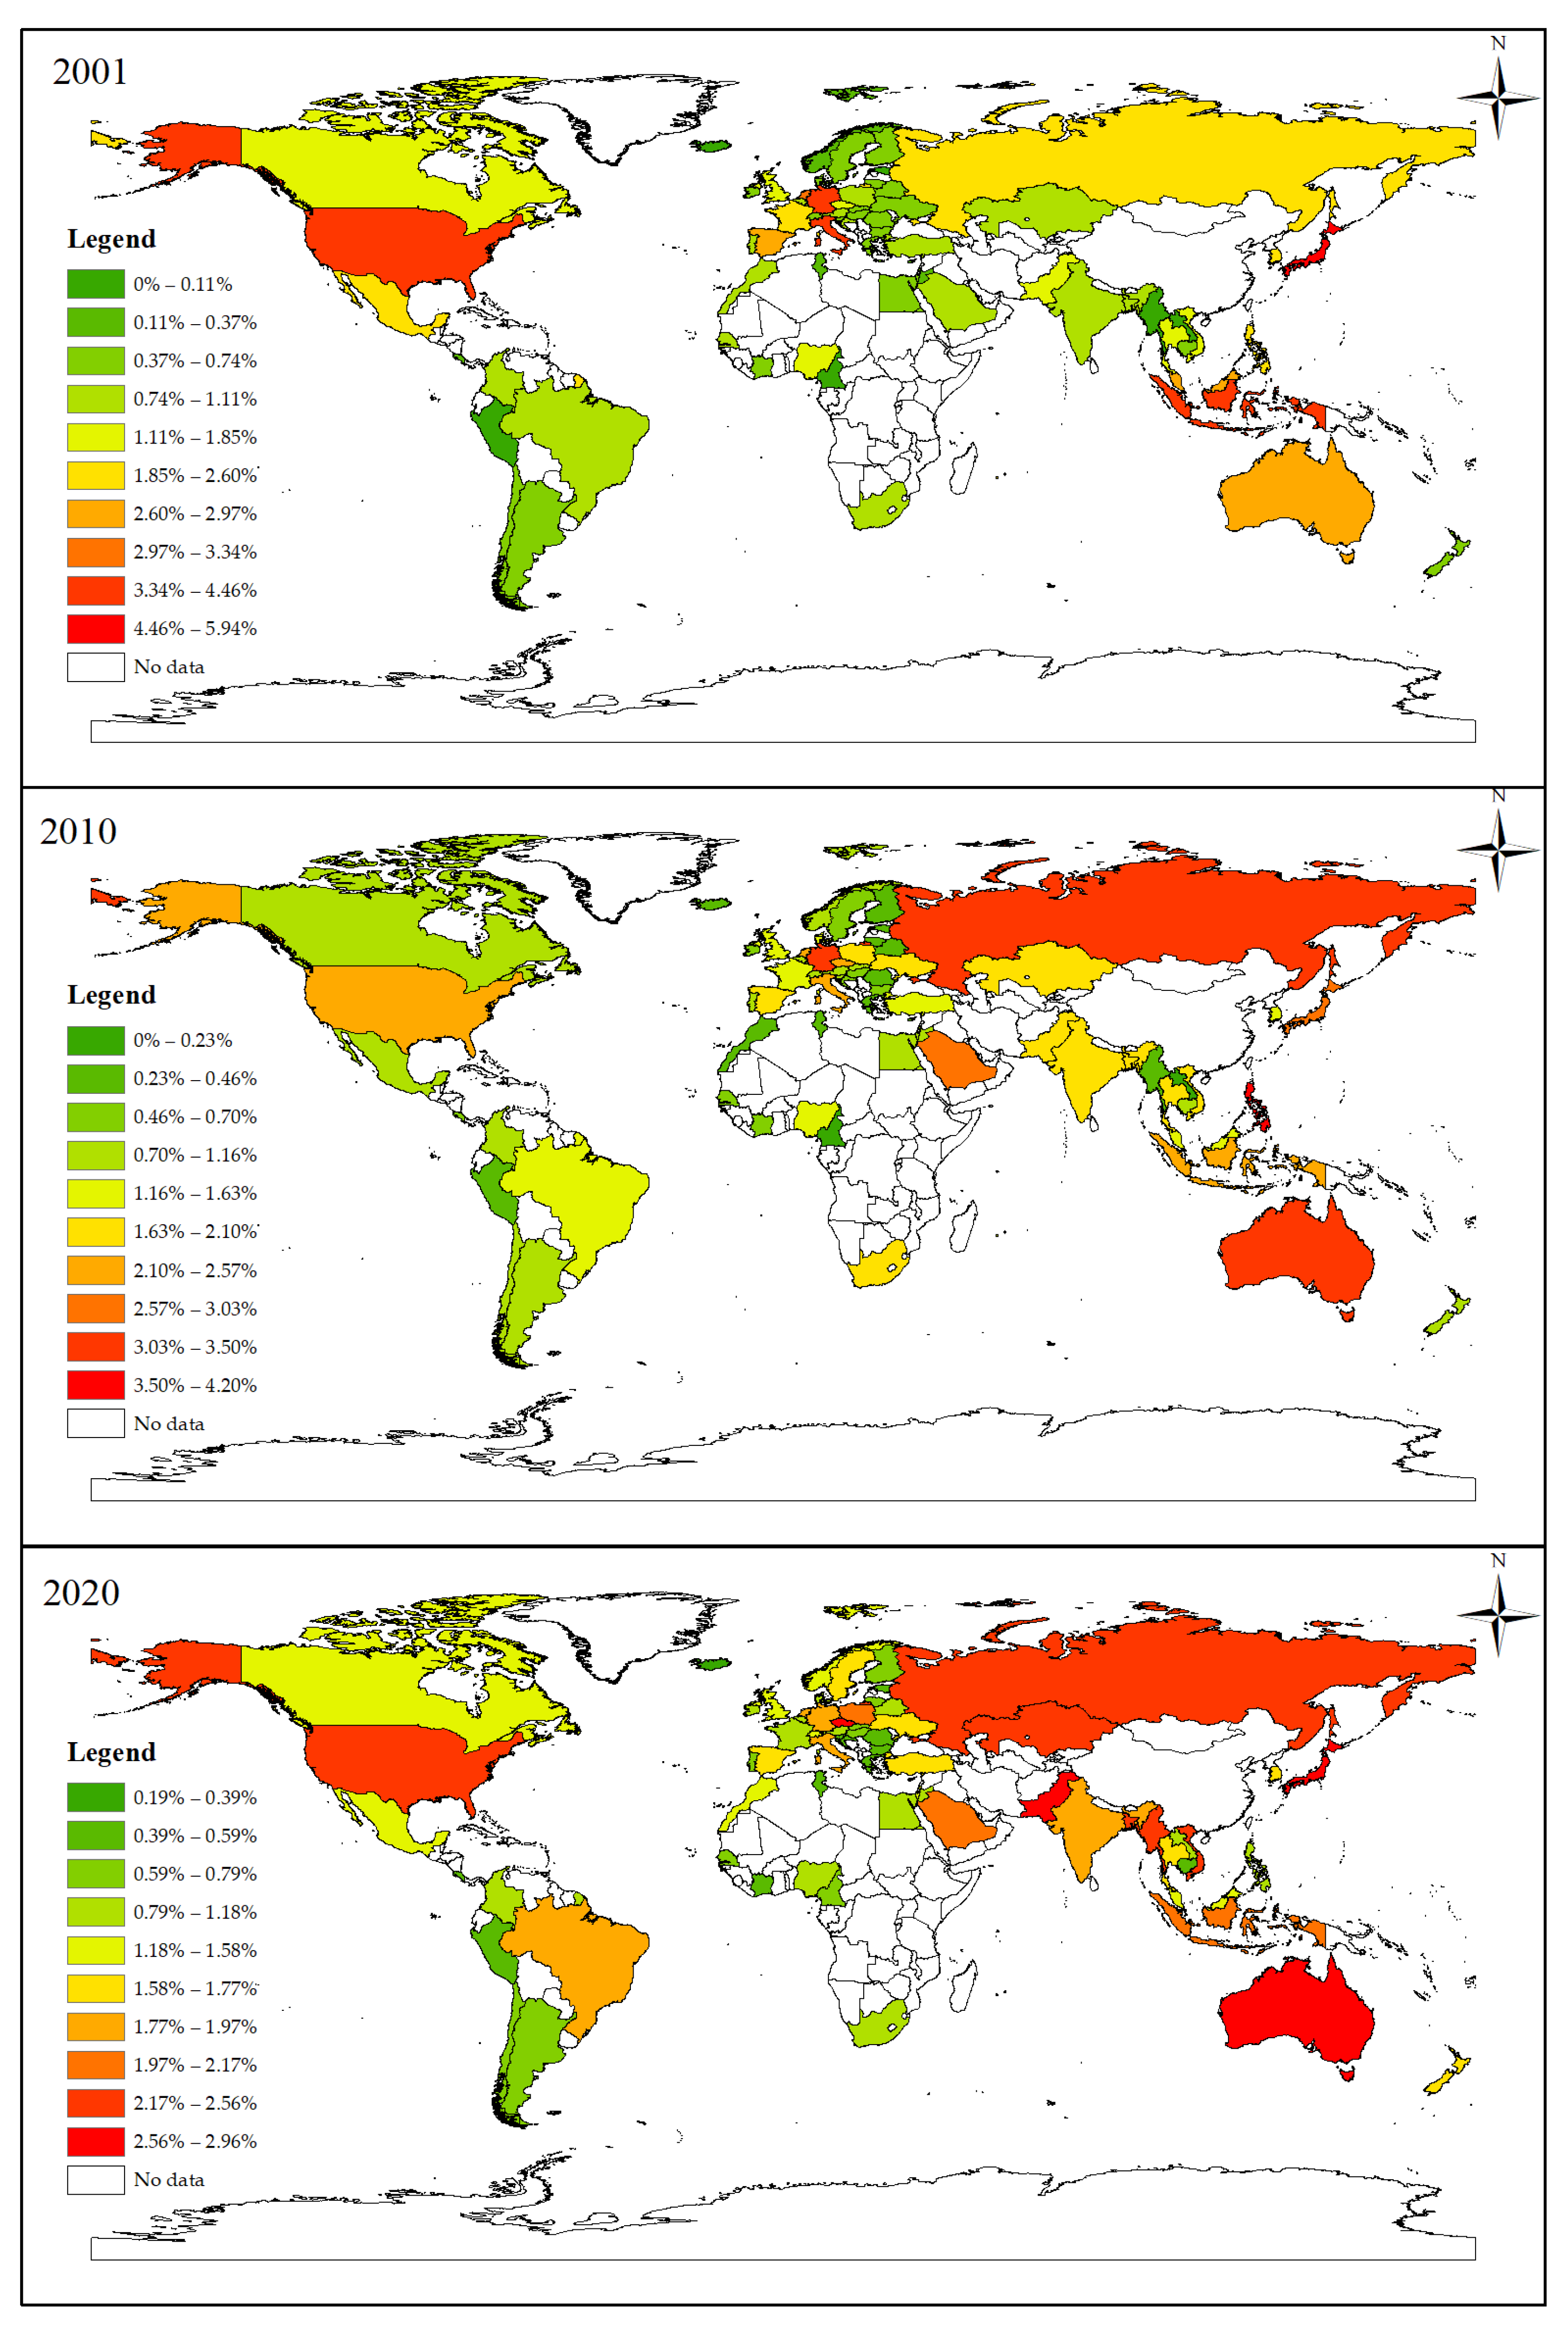
We further examine the direct connection levels of the backbone network. As shown in Figure 6, the concentration of potential direct risks on the downstream supply side is weakening. In 2001, Japan represented the most significant source of potential direct risk with a node share of nearly 5.9%. By 2010, this peak had decreased to approximately 4.2% in the United States. By 2020, the highest share among the economies in the network had further shrunk to around 2.9%. This indicates that the interface for potential direct risk transmission on the downstream supply side is evolving. It is moving from a highly concentrated structure to a more balanced and diversified pattern.
Crucially, the decline in peak values does not signify the dissipation of risks. Instead, it accompanies a continuous geographic shift in primary risk sources from traditional developed economies to emerging economies. In 2001, potential direct risks were highly concentrated in developed economies with mature downstream industries such as Japan, Germany, and the United States. By 2010, the risk landscape had undergone significant changes. While the United States remained prominent, the importance of economies such as Russia and Australia began to emerge. By 2020, this expansion trend became even more pronounced. It presented a new pattern of further multipolarization and fragmentation. Traditional partners like the United States and Russia still occupy important positions. However, South Asian economies such as Pakistan, as well as emerging economies like Myanmar and Vietnam, have become significant sources of direct risk.
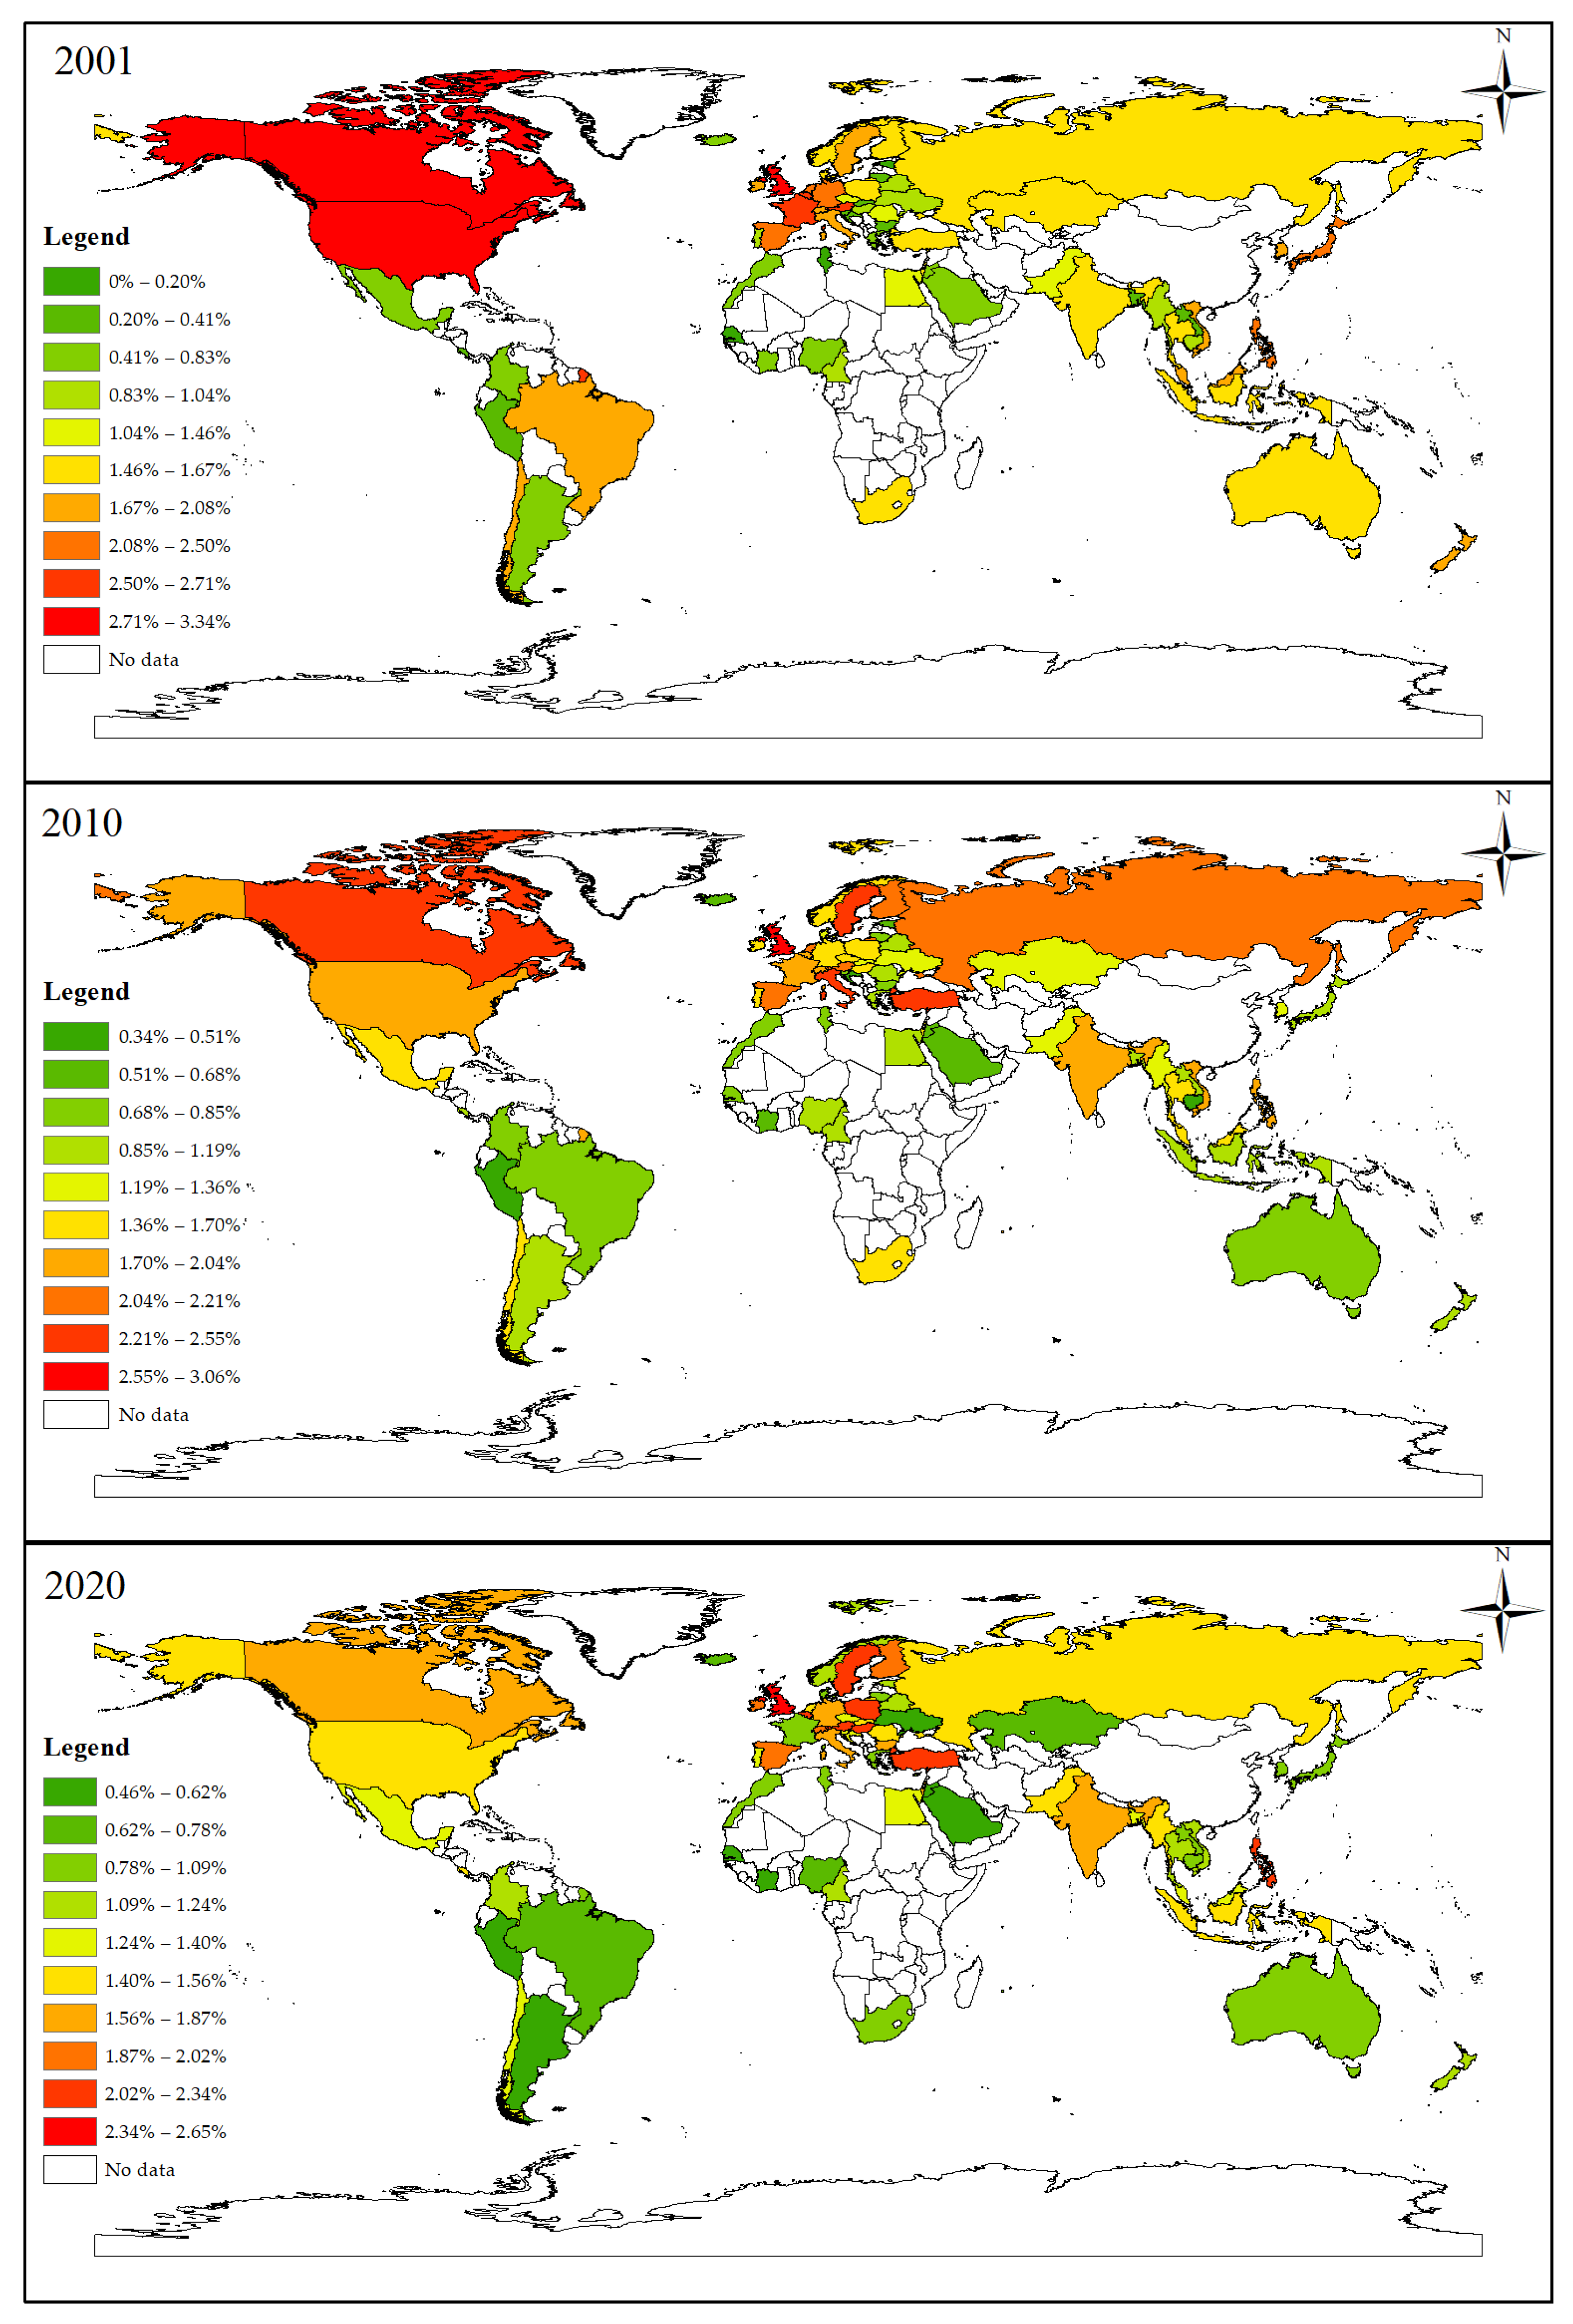
Similarly to the downstream supply side, potential direct risks on the upstream demand side also show a trend of decreasing concentration (Figure 7). In 2001, the United States and Canada constituted the most significant sources of potential direct risk with a node share of about 3.3%. By 2010, this peak had decreased to about 3.1% in the UK. By 2020, the highest share in the network had further declined to about 2.6% in the UK.
However, the nature of this upstream transformation differs fundamentally from the downstream side. It has not exhibited a diversified trend similar to the large-scale expansion of emerging economies seen downstream. In 2001, potential direct risks were mainly concentrated in traditional developed economies such as the United States, Canada, the United Kingdom, and France. By 2010, although the specific sources had changed, they remained highly concentrated in developed or resource-rich countries such as the United Kingdom, Germany, Australia, and Canada. By 2020, the landscape further evolved. Yet, the United Kingdom, Singapore, and Turkey remained the primary sources. This reveals that the transformation of upstream risk sources represents a structural reorganization among a few technologically advanced or resource-endowed countries.
A comprehensive comparison of Figure 6 and Figure 7 reveals a fundamental divergence. Although potential direct risks on both sides exhibit a peak decline and a shift in focus at the macro level, the intrinsic logic of their evolutionary paths is different. The risk transformation on the downstream supply side reflects a market-driven active diversification. Risk sources are widely dispersed across global emerging markets. In contrast, the risk transformation on the upstream demand side resembles a structural reorganization within a limited core supply circle. Its sources remain consistently concentrated in a few technologically advanced or resource-endowed countries without achieving true geographical dispersion. This solidification and concentration of upstream sources constitute a more fundamental structural risk in China’s agricultural GVC network.

4.3. Composition of Key Risk Transmission Nodes

Building on the previous analysis of risk exposure and transmission levels, this section focuses on key transmission nodes within the backbone network. Our goal is to identify specific industrial sectors that play a central role in the network and dynamically diagnose their risk characteristics.
As shown in Table 3 and Table 4, the key nodes on both the supply and demand sides exhibit significant differences across industries. On the downstream supply side, key nodes are highly concentrated in two major categories. The first category includes service industries closely related to terminal consumption, such as the “Accommodation and Catering” sector in South Korea, Japan, and Singapore. The second category involves the deep processing of agricultural products, such as the “Food Processing and Manufacturing” sector in South Korea and Canada. In contrast, the composition of key nodes on the upstream demand side is more diverse yet stable. Its core composition consistently revolves around three sectors. The “Chemical Industry” in economies like South Korea and Germany reflects the dependence on modern production inputs. The “Wholesale and Retail” sector in the United States and Spain serves as a key channel for controlling upstream inputs. Finally, the “Agriculture” sectors of other economies, such as Argentina and Brazil, reflect the dependence on land-intensive primary product imports. These static analysis results indicate that China’s dependence pattern on upstream core nodes is relatively solidified.
While static sorting identifies the core participants in the backbone network, a comprehensive assessment requires dynamic diagnosis. For this purpose, we map the key nodes onto a Two-Dimensional Risk Matrix. The horizontal axis represents the evolutionary trend of Weighted Degree Centrality, indicating long-term changes in influence. The vertical axis represents the relative uncertainty of Weighted Degree Centrality, defined as the difference between the node’s own fluctuation and the average fluctuation level of all associated nodes in that year. Nodes located in the first quadrant are characterized by both an upward trend and above-average uncertainty. These represent the highest-risk “Unstable Growth Points”.
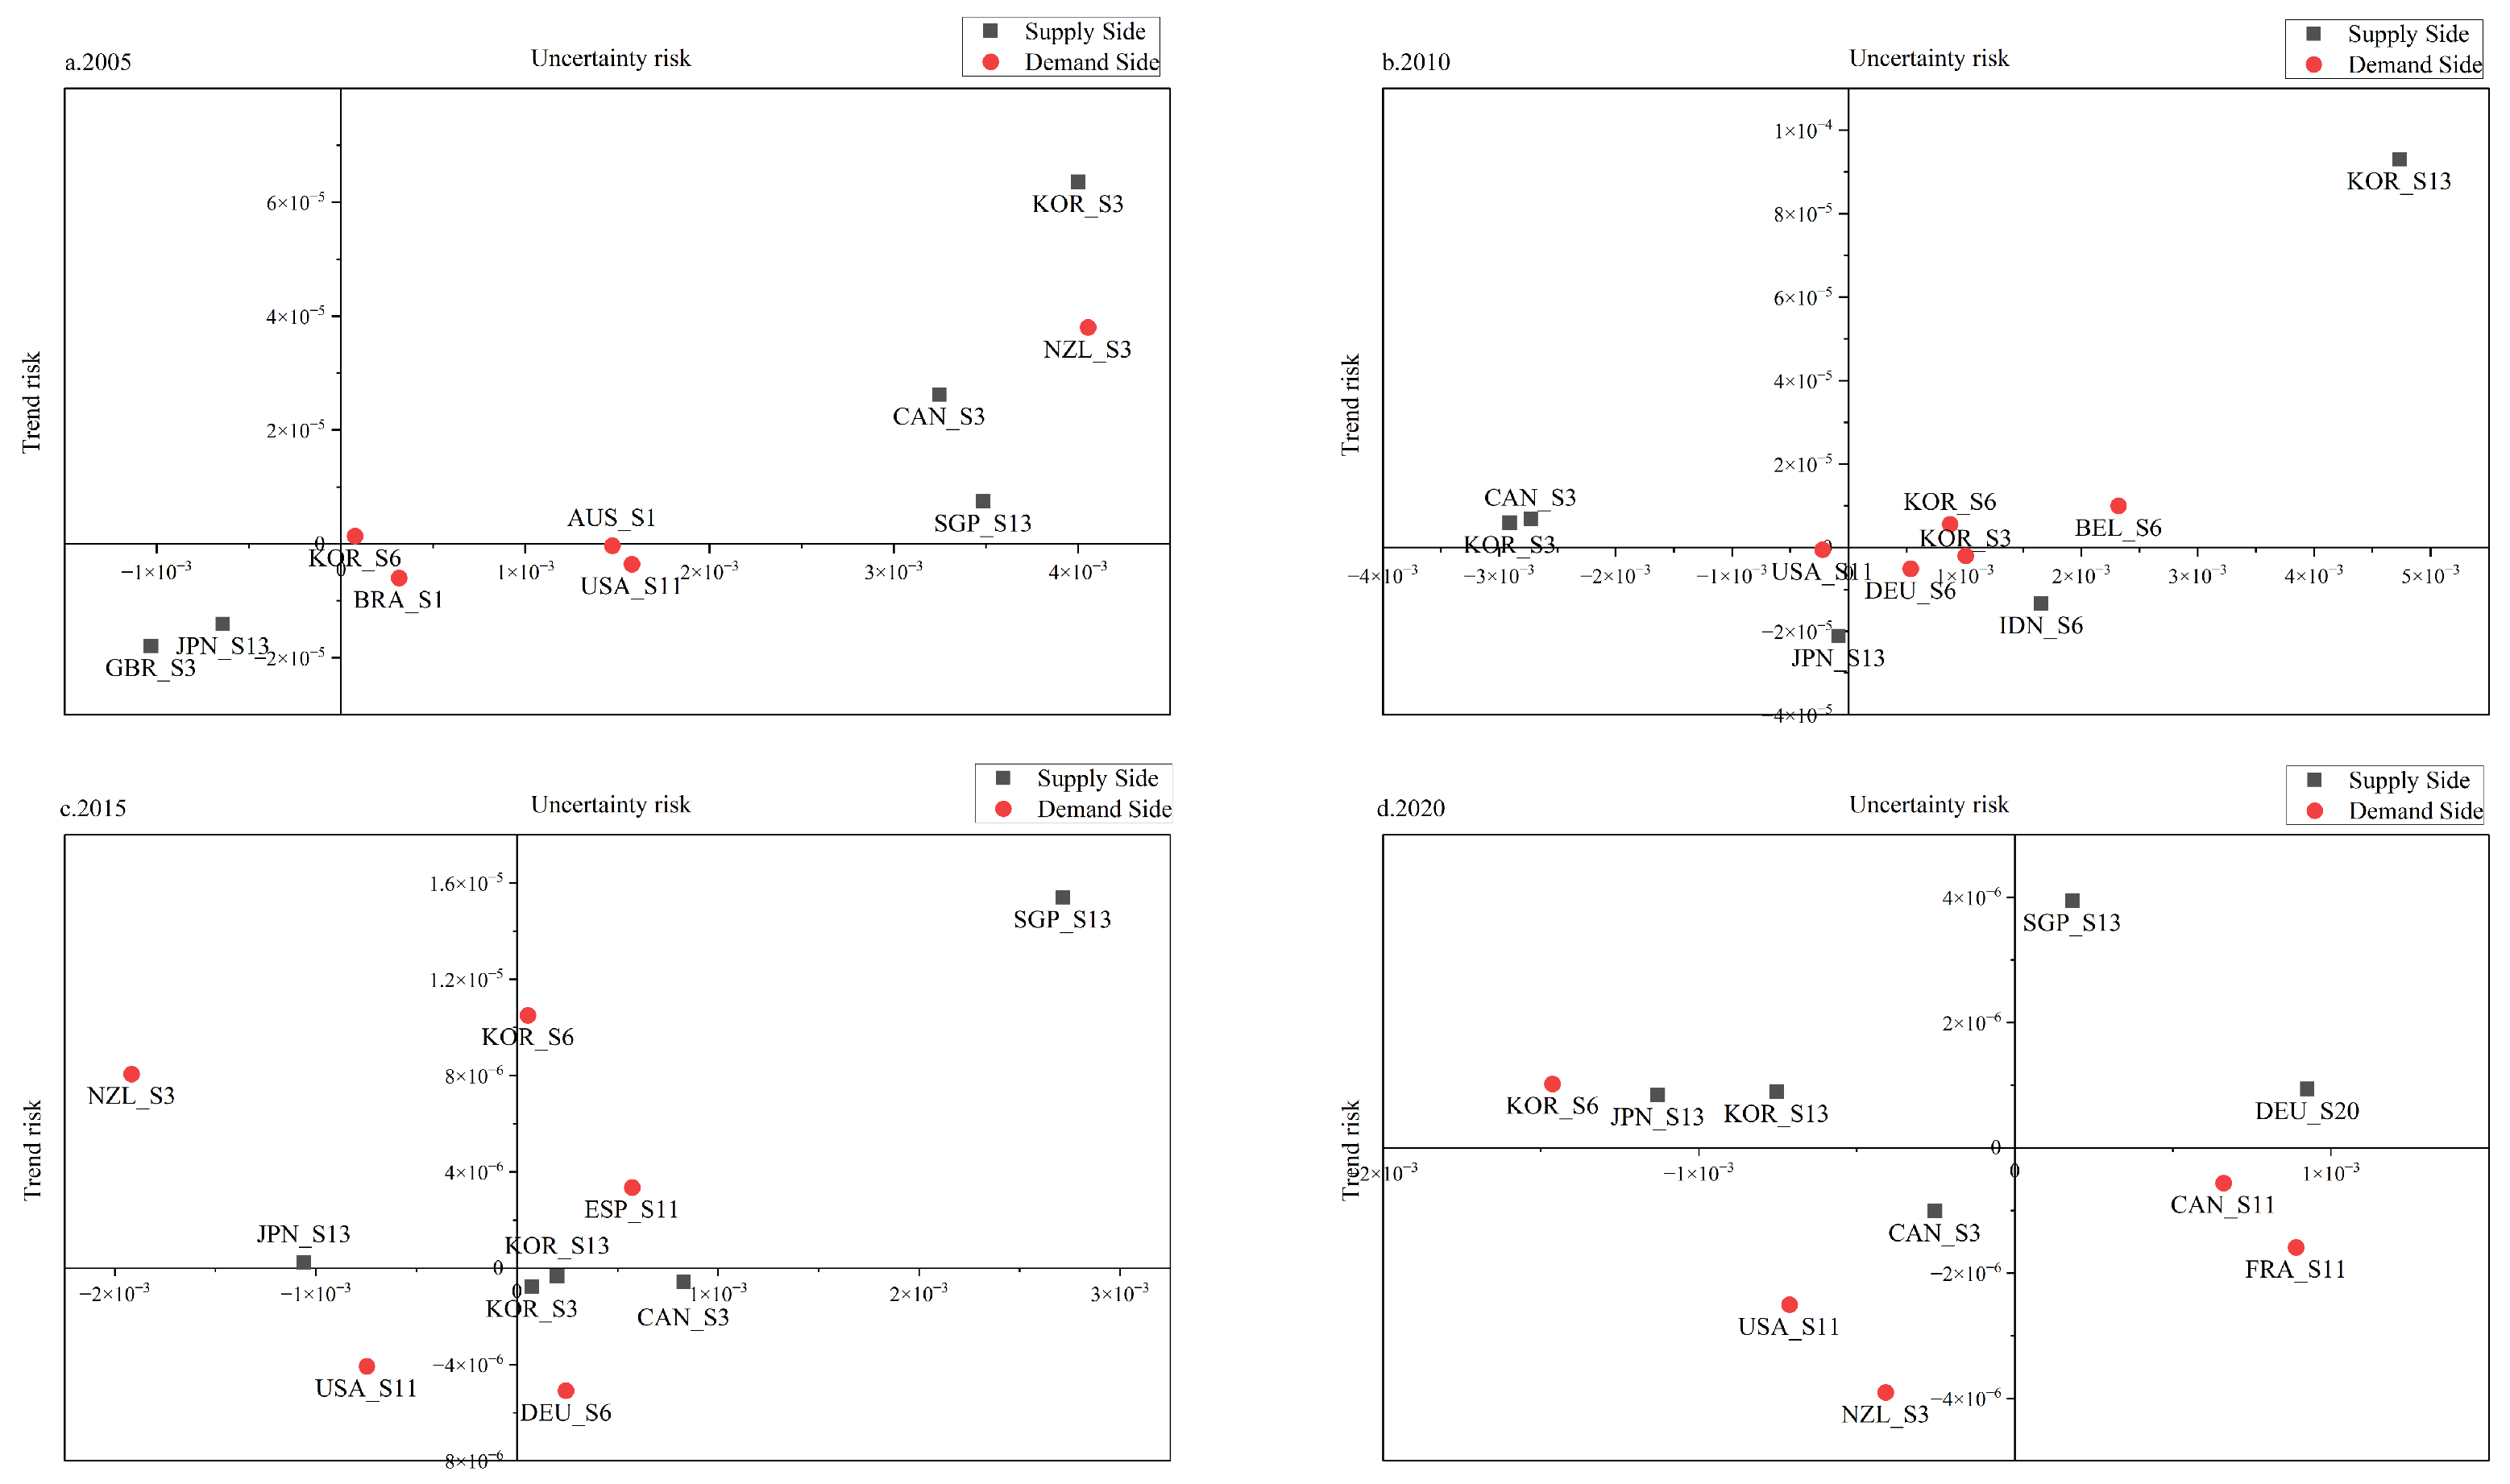
Visualizing the temporal evolution reveals that nodes with similar static importance often exhibit divergent dynamic risk characteristics. As shown in Figure 8a, the risk pattern of China’s agricultural GVC in 2005 exhibited a symmetrical expansion. The “Food Processing and Manufacturing” industry in South Korea (KOR_S3) on the downstream supply side and the corresponding sector in New Zealand (NZL_S3) on the upstream demand side both appeared in the high-risk first quadrant. This indicates that China’s agricultural value chain was in a “adaptation phase.” This phase was characterized by rapid expansion but unstable foundations with key partners at both ends of the chain.
Entering 2010 (Figure 8b), the risk configuration underwent significant changes as extreme risk points emerged on the downstream supply side. South Korea’s “Accommodation and Catering” (KOR_S13) surged to the top right corner of the first quadrant. It became the node with the highest comprehensive risk in the entire network, with influence growth and volatility far exceeding those of other partners. This reveals that China’s downstream dependence on specific service industry markets is rapidly concentrating, accompanied by extremely high uncertainty. In contrast, although nodes such as Belgium’s “Chemical Industry” (BEL_S6) entered the first quadrant on the upstream demand side, their risk levels remained far lower than those on the downstream supply side.
By 2015 (Figure 8c), high-risk nodes existed simultaneously on both sides but with distinct characteristics. On the downstream supply side, Singapore’s “Accommodation and Catering” (SGP_S13) became a new unstable growth point. On the upstream demand side, South Korea’s “Chemical Industry” (KOR_S6) maintained above-average volatility despite a slowdown in its influence growth. Notably, New Zealand’s “Food Processing and Manufacturing” (NZL_S3) shifted to the second quadrant. Once a high-growth partner, it evolved into a source of declining influence and high instability, constituting a new type of risk source.
By 2020 (Figure 8d), the risk configuration showed a significant upstream-downstream divergence. The upstream demand side completely exited the high-risk “Unstable Growth Points” zone, leaving high risks entirely concentrated on the downstream supply side. These downstream risk points shifted towards emerging service sectors. Germany’s “Administrative and Support Services” (DEU_S20) and Singapore’s “Accommodation and Catering” (SGP_S13) entered the first quadrant together, becoming highly volatile nodes as the value chain explored new markets. Meanwhile, upstream risks shifted from past growth uncertainties to a structural reliance on stable channels, such as the “Wholesale and Retail” sectors in France and Canada (FRA_S11, CAN_S11). Although their influence is growing, they no longer exhibit high volatility characteristics.
Overall, the continuous evolution of these key nodes outlines a distinct trajectory of structural risks. The pattern has shifted from an initial symmetrical distribution of upstream and downstream nodes in the food processing industry to an asymmetrical concentration of risks in downstream consumer services. Finally, it evolved into a profound differentiation between upstream and downstream risk patterns. Downstream nodes exhibit high volatility “Exploratory Risks” driven by the pursuit of new markets and higher value-added. Conversely, upstream nodes are driven by efficiency optimization and have transformed into “Structural Dependencies” that rely on a few stable channels.

4.4. Sensitivity Analysis

4.4.1. Sensitivity Analysis of Regional Aggregation

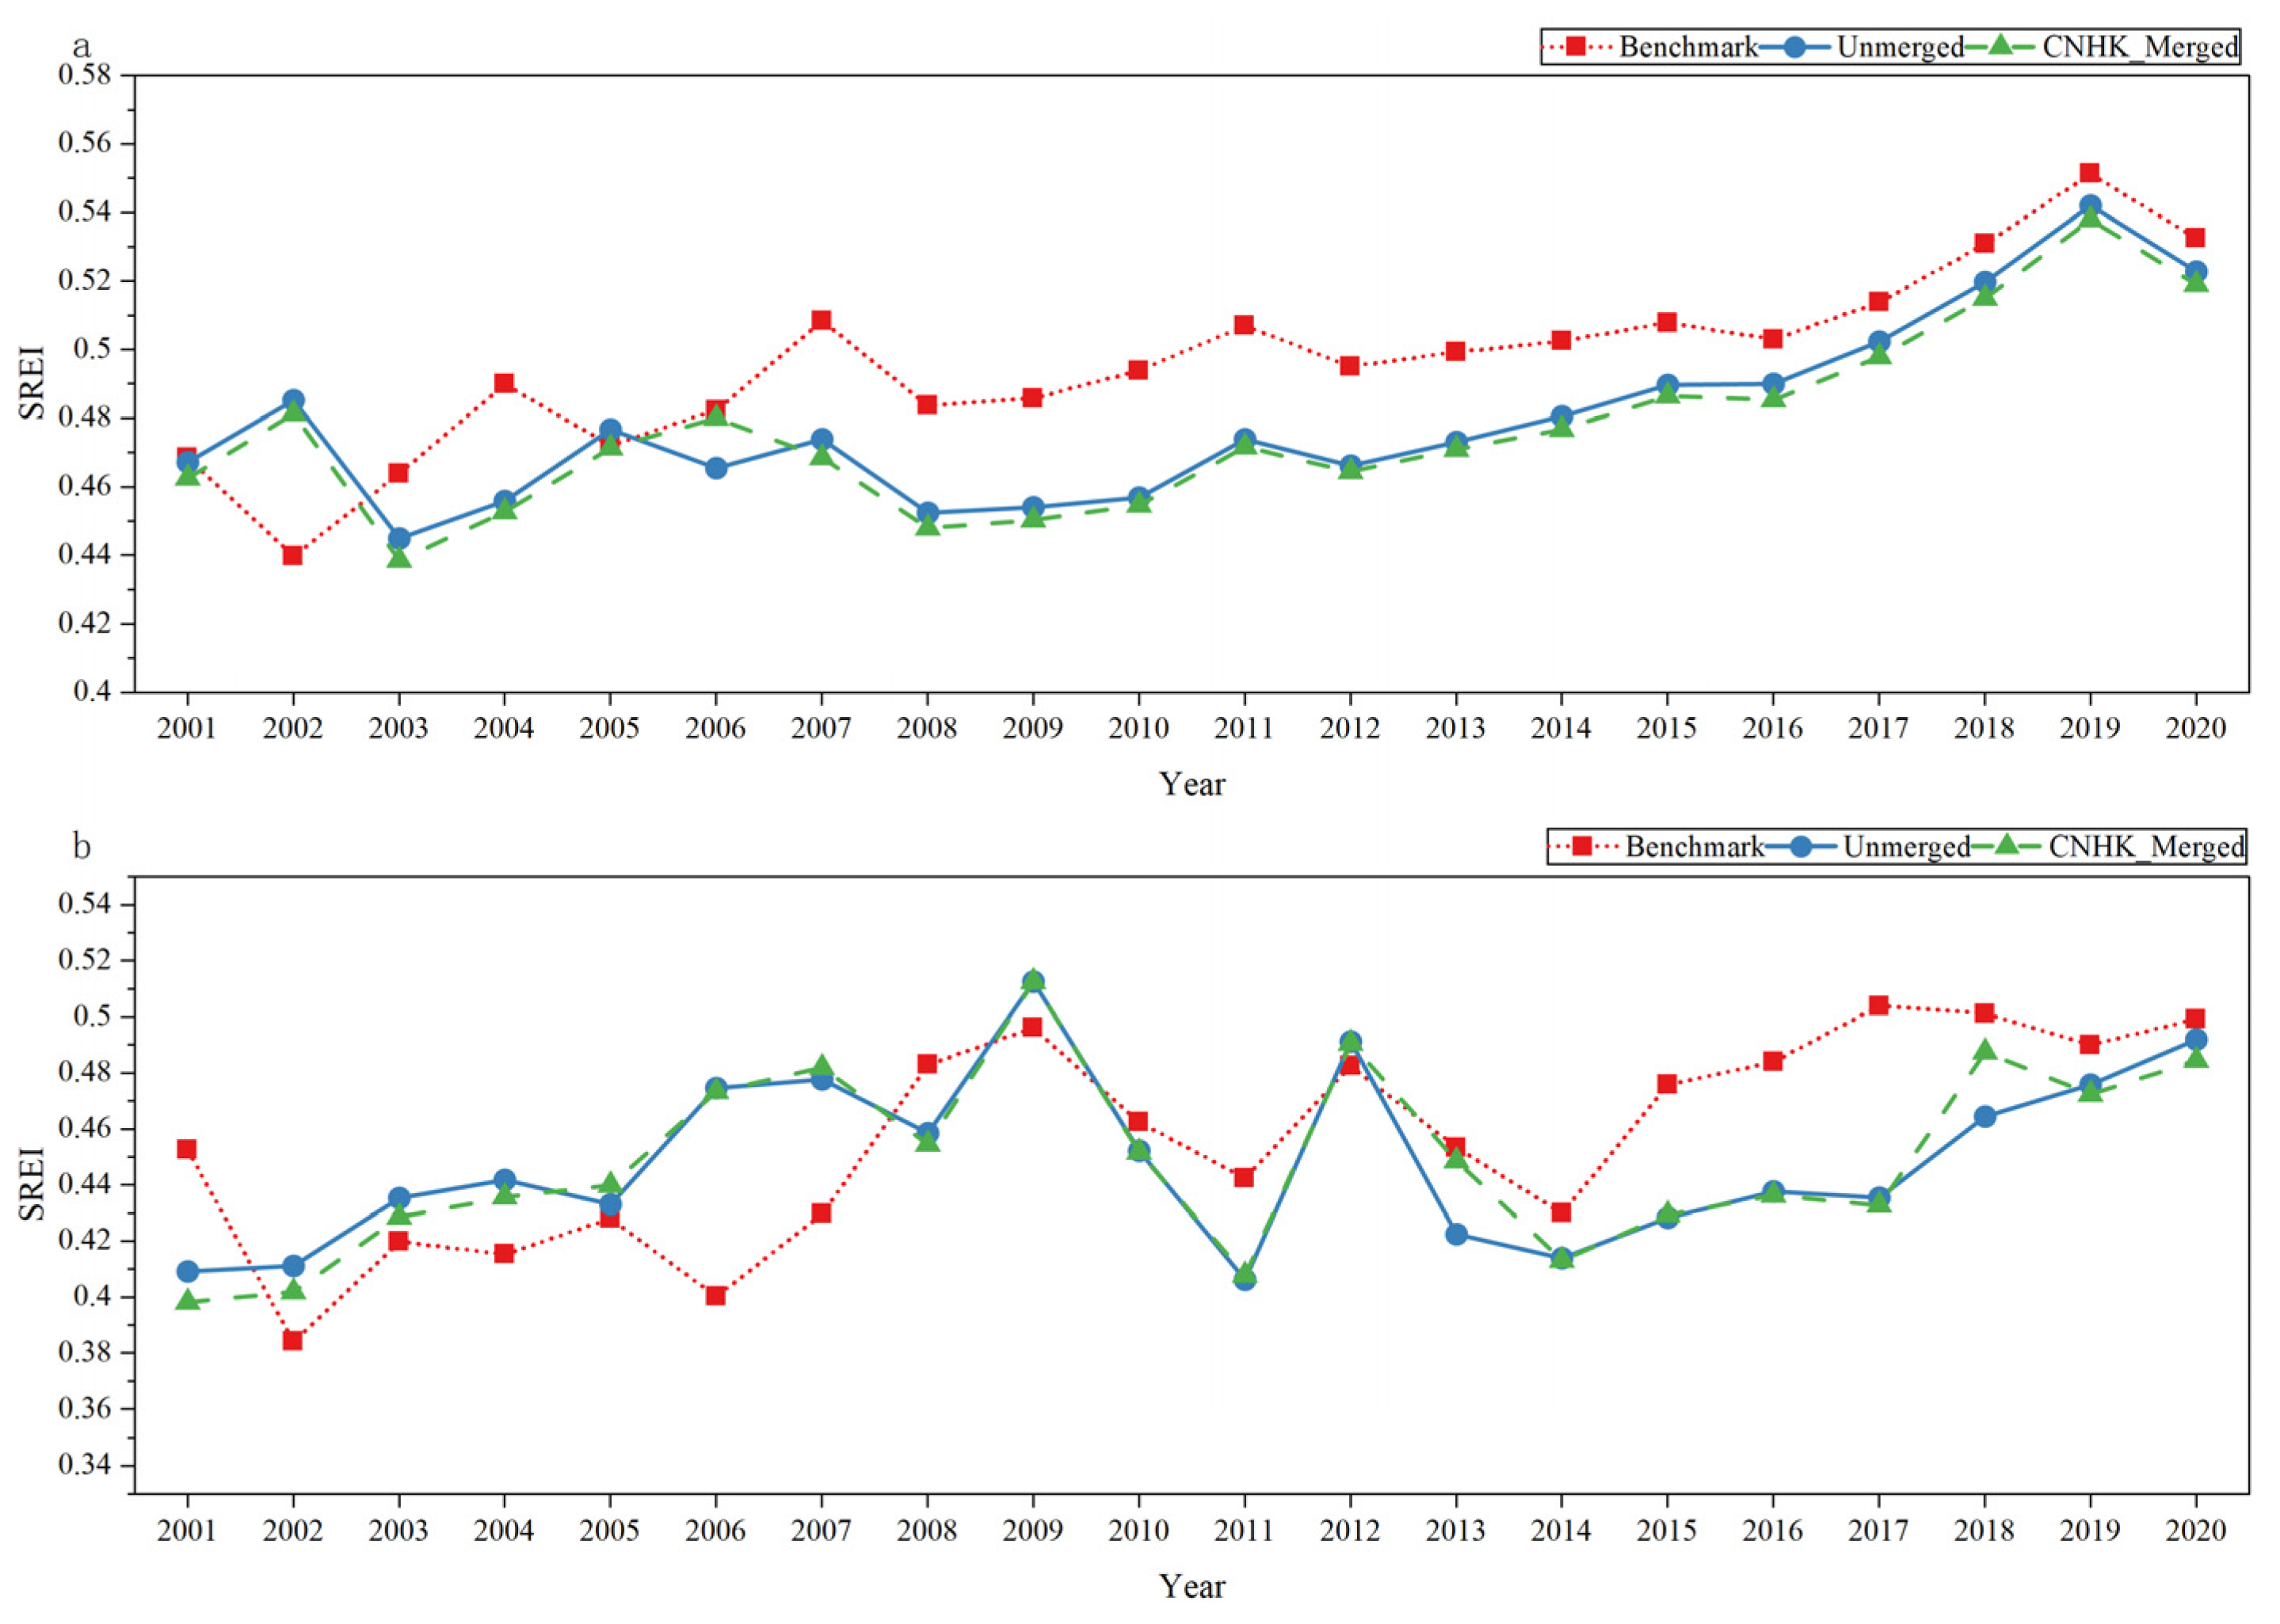
To verify that our findings are not artifacts of the regional aggregation strategy, we conducted a robustness check. We compared the benchmark model with two alternative scenarios: an “Unmerged” scenario and a “CNHK_Merged” scenario (merging Mainland China and Hong Kong). These experiments comprehensively examined the network across macro-structural, meso-path, and micro-node dimensions.
The risk exposure structure showed robust stability in its evolutionary trends. Figure 9 illustrates the trajectory of the SREI under different aggregation schemes. The inclusion of Taiwan’s independent data introduced distinct regional fluctuations. This resulted in Pearson correlation coefficients of 0.59 and 0.60 between the benchmark and alternative scenarios. However, such statistical divergence mainly stems from Taiwan’s unique economic volatility. It does not negate the consistency of the overall trend direction. In fact, these local disturbances further corroborate the necessity of our aggregation strategy to filter out regional noise and capture the true global macro-risk exposure.
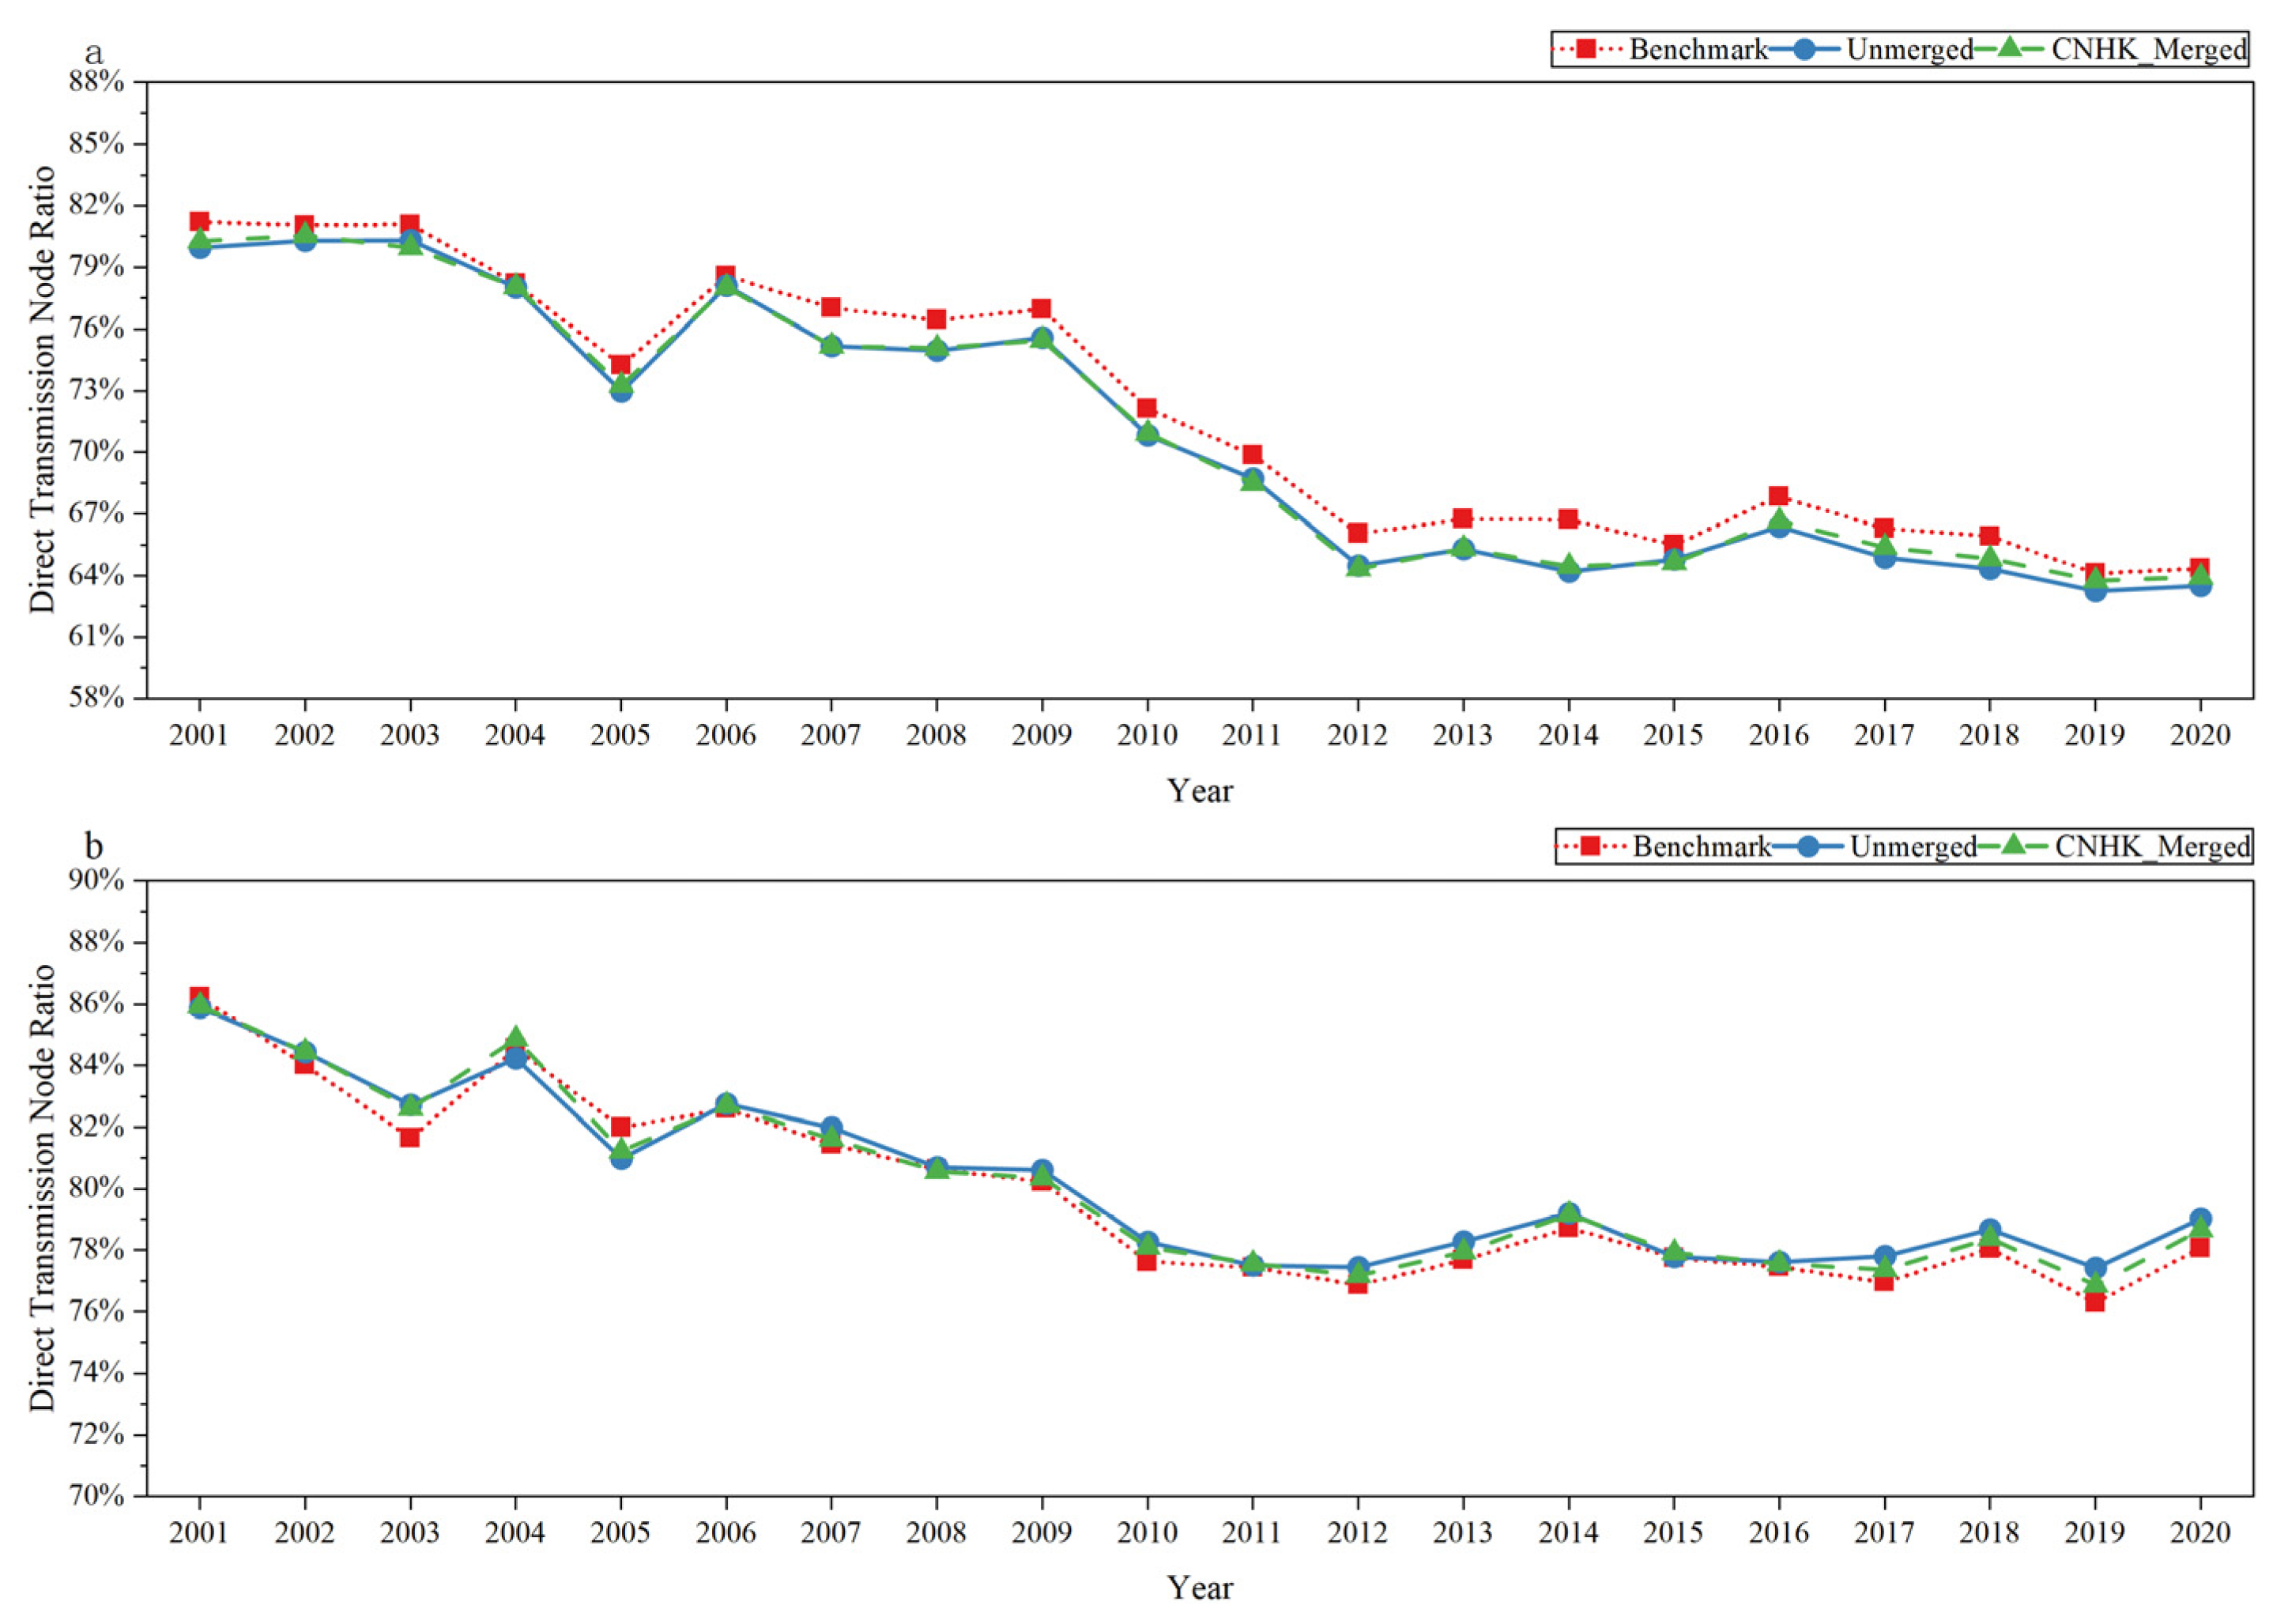
The structure of the risk transmission backbone proved highly stable. Figure 10 shows that the curves for the proportion of direct transmission nodes follow consistent trends across different schemes. The calculated Pearson correlation coefficients all exceeded 0.99. Such high correlation verifies that the “implicitization” of risk transmission paths is driven by global supply changes. It is independent of how regional nodes are defined.
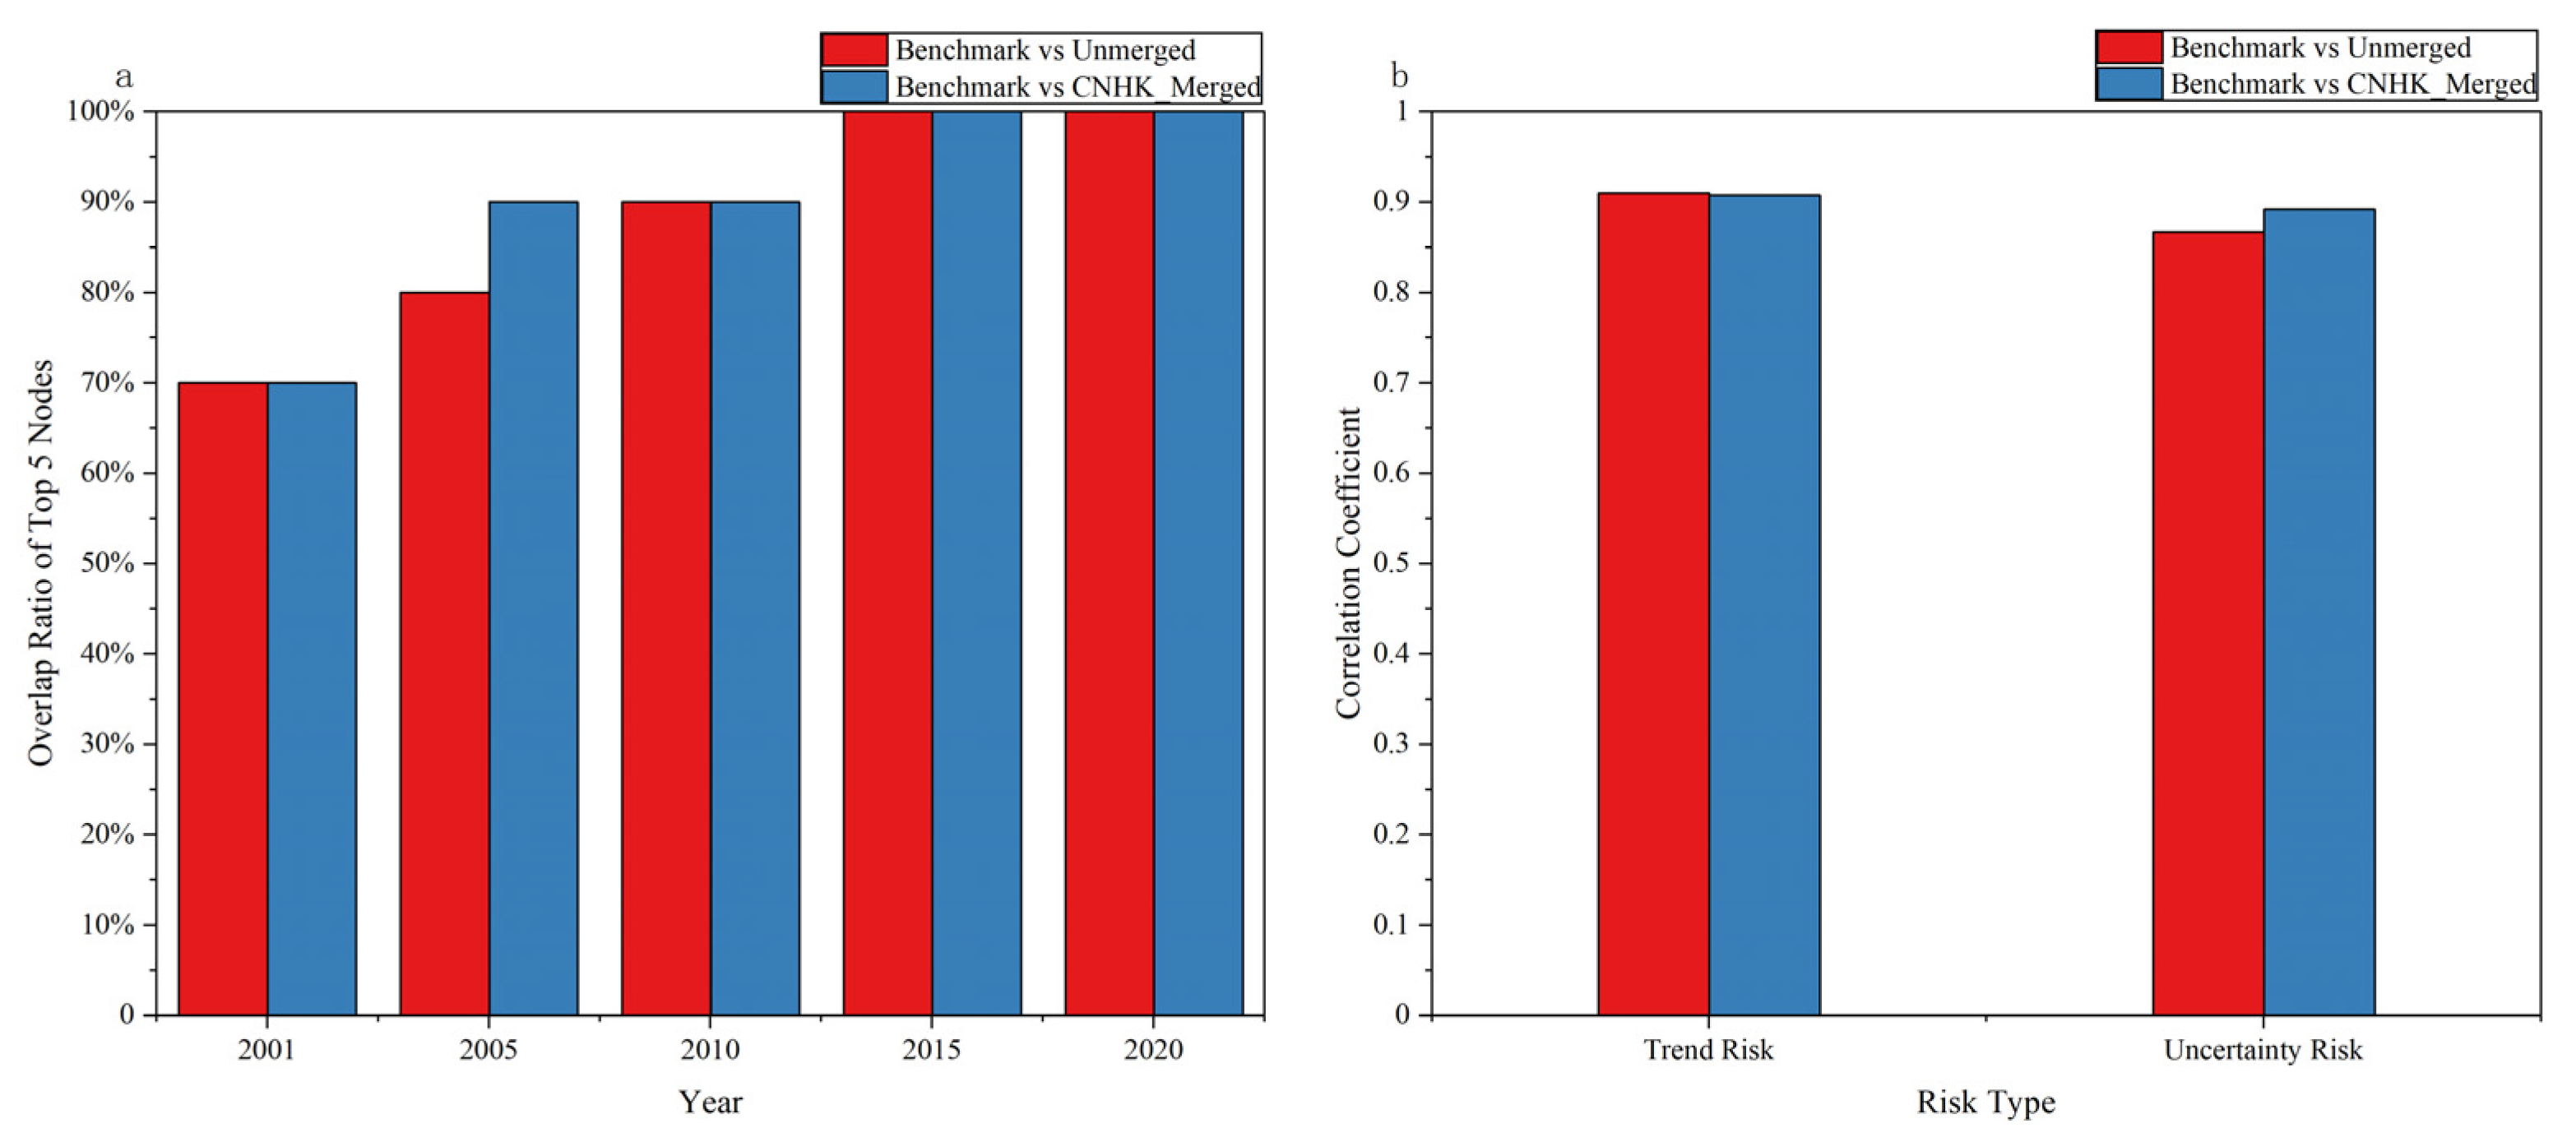
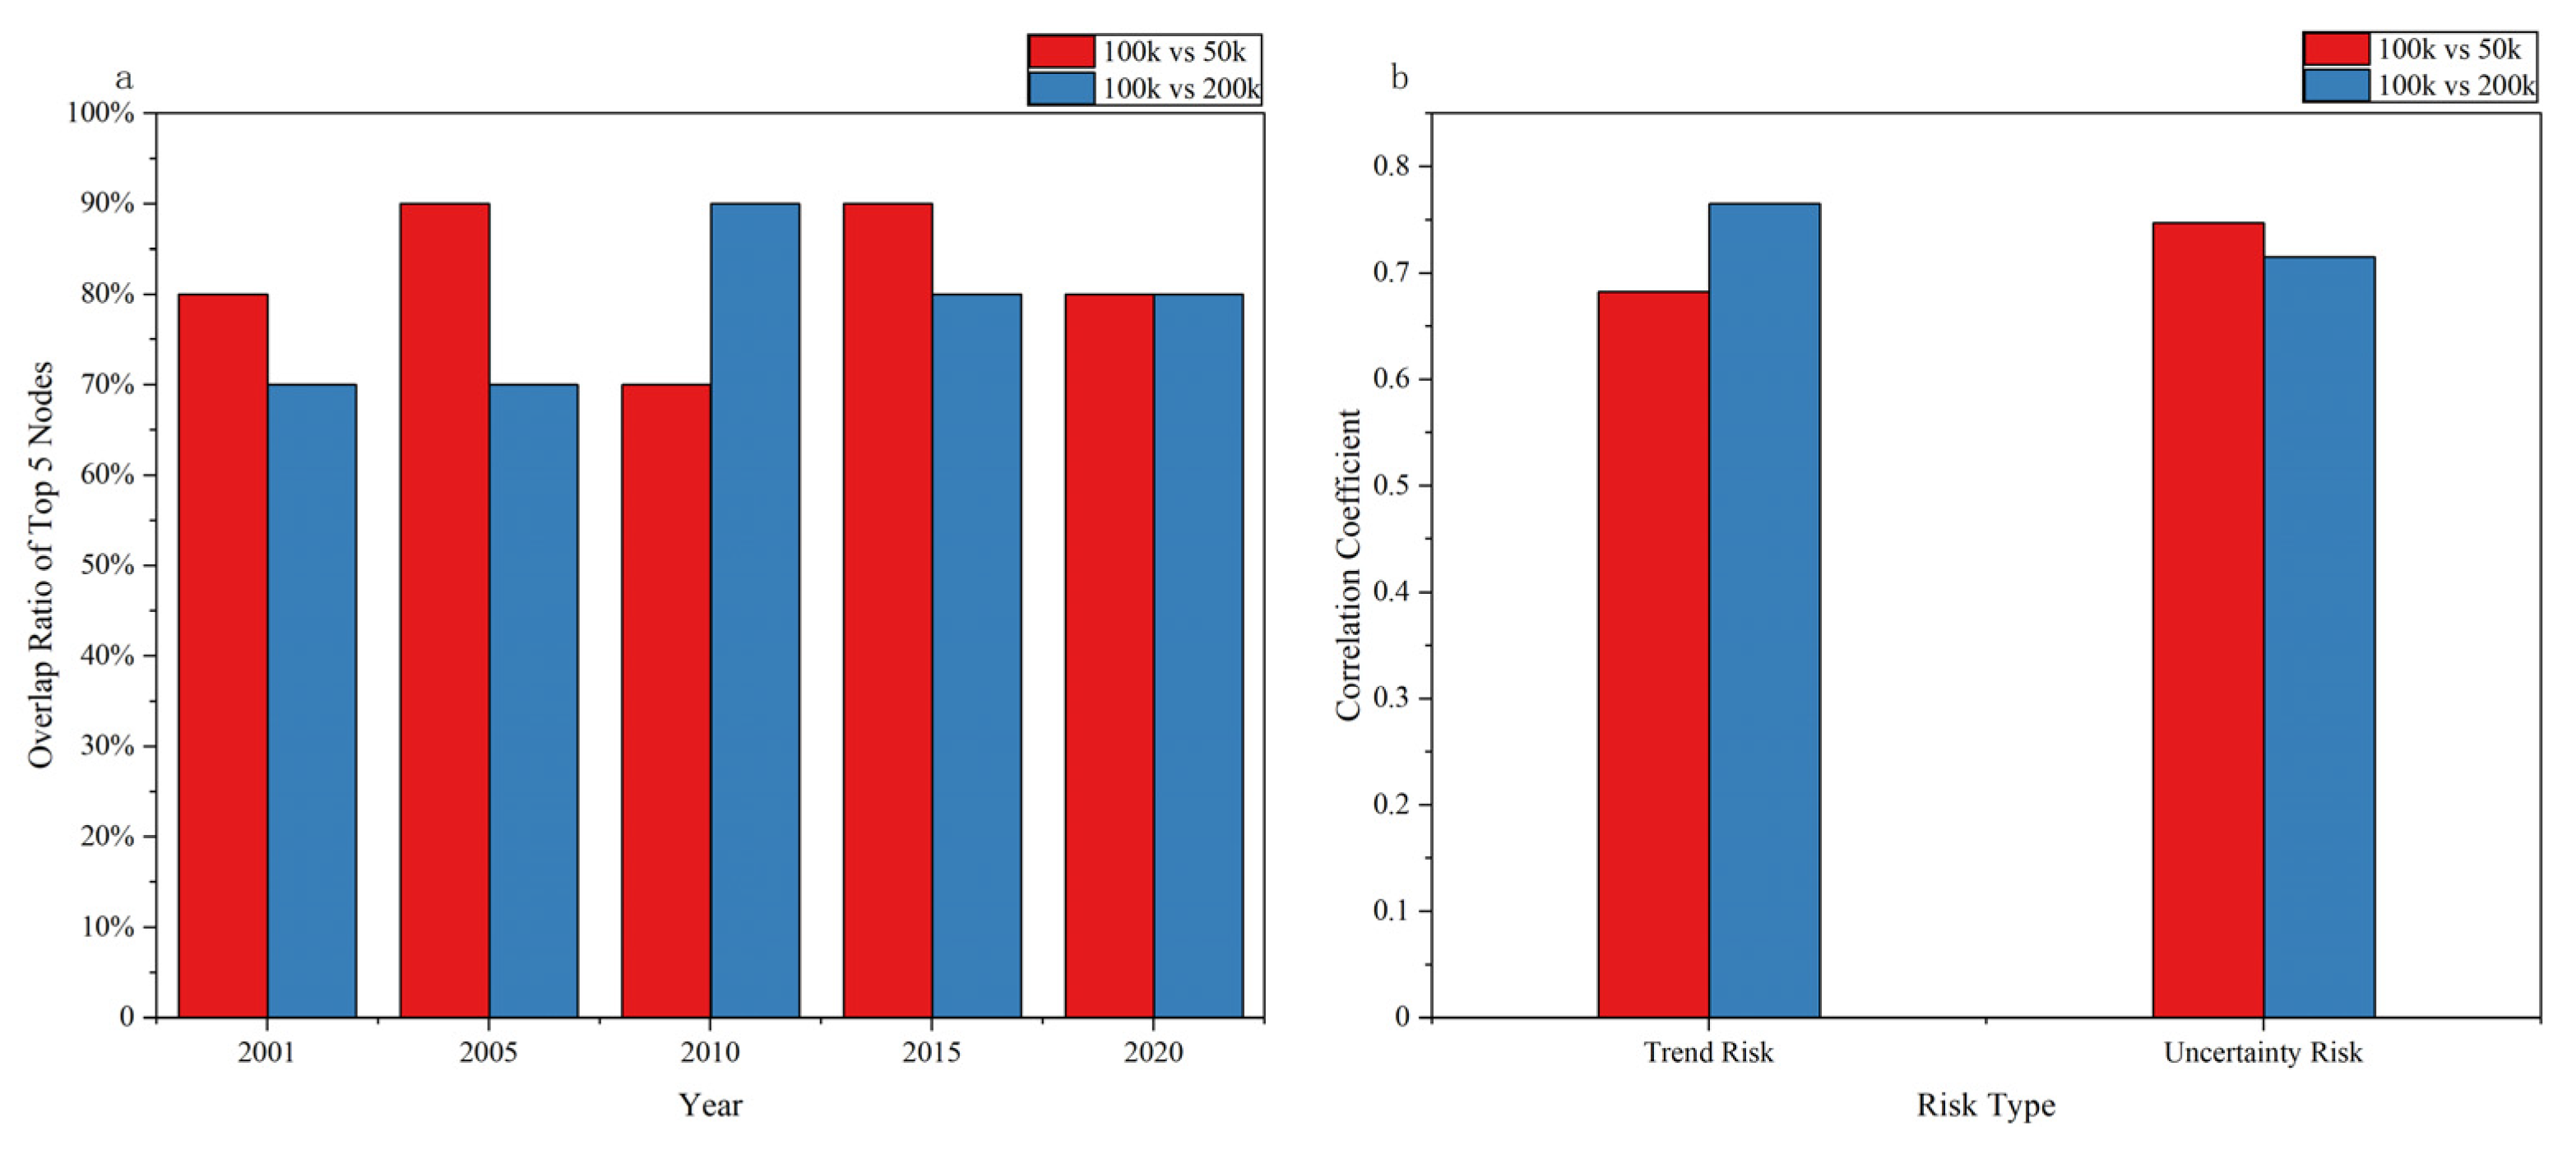
Key node identification and dynamic risk characteristics also remained consistent. As shown in Figure 11a, the overlap rate of the annual Top 5 key nodes across different aggregation schemes increased from 70% in the early period to 100% in the later period. (See Appendix D for details) For nodes common to all three schemes, we compared their dynamic risk diagnosis results. Figure 11b indicates a significant positive correlation for both trend risk and uncertainty risk across different schemes. The Pearson correlation coefficients surpassed 0.86. This suggests that the diagnostic conclusions regarding “upstream solidified dependency” and “downstream exploratory volatility” are highly credible. In summary, the model and conclusions proposed in this study possess strong robustness.

4.4.2. Sensitivity Analysis of Threshold Settings

To mitigate potential bias arising from single parameter settings, we conducted a sensitivity analysis on the edge weight thresholds. Based on the benchmark model ($100,000), we introduced two alternative scenarios: a relaxed scenario ($50,000) and a strict scenario ($200,000). These experiments comprehensively examined the network across macro-structural, meso-path, and micro-node dimensions.
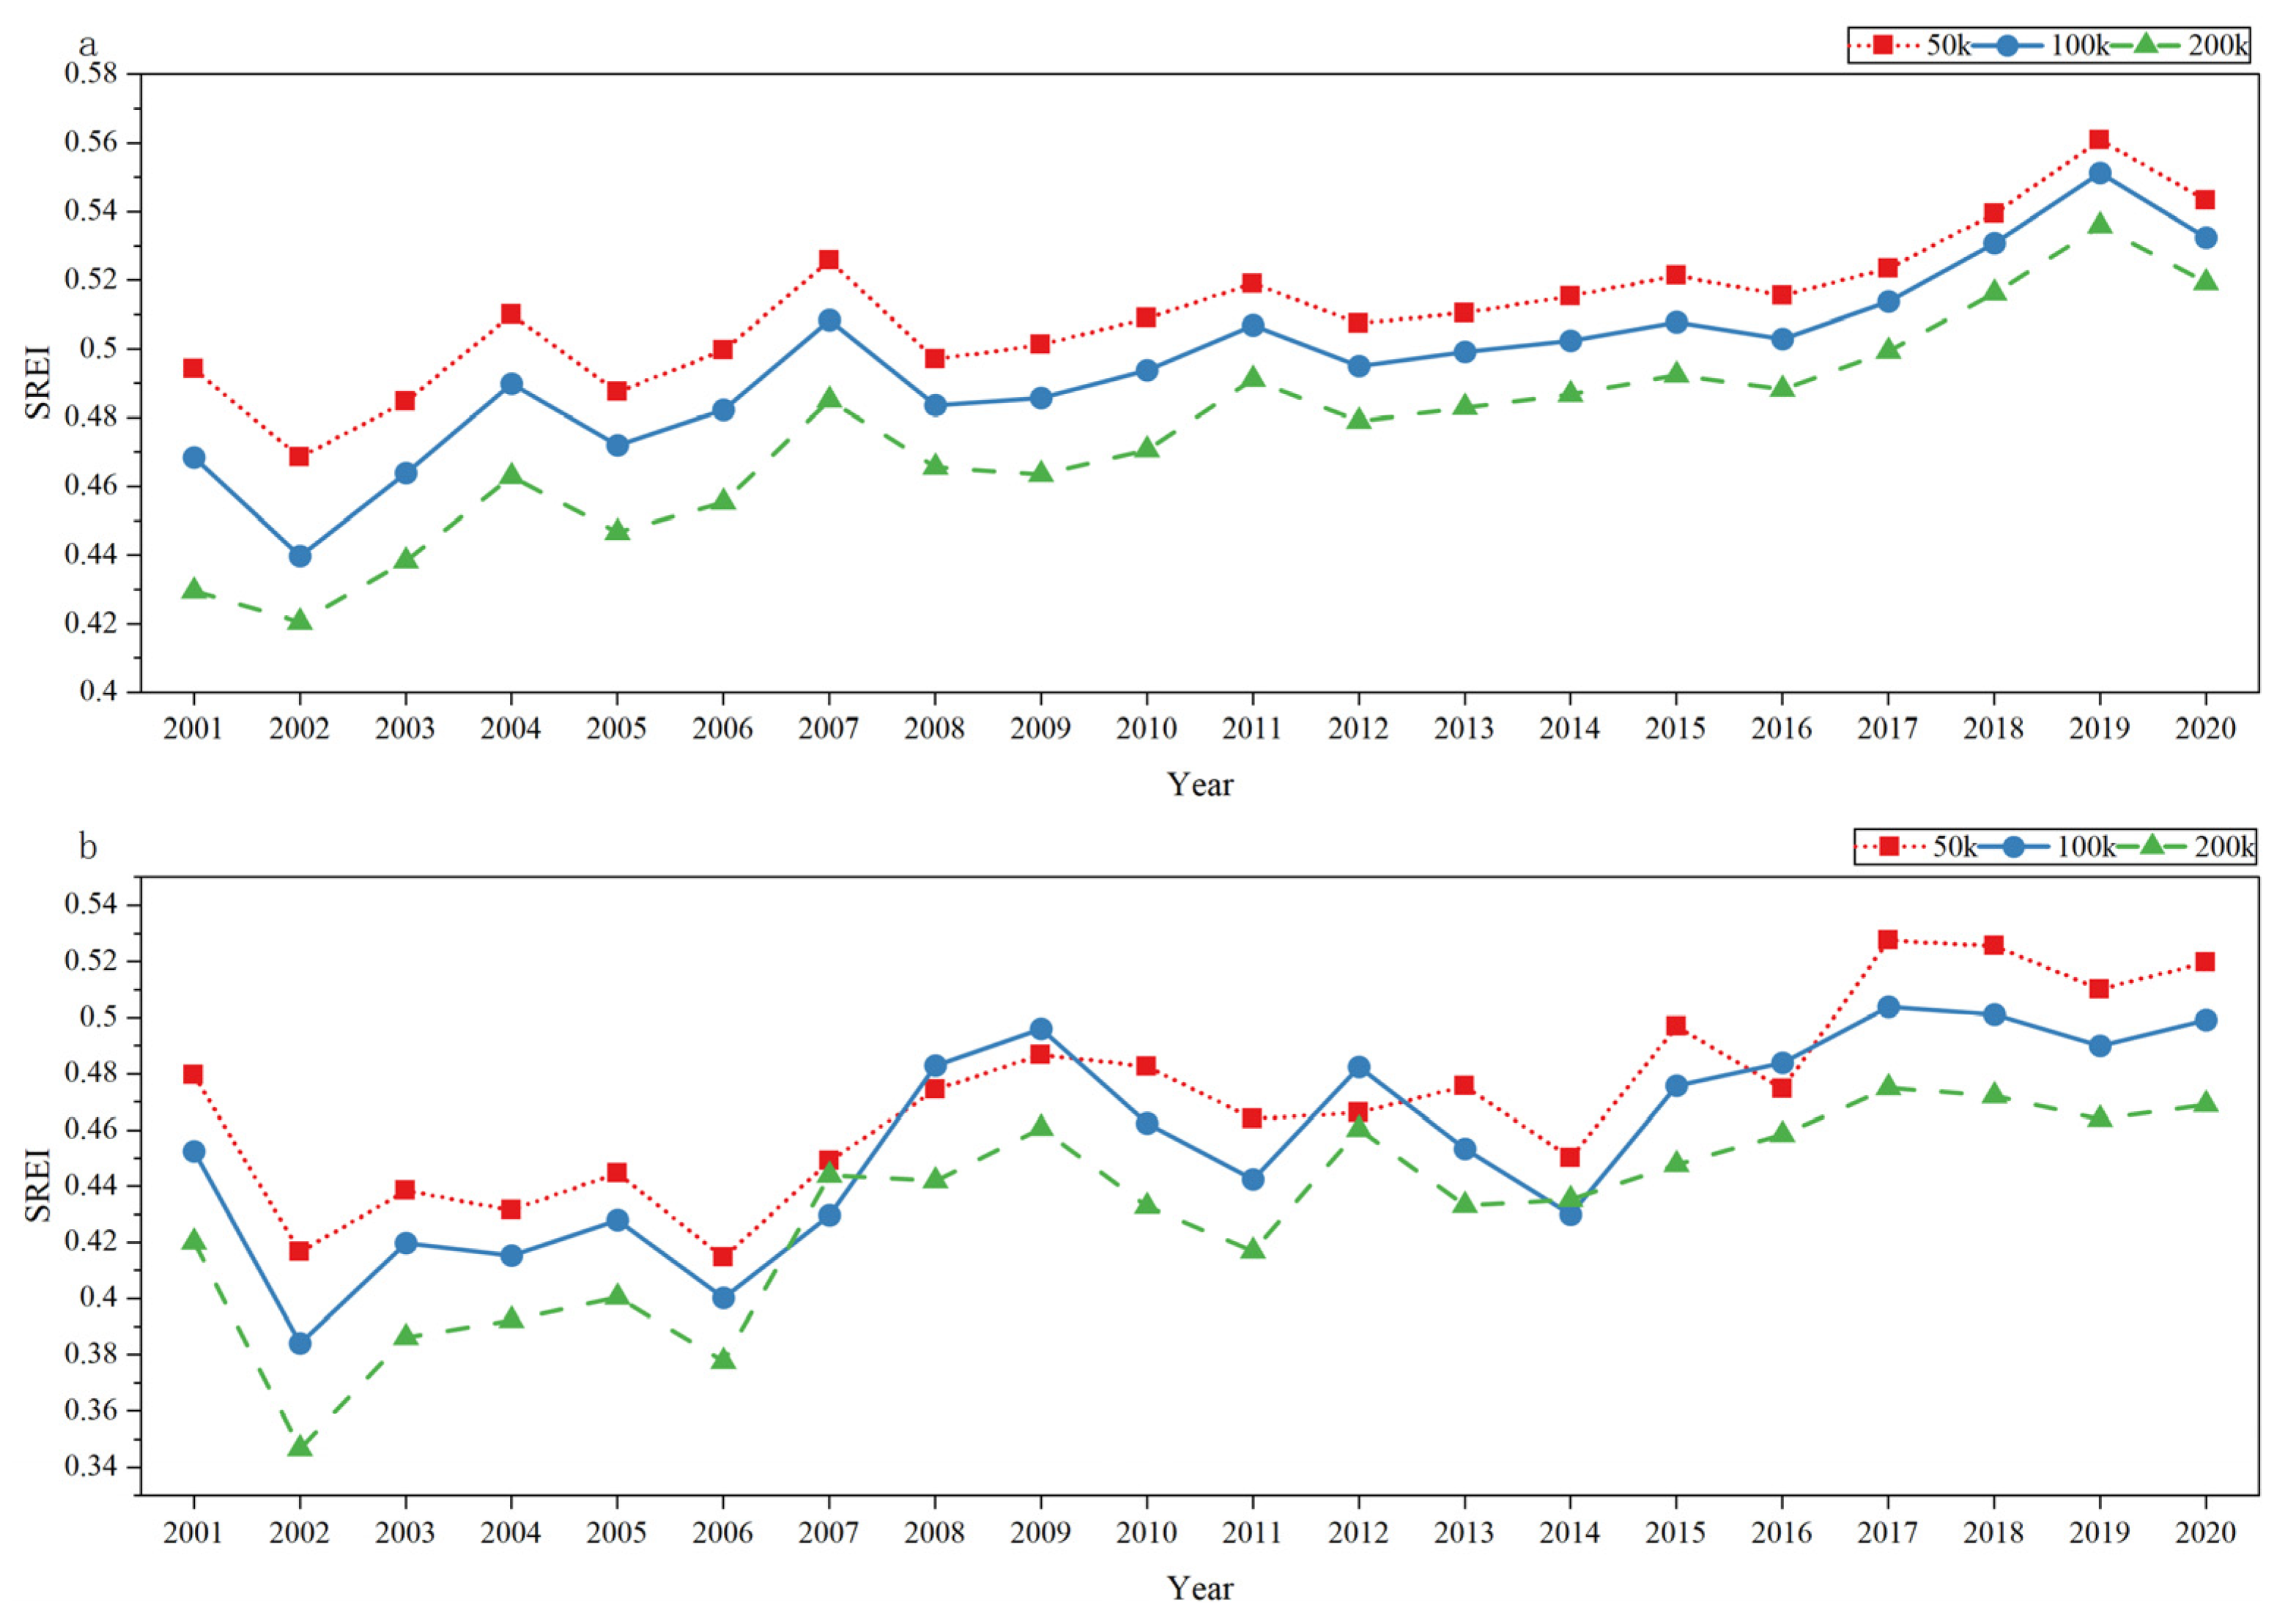
The network risk exposure structure showed robust stability. Figure 12 illustrates the evolutionary trajectory of the SREI under different thresholds. The three curves are highly aligned. Statistical calculations reveal that Pearson correlation coefficients between the benchmark and control groups reached 0.957 and 0.959, respectively. This confirms that the structural characteristic of “breadth expansion, depth lock-in” is an intrinsic property of the network and is unaffected by threshold selection.
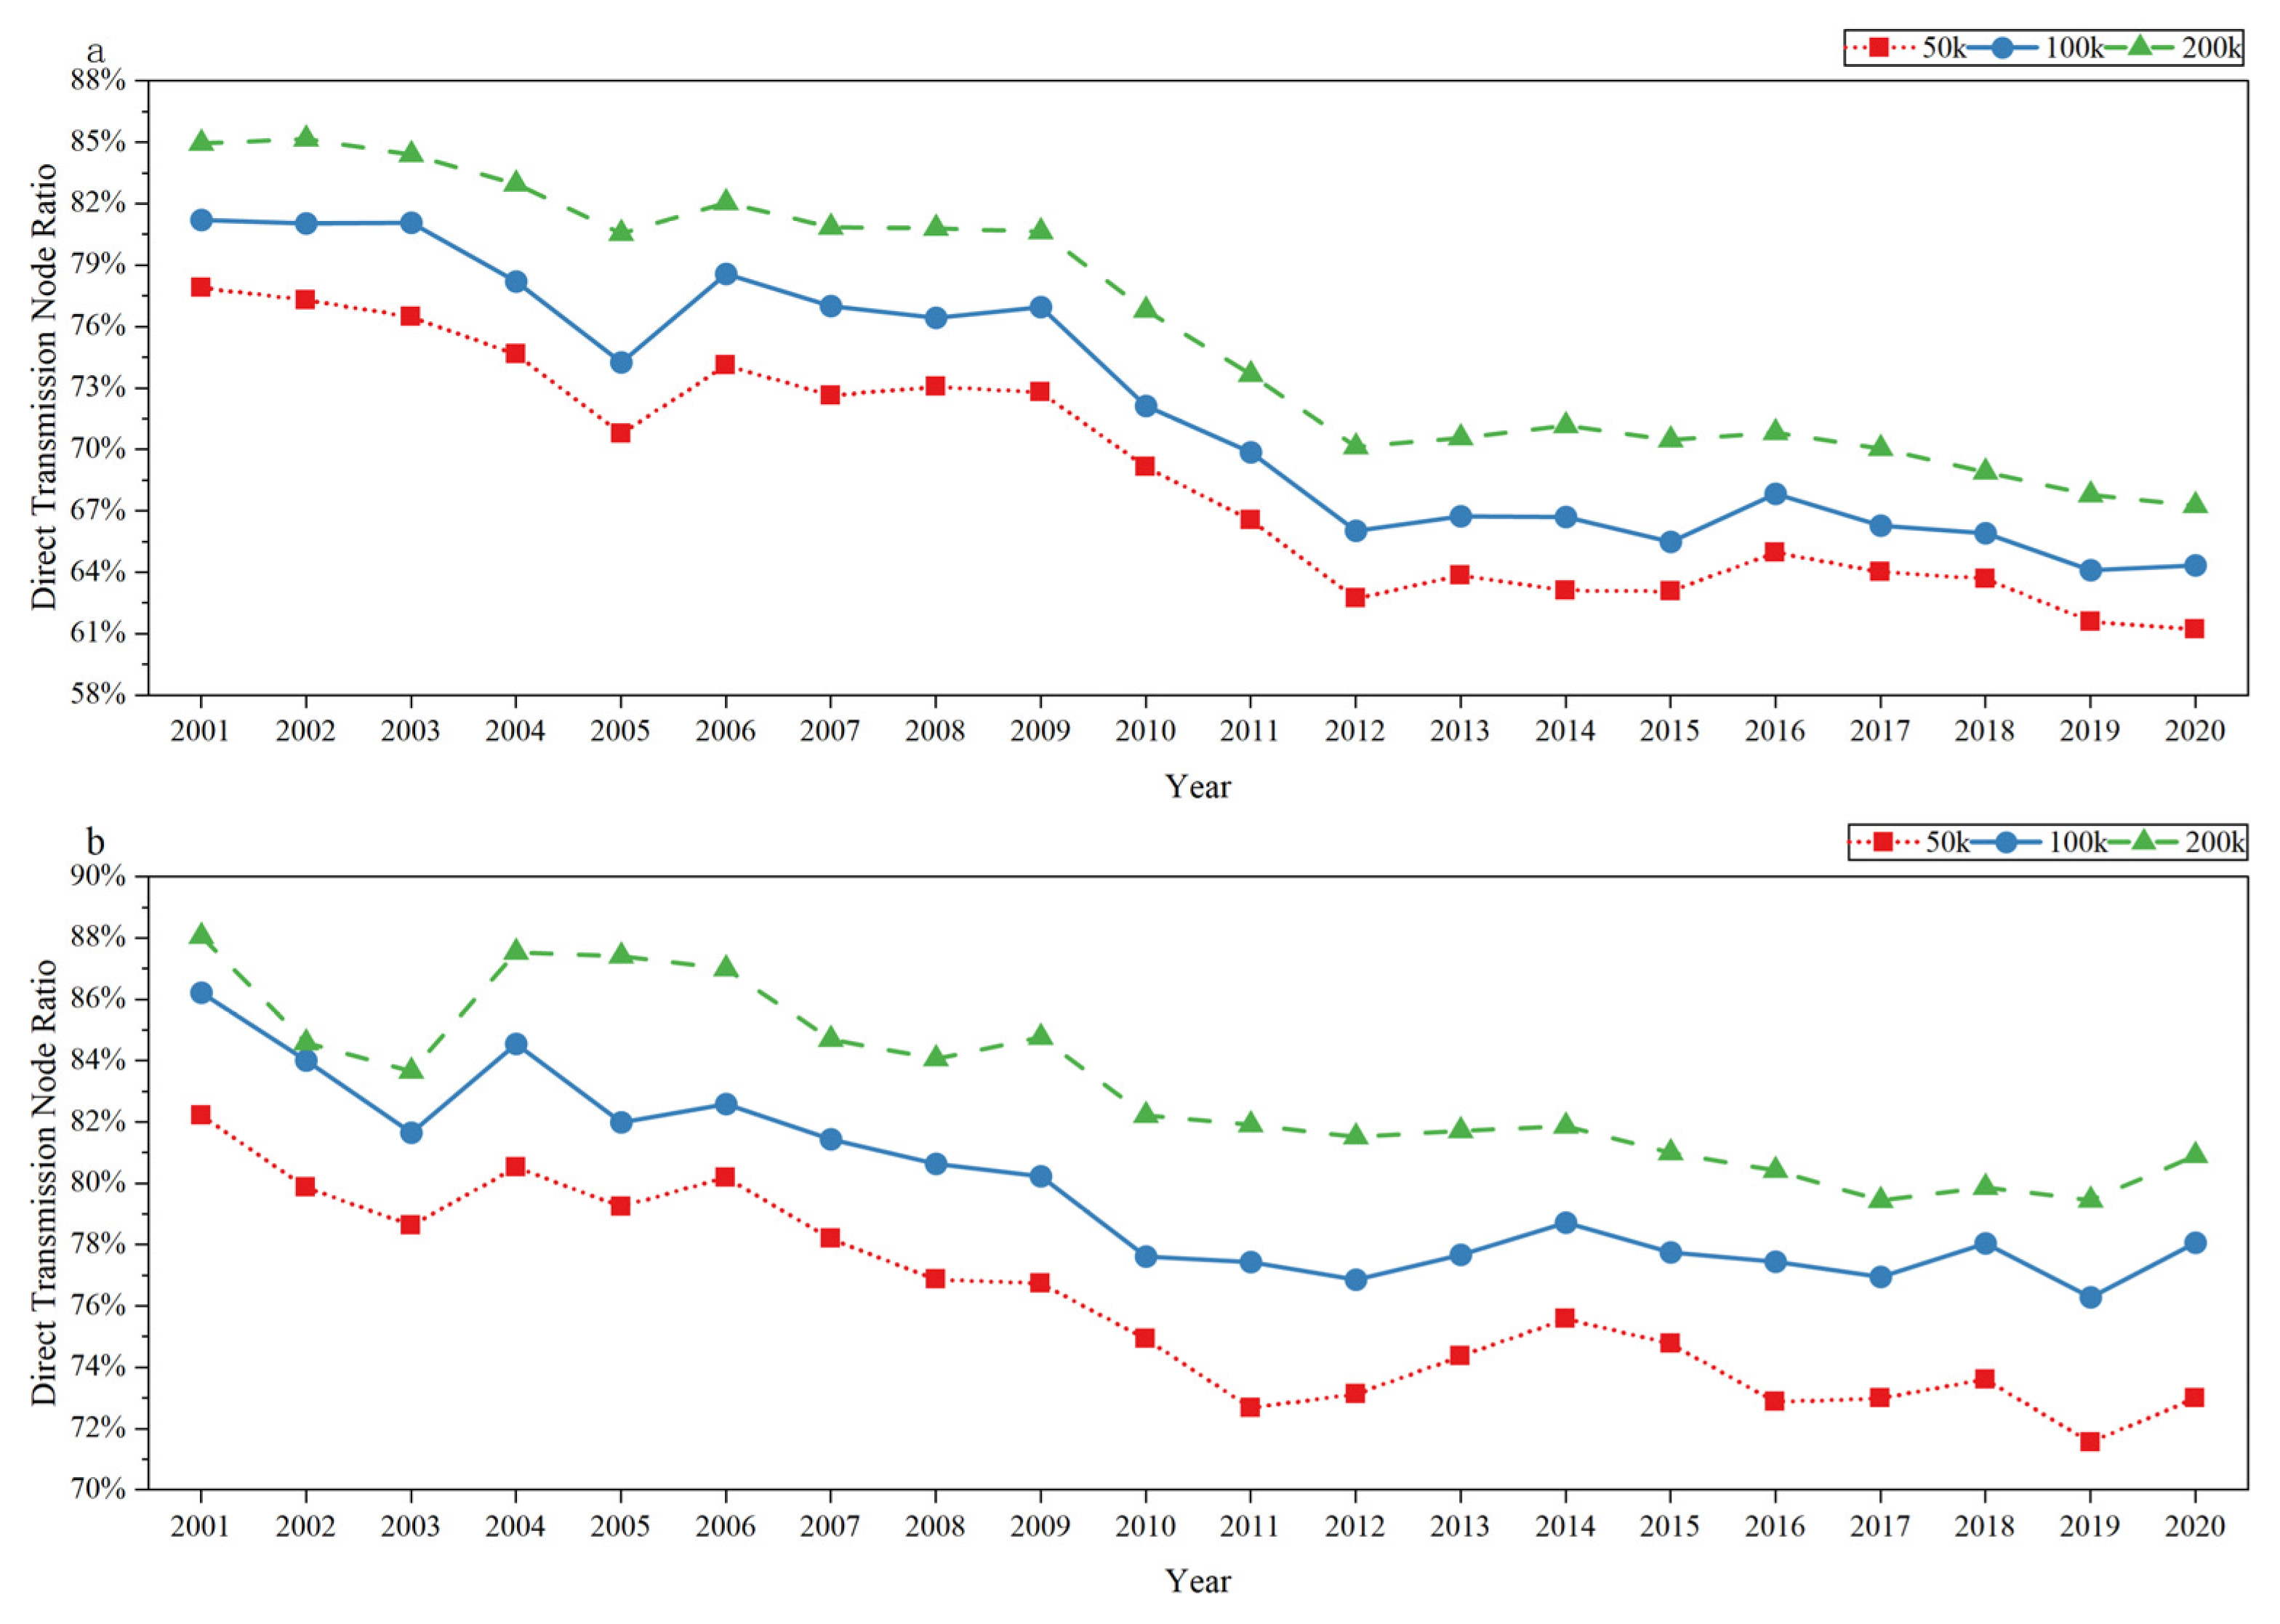
The trend of risk transmission paths becoming “implicit” remained equally consistent. Figure 13 shows that the curves for the proportion of direct transmission nodes follow consistent trends across different schemes. The calculated Pearson correlation coefficients reached 0.984 and 0.952. Such high correlation verifies that the shift in risk sources from “explicit direct links” to “implicit indirect links” is a reliable conclusion. It is independent of the observation granularity.
Key node identification and dynamic risk characteristics also remained consistent. As shown in Figure 14a, the overlap rate of the annual Top 5 key nodes across different threshold schemes is extremely high.(See Appendix E for details) For nodes common to all three schemes, we compared their dynamic risk diagnosis results. Figure 14b indicates a significant positive correlation for both trend risk and uncertainty risk across different schemes. The Pearson correlation coefficients stabilized between 0.68 and 0.76. This suggests that the diagnostic conclusions regarding upstream “solidified dependency” and downstream “exploratory fluctuation” are highly credible. In summary, the model and conclusions proposed in this study possess strong robustness.

5. Discussion and Policy Implications

5.1. Discussion

Through in-depth data mining from 2001 to 2020, this study reveals the asymmetric evolutionary path of risks in China’s agricultural GVC. We present our findings in the following aspects.

5.1.1. The Duality of “Risk Exposure”: Superficial Diversification Concealing Deep Concentration

Existing literature often evaluates supply chain security based on the growth of trade volume or the expansion of trade partners [25]. However, our measurement of the risk exposure structure refines this perspective. Empirical evidence reveals that although the number of China’s agricultural trade partners has increased significantly, the proportion of strongly connected nodes on the upstream demand side has exhibited a long-term decline. This ratio decreased from nearly 30% in 2002 to around 16%. Crucially, these few core nodes have consistently accounted for over 60% of the economic connection strength. This implies that the expansion of the trade network represents merely a nominal expansion, whereas deep dependency relationships have increasingly concentrated towards a few core partners. The continuous rise in the SREI further confirms that China’s agriculture is experiencing a structural paradox of “breadth expansion and depth lock-in.” This indicates that simple market diversification strategies may fail to mitigate the structural risks inherent in dependency depth. On the contrary, they might exacerbate systemic vulnerability due to the rising complexity of the network structure.

5.1.2. The Concealment of “Transmission Paths”: Risk Sources Shifting from Explicit to Implicit

Traditional supply chain risk management often focuses on direct partners. However, our analysis of the risk transmission backbone network reveals a concerning trend: risks are becoming “implicit.” Within the upstream demand side backbone network, the proportion of direct transmission nodes steadily decreased from 81% in 2001 to 64% in 2020. Correspondingly, the proportion of indirect transmission nodes increased. This indicates that as industrial chains lengthen, the sources of risk are shifting from observable and controllable direct trade partners toward more concealed and harder-to-trace secondary or multi-tier suppliers. This finding offers empirical support for the “cascading effect” hypothesis within the agricultural context. As risk pathways become more complex and elongated, minor indirect shocks are more likely to amplify into systemic crises via hidden channels, thereby undermining the effectiveness of monitoring systems that rely solely on direct trade linkages [4,35]. Furthermore, the evolution of geographical distribution exhibits a distinct contrast: while downstream paths have broadly diffused toward emerging markets, upstream supply sources remain confined to restructuring among a few technology- or resource-endowed major economies. This asymmetry fails to achieve true geographical decentralization.

5.1.3. The Asymmetric Evolution of “Key Nodes”: Exploratory Volatility vs. Solidified Dependence

Existing literature often posits that globalization can simultaneously diversify and mitigate risks stemming from both upstream supply and downstream demand [7]. However, our dynamic assessment of key nodes reveals distinctly asymmetric risk patterns across the value chain. The downstream supply side exhibits what we term “exploratory risk.” High-risk nodes are primarily concentrated in service-related sectors, such as accommodation and catering, within emerging market economies including South Korea and Singapore. These nodes are characterized by high volatility and rapid turnover, indicating frequent shifts in risk exposure. This pattern reflects the fact that China’s agricultural exports, in actively exploring new markets to capture higher added value, are inevitably accompanied by heightened market uncertainty. By contrast, the upstream demand side displays a pattern of “solidified dependence.” Risk sources have consistently and persistently concentrated in critical channels, including the chemical industry (e.g., South Korea and Germany) and wholesale and retail trade (e.g., the United States and Canada). Although these nodes exhibit lower volatility, they have long occupied central positions within the network. This configuration constitutes a form of structural lock-in that is difficult to dislodge. This divergence highlights the asymmetric consequences of participation in GVCs for developing economies. In effect, downstream market volatility is absorbed as the cost of export expansion, while upstream, structural dependence on a limited set of core nodes remains entrenched due to the inherent monopoly of technology and resource endowments.

5.2. Policy Implications

The findings suggest that enhancing system resilience requires a strategic pivot from general diversification to precision targeting. This is particularly urgent for the “Core Dependency” identified in the upstream input network. Given the high structural lock-in in sectors like seeds and fertilizers, mere import diversification often fails to dilute the monopoly power of dominant nodes. Therefore, policymakers should prioritize establishing “Technology Substitution Lists” for critical high-dependency inputs. This measure aims to accelerate domestic breakthroughs in core technologies. Complementing this, a “Strategic Resource Reserve Mechanism” should be implemented for essential input factors such as breeding stock and potash. Unlike traditional grain stockpiling, this specific mechanism focuses on production inputs. This dual approach aims to build a physical buffer against supply shocks originating from the highly concentrated upstream backbone.
In contrast, addressing the “Exploratory Volatility” on the downstream demand side calls for market-oriented monitoring and hedging instruments rather than rigid substitution. The primary risk here stems from the uncertainty of emerging markets. To mitigate this, a “Global Demand Volatility Monitoring System” is essential to track real-time purchasing signals from major export destinations. Furthermore, as enterprises expand into RCEP member countries, they should be encouraged to utilize “cross-border risk hedging instruments” such as export credit insurance and futures. These financial tools can effectively lock in export margins against external demand instability. Simultaneously, the stability of the massive domestic market can serve as a “ballast stone” to absorb these fluctuations.
Beyond these direct linkages, regulatory oversight must urgently upgrade its toolkit to manage the “Implicit Risks” shifting toward indirect nodes. Traditional trade statistics cannot capture the cascading effects hidden in the deep network. Therefore, adopting “Multi-tier Supplier Mapping” technologies becomes imperative. This visualization tool allows regulators to see beyond Tier-1 suppliers. It exposes bottlenecks in the indirect supply chain. Moreover, “Network Stress Testing” should be mandated for core agricultural nodes. By simulating extreme scenarios like the simultaneous failure of secondary and tertiary suppliers, policymakers can evaluate systemic resilience. This allows them to prepare contingency plans before hidden risks trigger a cascading collapse.

5.3. Limitations and Future Research Directions

Although this study expands the network research perspective of global value chains, several limitations should be acknowledged. The reliance on OECD multi-regional Input–Output data requires a relatively high level of aggregation, which constrains the identification of subnational heterogeneity and may obscure localized risk dynamics within individual countries. As a result, certain internal transmission mechanisms and region-specific vulnerabilities are likely underrepresented within the current macroscopic perspective. Future research should prioritize multi-scale integration and higher-resolution modeling. Beyond macro-level inter-country linkages, greater attention should be directed toward domestic agricultural circulation, particularly within large and structurally diverse economies such as China. Incorporating provincial-level statistics or customs-based transaction data would allow for the construction of higher-resolution domestic networks, thereby enabling the identification of internal bottlenecks and localized sources of risk. Moreover, given the distinctive characteristics of the regional economic nexus, future research should undertake a focused examination of the agricultural economic network encompassing Mainland China, Hong Kong and Taiwan. Analyzing these regions within a unified yet internally differentiated analytical framework would generate deeper insights into intra-regional risk transmission pathways, thereby supporting the development of coordinated and resilient risk management strategies adapted to this specific trade structure.

Author Contributions

Conceptualization, F.H. and K.P.; methodology, K.P.; software, S.W.; validation, K.P., S.W. and W.C.; formal analysis, F.H.; investigation, S.W.; resources, K.P.; data curation, S.W.; writing—original draft preparation, K.P.; writing—review and editing, W.C.; visualization, K.P.; supervision, S.W.; project administration, F.H.; funding acquisition, F.H. All authors have read and agreed to the published version of the manuscript.

Funding

This work was supported by Major Project of National Social Science Foundation of China (23&ZD049).

Institutional Review Board Statement

Not applicable.

Informed Consent Statement

Not applicable.

Data Availability Statement

Data generated or analysed during the study are available from the corresponding author by request.

Acknowledgments

The successful completion of this research would not have been possible without the support and assistance of many individuals and organizations. I would like to express my deepest gratitude to all of them.

Conflicts of Interest

The authors declare no conflicts of interest.

Appendix A

Table A1. Correspondence of industrial sector aggregation.
No.Aggregated Industrial SectorNo.Original Industrial Sector
1Agriculture1Agriculture, hunting, forestry
2Fishing and aquaculture
2Mining and Quarrying3Mining and quarrying, energy producing products
4Mining and quarrying, non-energy producing products
5Mining support service activities
14Other non-metallic mineral products
3Food Processing and Manufacturing6Food products, beverages and tobacco
4Textiles and Apparel7Textiles, textile products, leather and footwear
5Wood and Printing8Wood and products of wood and cork
9Paper products and printing
6Chemical Industry10Coke and refined petroleum products
11Chemical and chemical products
12Pharmaceuticals, medicinal chemical and botanical products
13Rubber and plastics products
7Metal Products15Basic metals
16Fabricated metal products
8Machinery and Equipment Manufacturing17Computer, electronic and optical equipment
18Electrical equipment
19Machinery and equipment, nec
20Motor vehicles, trailers and semi-trailers
21Other transport equipment
22Manufacturing nec; repair and installation of machinery and equipment
9Electricity and Water Supply23Electricity, gas, steam and air conditioning supply
24Water supply; sewerage, waste management and remediation activities
10Construction25Construction
11Wholesale and Retail Trade26Wholesale and retail trade; repair of motor vehicles
12Logistics27Land transport and transport via pipelines
28Water transport
29Air transport
30Warehousing and support activities for transportation
31Postal and courier activities
13Accommodation and Food Services32Accommodation and food service activities
14Publishing, Audiovisual and Broadcasting Activities33Publishing, audiovisual and broadcasting activities
15Telecommunications34Telecommunications
16Internet and Other Information Services35IT and other information services
17Financial Services36Financial and insurance activities
18Real Estate37Real estate activities
19Professional and Technical Activities38Professional, scientific and technical activities
20Administrative and Support Services39Administrative and support services
21Public Administration and Social Security40Public administration and defence; compulsory social security
22Education41Education
23Human Health and Social Work Activities42Human health and social work activities
24Arts and Entertainment43Arts, entertainment and recreation
25Other Service Activities44Other service activities
26Activities of Households as Employers45Activities of households as employers; undifferentiated goods- and services-producing activities of households for own use

Appendix B

Table A2. Statistics of network edges and value retention under different thresholds.
Threshold ($)Removed Edges (%)Retained Value (%)
10k42.4399.9967
20k50.0199.9932
50k59.8299.9828
100k66.8299.9665
200k73.2299.9367
500k80.5899.8596
1 m85.2499.7517

Appendix C

Algorithm A1: Identification of strongly connected nodes ( k ) via the Weaver Index
% INPUT: W_raw (Vector of raw economic connection weights)
% OUTPUT: k_star (The identified number of strong core nodes)

%% 1. Pre-processing and Data Cleaning
% Filter out zero/negative weights to ensure valid entropy calculation
W = W_raw (W_raw > 0);
N = length (W);

if N == 0
  k_star = 0;
  return;
end

%% 2. Calculate Entropy Difference Contribution (Delta H)
% First Normalization: Convert weights to probabilities for Shannon Entropy
P = W/sum (W);
H_total = -sum(P .* log(P)); % System Entropy (Equation (4))

Delta_H = zeros(N, 1);

for i = 1:N
  % Simulate node failure: Remove node i
  W_temp = W;
  W_temp(i) = [];

  % Re-normalize remaining weights
  P_temp = W_temp/sum(W_temp);

  % Calculate entropy after removal
  H_sub = -sum(P_temp .* log(P_temp));

  % Contribution is the drop in system entropy (Equation (5))
  Delta_H(i) = H_total − H_sub;
end

%% 3. Weaver Index Optimization
% Sort contributions descending
% Note: Tie-breaking is based on original weights W if Delta_H values are equal
[V_sorted, ~] = sort(Delta_H, ‘descend’);

% Second Normalization: Normalize contributions for Weaver Index calculation
V_norm = V_sorted/sum(V_sorted);

min_variance = inf; % Initialize with infinity
k_star = 1;

for k = 1:N
  % Theoretical uniform share if the top k nodes were perfectly equal
  theta = 1/k;

  % Calculate Goodness-of-Fit Variance (Weaver Index, Equation (6))
  % Head part: Deviation from uniform distribution
  var_head = sum((V_norm(1:k) − theta).^2);
  % Tail part: Deviation from zero (insignificance)
  var_tail = sum(V_norm(k+1:end).^2);

  current_variance = var_head + var_tail;

  % Update optimal k if variance is minimized
  if current_variance < min_variance
    min_variance = current_variance;
    k_star = k;
  end
end

%% 4. Apply Sparsity Constraint (Stopping Criterion)
% Heuristic limit: k* cannot exceed 60% of N to ensure a “minority core”
sparsity_limit = floor(0.6 * N);
k_star = min(k_star, sparsity_limit);

% Result: The top k_star nodes in the sorted list are identified as the core.

Appendix D

Table A3. Comparison of the top 5 key risk transmission nodes on supply and demand sides under different regional aggregation scenarios.
Year2005201020152020
ScenariosUnmergedBenchmarkCNHK_MergedUnmergedBenchmarkCNHK_MergedUnmergedBenchmarkCNHK_MergedUnmergedBenchmarkCNHK_Merged
UpstreamTWN_S6NZL_S3TWN_S6KOR_S6NZL_S3KOR_S6KOR_S6KOR_S6KOR_S6KOR_S6KOR_S6KOR_S6
USA_S11KOR_S6USA_S11TWN_S6KOR_S6TWN_S6DEU_S6DEU_S6DEU_S6NZL_S3NZL_S3NZL_S3
KOR_S6USA_S11KOR_S6NZL_S3DEU_S6NZL_S3USA_S11ESP_S11USA_S11CAN_S11CAN_S11CAN_S11
NZL_S3AUS_S1NZL_S3DEU_S6USA_S11DEU_S6ESP_S11NZL_S3ESP_S11USA_S11USA_S11USA_S11
HKG_S11BRA_S1BRA_S1USA_S11BEL_S6USA_S11NZL_S3USA_S11NZL_S3FRA_S11FRA_S11FRA_S11
DownstreamKOR_S3KOR_S3KOR_S3KOR_S3KOR_S3KOR_S3KOR_S3KOR_S3KOR_S3KOR_S13KOR_S13KOR_S13
CAN_S3JPN_S13CAN_S3IDN_S6KOR_S13KOR_S13KOR_S13KOR_S13KOR_S13CAN_S3SGP_S13CAN_S3
JPN_S13CAN_S3JPN_S13KOR_S13IDN_S6IDN_S6JPN_S13CAN_S3JPN_S13SGP_S13CAN_S3SGP_S13
GBR_S3SGP_S13GBR_S3JPN_S13JPN_S13JPN_S13SGP_S13JPN_S13SGP_S13JPN_S13JPN_S13JPN_S13
SGP_S13GBR_S3SGP_S13CAN_S3CAN_S3CAN_S3CAN_S3SGP_S13CAN_S3DEU_S20DEU_S20DEU_S20

Appendix E

Table A4. Comparison of the top 5 key risk transmission nodes on supply and demand sides under different threshold scenarios.
Year2005201020152020
Threshold50k100k200k50k100k200k50k100k200k50k100k200k
UpstreamNZL_S3NZL_S3USA_S11KOR_S6NZL_S3DEU_S6KOR_S6KOR_S6KOR_S6NZL_S3KOR_S6KOR_S6
KOR_S6KOR_S6KOR_S6NZL_S3KOR_S6KOR_S6NZL_S3DEU_S6NZL_S3KOR_S6NZL_S3NZL_S3
USA_S11USA_S11NZL_S3DEU_S6DEU_S6NZL_S3DEU_S6ESP_S11USA_S11USA_S11CAN_S11CAN_S11
PER_S3AUS_S1JPN_S11ESP_S11USA_S11USA_S11ESP_S11NZL_S3DEU_S6CAN_S11USA_S11USA_S11
AUS_S1BRA_S1BRA_S1PER_S3BEL_S6BEL_S6USA_S11USA_S11BRA_S1FRA_S11FRA_S11DEU_S6
DownstreamKOR_S3KOR_S3KOR_S3KOR_S3KOR_S3KOR_S3KOR_S3KOR_S3KOR_S3KOR_S13KOR_S13SGP_S13
CAN_S3JPN_S13JPN_S13KOR_S13KOR_S13KOR_S13KOR_S13KOR_S13KOR_S13SGP_S13SGP_S13CAN_S3
JPN_S13CAN_S3USA_S13CAN_S3IDN_S6IDN_S6CAN_S3CAN_S3SGP_S13ESP_S3CAN_S3IDN_S6
SGP_S13SGP_S13CAN_S3GBR_S3JPN_S13JPN_S13SGP_S13JPN_S13JPN_S13CAN_S3JPN_S13JPN_S13
GBR_S3GBR_S3DEU_S3IDN_S6CAN_S3BRA_S3GBR_S3SGP_S13DEU_S3GBR_S3DEU_S20KOR_S13

References

  1. Christopher, M.; Peck, H. Building the Resilient Supply Chain. Int. J. Logist. Manag. 2004, 15, 1–13. [Google Scholar] [CrossRef]
  2. Piprani, A.Z.; Jaafar, N.I.; Ali, S.M.; Mubarik, M.S.; Shahbaz, M. Multi-Dimensional Supply Chain Flexibility and Supply Chain Resilience: The Role of Supply Chain Risks Exposure. Oper. Manag. Res. 2022, 15, 307–325. [Google Scholar] [CrossRef]
  3. De Ruiter, M.C.; Van Loon, A.F. The Challenges of Dynamic Vulnerability and How to Assess It. iScience 2022, 25, 104720. [Google Scholar] [CrossRef]
  4. Helbing, D. Globally Networked Risks and How to Respond. Nature 2013, 497, 51–59. [Google Scholar] [CrossRef]
  5. Wang, X.; Wu, H.; Li, L.; Liu, L. Uncertainty, GVC Participation and the Export of Chinese Firms. J. Econ. Surv. 2022, 36, 634–661. [Google Scholar] [CrossRef]
  6. Awokuse, T.; Lim, S.; Santeramo, F.; Steinbach, S. Robust Policy Frameworks for Strengthening the Resilience and Sustainability of Agri-Food Global Value Chains. Food Policy 2024, 127, 102714. [Google Scholar] [CrossRef]
  7. Tabe-Ojong, M.P., Jr.; Nana, I.; Zimmermann, A.; Jafari, Y. Trends and Evolution of Global Value Chains in Food and Agriculture: Implications for Food Security and Nutrition. Food Policy 2024, 127, 102679. [Google Scholar] [CrossRef]
  8. Mehrabi, Z.; Delzeit, R.; Ignaciuk, A.; Levers, C.; Braich, G.; Bajaj, K.; Amo-Aidoo, A.; Anderson, W.; Balgah, R.A.; Benton, T.G.; et al. Research Priorities for Global Food Security under Extreme Events. One Earth 2022, 5, 756–766. [Google Scholar] [CrossRef]
  9. Komarek, A.M.; De Pinto, A.; Smith, V.H. A Review of Types of Risks in Agriculture: What We Know and What We Need to Know. Agric. Syst. 2020, 178, 102738. [Google Scholar] [CrossRef]
  10. Yu, Y.; Ma, D.; Wang, Y. Structural Resilience Evolution and Vulnerability Assessment of Semiconductor Materials Supply Network in the Global Semiconductor Industry. Int. J. Prod. Econ. 2024, 270, 109172. [Google Scholar] [CrossRef]
  11. Angelidis, G.; Ioannidis, E.; Makris, G.; Antoniou, I.; Varsakelis, N. Competitive Conditions in Global Value Chain Networks: An Assessment Using Entropy and Network Analysis. Entropy 2020, 22, 1068. [Google Scholar] [CrossRef] [PubMed]
  12. Kano, L.; Tsang, E.W.K.; Yeung, H.W. Global Value Chains: A Review of the Multi-Disciplinary Literature. J. Int. Bus. Stud. 2020, 51, 577–622. [Google Scholar] [CrossRef]
  13. Baldwin, R.; Freeman, R. Risks and Global Supply Chains: What We Know and What We Need to Know. Annu. Rev. Econ. 2022, 14, 153–180. [Google Scholar] [CrossRef]
  14. Cohen, M.A.; Kouvelis, P. Revisit of AAA Excellence of Global Value Chains: Robustness, Resilience, and Realignment. Prod. Oper. Manag. 2021, 30, 633–643. [Google Scholar] [CrossRef]
  15. Zahoor, N.; Wu, J.; Khan, H.; Khan, Z. De-Globalization, International Trade Protectionism, and the Reconfigurations of Global Value Chains. Manag. Int. Rev. 2023, 63, 823–859. [Google Scholar] [CrossRef]
  16. Bednarski, L.; Roscoe, S.; Blome, C.; Schleper, M.C. Geopolitical Disruptions in Global Supply Chains: A State-of-the-Art Literature Review. Prod. Plan. Control 2023, 36, 536–562. [Google Scholar] [CrossRef]
  17. Meng, B.; Gao, Y.; Zhang, T.; Ye, J.; Zhang, Y. The US–China Relations and the Impact of the US–China Trade War: Global Value Chains Analyses. Econ. Anal. Policy 2025, 87, 1896–1908. [Google Scholar] [CrossRef]
  18. Khorana, S.; Escaith, H.; Ali, S.; Kumari, S.; Do, Q. The Changing Contours of Global Value Chains Post-COVID: Evidence from the Commonwealth. J. Bus. Res. 2022, 153, 75–86. [Google Scholar] [CrossRef]
  19. Phillips, W.; Roehrich, J.K.; Kapletia, D.; Alexander, E. Global Value Chain Reconfiguration and COVID-19: Investigating the Case for More Resilient Redistributed Models of Production. Calif. Manag. Rev. 2022, 64, 71–96. [Google Scholar] [CrossRef]
  20. Gao, X.; Xu, R.; Zhu, K.; Zhang, Y.; Yang, C. Economic Impacts of Major Emergencies from the Perspective of Global Production Networks: A Case Study of the COVID-19 Pandemic. J. Int. Trade 2021, 7, 1–20. [Google Scholar] [CrossRef]
  21. Kalogiannidis, S.; Papadopoulou, C.-I.; Loizou, E.; Chatzitheodoridis, F. Risk, Vulnerability, and Resilience in Agriculture and Their Impact on Sustainable Rural Economy Development: A Case Study of Greece. Agriculture 2023, 13, 1222. [Google Scholar] [CrossRef]
  22. Mandal, U.K.; Karim, F.; Yu, Y.; Ghosh, A.; Zahan, T.; Mallick, S.; Kamruzzaman, M.; Paul, P.L.C.; Mainuddin, M. Assessing Vulnerability and Climate Risk to Agriculture for Developing Resilient Farming Strategies in the Ganges Delta. Clim. Risk Manag. 2025, 47, 100690. [Google Scholar] [CrossRef]
  23. Tabari, H.; Willems, P. Global Risk Assessment of Compound Hot-Dry Events in the Context of Future Climate Change and Socioeconomic Factors. npj Clim. Atmos. Sci. 2023, 6, 74. [Google Scholar] [CrossRef]
  24. Belarmino, L.C.; Pabsdorf, M.N.; Padula, A.D. Impacts of the COVID-19 Pandemic on the Production Costs and Competitiveness of the Brazilian Chicken Meat Chain. Economies 2023, 11, 238. [Google Scholar] [CrossRef]
  25. Hu, Q.; Guo, M.; Wang, F.; Shao, L.; Wei, X. External Supply Risk of Agricultural Products Trade along the Belt and Road under the Background of COVID-19. Front. Public Health 2023, 11, 1122081. [Google Scholar] [CrossRef]
  26. Calvia, M. Dissecting Extreme Price Fluctuations in Mineral Fertilizers: Regularities and Co-Movements in Light of Global Food Security. Appl. Econ. Perspect. Policy 2025, 1–19. [Google Scholar] [CrossRef]
  27. Morão, H. The economic consequences of fertilizer supply shocks. Food Policy 2025, 133, 102835. [Google Scholar] [CrossRef]
  28. Vos, R.; Glauber, J.; Hebebrand, C.; Rice, B. Global shocks to fertilizer markets: Impacts on prices, demand and farm profitability. Food Policy 2025, 133, 102790. [Google Scholar] [CrossRef]
  29. Deconinck, K. New evidence on concentration in seed markets. Glob. Food Secur. 2019, 23, 135–138. [Google Scholar] [CrossRef]
  30. Khatri, P.; Kumar, P.; Shakya, K.S.; Kirlas, M.C.; Tiwari, K.K. Understanding the Intertwined Nature of Rising Multiple Risks in Modern Agriculture and Food System. Environ. Dev. Sustain. 2023, 26, 24107–24150. [Google Scholar] [CrossRef]
  31. Alexoaei, A.P.; Cojanu, V.; Coman, C.-I. On Sustainable Consumption: The Implications of Trade in Virtual Water for the EU’s Food Security. Sustainability 2021, 13, 11952. [Google Scholar] [CrossRef]
  32. D’Ignazio, A.; Giovannetti, E. From Exogenous to Endogenous Economic Networks: Internet Applications. J. Econ. Surv. 2006, 20, 757–796. [Google Scholar] [CrossRef]
  33. Yu, D.F.; Wang, C.; Long, R. Theoretical and Applied Research Progress on Production Networks. Ind. Econ. Rev. 2022, 13, 5–18. [Google Scholar] [CrossRef]
  34. Acemoglu, D.; Akcigit, U.; Kerr, W.R. Networks and the Macroeconomy: An Empirical Exploration. NBER Macroecon. Annu. 2015, 30, 273–335. [Google Scholar] [CrossRef]
  35. Taschereau-Dumouchel, M. Cascades and Fluctuations in an Economy with an Endogenous Production Network. Rev. Econ. Stud. 2025, 00, 1–39. [Google Scholar] [CrossRef]
  36. Ibrahim, S.E.; Centeno, M.A.; Patterson, T.S.; Callahan, P.W. Resilience in Global Value Chains: A Systemic Risk Approach. Glob. Perspect. 2021, 2, 27658. [Google Scholar] [CrossRef]
  37. Cai, N.; Huang, C. Simulation of Cluster Risk and Structural Evolution Using Complex Networks. J. Chongqing Univ. Soc. Sci. Ed. 2012, 18, 5–11. [Google Scholar]
  38. Cui, W.; Kang, L.C.; Tang, L.M. Structural Risk Analysis of the Natural Gas Trade Network Under the Russia-Ukraine Conflict and Its Implications for China. Prices Mon. 2022, 8, 37–45. [Google Scholar] [CrossRef]
  39. Yotov, Y.V. The evolution of structural gravity: The workhorse model of trade. Contemp. Econ. Policy 2024, 42, 578–603. [Google Scholar] [CrossRef]
  40. Balogh, J.M.; Aguiar, G.M.B. Determinants of Latin American and the Caribbean agricultural trade: A gravity model approach. Agric. Econ. 2022, 68, 127–136. [Google Scholar] [CrossRef]
  41. Pi, J.C.; Luo, Y.H. Reliability Measurement of the Domestic Circulation: From the Perspective of Cross-Regional Transmission Network Under External Demand Fluctuations. World Econ. Pap. 2024, 6, 1–22. [Google Scholar]
  42. Voicu-Dorobanțu, R. Crisis-Proofing the Fresh: A Multi-Risk Management Approach for Sustainable Produce Trade Flows. Sustainability 2025, 17, 4466. [Google Scholar] [CrossRef]
  43. Qian, S.T.; You, H.; Zhang, X.Y. Research on the Mechanism of Cross-Industry Contagion of Industrial Chain Risk from a Multi-Layer Network Perspective. China Ind. Econ. 2024, 10, 62–80. [Google Scholar] [CrossRef]
  44. Corbo, L.; Corrado, R.; Ferriani, S. A New Order of Things: Network Mechanisms of Field Evolution in the Aftermath of an Exogenous Shock. Organ. Stud. 2016, 37, 323–348. [Google Scholar] [CrossRef]
  45. Statsenko, L.; Scholten, K.; Stevenson, M. The influence of global value chain governance on supply network resilience. Supply Chain Manag. 2025, 30, 161–177. [Google Scholar] [CrossRef]
  46. Chen, W.; Shu, X.; Zhao, X.; Yu, H. Illuminating the global maize trade network: Structure, resilience and supply chain security. Food Secur. 2025, 17, 811–827. [Google Scholar] [CrossRef]
  47. Liu, J.H.; Lu, H.Y.; Huang, G.Y. Research on Risk Industry Identification in the Evolution of the “Dual Circulation” Pattern. China Soft Sci. 2022, 12, 153–164. [Google Scholar]
  48. Pengli, A.; Shen, Q. Mapping Analytical Methods between Input-Output Economics and Network Science. J. Ind. Ecol. 2024, 28, 648–679. [Google Scholar] [CrossRef]
  49. Xie, C.; Li, Z.D.; Wang, G.J.; Zhu, Y.; Zeng, Z.J. Industrial System Structure and Resilience Under the Impact of Major Events: An Empirical Study Based on an Input-Output Integer Programming Network. J. Quant. Econ. 2024, 4, 981–1008. [Google Scholar] [CrossRef]
  50. Ge, C.; Wang, Y. Evolution of Global Value-Added Trade Networks and Response to Risk Transmission. Heliyon 2024, 10, e23816. [Google Scholar] [CrossRef]
  51. Liu, J.Q.; Che, W.H.; Xia, F.J. Analysis of Global Value Chain Trade Network and Response to International Risk Transmission. J. Manag. Sci. China 2021, 24, 1–17. [Google Scholar] [CrossRef]
  52. Cerina, F.; Zhu, Z.; Chessa, A.; Riccaboni, M. World Input-Output Network. PLoS ONE 2015, 10, e0134025. [Google Scholar] [CrossRef]
  53. Fagiolo, G.; Reyes, J.; Schiavo, S. World-trade web: Topological properties, dynamics, and evolution. Phys. Rev. E 2009, 79, 036115. [Google Scholar] [CrossRef] [PubMed]
  54. Hu, C.; Guo, R. Research on Risk Contagion in ESG Industries: An Information Entropy-Based Network Approach. Entropy 2024, 26, 206. [Google Scholar] [CrossRef] [PubMed]
  55. Diebold, F.X.; Yılmaz, K. On the network topology of variance decompositions: Measuring the connectedness of financial firms. J. Econom. 2014, 182, 119–134. [Google Scholar] [CrossRef]
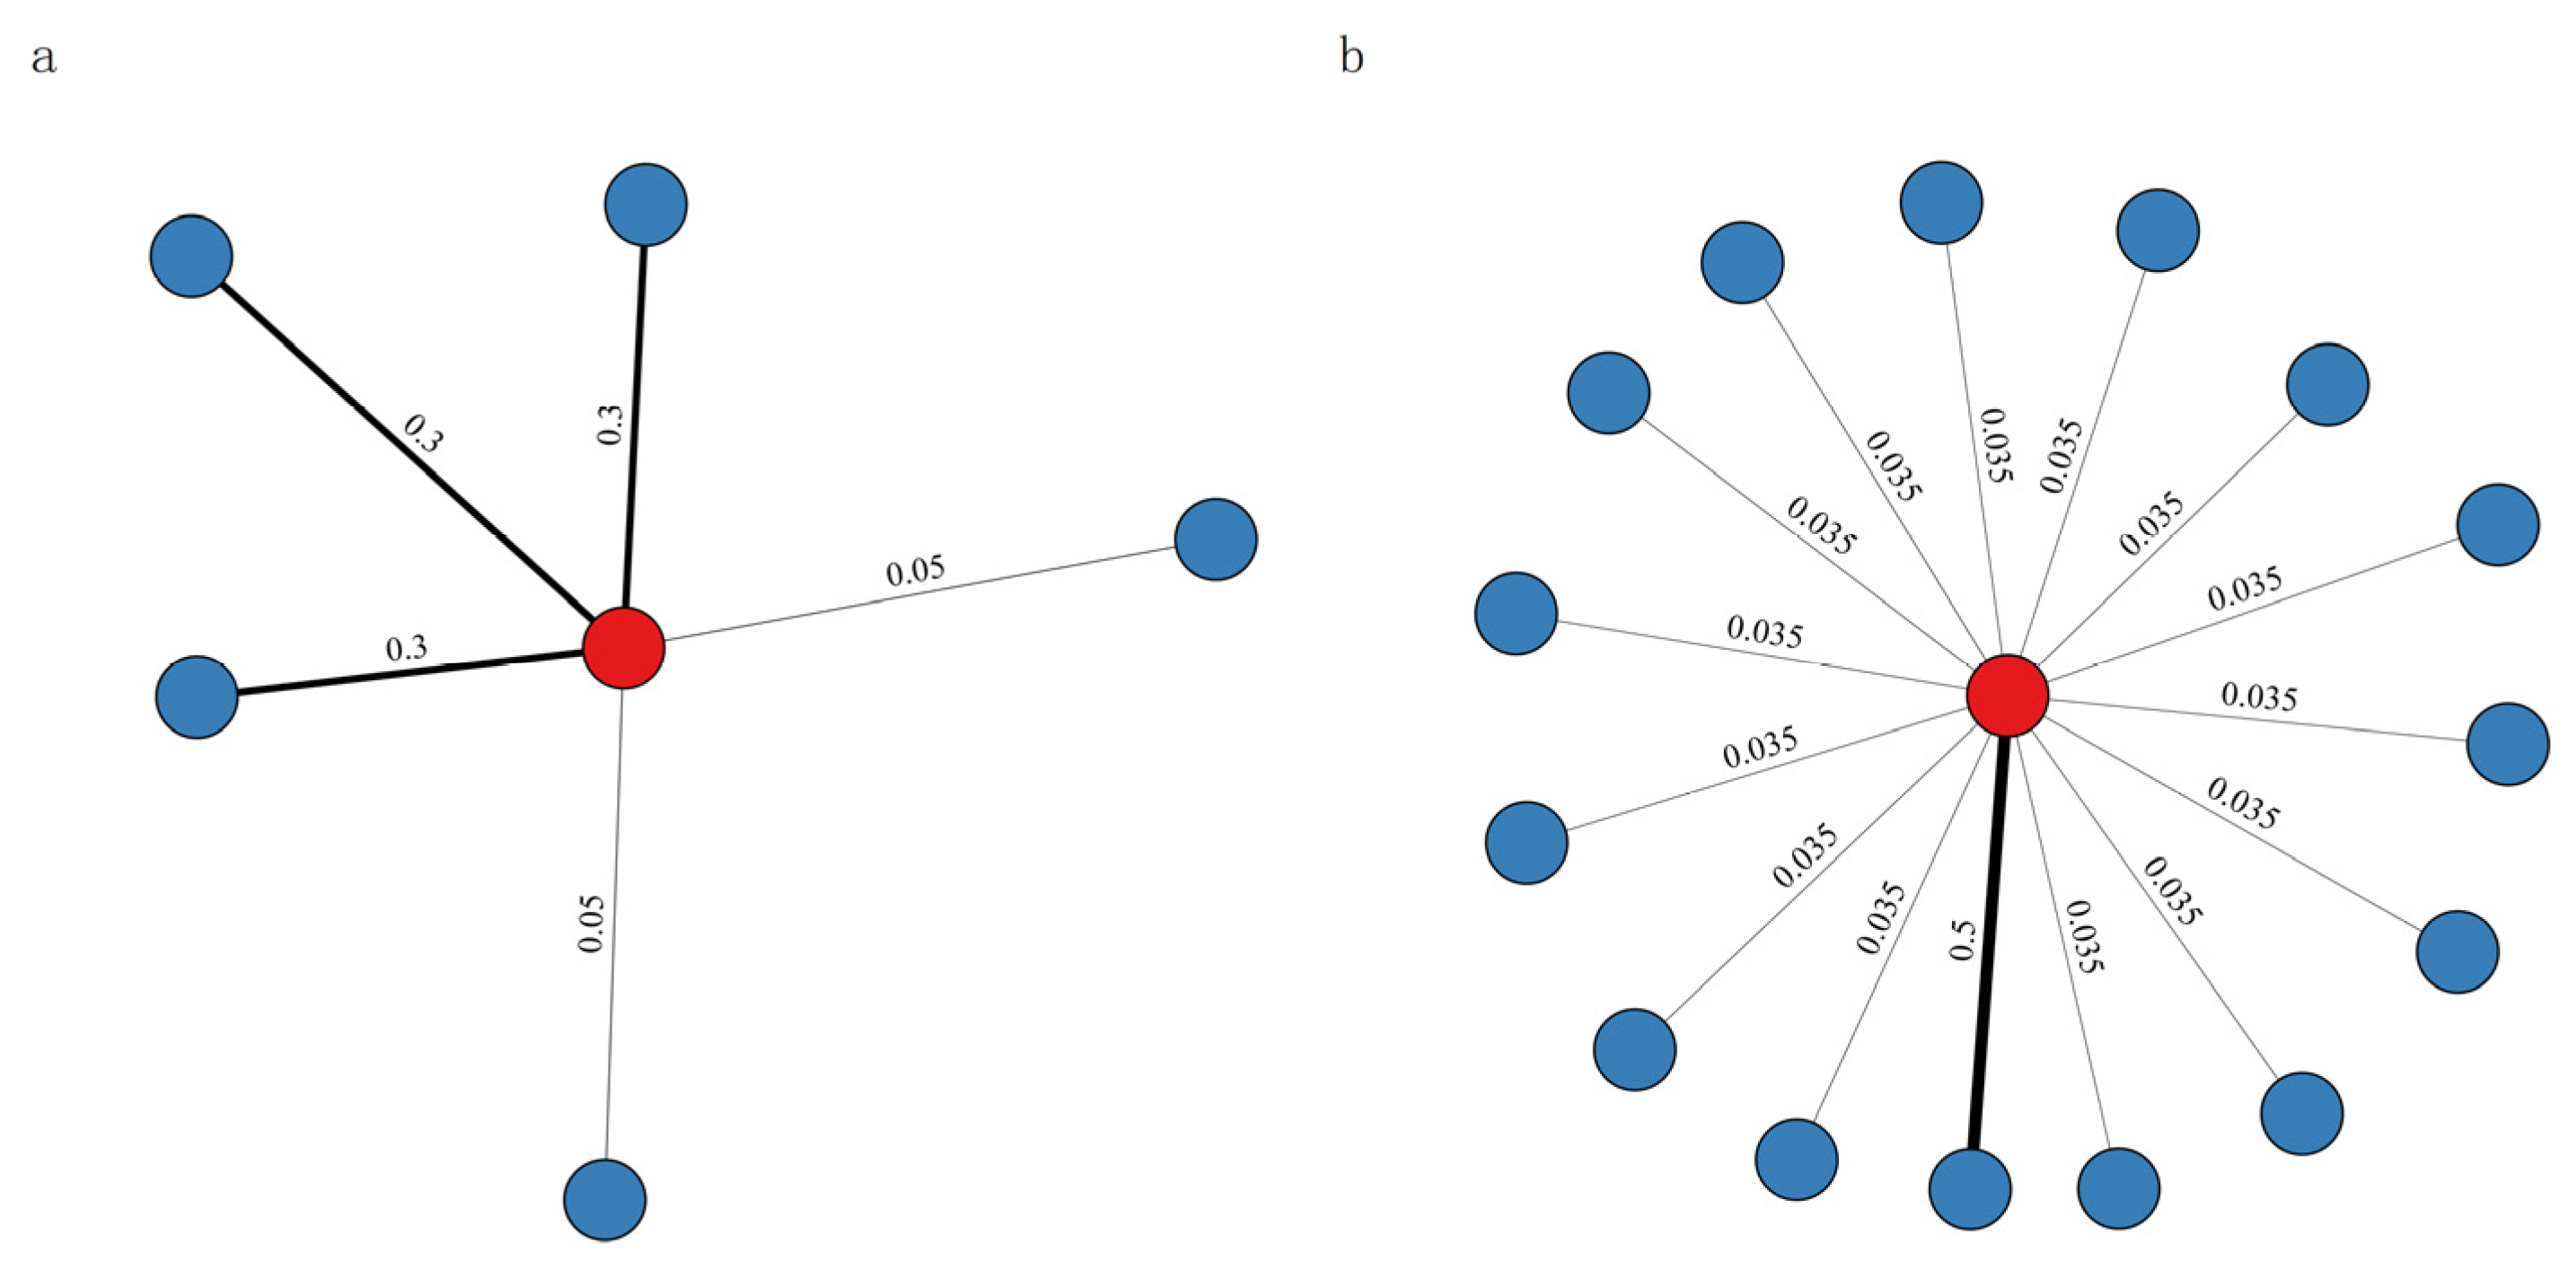
Figure 1. Comparison of network structures: (a) Scenario A; (b) Scenario B.
Sustainability 18 01082 g001
Figure 2. Risk exposure breadth of China’s agricultural GVC network, 2001–2020: (a) number of associated nodes; (b) number of strongly connected nodes; (c) proportion of strongly connected nodes. Note: The threshold for edge filtration is set at $100,000. “Strongly connected nodes” are identified via the Weaver Index ( k ). The proportion is calculated as the ratio of strong nodes ( k ) to the total number of associated nodes ( N ).
Sustainability 18 01082 g002
Figure 3. Risk exposure depth of China’s agricultural GVC network, 2001–2020: (a) association strength; (b) strong association strength; (c) strong association strength ratio. Note: “Association strength” refers to the absolute sum of Direct Consumption/Allocation Coefficients (dimensionless). Panel (b) shows the aggregated strength of core nodes, while Panel (c) represents their percentage share of the total network strength.
Sustainability 18 01082 g003
Figure 4. SREI of China’s Agricultural GVC Network (2001–2020). Note: The Structural Risk Exposure Index (SREI) ranges from [0, 1]. Higher values indicate higher structural risk, characterized by “breadth expansion combined with depth lock-in”.
Sustainability 18 01082 g004
Figure 5. Hierarchical structure of risk transmission in China’s agricultural GVC network, 2001–2020: (a) supply side; (b) demand side. Note: The bars represent the percentage composition of direct transmission nodes (Tier-1) versus indirect transmission nodes (Tier-2 and beyond) within the risk transmission backbone.
Sustainability 18 01082 g005
Figure 6. Composition of economies in the direct transmission tier of the downstream supply-side risk transmission backbone network for China’s agricultural GVC.
Sustainability 18 01082 g006
Figure 7. Composition of economies in the direct transmission tier of the upstream demand-side risk transmission backbone network for China’s agricultural GVC.
Sustainability 18 01082 g007
Figure 8. Risk identification for the top 5 industrial sectors on the supply and demand sides of the risk transmission backbone network for China’s agricultural GVC: (a) 2005; (b) 2010; (c) 2015; (d) 2020.
Sustainability 18 01082 g008
Figure 9. Comparison of SREI trends under different aggregation scenarios: (a) supply side; (b) demand side. Note: The comparison validates robustness across three regional aggregation schemes: Benchmark (Mainland China, Hong Kong, and Taiwan aggregated), Unmerged (No regional aggregation), and CNHK_Merged (Mainland China and Hong Kong aggregated).
Sustainability 18 01082 g009
Figure 10. Comparison of the proportion of direct transmission in risk transmission backbone networks under different aggregation scenarios: (a) supply side; (b) demand side. Note: The validation covers three scenarios: Benchmark (all three regions aggregated), Unmerged (treating regions independently), and CNHK_Merged (aggregating only Mainland China and Hong Kong).
Sustainability 18 01082 g010
Figure 11. Robustness test on critical node identification and dynamic risk features under different aggregation scenarios: (a) overlap rate of top 5 transmission nodes (b) correlation of dynamic risk features for overlapping critical nodes. Note: Scenarios include Benchmark (all aggregated), Unmerged (independent), and CNHK_Merged (Mainland + HK). Note: Scenarios include Benchmark (all aggregated), Unmerged (independent), and CNHK_Merged (Mainland + HK).
Sustainability 18 01082 g011
Figure 12. Comparison of the evolution of SREI under different thresholds: (a) supply side; (b) demand side. Note: The comparison validates robustness by contrasting the Benchmark ($100k) scenario against a Relaxed ($50k) and a Strict ($200k) scenario.
Sustainability 18 01082 g012
Figure 13. Comparison of the proportion of direct transmission in risk transmission backbone networks under different thresholds: (a) supply side; (b) demand side. Note: The comparison includes Benchmark ($100k), Relaxed ($50k), and Strict ($200k) thresholds to verify the consistency of risk transmission patterns.
Sustainability 18 01082 g013
Figure 14. Sensitivity test on critical node identification and dynamic risk features across thresholds: (a) overlap rate of top 5 transmission nodes (b) Correlation of dynamic risk features for overlapping critical nodes. Note: Scenarios include the Benchmark ($100k) threshold versus Relaxed ($50k) and Strict ($200k) thresholds.
Sustainability 18 01082 g014
Table 1. Merged industrial sectors.
No.Industrial SectorNo.Industrial Sector
S1AgricultureS14Publishing, Audiovisual and Broadcasting Activities
S2Mining and QuarryingS15Telecommunications
S3Food Processing and ManufacturingS16Internet and Other Information Services
S4Textiles and ApparelS17Financial Services
S5Wood and PrintingS18Real Estate
S6Chemical IndustryS19Professional and Technical Activities
S7Metal ProductsS20Administrative and Support Services
S8Machinery and Equipment ManufacturingS21Public Administration and Social Security
S9Electricity and Water SupplyS22Education
S10ConstructionS23Human Health and Social Work Activities
S11Wholesale and Retail TradeS24Arts and Entertainment
S12LogisticsS25Other Service Activities
S13Accommodation and Food ServicesS26Activities of Households as Employers
Table 2. Response of SREI to variations in network breadth and depth.
Metric/ScenarioScenario AScenario B
Partners Number ( N )515
Effective Core ( k )31
Breadth Risk ( R strong )0.600.07
Depth Risk ( I strong )0.900.50
SREI0.360.47
Table 3. Top 5 nodes in the downstream supply-side risk transmission backbone network of China’s agricultural GVC.
Rank20012005201020152020
SectorWDCSectorWDCSectorWDCSectorWDCSectorWDC
1JPN_S133.66%KOR_S34.81%KOR_S33.03%KOR_S33.36%KOR_S132.01%
2KOR_S32.68%JPN_S133.03%KOR_S132.55%KOR_S132.71%SGP_S132.01%
3KOR_S132.20%CAN_S32.67%IDN_S61.82%CAN_S31.84%CAN_S31.80%
4GBR_S31.71%SGP_S131.60%JPN_S131.82%JPN_S131.84%JPN_S131.59%
5USA_S131.71%GBR_S31.25%CAN_S31.33%SGP_S131.84%DEU_S201.16%
WDC—Weighted Degree Centrality.
Table 4. Top 5 nodes in the upstream demand-side risk transmission backbone network of China’s agricultural GVC.
Rank20012005201020152020
SectorWDCSectorWDCSectorWDCSectorWDCSectorWDC
1KOR_S61.84%NZL_S31.96%NZL_S32.26%KOR_S62.08%KOR_S61.33%
2DEU_S61.59%KOR_S61.77%KOR_S62.11%DEU_S61.54%NZL_S31.33%
3ARG_S11.35%USA_S111.77%DEU_S61.64%ESP_S111.41%CAN_S111.21%
4RUS_S61.35%AUS_S11.21%USA_S111.33%NZL_S31.41%USA_S111.21%
5DNK_S121.10%BRA_S11.21%BEL_S61.17%USA_S111.41%FRA_S111.10%
WDC—Weighted Degree Centrality.
Disclaimer/Publisher’s Note: The statements, opinions and data contained in all publications are solely those of the individual author(s) and contributor(s) and not of MDPI and/or the editor(s). MDPI and/or the editor(s) disclaim responsibility for any injury to people or property resulting from any ideas, methods, instructions or products referred to in the content.