


Abstract
This paper proposes a complete solution, implementing a low-cost, energy-independent, network-connected, and scalable environmental air parameter monitoring system. It features a remote sensing module which provides environmental data to a cloud-based server and a software application for real-time and historical data processing, standardized air quality indices computations, and a comprehensive visualization of environmental parameters evolutions. A fully operational prototype was built around a low-cost micro-controller connected to low-cost air parameter sensors and a GSM modem, powered by a stand-alone renewable energy-based power supply. The associated software platform has been developed by using Microsoft Power Platform technologies. The collected data is transmitted from sensors to a remote server via the GSM modem using custom-built JSON structures. From there, data is extracted and forwarded to a database accessible to users through a dedicated application. The overall accuracy of the air quality monitoring system has been thoroughly validated both in controlled indoor environment and against a trusted outdoor air quality reference station. The proposed air parameters monitoring solution paves the way for future research actions, such as the classification of polluted sites or prediction of air parameter variations in the site of interest.
1. Introduction
One of the main global problems that threatens human health in today’s society is the poor quality of the air we breathe. This is due to increasingly intensive human activities such as use of transport, and the rapid growth of the industry and agricultural sectors. In this context, the extensive use of air quality monitoring devices has become a mandatory support action in the effort to protect both citizens health and the environment itself [1].
With the increase in air pollution, the network of monitoring stations established to estimate the exposure levels requires an increase in the spatial density of monitoring stations [2]. Their efficient use involve adaptive sampling methods, variable monitoring frequency, and remote operation via stable network connection. Associated data should be processed according to relevant international standards and made available in real-time to all the potential end users [3,4]. All these requirements come with a significant increase in air quality monitoring stations’ construction, maintenance, and operation costs.
This is why low-cost, low-power, possibly off-grid (energy independent) monitoring equipment may represent an efficient solution to the above-presented problem. In the same spirit, a good air quality management should select the pollutants to be monitored according to the probable emission sources in the area of concern.
Unfortunately, conventional environmental monitoring stations are outdated and lacking key features, which hinders their ability to provide real-time, relevant data at a reasonable cost. Most certified air quality monitoring stations use techniques such as air sample collection and sample analysis in laboratories. These systems produce accurate results but they are expensive, difficult to use, and do not deliver pollutant concentrations in real time.
In recent years, a significant research effort has been invested in the development of affordable and efficient instruments for measuring air quality and pollution degree [5,6,7]. Complex standards and modern sensor networks have started to be used for air quality measurement [8]. Smart city components, including IoT or cloud computing devices, along with extensive sensor networks, are beginning to be used for air quality monitoring over large geographical areas [9,10].
Several limitations, such as limited interoperability with heterogeneous devices, reduced scalability when expanding networks with additional nodes, insufficient data security, lack of transparency and compliance with established standards, and low energy autonomy, may be found in the existing commercial solutions. Moreover, the means of presenting the resulting data is not standardized and the associated measurements still require validation and certification.
In an effort to overcome these limitations, this paper proposes a complete solution for a low-cost, energy-independent, network-connected, and scalable environmental air parameter monitoring system in which both hardware and software subsystems were built using state of the art technologies. This solution includes not only a sensing module, which deals with data acquisition and its transmission to the cloud, but also a software application, which effectively allows the remote monitoring of pollutant concentration and air quality index computation. Furthermore, both hardware and software components were carefully selected and integrated in order to obtain an all-around cost-effective air quality monitoring system for use in outdoor environments.
The paper is organized as follows. Section 2 introduces the basic elements of the air quality pollutants, measurements, and standards. Section 3 presents the hardware and software architecture of the proposed air monitoring system. The system prototype is presented in Section 4 and Section 5 concludes this paper.
2. Air Quality Monitoring
In the relevant literature, the Air Quality Index (AQI) is used as a global measure of air pollution in order to assess the current level of air quality and tracks at least three relevant air contaminants [11,12]. Based on pollutant concentrations, this index is calculated using a formula that depends on the associated standard. Currently, the relevant pollutants included in AQIs are PM10, PM2.5, O3, NO2, SO2, and CO.
There are several AQI standards that provide a standardized way to compare air quality across geographical sites, as detailed in [13].
The basic AQI involves using a number n of pollutant concentrations within the formula described by (1).
with being the maximum allowable limit per air pollutant, i, and representing the averaged concentration of pollutant i measured over a 24 h time interval.
The EPA Air Quality Index EPA-AQI is a standard developed by the U.S. Environmental Protection Agency (EPA), which uses the formula described in (2) [14].
with being the ambient concentration of the pollutant being measured, the concentration breakpoint at the lower bound of the specific concentration range, and the concentration breakpoint at the upper bound of the specific concentration range. is the AQI value at the lower bound of the specific index interval. is the AQI value at the upper bound of the specific index interval.
The European Common Air Quality Index (CAQI) uses a similar formula as (2), but pollutants and their accepted ranges are different—see Table 1 [15].
Table 1.
Air quality index values, associated pollutants ranges and levels of concern.
Table 1 shows a synthetic perspective of various AQI standards in relation to the levels of pollution. Please note that the pollutants with “*” exponent are averaged at one hour, the ones with the “**” exponent were computed with an eight-hour average, and the ones with “***” were those with a 24 h average.
3. Architecture of the Air Monitoring System
The proposed system was designed to meet the requirements stated in Section 1, i.e., enhanced interoperability, scalability compliance with standards, energy autonomy, and cost-effectiveness. It is composed of a sensor platform, a remote database for data logging, and a central management system, and runs on the end-user computing system.
The sensor hardware platform is built around a micro-controller and equipped with pollutant sensors and communication devices. It is a portable unit that can be placed in the area of concern. This platform is controlled via a local software, which is responsible for both capturing pollutant data and sending it to a remote server in the cloud, which can be further denoted as bridge server. The sensor platform is powered by an off-grid electrical energy generation system.
An environment monitoring system was developed and runs on a Microsoft server under a customized software environment, which was defined in the Microsoft 365 Education cloud platform (M365) associated with our University. It imports data from the bridge server and effectively allows for the remote monitoring of air quality via advanced processing and visualization through a dedicated human–machine interface (HMI).
3.1. Sensor Platform
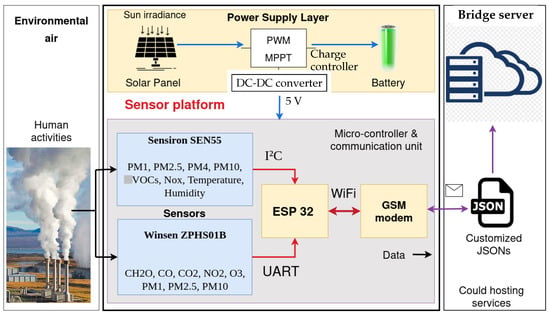
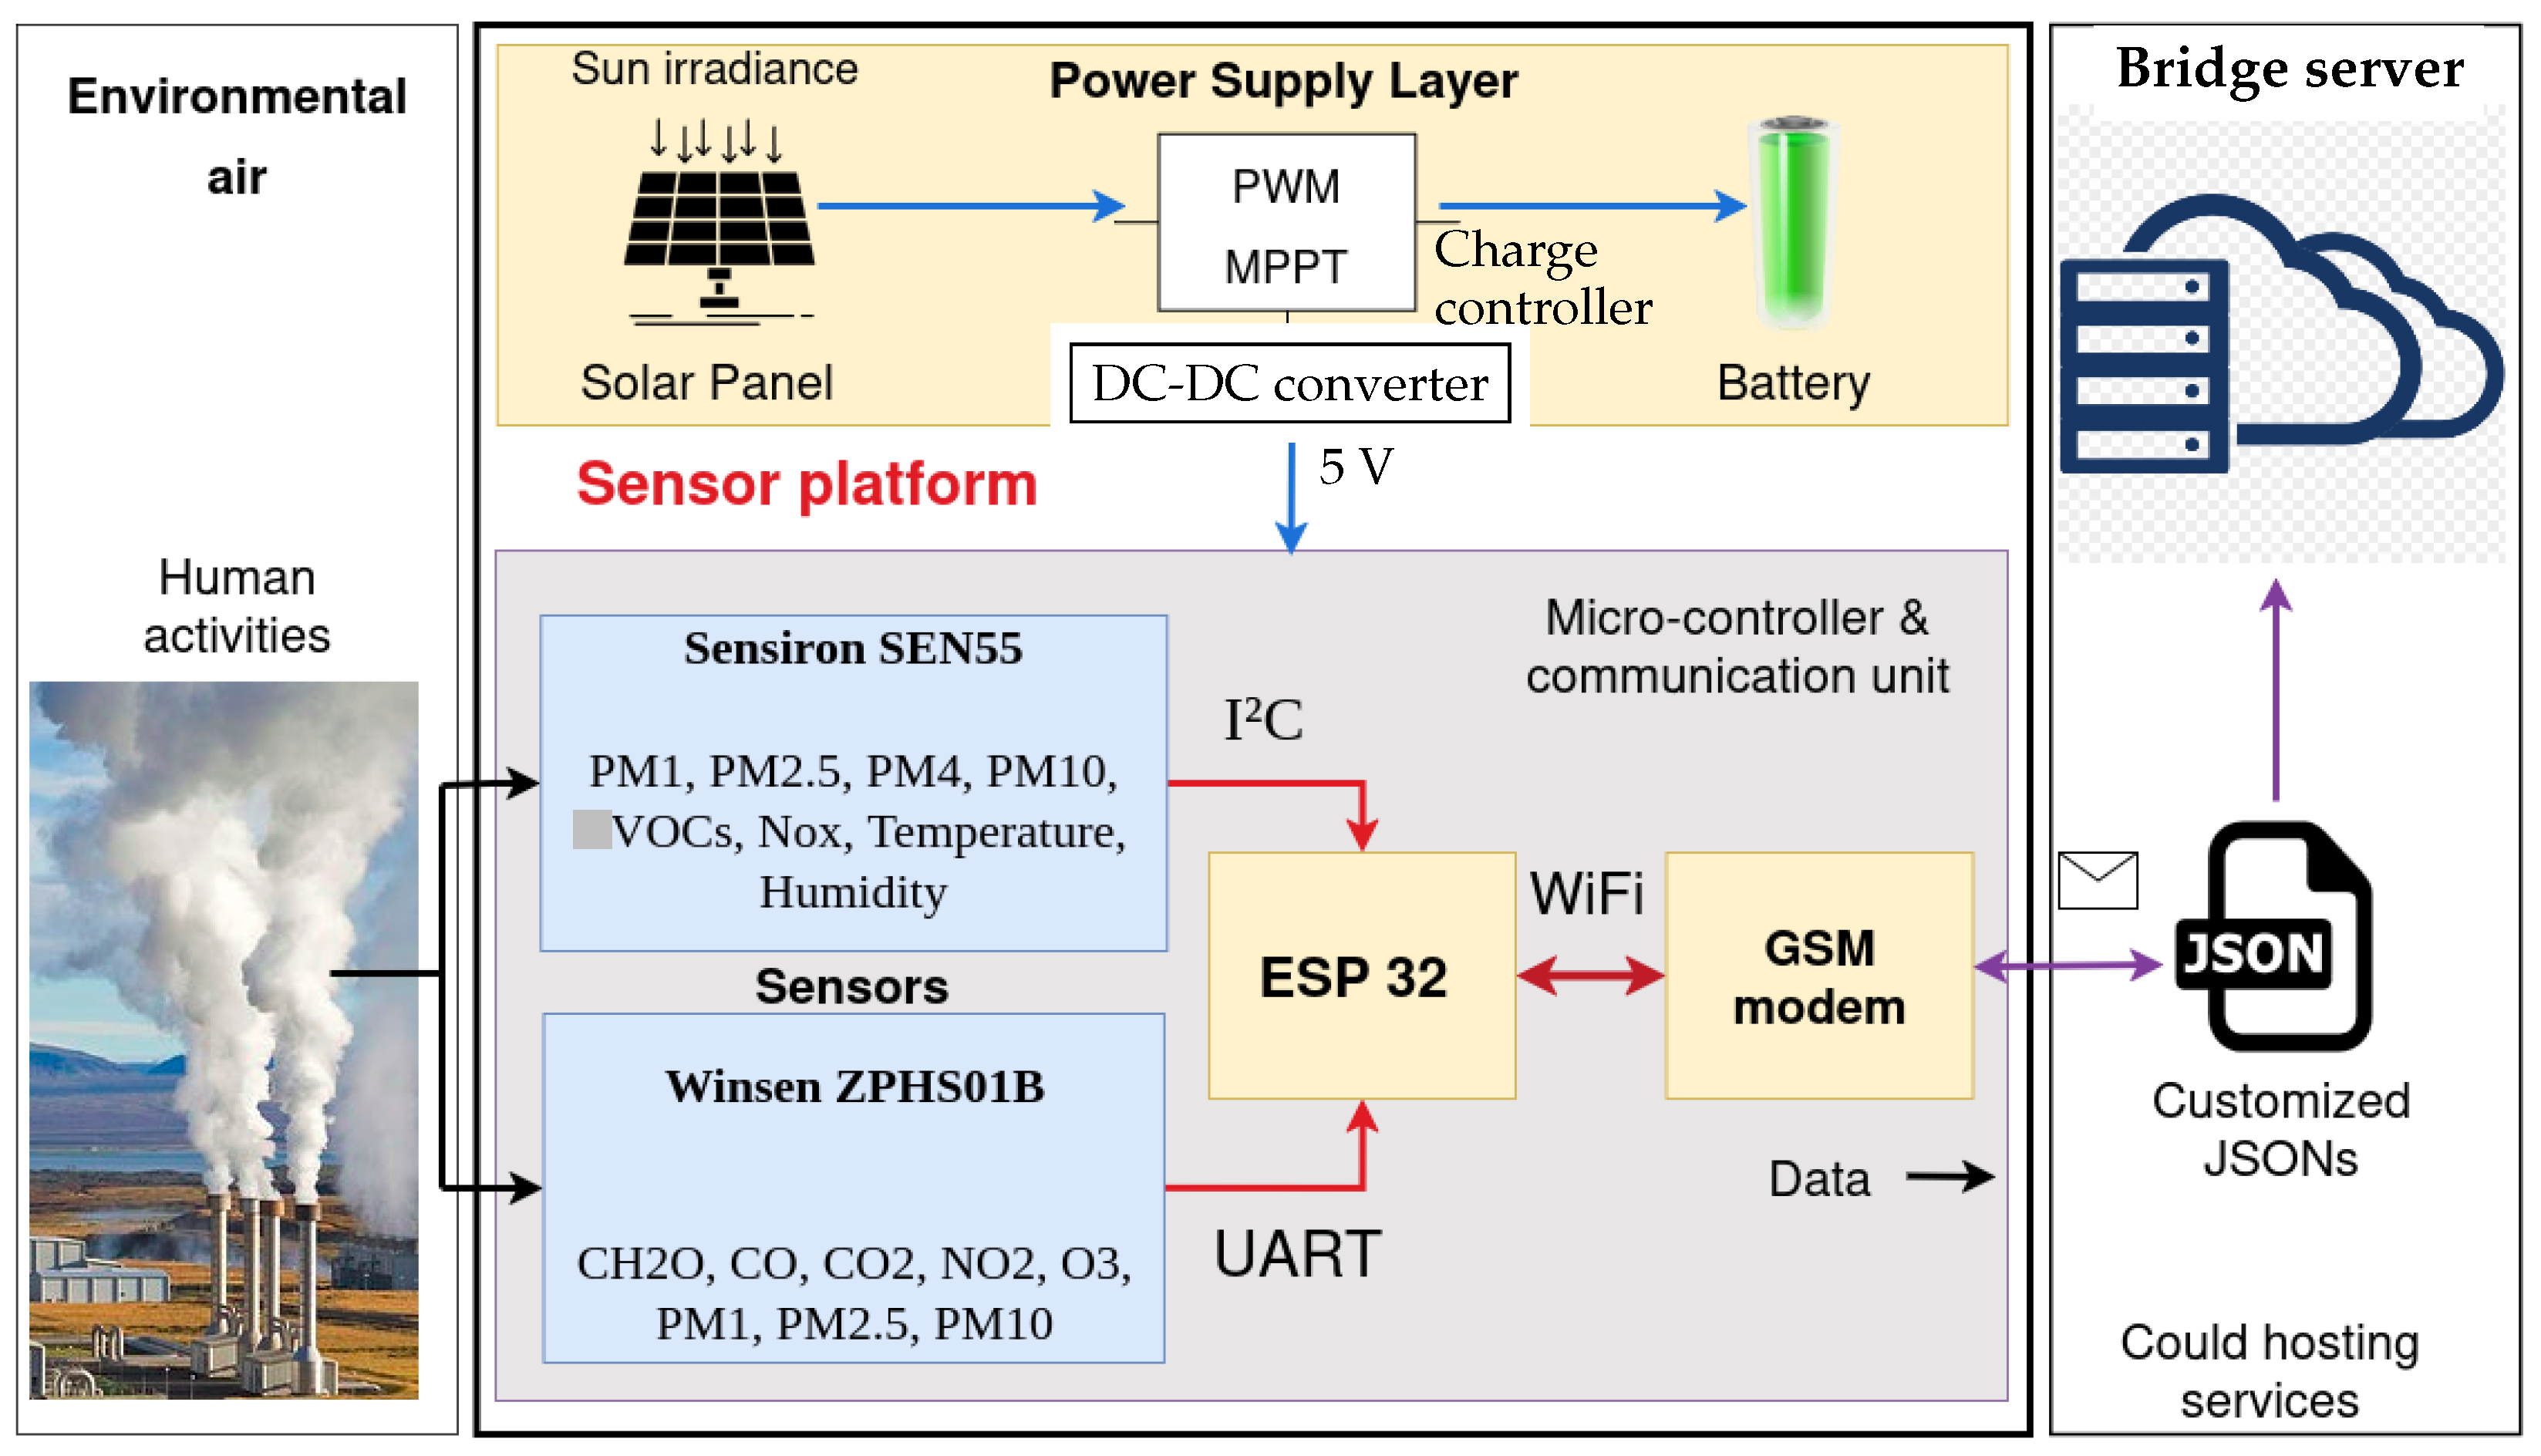
The proposed air monitoring device has a hardware platform that integrates two complementary sensor modules—the Sensiron SEN55 [16] and the Winsen ZPHS01B [17]—with each contributing unique measurement capabilities and expanding the scope of monitored environmental parameters; see Figure 1. This configuration was chosen for obtaining a more nuanced representation of air quality dynamics, particularly in urban or industrial environments where multiple emission sources coexist.
Figure 1.
Hardware architecture of the sensor platform, including data acquisition and communication modules. Data is then sent to the cloud.
The Sensiron SEN55 is a multi-parameter sensor specifically engineered for the detection of airborne particulate matter concentrations, namely PM1, PM4, PM10, and PM2.5, alongside volatile organic compounds (VOCs), NOx concentrations, and ambient temperature and relative humidity. This sensor ensures high-resolution detection across the entire spectrum of pollutants and has a digital communication interface, which ensures a stable and low-noise data transmission.
Complementing this unit, the Winsen ZPHS01B is a versatile air quality sensor capable of measuring key gaseous pollutants, such as formaldehyde (CH2O), carbon monoxide (CO), carbon dioxide (CO2), nitrogen dioxide (NO2), and ozone (O3), in addition to particulate matter indices.
Both sensor modules are pre-calibrated, which enhances the measured data accuracy and reduces the time and effort required for system deployment. This feature minimizes inter-sensor variability and systematic errors, ensuring that the collected measurements are both reliable and comparable over time, and allows for the running of long-term monitoring campaigns and studies.
These pollutant sensors have medium accuracy (for example, 5% for PM2.5) and a sufficient measurement range related to the AQI standards (for example 0.1000 μg/m3 for PM10).
The effective integration of these two sensing units into the monitoring system was made using specific communication protocols. The Sensiron SEN55 module uses an Inter-Integrated Circuit (I2C) protocol, which facilitates communication synchronization and minimizes pin requirements on the receiving micro-controller by employing a two-wire communication bus.
Sensor Winsen ZPHS01B uses the Universal Asynchronous Receiver–Transmitter (UART) protocol, which is adapted to the relatively high data throughput generated by this module and ensures robustness against transmission errors in noisy environments.
Data acquisition from sensor modules is managed by an ESP32 micro-controller [18], which is a low-power, high-performance computing device with integrated wireless communication features. The acquired sensor data is sent to the micro-controller using the above-presented communication protocols and is pre-processed locally. Subsequently, the ESP32 micro-controller transmits the measurements via Wi-Fi to a GSM modem and further to a central server, using in-house custom-designed APIs and JSON software structures. This wireless transmission pathway allows for integration with cloud-based storage and analytics platforms, where advanced processing, visualization, and the long-term archiving of air quality data can be performed.
The GSM module [19] is placed close to the ESP32 board to enable efficient and uninterrupted data transmission to the cloud server. Additionally, a reconnection functionality was implemented, whereby the ESP32 automatically attempts to restore the internet connection in the event of a disruption, continuing until successful; if the automatic reconnection fails, a human operator is notified in order to step in.
One should note that, by separating data acquisition and data transmission phases, the monitoring system maintains robustness against temporary communication failures and minimizes the risk of data loss.
Overall architecture of the sensor platform can be seen in Figure 1.
The ESP32 micro-controller role is used to obtain information from sensors and pass them on to the bridge server—no data is locally stored. The software layer in the micro-controller was developed in ANSI C, uses dedicated libraries for the two sensors and the GSM modem and has four main parts. Limited processing actions on captured data, such as calibration, were also implemented. Functions for reading data from sensors and the HTTP POST method has been used in a continuous loop in order to capture and sending data to the bridge server. An error handling mechanism is set to attempt reconnection several times in case of communication failures.
3.2. Power Supply Layer
The electrical energy supply and autonomy of the hardware platform is ensured by a chemical accumulator fed by a photovoltaic panel via a charge controller—see the yellow area in Figure 1. The accumulator is a 7.2 mAh, 12 V LiFePO4 battery with a high number of charge/discharge cycles, high discharge rates, good endurance in the cold, and a large depth of discharge value. The battery charge controller is driven by pulse-width modulation (PWM) technology and has Maximum Power Point Tracking (MPPT) capabilities [20]. The photovoltaic panel is equipped with monocrystalline cells and yields MPP current and voltage values of 3 A and 18 V, respectively. A buck DC-DC power electronics converter provides regulated power at 5 V for all hardware subsystems in the sensor platform.
The sensor platform autonomy was evaluated in the actual environment and real operating conditions. The electrical power system can assure power supply for approximately 60 h in cloudy weather.
3.3. Software Architecture
Concerning the software that controls data flow from sensor platform, the system integrates both open-source Application Programming Interfaces (APIs), which provide complementary pollutant data, and custom-developed APIs in order to ensure overall system robustness and adaptability.
In the proposed system, a JavaScript Object Notation (JSON)-based data exchange mechanism is employed to facilitate communication between both the ESP32 micro-controller and the bridge server, and also between the bridge server and monitoring system database, via a specific automation process, as detailed in both Figure 1 and Figure 4. This mechanism is common in web-based data transmission and storage and in addition to its easy readability, it also provides cross-platform compatibility. The JSONs are an intermediary representation layer that enables efficient serialization, modularity, and interoperability between heterogeneous components of the system (server-side scripts, client applications, and database management subsystems). This approach provides a scalable and transparent foundation for further integration with monitoring dashboards or real-time decision-support systems.
Data Transfer to Cloud
Within the relevant software architecture, one JSON object was generated to locally store the data most recently collected or computed by the system. This file, which is stored on the bridge server, acts as an intermediate data buffer, ensuring that all relevant parameters—numerical values, sensor readings, or control variables—are preserved in a structured format even when immediate database connectivity is not available.
The bridge server receives data from the ESP32 (via GSM modem), stores them locally in ASCII format, and sends the last twenty to a specific local webpage.
Each parameter is stored as a key–value pair, allowing for consistent data-parsing and validation before further processing. A second JSON structure is responsible for transferring the locally stored information to a centralized database. This operation ensures synchronization between the local dataset and the global data repository, allowing for historical tracking, statistical analysis, and long-term data storage.
3.4. Environment Monitoring System APP
The overall software application was implemented using Microsoft’s Power Platform components (2025 version) [21], as follows.
Firstly, all data is stored in the local database, provided by The Microsoft platform, in the form of Dataverse tables, which are preliminarily configured.
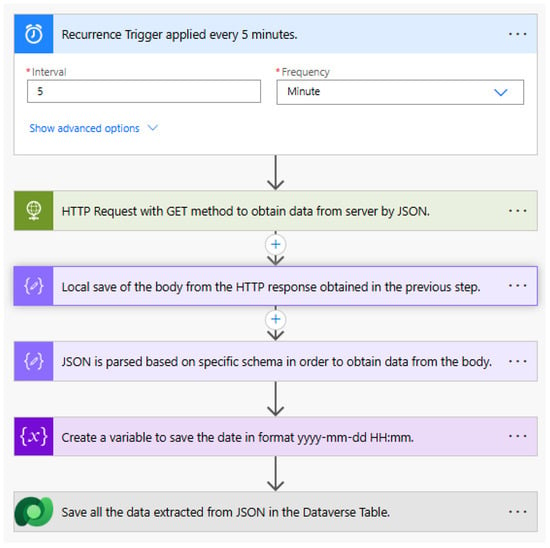
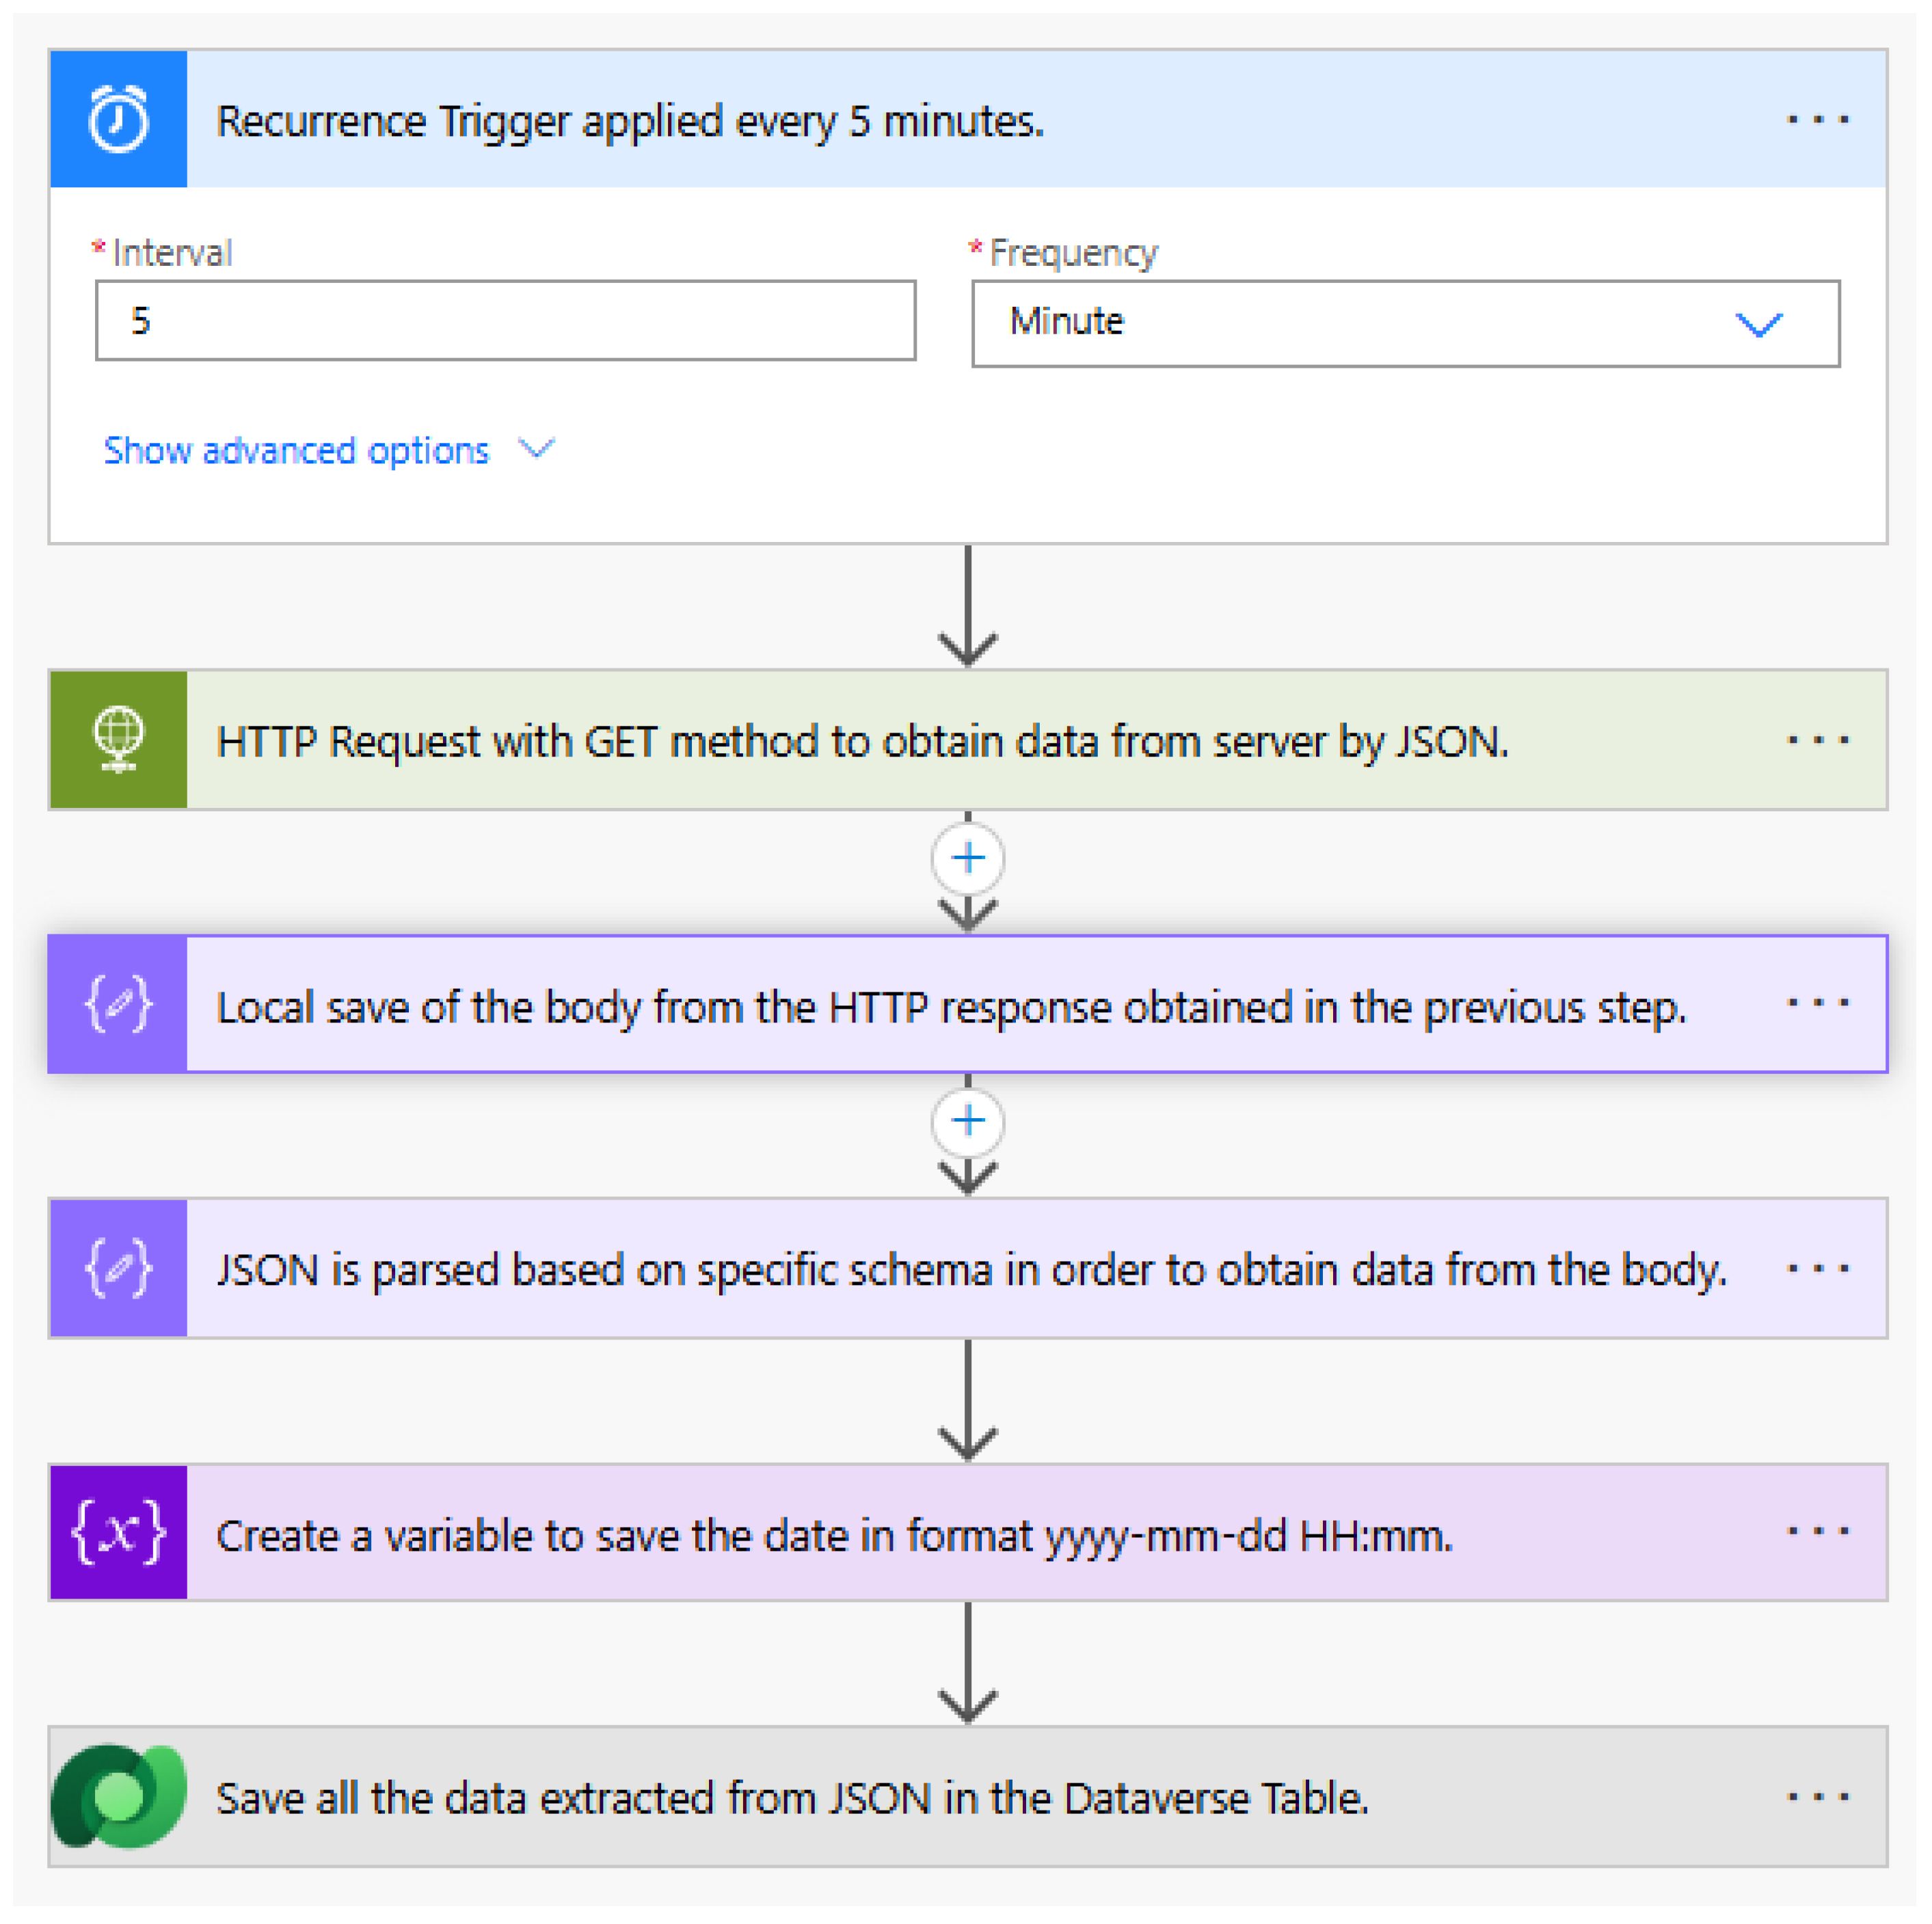
Secondly, the Microsoft Power Automate Flows mechanism was used to obtain data from the bridge server and store them in the Dataverse tables. The associated automated processes run in the background, configure the necessary gateways for sending/receiving data, and trigger HTTP GET requests every five minutes in order to transfer data from the bridge server. In addition, they perform JSON-parsing for the extraction of specific data and its subsequent storage in the Dataverse table. The customized structure in Figure 2 was employed for a power automate flow that generates historical data and saves it in the Dataverse table.
Figure 2.
Steps of the power automate flow used for data transfer. Data transfer mechanism is triggered every five minutes.
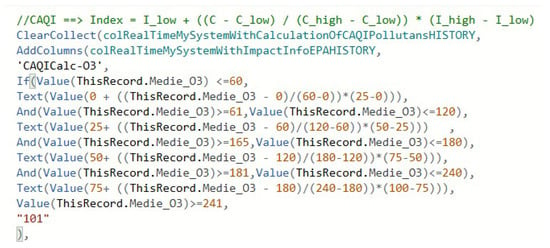
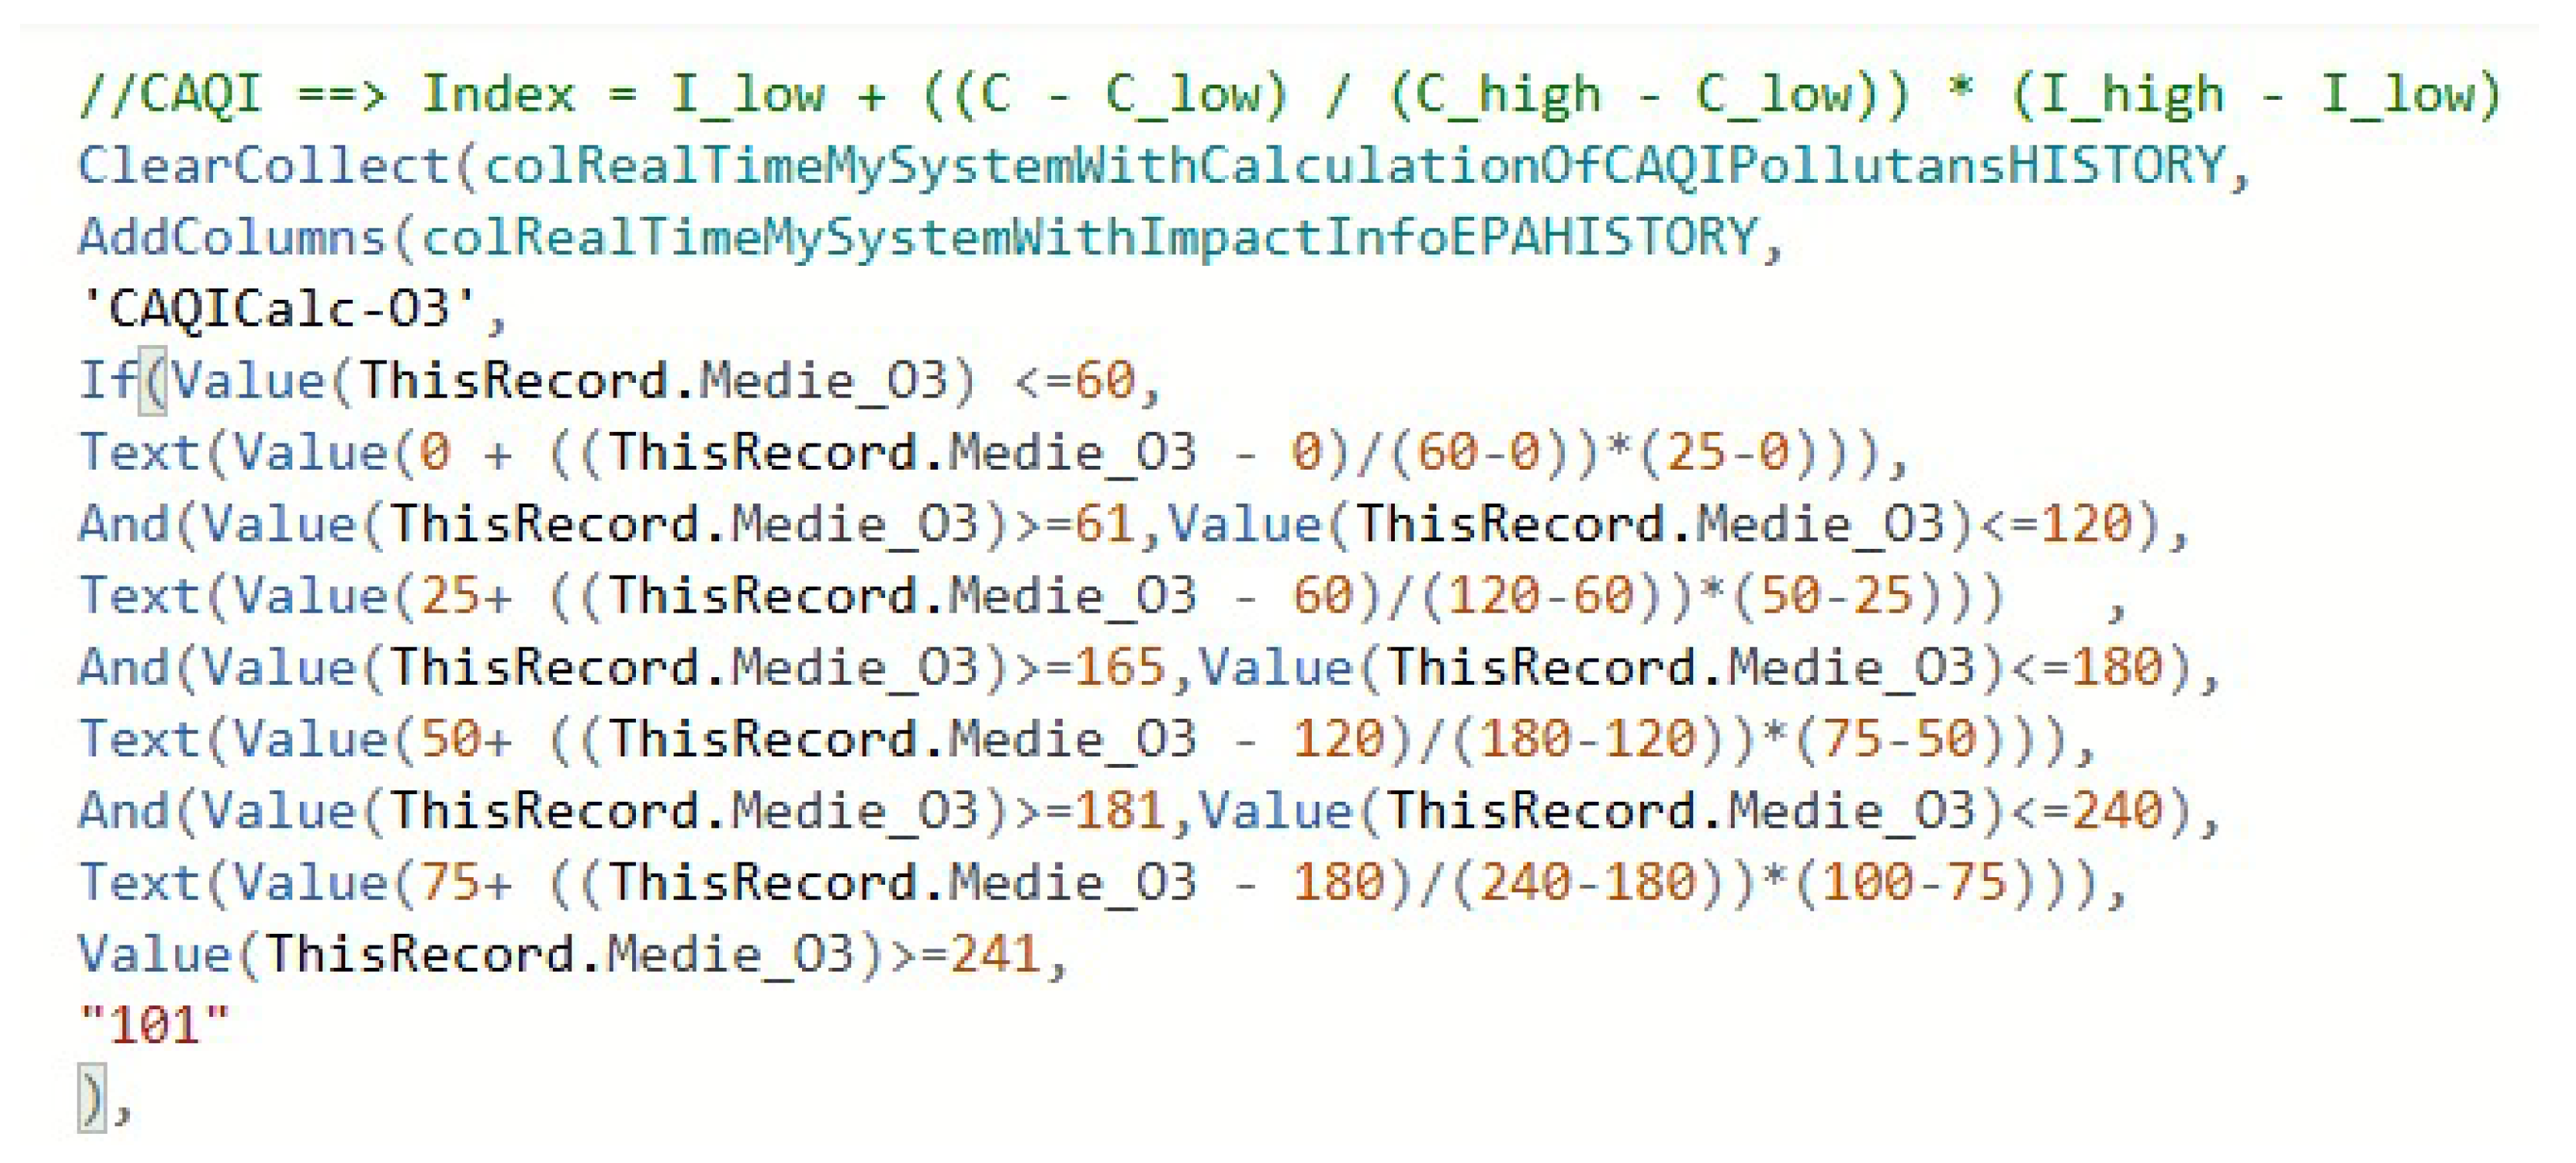
A user-oriented application offering an intuitive and accessible HMI for data visualization and interaction was developed using Microsoft’s PowerApps, which is a low-code development platform integrated into the Power Platform suite. In addition to a graphic user interface (GUI), it also hosts pollutants’ concentration processing and AQI computation. A sound comparison with the current EU and WHO standards was implemented. This application is of Canvas type, as this allows for full specificity, flexibility and control over the APP design and implementation process. In Figure 3, one can see the PowerApps code used for CAQI index implementation.
Figure 3.
PowerApps code for CAQI computation.
All these resources from the Microsoft Power platform suite have been used not only for capturing data from the above-described sensor platform, but also for acquiring complementary environmental data from third-party sources, further denoted as Source 1…3 or Data server 1…3 in Figure 4. Their specific APIs were used for connecting the monitoring APP with three different sources from the cloud—[22,23,24]. By providing the latitude and longitude of an area of interest, these APIs return both the measured environmental parameters and a calculated AQI. Details on these sources and their operational mechanisms can be found in [13]. This complementary data allows for sound comparison with the data provided by the proposed sensor platform and further validation of the overall monitoring system.
Figure 4.
Software architecture central management system, including communication with data repository.
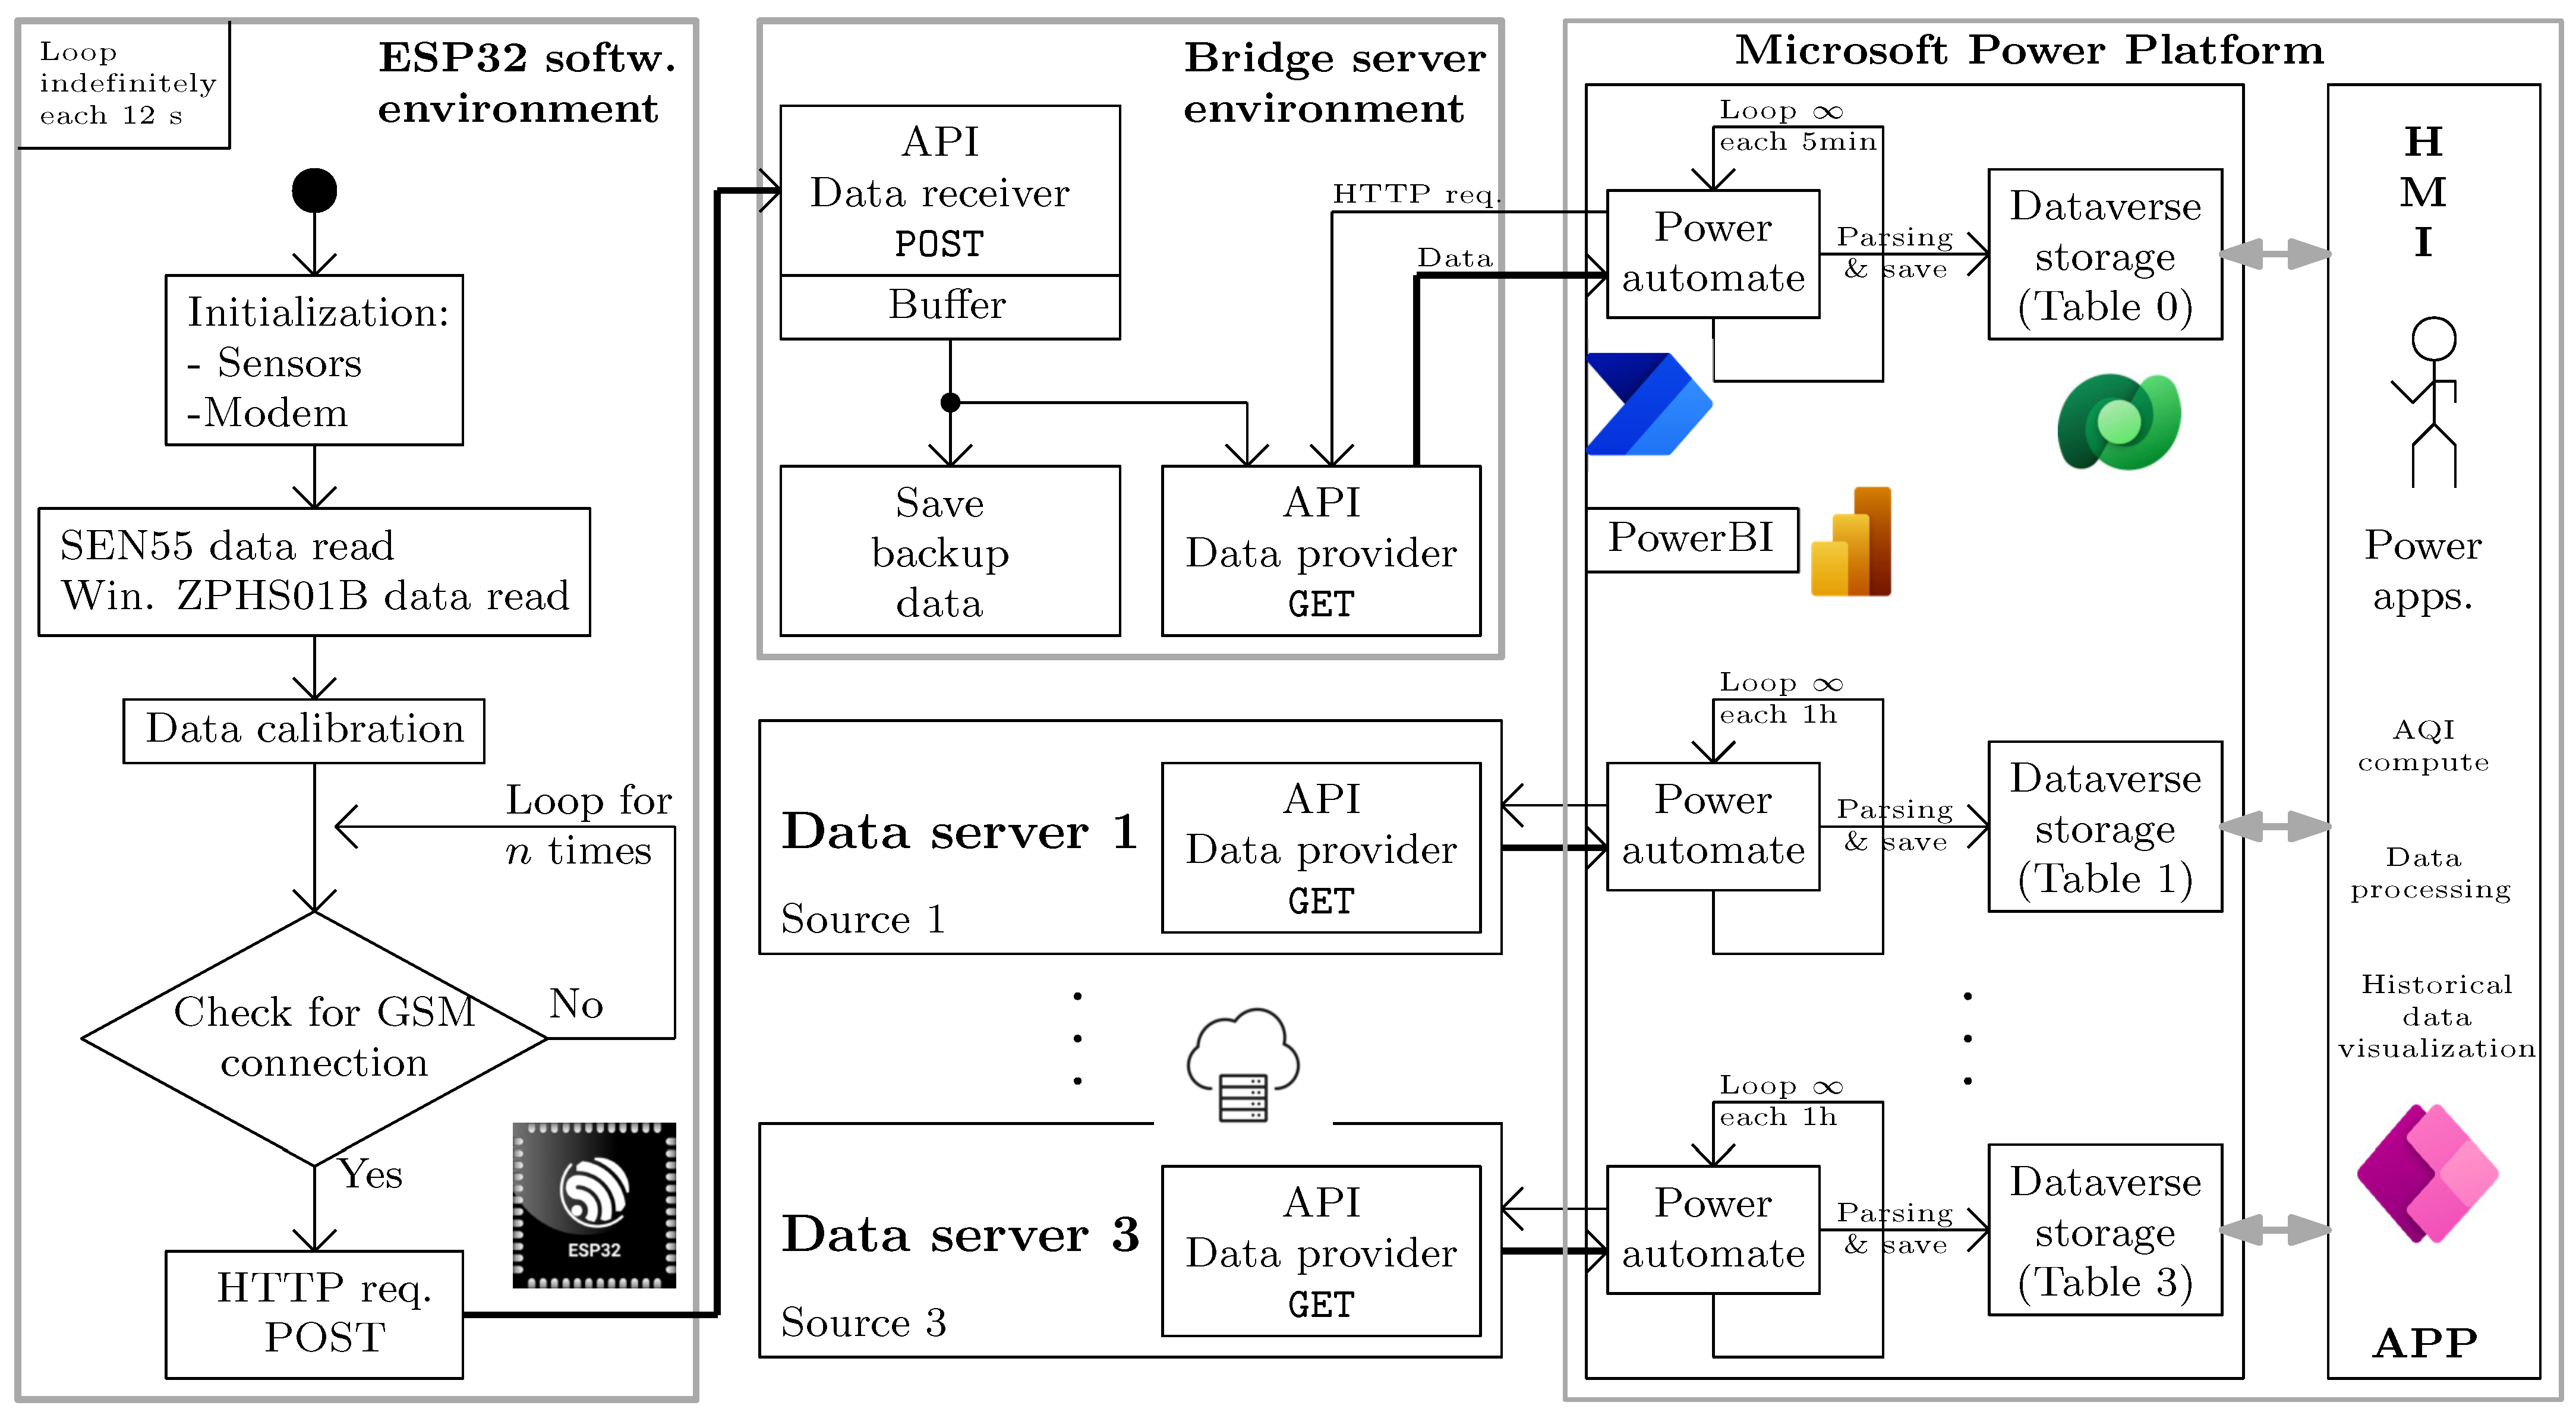
PowerBI software was used to graphically visualize environmental parameter evolutions and associated instantaneous values. The overall software architecture can be seen in Figure 4.
4. Implementation and Prototyping
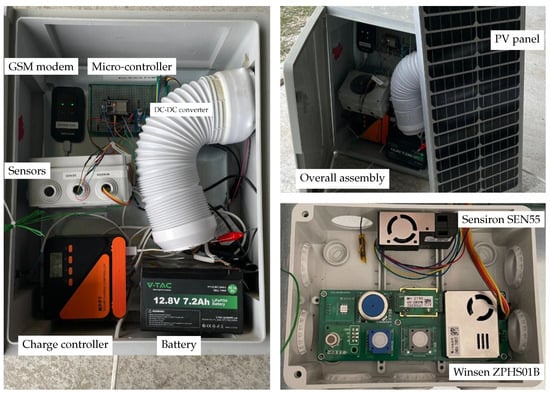
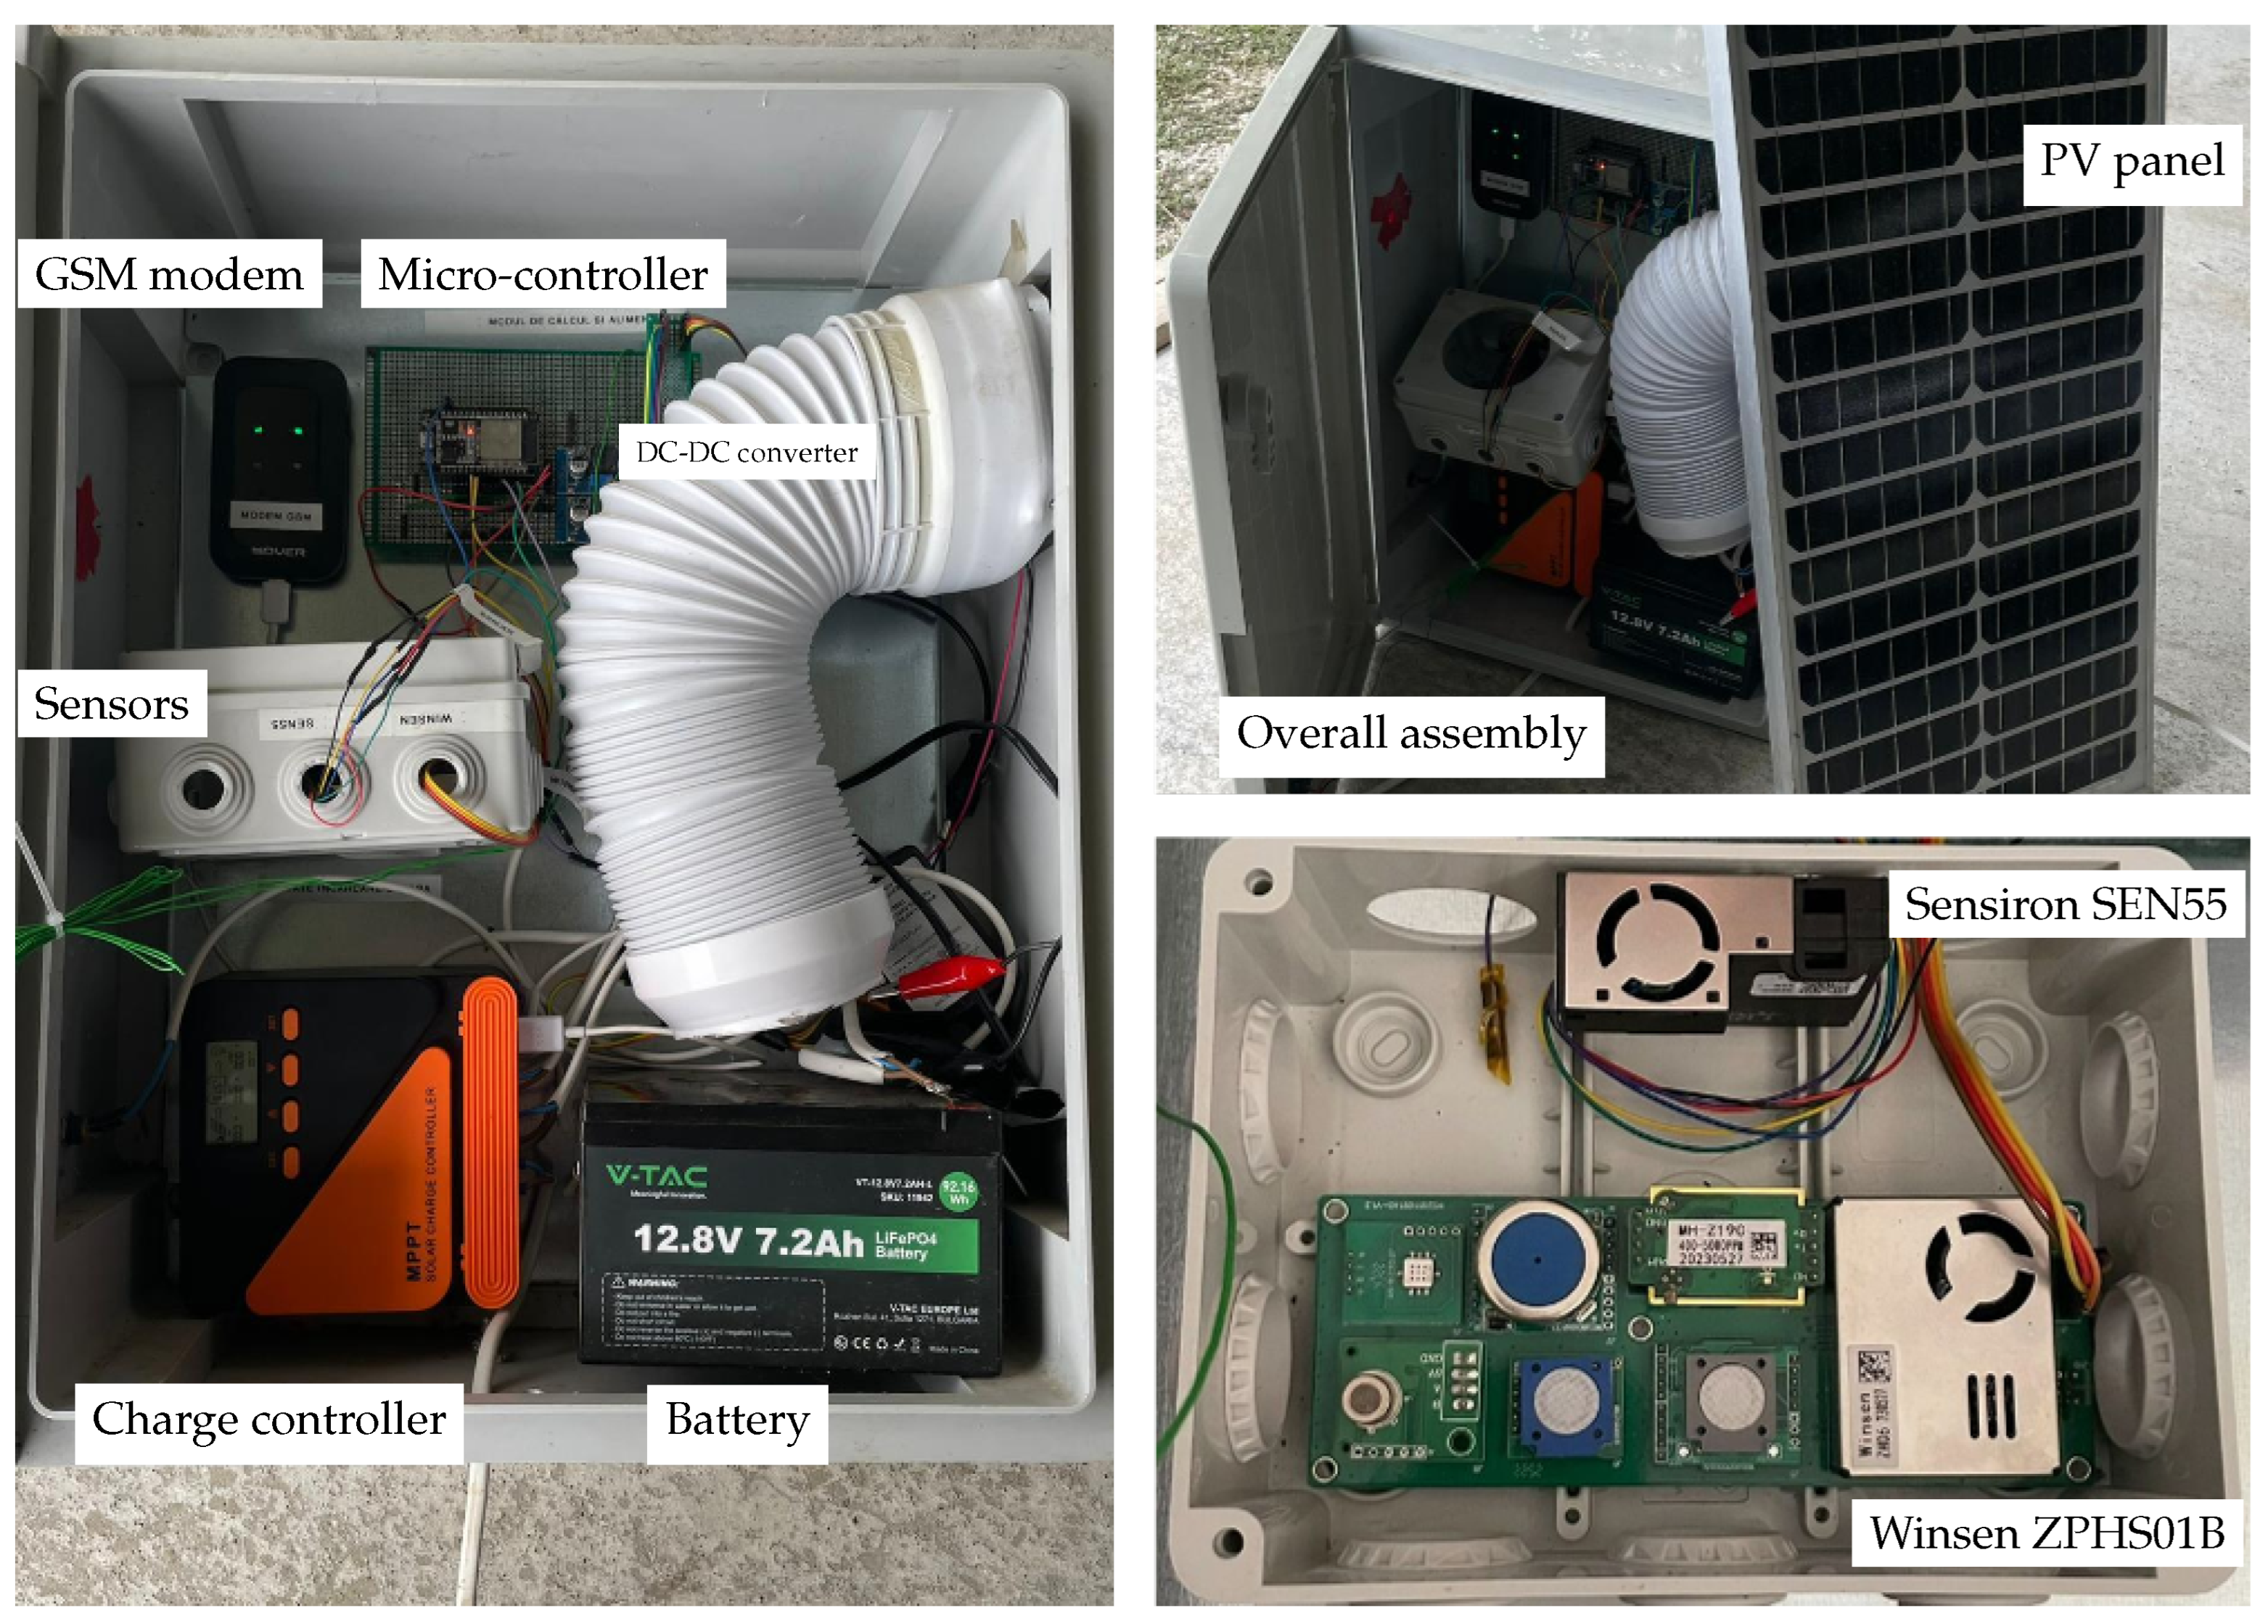
A prototype of the sensor platform was built using the hardware components described in Section 3.1. The EPS32 micro-controller and the GSM module were mounted on a protoboard —see Figure 5. This setup enabled rapid prototyping and iterative adjustments and was used for the interconnection of wires with both the sensors and the power supply. The overall cost of the prototype was around EUR 300, which matches the low-cost criteria; see, for example, [5], where the total cost was estimated at 250 USD.
Figure 5.
Hardware part of the sensor platform prototype, including the power supply system.
In the same sense, the software architecture was structured to support scalable deployments, with flexible sampling rates, error handling routines, and data buffering mechanisms to accommodate intermittent network connectivity. The prototype testing phase confirmed that the system provides reliable and high-resolution environmental monitoring while maintaining low power consumption and operational stability. The pre-calibrated sensor units, combined with standardized communication protocols and protoboard-based assembly, establish a strong foundation for future system expansion and long-term deployment in distributed monitoring networks.
The modular design of both hardware and software components allows for the system to be extended with additional parameter monitoring, for instance, SO2. Moreover, multiple sites may be monitored via the bridge server-related communication channels and by using multiple sensor platforms, effectively ensuring system scalability.
4.1. Data Acquisition, Testing, and Calibration
In a first stage, a preliminary validation of the prototype operation and assessment of its overall performance were performed through a series of experiments. These tests were conducted in an enclosed environment, where various substances were ignited near the system in order to observe the sensors response and overall monitoring system behavior. The measured variables, indicating concentration in the pollutants of interest, significantly increased or decreased with the induced environmental changes, confirming the real-time measurement of environmental parameters and associated data transmission to the remote server in the cloud.
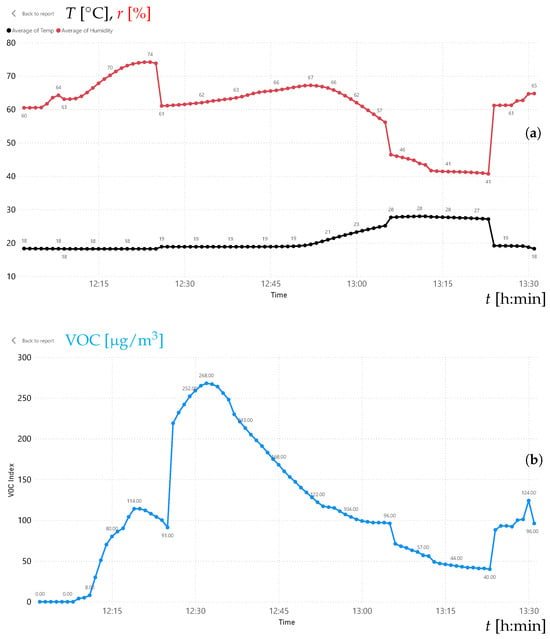
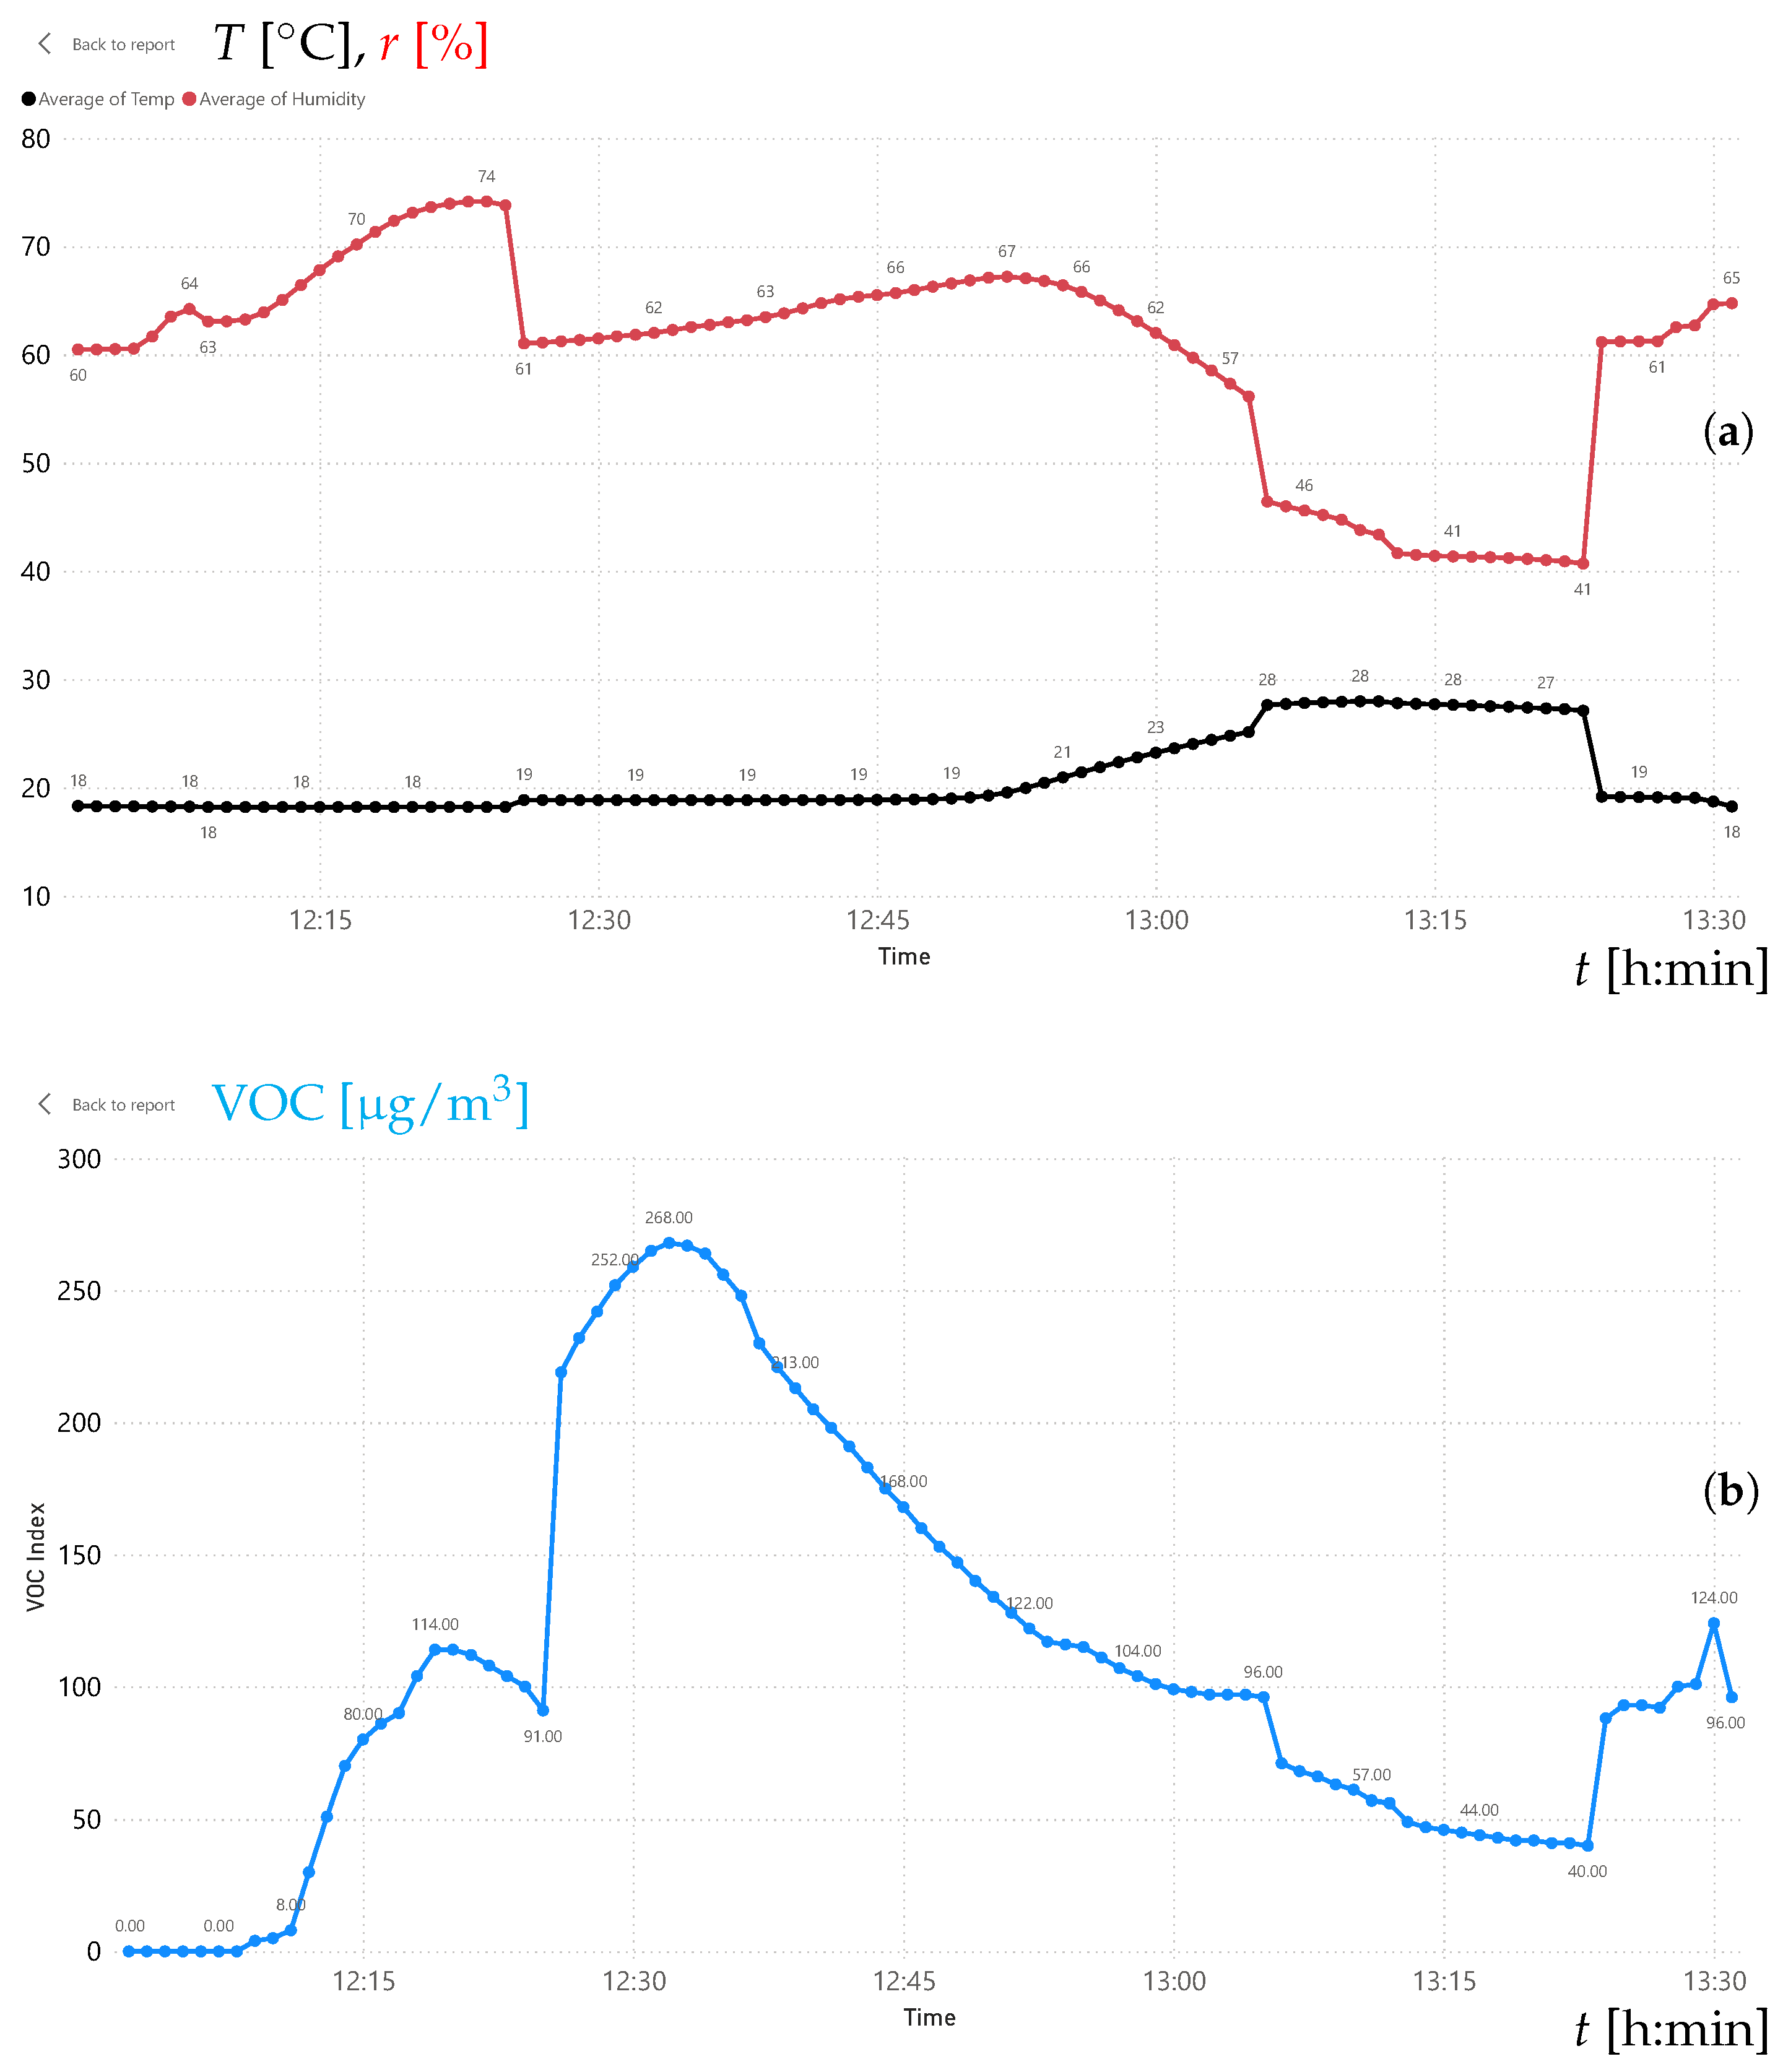
The experimental tests involved two steps. Results from these tests are presented in Figure 6a,b for a time span of approximately one hour and thirty minutes. Evolutions in temperature, , and relative humidity, , are visible in Figure 6a, while Figure 6b shows the time variation in the volatile organic compound (VOC) index. Note that this parameter was used only for assessing the proper operation of the sensor platform and not to compute any quality index.
Figure 6.
Results obtained for the testing phase of the sensors (one-hour time span, one-minute sample time). (a) Evolutions in temperature (black line) and humidity (red line); (b) VOC evolution.
In the initial phase of the experiment, a textile material was impregnated with multiple volatile substances (e.g., ethanol, gasoline) and placed near the sensor platform. The effects of this step can be seen in Figure 6b, with a gradual increase in the VOC index beginning at approximately 12h15, which indicates the presence and accumulation of volatile compounds in the controlled environment.
In the second step, the impregnated material was ignited to initiate a controlled combustion process. Before the ignition, the material was repositioned at a distance from the sensing unit in order to minimize direct thermal exposure and to prevent immediate sensor saturation. Figure 6a shows a measurable increase in ambient temperature and a decrease in relative humidity at approx. 12h30–12h45, corresponding to the combustion thermal reaction. Also, VOC levels are progressively reduced.
In the second testing stage, air quality monitoring system calibration was performed using a certified reference station in order to ensure the accuracy and reliability of the acquired data. The calibration site was selected in the vicinity of the B-15 station, a fixed air quality monitoring unit belonging to the Romanian National Air Quality Monitoring Network, which provides precise data in compliance with European and international (WHO, EPA) standards. This monitoring station [25], offers a public data platform and has been previously integrated into the Aerlive project [26], which promotes urban pollution transparency and actions toward a cleaner environment.
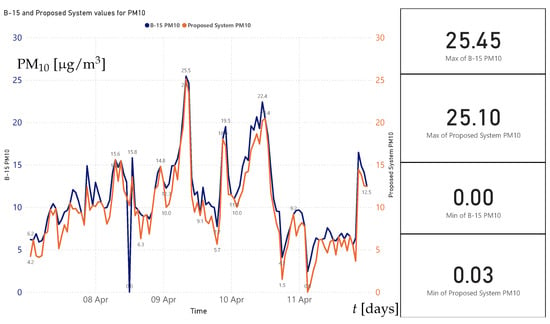
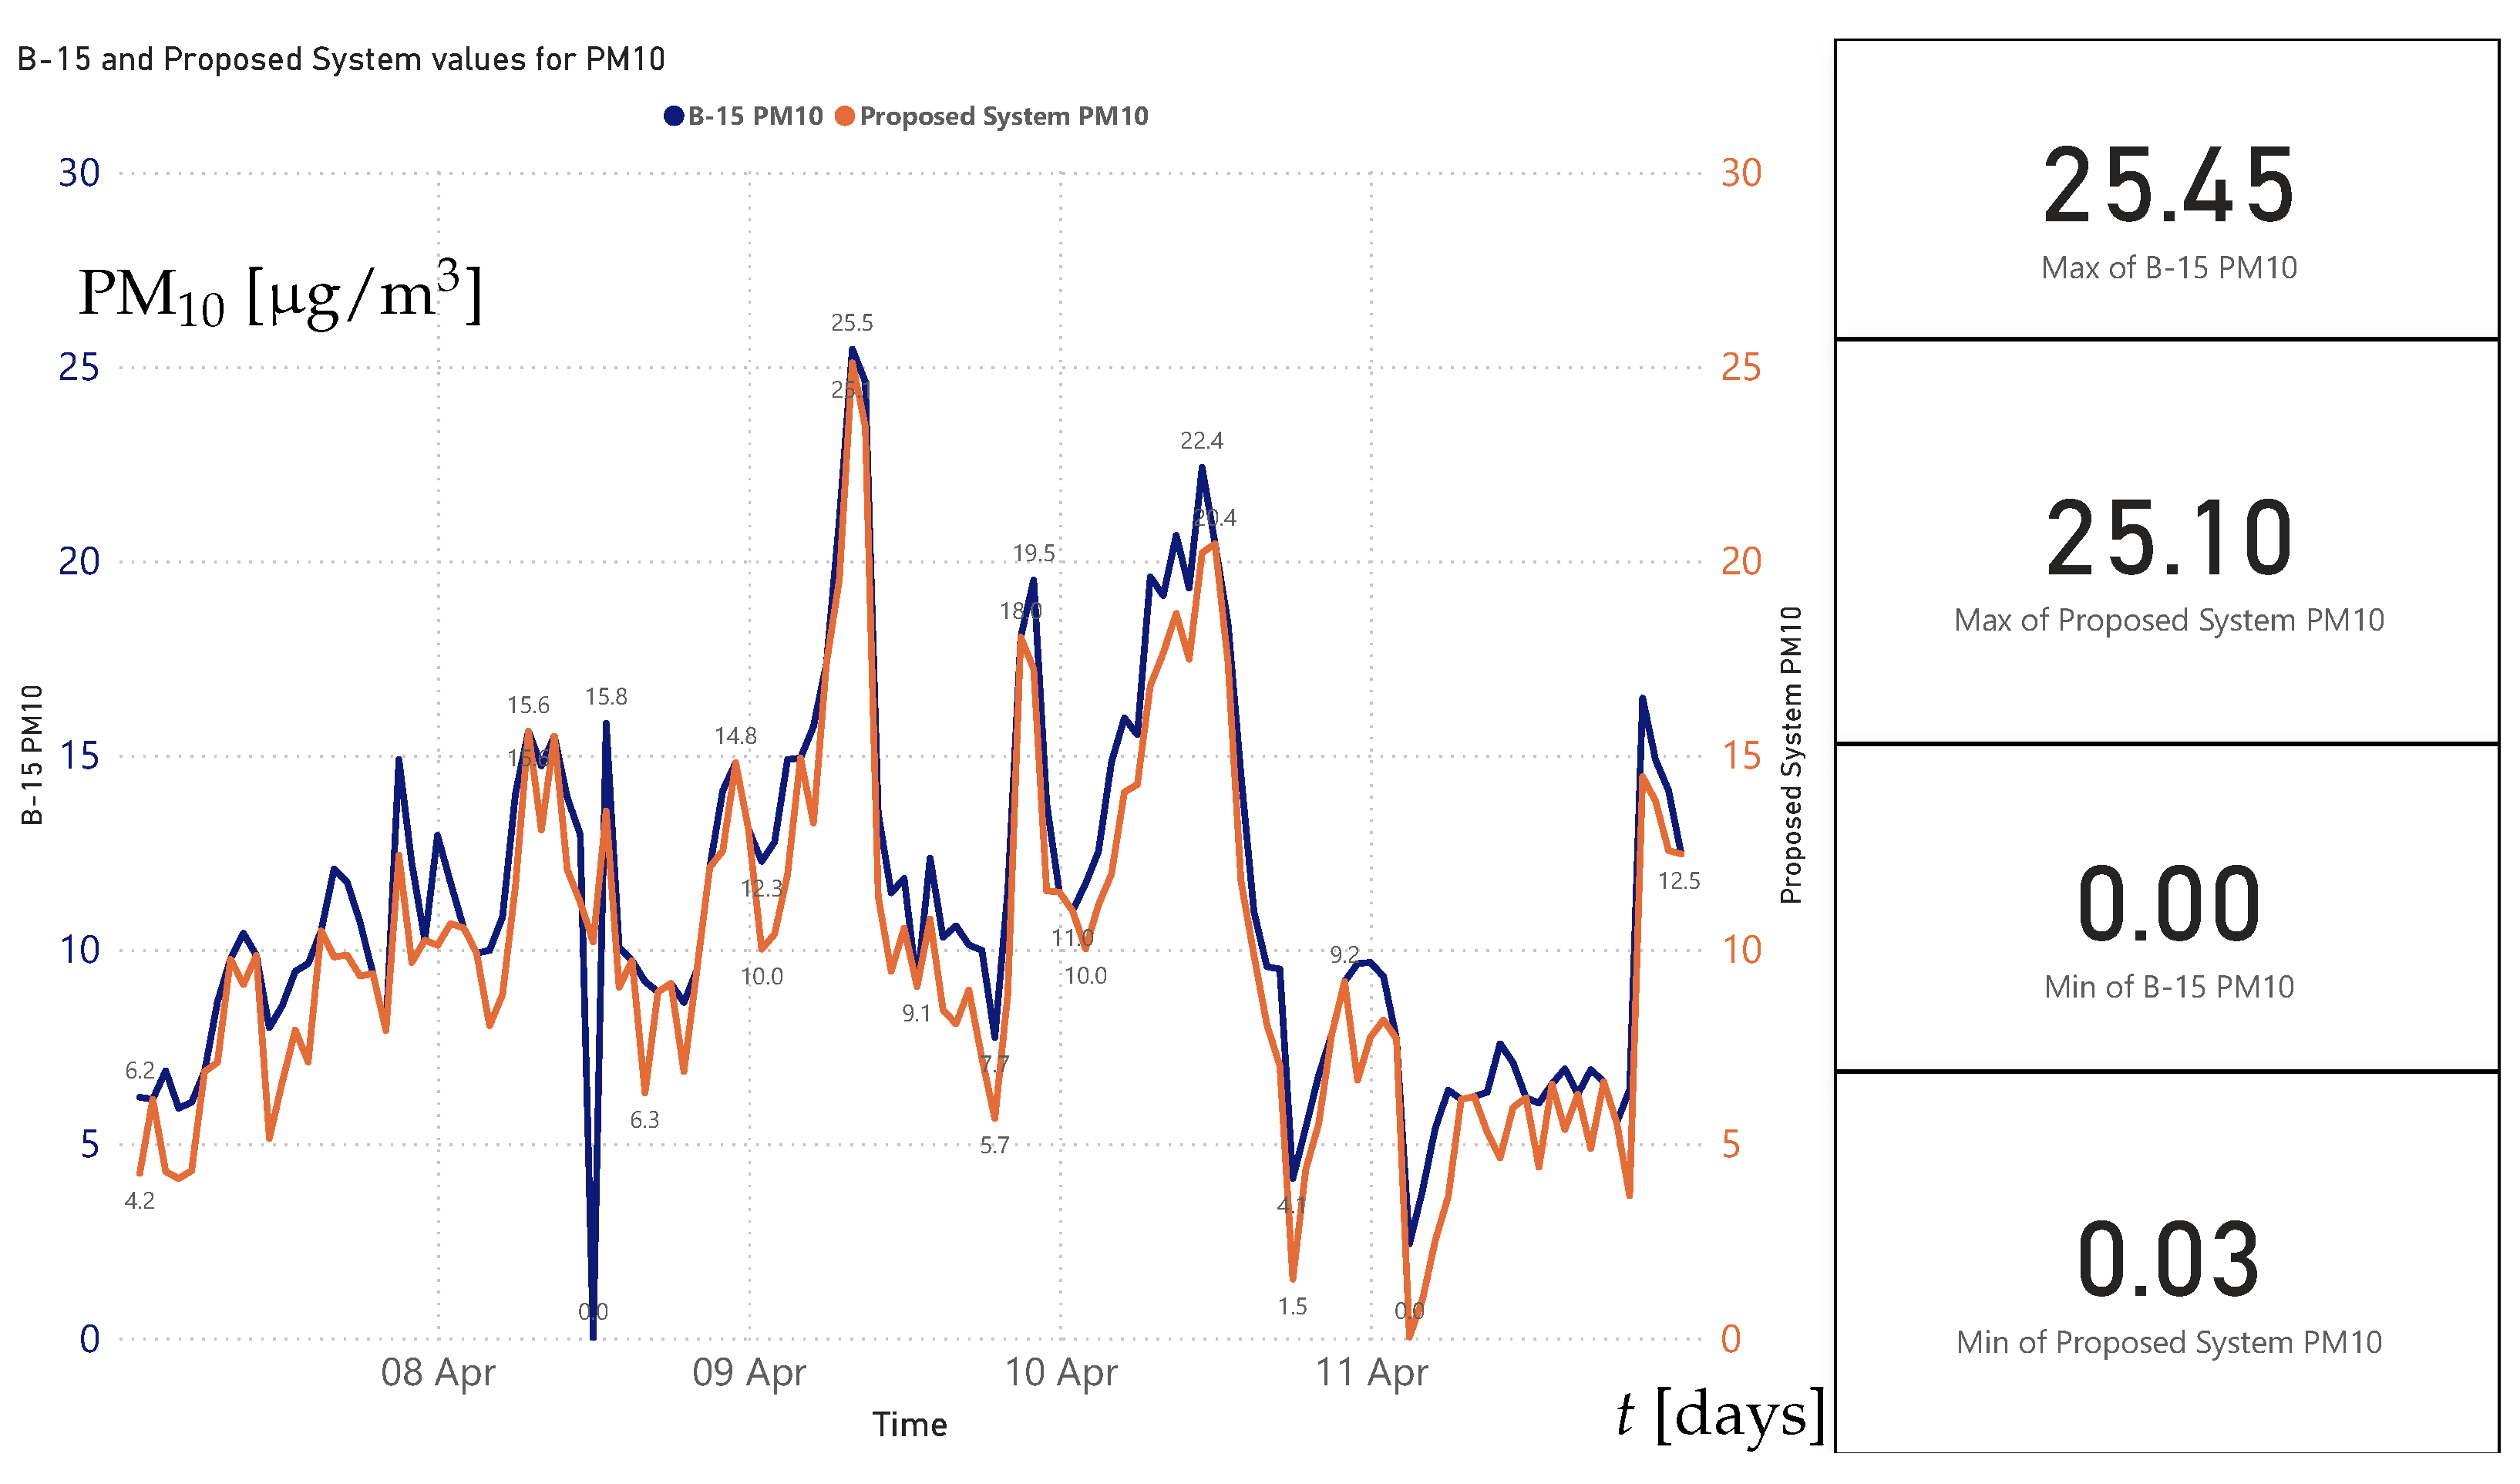
Testing involved the temporary installation of the proposed monitoring system near a B-15 station; measured data were simultaneously collected by both systems, and the resulting values were subsequently analyzed in order to assess the correlation between datasets for each monitored parameter (i.e., PM2.5, PM10, NO2, CO, VOCs, temperature and humidity). This analysis demonstrated strong alignment between our system’s measurements and those reported by the reference station, thereby confirming sensor functionality, the reliability of the data acquisition circuitry, and the accuracy of the data processing algorithms—see Figure 7. This figure presents the evolution of PM10 values over a time period of five days for both the proposed tested system (with red line) and for the B-15 station (with blue line), and shows a close similarity between the two time series.
Figure 7.
Comparison between data obtained from B-15 station, represented by the blue line, and data obtained with the proposed system, represented by the red line (PM10, in the same location).
4.2. GUI Environment
The HMI application contains various functionalities, such as real-time environmental data display, the evolution of a specific parameter or of the air quality index (AQI) over a user-selected time period (historical data), or data collected from three complementary sources in the cloud.
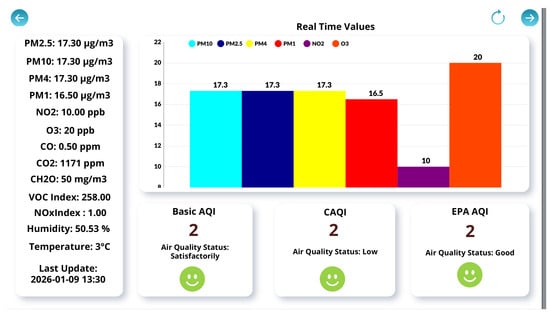
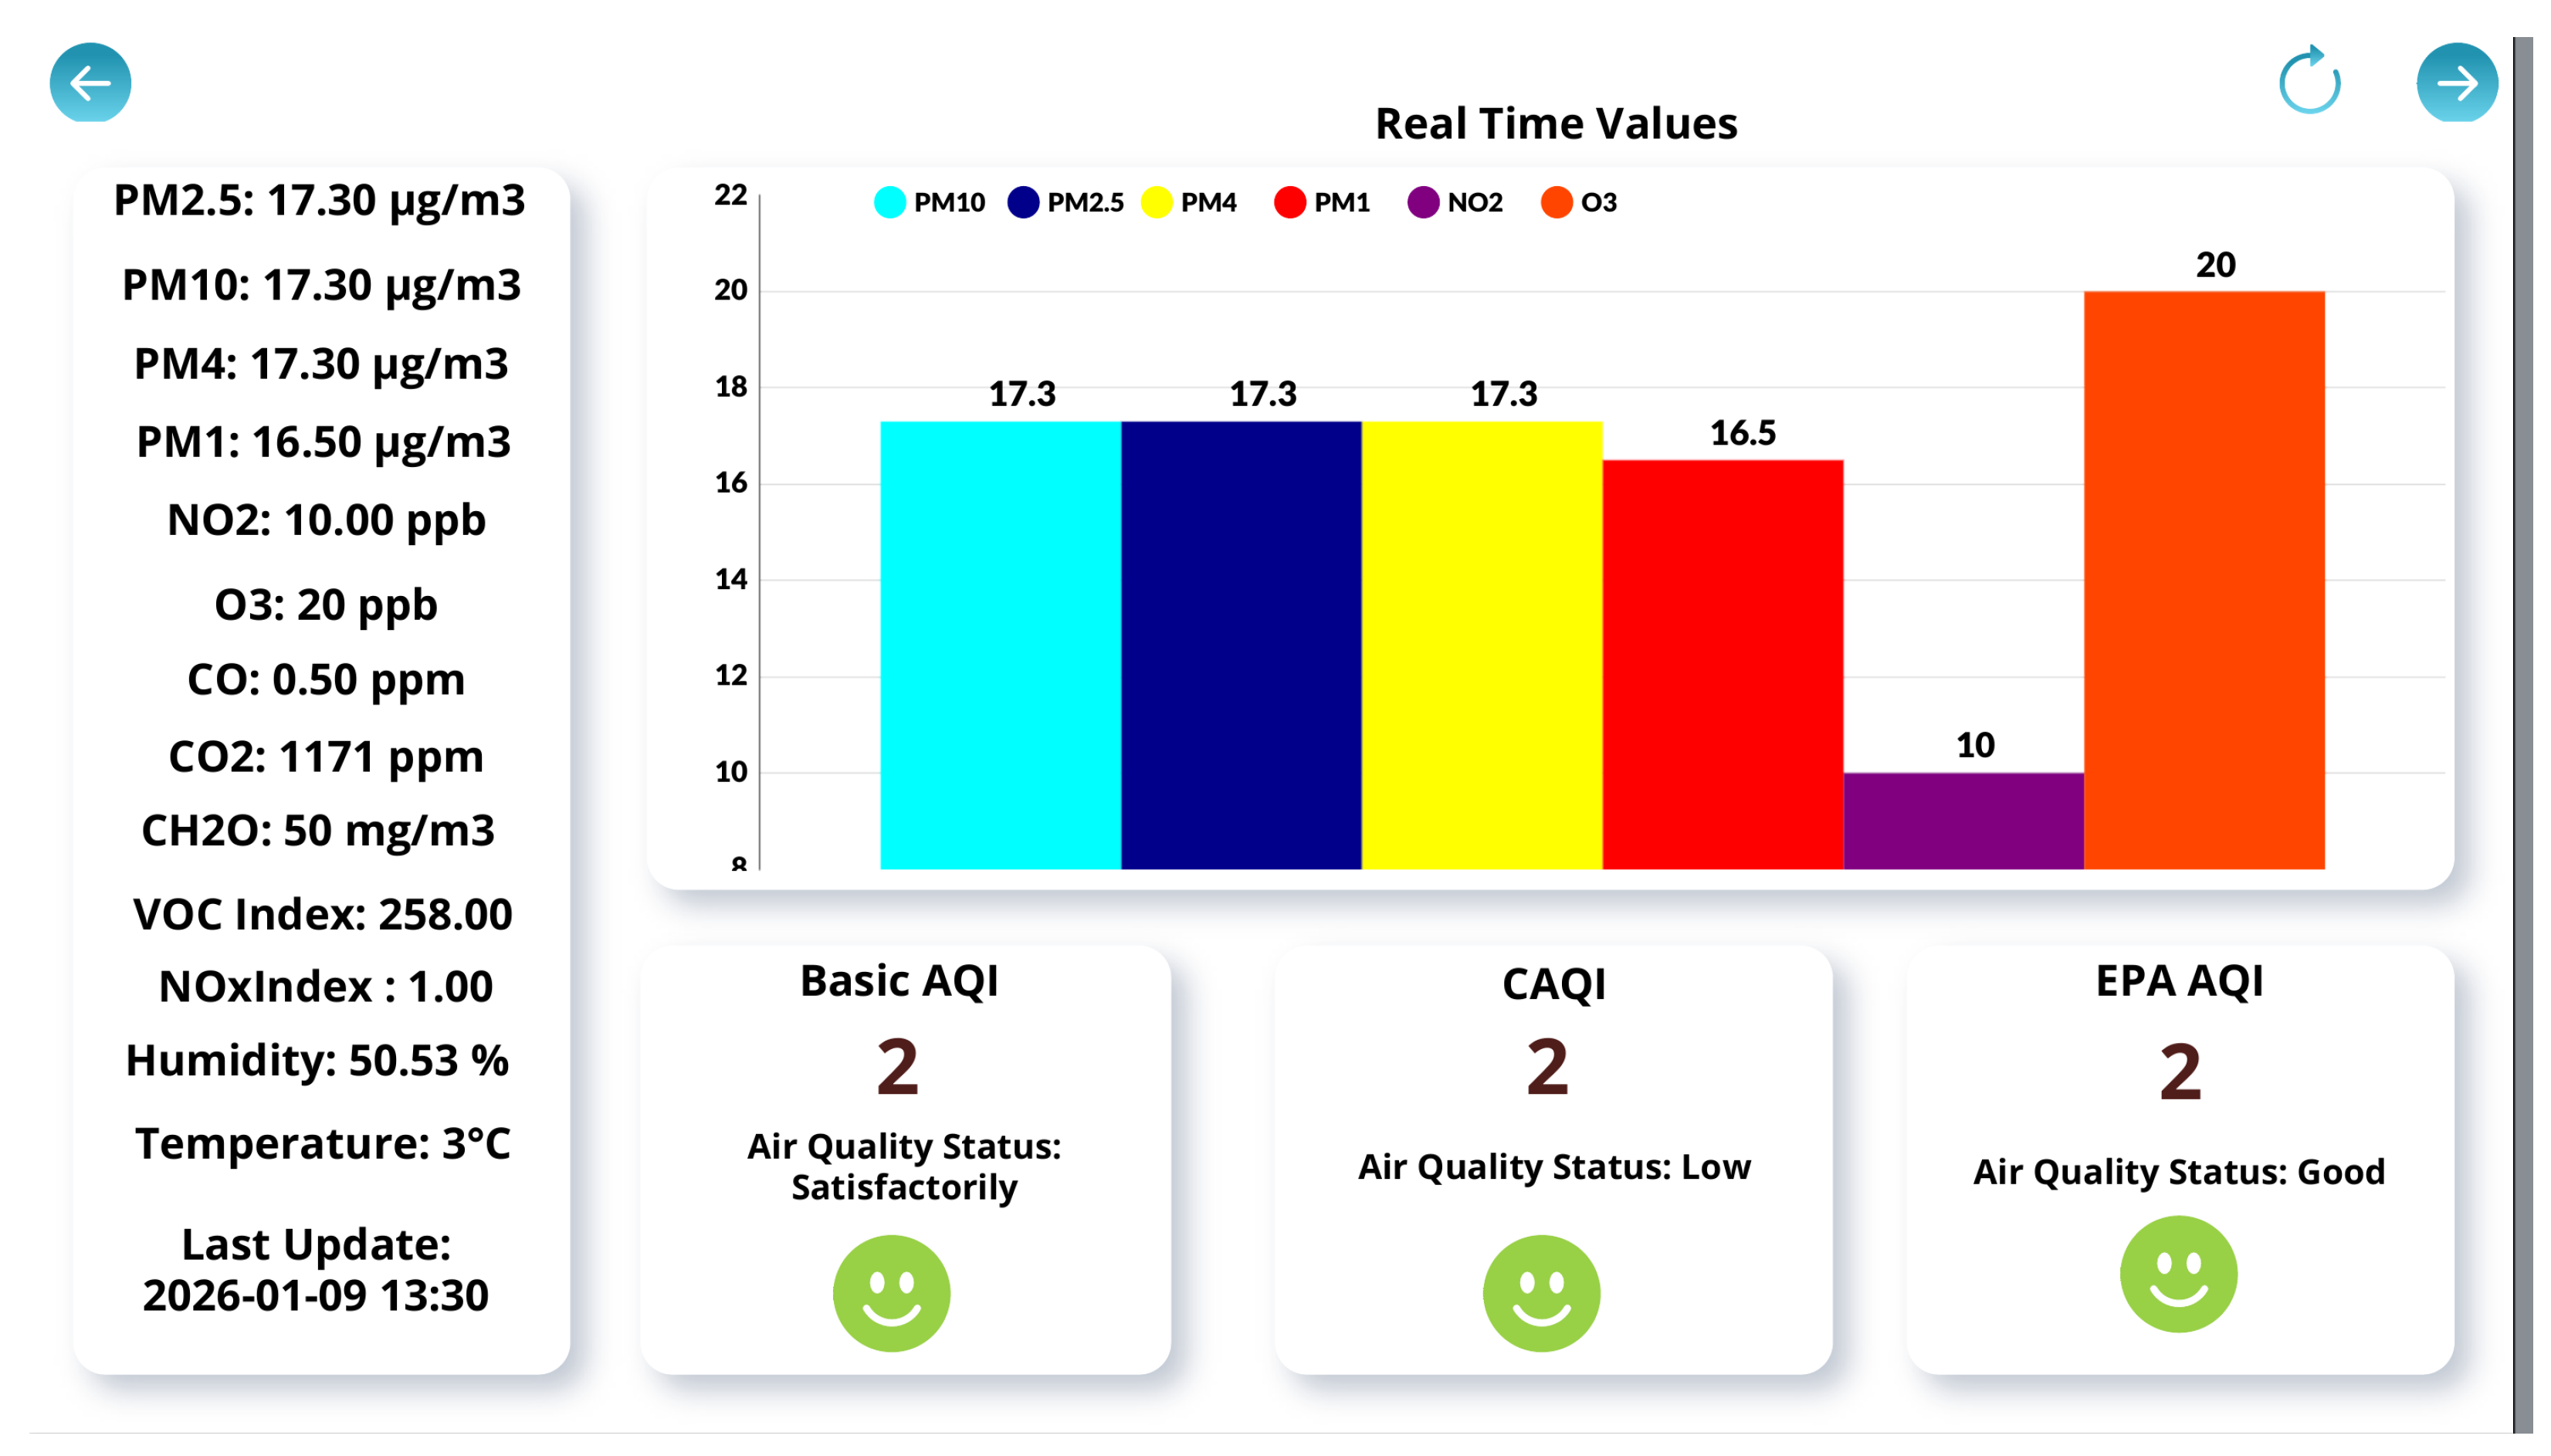
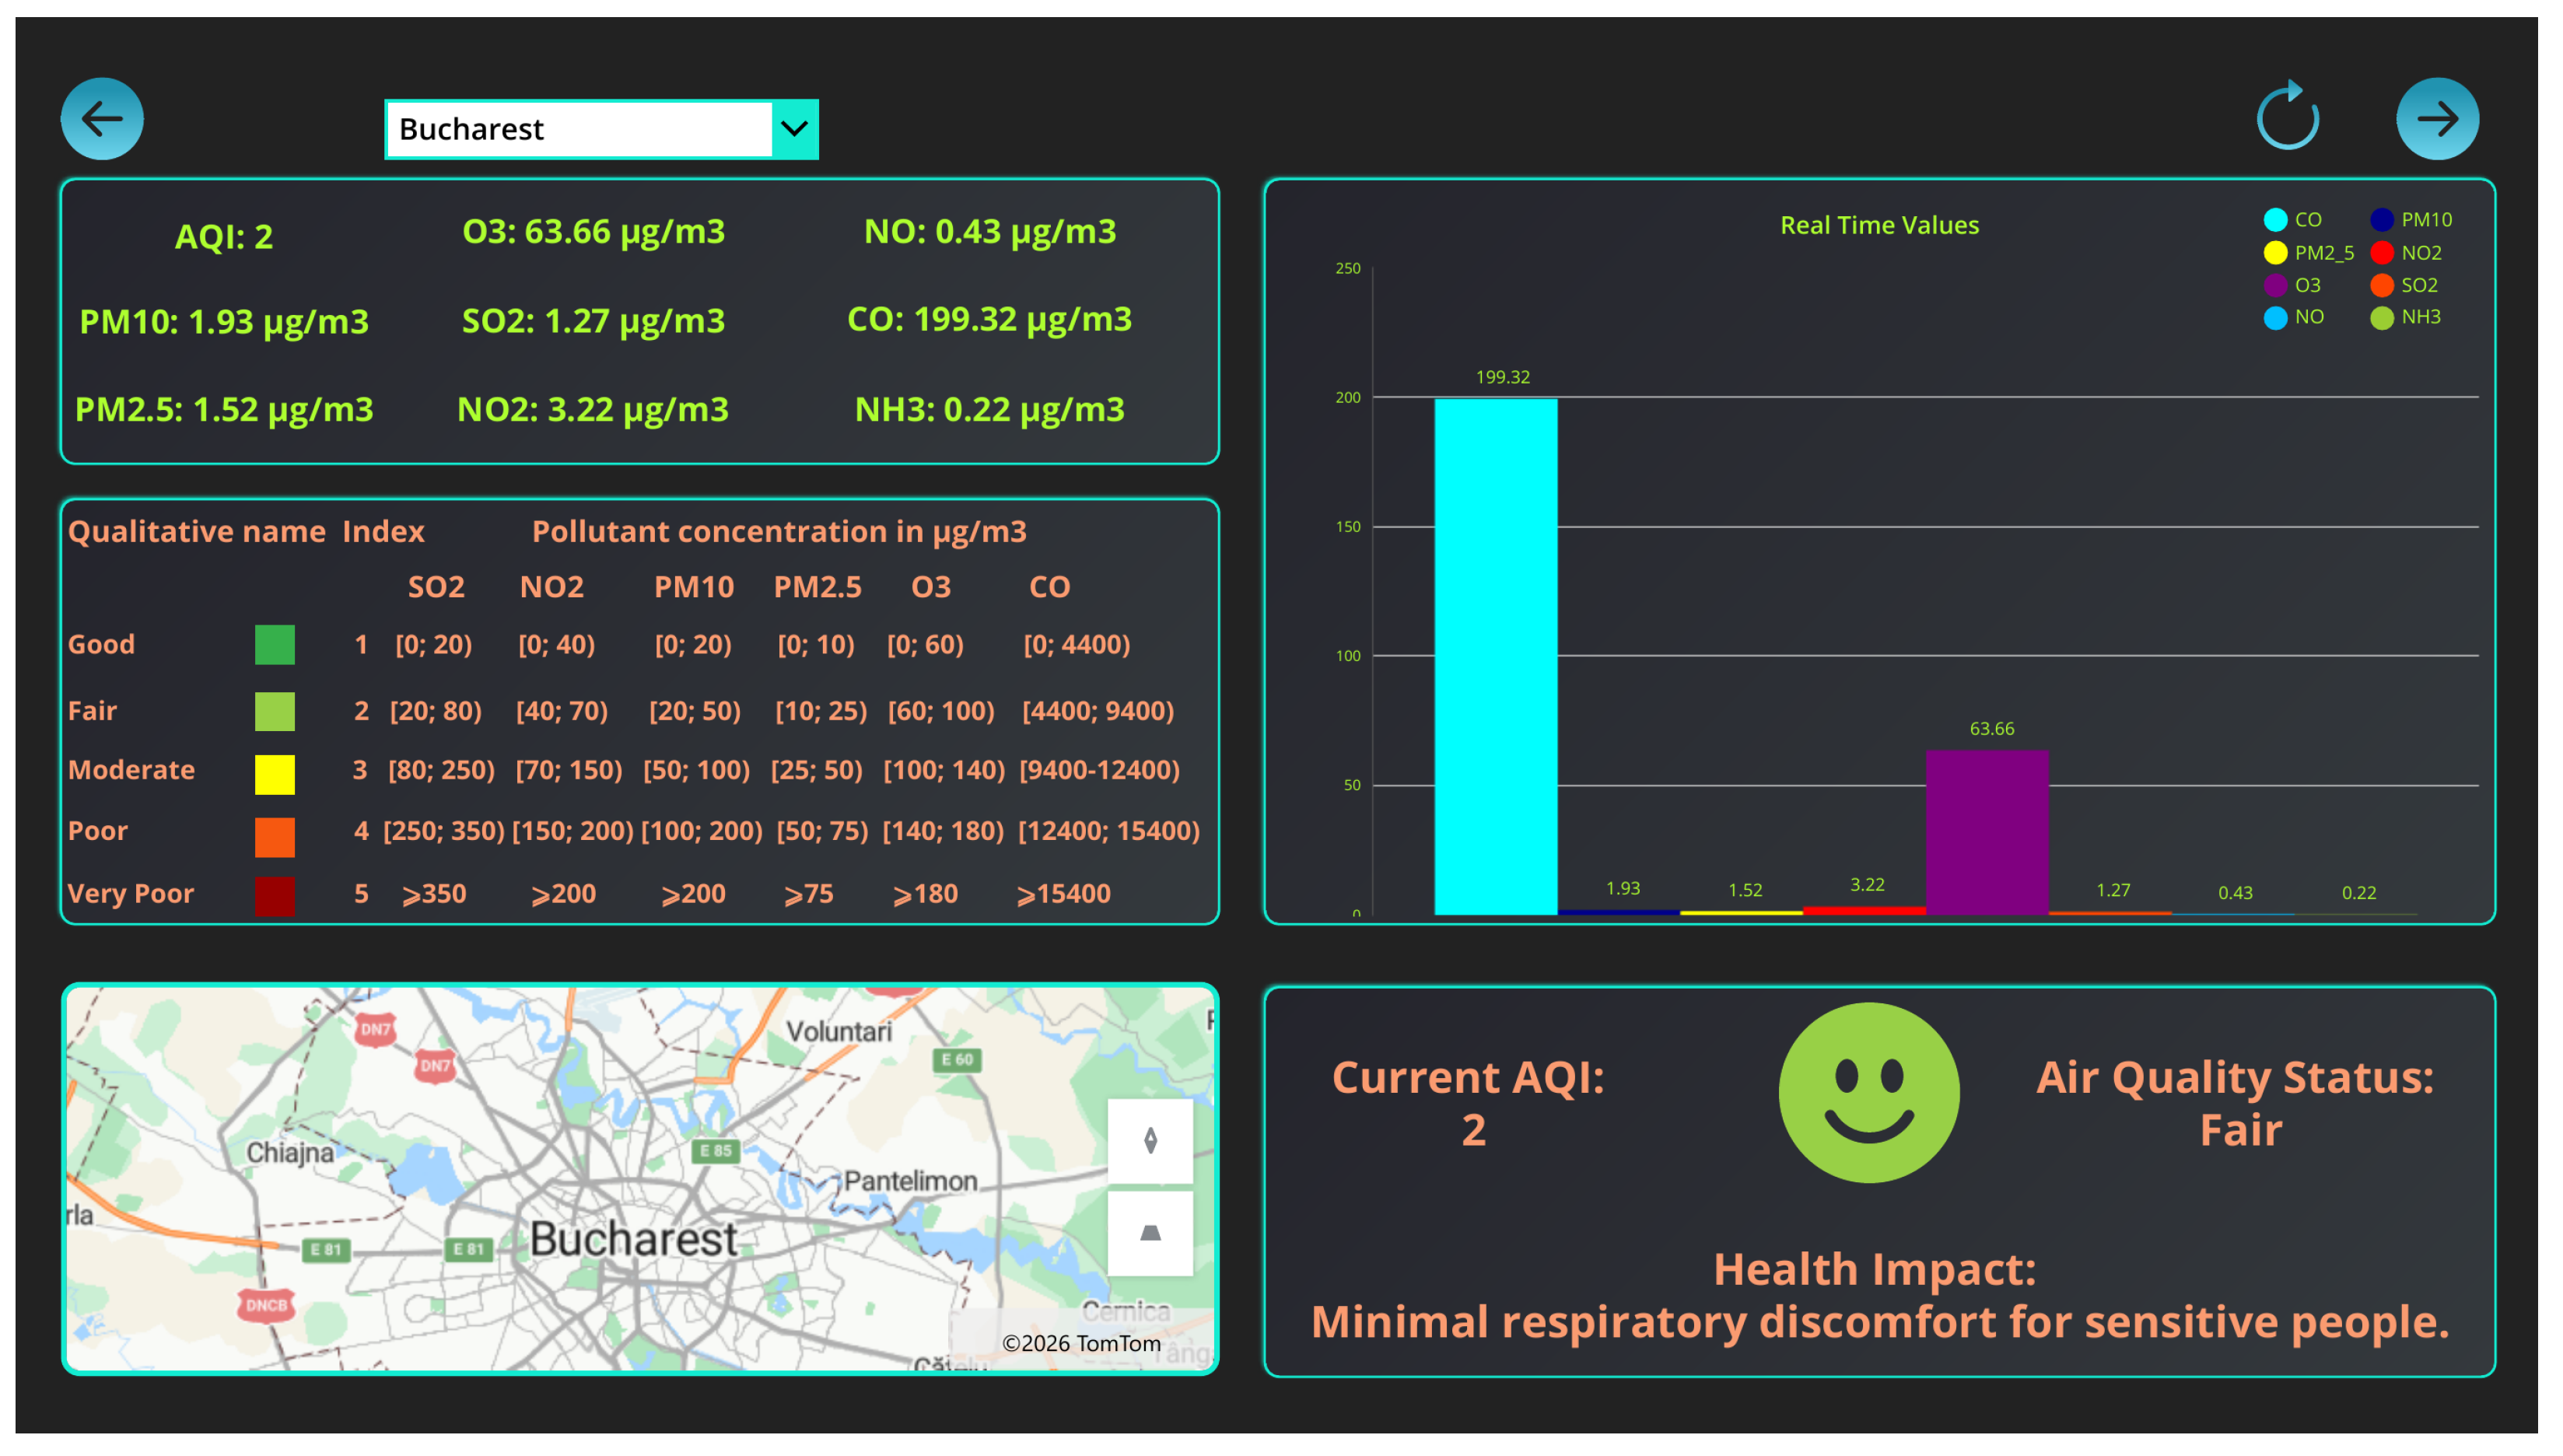
Figure 8 shows real-time data collected from the sensor platform, displaying multiple pollutants concentrations along with the corresponding air quality index (AQI) derived from the measured values. The interface also includes a graphical (bar) representation of the real-time data and an interpretation section describing the computed AQI values and its potential impact on human health.
Figure 8.
Application HMI displaying the real-time values of pollutants captured by the developed air quality monitoring system. AQI is computed using various standards.
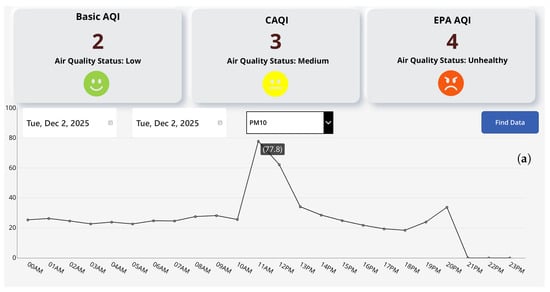
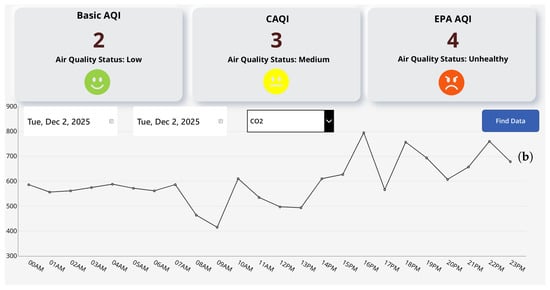
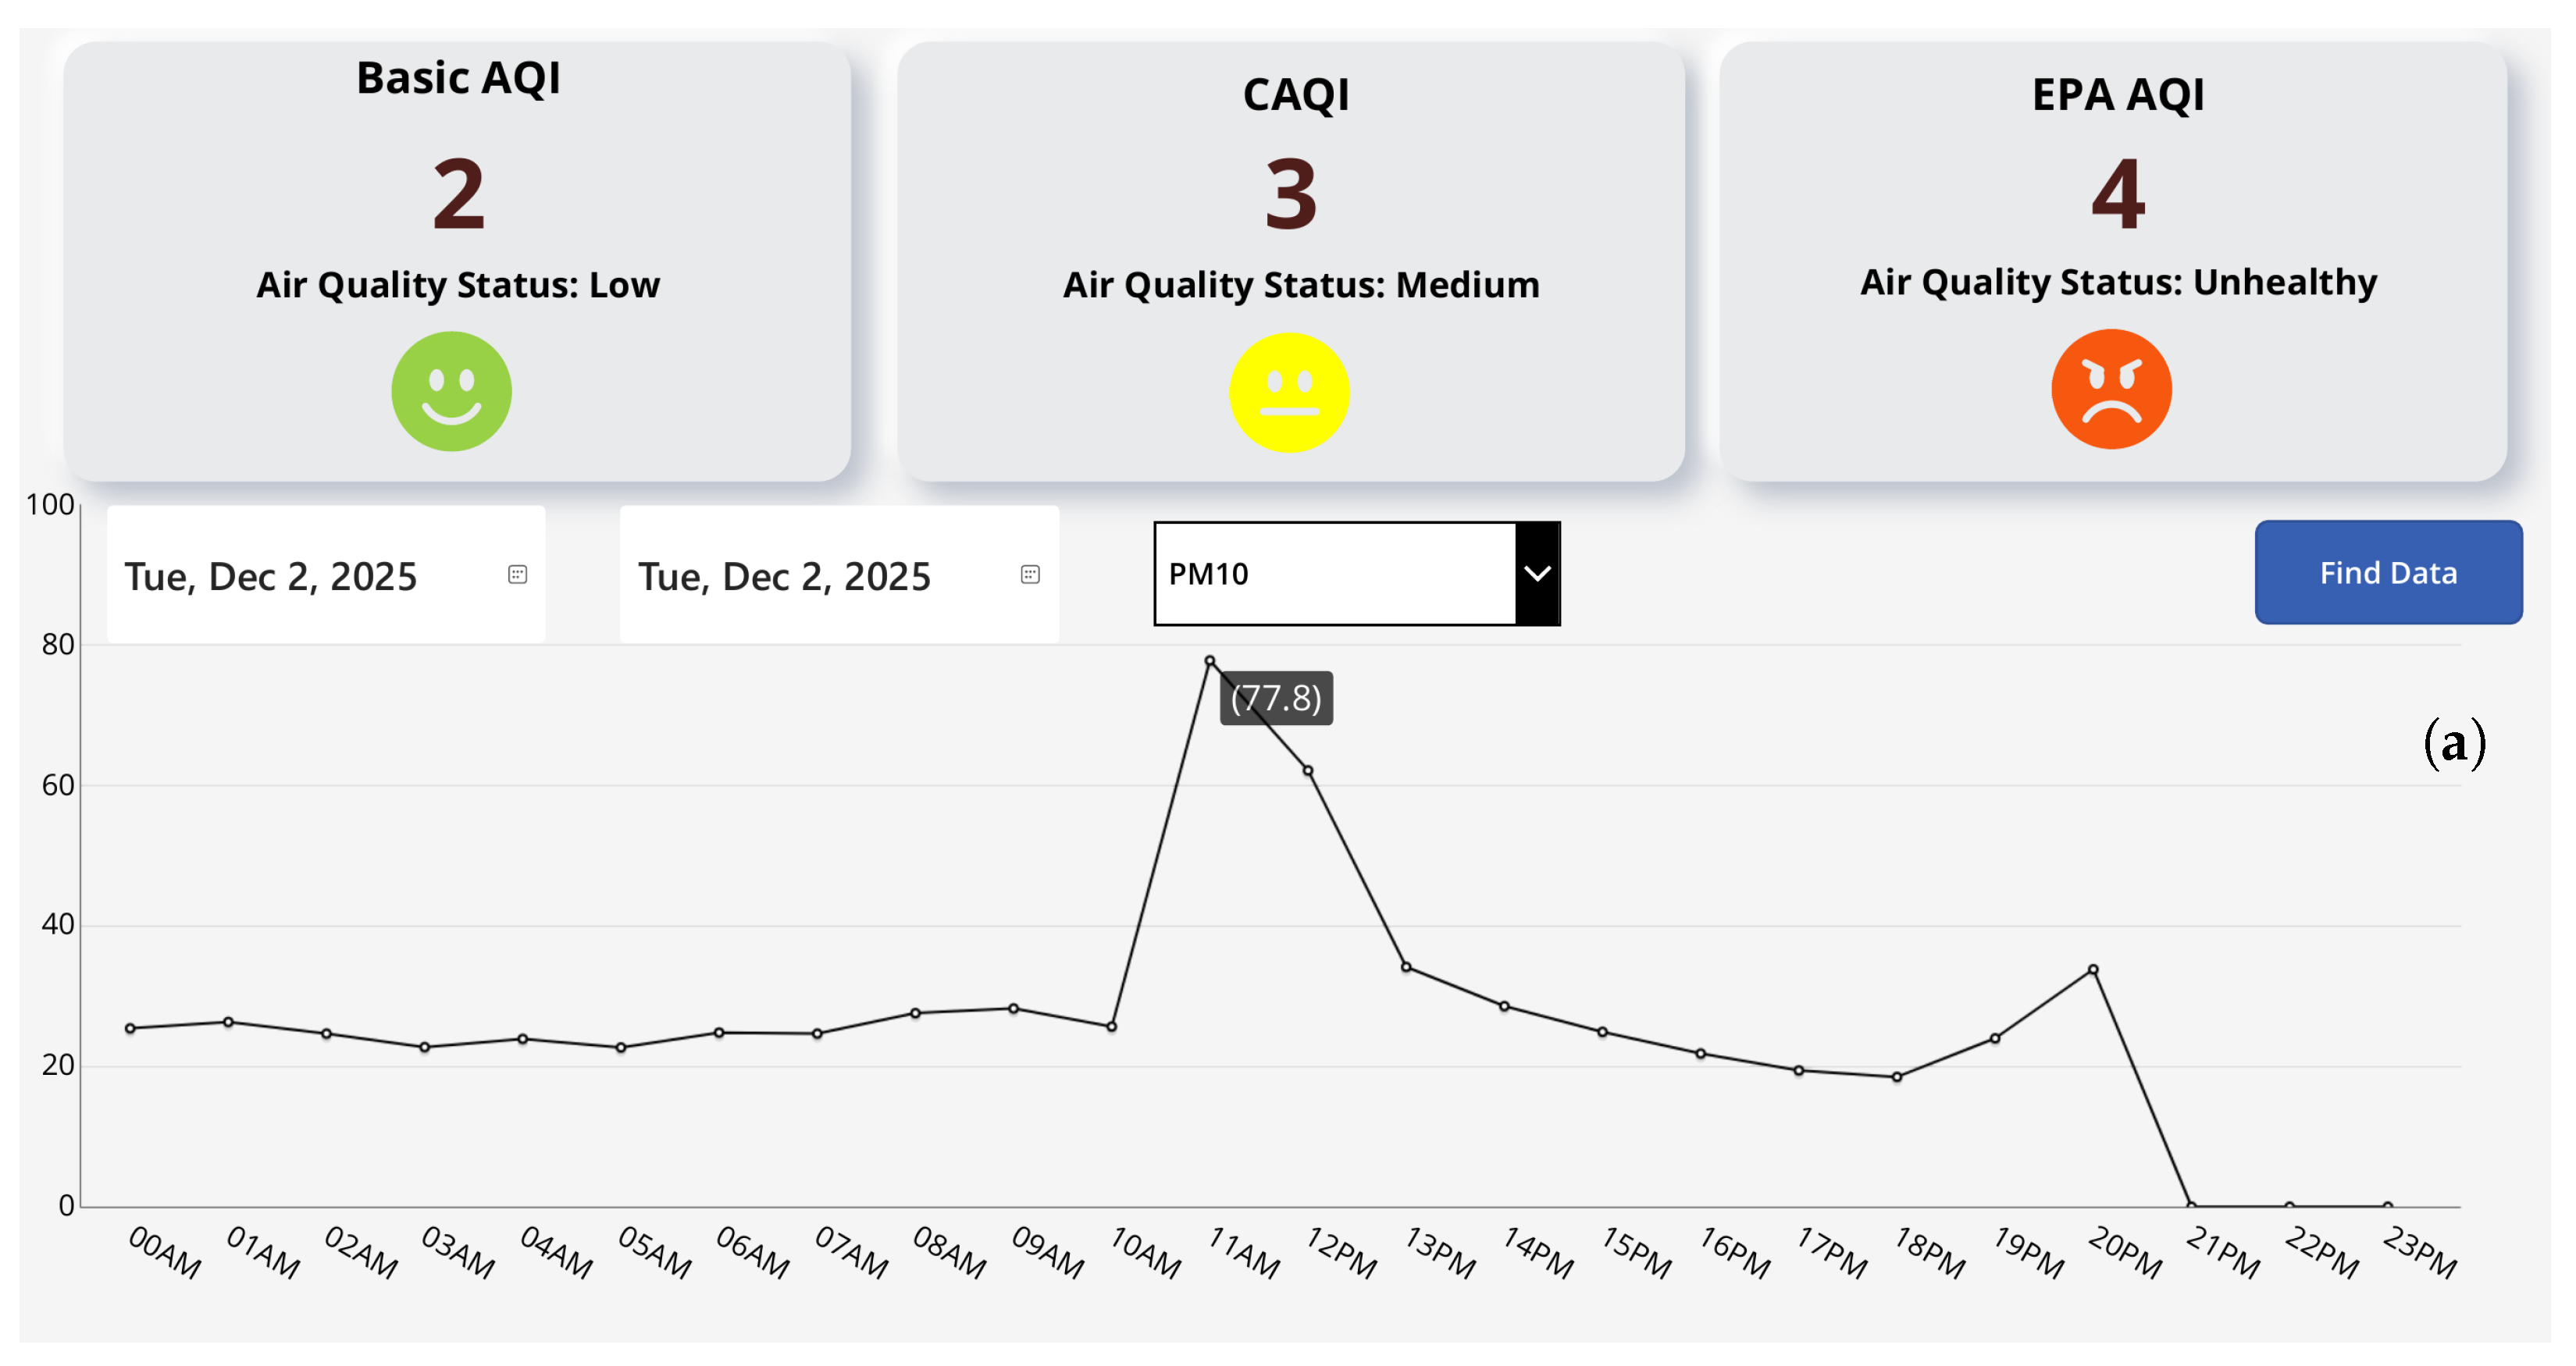
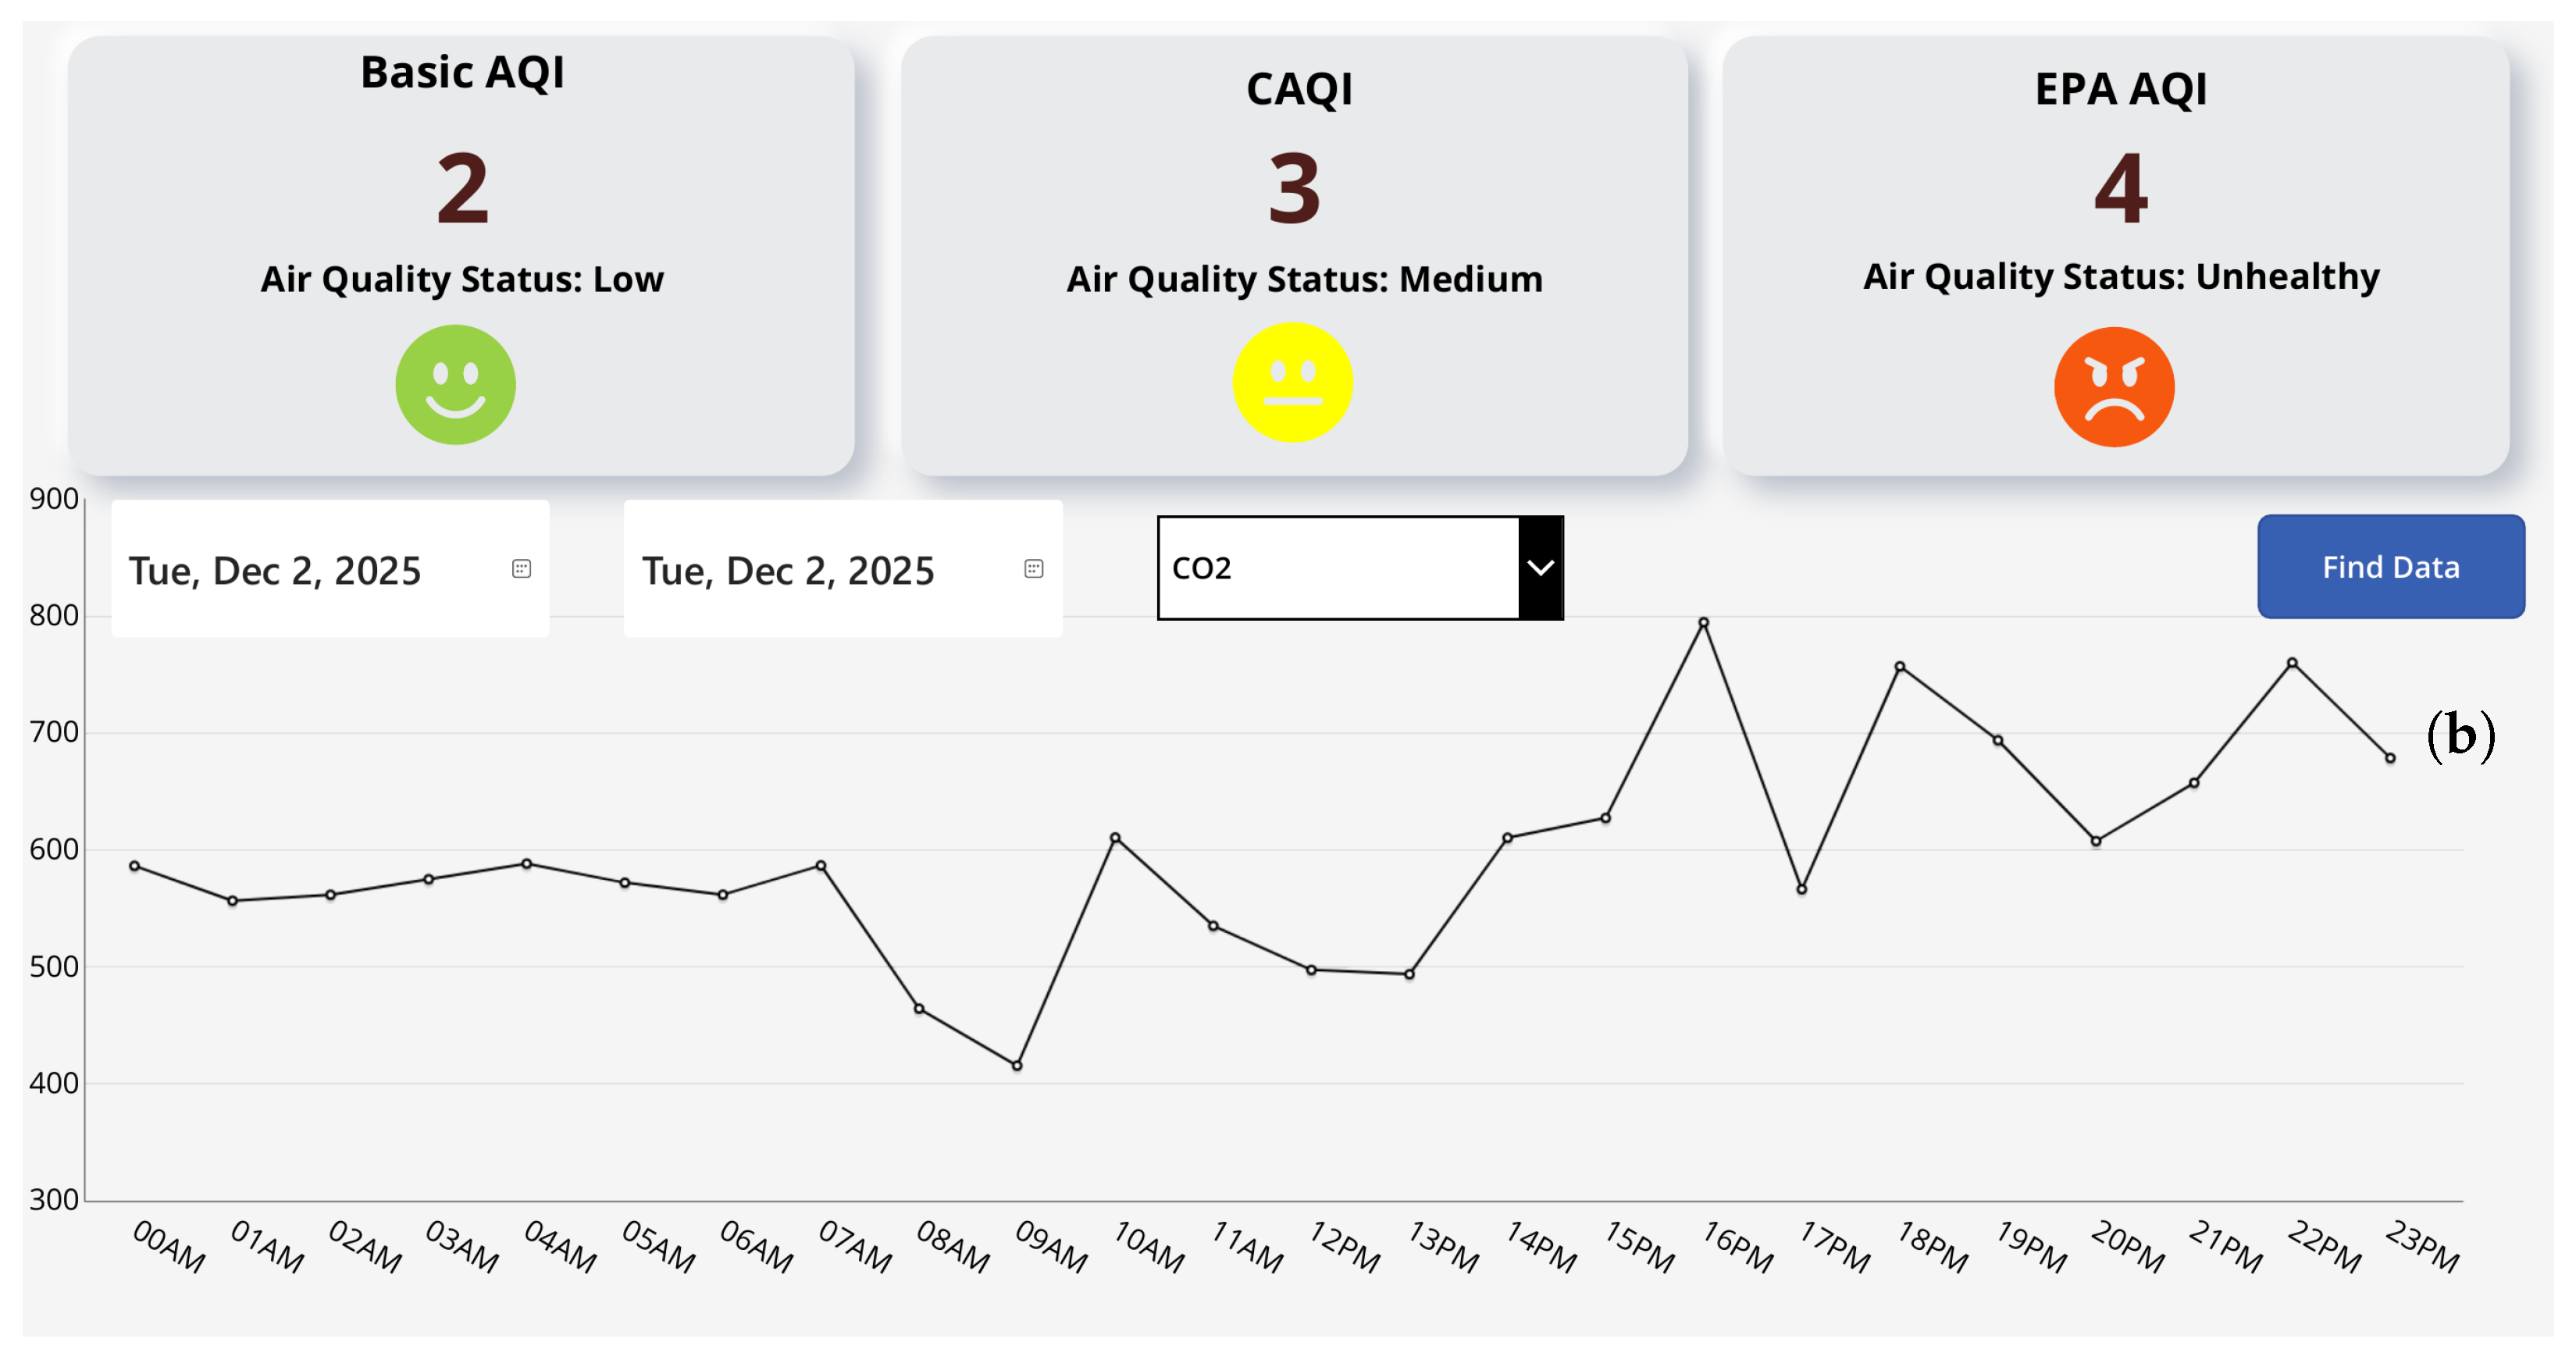
Another GUI functionality allows for data history to be viewed over a custom-sized time interval, which can be of the order of days, weeks, or years, according to the users’ preference—see Figure 9a,b. This functionality allows for time evolution observations of a certain parameter, which can be selected via a dropdown menu available in the interface. The obtained results include all key parameters defined by the relevant standards, as well as the current corresponding AQI values, computed using the three above-defined standards. Measurements are recorded hourly, and their representation is provided both graphically and in a scrollable table. To prevent information overload and potential confusion for users, the table includes an icon that opens a pop-up window which displays, in detail, all data stored in the database for the selected parameter. The 24 h evolution of historical data for PM10 and CO2 is displayed in the HMI application—see Figure 9a,b.
Figure 9.
Representation of 24 h historical data displayed in the HMI application. Data comes from the developed air quality monitoring system. (a) Evolution of PM10; (b) evolution of CO2.
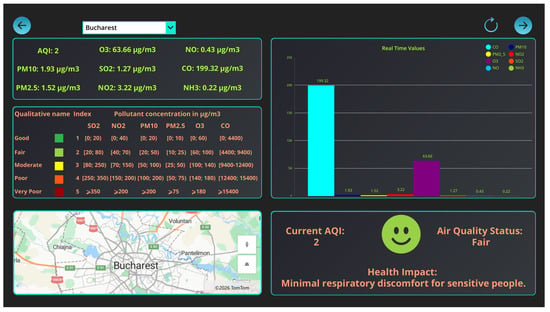
Figure 10 shows real-time data extracted from a the complementary data server associated with the Source 1. Sensor location, pollutants concentration values and respective bar graph, AQI value, and user-related information (index scale and impact on human health) are shown within the HMI.
Figure 10.
Real-time data extracted from a complementary data server, displayed in the HMI application. Data comes from a server denoted as Source 1.
5. Conclusions
This paper dealt with a complete solution, implementing a low-cost, energy-independent, network-connected, and scalable environmental air parameter monitoring system. It features a remote sensing module, which provides environmental data to a cloud-based server, and an intuitive air quality monitoring system, which ensures data retrieval, data processing, and a decision making-oriented user interface.
The application computes three air quality index values, Basic AQI, CAQI, and EPA AQI, in accordance with the current standards. It also applies these standards to the values obtained from additional API-based external data sources, allowing users to compare real-time information from the proposed system with other reference datasets.
The system integrates Sensirion SEN55 and the Winsen ZPHS01B, two complementary sensors dedicated to the measurement of environmental parameters. The collected data is transmitted to a remote server via the GSM modem using custom-built JSON structures. Once received by the server, the data are extracted and forwarded to a database that is accessible to users through a dedicated application.
The application, database, and underlying automation processes were developed using Microsoft Power Platform technologies. Specifically, PowerApps was used for the user interface, Dataverse for data storage, and PowerAutomate for data transfer and synchronization workflows. These components enable real-time data acquisition, automated storage, and the visualization of data from multiple sources.
Within the application, users can view the real-time evolution of pollutants that compose the selected air quality indices over user-defined time intervals (daily, monthly, or yearly) and compare the obtained values with official standards. This approach ensures full transparency and helps users clearly understand how each result is derived.
Following the development of the prototype composed by the sensor platform and the software application, the accuracy of the overall air quality monitoring system was thoroughly validated both in controlled indoor environments and against a trusted outdoor air-quality reference station.
The solution is scalable to a large extent, can be easily integrated into any organization that uses Microsoft cloud services, and can run on any connected device. It features a compact and energy-independent sensor platform and ensures data compatibility and security at a low price, making it suitable for integration within the increasingly large spatial density of monitoring stations required in urban environments.
The associated software application has a small size and can be shared with anyone in the organization, and the Dataverse database imposes no limitations on the number of records that can be added to the data table. Furthermore, by applying efficient filtering techniques, relevant results can be retrieved in a very short time, ensuring that user experience remains unaffected. Importantly, although the current implementation involves a single physical unit deployed in the field for data acquisition, the system architecture allows for the seamless addition of multiple units. The existing infrastructure can accommodate the increased data volume with minimal modifications, effectively addressing one of the main challenges associated with system scalability.
The security of the proposed solution is provided by the Microsoft 365 Education cloud platform itself. In addition to relying on the robust security mechanisms provided by Microsoft, the architecture of the employed tools inherently enhances data protection. As these technologies operate within an organization-based environment, access to the application is restricted to users who are not members of the designated organization, and an application owner must explicitly grant access to each user. Moreover, the use of Dataverse enables the implementation of a fine-grained access control, as application owners are required to define and assign specific security roles to users, allowing limited or conditional data access based on these roles.
Future work will be devoted to a refined calibration process of the sensor platform in order to ensure high-quality data output despite relying on low-cost sensors. In this sense, the mathematical correction of sensor measurement errors will be implemented, in order to minimize the impact of drifting phenomena commonly associated with low-cost sensing devices.
Field deployment to initiate continuous air quality monitoring within polluted sites due to nearby industrial and human activities is also envisaged. This will allow for statistical studies on emission sources in the area of concern and the subsequent effective selection of pollutants that relate to the type of human activity being performed.
Further, an analysis of the results and different AQI calculation modules provided by various environmental data source servers that are proposed in the online environment, with the aim of the identification of inconsistencies in both pollutant concentration and air quality index calculation, is envisaged.
Lastly, the prediction of future variations in the selected monitored parameters will be performed by implementing a machine learning-based system within the central management system.
Author Contributions
The study was conceptualized by I.F. and N.A. The hardware and software developments of the proposed system, including system integration and implementation, were carried out by S.-M.P. The original draft of the manuscript was prepared by S.-M.P., I.F. and N.A. Writing, critical review, and editorial revisions were provided by I.M. and N.A. Supervision and overall coordination of the research were conducted by I.F. and N.A. All authors have read and agreed to the published version of the manuscript.
Funding
This work was supported by PUBART project of National University of Science and Technology POLITEHNICA Bucharest.
Institutional Review Board Statement
Not applicable.
Informed Consent Statement
Not applicable.
Data Availability Statement
The original contributions presented in this study are included in the article. Further inquiries can be directed to the corresponding author.
Acknowledgments
This work was supported by the NetZeRoCities Competence Center, funded by the European Union–NextGenerationEU and Romanian Government, under National Recovery and Resilience Plan for Romania, contract no. 760007/30.12.2022 with Romanian Ministry Of Research, Innovation and Digitization, through specific research project P2—Sustainable energy and environment.
Conflicts of Interest
The authors declare no conflicts of interest. The funders had no role in the design of the present study; in the collection, analyses, or interpretation of data; in the writing of the manuscript; or in the decision to publish the results.
Abbreviations
The following abbreviations are used in this manuscript:
| ANSI C | American National Standards Institute C language |
| API | Application Programming Interface |
| AQI | Air Quality Index |
| CAQI | Common Air Quality Index |
| CH2O | Formaldehyde |
| CO | Carbon Monoxide |
| CO2 | Carbon Dioxide |
| EPA | Environmental Protection Agency |
| EU | European Union |
| GSM | Global System for Mobile Communications |
| GUI | Graphical User Interface |
| HMI | Human–Machine Interface |
| HTTP | Hypertext Transfer Protocol |
| I2C | Inter-Integrated Circuit |
| IoT | Internet of Things |
| JSON | JavaScript Object Notation |
| MPP | Maximum Power Point |
| MPPT | Maximum Power Point Tracking |
| NO | Nitric Oxide |
| NO2 | Nitrogen Dioxide |
| O3 | Ozone |
| PM | Particulate Matter (e.g., PM2.5, PM10) |
| PWM | Pulse Width Modulation |
| UART | Universal Asynchronous Receiver-Transmitter |
| VOC | Volatile Organic Compounds |
| WHO | World Health Organization |
| Wi-Fi | Wireless network protocol based on the IEEE 802.11 family of standards |
References
- Lelieveld, J.; Evans, J.S.; Fnais, M.; Giannadaki, D.; Pozzer, A. The contribution of outdoor air pollution sources to premature mortality on a global scale. Nature 2015, 525, 367–371. [Google Scholar] [CrossRef] [Scilit] [PubMed]
- Kozłowski, R.; Szwed, M.; Kozłowska, A.; Przybylska, J.; Mach, T. Quality Management System in Air Quality Measurements for Sustainable Development. Sustainability 2024, 16, 7537. [Google Scholar] [CrossRef] [Scilit]
- Alsamrai, O.; Redel-Macias, M.D.; Dorado, M.P. Real-Time Intelligent Monitoring of Outdoor Air Quality in an Urban Environment Using IoT and Machine Learning Algorithms. Appl. Sci. 2025, 15, 9088. [Google Scholar] [CrossRef] [Scilit]
- Alrashidi, H.; Sibai, F.N.; Abonamah, A.; Alrashidi, M.; Alsaber, A. PM2.5: Air Quality Index Prediction Using Machine Learning: Evidence from Kuwait’s Air Quality Monitoring Stations. Sustainability 2025, 17, 9136. [Google Scholar] [CrossRef] [Scilit]
- Kortoçi, P.; Motlagh, N.H.; Zaidan, M.A.; Fung, P.L.; Varjonen, S.; Rebeiro-Hargrave, A.; Niemi, J.V.; Nurmi, P.; Hussein, T.; Petäjä, T.; et al. Air pollution exposure monitoring using portable low-cost air quality sensors. Smart Health 2022, 23, 100241. [Google Scholar] [CrossRef] [Scilit]
- Petrică, S.M.; Făgărăşan, I.; Arghira, N.; Stamatescu, I.; Neculoiu, G.; Flangea, O. Energy efficient IoT air quality monitoring system. In Proceedings of the 2023 24th International Conference on Control Systems and Computer Science (CSCS), Bucharest, Romania, 24–26 May 2023; pp. 508–513. [Google Scholar]
- Banciu, C.; Florea, A.; Bogdan, R. Monitoring and Predicting Air Quality with IoT Devices. Processes 2024, 12, 1961. [Google Scholar] [CrossRef] [Scilit]
- Liu, S.; Xia, C.; Zhao, Z. A low-power real-time air quality monitoring system using LPWAN based on LoRa. In Proceedings of the 2016 13th IEEE International Conference on Solid-State and Integrated Circuit Technology (ICSICT), Hangzhou, China, 25–28 October 2016; pp. 379–381. [Google Scholar]
- Shahid, S.; Brown, D.J.; Wright, P.; Khasawneh, A.M.; Taylor, B.; Kaiwartya, O. Innovations in Air Quality Monitoring: Sensors, IoT and Future Research. Sensors 2025, 25, 2070. [Google Scholar] [CrossRef] [Scilit] [PubMed]
- Paithankar, D.N.; Pabale, A.R.; Kolhe, R.V.; William, P.; Yawalkar, P.M. Framework for implementing air quality monitoring system using LPWA-based IoT technique. Meas. Sens. 2023, 26, 100709. [Google Scholar] [CrossRef] [Scilit]
- Kumar, P. A critical evaluation of air quality index models (1960–2021). Environ. Monit. Assess. 2022, 194, 324. [Google Scholar] [CrossRef] [Scilit] [PubMed]
- Quality Index CAQI and AQI—Methods of Calculation. Available online: https://shorturl.at/foRDI (accessed on 15 December 2025).
- Petrică, S.M.; Făgărășan, I.; Stamatescu, I.; Arghira, N.; Pietraru, R.N. Low-cost air pollution monitoring systems. In Proceedings of the 2024 28th International Conference on System Theory, Control and Computing (ICSTCC), Sinaia, Romania, 10–12 October 2024; pp. 258–263. [Google Scholar]
- Technical Assistance Document for the Reporting of Daily Air Quality—The Air Quality Index (AQI). Available online: https://shorturl.at/xG4y2 (accessed on 15 December 2025).
- European Common Air Quality Index. Available online: https://eur-lex.europa.eu/eli/dir/2008/50/oj/eng (accessed on 15 December 2025).
- Environmental Sensor Node for HVAC and Air Quality Applications. Datasheet SEN5x. Available online: https://shorturl.at/ld9DJ (accessed on 15 December 2025).
- Winsen ZPHS01B Datasheet. Multi-in-One Sensor Module. Available online: https://shorturl.at/E0GPz (accessed on 15 December 2025).
- ESP32 Microcontroller Datasheet. Available online: https://shorturl.at/7Y7Iy (accessed on 15 December 2025).
- GSM Modem WIFI 4G/5G. Available online: https://shorturl.at/54bYa (accessed on 15 December 2025).
- MPPT Charge Controller. Available online: https://shorturl.at/3CpNP (accessed on 15 December 2025).
- Microsoft Power Platform Documentation. Available online: https://learn.microsoft.com/en-us/power-platform/ (accessed on 15 December 2025).
- Data Source 1: Open Weather Air Pollution Platform. Available online: https://openweathermap.org/api/air-pollution (accessed on 15 December 2025).
- Data Source 2: The Air Quality API. Available online: https://api-ninjas.com/api/airquality (accessed on 15 December 2025).
- Data Source 3: City Feed-City/Station Feed API. Available online: https://aqicn.org/json-api/doc/ (accessed on 15 December 2025).
- Location of B-15 Station. Available online: https://shorturl.at/z5Nyp (accessed on 11 December 2025).
- Aerlive Air Monitoring Platform (in Romanian). Available online: https://aerlive.ro/ (accessed on 15 December 2025).

Disclaimer/Publisher’s Note: The statements, opinions and data contained in all publications are solely those of the individual author(s) and contributor(s) and not of MDPI and/or the editor(s). MDPI and/or the editor(s) disclaim responsibility for any injury to people or property resulting from any ideas, methods, instructions or products referred to in the content. |
© 2026 by the authors. Licensee MDPI, Basel, Switzerland. This article is an open access article distributed under the terms and conditions of the Creative Commons Attribution (CC BY) license.