


Abstract
Green cities can contribute to greater mental and physical well-being. In addition, many people enjoy being active outdoors (green exercise). As yet, no questionnaire jointly emphasises mental health, willingness to pay for sustainability, and the incentive of a green environment for physical exercise in cities. Therefore, I developed the new Green Cities Questionnaire (GCQ), comprising 18 items, and used it to survey the perceptions of 249 participants (130 female, 119 male, 0 diverse; aged 18 to 84). Then, I applied exploratory factor analyses where the three factors of mental health (MH; nine items), willingness-to-pay (WTP; five items), and green exercise (GE; four items) were extracted. Additional statistical analyses revealed that women reported higher values on the MH and GE factors than men. In particular, women and men reported a beneficial effect of green cities on mental health (higher ratings on MH than on GE and on WTP). However, there was no gender effect on WTP. From an urban-planning perspective, the two strongest implications are as follows: First, the GCQ facilitates measurement of the three key latent factors: MH, WTP, and GE. However, future validation studies with larger sample sizes and applications of the GCQ alongside additional similar and different recognised scales are necessary to establish convergent and discriminant validity. Second, mental health is reported to be much more important than WTP and GE. Hence, green initiatives, educational programs, and green city workshops should not only focus on expanding urban green spaces but also on providing appropriate relaxation areas to promote and foster psychological well-being and quality of life in green cities.
1. Introduction
Rapid urbanisation worldwide, anthropogenic climate change, the exploitation of natural resources, and unhealthy lifestyle changes have reduced the opportunities for humans to engage with nature in many urbanised societies [1]. However, evidence suggests that nature contact may promote health, and the benefits of short-term restorative effects are already quite strong [1]. For example, in Japan, shinrin-yoku is the well-recognised healthy practice of forest bathing or taking in the forest atmosphere, which has been shown to confer several physiological health benefits, including lower pulse rate, lower blood pressure, lower cortisol concentrations, lower sympathetic nerve activity, and greater parasympathetic nerve activity, compared to city environments [2]. A review examined the potential effects of forest bathing trips (i.e., a 3-day/2-night trip) on the human immune function [3]. It was found that these trips positively affected the increase in natural killer (NK) activity (i.e., the number of NK, granulysin-, perforin-, and granzyme A/B-expressing lymphocytes in the blood and a lower concentration of urinary adrenaline), which lasted for more than 30 days after the trip. In contrast, a visit to the city did not increase NK activity. In another meta-analysis, the green space living environment was associated with a decrease in blood pressure and a lower risk of hypertension [4]. As urban green spaces play a crucial role in reducing heat-related health risks, strategies for urban planning are essential to enhance public health in cities while mitigating climate change [5]. Moreover, although climate change threatens the global economy, the implementation of nature-based solutions (NBS) can help tackle biodiversity loss while generating value for the health and well-being of residents [6].
1.1. Green Cities and Urban Green Spaces
The terms green city and urban green spaces are related. However, they represent different concepts in sustainability and urban planning. Green city (also referred to as sustainable city or eco-city) is a broader concept that refers to a holistic, city-wide sustainability strategy focusing on the design, construction, operation, and on the overall social, economic, and environmental impact (to increase urban green spaces; to lower pollution and greenhouse gas emissions etc.) to foster and improve the psychological and physiological well-being of the city’s residents within a sustainable ecosystem [7,8]. Furthermore, the 11th Sustainable Development Goal (SDG) of the 17 SDGs of the United Nations is Sustainable Cities and Communities [9,10,11], which aims to “make cities and human settlements inclusive, safe, resilient and sustainable”, and encompasses 10 targets ([12], p. 21).
Urban green spaces can be defined as “any vegetation found in the urban environment, including parks, open spaces, residential gardens, or street trees” ([13], p. 113). Furthermore, the framework of urban green spaces can be grounded in a construct-based definition that subdivides it into five elements: measures, scale, methods, view type, and green/blue spaces [14]. Nevertheless, although several approaches exist for describing and defining urban green spaces, they can be considered components of the sustainability strategy described within the context of green cities.
The newly developed Green Cities Questionnaire addresses both aspects of green cities and, more specifically, urban green spaces as essential components of green cities (cf. the 18 items in Appendix A.1).
1.2. Green Cities and Mental Health
Urbanisation is a global phenomenon that poses tremendous challenges to residents’ mental health and the provision of mental health services [15]. The negative impact of climate change on mental health is accelerating, which disproportionally affects marginalised groups the most [16]. A review has shown that in most included studies, a positive association was found between urban green space and physical activity and mental health [17]. However, they also identified that sole access is not enough; proximity to residential areas, perceived security aspects, maintenance, renovation, and planning of interactive activities are also essential factors. Another review revealed small effects of positive associations for exposure to the natural environment and reduction in depressive mood following [18]. Additionally, for the prevention and treatment of depression in adults, forest therapy was found to be a more effective short-term intervention than engaging in similar activities in a hospital or non-forested urban area [19]. Moreover, about of the individuals suffering from clinical depression benefited clinically relevantly from a 12-week therapeutic horticulture intervention, in which the factors Being Away and Fascination appeared to have an active role [20]. In a study conducted in Brussels, it was uncovered that higher odds of depressive disorders were positively associated with exposure to traffic-related air pollution (i.e., NO2, PM10, black carbon) [21]. In a meta-analysis, it was demonstrated that nature-based interventions (NBIs) such as gardening, nature-based therapy, and green exercise effectively improved mental health outcomes in adults (also with pre-existing mental health problems), particularly when they were offered for 8 to 12 weeks for 20 to 90 min [22]. A systematic review revealed limited evidence for a positive relationship between surrounding greenness and mental health in adults, but not for children [23]. Moreover, it was found that urban green spaces have a positive effect on well-being while reducing mental distress among individuals living in urban areas [24]. It was also shown that people felt their lives were more worthwhile when they visited nature regularly, and those who reported being happier had visited nature the previous day [25]. In a review, a positive association of urban green areas and benefits to citizens, as well as increased welfare levels, were identified [26]. Furthermore, in an experimental field study in Helsinki, it was shown that short-term visits to urban nature environments had a positive effect on the relief of perceived stress when compared to the built-up environment [27].
Given the broad and diverse field of green cities, it is crucial to learn more about mental health within the context of green cities, particularly urban green spaces.
1.3. Green Cities and Willingness to Pay
Several studies investigated the willingness to pay for green cities in various contexts. It was found that knowledge of the benefits of recreation and accessibility to green roofs had a positive impact on the willingness to pay for urban green spaces [28]. In Germany, a study conducted in Berlin found that street greening was strongly valued by the respondents [29]. In China, a study conducted in Beijing found that environmental awareness positively influenced the willingness to pay for urban green space conservation, whereas higher income and higher education levels had a negative impact on the willingness to pay [30]. Furthermore, in Wuhan, it was demonstrated that familiarity with green infrastructure, perceptions of air quality improvement, and information sources had a positive impact on willingness to pay; however, low income had an adverse effect on it [31]. Besides the direct link between urban and suburban green spaces and the quality of life of the local residents, in a Greek city, income and knowledge of environmental issues and benefits of green spaces were identified as key factors for a higher willingness to pay for green spaces [32]. In Vienna, it was found that respondents expressed a preference for a greener city, with a higher willingness to pay for green measures on streets (EUR 5.58/year) than on buildings (EUR 3.60/year) [33]. Moreover, in China, Chifeng, there was a greater willingness to pay for green development among well-educated individuals, urban residents, and government employees [34]. Similarly, in Hong Kong, better-educated, higher-income, and younger individuals articulated a higher willingness to pay for sustainable drainage systems in a highly urbanised city [35]. Furthermore, in Brazil, the public is willing to pay more for urban green spaces if they recognise the health benefits of urban well-being and sustainability [36]. In another study in Finland, it was shown that more than two-thirds of the participants expressed a willingness to pay for the use of recreation areas, with active management and a good location even increasing the average willingness [37].
Taken together, several studies indicate that willingness to pay is an essential economic aspect of green and sustainable cities. Hence, it is necessary to not only assume it, but also to directly assess and study whether local city residents would be willing to pay for a more sustainable city, and if yes, to what extent.
1.4. Green Cities and Green Exercise
The beneficial effects of exercise and physical activity on physical and mental health, as well as quality of life outcomes, are well-documented [38]. Physical activity and health-related quality of life (HRQoL) were positively associated with higher amounts of time spent in urban green spaces for community-dwelling older adults [39]. Additionally, obese individuals aged 18–21 years experience better stress relief and restored attentional levels when exercising in natural urban green spaces, compared to physical activity in a gym [40]. In an experimental study, self-esteem was positively affected by rural and urban pleasant scenes than in the exercise-only control [41]. Green exercise can substantially improve self-esteem and total mood disturbance (e.g., anger-hostility, confusion-bewilderment, depression-dejection and tension-anxiety) after activity and may positively affect mental health and well-being [42]. Furthermore, walking may increase positive affect and reduce negative affect, while feelings of time pressure can decline more when walking in the park instead of walking on the street [43]. Although having urban green spaces in the neighbourhood is not enough to reduce mental health issues, research in Brazil has shown that the frequency, duration, and higher intensity of nature engagement in UGS are positively associated with lower stress, depression, and anxiety [44]. Additionally, green exercise may positively improve psychological well-being (e.g., improvements of self-esteem, perceived stress, and mood), but the type of nature seems to be less critical [45]. However, it was found that green exercise, such as running with no audio, can evoke similar emotional states as running with an audiobook or music [46]. Furthermore, running in nature and consciously listening to nature sounds may evoke more positive emotions than when compared to running and not consciously listening to nature sounds [47]. Moreover, a review suggests that integrating green spaces and walkability features, such as safe pavements, may substantially improve cardiovascular health and enhance well-being and quality of life in urban residents [48]. For running, a preference for green spaces, routes with high connectivity, higher safety, wide, smooth surfaces, away from pollution and traffic congestion to connect with nature was observed [49]. Although it has been shown that green exercise may have a more positive impact on reducing depression, anxiety, anger, and fatigue while improving positive emotions and moods, exercising in wild environments can be even more effective than in urban green spaces [50].
Park proximity has been identified as a crucial factor for promoting physical activity and green exercise. For example, multiple leisure-time physical activity outcomes were positively associated with perceived proximity to a park [51,52]. Moreover, large, high-quality parks within walking distance [53] as well as cleanliness and maintenance are essential for many people, regardless of the park’s size [54]. Additionally, more sports and bicycling were associated with more urban green [55], and respondents living closer to parks were less likely to be obese and overweight and more likely to be physically active [56]. Park use may also increase in residential areas if small, accessible green spaces are planned and if park accessibility is improved via public transportation [57]. In contrast, a study in Stockholm also observed that moving to places with more greenness was associated with less walking and cycling, while moving to less green areas was associated with more walking and cycling [58]. These contradictory findings stress the need for place-specific health policies.
Although several studies have examined aspects of green cities and urban green spaces, it is highly important to examine the attitudes, beliefs, and opinions of city residents. Hence, it is vital to also quantitatively measure and focus on crucial aspects within the broader context of green cities and urban green spaces, such as mental health, willingness to pay, and incentives for green exercise.
As yet, even though in a survey study a two-factor structure on attitudes towards urban green spaces, such as behaviour and usefulness had been identified [59], to the best of my knowledge, no psychometric questionnaire on green cities and urban green spaces focuses jointly on the aspects of mental health, willingness to pay for greener cities, and incentives for urban green exercise. However, these aspects play a crucial role in planning greener cities with more urban green spaces, not only to improve mental health and green exercise, but also to shed more light on the willingness to pay for greener cities. Taken together, the Green Cities Questionnaire (GCQ) makes a new contribution to better study attitudes, beliefs, and opinions of the broader concept of green cities and of the smaller ones, such as urban green spaces.
1.5. Present Work
Therefore, the primary goal and the first research objective of the present study was to develop a new questionnaire that measures crucial dimensions such as the impact of greener cities on mental health, the willingness to pay for greener cities, and the impact of greener cities on physical activity, i.e., green exercise. The second research objective was to provide initial correlational insights into any potential associations between the newly extracted factor scores and several demographic variables (e.g., gender, age, income), as well as mobility variables such as annual mileage, commuting by car and public transport, and cycling per week.
2. Materials and Methods
2.1. Questionnaire Development
The main goal of the present study was to develop a new questionnaire that measures crucial dimensions such as the impact of greener cities on mental health, the willingness to pay for greener cities, and the impact of greener cities on physical activity, i.e., green exercise. Therefore, I conducted literature research and developed the research design and research objectives for developing the new questionnaire on green cities. Additional items on volunteering, cycling, waste management, and demographic questions (e.g., gender, age, education, living, marital status, etc.; cf. Section 2.2) were included. After the data were sampled, as described in more detail in Section 2.3, the comprehensive statistical analyses began. I removed ambiguous items in iterative steps due to unclear or weak loadings and/or low commonalities. Therefore, the initial item pool of 43 selected items was reduced to 18 items with the three extracted and stable factors: Mental Health (MH; 9 items), Willingness-to-Pay (WTP; 5 items), and Green Exercise (GE; 4 items). Despite the development of a new questionnaire on greener cities, the overarching goal was to apply it in future research settings to provide more insights into gender and age differences across these three main factors, as well as into the context of other similar and different questionnaires examining convergent and discriminant validity.
Additionally, I put a special emphasis on collecting (quasi-)metric (or quasi-continuous) data [60] on a differentiated scale. Hence, I incorporated and applied a visual analogue scale response format to all GCQ items with the numerical and verbal anchors: 0 = “I fully disagree” and 10 = “I fully agree”. Of course, this response format was not applied to the demographic questions.
The GCQ items for all three factors are supplied in Appendix A.1. Furthermore, a short guideline (or manual) on how to apply it and compute the mean factor scores is also provided in the appendix in Appendix A.2. On top of this, the data set and further results (computed with SPSS or jamovi [61,62]) are shared with the scientific community via the professional Open Science Framework (OSF). The link to the OSF repository is provided in the Data Availability Statement.
2.2. Participants
In total, 249 respondents were queried in Germany (130 female, 119 male, 0 diverse; aged 18 to 84, M = 39.40 years, SD = 17.88). A special focus was put on collecting data from about as many women as men and as many older adults as young ones. This was particularly important for developing the GCQ and studying any gender or age-group differences. All participants were fluent in German and had normal or corrected-to-normal vision. Fifty-five were unmarried or single, 81 were in a relationship, 97 were married, 12 were divorced, and one was widowed (three did not answer). One hundred and thirty-eight lived in a big city (>100.000 inhabitants), 43 in a medium city (20.000 to 100.000), 39 in a small town (5.000 to 20.000), seven near a city, 16 in a small town or village, and 6 in the countryside. Two hundred and nineteen held a driving licence, and 241 knew how to cycle. One hundred and fifteen used it as a mode of transport and cycled on average 3.57 times per week (SD = 3.03). One hundred and nineteen commuted by car, and 91 regularly by public transport. Ride-sharing was used seldom by 24 and frequently by 3 of them. Ten regularly used car-sharing. The average annual mileage (measured in kilometres) and income could be answered in categories. Thereby, 34 were assigned 0 km, 34 till 1.000, 46 till 5.000, 43 till 10.000, 27 till 15.000, 18 till 20.000, 17 till 25.000, 15 till 30.000, 5 till 40.000, 3 till 45.000, and one more than 50.000 (6 did not specify). Fifty-seven did not specify their household income, 59 had no own income, 16 had less than EUR 500, 45 had less than EUR 1.000, 27 had less than EUR 2.000, 26 had less than EUR 3.000, and 19 had less than EUR 4.000. Two hundred nineteen were German citizens. Education: Three participants did not have a professional qualification and were not in vocational training; two were in vocational training; 86 were students; 33 had completed vocational-company training (apprenticeship) or vocational-school training (vocational school, commercial school); 15 had completed training at a technical college, master’s school, technical college, vocational or technical academy; 33 completed a high school diploma; 68 held a university degree (bachelor or master), six a doctorate, and three had completed a habilitation (a postdoctoral qualification).
2.3. Study Design and Sampling Procedure
A cross-sectional online questionnaire study was conducted to develop the GCQ. The data were collected by 62 psychology bachelor students at RWTH Aachen within my lecture Test theory. The data collection was a recommended practical part of this lecture, but it was not compulsory and did not influence the grading. Every student interested in participating could choose between this topic on green cities or another one (beyond the scope of the present study, with a separate online questionnaire). Everyone who decided to participate was responsible for the data collection of four participants; two should be women and two men, while one woman and one man should be older than 40 years. In total, 62 students collected the data (from 150+ students who attended this lecture) and sampled data of about four participants each, resulting in the overall sample size of .
The study was conducted in accordance with the Declaration of Helsinki [63]. An internal pilot phase was used to optimise a few items. Therefore, these data were not included in the data set of the main phase. In the primary phase , the participants were recruited throughout Germany, mainly in North Rhine-Westphalia. About 91 per cent of all 275 respondents initially interested completed the questionnaire. They were approached and invited personally or via email (with support on the phone or laptop). Before participation, they were transparently informed of the online questionnaire study’s goal, objectives, and data usage. All could ask questions if anything was unclear before beginning the study, and they were invited to ask questions at any time during the study. They were informed about their free participation and the possibility of stopping the study at any stage. After the welcome page with all information about the background and the data usage of the study, they had to confirm and tick items on the following inclusion criteria: (a) 18 years or older, (b) informed consent to participate in the study voluntarily, (c) feeling physically and mentally able to participate in this study, and (d) all open questions have been answered satisfactorily by the survey manager before participation. An additional inclusion criterion was that each participant had to live in a city or be there regularly so they could answer all items related to greener cities. Then, they had to complete the attention checks (two codes had to be typed in to sort out any fakers or non-serious respondents) and answer all GCQ items. In addition to a few additional items focusing on cycling and waste management, which are beyond the scope of the present study, in the last part, demographic questions (i.e., gender, age, etc.) had to be answered. At the end, all subjects were thanked for their participation, and contact details of the project leader were provided in case of any questions. On average, the study lasted 22.5 min (SD = 9.5 min). If the subjects were interested in the study’s results, they were invited to provide their email address. However, there was no financial compensation. All data were collected online and anonymously, and the questionnaire was deployed on So Sci Survey, version 3.5.01 [64].
2.4. Statistical Analyses
The significance level was set to = 0.05 (or to the Bonferroni-corrected level, for example, for the correlational findings), and all results with are reported as statistically significant. The detailed results and the respective statistical analyses are described in the results section (cf. Section 3) for both primary analyses, as follows:
(I) Initially, item statistics such as the mean, the standard deviation (the larger the SD, the higher the item differentiation), skewness, and kurtosis (to assess the item distribution; should be within the boundaries of ). Box plots and QQ plots were plotted for all items for the graphical assessment of the item distributions. Then, I applied exploratory factor analysis (i.e., principal axis factor analysis with Promax and further rotation techniques).
Although not presented in this paper, these extracted factor structures were confirmed by the consecutive application of principal component analyses (PCA) and confirmatory factor analyses (CFA; the additional results are provided via the OSF repository; cf. Data Availability Statement).
After I had extracted the factor structure for GCQ with further test statistics (e.g., item commonalities, h2; Kaiser–Meyer–Olkin (KMO); Bartlett’s test), I computed the item discrimination index (DI; part-whole corrected). The DI determines the correlation (and contribution) of the item to the respective factor (items with < 0.3 are critical, and items < 0.1 should be excluded). Finally, I calculated Cronbach’s Alpha to determine the internal consistency of the items (cf. Table 1).
Table 1.
Principal axis factor analysis (Promax rotation) of the Green Cities Questionnaire (GCQ) revealing a three-factor solution: Mental Health (MH), Willingness-to-Pay (WTP), and Green Exercise (GE).
(II) Then, I computed the mean scores and applied Spearman’s nonparametric rank-order correlation coefficient in further statistical analyses to obtain more insights into the newly established factors. Table 2 shows the correlational findings. In supplementary statistical analyses, I performed additional partial correlations with the same variables (cf. Table 2), controlling for the two variables gender and age.
Table 2.
Correlations (nonparametric, Spearman) of the three GCQ mean scores, gender, age, income, annual mileage, commuting by car and by public transport, and cycling per week.
The statistical analyses were performed with jamovi, version 2.6.25.0 [62], and IBM® SPSS® Statistics, version 29.0.1.0 [61].
3. Results
The present study pursued two goals (cf. Section 1.5): First, the development of the new Green Cities Questionnaire (GCQ), with a special focus on mental health, willingness to pay, and green exercise (cf. below). Second, the application of further statistical analyses (e.g., descriptive statistics, statistical prerequisites, and correlational findings; cf. Section 3.2).
3.1. Exploratory Factor Analyses for the Development of the GCQ
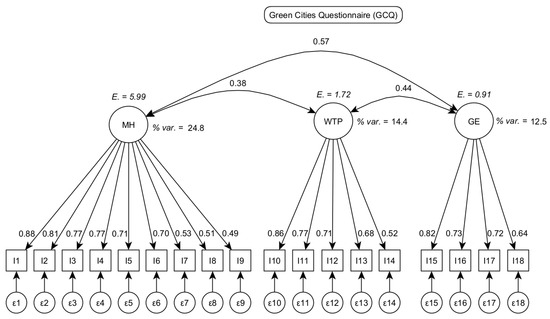
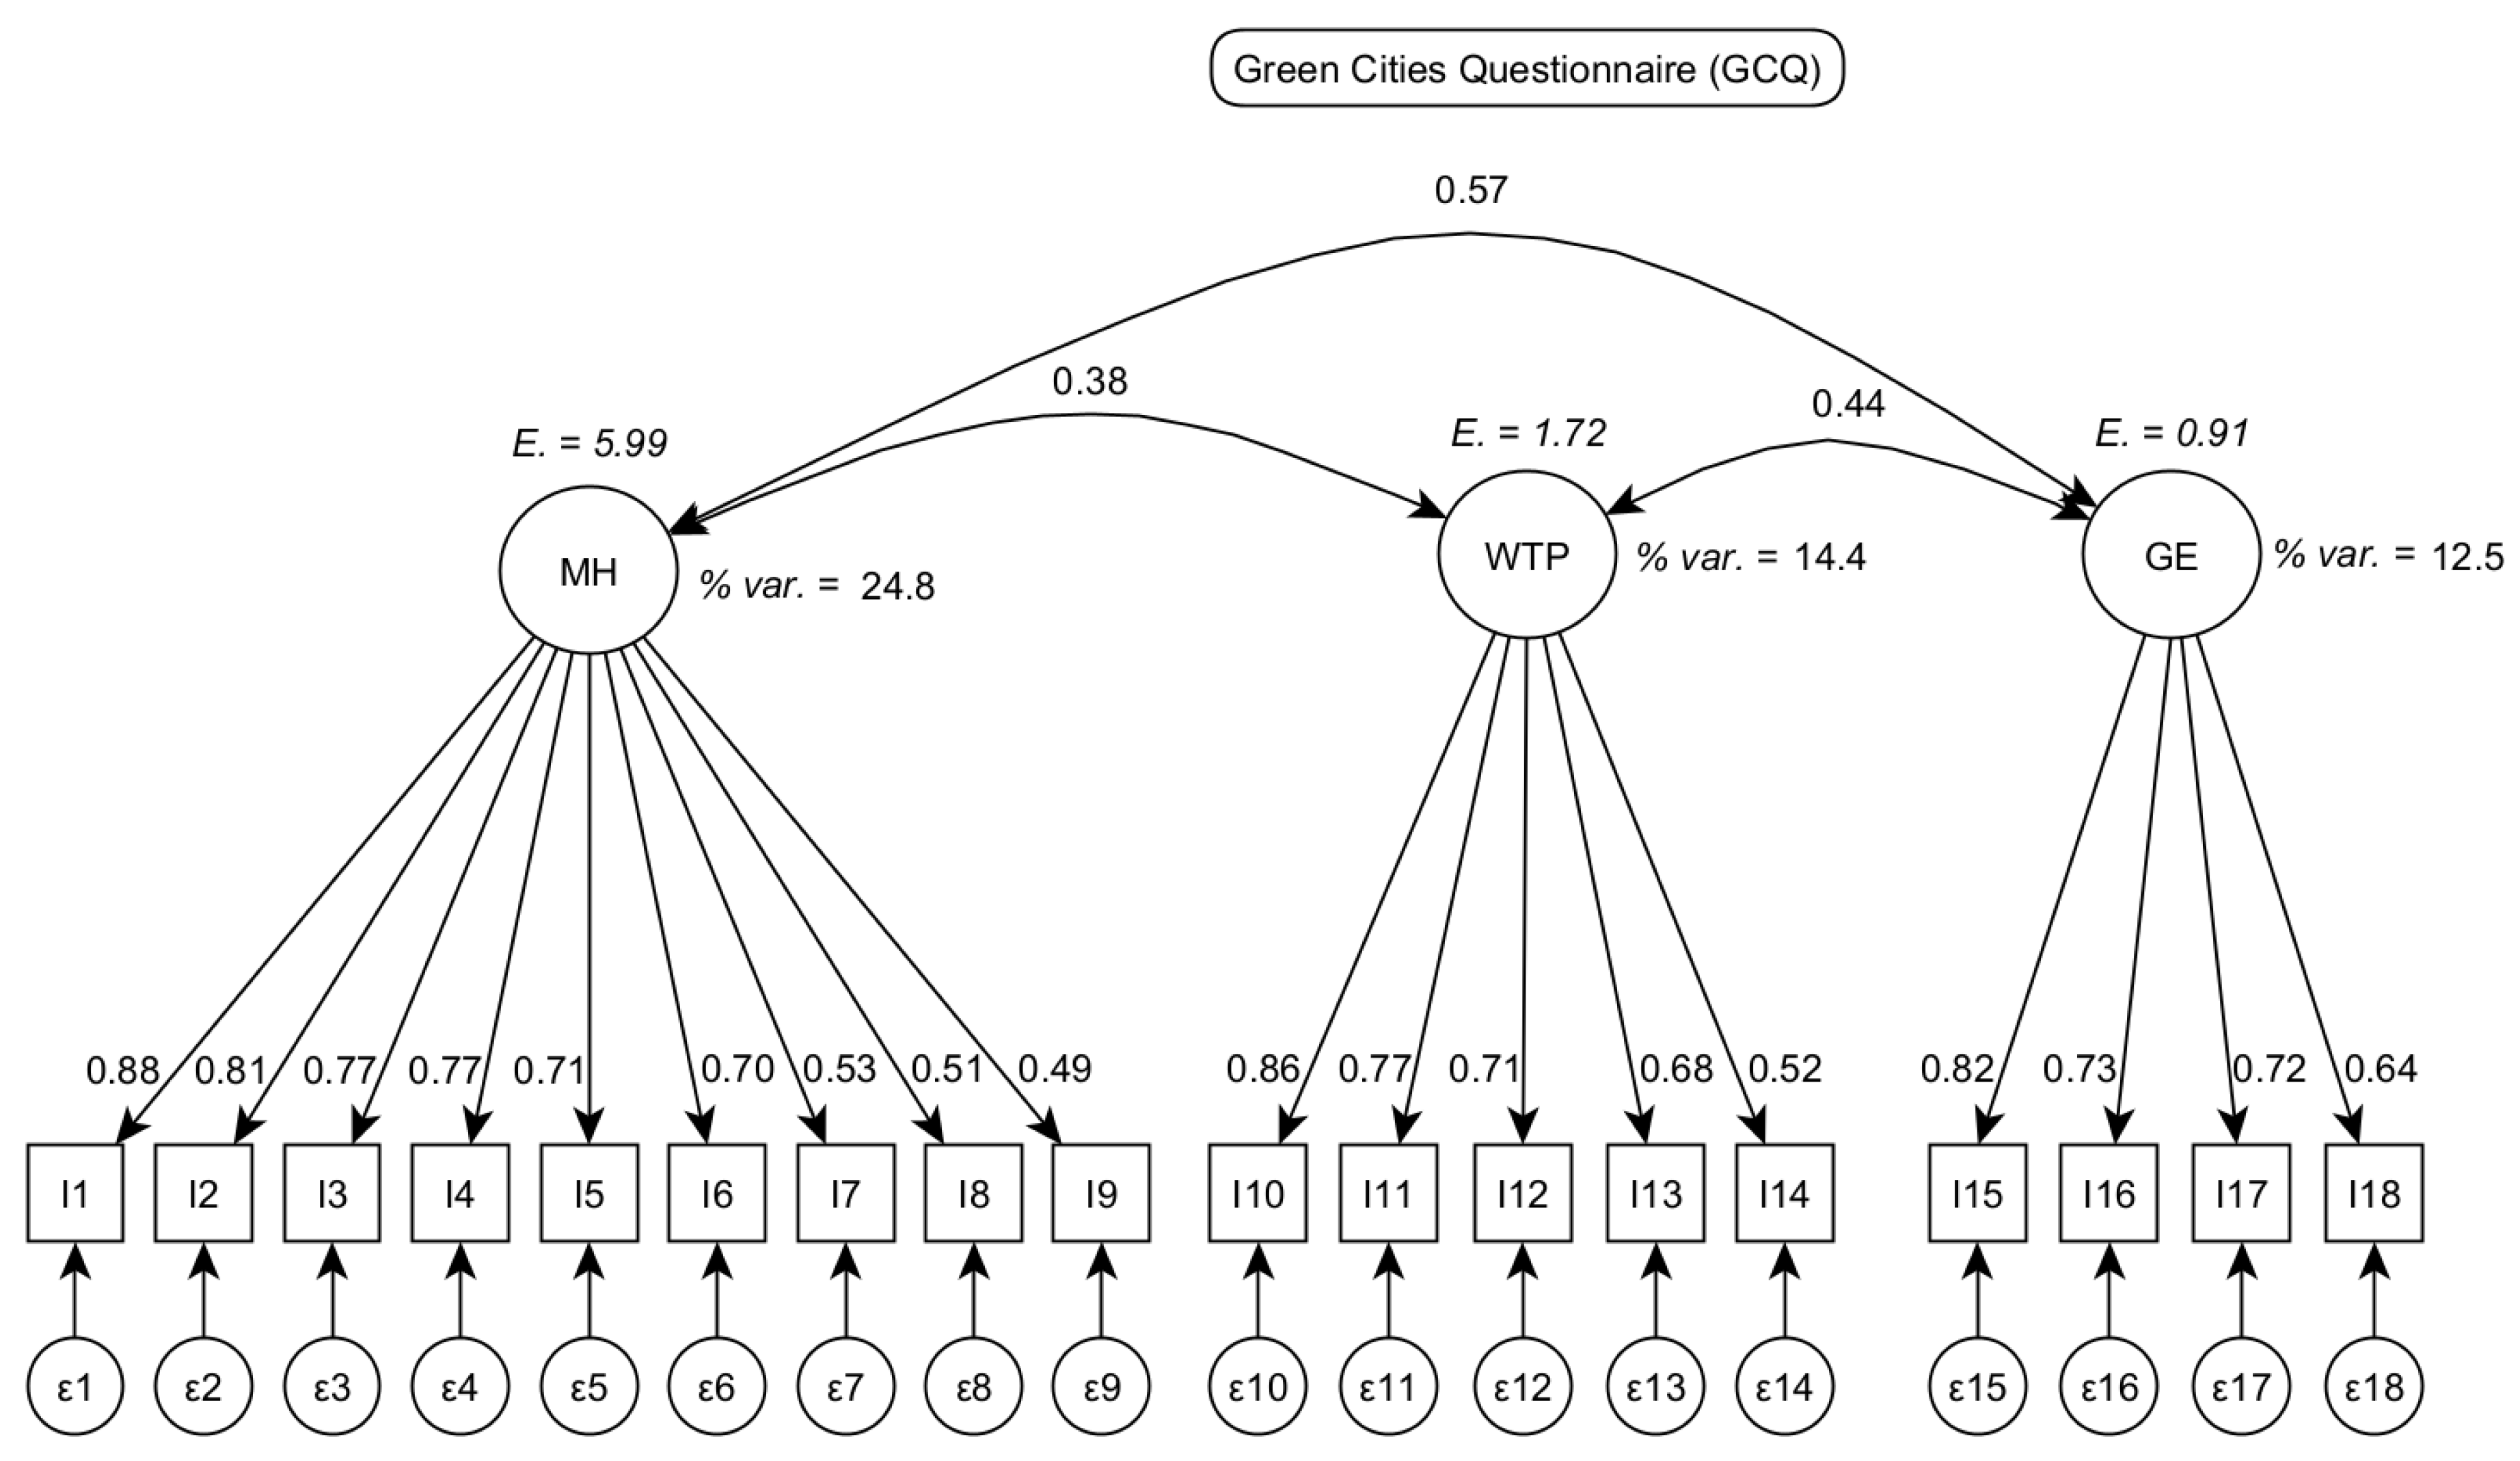
Before the investigation of the latent and underlying factor structure related to the manifest (observed) items, I performed descriptive item analyses and excluded bad items such as those with no suitable item formulation (i.e., two ambiguous aspects queried with one item, resulting in two peaks/a bimodal distribution; no good face validity; misleading formulation), statistical floor/ceiling effects (i.e., mean too low/high), or good item differentiation (i.e., SD too small etc.). Next, I applied exploratory factor analyses (i.e., principal axis factor analyses, Promax rotation technique, confirmed with additional extraction techniques such as Maximum Likelihood/smallest residuals). In several iterative steps, I removed ambiguous items with unclear double- or triple-loadings and/or items whose commonality values were too low. Starting with an initial item set of 43 items, finally, 18 items remained loading clearly on the three factors: Mental Health (MH; 9 items), Willingness-to-Pay (WTP; 5 items), and Green Exercise (GE; 4 items; cf. Table 1 and Figure 1). The Kaiser–Meyer–Olkin (KMO) value was 0.88. Hence, the sample can be classified as meritorious [65]. The Bartlett’s test revealed, = 2144, p < 0.001. Therefore, this prerequisite is also met because these results indicate that the correlations deviate significantly from zero [66]. Figure 1 depicts the three factors’ eigenvalues and explained variance. In total, 51.8% of the variance can be explained by this model. Although it is not ideal and not above 60%, it has to be taken into account that the sample size is not above 500 or more [67] and that the mean of 7 items (from 9) of the mental MH factor was above 80% agreement, yielding several non-normal item statistics. This may also affect the total variance explained. However, those items had clear factor loadings (all substantially higher than 0.3) and reasonably high commonalities. Hence, although the non-normal item statistics may potentially bias the obtained results, they were kept because of the high content-related relevance of the queried impact of urban green spaces on mental health, resulting in numerous unambiguous ratings from the participants.
Figure 1.
The Green Cities Questionnaire (GCQ) with three factors: Mental Health (MH), Willingness-to-Pay (WTP), and Green Exercise (GE). E. = Eigenvalue. % var. = explained variance. = error term/residual of the respective item.
Furthermore, the item commonalities (h2; cf. Table 1) depend on N and the number of items per factor. For about 250 respondents, it should be greater than 0.4 for six items per factor, but not below 0.2 [66,68]. This prerequisite was also met. Additionally, the item discrimination index (DI) (part-whole corrected) should be greater than 0.5 [69]. A DI < 0.3 can be too low if the item variance (SD) is sufficient, and a DI < 0.1 is too small [66]. Moreover, Cronbach’s ranged between 0.81 and 0.89 (cf. Table 1), whereas greater than 0.7 is classified as acceptable and greater than 0.8 as high [70].
3.2. Correlational Findings of the GCQ
I computed the mean score for all three factors (cf. Appendix A.2) and additional descriptive statistics in further statistical analyses. I examined the statistical prerequisites of the three factors and the variables cycling per week and age (cf. Table 3). However, the additional demographic variables such as gender (two factors: female and male), income (non-compulsory variable with several missing data), annual mileage (assessed with categories, e.g., 0 = 0 km; 1 = x < 100 km; 2 = x < 500 km; 3 = x < 1000 km etc.) and commuting by car and by public transport (both also assessed with categories; for more details, see the comprehensive definitions in the data set available on the OSF platform (cf. Data Availability Statement)) are not reported here because the findings are not as informative as the others depicted in Table 3 (all results are shared via the above mentioned OSF repository). Combining all these results, I applied Spearman’s nonparametric rank-order correlation coefficient for the correlational main findings, as shown in Table 2.
Table 3.
Descriptive statistics and statistical prerequisites of the three factor mean scores, MH, WTP, and GE, as well as Age and Cycling per week.
In supplementary statistical analyses, I performed additional partial correlations with the same variables (cf. Table 2), controlling for the two variables gender and age in three different combinations: (1) gender, (2) age, (3) gender and age. The results of those supplementary analyses of (1) to (3) are provided via the OSF repository (cf. Data Availability Statement). However, it has to be mentioned that consistent findings revealed that the positive correlations of the variable cycling per week with WTP (r = 0.28, p < 0.001) and GE (r = 0.26, p < 0.001; cf. Table 2) disappeared in all three combinations indicating no association, respectively. When focusing on those newly extracted factors, MH, WTP, and GE, this was the most significant difference of the three partial correlations when compared to correlations depicted in Table 2.
In contrast to this difference and consistent with the correlational results obtained with no partial correlation (cf. Table 2), across all three applications (i.e., (1) to (3)), none of the three factors MH, WTP, and GE was associated with any of the other demographic variables income, annual mileage, commuting by car and by public transport. Additionally, in each of the three conditions, the same and consistent negative associations between annual mileage (by car) and commuting by public transport, and a positive association between annual mileage and commuting by car were confirmed, as shown in Table 2.
Moreover, the positive correlations between the three factor mean scores, MH, WTP, and GE, were found in the original correlational analysis (cf. Table 2) and, again, in all three combinations of the supplementary partial correlations described above. Detailed results of the supplementary partial correlations are provided on OSF (cf. the OSF repository (Data Availability Statement)).
Furthermore, although age was not associated with any of the three factors, gender was negatively correlated with MH and GE. Here, it has to be noted that the value labels of gender were denoted as follows: female = 1, male = 2, diverse = 3, other = 4. However, none of the respondents stated 3 or 4. Therefore, a negative correlation indicates that women assigned higher values to both factors MH and GE and men reported smaller ones. Interestingly, there was no gender effect or association between gender and WTP. Hence, neither women nor men reported that they would be willing to pay more for greener and more sustainable cities.
Gender and age were also positively associated with annual mileage, indicating that men and older adults drive more kilometres per year than women or younger adults. In contrast, gender and age were both negatively correlated with commuting by public transport, with women and younger adults commuting more by public means of transport than men and older adults. However, age was positively associated with commuting by car, whereas gender was not (cf. the findings in Table 2).
4. Discussion
The present study pursued two primary goals: First, it was designed to develop a new Green Cities questionnaire, namely the GCQ. It was intended to measure the impact of greener cities on mental health, the willingness to pay for greener cities, and the impact of greener cities on physical activity, such as green exercise. Hence, if the items on those three topics reveal stable findings, the GCQ should comprise the three factors: Mental Health (MH), Willingness-to-Pay (WTP), and Green Exercise (GE). Second, the GCQ should provide first correlational insights into any potential associations with the newly extracted factor scores and several demographic as well as additional mobility variables.
4.1. Development of the GCQ
The exploratory factor analyses extracted the three stable factors, such as Mental Health (MH), Willingness-to-Pay (WTP), and Green Exercise (GE). Hence, within the context of green cities, the factor MH encompasses various psychological aspects, including the quality of life, relaxation, self-designed community gardens, the mental well-being of residents, a green work environment (indoor), the beauty of flower beds, and the calming effect of nature.
Furthermore, the factor WTP comprises the willingness to pay for the renovation and greening of public spaces and buildings, for sustainable and environmentally friendly electricity, for higher rent for an apartment in a green area, for additional costs to improve waste management, and for higher taxes for sustainability.
Finally, the factor GE comprises aspects such as access to green spaces and motivation to increase the physical activity level, outdoor exercise in green spaces within the city, park visits, and other green spaces, and the use of green spaces in the city for relaxation in the last two weeks.
The corresponding descriptive statistics based on the drawn sample in Germany clearly indicated the high importance to city residents of the factor MH with a mean of 8.21 (SD = 1.56; cf. Table 3) on a scale range from 0 to 10 (0 = “I fully disagree” to 10 = “I fully agree”), regardless of gender and across the entire sample. Interestingly, the two factors, WTP (M = 4.43; SD = 2.61) and GE (M = 4.84; SD = 2.78), showed substantially lower agreement among residents in cities.
Taken together, those descriptive findings clearly indicate that psychological aspects of MH in green cities are reported by far more crucially by residents than the aspects of WTP or GE. This finding is remarkable because those three factors, MH, WTP, and GE, have not been considered simultaneously in an empirical study to date. Hence, the newly developed GCQ enables the direct assessment and comparison of the three factors (or dimensions). Furthermore, in another study conducted in Germany, it was observed that year-round urban green exercise could be an effective public health intervention to improve well-being [71]. However, it is noteworthy that when MH and GE are measured using the newly developed items of the GCQ (cf. Appendix A.2), assessed with a 0 to 10 slider scale, MH aspects are rated substantially larger than GE and also the WTP aspects (M and SD of MH, WTP, and GE cf. above). Hence, residents seem to consider psychological mental health aspects substantially more important and critical than WTP and GE.
Concerning WTP, these findings are partly in line with another study where it was shown that urban green infrastructure is of great importance for increasing public participation and their willingness to pay [72]. At the same time, they highlighted the need for government decision-makers to prioritise disseminating knowledge about green infrastructure to residents before implementing such projects in communities.
4.2. Correlational Findings of the GCQ
Additionally, further and initial inferential statistical insights of correlational analyses shed more light on some associations between the newly extracted factor scores MH, WTP, and GE, several demographic variables (e.g., gender, age, income), and mobility variables (e.g., annual mileage, commuting by car and public, and cycling per week). In this regard, the following four findings have to be highlighted:
First, from a psychometric perspective, the positive but not too large correlations among the three factor mean scores, MH, WTP, and GE, indicate that they share some common variance while all three factors are also measuring different hidden, underlying, and latent constructs.
Second, the correlational findings, also from the additional partial correlations, portray a consistent picture that there are no substantial associations between the three factors and income, annual mileage, commuting by car, and public transport. Furthermore, the two positive correlations of cycling per week with both WTP and GE disappear in all three partial correlational analyses. This is a remarkable finding because it shows that participants who report cycling more often are also willing to pay more for a more sustainable city and are more interested in green exercise. Thus, both gender and age appear to play a crucial role in this relationship, which requires further investigation and research, which is beyond the scope of the present article because of the focus on the development of the GCQ with initial correlational insights.
Third, gender was negatively correlated with MH and GE, indicating that women assign greater values to mental health and incentives for green exercise items than men. These findings are particularly interesting for incentives for GE, as numerous men participate in outdoor sports. However, it is perhaps more important for women to have access to urban green spaces, as well as to park visits and other activities (e.g., as a meeting place, for exercise, for recreation).
However, there was no association between gender and WTP. This result offers unique evidence that, although neither women nor men stated a willingness to pay for a more sustainable and greener city, both genders consider such cities very important for mental health (cf. descriptive statistics in Table 3).
Fourth, even though all correlations, as well as the three control conditions (of the partial correlations, cf. above), are plausible and make sense content-related, they must be treated cautiously. Not all statistical prerequisites were met, especially not for the additional demographic variables such as commuting by car and cycling per week, but the sample size of remains reasonably stable, and for the primary correlational analyses, nonparametric Spearman correlation coefficients were applied.
4.3. Practical Implications of the GCQ
Despite the development of a new questionnaire for greener cities, the overarching goal was to apply it in future research settings to provide more insights into gender and age differences across these three main factors, as well as into the context of other similar and different questionnaires examining convergent and discriminant validity.
Furthermore and despite the fact that the concept of urban green spaces can be considered as a minor component of the broader concept of green cities, the extracted factors of MH, WTP, and GE and the corresponding items, address both aspects of green cities and, more specifically, those of urban green spaces. Although the concept of green cities is broader and more complex than urban green spaces, it is important to study city residents’ attitudes and preferences toward both. Nevertheless, the factors MH, WTP, and GE enable the measurement of only those three latent dimensions, at least the topics covered by the 18 newly developed items. However, there exists much more within both concepts of green cities and urban green spaces. Hence, from a practical perspective, the GCQ can only study those three latent factors, while even more new psychometric questionnaires focusing on similar and different aspects are needed to better cover the wide range of the broad concept of green cities.
It has been reported that a ‘one size fits all’ approach to green space planning might not meet the general public’s desires at all, while urban green spaces are expected to perform context-dependent multiple roles [73]. The GCQ enables the multidimensional assessment of residents’ local preferences on the three green city dimensions, such as MH, WTP, and GE. Hence, the GCQ sheds more light on the essential but latent factors associated with green cities, as demonstrated by the evidence presented in the present study. In general, it is crucial to query and measure multiple latent dimensions to properly portray and understand citizens’ attitudes, opinions, worries, needs, and thoughts before creating policies to support local residents.
Although it will remain necessary to get in contact with the local residents prior an implementation of a new green city policy or prior to the execution of a new green space project anyway, the additional application of the GCQ may also contribute to gain further knowledge to optimise new educational programs or participatory workshops for greener cities which cover the critical topics which matter to the public such as mental health, willingness to pay, and green exercise. Hence, the GCQ may provide additional data, results, and new evidence that can be used and implemented in recommendations for policymakers.
In the context of implementing a Greenway, the predicted direct health gains were small for any individual but substantial when summed over the entire population of residents who can use and interact with it [74]. This may be similar for new evidence gained with the GCQ. The individual mental health and green exercise benefits might be relatively small, even though new findings in, for example, a specific city district could reveal interesting insights. However, on the level of all residents living there, all those small benefits added up might be substantial. Thus, the consideration of mental health and green exercise when planning and developing greener cities can positively affect the well-being and quality of life of the residents.
4.4. Limitations and Future Work
Although those three factors revealed relatively stable properties and enabled the measurement of mental health, willingness to pay, and green exercise within the context of green cities, they should not be used to infer a causal relationship, as reality is more complex. Similarly, a previous study discussed how the use of urban green spaces is influenced by factors such as accessibility, attractiveness, facilities, quality, and security [75]. However, this assumed a causal relationship, whereas it was discussed that the relationship is multifactorial and that it seems to be more likely that the functionality of green spaces (e.g., for sociocultural activities or exercise) plays an essential role.
From a statistical point of view, the newly developed GCQ model explains 51.8% of the variance. In a meta-analysis incorporating 803 factor analyses it was shown that the average variance was 56.6% [76]. Although the total variance of the GCQ is slightly below this value, it has to be taken into account that the sample size is not above 500 or more [67] and that the mean of 7 items (from 9) of the mental MH factor was above 80% agreement, yielding several non-normal item statistics. This may also affect the total variance explained.
However, the GCQ focuses primarily on specific aspects of green cities, such as urban green spaces and their relation to mental health, willingness-to-pay, and incentives for green exercise, but not on blue spaces. Future developments of a new questionnaire on green cities could also include additional green-city aspects, such as sustainable design, construction, and operations, as well as further economic factors. Furthermore, it would be interesting to shed more light on city residents’ attitudes and opinions towards blue spaces. However, besides several commonalities, it has already been reported that there are essential differences between green and blue spaces [77].
Moreover, in future validation studies with a larger sample size (e.g., more than 500 respondents), it will be essential to administer the GCQ alongside other questionnaires on green cities, ideally in different countries, both with similar and different topics, to establish convergent and discriminant validity, respectively, and to perform cross-validation to further study the factor structure.
Better educational programs, targeted initiatives, and inclusive policies may enhance public support, particularly as green space accessibility and maintenance play an important role in inclusive urban development policies [36]. Hence, the GCQ and additional open questions, as well as interviews, can and should also be applied within the context of inclusive urban development, ideally, before the realisation and implementation of new urban green spaces.
5. Conclusions
The Green Cities Questionnaire (GCQ) is a newly developed questionnaire that facilitates the measurement of three latent and stable factors, such as mental health (MH), willingness-to-pay (WTP), and green exercise (GE), within the context of green cities. This new assessment of MH, WTP, and GE has the potential to shed further light on the hidden yet essential dimensions not only for greener and more sustainable cities, but also for a higher quality of life in green cities. Thus, the collection of new evidence gained with the GCQ can be used by urban planners, public authorities, and policymakers for green initiatives, educational programs, and green city workshops to better understand and learn from the cities’ residents, but also to better educate them about the mental health and quality of life advantages of green exercise. Ultimately, the overarching goal when applying the GCQ is to better meet residents’ needs across city districts, despite varying demographic representations of local citizens and geographical areas. Considering crucial aspects such as mental health, willingness to pay, and green exercise is likely to improve quality of life and residents’ well-being, making cities greener and more attractive.
Highlights
- Newly developed questionnaire: Green Cities Questionnaire (GCQ);
- Three factors: Mental Health (MH), Willingness-to-Pay (WTP), and Green Exercise (GE).
- MH was reported to be substantially more important than WTP and GE.
- Women assigned higher values to the MH and GE factors than men.
- The new evidence gained with the GCQ can be used in green initiatives, educational programs, and green city workshops to promote not only the assessment of physiological and environmental parameters but also of mental health and subjective well-being, thereby making cities more attractive to citizens and improving their quality of life.
Funding
This research received no external funding.
Institutional Review Board Statement
According to the ethical guidelines of the German Research Foundation, no individual approval was required for this study protocol (17 September 2025).
Informed Consent Statement
Informed consent was obtained from all subjects involved in the study.
Data Availability Statement
The data set, supplementary results, and the German questionnaire items of the GCQ are available at the OSF repository: https://osf.io/tzaqe/.
Acknowledgments
I thank 62 psychology bachelor students for collecting the data. Furthermore, I appreciate the support of Amaan Mansour, Simon Winkelmann, and Tim Seyrek in clustering the items before data collection. Finally, I am grateful to Jana Schwarzkopf for her technical assistance in data management.
Conflicts of Interest
The author declares no conflicts of interest.
Appendix A. Green Cities Questionnaire (GCQ)
Appendix A.1. Items: English Version
In the following, the 18 items are listed for the entire GCQ for the three factors: MH (9 items), WTP (5 items), and GE (4 items). The original items in German are provided via the OSF repository (cf. Data Availability Statement).
- Mental Health (MH)
- 1.
- I think that green spaces in urban areas contribute to an increased quality of life.
- 2.
- I find the view of urban green spaces relaxing.
- 3.
- Self-designed community gardens can contribute to higher levels of well-being.
- 4.
- Greater integration of green spaces in urban environments can positively influence the mental well-being of residents.
- 5.
- I feel more able to work when my work environment is green (e.g., indoor plants, indoor wall greening).
- 6.
- Looking out the window at a green space and/or trees relaxes me in my everyday life.
- 7.
- I perceive my city as more beautiful when there are many flower beds.
- 8.
- Green spaces enhance the quality of life in a city.
- 9.
- Spending time in nature has a calming effect on me.
- Willingness-to-Pay (WTP)
- 10.
- I would pay a monthly contribution to the renovation and greening of public spaces and buildings.
- 11.
- I am happy to pay more money for sustainable and environmentally friendly electricity.
- 12.
- I am willing to pay more rent for an apartment in a green environment.
- 13.
- I would accept additional costs if this would improve waste management in my city.
- 14.
- I would be willing to pay higher taxes if the revenue were invested in urban sustainability.
- Green Exercise (GE)
- 15.
- Access to green spaces motivates me to increase my level of physical activity.
- 16.
- I exercise more outdoors because it allows me to use urban green spaces.
- 17.
- I visit parks and other green spaces several times a week (e.g., as a meeting place, to exercise, for recreation).
- 18.
- I have used green spaces in my city for relaxation in the last two weeks.
Appendix A.2. Instructions for Application and Statistical Analyses
When applying the GCQ, a 0 to 10 response format using a visual analogue slider scale (with verbal anchoring of the endpoints: 0 = “I fully disagree”; 10 = “I fully agree”) must be applied. This further facilitates the comparison of the means with the initial sample. All items are positively coded. Hence, the mean scores comprising the items of each factor (cf. Appendix A.1) can be computed directly from the newly collected (raw) data.
References
- Hartig, T.; Mitchell, R.; De Vries, S.; Frumkin, H. Nature and Health. Ann. Rev. Public Health 2014, 35, 207–228. [Google Scholar] [CrossRef] [Scilit]
- Park, B.J.; Tsunetsugu, Y.; Kasetani, T.; Kagawa, T.; Miyazaki, Y. The physiological effects of Shinrin-yoku (taking in the forest atmosphere or forest bathing): Evidence from field experiments in 24 forests across Japan. Environ. Health Prev. Med. 2010, 15, 18–26. [Google Scholar] [CrossRef] [Scilit]
- Li, Q. Effect of forest bathing trips on human immune function. Environ. Health Prev. Med. 2010, 15, 9–17. [Google Scholar] [CrossRef] [Scilit]
- Zhao, Y.; Bao, W.W.; Yang, B.Y.; Liang, J.H.; Gui, Z.H.; Huang, S.; Chen, Y.C.; Dong, G.H.; Chen, Y.J. Association between greenspace and blood pressure: A systematic review and meta-analysis. Sci. Total Environ. 2022, 817, 152513. [Google Scholar] [CrossRef] [Scilit]
- Nazish, A.; Abbas, K.; Sattar, E. Health impact of urban green spaces: A systematic review of heat-related morbidity and mortality. BMJ Open 2024, 14, e081632. [Google Scholar] [CrossRef] [Scilit]
- Bockarjova, M.; Botzen, W.J.W.; Bulkeley, H.A.; Toxopeus, H. Estimating the social value of nature-based solutions in European cities. Sci. Rep. 2022, 12, 19833. [Google Scholar] [CrossRef] [Scilit]
- Anderson, M. Green Cities: How to Make a Sustainable City. 2022. Available online: https://onekeyresources.milwaukeetool.com/en/green-city (accessed on 26 August 2025).
- McDonough School of Business. What Are “Green” Cities? Steers Global Real Assets. 2025. Available online: https://globalrealassets.georgetown.edu/insight/what-are-green-cities/ (accessed on 26 August 2025).
- The United Nations Development Programme (UNDP). Sustainable Development Goals. UNDP. Available online: https://www.undp.org/arab-states/sustainable-development-goals (accessed on 26 August 2025).
- The United Nations Development Programme (UNDP). Goal 11: Sustainable Cities and Communities | Joint SDG Fund. Available online: https://jointsdgfund.org/sustainable-development-goals/goal-11-sustainable-cities-and-communities (accessed on 26 August 2025).
- United Nations. Take Action for the Sustainable Development Goals. United Nations Sustainable Development. Available online: https://www.un.org/sustainabledevelopment/sustainable-development-goals/ (accessed on 26 August 2025).
- United Nations General Assembly. Transforming Our World: The 2030 Agenda for Sustainable Development (A/RES/70/1, 70th Session); Technical Report A/RES/70/1; United Nations: New York, NY, USA, 2015. [Google Scholar]
- Kabisch, N.; Haase, D. Green spaces of European cities revisited for 1990–2006. Landsc. Urban Plan. 2013, 110, 113–122. [Google Scholar] [CrossRef] [Scilit]
- Lee, D.H.; Chamberlain, B.; Park, H.Y. Toward a Construct-Based Definition of Urban Green Space: A Literature Review of the Spatial Dimensions of Measurement, Methods, and Exposure. Land 2025, 14, 517. [Google Scholar] [CrossRef] [Scilit]
- Okkels, N.; Kristiansen, C.B.; Munk-Jørgensen, P.; Sartorius, N. Urban mental health: Challenges and perspectives. Curr. Opin. Psychiatry 2018, 31, 258. [Google Scholar] [CrossRef] [Scilit]
- Hayes, K.; Blashki, G.; Wiseman, J.; Burke, S.; Reifels, L. Climate change and mental health: Risks, impacts and priority actions. Int. J. Ment. Health Syst. 2018, 12, 28. [Google Scholar] [CrossRef] [Scilit]
- Gianfredi, V.; Buffoli, M.; Rebecchi, A.; Croci, R.; Oradini-Alacreu, A.; Stirparo, G.; Marino, A.; Odone, A.; Capolongo, S.; Signorelli, C. Association between Urban Greenspace and Health: A Systematic Review of Literature. Int. J. Environ. Res. Public Health 2021, 18, 5137. [Google Scholar] [CrossRef] [Scilit] [PubMed]
- Roberts, H.; Van Lissa, C.; Hagedoorn, P.; Kellar, I.; Helbich, M. The effect of short-term exposure to the natural environment on depressive mood: A systematic review and meta-analysis. Environ. Res. 2019, 177, 108606. [Google Scholar] [CrossRef] [Scilit]
- Rosa, C.D.; Larson, L.R.; Collado, S.; Profice, C.C. Forest therapy can prevent and treat depression: Evidence from meta-analyses. Urban For. Urban Green. 2021, 57, 126943. [Google Scholar] [CrossRef] [Scilit]
- Gonzalez, M.T.; Hartig, T.; Patil, G.G.; Martinsen, E.W.; Kirkevold, M. Therapeutic horticulture in clinical depression: A prospective study of active components. J. Adv. Nurs. 2010, 66, 2002–2013. [Google Scholar] [CrossRef] [Scilit]
- Pelgrims, I.; Devleesschauwer, B.; Guyot, M.; Keune, H.; Nawrot, T.S.; Remmen, R.; Saenen, N.D.; Trabelsi, S.; Thomas, I.; Aerts, R.; et al. Association between urban environment and mental health in Brussels, Belgium. BMC Public Health 2021, 21, 635. [Google Scholar] [CrossRef] [Scilit]
- Coventry, P.A.; Brown, J.; Pervin, J.; Brabyn, S.; Pateman, R.; Breedvelt, J.; Gilbody, S.; Stancliffe, R.; McEachan, R.; White, P. Nature-based outdoor activities for mental and physical health: Systematic review and meta-analysis. SSM Popul. Health 2021, 16, 100934. [Google Scholar] [CrossRef] [Scilit]
- Gascon, M.; Triguero-Mas, M.; Martínez, D.; Dadvand, P.; Forns, J.; Plasència, A.; Nieuwenhuijsen, M.J. Mental Health Benefits of Long-Term Exposure to Residential Green and Blue Spaces: A Systematic Review. Int. J. Environ. Res. Public Health 2015, 12, 4354–4379. [Google Scholar] [CrossRef] [Scilit]
- White, M.P.; Alcock, I.; Wheeler, B.W.; Depledge, M.H. Would you be happier living in a greener urban area? A fixed-effects analysis of panel data. Psychol. Sci. 2013, 24, 920–928. [Google Scholar] [CrossRef] [Scilit]
- White, M.P.; Pahl, S.; Wheeler, B.W.; Depledge, M.H.; Fleming, L.E. Natural environments and subjective wellbeing: Different types of exposure are associated with different aspects of wellbeing. Health Place 2017, 45, 77–84. [Google Scholar] [CrossRef] [Scilit] [PubMed]
- Kolimenakis, A.; Solomou, A.D.; Proutsos, N.; Avramidou, E.V.; Korakaki, E.; Karetsos, G.; Maroulis, G.; Papagiannis, E.; Tsagkari, K. The Socioeconomic Welfare of Urban Green Areas and Parks; A Literature Review of Available Evidence. Sustainability 2021, 13, 7863. [Google Scholar] [CrossRef] [Scilit]
- Tyrväinen, L.; Ojala, A.; Korpela, K.; Lanki, T.; Tsunetsugu, Y.; Kagawa, T. The influence of urban green environments on stress relief measures: A field experiment. J. Environ. Psychol. 2014, 38, 1–9. [Google Scholar] [CrossRef] [Scilit]
- Teotónio, I.; Oliveira Cruz, C.; Matos Silva, C.; Morais, J. Investing in Sustainable Built Environments: The Willingness to Pay for Green Roofs and Green Walls. Sustainability 2020, 12, 3210. [Google Scholar] [CrossRef] [Scilit]
- Fruth, E.; Kvistad, M.; Marshall, J.; Pfeifer, L.; Rau, L.; Sagebiel, J.; Soto, D.; Tarpey, J.; Weir, J.; Winiarski, B. Economic valuation of street-level urban greening: A case study from an evolving mixed-use area in Berlin. Land Use Policy 2019, 89, 104237. [Google Scholar] [CrossRef] [Scilit]
- Xu, F.; Wang, Y.; Xiang, N.; Tian, J.; Chen, L. Uncovering the willingness-to-pay for urban green space conservation: A survey of the capital area in China. Resour. Conserv. Recycl. 2020, 162, 105053. [Google Scholar] [CrossRef] [Scilit]
- Lu, C.; Tanaka, K.; Shen, Q. Residents’ Preferences on Green Infrastructure in Wuhan, China. Sustainability 2024, 16, 10303. [Google Scholar] [CrossRef] [Scilit]
- Kalfas, D.; Chatzitheodoridis, F.; Loizou, E.; Melfou, K. Willingness to Pay for Urban and Suburban Green. Sustainability 2022, 14, 2332. [Google Scholar] [CrossRef] [Scilit]
- Schneider, A.E.; Neuhuber, T.; Zawadzki, W. Understanding citizens’ willingness to contribute to urban greening programs. Urban For. Urban Green. 2024, 95, 128293. [Google Scholar] [CrossRef] [Scilit]
- Zhao, M.; Zhang, X.; Wang, C.; Zhao, Y.; Wu, G. Research on Residents’ Willingness to Pay for Promoting the Green Development of Resource-Based Cities: A Case Study in Chifeng. Sustainability 2021, 13, 2833. [Google Scholar] [CrossRef] [Scilit]
- Chui, T.F.M.; Ngai, W.Y. Willingness to pay for sustainable drainage systems in a highly urbanised city: A contingent valuation study in Hong Kong. Water Environ. J. 2016, 30, 62–69. [Google Scholar] [CrossRef] [Scilit]
- Bressane, A.; Galvão, A.L.D.S.; Loureiro, A.I.S.; Ferreira, M.E.G.; Monstans, M.C.; Medeiros, L.C.D.C. Valuing urban green spaces for enhanced public health and sustainability: A study on public willingness-to-pay in an emerging economy. Urban For. Urban Green. 2024, 98, 128386. [Google Scholar] [CrossRef] [Scilit]
- Tyrväinen, L. Economic valuation of urban forest benefits in Finland. J. Environ. Manag. 2001, 62, 75–92. [Google Scholar] [CrossRef] [Scilit]
- Penedo, F.J.; Dahn, J.R. Exercise and well-being: A review of mental and physical health benefits associated with physical activity. Curr. Opin. Psychiatry 2005, 18, 189. [Google Scholar] [CrossRef] [Scilit]
- Petersen, E.; Schoen, G.; Liedtke, G.; Zech, A. Relevance of urban green space for physical activity and health-related quality of life in older adults. Qual. Ageing Older Adults 2018, 19, 158–166. [Google Scholar] [CrossRef] [Scilit]
- Wang, X.; Zhou, Q.; Zhang, M.; Zhang, Q. Exercise in the Park or Gym? The Physiological and Mental Responses of Obese People Walking in Different Settings at Different Speeds: A Parallel Group Randomized Trial. Front. Psychol. 2021, 12, 728826. [Google Scholar] [CrossRef] [Scilit]
- Pretty, J.; Peacock, J.; Sellens, M.; Griffin, M. The mental and physical health outcomes of green exercise. Int. J. Environ. Health Res. 2005, 15, 319–337. [Google Scholar] [CrossRef] [Scilit]
- Pretty, J.; Peacock, J.; Hine, R.; Sellens, M.; South, N.; Griffin, M. Green exercise in the UK countryside: Effects on health and psychological well-being, and implications for policy and planning. J. Environ. Plan. Manag. 2007, 50, 211–231. [Google Scholar] [CrossRef] [Scilit]
- Johansson, M.; Hartig, T.; Staats, H. Psychological Benefits of Walking: Moderation by Company and Outdoor Environment. Appl. Psychol. Health Well-Being 2011, 3, 261–280. [Google Scholar] [CrossRef] [Scilit]
- Bressane, A.; Ferreira, M.E.G.; Garcia, A.J.d.S.; Medeiros, L.C.d.C. Is Having Urban Green Space in the Neighborhood Enough to Make a Difference? Insights for Healthier City Design. Int. J. Environ. Res. Public Health 2024, 21, 937. [Google Scholar] [CrossRef] [Scilit]
- Rogerson, M.; Brown, D.K.; Sandercock, G.; Wooller, J.J.; Barton, J. A comparison of four typical green exercise environments and prediction of psychological health outcomes. Perspect. Public Health 2016, 136, 171–180. [Google Scholar] [CrossRef] [Scilit] [PubMed]
- Weigl, K.; Becker, S.; Bosch, K.; Thai, N.; Riener, A. Impact of Auditory Listening on Emotional States in Self-paced Outdoor Running. In Proceedings of the 8th International Conference on Sport Sciences Research and Technology Support, Budapest, Hungary, 5–7 November 2020; pp. 189–196. [Google Scholar] [CrossRef] [Scilit]
- Weigl, K. Der Einfluss der Naturwahrnehmung auf Emotionen bei Läuferinnen und Läufern [The Influence of Listening to Nature’s Sounds on Emotions of Female and Male Runners]. Psychol. Osterreich 2021, 41, 42–51. [Google Scholar]
- Nwana, N.; Javed, Z.; Jones, S.L.; Lee, C.; Maddock, J.E.; Al-Kindi, S.; Nasir, K. Green Streets, Healthy Hearts: Exploring the Roles of Urban Nature and Walkability in Cardiovascular Health. Methodist DeBakey Cardiovascular J. 2024, 20, 37–46. [Google Scholar] [CrossRef] [Scilit]
- Tegart, A.D.; Schuurman, N.; Harden, S.R. Runnability: A Scoping Review. Int. J. Environ. Res. Public Health 2025, 22, 71. [Google Scholar] [CrossRef] [Scilit]
- Li, H.; Zhang, X.; Bi, S.; Cao, Y.; Zhang, G. Psychological benefits of green exercise in wild or urban greenspaces: A meta-analysis of controlled trials. Urban For. Urban Green. 2022, 68, 127458. [Google Scholar] [CrossRef] [Scilit]
- Schipperijn, J.; Cerin, E.; Adams, M.A.; Reis, R.; Smith, G.; Cain, K.; Christiansen, L.B.; Dyck, D.V.; Gidlow, C.; Frank, L.D.; et al. Access to parks and physical activity: An eight country comparison. Urban For. Urban Green. 2017, 27, 253–263. [Google Scholar] [CrossRef] [Scilit] [PubMed]
- Kaczynski, A.T.; Henderson, K.A. Environmental correlates of physical activity: A review of evidence about parks and recreation. Leis. Sci. 2007, 29, 315–354. [Google Scholar] [CrossRef] [Scilit]
- Sugiyama, T.; Francis, J.; Middleton, N.J.; Owen, N.; Giles-Corti, B. Associations Between Recreational Walking and Attractiveness, Size, and Proximity of Neighborhood Open Spaces. Am. J. Public Health 2010, 100, 1752–1757. [Google Scholar] [CrossRef] [Scilit]
- Bertram, C.; Meyerhoff, J.; Rehdanz, K.; Wüstemann, H. Differences in the recreational value of urban parks between weekdays and weekends: A discrete choice analysis. Landsc. Urban Plan. 2017, 159, 5–14. [Google Scholar] [CrossRef] [Scilit]
- Picavet, H.S.J.; Milder, I.; Kruize, H.; De Vries, S.; Hermans, T.; Wendel-Vos, W. Greener living environment healthier people? Prev. Med. 2016, 89, 7–14. [Google Scholar] [CrossRef] [Scilit]
- Coombes, E.; Jones, A.P.; Hillsdon, M. The relationship of physical activity and overweight to objectively measured green space accessibility and use. Soc. Sci. Med. 2010, 70, 816–822. [Google Scholar] [CrossRef] [Scilit]
- Zhang, S.; Zhou, W. Recreational visits to urban parks and factors affecting park visits: Evidence from geotagged social media data. Landsc. Urban Plan. 2018, 180, 27–35. [Google Scholar] [CrossRef] [Scilit]
- Persson, R.; Möller, J.; Engström, K.; Sundström, M.L.O.; Nooijen, C.F. Is moving to a greener or less green area followed by changes in physical activity? Health Place 2019, 57, 165–170. [Google Scholar] [CrossRef] [Scilit]
- Balram, S.; Dragićević, S. Attitudes toward urban green spaces: Integrating questionnaire survey and collaborative GIS techniques to improve attitude measurements. Landsc. Urban Plan. 2005, 71, 147–162. [Google Scholar] [CrossRef]
- Weigl, K.; Forstner, T. Design of Paper-Based Visual Analogue Scale Items. Educ. Psychol. Meas. 2021, 81, 595–611. [Google Scholar] [CrossRef] [Scilit] [PubMed]
- IBM Corp. IBM SPSS Statistics for Windows, Version 29.0.1.0; IBM Corp.: Armonk, NY, USA, 2023. [Google Scholar]
- The Jamovi Project. Jamovi (Version 2.6.25) [Computer Software]. 2025. Available online: https://www.jamovi.org (accessed on 26 August 2025).
- World Medical Association. World Medical Association Declaration of Helsinki: Ethical principles for medical research involving human subjects. JAMA 2013, 310, 2191–2194. [Google Scholar] [CrossRef] [Scilit]
- Leiner, D.J. SoSci Survey (Version 3.5.01) [Computer Software]. 2024. Available online: https://www.soscisurvey.de (accessed on 26 August 2025).
- Kaiser, H.F. An index of factorial simplicity. Psychometrika 1974, 39, 31–36. [Google Scholar] [CrossRef] [Scilit]
- Bühner, M. Einführung in die Test-und Fragebogenkonstruktion; Pearson Deutschland GmbH: Munich, Germany, 2011. [Google Scholar]
- Boateng, G.O.; Neilands, T.B.; Frongillo, E.A.; Melgar-Quiñonez, H.R.; Young, S.L. Best Practices for Developing and Validating Scales for Health, Social, and Behavioral Researchs: A Primer. Front. Public Health 2018, 6, 149. [Google Scholar] [CrossRef] [Scilit] [PubMed]
- Schwab, J. Data Analysis & Computers II—Factor Analysis [Handout]; The University of Texas: Austin, TX, USA, 2012. [Google Scholar]
- Weise, G. Psychologische Leistungstests; Hogrefe, Verlag für Psychologie: Göttingen, Germany, 1975. [Google Scholar]
- George, D.; Mallery, P. IBM SPSS Statistics 29 Step by Step: A Simple Guide and Reference, 18th ed.; Routledge: New York, NY, USA, 2024. [Google Scholar]
- Reuß, K.; Huth, C. Redefining Urban Recreation: A Demand Analysis for Urban Year-Round Green Exercise. Int. J. Environ. Res. Public Health 2024, 21, 1483. [Google Scholar] [CrossRef] [Scilit]
- Wu, X.; Zhang, J.; Han, Y.; Zhou, N.; Qiao, X.J.; Han, C. Exploring Public Preference and Willingness to Pay for the Ecosystem Benefits of Urban Green Infrastructure: Evidence from a Discrete Choice Experiment of Pilot Sponge Cities in China. Water 2023, 15, 2767. [Google Scholar] [CrossRef] [Scilit]
- Madureira, H.; Nunes, F.; Oliveira, J.V.; Madureira, T. Preferences for Urban Green Space Characteristics: A Comparative Study in Three Portuguese Cities. Environments 2018, 5, 23. [Google Scholar] [CrossRef] [Scilit]
- Dallat, M.A.T.; Soerjomataram, I.; Hunter, R.F.; Tully, M.A.; Cairns, K.J.; Kee, F. Urban greenways have the potential to increase physical activity levels cost-effectively. Eur. J. Public Health 2014, 24, 190–195. [Google Scholar] [CrossRef] [Scilit]
- Lee, A.C.K.; Jordan, H.C.; Horsley, J. Value of urban green spaces in promoting healthy living and wellbeing: Prospects for planning. Risk Manag. Healthc. Policy 2015, 8, 131–137. [Google Scholar] [CrossRef] [Scilit]
- Peterson, R.A. A meta-analysis of variance accounted for and factor loadings in exploratory factor analysis. Mark. Lett. 2000, 11, 261–275. [Google Scholar] [CrossRef] [Scilit]
- White, M.P.; Elliott, L.R.; Gascon, M.; Roberts, B.; Fleming, L.E. Blue space, health and well-being: A narrative overview and synthesis of potential benefits. Environ. Res. 2020, 191, 110169. [Google Scholar] [CrossRef] [Scilit]

Disclaimer/Publisher’s Note: The statements, opinions and data contained in all publications are solely those of the individual author(s) and contributor(s) and not of MDPI and/or the editor(s). MDPI and/or the editor(s) disclaim responsibility for any injury to people or property resulting from any ideas, methods, instructions or products referred to in the content. |
© 2026 by the author. Licensee MDPI, Basel, Switzerland. This article is an open access article distributed under the terms and conditions of the Creative Commons Attribution (CC BY) license.