Article

Cultural–Tourism Integration and People’s Livelihood and Well-Being in China’s Yellow River Basin: Dynamic Panel Evidence and Spatial Spillovers (2011–2023)


1
College of Literature and History (College of Culture and Tourism), Weifang University, Weifang 261061, China
2
Department of Business Administration, Kyonggi University, Suwon 16227, Republic of Korea
*
Author to whom correspondence should be addressed.
Sustainability 2026, 18(2), 1006; https://doi.org/10.3390/su18021006
Submission received: 21 December 2025 / Revised: 10 January 2026 / Accepted: 16 January 2026 / Published: 19 January 2026

Abstract

Despite its rich cultural heritage, the Yellow River Basin (YRB) faces challenges of ecological fragility and unbalanced development that constrain residents’ welfare improvement. Cultural–tourism integration (CTI)—aimed at creating employment, optimizing industrial structure, and improving public services—is increasingly promoted as a pathway to enhance people’s livelihood and well-being (PLW). Grounded in industrial integration theory and welfare economics, this study examined the impact effects, transmission mechanisms, and spatial spillovers of CTI on PLW. Panel data from 75 prefecture-level cities in the YRB, spanning 2011 to 2023, were utilized, and multi-dimensional indices were constructed for both CTI and PLW. Impact effects, mediating mechanisms, and spatial spillovers were examined through kernel density estimation, a dynamic system generalized-method-of-moments (SYS-GMM) model, mediation analysis, and a spatial Durbin model (SDM). The results showed that CTI and PLW both improved over time and displayed a spatial pattern of “midstream and downstream leading, upstream lagging”. CTI significantly promoted PLW, after controlling for dynamics and endogeneity (SYS-GMM coefficient = 0.130, p < 0.01). Industrial structure upgrading acted as a positive mediator, whereas digital infrastructure exhibited a short-term suppressing (negative mediating) effect, implying a phased mismatch between CTI investment priorities and digital input. Spatial estimates further indicated that CTI generated positive spillovers, improving PLW in neighboring cities, in addition to local gains. These findings suggest that basin-wide coordination and better alignment between CTI projects and digital infrastructure are essential for inclusive and sustainable well-being improvements, supporting regional progress toward the Sustainable Development Goals.

1. Introduction

In this, the third decade of the 21st century, the global sustainable development agenda and national strategies for coordinated regional development intertwine deeply, jointly anchoring the core essence of the people-centered development philosophy. This trend not only aligns with the core aspirations of the UN 2030 Agenda for Sustainable Development—eradicating poverty, promoting equality, and safeguarding people’s livelihoods—but also coincides to a high degree with China’s development goal of common prosperity [1]. As a fundamental yardstick for measuring social progress and development quality, the connotation of people’s livelihood and well-being (PLW) has expanded from a single focus on material wealth growth to a multi-dimensional and high-level comprehensive concept covering economic, social, cultural, and ecological dimensions, reflecting people’s comprehensive aspiration for a better life [2]. Against this backdrop, China has promoted the implementation of major regional strategies with unprecedented resolve. Among them, the national strategy for ecological protection and high-quality development of the Yellow River Basin (YRB), established in 2019, is not only an ecological governance project targeting a specific geographical unit but also a systematic and long-term development blueprint for reshaping the regional economic and social structure and enhancing PLW in the basin. This strategy explicitly proposes to “jointly strengthen comprehensive protection and coordinate the advancement of integrated governance” and emphasizes “protecting, inheriting, and promoting the Yellow River culture” to drive the development of cultural and tourism integration (CTI). The strategy positions the YRB as a key national ecological security barrier, a pilot zone for high-quality development, and a vital carrier for preserving and promoting Chinese culture, with the overarching goal of enabling basin residents to live more prosperous lives with an enhanced sense of fulfillment, happiness, and security [3]. This provides a field with both typicality and uniqueness as a “quasi-natural experiment” for exploring the transformation mechanism of specific development models into PLW. Hailed as the cradle of the Chinese nation and its civilization, the YRB embodies profound historical-cultural legacies and rich natural-ecological assets. However, for a long time, the basin has faced severe challenges such as ecological fragility, water scarcity, and unbalanced development—particularly in its upper and middle reaches, where the problems of lagging economic development and arduous tasks in improving PLW are especially prominent. The question of how to transform the unique CTI resources of the YRB into practical driving forces for economic and social transformation and the improvement of PLW has become, in this era, an urgent proposition to address. CTI is regarded as a core path for activating regional endogenous dynamics and realizing the transformations, as “lucid waters and lush mountains are invaluable assets”. Through creativity empowerment, technology-driven development, and market integration, CTI can not only foster new economic growth points but also generate positive impacts on cultural inheritance, ecological protection, employment security, and improvement of public services, which are highly aligned with the multi-dimensional demands of PLW. Therefore, systematically evaluating the level of CTI in the YRB, quantitatively revealing its impact effects, transmission mechanisms, and spatial spillover characteristics relative to PLW not only is a positive response to the national strategy of the YRB but also provides a Chinese experience of inclusive and sustainable development which can serve as a reference for similar basins and underdeveloped regions worldwide.
CTI does not merely represent the superficial overlay of cultural sectors and tourism industries, but rather embodies a more in-depth mutual penetration, cross-fertilization, and restructuring of related industrial chains. Its core lies in forming a new synergistic development model of “shaping tourism with culture and highlighting culture through tourism” through industrial chain extension, value chain upgrading, and innovation chain construction [4,5,6]. The theoretical foundation of this concept stems from the industrial integration theory, which holds that technological progress and the evolution of market demand will break the boundaries of traditional industries and give birth to new industrial forms. In the field of CTI, this means that cultural resources are transformed from static objects of appreciation into a core content for tourism experiences, while tourism activities become an important carrier for cultural dissemination and value realization. Academic research on CTI has evolved from superficial product forms to deep-seated industrial logic. In recent years, with the advancement of national strategies such as high-quality development and common prosperity, topics relating to its social benefits and regional effects have become research hotspots. Xiao and Shi clearly pointed out that the ultimate goal of CTI is to meet people’s demand for a better life, and its essence lies in “increasing social well-being” [7].
PLW is an inclusive concept rooted in the Chinese context. While sharing conceptual affinities with “well-being,” “quality of life,” and “happiness” in international academic discussions, PLW carries distinctive emphases shaped by China’s governance tradition. Originating from Sun Yat-sen’s “Principle of Minsheng”, PLW places greater weight on the government’s responsibility to ensure basic livelihood security—including employment, income, housing, and social services—and promote equity across regions and urban–rural divides [8,9,10]. Unlike the predominantly individualistic orientation of subjective well-being described in the Western literature, PLW embeds a stronger collective and policy-oriented dimension. Its theoretical origin can be traced back to Aristotle’s “eudaimonia”, which emphasizes that a good life consists not only of sensory pleasure but also of the realization of potential and the pursuit of values—an idea that transcends the traditional GDP-oriented growth paradigm [8]. In terms of connotation, PLW encompasses both the satisfaction of residents’ objective needs for survival and development (e.g., income, employment, and public services) and subjective perceptions (e.g., life satisfaction, cultural identity) [11,12,13]. With the interdisciplinary expansion of research, the concept of PLW has gradually been integrated into the field of tourism research, giving rise to the concept of “Tourism for Livelihood” [14]. Relevant studies have focused on rural tourism and livelihood improvement, the livelihood functions of tourism, and paths to well-being enhancement, with some scholars beginning to explore the coordinated relationship and interactive responses between tourism development and PLW [15,16,17,18]. Notably, common prosperity, as the core goal of Chinese modernization, provides an important perspective for evaluating the comprehensive benefits of CTI. Numerous studies have confirmed that CTI is a key driver of the achievement of common prosperity [19], and the indicator system of common prosperity (e.g., income level, consumption capacity, and public services) is highly aligned with the focus of PLW—further verifying the inherent correlation between the two [20].
Building upon the foregoing theoretical foundations of CTI and PLW, this study proposes an integrated analytical framework linking the two constructs through a multi-pathway transmission mechanism. Drawing on industrial integration theory [4,5,6] and welfare economics, we posit that CTI affects PLW through three primary channels: (1) the economic channel—creating employment and increasing income through industrial agglomeration and value chain extension; (2) the structural channel—driving industrial structure optimization that improves factor allocation efficiency and promotes high-quality economic development; and (3) the infrastructure channel—stimulating investment in physical and digital infrastructure that generates spillover benefits for local residents. Furthermore, informed by new economic geography theory, CTI development in core cities is expected to produce spatial spillovers that influence PLW in neighboring regions through tourist flows, capital mobility, and knowledge diffusion. This “CTI → transmission pathways → PLW” causal logic provides the analytical foundation for the subsequent empirical investigation.
The positive impacts of CTI on PLW have gradually attracted scholars’ attention, with relevant research outcomes focusing on three main dimensions. In the dimension of economic well-being, CTI serves as a direct driver of livelihood improvement by boosting employment and increasing income. Peng et al., based on provincial panel data, demonstrated that CTI can promote common prosperity by raising urban and rural income levels and advancing the equalization of public services, with heterogeneous effects across regions [19]; Ma, from the perspective of industrial agglomeration, confirmed that CTI can drive the development of related industries, expand investment scales, and indirectly enhance regional development levels and residents’ income [21]; in rural and ethnic areas, CTI expands income channels for residents through the development of diversified formats such as characteristic homestays and cultural and creative products, serving as an important support for rural revitalization [22,23,24]. In the dimension of social and cultural well-being, the positive impacts of CTI are reflected in the cultivation of cultural identity and the improvement of quality of life. Guo and Ye found that residents’ positive perceptions of tourism development (e.g., economic benefits, cultural exchanges) are significantly positively correlated with their perceptions of quality of life [25,26]; meanwhile, the “spillover effects” generated by the construction of tourism infrastructure (e.g., transportation, communication, and medical facilities) serve both tourists and local residents, acting as an indirect path to PLW enhancement [27]. In the dimension of theoretical and methodological innovation, scholars have constructed diverse analytical frameworks and technical approaches. Ma, based on the theory of new endogenous development, analyzed the PLW empowerment mechanism of CTI in ethnic areas following the logic of “factor synergy–system restructuring–function upgrading” [24]; Wang, Liu, and Li, among others, employed methods such as spatial econometric models, coupling coordination models, and kernel density estimation (KDE) to explore the spatiotemporal-evolution-related characteristics, influencing factors, and adaptive relationships between CTI and PLW in regions including the Yangtze River Economic Belt, the Eight Great Ancient Capitals, and coastal urban agglomerations [28,29,30,31].
Despite the abundant achievements of existing research, from the perspectives of economic geography and basin governance, there remain significant research gaps that restrict the depth and applicability of conclusions. First, in terms of research scale, most existing studies focus on provincial administrative units, urban agglomerations (e.g., the Yangtze River Delta, the coastal areas of Guangdong–Fujian–Zhejiang), or individual cities (e.g., Zhangjiajie) [28,30,32], ignoring the uniqueness of river basins as “ecological–economic–social complex systems”. The YRB has the dual attributes of containing an important ecological security barrier and an economic development belt and faces the dual constraints of ecological protection and high-quality development. The interaction law for CTI and PLW in the YRB is distinctive, yet systematic exploration of this region is lacking in the existing research. Second, in terms of spatial effects, although some studies have introduced a spatial perspective [28], they have not fully covered the unique spatial spillover paths of CTI, making it difficult to reveal the cross-regional interaction mechanism of CTI dividends under the core–periphery structure. Third, in terms of heterogeneity and mechanism exploration, existing heterogeneity analyses mostly focus on differences between the eastern, central, and western regions or between ethnic and non-ethnic areas [19], failing to specifically analyze the significant differentiations in resource endowments and development stages among the upper, middle, and lower reaches of the YRB; meanwhile, mechanism studies mostly focus on single paths such as income growth and public service improvement [19], and do not pay full attention to the heterogeneous characteristics of the mediating variables that may present short-term negative constraints and long-term positive gains, resulting in the inability to fully clarify the complex transmission logic of CTI empowering PLW. Against this backdrop, this study addresses the following research questions: (1) What are the spatiotemporal-evolution-related characteristics of CTI and PLW in the YRB? (2) Does CTI significantly promote PLW, after controlling for endogeneity and dynamic dependence? (3) Through which mechanisms—specifically referencing those relating to industrial structure optimization and digital infrastructure—does CTI transmit its effects to PLW? (4) Does CTI generate spatial spillover effects that benefit neighboring cities’ PLW? (5) How do these effects vary across the upper, middle, and lower reaches of the basin and across different PLW levels? In conclusion, this paper selects 75 prefecture-level administrative units (including prefectures and leagues) across the YRB, spanning the period 2011–2023, as its research subjects, systematically constructs a comprehensive evaluation index system of CTI from the three dimensions of “resource–support–benefit” and PLW from the five dimensions of “economy–society–health–culture–education–ecology”, and uses methods such as KDE, dynamic system generalized-method-of-moments (SYS-GMM) estimation, mediating-effect model, and the spatial Durbin model (SDM) to comprehensively analyze the spatiotemporal-evolution-related characteristics, impact effects, transmission mechanisms, and spatial spillover laws of the two. From the perspective of practical experience transplantation, the development model of CTI empowering PLW formed in the YRB can provide a directly referenceable implementation blueprint for regions with similar development demands through localized adjustment of index systems and dynamic optimization of mechanism paths, based on the regions’ ecological endowments, resource types, and development stages. From the perspective of policy empowerment, the empirical findings of this paper as to the spatial spillover laws of CTI and the heterogeneous characteristics of the upper, middle, and lower reaches can provide solid quantitative support for the construction of cross-regional CTI collaboration mechanisms, the formulation of ecological compensation standards, and targeted policy-making for livelihood improvement. They help other regions to effectively solve the problem of the regional well-being imbalance and continuously improve residents’ quality of life while adhering to the bottom line of ecological protection and promoting high-quality economic development, ultimately realizing the localized adaptation and efficient transformation of the United Nations Sustainable Development Goals (SDGs) in regional governance.

2. Theoretical Analysis and Research Hypotheses

2.1. Direct Impact of CTI on PLW

From the perspective of economic foundations, CTI uses cultural resources as its core to activate diverse formats, spawns new growth drivers such as the homestay economy, cultural and creative industries, and study tourism, and directly creates a large number of employment opportunities to broaden the income-increasing channels for urban and rural residents [19,22]. The industrial agglomeration effect further drives the coordinated development of related industries such as catering, accommodation, and transportation, forming a “tourism +” industrial cluster. Income inclusiveness is achieved through industrial chain extension, which, in particular, provides non-agricultural employment opportunities for rural and underdeveloped areas, effectively narrowing the development gaps between regions and between urban and rural areas. In terms of social services, the rigid demands of the cultural and tourism industry for infrastructure force the upgrading of transportation networks, communication facilities, and public-service-supporting facilities. The improvement of these facilities not only serves tourists but also benefits local residents, significantly enhancing the convenience of everyday life and accessibility of public services [27,33]. The establishment of cross-regional collaboration mechanisms further promotes the cross-regional flow and sharing of public service resources, effectively addressing the imbalances in urban–rural and regional services. From the cultural and spiritual perspectives, CTI transforms static cultural heritage into dynamic tourism experience products. While protecting cultural roots, it provides residents with convenient channels for cultural participation, strengthening cultural identity and the sense of belonging [25,26]. At the same time, it promotes improvements in quality and expansions in the capacity of public cultural resources, optimizes the quality of education and cultural supply, and meets the spiritual development needs of residents. In terms of ecological foundation, given the environment-dependent nature of the cultural and tourism industry, the in-depth integration of “ecology + tourism” not only realizes an economic transformation of ecological value but also feeds back ecological governance through tourism income [31]. The promotion of green tourism concepts fosters residents’ awareness of ecological protection. Combined with practical measures such as scenic area ecological restoration and pollution control, it continuously optimizes the regional ecosystem service functions, provides residents with inclusive ecological products such as clean air and a beautiful environment, and strengthens the ecological bottom line of PLW. In summary, through the multi-dimensional direct effects of economic empowerment, service optimization, cultural nourishment, and ecological protection, CTI fully covers the core connotation of PLW, promoting the coordinated improvement of residents’ material and spiritual needs, as well as individual development and regional coordination. Based on this, this paper proposes the following hypothesis:
Hypothesis 1. 
CTI has a significant positive promoting effect on PLW in the YRB.

2.2. Indirect Impact of CTI on PLW

As a composite development model, CTI breaks industrial boundaries and promotes the in-depth integration of the service industry and the cultural industry. This drives the transfer of production factors from low-value-added industries to high-value-added industries and the evolution of industrial forms from industry-led to service industry-led. Furthermore, through the mediating role of industrial structure optimization, CTI indirectly improves the level of PLW. First, CTI gives rise to diversified service formats that are knowledge-intensive and high-value-added, and that have strong employment absorption capacity, which can directly drive the agglomeration of production factors in the context of high-end service industries [22,28]. Meanwhile, the cross-sectoral linkages between CTI and agriculture, as well as industry, extend the value chains of traditional industries. This not only improves the quality of regional economic development but also lays a material foundation for the improvement of PLW by creating high-quality employment opportunities and broadening income-increasing channels. Second, CTI optimizes factor allocation efficiency and accelerates the evolution of industrial structure optimization. The agglomeration effect and cross-regional collaboration attribute of the cultural and tourism industry can attract key factors such as capital, talents, and technology to core cities within the YRB, breaking down barriers to factor flow [19]. On the one hand, factor agglomeration promotes the large-scale and intensive development of the cultural and tourism industry and related industries, facilitates the refinement of industrial division of labor and collaborative upgrading, and enhances the overall competitiveness of the industry. On the other hand, the upgrading of consumer demand triggered by CTI forces traditional industries to carry out technological transformation and service upgrading, driving the industrial structure to evolve toward a higher quality and structures more in line with people’s livelihood needs. Ultimately, it indirectly empowers PLW through paths such as economic quality improvement, employment optimization, and income growth. Based on this, this paper proposes the following hypothesis:
Hypothesis 2. 
Industrial structure optimization plays a mediating role in the impact of CTI on PLW in the YRB.
CTI may affect digital infrastructure construction through demand pull or adjustment of resource allocation, thereby indirectly acting upon PLW. First, the new formats spawned by CTI generate rigid demand for digital infrastructure such as network coverage, data platforms, and intelligent terminals [34]. To meet these demands, the construction of facilities, including 5G networks, the Internet of Things, smart scenic area management systems, and cultural and tourism big data platforms, will be accelerated within the YRB. This not only improves the efficiency of cultural and tourism services but also benefits local residents—for instance, high-speed network coverage promotes the extension of distance education and telemedicine to county and township levels, while digital service platforms integrate government affairs and living service resources, significantly enhancing the accessibility of public services and convenience of daily life, and directly improving livelihood experiences. Second, digital infrastructure optimizes the allocation of cultural and tourism resources and service supply, indirectly driving the improvement of PLW. On the one hand, digital infrastructure breaks information asymmetry, realizes precise matching between tourist demand and local supply through cultural and tourism big data platforms, and promotes the joint development of cultural and tourism resources and cross-regional flow of tourists in the upper, middle, and lower reaches of the YRB [35]. This not only improves the economic benefits of the cultural and tourism industry but also drives the expansion of employment opportunities and growth of residents’ income through increased industrial income. On the other hand, digital infrastructure empowers the upgrading of cultural and tourism services, such as online reservation systems, intelligent navigation, and digital cultural and creative products. These service forms not only enhance tourist experience but also spawn new forms of employment such as digital cultural and tourism operation and online content creation, broadening income-increasing channels for residents. Meanwhile, digital infrastructure promotes the digital sharing of public cultural resources, such as online exhibitions of libraries and museums, and the digital inheritance of intangible cultural heritage skills. This enables residents to easily access cultural services, enriches their spiritual and cultural life, and further consolidates the spiritual foundation of PLW. Based on this, this paper proposes the following hypothesis:
Hypothesis 3. 
Digital infrastructure plays a mediating role in the impact of CTI on PLW in the YRB.
The First Law of Geography states that everything is spatially correlated, and the correlation intensity between adjacent things is stronger. Cities in the YRB are geographically adjacent and have complementary resource endowments; the core elements of CTI exhibit significant cross-regional mobility characteristics, which can break administrative boundaries and geographical constraints, and strengthen economic and cultural ties among cities within the basin. The new economic geography theory further indicates that the diffusion effect formed by industrial agglomeration will drive factors to spill over to surrounding regions, and the agglomeration and correlation of the cultural and tourism industry provide just such a mechanism for spatial spillover. The extant literature has further verified that the advancement of cultural and tourism sectors exerts substantial spatial spillover impacts on two critical dimensions: economic expansion and the improvement of public service systems [31]. Moreover, the core dimensions of PLW (e.g., income growth, service equalization) inherently have natural spatial correlation, and effect transmission can be achieved through cross-regional factor flow and public service sharing. Based on this, this paper proposes the following hypothesis:
Hypothesis 4. 
The impact of CTI on PLW in the YRB has spatial spillover effects.

3. Materials and Methods

3.1. Study Area

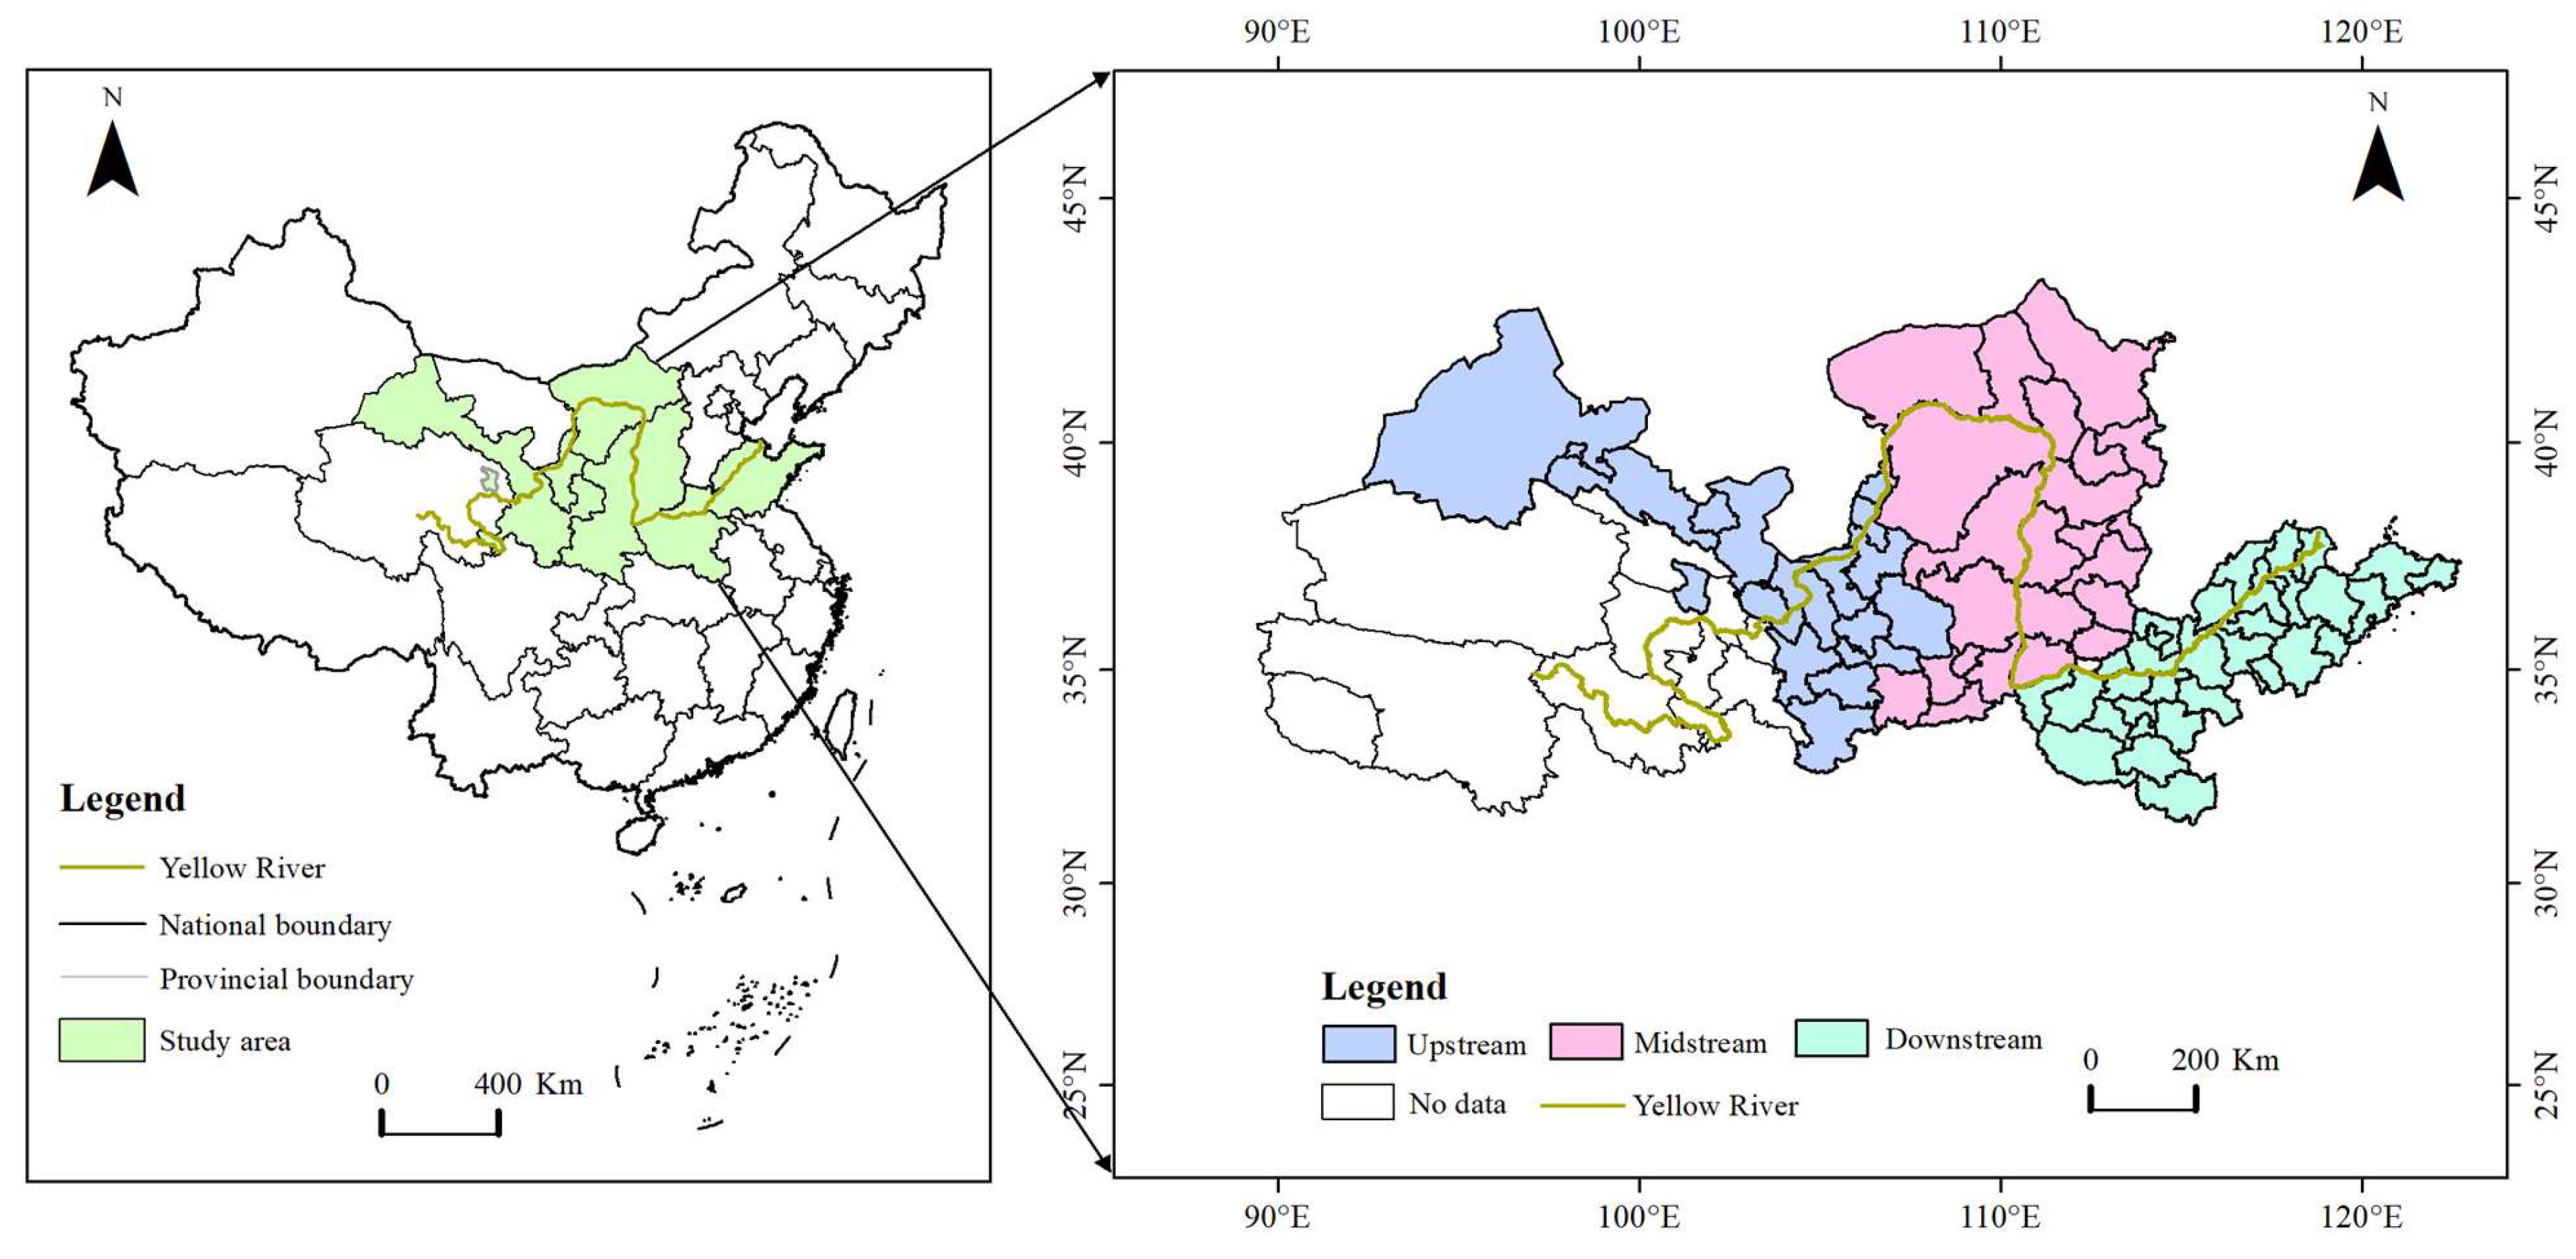
Geographically situated in China’s central-northern territories, the YRB stretches across the nation’s eastern, central, and western macro-regions, encompassing nine provincial-level administrative regions (provinces and autonomous regions): Qinghai, Sichuan, Gansu, Inner Mongolia, Ningxia, Shanxi, Shaanxi, Henan, and Shandong, with a total basin area of 795,000 square kilometers. Based on data availability and consistency in research standards, 75 prefecture-level cities (prefectures, leagues) within the basin were selected as research samples (Figure 1), with the study period designated as 2011–2023—encompassing critical developmental phases from China’s 12th Five-Year Plan to the midpoint of its 14th Five-Year Plan. The YRB features diverse landforms and fragile ecosystems, serving as an important ecological security barrier in China, and boasts unique advantages in its cultural and tourism resources, such as natural ecology, historical culture, and ethnic folk customs. By the end of 2023, the YRB had 40 national 5A-level tourist attractions, 544 4A-level tourist attractions, and the number of A-level tourist attractions accounted for approximately one-third of the national total. The cultural–tourism sector has emerged as a pivotal driver for economic restructuring across the basin, laying a robust groundwork for investigating industrial linkages and effect-spillover mechanisms associated with CTI. Notably, the YRB exhibits significant unbalanced development characteristics: in 2023, the GDPs of Shandong, Henan, and Shaanxi (midstream and downstream regions) accounted for 68.2% of the total basin GDP, while those of Qinghai, Ningxia, and Gansu (upstream regions) only accounted for 9.7%; the urban–rural income disparity stood at a ratio of 2.43:1, and regional differentiation in livelihood dimensions such as public services and ecological environment is also prominent. This imbalance provides an ideal sample for testing the heterogeneous effects and spatial spillover of CTI on PLW.

3.2. Research Methods

3.2.1. KDE

KDE is an effective tool for measuring the state of spatial imbalance by constructing a kernel density function and using kernel density curves. This method can reflect the temporal and spatial change trends, polarization phenomena, and other characteristics of quantitative indicators. The specific formula is as follows:
f x = 1 N h i = 1 n K y i y h
Herein, N denotes the number of observations, y i represents the level of PLW or CTI of the i-th city, y is the mean value of the indicator, and h is the bandwidth. The Gaussian kernel density function is as follows:
K x = 1 2 π e x p x 2 2

3.2.2. Benchmark Regression Model

To investigate the direct impact of CTI on PLW, the benchmark econometric model is constructed as follows:
P L W i t = β 1 + β 2 C T I i t + β 3 X i t + ε i t
In the equation, i denotes the region, t denotes the time period, P L W i t represents the PLW Index, C T I i t denotes the level of CTI, and X i t represents a set of control variables.
To incorporate the one-period lag term of PLW, a dynamic panel model is constructed, and the model specification is as follows:
P L W i t = β 1 + β 2 P L W i t 1 + β 3 C T I i t + β 4 X i t + ε i t
In the equation, P L W i t 1 denotes the one-period lag term of PLW. There are two main types of dynamic panel estimation methods: Difference Generalized Method of Moments (DIF-GMM) and SYS-GMM. Compared with DIF-GMM, SYS-GMM possesses more sample information and achieves a higher estimation efficiency. Therefore, this paper adopts SYS-GMM for estimation.

3.2.3. Mediating-Effect Model

To further verify the mediating roles of industrial structure optimization and digital infrastructure in the impact of CTI on PLW, this paper draws on the mediating-effect testing approach proposed by Wen et al., constructing the mediating-effect models as follows [36]:
P L W i t = θ 1 + ω C T I i t + γ X i t + ε i t
M E D i t = λ 1 + α C T I i t + η X i t + ε i t
P L W i t = τ 1 + C T I i t + b M E D i t + χ X i t + ε i t
In the equation, M E D i t denotes industrial structure optimization or digital infrastructure, which serves as the mediating variable.

3.2.4. SDM

The SDM fully accounts for the spatial autocorrelation of explanatory variables and explained variables. It can better identify the spatial autocorrelation between CTI and PLW in the YRB, as well as the magnitudes of the impacts of various influencing factors on PLW (including direct effects and indirect spillover effects). The model specification is as follows:
Y i t = β X i t + ρ j = 1 n W i j Y j t + j = 1 n φ W i j X i t + μ i + ν t + ε i t
In this equation, Y i t and X i t correspond to the actual observations of the explained variable and explanatory variable for the i-th research unit in period t , respectively; β signifies the coefficient associated with the explanatory variable; ρ serves as the spatial autoregressive coefficient of the explained variable; φ denotes the spatial spillover coefficient; W i j refers to the spatial weight matrix; μ i , ν t , and ε i t represent the spatial effect, time effect, and random error term, respectively.

3.2.5. Entropy Weight Method

The entropy weight method is an objective weighting technique, grounded in information theory, which determines indicator weights based on the degree of variation in the observed data [37]. The core principle is that indicators exhibiting greater dispersion across observations contain more discriminatory information and should therefore receive higher weights, whereas indicators with minimal variation contribute less to differentiation among observations and receive lower weights. Compared with subjective weighting approaches such as the analytic hierarchy process (AHP), the entropy weight method better eliminates human bias in weight assignment, thereby enhancing the objectivity and reproducibility of composite index construction. This method has been widely adopted in multi-criteria evaluation studies across economics, geography, and environmental science [34]. In this study, the entropy weight method was applied to construct the CTI index, PLW index, and digital infrastructure composite index. The calculation procedure comprises five steps.
First, to eliminate the influences of differing dimensions and magnitudes, the original data are standardized using the min–max normalization method. For positive indicators (where higher values indicate better performance), the standardization formula is
X i j = X i j m i n X i / m a x X i m i n X i
For negative indicators (where lower values indicate better performance), the standardization formula is
X i j = m a x X i X i j / m a x X i m i n X i
where X i j denotes the original value of indicator j for observation i , X i j denotes the standardized value, and m i n X i and m a x X i represent the minimum and maximum values of indicator j across all observations, respectively. Second, the proportion of indicator j for observation i is calculated as
P i j = X i j / Σ n = 1 n X i j
where n is the total number of observations.
Third, the entropy value of indicator j is computed as
E j = 1 / ln n × Σ m = 1 P i j l n P i j
Following convention, if P i j = 0 , then P i j l n P i j is defined as 0. The entropy value E j ranges between 0 and 1, where higher values indicate a more uniform distribution and less information content. Fourth, the weight of indicator j is determined by
W j = 1 E j / Σ m j = 1 1 E j
where m is the total number of indicators, and 1 E j represents the coefficient of variation (degree of differentiation) for indicator j . Indicators with lower entropy values (greater variation) receive higher weights. Fifth, the composite index for observation i is calculated as the weighted sum of standardized indicator values:
S i = Σ m j = 1 W j × X i j
The resulting weights for all indicators in the CTI and PLW evaluation systems are presented in Table 1 and Table 2, respectively.

3.2.6. Spatial Visualization Method

To visualize the spatial distribution patterns of CTI and PLW across the YRB, this study employed the natural breaks (Jenks) classification method implemented in ArcGIS 10.8. The natural breaks method is a data clustering algorithm that minimizes within-class variance while maximizing between-class variance, thereby identifying natural groupings inherent in the data distribution [38,39]. This approach is particularly suitable for mapping regional disparities because it optimizes class boundaries based on actual data characteristics rather than imposing arbitrary equal intervals. Based on the CTI and PLW index values, each of the 75 prefecture-level cities was assigned to one of five classification grades: low, relatively low, medium, relatively high, and high. The classification was performed independently for each of the four time cross-sections (2011, 2015, 2019, and 2023) to capture temporal changes in the spatial distribution pattern. The specific classification intervals for CTI and PLW indices across the four time periods are presented in Table A1 (Appendix A).

3.3. Variable Selection and Measurement

3.3.1. Explained Variable

PLW, as a core concept for measuring regional development quality and residents’ living conditions, has seen evolution in its measurement paradigm, from the traditional model focusing on single economic indicators such as GDP and per capita income to a multi-dimensional comprehensive evaluation system based on diverse theoretical frameworks [40,41,42]. The Human Development Index (HDI) proposed by the United Nations Development Programme (UNDP) in 1990, and which centers on three core dimensions—long and healthy life, knowledge acquisition, and a decent standard of living—marks a milestone in the multi-dimensional measurement of well-being. Subsequent frameworks, including the Happy Planet Index [43], OECD Good Life Index, and Inclusive Wealth Index, have further expanded the measurement dimensions. Maslow’s hierarchy of human needs theory, the genuine wealth model, SDGs, and the Millennium Ecosystem Assessment (MEA) framework provide the core theoretical support for constructing the dimensions of well-being measurement. Specifically, Maslow’s hierarchy of human needs theory divides PLW into hierarchical levels of basic material needs, development needs, and advanced needs [21,28], while the genuine wealth model, SDGs, and MEA framework correlate PLW with capital types such as manufactured capital, natural capital, and human capital, forming a multi-dimensional logic of “economy–society–ecology–culture” [32,44,45,46]. Although academic debates persist regarding the measurement perspectives of subjective well-being versus objective well-being and the selection of dimension quantities, a consensus has been reached on the core evaluation dimensions, including economic income, social security, public services, and ecological environment [13,18,28,47]. Given that subjective well-being is mostly internalized in objective well-being, and objective indicators are more comparable and usable [48], this paper, combining the characteristics of the research context in the YRB, adopts an objective multi-dimensional evaluation framework. It constructs an PLW evaluation index system from five dimensions: economic well-being (income and employment security), social well-being (social security and equity of public services), health well-being (medical and health security), cultural and educational well-being (education supply and satisfaction of cultural and spiritual needs), and ecological well-being (living environment and ecological security) (Table 1).

3.3.2. Core Explanatory Variable

Currently, scholarly inquiries into quantifying CTI development levels have identified two predominant methodological approaches: one involves establishing separate subsystem indicator frameworks for the cultural and tourism sectors, and applying the coupling coordination degree model to assess the extent of their coordinated advancement [49]; the second approach involves treating the cultural–tourism sector as a cohesive, integrated system while constructing a holistic evaluation indicator framework [50]. The former can profoundly reveal the interaction relationships between systems, accurately identify the stage of integrated development, and diagnose structural imbalance problems such as “cultural industry lag” or “tourism industry lag”, but it is prone to issues like “false coupling coordination” and subjectivity in the weight setting of the coordination index in practical applications [22,51]. In contrast, although the latter does not deeply deconstruct the internal interaction mechanism of CTI and regards the integration process as a “black box” to a certain extent, it can break through the limitations of a single industry perspective, comprehensively depict the overall development status of CTI from a multi-dimensional and macro perspective, and form a “panoramic” comprehensive evaluation result. Given the research objective of this paper—to explore the overall impact effects, transmission mechanism, and spatial spillover characteristics of CTI on PLW—it is necessary to conduct a comprehensive and systematic quantitative characterization of the CTI level in the YRB, rather than focus on the diagnosis of issues affecting the coordination stage between industries. Therefore, this paper selects the measurement path of constructing a comprehensive evaluation indicator system to provide scientific and comprehensive data support for the core explanatory variable in subsequent empirical analysis. Referring to relevant research results [34,35,52,53,54,55], based on the core logical framework of “resource–support–output”, this paper constructs a comprehensive evaluation indicator system for integration level from three dimensions: cultural and tourism resource endowment, cultural and tourism development support, and the benefits and scale of CTI. Among these dimensions, cultural–tourism resource endowments encapsulate the abundance, quality, and core carrier capacity of a region’s cultural–tourism assets, acting as the “foundational impetus” for integrated development. Cultural and tourism development support covers various supporting elements and development environments that directly or indirectly promote integration, acting as the “guarantee conditions” for integrated development. The benefits and scale of CTI reflect the scale effects and comprehensive benefits formed by integrated development, which is an “intuitive reflection” of the integrated development level (Table 2).
Table 2. Evaluation index system for CTI.
First-Level IndicatorsSecond-Level Indicators (Unit)AttributeWeightSourceReference
Cultural and Tourism Resource EndowmentWeighted number of A-level scenic spots (unit)Positive0.0456PSYC[34,35,52]
Number of public libraries (unit)Positive0.0117PSYC[34,35,52]
Number of theaters and cinemas (unit)Positive0.0286PSYC[34,35,52]
Number of museums (unit)Positive0.0575PSYC[34,35,52]
Total collections of public libraries (volumes/item)Positive0.0177PSYC[34,35,52]
Cultural and Tourism Development SupportPer capita urban road area (square meters per capita)Positive0.0102CCSY[34,35,52,53,54]
Proportion of tertiary industry added value (%)Positive0.0589CCSY[34,35,52,53,54]
Total fixed asset investment (10,000 CNY)Positive0.0178CCSY[34,35,52,53,54]
Per capita household consumption level (CNY per capita)Positive0.2076CCSY[34,35,52,53,54]
Number of employees in the culture, sports and entertainment industry (10,000 persons)Positive0.0462CCSY[34,35,52,53,54]
Number of internet users (household)Positive0.0375SCED[34,35,52,53,54]
Cultural and Tourism Integration Benefits and ScaleNumber of star-rated hotels (unit)Positive0.0600PSYC[34,35,52]
Total passenger traffic (10,000 person-times)Positive0.0436CCSY[34,35,52]
Number of domestic tourist arrivals (10,000 person-times)Positive0.1404PSYC[34,35,52]
Number of inbound tourist arrivals (10,000 person-times)Positive0.0564PSYC[34,35,52]
Total tourism income (100 million CNY)Positive0.1604PSYC[34,35,52]
Number of employees in the accommodation and catering industry (10,000 persons)Positive0.0456CCSY[34,35,52]
Notes: Weights were determined using the entropy method. SCED = Statistical Communiqué on National Economic and Social Development of Prefecture-level Cities in the YRB. See Table 1 notes for other abbreviations. The “Reference” column indicates the literature basis for indicator selection and attribute direction. All CTI indicators are classified as positive, as higher values indicate greater levels of cultural–tourism integration, following established CTI measurement frameworks [34,35,52,53,54,55].

3.3.3. Mediating Variables

Mediating variables (also termed intervening variables) are intermediate factors through which the independent variable transmits its effect to the dependent variable, thereby revealing the causal mechanism underlying the observed relationship. Based on the theoretical analysis in Section 2, this study identifies two potential mediating pathways: industrial structure optimization and digital infrastructure. Following the mediating-effect testing procedure proposed by Wen et al. [36], the analysis employs a three-step approach: (1) establishing the total effect of CTI on PLW; (2) testing whether CTI significantly affects the mediating variable; and (3) including both CTI and the mediating variable in the regression to assess the direct effect and mediating pathway. A mediating effect is confirmed when the coefficient of CTI decreases in step (3) compared to step (1) while the mediating variable remains significant.
The first mediating variable is industrial structure optimization (Ind). It is a core characterization of regional economic transformation and quality improvement, the essence of which is the process of shifting the production factors from low-value-added industries to high-value-added industries and industrial forms evolving from industrial dominance to service industry dominance [56]. Referring to the classic approach of Gan et al., the ratio of the output value of the tertiary industry to that of the secondary industry is adopted to measure the level of industrial structure optimization [57].
The second mediating variable is digital infrastructure (Dig). It is the core hardware and software carrier supporting regional economic and social development in the era of the digital economy, covering multiple dimensions, such as digital resource input and digital service supply. Referring to the research of Zhao and Wang et al., the level of digital infrastructure is measured from two aspects: digital infrastructure input and digital infrastructure output [58,59]. More concretely, digital infrastructure investment is operationalized through fiber optic cable density, per capita internet broadband connection ports, and the employment share in information transmission, computer services, and software sectors; digital infrastructure performance is gauged via per capita telecommunications revenue, mobile device penetration rate, and internet usage penetration rate. The composite index is calculated using the entropy method.

3.3.4. Control Variables

In addition to the core explanatory variables, other variables that have important impacts on PLW are further controlled to reduce the estimation bias of the research caused by omitted variables and make the model more robust. Referring to previous relevant studies [24,60,61,62], the specific definitions and explanations of the control variables are shown in Table 3.

3.4. Data Sources

The data used in this study were compiled from multiple authoritative statistical sources, as indicated in the “Source” columns of Table 1, Table 2 and Table 3. Specifically: (1) the China City Statistical Yearbook (CCSY) provided core socioeconomic indicators including GDP, income, consumption, employment, urbanization, and urban infrastructure; (2) the China Fiscal Statistical Yearbook (CFSY) supplied fiscal expenditure structure data covering health, social security, education, and science and technology expenditures; (3) the China Health Statistics Yearbook (CHSY) provided health-related indicators such as the number of health institutions, hospital beds, and licensed physicians per 10,000 people; (4) Statistical Yearbooks of Prefecture-level Cities in the YRB (PSYC) contributed cultural and tourism resource data, including A-level scenic spots, museums, libraries, tourist arrivals, and tourism revenue; (5) the Statistical Communiqué on National Economic and Social Development of Prefecture-level Cities (SCED) offered annual updates for digital infrastructure and technological innovation variables; and (6) the China Environmental Statistics Yearbook and official releases by the Ministry of Ecology and Environment (CESY) provided ecological environment indicators such as PM2.5 concentration and air quality data. Missing data for individual years were supplemented using linear interpolation. All monetary variables were deflated to 2011 constant prices using the GDP deflator to ensure comparability across the study period.

4. Results

4.1. Temporal- and Spatial-Evolution-Related Characteristics of CTI and PLW

4.1.1. Temporal-Evolution-Related Characteristics

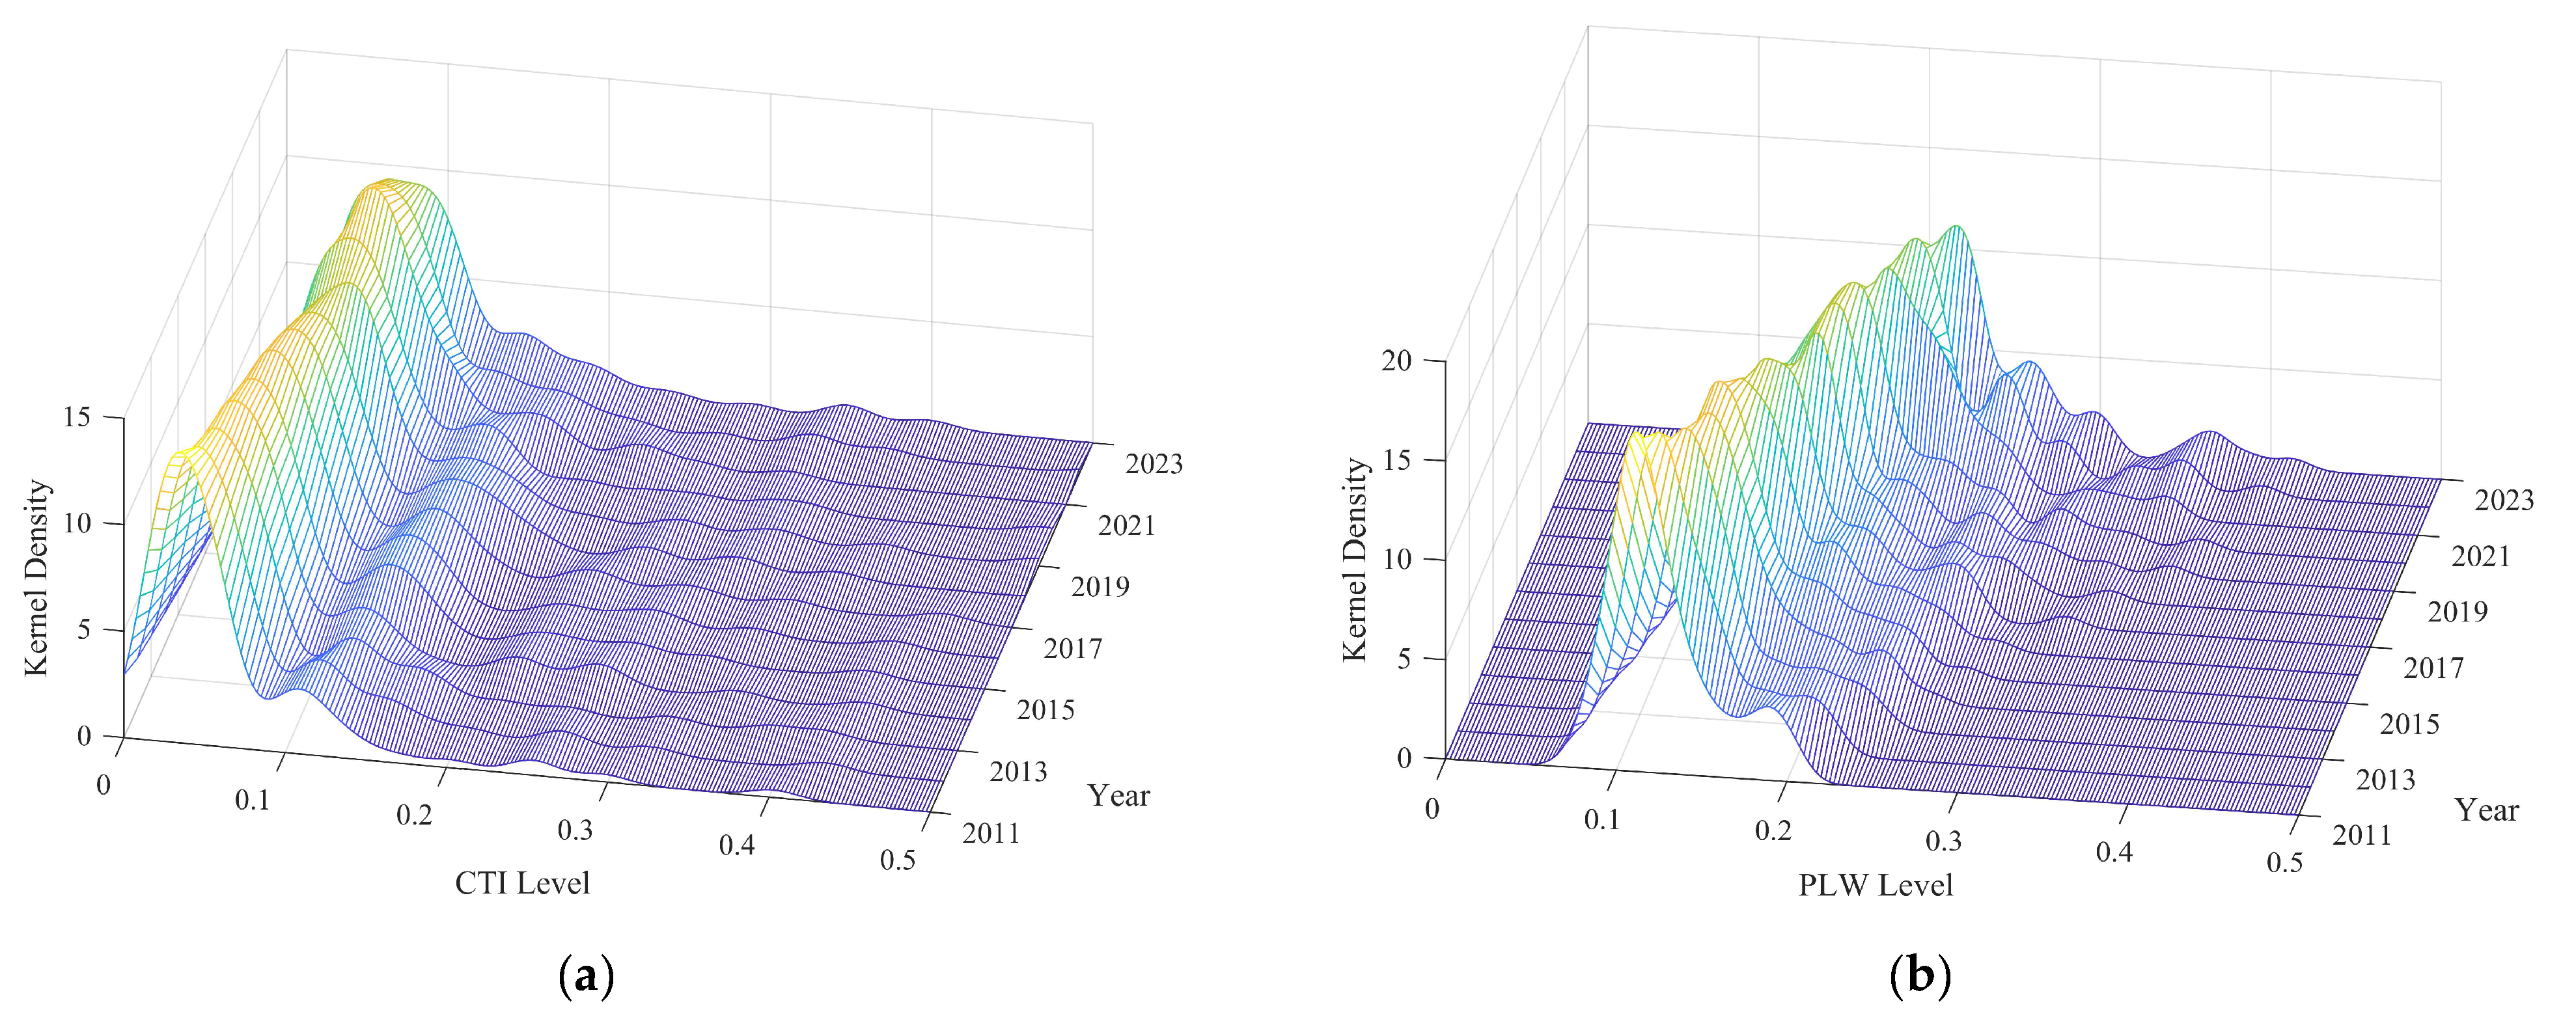
This paper adopts KDE to analyze the dynamic change laws relevant to CTI level and PLW level in the YRB from 2011 to 2023.
From Figure 2a, it can be observed that, in terms of distribution location, the main peak is located on the left side of the kernel density curve, with a slight rightward shift of the peak, indicating that the CTI level in the YRB is mostly at a medium-low level, but shows a slow upward trend overall. Regarding the distribution characteristics, the breadth of the kernel density curve’s main peak initially broadens before contracting, which reflects the fact that the regional differences in CTI development in the YRB have gradually decreased, with some fluctuations. In the early stage, the gap widened due to differences in resource endowments and development intensity; in the later stage, with the implementation of cross-regional coordinated development mechanisms and CTI coordination policies, the imbalance of regional development has been effectively alleviated. In terms of distribution extensibility, the kernel density curve shows an obvious right tailing phenomenon, mainly because there are a few cities with high CTI levels in the YRB. In addition, the right tailing phenomenon has weakened, indicating that the spatial gap in CTI levels has shown a trend of gradual convergence and narrowing, and the demonstration effect and spatial spillover effect in cities with high CTI levels have gradually emerged.
From Figure 2b, the following can be observed: in terms of the distribution interval and offset degree of the main peak, the position of the main peak of the kernel density curve has continued to shift rightward, indicating that the PLW level in the YRB has continuously improved, with a significant increase observed during the study period. In terms of distribution pattern, the width of the main peak of the kernel density curve has undergone a continuous widening process, reflecting a significant expansion of regional differences in PLW levels in the YRB. In terms of distribution extensibility, it shows a year-by-year rightward widening, meaning that there are always some cities with rapid PLW development, and the growth rate is accelerating year by year. These cities have formed cumulative circular advantages in income growth, public service optimization, and other aspects, thus further widening the gap within the basin and leading to the emergence of the phenomenon of “the strong getting stronger”.

4.1.2. Spatial-Evolution-Related Characteristics

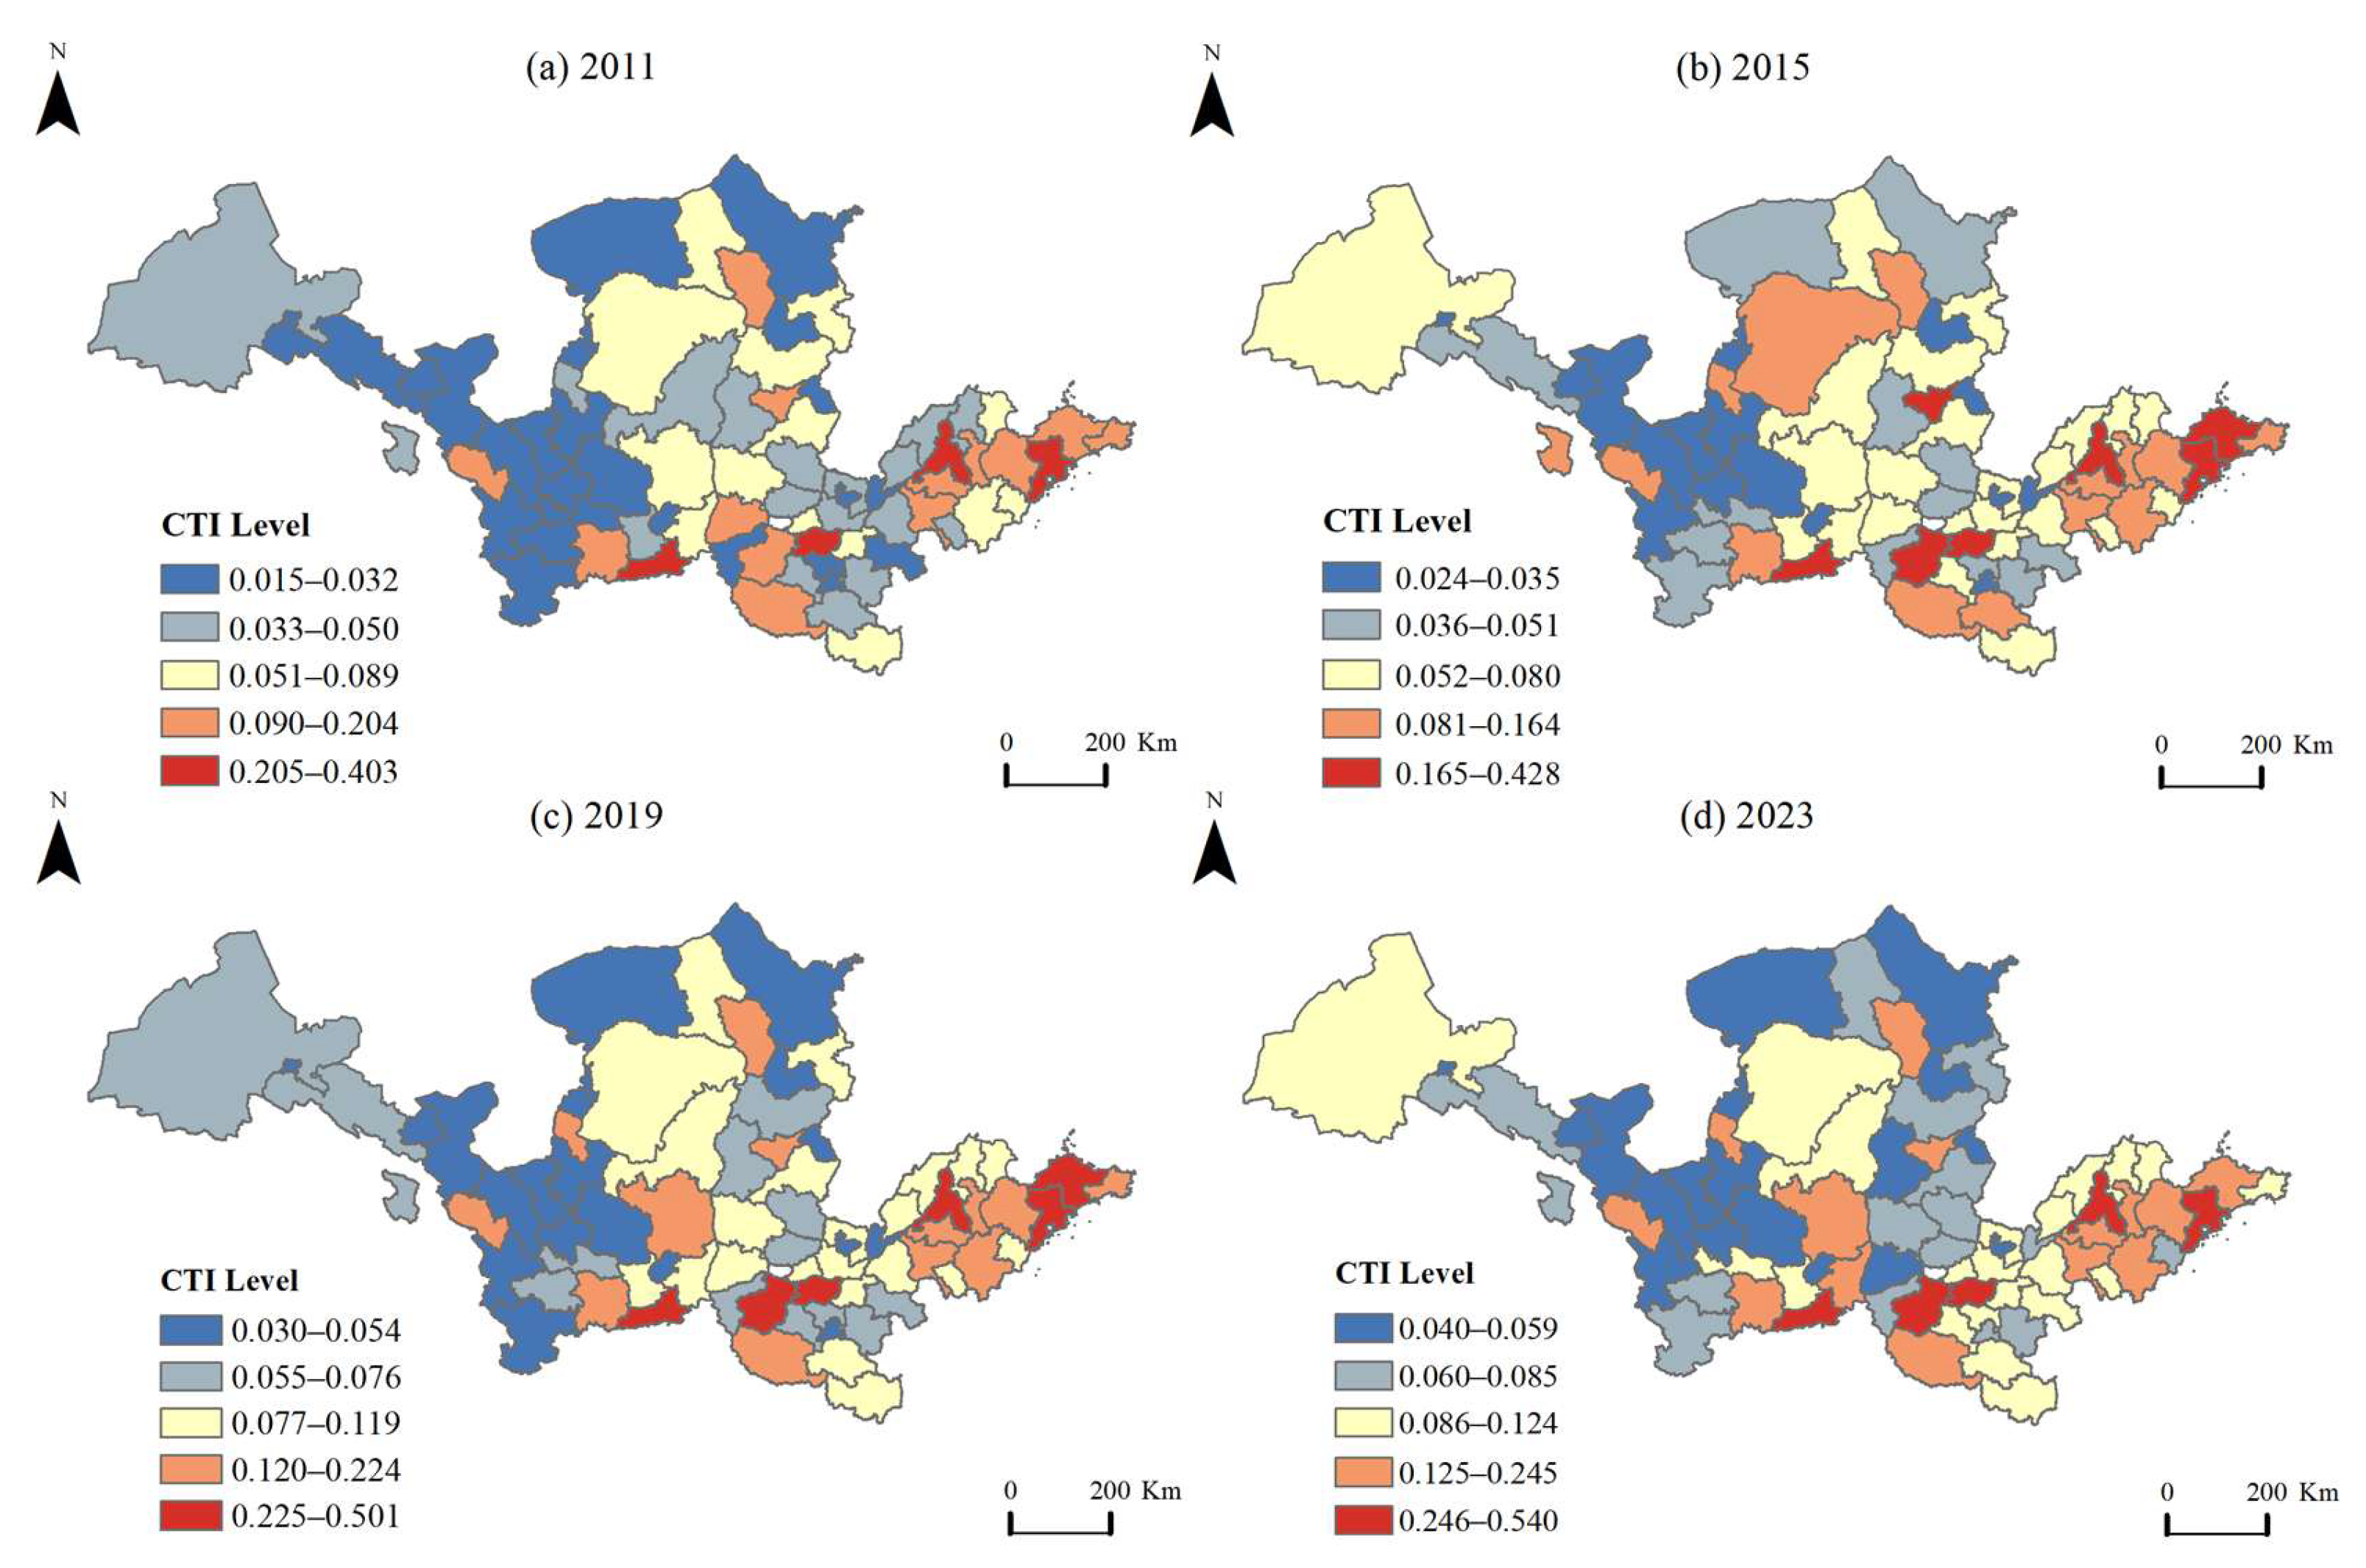
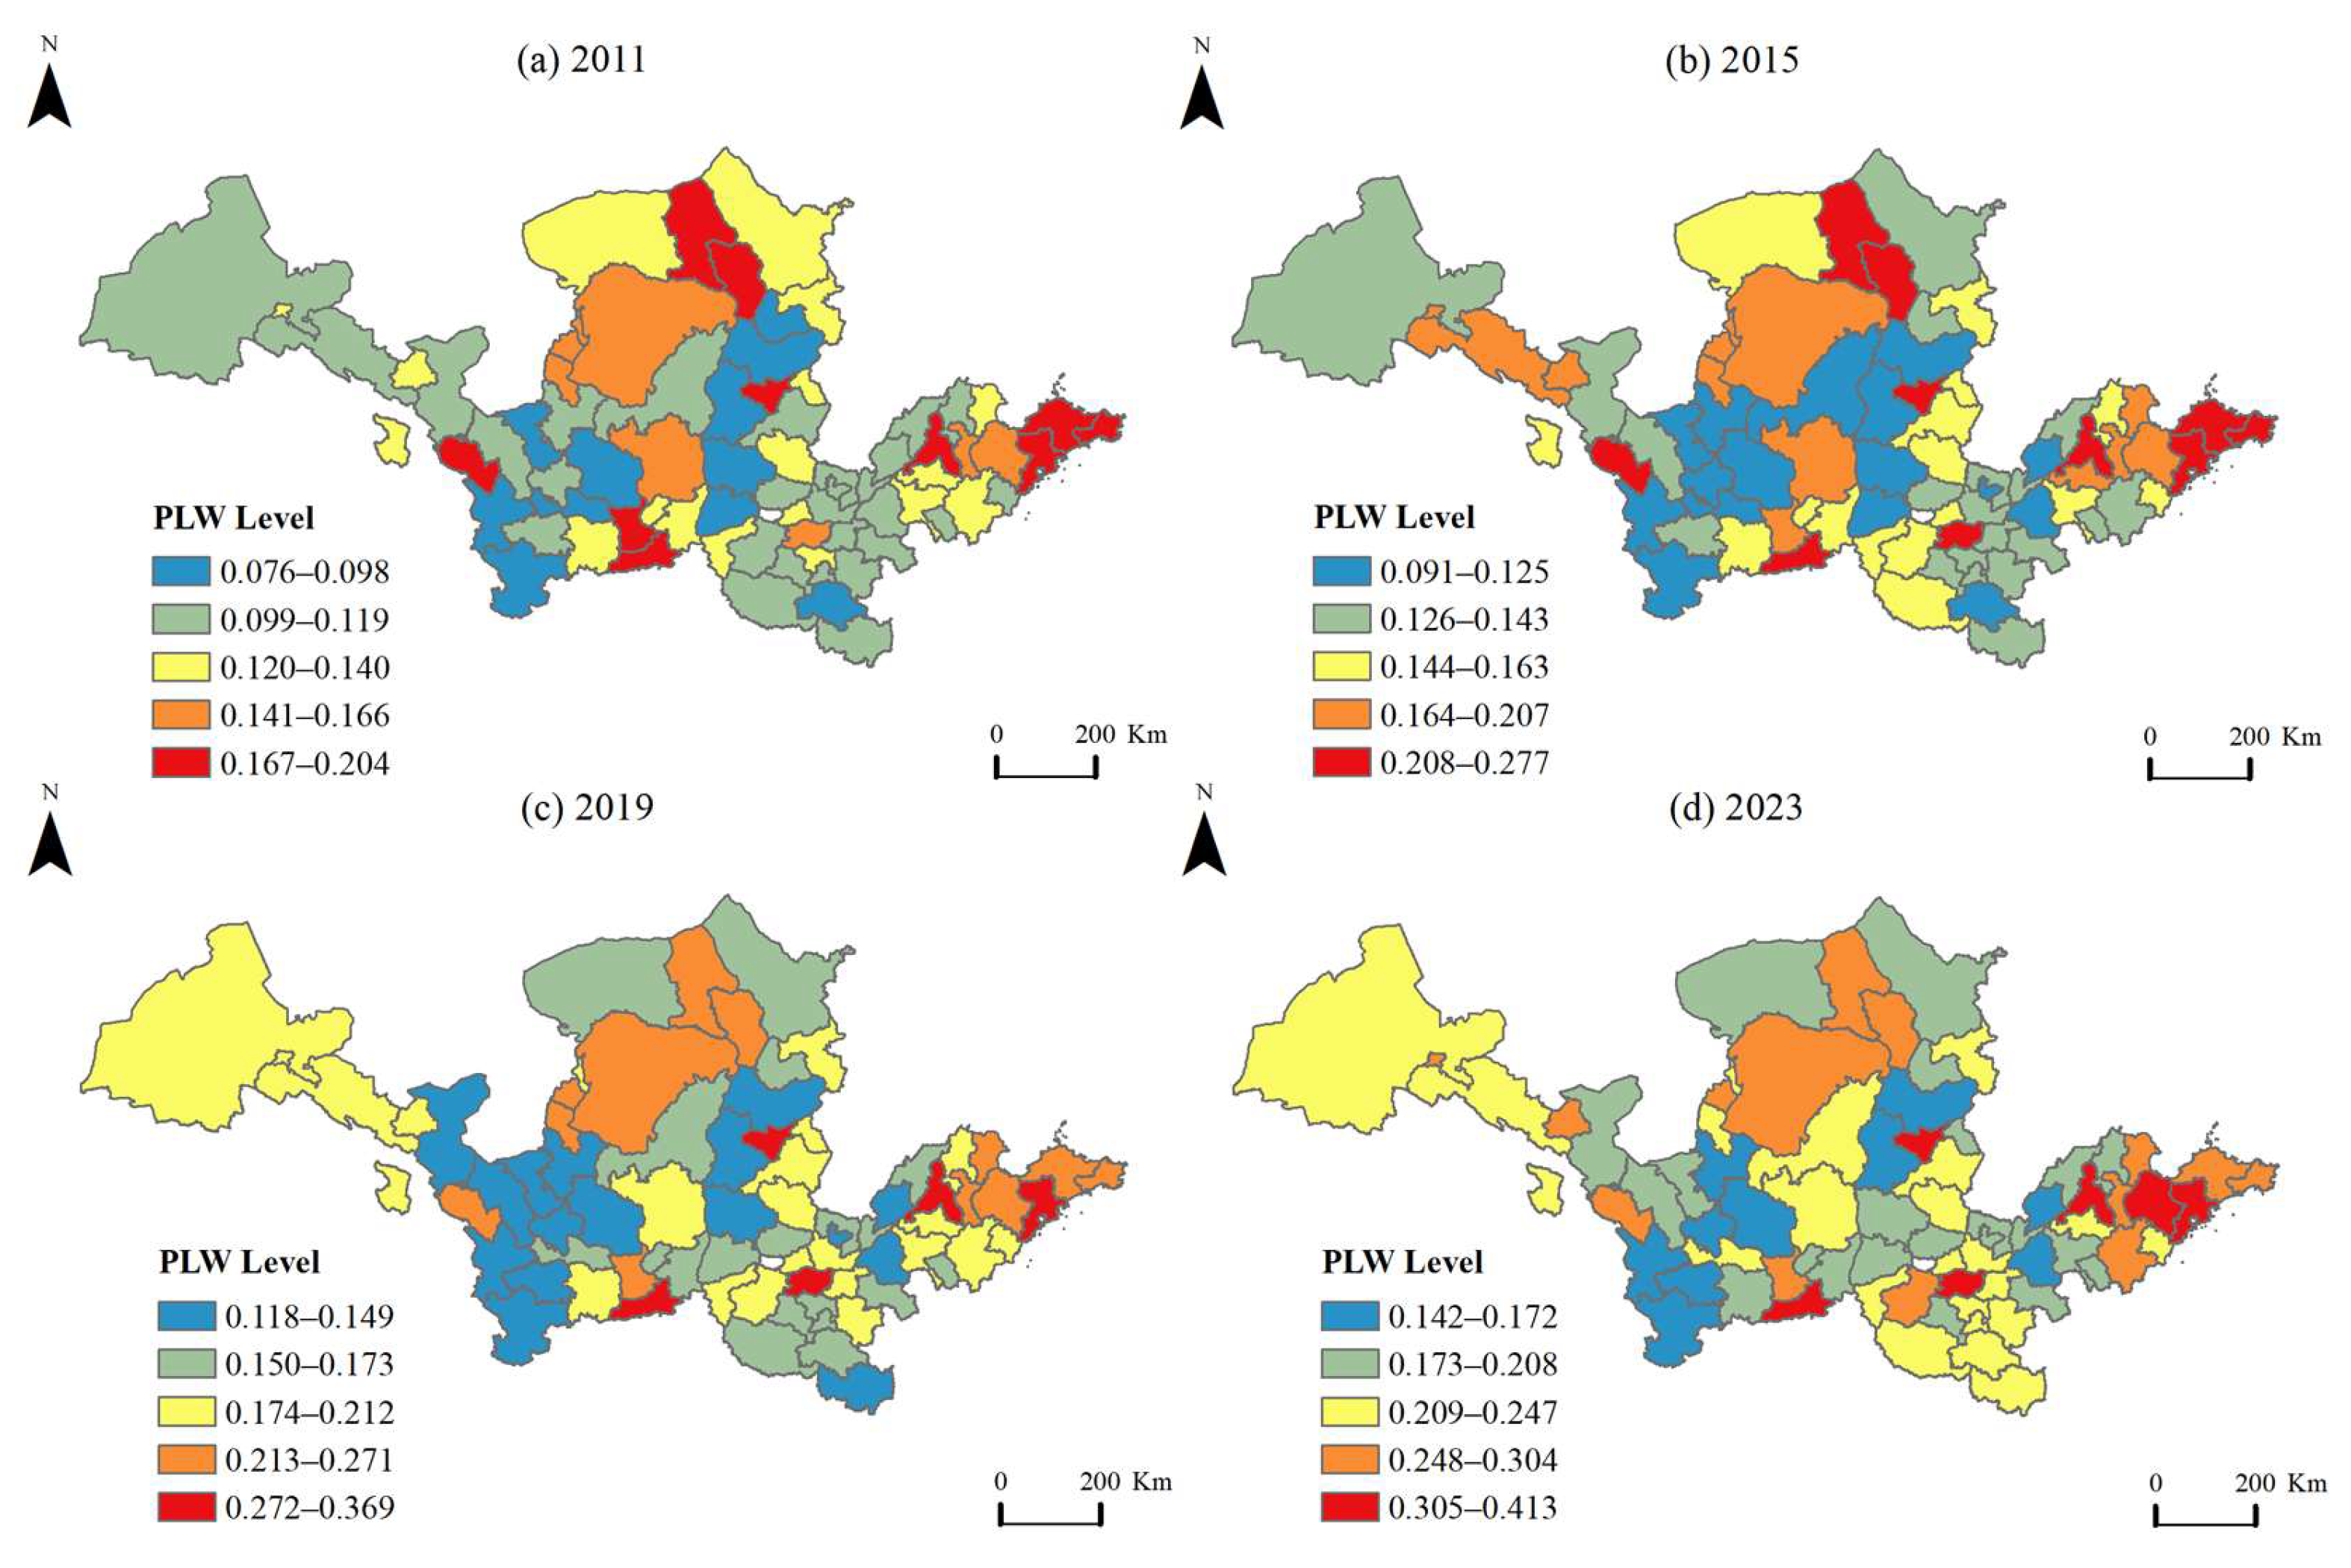
To reveal the spatiotemporal distribution patterns and evolution trends of CTI level and PLW level in the YRB, this paper adopts the natural breaks method in ArcGIS to classify the patterns and trends into five grades: low, relatively low, medium, relatively high, and high, and conducts spatial visualization analysis with 2011, 2015, 2019, and 2023 as time cross-sections.
As shown in Figure 3, the CTI level in the YRB presents an overall core spatial pattern of “midstream and downstream leading, upstream lagging behind”, with high-value areas concentrated in core cities of the midstream and downstream areas for substantial durations. Its spatial distribution characteristics are highly correlated with regional resource endowments, policy support intensity, and economic foundation conditions, showing an evolution trend of “core agglomeration–global diffusion–gap convergence” overall. Specifically, in 2011, the overall CTI level of the basin was relatively low, with the highest value (0.403) occurring in Xi’an; high-value areas were concentrated in only a few provincial capitals and famous historical and cultural cities such as Xi’an, Jinan, and Qingdao; low-value areas were scattered in the upper reaches and marginal areas of the YRB; medium-value areas had a limited coverage; and the characteristics of core–periphery dual structure were significant. In 2015, the gradient diffusion effect of CTI initially emerged: high-value areas gradually expanded to the Central Plains region and Shandong Peninsula; medium-value areas showed the characteristic of “local agglomeration” in central Henan, central Shanxi, and the Guanzhong Plain of Shaanxi; the signs of relatively low-value areas transforming into medium-value areas were obvious; the CTI level of some cities in the upper reaches improved slowly; and the scope of low-value areas initially shrank. In 2019, the catching-up momentum in the upper reaches accelerated: the CTI level of some prefecture-level cities in Qinghai, Ningxia, and Gansu broke away from the long-term stagnation; cities such as Hohhot, Xianyang, and Datong in the midstream areas made steady progress, driven by policies; and the coverage of medium-value areas continued to expand. In 2023, the overall CTI level achieved a qualitative improvement: the highest value was again found in Xi’an; the range of high-value areas expanded to (0.246–0.540]; cities such as Luoyang successively joined the ranks of high-value areas; and the number of high-value cities increased significantly. Meanwhile, the scope of low-value areas shrank sharply; the leap from relatively low-value areas to medium-value areas was obvious; medium-value areas transformed from “local agglomeration” to “global multi-point diffusion”, forming a wide distribution in the upper, middle, and lower reaches; and the balance of regional development continued to improve.
From the perspective of overall evolution, all four time-cross-sections maintain an obvious core–periphery structure: cities in the midstream and downstream areas, such as Xi’an, Zhengzhou, Luoyang, Jinan, and Qingdao, continued to lead by virtue of high-quality cultural and tourism resources and improved infrastructure; the CTI levels of some prefecture-level cities in Qinghai, Ningxia, and Gansu in the upper reaches have been lower than 0.100 for a long time, but it has shown a slow catching-up trend since 2019; most cities in the midstream areas, such as Hohhot, Xianyang, and Datong, are in the medium-value range and have achieved steady improvement driven by policies. On the whole, the findings indicate the unbalanced evolution characteristic of “midstream and downstream leading, upstream catching up”, and the regional development gap has gradually converged under the effect of gradient diffusion and coordinated development mechanisms.
As shown in Figure 4, the overall spatial distribution pattern of PLW in the YRB also presents “midstream and downstream leading, upstream lagging behind”, but it forms a distinct contrast with the evolution trend of CTI, showing the characteristics of “strengthened core agglomeration and expanded regional gaps” overall. High-value areas have long been concentrated in economically developed cities with improved public services in the midstream and downstream areas, while low-value areas remain in ecologically fragile and economically underdeveloped regions in the upstream areas, with the unbalanced nature becoming increasingly prominent over time. Specifically, in 2011, the overall PLW level of the basin was relatively low; high-value areas were found in only a few cities, such as Xi’an and Jinan; low-value areas were continuously distributed in upstream and marginal areas such as Longnan, Qingyang, and Dingxi, and the unbalanced pattern first emerged. In 2015, the PLW level improved steadily, and the regional diffusion effect initially appeared: cities such as Zhengzhou, Weifang, and Ordos joined the ranks of high-level areas; high-value areas expanded to the Central Plains region and Shandong Peninsula; medium-level cities showed the characteristic of “local agglomeration” in central Henan, central Shanxi, and the Guanzhong Plain of Shaanxi; the scope of the low-value areas shrank, but still remained continuously distributed. In 2019, the improvement momentum of PLW accelerated: cities such as Qingdao, Jinan, Zhengzhou, and Xi’an formed a “Shandong Peninsula–Central Plains–Guanzhong” high-value agglomeration belt; relatively high-level cities transformed from “point-like” to “belt-like” distribution; low-value areas further shrank to a few cities in southern Gansu, eastern Qinghai, and southern Ningxia. In 2023, the overall level of PLW in the basin increased significantly: cities with medium-or-above levels accounted for 57.33%; high-value areas showed “the strong getting stronger”, with the high-level range expanding to (0.305–0.413]; however, marginal cities in the upstream such as Longnan, Dingxi, and Guyuan have long remained in the low-level range, and the gap with high-value areas has nearly doubled, compared with 2011.
Overall, the spatial pattern of PLW in the YRB has always maintained the unbalanced characteristic of “core agglomeration in the midstream and downstream, relative lag in the upstream”, and over time, it has presented an evolution trend in which the agglomeration effect of high-value areas continues to strengthen and the unbalanced nature of regional development becomes increasingly prominent.
It should be noted that the spatial distribution maps (Figure 3 and Figure 4) are descriptive visualizations based on observed index values rather than model-based predictions; therefore, prediction error metrics (e.g., RMSE) are not applicable.

4.2. Effects of the Impacts of CTI on PLW in the YRB

4.2.1. Benchmark Regression Results

Prior to estimation, the Modified Wald test for groupwise heteroskedasticity was conducted, yielding a chi-square statistic of 3828.33 (p < 0.01), which rejects the null hypothesis of homoskedasticity. To address this issue, robust standard errors were employed in all regression models. As shown in Table 4, the estimated coefficients of CTI are positive in all three models and pass the significance test at the 1% level, which fully verifies Research Hypothesis H1. In the Ordinary Least Squares (OLS) model, the estimated coefficient of CTI is 0.323 (p < 0.01), initially revealing the positive correlation between CTI and PLW. After further controlling for the inherent characteristics of city individuals in the Fixed Effects (FE) model, the coefficient rises to 0.380 (p < 0.01), indicating that the livelihood promotion effect associated with CTI becomes more prominent after eliminating regional heterogeneity. Considering that PLW has significant path-dependent characteristics and there may be bidirectional causal endogeneity between CTI and PLW, this paper adopts the SYS-GMM for in-depth estimation. After incorporating the first-order lag term of PLW (coefficient: 0.873, p < 0.01), the estimated coefficient of CTI is 0.130 (p < 0.01). Although the value decreases, it remains highly significant, reflecting the fact that the positive impact of CTI on PLW is still robust after controlling for endogeneity and dynamic dependence, and is closer to the true effect level. In terms of control variables, the level of financial development and technological innovation capacity are consistently significantly positive at the 1% level; the urbanization rate, fiscal self-sufficiency rate, and level of opening-up are significantly negative in the OLS and FE models but turn out to be significantly positive, at the 1% level, in the SYS-GMM estimation. This reflects the fact that the impacts of such variables on PLW have phased characteristics—their development dividends are gradually released in the long run, and their positive effects on PLW become evident. SYS-GMM estimation tests show that the p-value of AR (2) is greater than 0.1, indicating the lack of any second-order autocorrelation; the Hansen test yields a p-value of 0.263 (greater than 0.1), which suggests that the internal instrumental variables are valid and there is no over-identification problem; thus the model estimation is reasonable and reliable.

4.2.2. Heterogeneity Analysis

(1) Regional Heterogeneity
Significant differences exist in resource endowments, economic foundations, and development stages within the upper, middle, and lower reaches of the YRB, which may lead to regional differentiation in the impact of CTI on PLW. Therefore, it is necessary to conduct targeted regional heterogeneity tests. Since the upstream and downstream regions failed the second-order autocorrelation test of disturbance terms, the results of the SYS-GMM estimation are unreliable; thus, the FE model is selected for analysis, with the results being shown in Table 5. CTI has a significant positive promoting effect on PLW in the upper, middle, and lower reaches of the YRB at the 1% level, but the effect intensity presents a stepwise distribution characteristic of “strongest in the upstream, followed by the downstream, and weakest in the midstream”. The possible reasons are as follows: the upstream region boasts original ecological natural landscapes and unique ethnic and cultural resources, with CTI starting late and having a low development base. In recent years, new formats such as ecotourism and study tourism have developed rapidly, forming a “low base–high growth” marginal effect characteristic, which has a more direct and significant driving effect on employment and income increase, as well as public service improvement; the downstream region has a solid economic foundation, dense transportation networks, and a mature consumer market, in which the cultural and tourism industry has formed a large-scale agglomeration effect. However, the PLW base itself is high and the industrial structure is diversified, so the marginal contribution of CTI has converged compared with the upstream values, but still maintains a stable, positive effect; although the midstream region is endowed with rich historical and cultural resources, some cities face problems such as homogeneous competition for cultural and tourism resources, insufficient industrial innovation, and lagging infrastructure in supporting facilities, resulting in a limited livelihood conversion efficiency of CTI and a weaker promoting effect than those seen in the upstream and downstream regions.
(2) Heterogeneity in PLW Level
In addition to regional differences, the impact of CTI on PLW may vary according to the different development levels of PLW itself. To this end, the Unconditional Quantile Regression (UQR) model (selecting four representative quantiles: 0.20, 0.40, 0.60, and 0.80) is adopted for further exploration. Table 5 shows that CTI has a significant positive promoting effect on cities with different PLW development levels (at the 1% level), and the effect intensity presents a gradually increasing characteristic associated with the rise in quantiles. The coefficient at the low PLW-level quantile (Q = 0.20) is 0.081 (p < 0.01); when the quantile rises to 0.40 and 0.60, the coefficients increase to 0.164 and 0.222, respectively (both p < 0.01); the coefficient at the high PLW-level quantile (Q = 0.80) reaches a peak of 0.318 (p < 0.01), which is nearly three times higher than that at the Q = 0.20 quantile. The reasons are as follows: cities with high PLW levels usually have improved transportation and accommodation facilities and high-quality public services, as well as higher consumption capacities associated with their residents and increased cultural literacy, enabling them to more efficiently absorb the industrial dividends of CTI and achieve a virtuous cycle. Cities with low PLW levels are restricted by weak economic foundations, lagging infrastructure, and narrow consumer markets, resulting in weak capabilities in cultural and tourism resource development and industrial transformation. Although they can obtain certain employment and income growth through CTI, the scale of the effect is limited. With the gradual improvement in PLW levels, cities’ capacities for bearing, innovating, and radiating CTI continues to enhance, and the PLW promotion effect of CTI is progressively strengthened, highlighting the “Matthew effect” of “the strong getting stronger”.

4.2.3. Robustness Analysis

(1) Excluding Partial Years.
Following the onset of the COVID-19 pandemic, the cultural–tourism sector sustained multifaceted disruptions—including travel restrictions and assembly restrictions—impeding the advancement of CTI. This may have led to abnormal fluctuations in data during this period, thereby affecting the accuracy of estimation results. To eliminate this interference, this paper conducted the regression a second time after excluding the sample data from 2020 to 2022, with the results as shown in Column (1) of Table 6. The estimated coefficient of CTI is 0.060 (p < 0.01), which remains significantly positive at the 1% level, consistent with the coefficient sign in the benchmark regression, with only a slight adjustment in value. This indicates that after excluding the abnormal years affected by the pandemic, the positive promoting effect of CTI on PLW still exists in a stable manner.
(2) Selecting Policy Node Samples.
The formal establishment of the Ministry of Culture and Tourism in 2018 indicated that China’s CTI has entered a new development stage characterized by “policy-guided and systematically promoted” initiatives. This policy node has an important impact on the development quality and promotion efficiency of CTI. To verify the stability of the core conclusions during the key policy phase, this paper selected samples after the policy implementation period (2018–2023) for re-estimation, with the results as shown in Column (2) of Table 6. The estimated coefficient of CTI is 0.206 (p < 0.01), which still passes the significance test at the 1% level, and the coefficient sign is consistent with that of the benchmark regression. This confirms that even when focusing on the key stage of systematic CTI development, its positive promoting effect on PLW remains significant.

4.3. Mediating-Effect Analysis

This paper adopts the mediating-effect model to verify whether industrial structure optimization and digital infrastructure serve as mediating paths through which CTI affects PLW in the YRB, with the results being shown in Table 7 and Table 8. All models have passed the autocorrelation test of disturbance terms and the Hansen over-identification test, indicating that the use of the SYS-GMM for estimation is reasonable.
Centering on the transmission mechanism of industrial structure optimization, we perform regression analysis by taking industrial structure optimization as the explained variable and CTI as the key explanatory variable (Table 7). The findings in Column (2) reveal that the estimated coefficient of CTI stands at 1.415 (p < 0.01), achieving statistical significance at the 1% level—demonstrating that CTI exerts a significant positive impact on the process of industrial structure upgrading across the YRB. The inherent logic is as follows: CTI, with cultural resources as the core and tourism carriers as the support, has spawned new formats such as cultural and creative industries, study tourism, and smart cultural initiatives and tourism. This prompts the industrial structure to transform from a “resource-dependent” model to an “innovation-driven” one, accelerating the evolution of industrial structure optimization. After incorporating the industrial structure optimization variable into the benchmark regression, as can be seen in the findings presented in Column (3), the estimated coefficient of CTI equals 0.115 (p < 0.01)—maintaining statistical significance at the 1% level, yet smaller than the overall effect (0.130); simultaneously, the estimated coefficient of the process of industrial structure upgrading stands at 0.008 (p < 0.01), which proves statistically positive and significant. This indicates that CTI can not only directly promote the improvement of PLW but also indirectly empower livelihood enhancement by driving industrial structure optimization—in other words, industrial structure optimization plays a partially mediating role in the relationship between the two. The mediating role of ISU is reflected in its ability to optimize the employment structure (e.g., increasing high-value-added service sector jobs), improve factor allocation efficiency, and promote high-quality regional economic growth, thereby providing a material basis and institutional guarantee for the improvement of PLW. Research Hypothesis H2 is therefore verified.
Shifting focus to the mediating role of digital infrastructure, we carry out regression analysis by treating digital infrastructure as the explained variable and CTI as the key explanatory variable (Table 8). The findings in Column (2) reveal that the estimated coefficient of CTI registers at −0.077 (p < 0.01), attaining statistical significance at the 1% level, which indicates that CTI exerts a notably adverse effect on the development of digital infrastructure across the YRB in the short run. The core reason for this phenomenon lies in the phased characteristics of cultural and tourism development in the YRB: in some regions, CTI still relies on the offline development of traditional natural and cultural resources, since funds and resources are more likely to be invested in offline facilities such as scenic-spot renovation and transportation-supporting facilities, which generates a significant crowding-out effect relative to investment in digital infrastructure (e.g., smart scenic-spot systems, digital service platforms); meanwhile, market demand in the initial stage of CTI focuses on basic tourism experiences, and the strong pull of high-end digital services has not yet been formed, leading to insufficient synergy between cultural and tourism development and digital infrastructure construction; thus, a negative correlation is shown in the short term. Following the inclusion of the digital infrastructure variable in the benchmark regression model, the findings, as shown in Column (3), reveal that the estimated coefficient of CTI stands at 0.136 (p < 0.01)—maintaining statistical significance at the 1% level (positive) and marginally greater than the overall effect (0.130); simultaneously, the estimated coefficient of digital infrastructure registers at 0.078 (p < 0.01), which proves to be statistically positive and significant. This indicates that digital infrastructure itself exerts a notably positive enabling impact on PLW. It can be seen from this that although CTI inhibits digital infrastructure construction in the short term, digital infrastructure has a significant positive effect on PLW, and the direct positive effect of CTI on PLW (0.136) is sufficient to offset this indirect negative impact, ultimately resulting in a significantly positive total effect. Essentially, this mechanism reflects the insufficient development synergy between CTI and digital infrastructure construction in the YRB: the direct livelihood dividends of CTI (e.g., employment and income growth, public service improvement) have been fully manifested, but effective demand pull and resource inclination for digital infrastructure have not yet been formed. This leads to the failure of the digital infrastructure to fully release its mediating, empowering effect; it instead forms a negative mediating effect (suppressing effect). Therefore, Research Hypothesis H3 is verified, due to the suppressing rather than enhancing mediation pathway.

Regional Heterogeneity of Mediating Effects

To further examine regional heterogeneity in the mediating mechanisms, subgroup mediation analyses were conducted across the upstream, midstream, and downstream regions; the results are presented in Table 9 and Table 10.
Industrial structure optimization functions as a mediator (Table 9). The mediating role of industrial structure optimization exhibits significant regional differences. In the upstream region, CTI significantly promotes industrial structure optimization (coefficient = 1.267, p < 0.01), and industrial structure optimization exerts a positive mediating effect on PLW (coefficient = 0.005, p < 0.05), while the direct effect of CTI on PLW remains significant (0.264, p < 0.1). This suggests that CTI in the upstream region enhances PLW both directly, through ecological tourism development, and indirectly, through industrial upgrading. In the midstream region, CTI has the strongest effect on industrial structure optimization (coefficient = 1.766, p < 0.01), but the mediating effect on PLW turns significantly negative (coefficient = −0.013, p < 0.01), indicating that “structural transformation pains”—such as labor displacement and short-term adjustment costs—temporarily offset welfare gains. In the downstream region, industrial structure optimization plays a positive mediating role (coefficient = 0.006, p < 0.05), reflecting the fact that the mature industrial base enables synergistic development between CTI and PLW.
Digital infrastructure functions as a mediator (Table 10). The mediating mechanism of digital infrastructure also shows pronounced regional differentiation. In the upstream region, CTI has no significant impact on digital infrastructure (coefficient = 0.079, p > 0.1), while digital infrastructure strongly promotes PLW (coefficient = 0.153, p < 0.01). This indicates that the resource crowding-out effect has not yet emerged in the upstream region, where CTI development remains at an early stage, with limited demand for digital services. In the midstream region, CTI exerts a significant negative impact on digital infrastructure (coefficient = −0.144, p < 0.01), confirming the strongest crowding-out effect among the findings, as resources are predominantly allocated to traditional offline facilities. In the downstream region, the negative effect persists (coefficient = −0.185, p < 0.01), but is partially mitigated by the developed digital economy and strong market demand for smart tourism services. Notably, the mediating effect of digital infrastructure on PLW is relatively weaker in the downstream (coefficient = 0.047, p < 0.01) due to diminishing marginal returns from an already high digital development base.
These findings reveal that the resource crowding-out effect of digital infrastructure is primarily concentrated in the midstream region, where CTI development remains offline-oriented, while significant resource competition has not yet been triggered in the upstream region, and the downstream has begun to achieve partial coordination between CTI and digital construction.

4.4. Analysis of Spatial Spillover Effects

4.4.1. Spatial Correlation Analysis

This paper adopts the Global Moran’s I and uses the 0–1 adjacency weight matrix to measure the spatial autocorrelation of CTI level and PLW level in the YRB from 2011 to 2023, with the results as shown in Table 11. The 0–1 adjacency matrix was selected for the following reasons. First, it aligns with the First Law of Geography, which posits that spatial interactions are strongest between neighboring units sharing common boundaries [63]. Second, the primary spillover channels of CTI in the YRB—such as tourist flows along contiguous routes and resource sharing among neighboring cities—operate predominantly through adjacent administrative units rather than following a continuous distance–decay pattern, making the adjacency matrix more theoretically appropriate than geographically weighted distance matrices. Third, economic distance matrices may introduce endogeneity concerns when economic variables are already included as controls in the model. It can be seen that the Global Moran’s I of CTI level in the YRB from 2011 to 2023 ranges from 0.082 to 0.206. With the exceptions of 2020 (Moran’s I = 0.108, p = 0.096) and 2021 (Moran’s I = 0.082, p = 0.210), which fail to pass the 5% significance test, the values in other years are significantly positive at the 1–5% level. This indicates that CTI in the YRB exhibits significant spatial positive correlation and distinct spatial agglomeration characteristics: cities with high CTI levels tend to form high-value agglomeration clusters with neighboring cities, while cities with low CTI levels are likely to form low-value agglomeration patterns with surrounding cities, and there exists a positive spatial correlation effect in CTI development among adjacent cities. In the same period, the Global Moran’s I of the PLW level in the YRB ranges from 0.082 to 0.322. Except for 2021 (Moran’s I = 0.082, p = 0.220), which fails to pass the significance test, the values in other years are significantly positive at the 1% level. This means that PLW level in the YRB exhibits a stronger spatial positive correlation and more prominent spatial agglomeration characteristics: core cities with high PLW levels have a significant positive radiation effect on neighboring cities, and the spatial correlation of low-value areas is also evident.

4.4.2. Testing and Selection of Spatial Econometric Models

The reasonable selection of spatial panel data econometric models is a prerequisite for ensuring the reliability of regression results. Combined with relevant tests, the specific applicable form of the spatial panel econometric model is determined (Table 4). First, the LM test results show that the LM (error) test statistic of the spatial error model (SEM) is 346.839 (p = 0.000), and the robust LM (error) statistic is 303.593 (p = 0.000), both of which are significant at the 1% level; the robust LM (lag) statistic of the spatial autoregressive model (SAR) is 0.696 (p = 0.404), failing to pass the 5% significance test. This necessitates the further estimation of the spatial Durbin model (SDM). Second, the Hausman test yields a statistic of 664.00 (p = 0.000), which strongly rejects the null hypothesis—that the random effects model is preferable—at the 1% significance level. Third, the LR test results demonstrate that dual fixed effects (incorporating individual and time dimensions) are statistically superior to either individual fixed effects (Both-Ind, p < 0.01) or time-fixed effects (Both-Time, p < 0.01), indicating that the adoption of dual fixed effects in the SDM is more appropriate. Fourth, the Wald test outcomes reveal that the statistic for the SDM degenerating into the SAR model is 19.13 (p = 0.004), while the statistic for its degeneration into the SEM model is 17.36 (p = 0.008)—both strongly reject the null hypothesis at the 1% level. This conclusion is further corroborated by the LR test. Consequently, this study ultimately decides to employ the SDM with individual and time dual fixed effects for subsequent analytical procedures.

4.4.3. Decomposition of Spatial Effects

Table 12 presents the estimation results of the dual fixed effects SDM for the impact of CTI on PLW in the YRB. This model can simultaneously capture the exogenous interaction effects of explanatory variables and the endogenous interaction effects of response variables, which are more consistent with the spatial correlation characteristics of regional economic geography phenomena. In terms of model test indicators, the Log-likelihood value of the SDM reaches 2843.834, which is significantly higher than that of the dual fixed effects SEM (2835.252) and SAR (2834.379). This indicates that the SDM has a better overall specification and more reliable estimation results. The model’s adjusted R-squared value stands at 0.532, a relatively elevated level—indicating that the chosen key explanatory variables (along with control variables, if applicable) effectively account for the variations in the explained variable and control variables, and their spatial lag terms can well explain the changes in PLW in the YRB, covering the main influencing factors. Furthermore, the rho of the SDM is 0.126 (p < 0.01), passing the significance test at the 1% level. This not only verifies the scientific validity and applicability of the selection of the SDM but also reveals that PLW in the YRB has significant spatial correlation—namely, the improvement of PLW level in a city will be positively driven by the PLW statuses of neighboring cities, and spatial spillover is an important spatial mechanism affecting the evolution of PLW within the basin.
Subject to certain factors, including the feedback effects associated with spatial lag terms, the direct estimates derived from the SDM fail to precisely capture the actual magnitude of inter-variable impacts [64]. To address this issue, the spatial effects of core explanatory variables and control variables are decomposed into the direct effect (the impact of a city on itself), indirect effect (the spillover impact of a city on neighboring cities), and total effect (the sum of direct effect and indirect effect) using the partial differential method, in order to accurately identify the spatial mechanism of CTI. The results are shown in Table 13. The decomposition results of CTI’s spatial effects are both statistically significant and economically meaningful, verifying Research Hypothesis H4 with a positive spatial spillover effect (indirect effect = 0.145, p < 0.01). Specifically, the estimated coefficient of the direct effect is 0.094 (p < 0.01), passing the significance test at the 1% level. This indicates that the development of CTI in a city within the YRB can directly and significantly promote the improvement of local PLW, which echoes the conclusion of the benchmark regression and confirms the endogenous positive driving effect of CTI relative to PLW. This effect mainly stems from local dividends brought by CTI, such as employment and income growth, as well as the improvement of public services. The estimated coefficient for the indirect effect registers at 0.145 (p < 0.01), achieving statistical significance at the 1% level with a positive sign. This demonstrates that CTI development within a given city exerts a notably positive spatial spillover impact—specifically, the advancement of CTI in one city can facilitate the enhancement of PLW in adjacent cities via mechanisms including inter-regional tourist mobility, industrial collaboration, and public service co-sharing, thus embodying the “regional linkage dividends” of CTI across the YRB. The estimated coefficient for the total effect stands at 0.239 (p < 0.01), attaining statistical significance at the 1% level. This suggests that following the combination of CTI’s direct catalytic effect and inter-regional spillover impact on PLW, the aggregate impact proves statistically significant and positive.
For the fiscal self-sufficiency rate, the estimated coefficient for the indirect effect registers at −0.120 (p < 0.1), while the total effect stands at −0.133 (p < 0.1)—both attain marginal statistical significance with a negative sign. In contrast, the direct effect fails to achieve statistical significance. This result indicates that the improvement of a city’s fiscal self-sufficiency rate may crowd out public service investment in neighboring areas through the resource agglomeration effect (e.g., the inclination of fiscal resources toward the local area), leading to negative spatial spillover on the PLW of neighboring cities. For the level of opening-up, the direct effect (−0.015 **, p < 0.05), indirect effect (−0.068 *, p < 0.1), and total effect (−0.083 **, p < 0.05) are all significantly negative. This reflects the fact that factor competition (e.g., competition for foreign capital and high-end talents) may exist in the process of opening-up in some cities of the YRB, which inhibits the improvement of PLW in both the local and neighboring areas, presenting the characteristic of “competitive negative spillover”. For the level of financial development, only the direct effect (0.002 **, p < 0.05) and total effect (0.001 **, p < 0.05) are significantly positive, while the indirect effect is insignificant. This shows that the promoting effect of financial development relative to PLW is limited to the city itself, and the mechanisms for cross-regional capital flow and financial resource sharing are not yet sound, resulting in the failure to form spatial spillover effects. For technological innovation capacity, the direct effect (0.008 ***, p < 0.01) and total effect (0.023 **, p < 0.05) are significantly positive, while the indirect effect (0.015, p > 0.1) fails to pass the significance test. This indicates that technological innovation has a clear direct driving effect on the PLW of the local city, but the channels for cross-regional technology diffusion and achievement sharing are not smooth, leading to the insufficient release of spillover effects.

5. Discussion

5.1. Core Findings and Theoretical Implications

First, the findings verify and expand the applicability of the coupling and interaction theory for CTI and PLW in the basin’s complex systems. Taking the YRB—a core complex region that serves as an ecological security barrier and a key area for regional economic development—as the research object, this paper reveals the core law of “isomorphic spatial pattern and heterogeneous temporal evolution” existing between CTI and PLW. Both present a spatial differentiation pattern of “midstream and downstream leading, upstream lagging behind”, but a striking contrast exists in their temporal characteristics: CTI tends to move toward regional balance, while the gap in PLW continues to widen. This finding breaks through the limitation of existing studies that mostly focus on provincial or municipal scales, extending the research on the interaction between industrial development and livelihood improvement to the basin scale, as characterized by the coexistence of ecological constraints and unbalanced development. It supplements the theoretical cognition of the intrinsic connections between factor allocation, spatial interaction, and welfare improvement in complex systems, and provides a new theoretical analysis framework for related research in similar basins or ecologically sensitive regions.
The regional imbalance in the YRB stems from both structural and regional causes. Structurally, the upstream region remains dominated by resource-extraction and primary industries with limited value-added capacity, whereas the midstream and downstream regions have developed diversified service economies with stronger employment absorption potential. Infrastructure disparities further compound this imbalance, as transportation networks, digital connectivity, and public services are more developed in midstream and downstream cities. Regionally, the upstream areas face inherent ecological constraints—including fragile ecosystems, water scarcity, and restrictive environmental regulations—that limit large-scale tourism development. Historical path-dependence also contributes to this result; core cities such as Xi’an, Zhengzhou, and Jinan have accumulated cultural tourism resources and human capital over decades, while policy support has historically favored economically developed regions, reinforcing the core–periphery structure.
Second, the findings deepen the theoretical interpretation of spatial spillover mechanisms at the basin scale. Based on the new economic geography theory, this paper accurately identifies the positive direct effect and spillover effect of CTI on PLW through the SDM and partial differential effect decomposition, while revealing the negative spatial spillover characteristics of fiscal self-sufficiency rate and opening-up level. The study not only supplements empirical evidence on the spatial spillover of cultural and tourism economy at the basin scale, but also clarifies the dynamic game between siphon effect and diffusion effect in livelihood improvement during the process of cultural and tourism development: core cities not only form positive diffusion through industrial radiation, but some variables also generate a negative siphon due to factor competition. This finding improves the theoretical system of spatial economics regarding regional interaction and PLW enhancement, and provides a new theoretical perspective for understanding resource allocation and welfare distribution under the core–periphery structure within the basin.
Specifically, tourist flows serve as a primary transmission channel: visitors traveling along Yellow River cultural routes (e.g., the Xi’an–Luoyang–Zhengzhou corridors) generate consumption spillovers to adjacent cities through extended itineraries and overnight stays, creating a “tourist radiation effect”, which is particularly pronounced along major transportation arteries. Capital drivers constitute another critical mechanism: cultural tourism enterprises headquartered in core cities expand operations to neighboring regions, transferring management expertise, brand resources, and employment opportunities. These two channels—tourist mobility and capital expansion—jointly amplify the positive spillover effects of CTI on PLW in surrounding areas.
Finally, this study expands the mechanism of research on the impact of CTI on PLW. This paper is the first to identify the dual heterogeneous transmission paths of industrial structure optimization and digital infrastructure, breaking the simplistic understanding that CTI directly empowers PLW and deepening the comprehension of the intrinsic logic of their complex relationship. Notably, the discovery of the short-term suppression effect of digital infrastructure responds to the phased contradictions in resource allocation during the initial stage of CTI development, and provides a new analytical dimension for subsequent research exploring the dynamic coordination between industrial development and infrastructure construction.

5.2. Comparison with the Existing Literature

The conclusions of this study share a theoretical consensus with the existing research on CTI and PLW, while also forming significant supplements and extensions in terms of research scale, spatial mechanism, heterogeneity analysis, and transmission paths. On the one hand, this study confirms the significant positive promoting effect of CTI on PLW, which is consistent with the core viewpoint of Li et al. and Wang et al. that the cultural and tourism industry empowers livelihood improvement through employment creation and income enhancement, further verifying the universal logic of “industrial development—livelihood quality improvement” [65,66]. Meanwhile, the overall judgment on regional heterogeneity in this study is consistent with the view of Yao and Fang that differences in factor endowments lead to the differentiation of development effects, jointly supporting the necessity of differentiated governance [67]. On the other hand, this study achieves multiple extensions on the basis of the existing literature: First, in terms of research scale, most existing studies have focused on provincial and municipal units [28,30], ignoring the particularity of basins as “ecological–economic–social complex systems”. This makes their conclusions difficult to adapt to the governance needs at the basin scale. Focusing on the YRB as the research context, this study systematically unpacks the interaction mechanisms between CTI and PLW within the dual constraints of ecological conservation and economic growth. It not only addresses the existing research gap in basin-scale related inquiries but also offers a replicable analytical framework for investigations in analogous ecologically fragile basins. Second, in terms of heterogeneity analysis, most existing studies are limited to a single dimension, such as only focusing on regional differences or urban scale differences [19], and fail to comprehensively capture the multiple sources of effect differentiation. This study simultaneously incorporates the dual heterogeneous dimensions of “region (upper, middle, and lower reaches)” and “PLW level (quantiles)”, clarifying the stepwise regional distribution of CTI effect characterized by “strongest in the upstream and weakest in the midstream” and the PLW level differentiation feature of “increasing with quantiles”. Compared with single-dimensional heterogeneity analysis, this approach depicts the law of effect differentiation more comprehensively and meticulously, providing a more useful empirical basis for targeted policies. Third, in terms of transmission mechanisms, most existing studies focus on a single positive mediating path such as industrial structure upgrading, ignoring the possible phased negative role of mediating variables [35]. This study is the first to identify the dual heterogeneous transmission mechanisms of industrial structure optimization and digital infrastructure, especially revealing the resource crowding-out effect of CTI on digital infrastructure in the initial stage. It expands the research, previously limited by the limitations of existing studies in which the discussion on mechanisms was not in-depth enough.

5.3. Practical Implications and Alignment with SDGs

This study’s conclusions not only closely align with the core tenets of China’s national strategy for ecological conservation and high-quality development in the YRB but also offer targeted and actionable practical pathways for the precise implementation of the SDGs at the basin level—thus embodying distinct practical guiding significance.
In terms of alignment with SDGs, the core research issues resonate deeply with multiple SDGs: First, the positive empowering effect of CTI on PLW directly responds to SDG 1 (No Poverty) and SDG 8 (Decent Work and Economic Growth). By creating employment opportunities and expanding income-increasing channels, the cultural and tourism industry helps residents in the basin, especially those in underdeveloped upstream areas, lift themselves out of poverty and increase their income, thereby promoting inclusive economic growth. Second, the countermeasures of cross-regional coordination and interest-sharing proposed in response to the spatial differentiation pattern of “midstream and downstream leading, upstream lagging behind” closely adhere to SDG 10 (Reduced Inequalities). Through the radiation of core areas and collaboration between upstream and downstream regions, this trend narrows the regional development gap and facilitates the inclusive sharing of development achievements. Third, the development idea of promoting CTI and ecological protection in a coordinated manner is consistent with SDG 13 (Climate Action) and SDG 15 (Life on Land). The protective development model of ecotourism in the upstream region not only safeguards the ecological security barrier of the YRB but also realizes the transformation of ecological value into livelihood dividends, practicing the development concept of “lucid waters and lush mountains are invaluable assets”. Fourth, the measures for the coordinated development of the cultural and tourism industry upgrades and digital infrastructure respond to SDG 9 (Industry, Innovation and Infrastructure). By improving technological innovation and infrastructure, the quality of the cultural and tourism industry is enhanced, injecting sustained impetus into the high-quality development of the basin. Fifth, the proposals pertaining to the cross-regional co-construction and sharing of public services, along with the refinement of urban cultural and tourism functions, align with SDG 11 (Sustainable Cities and Communities). These measures facilitate the enhancement of urban livability and the equalization of public services across the basin, while also elevating the quality of life for local residents. Furthermore, the policy insights derived from this study deliver actionable strategies for the high-quality advancement of CTI and the improvement of PLW in the YRB. They also serve as a valuable reference for other river basins or ecologically vulnerable regions striving to attain sustainable development.

5.4. Research Limitations and Future Directions

Despite the theoretical and practical contributions of this study, there are still limitations: First, the indicator dimensions can be further enriched. The evaluation of both CTI and PLW focuses on macro statistical data, emphasizing the depiction of objective development levels, while lacking microscopic subjective indicators such as residents’ satisfaction with cultural and tourism consumption, subjective well-being, and sense of gain from cultural and tourism participation, resulting in insufficient comprehensiveness of the evaluation. Second, the depth of mechanism analysis can be further explored. This study only focuses on the mediating effects of industrial structure optimization and digital infrastructure, failing to investigate the moderating effects of variables such as environmental regulation and social capital; additionally, it does not consider the interactive transmission mechanisms between mediating variables. Third, there are limitations in spatial scale and comparative perspective. The study focuses on the urban level of the YRB, without refining to the urban–rural scale, making it difficult to reveal the differences in the livelihood effects of CTI under the urban–rural dual structure. Additionally, it lacks cross-basin comparisons with typical basins such as the Yangtze River Basin and the Rhine River Basin, making it difficult to refine the universal laws of basin-based sustainable development. Fourth, the analysis of long-term dynamic evolution is insufficient. The research period, from 2011 to 2023, can only reflect phased characteristics, and the long-term evolution trends and policy lag effects require support from data associated with longer time-series.
Based on the above limitations, future research can be deepened and expanded in the following directions: First, improve the evaluation indicator system and data sources. Integrate macro statistical data with micro survey data, and incorporate subjective perception indicators through mixed research methods such as questionnaire surveys and in-depth interviews to enhance the evaluation accuracy of CTI and PLW. Second, deepen the analysis of mechanisms and boundary conditions. Use methods such as threshold regression to explore the role of moderating variables and mediating interaction mechanisms, and clarify the core logic. Third, expand the research scale and comparative perspective. Extend downward to the urban–rural scale, carry out cross-basin comparative studies, reveal the heterogeneous laws of the interaction between CTI and PLW under different natural geographical characteristics and development stages of different basins, and refine universally applicable theoretical frameworks and practical experiences. Fourth, strengthen research on long-term dynamic evolution. Adopt methods such as dynamic spatial econometric models and synthetic control methods, and combine long-time-series data to evaluate the long-term implementation effects of major policies, providing forward-looking governance implications.

6. Conclusions and Policy Implications

6.1. Conclusions

Based on the panel data of cities in the YRB from 2011 to 2023, this paper comprehensively adopts methods including KDE, the SYS-GMM estimation, the mediating-effect model, and the SDM to systematically explore the temporal- and spatial-evolution-related characteristics of CTI and PLW, as well as the impact effects, transmission mechanisms, and spatial spillover effects of CTI on PLW. The main conclusions are as follows:
(1) In terms of temporal evolution, both CTI and PLW in the YRB show a year-by-year growth trend, but the evolution paths of regional differences are significantly differentiated. The overall level of CTI has improved slowly, with fluctuations, and the spatial gap has gradually converged at the end of the study period with the implementation of cross-regional coordination policies; PLW has increased significantly, and regional differences have gradually expanded.
(2) In terms of spatial distribution, both CTI and PLW in the YRB present an unbalanced pattern of “midstream and downstream leading, upstream lagging behind”, but their agglomeration-evolution-related characteristics are significantly differentiated. High-value areas of CTI have long been concentrated in core cities in the midstream and downstream; after 2019, the upstream region has shown a catching-up trend, and medium-value areas have achieved multi-point diffusion. PLW has formed a “Shandong Peninsula–Central Plains–Guanzhong” high-value agglomeration belt; the upstream region, with its underdeveloped ecological economy, has long been a low-value area, with its agglomeration effect continuously strengthened, and the gap associated with high-value areas has nearly doubled compared with 2011.
(3) In terms of benchmark impact effects, CTI has a significant positive promoting effect on PLW. After controlling for endogeneity and dynamic path-dependent characteristics using the SYS-GMM estimation, the coefficient of CTI is 0.130 (p < 0.01), and this conclusion remains valid after robustness tests such as excluding years affected by the COVID-19 pandemic and focusing on policy nodes. Among control variables, the levels of financial development and technological innovation capacity are consistently positive and significant; the urbanization rate, fiscal self-sufficiency rate, and level of opening-up show phased characteristics of “short-term negative, long-term positive”.
(4) In terms of heterogeneity characteristics, the livelihood empowerment effect of CTI presents a dual differentiation pattern. In terms of regional heterogeneity, the promoting effect shows a stepwise distribution of “strongest in the upstream, followed by the downstream, and weakest in the midstream”; in terms of PLW level heterogeneity, the effect intensity increases gradually with quantiles—the coefficient for cities with high PLW levels (Q = 0.80) reaches 0.318, nearly three times higher than that at the Q = 0.20 quantile, reflecting the fact that high-PLW cities have better absorption and transformation efficiency relative to the CTI dividends.
(5) In terms of mediating transmission mechanisms, the impact of CTI on PLW involves dual heterogeneous mediating paths. Industrial structure optimization plays a partial, positive mediating effect: CTI drives the transformation of industrial structure to an innovation-driven model by fostering new formats, thereby indirectly empowering PLW. Digital infrastructure presents a short-term negative suppression effect: in the initial stage of CTI, resources are biased toward offline facility construction, crowding out investment in digital infrastructure; however, digital infrastructure itself has a significant positive effect on PLW, and the direct positive effect of CTI is sufficient to offset this indirect negative impact, ultimately resulting in a positive total effect.
(6) In terms of spatial spillover effects, CTI has the dual positive effects of local empowerment and cross-regional spillover. Decomposition of spatial effects shows that the direct effect coefficient of CTI on PLW is 0.094 (p < 0.01), the indirect effect coefficient is 0.145 (p < 0.01), and the total effect coefficient is 0.239 (p < 0.01), confirming that CTI drives the improvement of PLW in neighboring cities through channels such as tourist flow and industrial collaboration. Among control variables, the fiscal self-sufficiency rate and level of opening-up show negative spatial spillover, while the positive effects of financial development and technological innovation capacity are limited to local areas, reflecting the fact that the mechanism for coordinated resource allocation within the basin still needs to be improved.

6.2. Policy Implications

First, construct a gradient collaborative development system to break the spatial differentiation pattern: establish the CTI Collaborative Development Alliance in the YRB, promote pairing assistance between core cities such as Xi’an, Jinan, and Qingdao and underdeveloped cities in the upstream, and share resources including brand operation, tourist flow diversion, and talent cultivation. The upstream region should focus on the protective development of ecotourism and ethnic cultural tourism, increase investment in infrastructure such as transportation and accommodation, and transform ecological advantages into livelihood dividends. The midstream region should take the creation of Yellow River cultural IP as the core, resolve the homogeneous competition of historical and cultural resources, and enhance industrial recognition. The downstream region should promote the in-depth integration of the cultural and tourism industry with the digital economy and high-end service industry to strengthen radiation capacity. Encourage cultural and tourism enterprises in core cities to extend industrial chains upstream and downstream; ensure the upstream region shares development achievements through mechanisms such as tax sharing, employment transfer, and ecological compensation, and narrow the regional gap in PLW.
Furthermore, strengthen targeted policies based on heterogeneity to release differentiated development potential: set up special CTI funds in the upstream region to support the protective development of original ecological landscapes and ethnic and cultural resources. The midstream region should build industry–university–research innovation platforms to drive the creative upgrading of cultural and tourism products and the improvement of service quality. The downstream region should optimize cultural and tourism consumption scenarios, develop the night-time economy and exhibition economy, and expand channels for livelihood income growth. Make targeted efforts based on differences in PLW levels: high-PLW cities should strengthen their demonstration and leading roles, establish a cross-regional sharing database of high-quality cultural and tourism resources and management experience, and help surrounding low-PLW cities improve industrial carrying capacity. Low-PLW cities should focus on addressing infrastructure shortcomings, improve transport accessibility and the level of public services, and gradually alleviate the “Matthew effect”.
Additionally, optimize dual mediating paths to improve livelihood conversion efficiency: use CTI as the link to cultivate high-value-added new formats such as cultural creativity, digital cultural tourism, study tourism, and wellness tourism, and promote the transfer of labor to the skill-intensive service industry. Establish a coordinated development mechanism between CTI and digital infrastructure; incorporate digital infrastructure into the mandatory requirements of cultural and tourism project planning, and focus on advancing the construction of smart scenic spots and online tourism service platforms. In upstream and underdeveloped cities, increase financial investment and technical support for digital infrastructure, cultivate the digital cultural and tourism consumption market, and drive DI to shift from “short-term crowding-out” to “long-term empowerment”. Urge financial institutions to develop specialized credit products tailored to the cultural and tourism sector, facilitate technological and model-driven innovation among cultural and tourism enterprises, and empower CTI in order to achieve quality upgrading and efficiency enhancement via technological advancements—indirectly improving PLW.
Fourth, build a regional linkage network to activate spatial spillover effects: improve the high-speed railway, intercity railway, and trunk highway networks within the basin; build a cultural and tourism data sharing platform to promote the free flow of factors such as tourists, capital, and information, and strengthen carriers of spatial spillover transmission. Break local protection and market segmentation; launch cross-regional integrated cultural and tourism consumption vouchers to realize mutual recognition of scenic spots, interconnection of travel routes, and sharing of preferential policies; and establish a unified cultural and tourism service standard and supervision system. Institute a cross-regional coordination mechanism for industrial layout, regulate local investment promotion behaviors, and avoid homogeneous competition and vicious competition for factors. Build a collaborative supply platform for public services, promote the cross-regional co-construction and sharing of resources such as education and medical care, and improve the spatial balance of PLW. Rely on the “Shandong Peninsula–Central Plains–Guanzhong” high-value agglomeration belt to build a demonstration corridor for CTI and livelihood improvement, summarize replicable models, and radiate and drive the coordinated development of the entire basin.

Author Contributions

Conceptualization, F.L. and S.J.Y.; methodology, F.L.; software, F.L.; validation, F.L. and S.J.Y.; formal analysis, F.L.; investigation, F.L. and S.J.Y.; resources, F.L. and S.J.Y.; data curation, F.L.; writing—original draft preparation, F.L.; writing—review and editing, S.J.Y.; visualization, F.L.; supervision, S.J.Y.; project administration, F.L.; funding acquisition, F.L. All authors have read and agreed to the published version of the manuscript.

Funding

This study was supported by the Research Project in Philosophy and Social Sciences of Shandong Provincial Colleges and Universities (20250169) and the Research Project of Weifang City Science and Technology Development Plan (Soft Science Section) (2025RKX045).

Institutional Review Board Statement

Not applicable.

Informed Consent Statement

Not applicable.

Data Availability Statement

The original contributions presented in this study are included in the article. Further inquiries can be directed to the corresponding author.

Conflicts of Interest

The authors declare no conflicts of interest.

Abbreviations

The following abbreviations are used in this manuscript:
YRBYellow River Basin
CTICultural and tourism integration
PLWPeople’s livelihood and well-being

Appendix A

The following table presents the classification intervals used in the spatial visualizations of CTI and PLW levels (Figure 3 and Figure 4).
Table A1. Classification intervals for CTI and PLW indices.
GradeCTI 2011CTI 2015CTI 2019CTI 2023PLW 2011PLW 2015PLW 2019PLW 2023
Low0.015–0.0320.024–0.0350.030–0.0540.040–0.0590.076–0.0980.091–0.1250.118–0.1490.142–0.172
Relatively Low0.033–0.0500.036–0.0510.055–0.0760.060–0.0850.099–0.1190.126–0.1430.150–0.1730.173–0.208
Medium0.051–0.0890.052–0.0800.077–0.1190.086–0.1240.120–0.1400.144–0.1630.174–0.2120.209–0.247
Relatively High0.090–0.2040.081–0.1640.120–0.2240.125–0.2450.141–0.1660.164–0.2070.213–0.2710.248–0.304
High0.205–0.4030.165–0.4280.225–0.5010.246–0.5400.167–0.2040.208–0.2770.272–0.3690.305–0.413
Notes: Classification intervals were determined independently for each year using the natural breaks (Jenks) method in ArcGIS 10.8. The intervals reflect the actual data distribution characteristics of each time period.

References

  1. Baumann, F. The Next Frontier—Human Development and the Anthropocene: UNDP Human Development Report 2020. Environ. Sci. Policy Sust. Dev. 2021, 63, 34–40. [Google Scholar] [CrossRef]
  2. Tang, R.; Wang, Y.; Li, C. Theoretical Construction of People’s Livelihood Development Based on Being, Livelihood and Living: On the Political Economy of Socialism with Chinese Characteristics. Chin. Econ. Stud. 2022, 2, 14–27. [Google Scholar] [CrossRef]
  3. Central Committee of the Communist Party of China; State Council of the People’s Republic of China. Outline of the Yellow River Basin Ecological Protection and High-Quality Development Plan; Xinhua News Agency: Beijing, China, 2021. Available online: https://www.gov.cn/zhengce/2021-10/08/content_5641438.htm (accessed on 6 January 2026).
  4. Shi, Y.; Zhan, G. Index Construction, Influencing Factors and Promotion Strategies of High-Quality Development of Cultural Tourism Industry’s Integration: A Case Study of Jiangsu Province. Nanjing Soc. Sci. 2021, 7, 165–172. [Google Scholar] [CrossRef]
  5. Wu, Q.; Jiang, J. Industrial Integration, Spatial Spillover, and Regional Economic Growth. Mod. Econ. Res. 2021, 2, 67–78. [Google Scholar] [CrossRef]
  6. Tang, R. Efficiency Evaluation and Motivation of Culture and Tourism Industry Integration in China: On Spatial Dubin Model and Threshold Regression. J. Nanjing Univ. Financ. Econ. 2022, 2, 23–33. [Google Scholar]
  7. Xiao, J.; Shi, X. The Impact of Cultural and Tourism Integration on Social Well-being: A Case Study of Yangzhou. Tour. Trib. 2019, 34, 6–8. [Google Scholar] [CrossRef]
  8. Stiglitz, J.E.; Sen, A.; Fitoussi, J. Report by the Commission on the Measurement of Economic Performance and Social Progress; French Government: Paris, France, 2009; pp. 1–292.
  9. Chen, M.; Zhou, Y.; Tang, Q.; Liu, Y. New-type Urbanization, Residents’ Well-Being, and the Response of Territorial Spatial Planning. J. Nat. Resour. 2020, 35, 1273–1287. [Google Scholar] [CrossRef]
  10. Tang, R. The China Well-Being Minsheng Development Report 2012; Homa & Sekey Books: Paramus, NJ, USA, 2014; ISBN 978-1-931907-94-1. [Google Scholar]
  11. Burk, A. A Reformulation of Certain Aspects of Welfare Economics. Q. J. Econ. 1938, 52, 310–334. [Google Scholar] [CrossRef]
  12. Saikia, U.; Dasvarma, G.; Chalmers, J. Chapter 13—Methods of Measuring Human Well-Being and Human Development. In Handbook of Statistics; Srinivasa Rao, A.S.R., Rao, C.R., Eds.; Elsevier: Amsterdam, The Netherlands, 2018; Volume 39, pp. 545–575. [Google Scholar] [CrossRef]
  13. Ma, X.; Sun, Y. Research on the Adaptation of Tourism Industry Development and People’s Livelihood and Well-being: A Case Study of Zhangjiajie. Tour. Sci. 2024, 38, 1–19. [Google Scholar] [CrossRef]
  14. Su, L.; Tang, B. Destination Resident Quality-of-Life: Literature Review and Future Prospects. Tour. Trib. 2020, 35, 78–95. [Google Scholar] [CrossRef]
  15. Huang, Z.; Li, J. Influence of Land Acquisition for Rural Tourism on the Well-Being of Landless Farmers Based on the Empirical Analysis of PSM Model. Resour. Sci. 2021, 43, 171–184. [Google Scholar] [CrossRef]
  16. Horita, Y. Urban Development and Tourism in Japanese Cities. Tour. Plan. Dev. 2018, 15, 26–39. [Google Scholar] [CrossRef]
  17. Xu, R.; Wu, Y.; Shi, J. Factors Influencing the Residents’ Subjective Well-Being from the Perspective of Tourism Perception: An Empirical Study on Jiuzhaigou National Nature Reserve. J. Nanjing Tech Univ. (Soc. Sci. Ed.) 2017, 16, 104–114. [Google Scholar]
  18. Wang, Z.; Zhang, X. A Research on the Dynamic Response and Coordination Effect of Provincial Tourism Development and the Residents’ Well-Being in China. Tour. Sci. 2023, 37, 1–19. [Google Scholar] [CrossRef]
  19. Peng, Y.; Liu, W.; Xiong, C.; Bai, X. The Mechanism and Empirical Testing of the Impact of Cultural and Tourism Integration on Common Prosperity. J. Resour. Ecol. 2024, 15, 1027–1038. [Google Scholar] [CrossRef]
  20. Zhang, C.; Zhao, L.; Song, X.; Zhang, Q.; Zhang, X. Spatio-Temporal Coupling Characteristics and Interaction Effects of Economic Resilience and Livelihoods and Well-Being: An Analysis of 78 Cities in the Yellow River Basin. Sust. Cities Soc. 2024, 112, 105638. [Google Scholar] [CrossRef]
  21. Ma, X.; Zhao, J. Impact of Tourism Industry Agglomeration on Livelihood and Welfare: A Case Study of Western Hunan. Prog. Geogr. 2023, 42, 1486–1500. [Google Scholar] [CrossRef]
  22. Fang, L.; Liu, Z.; Jin, C. How Does the Integration of Cultural Tourism Industry Affect Rural Revitalization? The Mediating Effect of New Urbanization. Sustainability 2023, 15, 10824. [Google Scholar] [CrossRef]
  23. Qiu, Q.; Zhang, M. Using Content Analysis to Probe the Cognitive Image of Intangible Cultural Heritage Tourism: An Exploration of Chinese Social Media. ISPRS Int. J. Geo-Inf. 2021, 10, 240. [Google Scholar] [CrossRef]
  24. Ma, X.; Xie, X. Pathway and Mechanism for Improving the Livelihood of Ethnic Minorities Through Cultural and Tourism Integration: A Case Study of Chashan Village in Fuchuan Yao Autonomous County. Econ. Geogr. 2025, 45, 202–212. [Google Scholar] [CrossRef]
  25. Guo, A.; Guo, Y.; Li, H.; Sun, X. Relationship Between Perceived Tourism Impacts and Perceived Quality of Life of Community Residents in Tourist Destinations. World Reg. Stud. 2017, 26, 115–127. [Google Scholar] [CrossRef]
  26. Ye, X.; Zhu, Y. An Empirical Study on Residents’ Perception of Quality of Life in Tourism Communities Against the Background of Rural Revitalization. Hubei Soc. Sci. 2020, 12, 58–70. [Google Scholar] [CrossRef]
  27. Zhang, Y.; Zhang, H.; He, Y.; Ji, L. Social Well-being Effect of Integrated Development of Culture and Tourism: Logical Interpretation Measurement and Mechanism Framework. Econ. Geogr. 2022, 42, 233–240. [Google Scholar] [CrossRef]
  28. Wang, Z.; Cui, Y. Adaptation and Coordination Relationship Between Cultural-Tourism Integration and People’s Well-Being in the Yangtze River Economic Belt and Its Influencing Factors. Geo. Geo-Inf. Sci. 2025, 41, 148–158. [Google Scholar] [CrossRef]
  29. Liu, D.; Jia, Y.; Lu, Y.; Xu, P.; Song, X. An Evolution of the Coupling Relationship Between Cultural Tourism and Residents’ Well-Being and Its Development Models in Eight Ancient Capitals, China. J. Natur. Sci. Hunan Normal Univ. 2025, 48, 72–83. [Google Scholar]
  30. Li, X.; Zhang, Y.; Lu, H.; Lin, M. Coordination Effects and Obstacles in Tourism Development and People’s Livelihood: A Case Study of Coastal Urban Agglomerations in Guangdong, Fujian, and Zhejiang. J. Fujian Norm. Univ. (Nat. Sci.) 2025, 41, 83–91. [Google Scholar]
  31. Wang, Z.; Zhang, X.; Wu, W. Spatial Effects of the Development of the Tourism Industry in the Yangtze River Economic Belt on People’s Livelihood and Well-Being. Prog. Geogr. 2025, 44, 508–524. [Google Scholar] [CrossRef]
  32. Chu, D.; Shao, X.; Lu, L. Adaptation Relationship and Spatiotemporal Interaction Between Public Cultural Service Supply and People’s Well-Being in the Yangtze River Delta Urban Agglomeration. Acta Geogr. Sin. 2025, 80, 3203–3225. [Google Scholar] [CrossRef]
  33. Li, D.; Xu, Q. Culture-Tourism Integration Empowering Rural Revitalization: Intrinsic Mechanism and Empirical Test. J. Anhui Agric. Univ. (Soc. Sci. Ed.) 2024, 33, 20–32. [Google Scholar] [CrossRef]
  34. Yang, S.; Hu, L. Measurement and Spatiotemporal Characteristics of Cultural and Tourism Integration Level at the Prefecture Level in the Context of Digital Empowerment. Econ. Geogr. 2024, 44, 202–211. [Google Scholar] [CrossRef]
  35. Gan, C.; Wang, K. Influence Mechanism and Spatial Effect of Culture and Tourism Integration on Carbon Emission Performance in China. Res. Environ. Sci. 2025, 38, 736–745. [Google Scholar] [CrossRef]
  36. Wen, Z.; Ye, B. Analyses of Mediating Effects: The Development of Methods and Models. Adv. Psychol. Sci. 2014, 22, 731–745. [Google Scholar] [CrossRef]
  37. Shannon, C.E. A mathematical theory of communication. Bell Syst. Tech. J. 1948, 27, 379–423. [Google Scholar] [CrossRef]
  38. ESRI. How Natural Breaks (Jenks) Works. ArcGIS Pro Documentation. Available online: https://pro.arcgis.com/en/pro-app/latest/help/mapping/layer-properties/data-classification-methods.htm (accessed on 6 January 2026).
  39. Jenks, G.F. The Data Model Concept in Statistical Mapping. Int. Yearb. Cartogr. 1967, 7, 186–190. [Google Scholar]
  40. Clark, A.E.; Frijters, P.; Shields, M.A. Relative Income, Happiness, and Utility: An Explanation for the Easterlin Paradox and Other Puzzles. J. Econ. Lit. 2008, 46, 95–144. [Google Scholar] [CrossRef]
  41. Wu, L.; Chen, H. Construction of a Structural Equation Model for Income and Happiness Index: Evidence from Small Towns in Zhejiang Province. Chin. Rural Econ. 2010, 11, 63–74. [Google Scholar] [CrossRef]
  42. Costanza, R. Misconceptions about the valuation of ecosystem services. Ecosyst. Serv. 2024, 70, 101667. [Google Scholar] [CrossRef]
  43. Abdallah, S.; Marks, N. Happy Planet Index. In Encyclopedia of Quality of Life and Well-Being Research; Maggino, F., Ed.; Springer: Cham, Switzerland, 2022. [Google Scholar] [CrossRef]
  44. Zhai, C.; Wang, S. Spatio-temporal difference evolution and scenario simulation of multidimensional well-being in Poyang Lake area based on system dynamics. Acta Ecol. Sin. 2021, 41, 2954–2967. [Google Scholar]
  45. Liu, D.; Chen, X.; Shi, Q.; Yang, M.; Chen, H.; Zhang, H.; Li, N. Research on the Spatial Zoning and Driving Factors of Ecosystem Service Bundles and Human Well-Being in China. Ecol. Indic. 2025, 178, 114082. [Google Scholar] [CrossRef]
  46. Bi, J.; Lu, M.; Liu, F.; Cai, Y.; Wang, Y.; Duan, M.; Li, J.; Li, X.; Yu, D. Multi-Scale Urban Ecosystem Service Changes and Their Impact Mechanisms on Human Well-Being. J. Environ. Manag. 2025, 374, 124117. [Google Scholar] [CrossRef]
  47. Zhu, Y.; Zhou, X.; Gu, J.; Chen, J. Spatial Effect and Driving Mechanism of the Integrated Development of Culture-tourism Industries in the Middle Yangtze River Basin Urban Agglomeration. Prog. Geogr. 2022, 41, 785–796. [Google Scholar] [CrossRef]
  48. Chen, J.; Jiang, J.; Liu, R. Trade-off and Synergy Relationship among Tourism Market, People’s Livelihood and Well-being, and Ecosystem Services: A Case Study of Zhangjiajie. Econ. Geogr. 2025, 45, 224–233. [Google Scholar] [CrossRef]
  49. Wang, J.; Wang, Z. Spatio-temporal Pattern and Spatio Correlation of Integrated Development of Agriculture and Tourism Industries in China. J. Nat. Sci. Hunan Norm. Univ. 2023, 46, 1–10. [Google Scholar]
  50. Ma, B.; Zhang, Y. Four Quadrant Model and Its Application of the Integration of Culture and Tourism. Tour. Trib. 2020, 35, 15–21. [Google Scholar] [CrossRef]
  51. Zhou, Z.; Yang, Q.; Kim, D.-J. An Empirical Study on Coupling Coordination Between the Cultural Industry and Tourism Industry in Ethnic Minority Areas. J. Open Innov. Technol. Market Complex. 2020, 6, 65. [Google Scholar] [CrossRef]
  52. Wang, K.; Zhao, Y.; Tan, J.; Gan, C. A Study on the Social Well-Being Effect of the Integrated Development of China’s Cultural and Tourism Industries. J. Southwest Univ. (Soc. Sci. Ed.) 2024, 50, 214–226. [Google Scholar]
  53. He, X.; Chen, W. The Coordinated Relationship between Digital Economy and Culture-Tourism Industry Integration and Its Influencing Factors of China. Trop. Geogr. 2024, 44, 1314–1328. [Google Scholar] [CrossRef]
  54. Yang, S.; Hu, L.; Lu, Y. Spatio-Temporal Pattern and Driving Mechanism of the Integration of Digital Technology and Cultural-Tourism in Chinese Cities. J. Chongqing Univ. (Soc. Sci. Ed.) 2025, 31, 32–47. [Google Scholar]
  55. Yang, S.; Hu, L.; Wang, Y. Measurement and Evaluation of Collaborative Development of Urban Digital Technology and Cultural Tourism Integration in China and Its Spatiotemporal Pattern. Sci. Geogr. Sin. 2025, 45, 1758–1767. [Google Scholar] [CrossRef]
  56. Yu, B. Economic Growth Effects of Industrial Restructuring and Productivity Improvement: Analysis of a Dynamic Spatial Panel Model with Chinese City Data. China Ind. Econ. 2015, 12, 83–98. [Google Scholar] [CrossRef]
  57. Gan, C.; Zheng, R.; Yu, D. An empirical study on the effects of industrial structure on economic growth and fluctuations in China. Econ. Res. J. 2011, 5, 4–16+31. [Google Scholar]
  58. Zhao, X. Research on the Technology Innovation Effect of New Digital Infrastructure. Stat. Res. 2022, 39, 80–92. [Google Scholar] [CrossRef]
  59. Wang, Q.; Yang, Y.; Chen, X. Research on the Integration of Jiangsu Cultural Industry and the Development of Digital Technology Industry. Hundr. Sch. Arts 2022, 2, 51–56+70. [Google Scholar] [CrossRef]
  60. Lu, F.; Liu, Q.; Wang, P. Spatiotemporal Characteristics of Ecological Resilience and Its Influencing Factors in the Yellow River Basin of China. Sci. Rep. 2024, 14, 16988. [Google Scholar] [CrossRef]
  61. Tian, K.; Peng, B.; Zhang, B.; Wu, F.; Liu, Y. Spatio-temporal Evolution Influencing Factors of Digital Inclusive Finance in the Yellow River Basin. Areal Res. Dev. 2024, 43, 35–40+55. [Google Scholar] [CrossRef]
  62. Qian, L.; Shen, L.; Xiao, R. The Coupling Coordination Between Green Innovation and Industrial Structure Optimization in the Yangtze River Economic Belt and Its Spatial Effect. Commer. Res. 2021, 6, 55–64. [Google Scholar] [CrossRef]
  63. Tobler, W.R. A Computer Movie Simulating Urban Growth in the Detroit Region. Econ. Geogr. 1970, 46, 234–240. [Google Scholar] [CrossRef]
  64. Levinson, A. Environmental Regulatory Competition: A Status Report and Some New Evidence. Natl. Tax. J. 2003, 56, 91–106. [Google Scholar] [CrossRef]
  65. Zhu, L.; Li, Q.; Liu, J. Coordination Relationship Between Tourism Development and Regional Development with Improvement of People’s Livelihood in China. Sci. Geogr. Sin. 2020, 40, 1328–1335. [Google Scholar] [CrossRef]
  66. Wang, K.; Zhang, Y. Zhangjiajie Tourism Development-People’s Livelihood Improvement-Ecological Environment Coupling Coordination Research. J. Cent. South Univ. For. Technol. (Soc. Sci.) 2021, 15, 98–104+120. [Google Scholar] [CrossRef]
  67. Yao, X.; Fang, S. Exploring the Coupling of Ecosystem Services and Human Well-Being: Evidence from Chinese Cities Through Interpretable Machine Learning. Ecol. Indic. 2025, 180, 114315. [Google Scholar] [CrossRef]
Figure 1. The study area.
Sustainability 18 01006 g001
Figure 2. Kernel density plots of CTI and PLW in the YRB. (a) Kernel density estimation of CTI; (b) Kernel density estimation of PLW. The color gradient from blue/purple to yellow/green indicates the magnitude of kernel density values.
Sustainability 18 01006 g002
Figure 3. Spatiotemporal distribution patterns of CTI level in the YRB.
Sustainability 18 01006 g003
Figure 4. Spatiotemporal distribution patterns of PLW level in the YRB.
Sustainability 18 01006 g004
Table 1. Evaluation index system for PLW.
First-Level Indicators Second-Level Indicators (Unit)AttributeWeightSourceReference
Economic Well-BeingGrowth rate of gross domestic product (GDP) (%)Positive0.0631CCSY[1,13,18,21]
Per capita total retail sales of consumer goods (CNY per capita)Positive0.0294CCSY[1,13,18,21]
Per capita disposable income of urban residents (CNY per capita)Positive0.0230CCSY[1,13,18,21]
Per capita disposable income of rural residents (CNY per capita)Positive0.0210CCSY[1,13,18,21]
Per capita consumption expenditure of urban residents (CNY per capita)Positive0.0242CCSY[1,13,18,21]
Per capita consumption expenditure of rural residents (CNY per capita)Positive0.0215CCSY[1,13,18,21]
Ratio of per capita disposable incomes of urban and rural residents (%)Negative0.0048CCSY[1,13,18,21]
Social Well-BeingNumber of employed people (persons)Positive0.1052CCSY[1,13,18,28]
Coverage rate of urban basic endowment insurance (%)Positive0.0378CCSY[1,13,18,28]
Coverage rate of unemployment insurance (%)Positive0.0293CCSY[1,13,18,28]
Urban registered unemployment rate (%)Negative0.0509CCSY[1,13,18,28]
Proportion of social security and employment expenditure within fiscal expenditure (%)Positive0.0263CFSY[1,13,18,28]
Per capita daily domestic water consumption (liters)Positive0.0204CCSY[1,13,18,28]
Gas penetration rate (%)Positive0.0028CCSY[1,13,18,28]
Health Well-BeingProportion of health expenditure in fiscal expenditure (%)Positive0.0397CFSY[1,13]
Number of health institutions per 10,000 people (units per 10,000 people)Positive0.0529CHSY[1,13]
Number of hospital beds per 10,000 people (beds per 10,000 people)Positive0.0167CHSY[1,13]
Number of licensed (assistant) physicians per 10,000 people (persons per 10,000 people)Positive0.0175CHSY[1,13]
Mortality rate (%)Negative0.0002CHSY[1,13]
Cultural and Educational Well-BeingStudent–teacher ratio in general primary and secondary schools (%)Negative0.0049CCSY[1,13,28,32]
Number of college students per 10,000 people (person)Positive0.0752CCSY[1,13,28,32]
Per capita collections of public libraries (volumes per 100 people)Positive0.1477PSYC[1,13,28,32]
Proportion of scientific and technological expenditure within fiscal expenditure (%)Positive0.0590CFSY[1,13,28,32]
Proportion of educational expenditure within fiscal expenditure (%)Positive0.0076CFSY[1,13,28,32]
Number of employees in the education industry (10,000 persons)Positive0.0389CCSY[1,13,28,32]
Ecological Well-BeingAnnual average concentration of fine particulate matter (PM2.5) (μg/m3)Negative0.0015CESY[13,28,31]
Harmless treatment rate of domestic waste (%)Positive0.0031CCSY[13,28,31]
Centralized treatment rate of sewage treatment plants (%)Positive0.0026CCSY[13,28,31]
Green coverage rate of built-up areas (%)Positive0.0023CCSY[13,28,31]
Per capita park green space area (square meters per capita)Positive0.0181CCSY[13,28,31]
Proportion of days with good air quality (%)Positive0.0293CESY[13,28,31]
Comprehensive utilization rate of industrial solid waste (%)Positive0.0228CESY[13,28,31]
Notes: Weights were determined using the entropy method, which objectively assigns weights based on the degree of variation in the data across observations. CCSY = China City Statistical Yearbook; CFSY = China Fiscal Statistical Yearbook; CHSY = China Health Statistics Yearbook; PSYC = Statistical Yearbooks of Prefecture-level Cities in the YRB; CESY = China Environmental Statistics Yearbook/Ministry of Ecology and Environment. The same abbreviations and weighting approach apply to Table 2 and Table 3. The “Reference” column indicates the basis in the literature for the attribute direction (positive or negative) of each indicator. Positive indicators are those where higher values represent better well-being outcomes, while negative indicators are those where lower values represent better outcomes. The classification follows established well-being measurement frameworks including the UNDP Human Development Index [1] and multi-dimensional PLW evaluation studies [13,18,21,28,31,32].
Table 3. Definition and explanation of control variables.
SymbolVariableMeasurement MethodSource
UrUrbanization RateUrban permanent population/Total populationCCSY
FsrFiscal Self-Sufficiency RateGeneral public budget revenue/General public budget expenditureCFSY
OpenOpening-Up LevelTotal import and export volume of goods/GDPCCSY
FinFinancial Development LevelYear-end balance of loans from financial institutions/GDPCCSY
TecTechnological Innovation Capacityln(1 + per capita number of authorized patents)SCED
Notes: See Table 1 notes for abbreviations.
Table 4. Results of benchmark regression analysis.
VariablesOLSFESYS-GMM
CTI0.323 *** (0.026)0.380 *** (0.035)0.130 *** (0.007)
PLW(t−1) 0.873 *** (0.007)
Ur−0.023 *** (0.010)−0.070 *** (0.016)0.018 *** (0.001)
Fsr−0.006 *** (0.009)−0.053 *** (0.013)0.018 *** (0.001)
Open−0.079 *** (0.009)−0.086 *** (0.010)0.025 *** (0.002)
Fin0.010 *** (0.001)0.010 *** (0.001)0.001 *** (0.000)
Tec0.033 *** (0.006)0.033 ** (0.001)0.007 *** (0.000)
Constant 0.094 *** (0.006)0.133 *** (0.009)−0.016 *** (0.001)
AR (1) 0.000
AR (2) 0.109
Hansen Test 0.263
N975975825
R-squared0.5960.433
Notes: Standard errors are reported in parentheses. ** and *** indicate statistical significance at the 5% and 1% level, respectively. R-squared denotes the goodness of fit, while AR (1), AR (2), and the Hansen Test report p-values.
Table 5. Heterogeneity analysis results.
VariablesFEUQR
UpstreamMidstreamDownstreamQ = 0.20Q = 0.40Q = 0.60Q = 0.80
CTI0.517 *** (0.073)0.135 *** (0.060)0.228 *** (0.041)0.081 *** (0.024)0.164 *** (0.028)0.222 *** (0.025)0.318 *** (0.035)
Control VariablesControlledControlledControlledControlledControlledControlledControlled
Constant 0.157 *** (0.016)0.150 *** (0.012)0.042 *** (0.014)0.075 *** (0.012)0.074 *** (0.009)0.072 *** (0.010)0.086 *** (0.018)
N234312429975975975975
R-squared0.4790.4400.7180.5320.4240.3950.428
Notes: Standard errors are reported in parentheses. *** indicates statistical significance at the 1% level. FE = Fixed Effects model; UQR = Unconditional Quantile Regression.
Table 6. Robustness analysis results.
Variables(1) Excluding Partial Years(2) Selecting Partial Samples
CTI0.060 *** (0.022)0.206 *** (0.056)
PLW(t−1)0.882 *** (0.021)0.816 *** (0.050)
Constant 0.025 *** (0.009)−0.024 *** (0.012)
AR (1)0.0090.000
AR (2)0.1070.167
Hansen Test0.2120.302
N525300
Notes: Standard errors are reported in parentheses. *** indicates statistical significance at the 1% level. AR (1), AR (2), and the Hansen Test report p-values.
Table 7. Mediation effect test results (industrial structure optimization as mediator).
Variables(1) PLW(2) Ind(3) PLW
PLW(t−1)0.873 *** (0.007) 0.838 *** (0.007)
Indt−1 0.761 *** (0.003)
CTI0.130 *** (0.007)1.415 *** (0.071)0.115 *** (0.005)
Ind 0.008 *** (0.000)
Ur0.018 *** (0.001)0.171 *** (0.009)0.016 *** (0.002)
Fsr0.018 *** (0.001)−0.704 *** (0.009)0.028 *** (0.001)
Open0.025 *** (0.002)−0.115 *** (0.023)0.026 *** (0.002)
Fin0.001 *** (0.000)0.043 *** (0.003)0.001 *** (0.000)
Tec0.007 *** (0.000)−0.048 *** (0.001)0.007 *** (0.000)
Constant−0.016 *** (0.001)0.442 *** (0.011)−0.020 *** (0.001)
AR (1)0.0000.0040.000
AR (2)0.1090.1070.122
Hansen Test0.2630.2840.230
N825825825
Notes: Standard errors are reported in parentheses. *** indicates statistical significance at the 1% level. AR (1), AR (2), and the Hansen Test report p-values.
Table 8. Mediation effect test results (digital infrastructure as mediator).
Variables(1) PLW(2) Dig(3) PLW
PLW(t−1)0.873 *** (0.007) 0.829 *** (0.005)
Digt−1 0.746 *** (0.001)
CTI0.130 *** (0.007)−0.077 *** (0.003)0.136 *** (0.007)
Dig 0.078 *** (0.003)
Ur0.018 *** (0.001)−0.109 *** (0.002)0.023 *** (0.002)
Fsr0.018 *** (0.001)0.032 *** (0.002)0.010 *** (0.002)
Open0.025 *** (0.002)0.002 *** (0.001)0.023 *** (0.002)
Fin0.001 *** (0.000)0.001 *** (0.000)0.001 *** (0.000)
Tec0.007 *** (0.000)0.014 *** (0.000)0.007 *** (0.000)
Constant−0.016 *** (0.001)0.030 *** (0.000)−0.009 *** (0.001)
AR (1)0.0000.0040.000
AR (2)0.1090.1170.124
Hansen Test0.2630.2370.230
N825825825
Notes: Standard errors are reported in parentheses. *** indicates statistical significance at the 1% level. AR (1), AR (2), and the Hansen Test report p-values.
Table 9. Regional heterogeneity of mediation effects (industrial structure optimization as mediator).
VariablesUpstreamMidstreamDownstream
(1) Ind(2) PLW(3) Ind(4) PLW(5) Ind(6) PLW
PLW(t−1) 0.617 *** (0.062) 0.959 *** (0.030) 0.822 *** (0.021)
Indt−10.695 *** (0.017) 0.693 *** (0.012) 0.694 *** (0.021)
CTI1.267 *** (1.181)0.264 *
(0.145)
1.766 *** (0.312)0.088 ***
(0.025)
1.483 *** (0.118)0.117 ***
(0.016)
Ind 0.005 **
(0.002)
−0.013 ***
(0.003)
0.006 **
(0.002)
Constant0.684 *** (0.145)−0.025 *
(0.014)
0.259 *** (0.039)0.001
(0.004)
0.087 *** (0.025)−0.024 *
(0.003)
AR (1)0.0080.0080.0070.0000.0000.000
AR (2)0.2870.4510.4510.5510. 3000.471
Hansen Test0.1960.1820.1600.1210.2330.243
N198198264264363363
Notes: Standard errors are reported in parentheses. *, **, and *** indicate statistical significance at the 10%, 5%, and 1% levels, respectively. AR (2) and the Hansen Test report p-values.
Table 10. Regional heterogeneity of mediation effects (digital infrastructure as mediator).
VariablesUpstreamMidstreamDownstream
(1) Dig(2) PLW(3) Dig(4) PLW(5) Dig(6) PLW
PLW(t−1) 0.642 *** (0.094) 0.785 *** (0.028) 0.829 *** (0.022)
Digt−10. 864 *** (0.016) 0.787 *** (0.017) 0.604 *** (0.002)
CTI0.079
(0.061)
0.200 *
(0.124)
−0.144 *** (0.023)0.092 *
(0.021)
−0.185 *** (0.008)0.132 ***
(0.019)
Dig 0.153 ***
(0.057)
0.177 ***
(0.022)
0.047 ***
(0.008)
Constant0.082 *** (0.07)0.012 *
(0.014)
0.015 *** (0.145)−0.006 *
(0.004)
0.012 *** (0.003)−0.024 *
(0.005)
AR (1)0.0320.0130.0070.0000.0480.000
AR (2)0.2040.9030.3070.2080.2510.405
Hansen Test0.1960.2030.2180.1600.1790.174
N198198264264363363
Notes: Standard errors are reported in parentheses. *, and *** indicate statistical significance at the 10%, and 1% levels, respectively. AR (2) and the Hansen Test report p-values.
Table 11. Global Moran’s I and test results of CTI and PLW in the YRB from 2011 to 2023.
YearCTIPLW
Moran’s IZscoresp-ValueMoran’s IZscoresp-Value
20110.1852.6990.0070.2573.4540.001
20120.1772.5790.0100.2843.8040.000
20130.1862.6790.0070.2803.7600.000
20140.1612.3230.0200.2803.7600.000
20150.1692.4210.0150.3024.0420.000
20160.2062.9140.0040.3224.2950.000
20170.1912.7180.0070.2623.5450.000
20180.1802.6010.0090.2613.5440.000
20190.1732.4940.0130.2283.1240.002
20200.1081.6620.0960.1552.1890.029
20210.0821.2540.2100.0821.2270.220
20220.1321.9700.0490.1902.6340.008
20230.1482.1880.0290.1982.7320.006
Table 12. SDM estimation results.
Variables(1) SEM(2) SAR(3) SDM
CTI0.104 *** (0.024)0.103 *** (0.024)0.101 *** (0.024)
Ur−0.015 ** (0.007)−0.014 * (0.007)−0.019 ** (0.007)
Fsr−0.006 (0.009)−0.005 (0.008)−0.020 ** (0.010)
Open−0.011 * (0.006)−0.012 * (0.006)−0.008 (0.007)
Fin0.002 *** (0.001)0.002 *** (0.001)0.002 ** (0.001)
Tec0.007 *** (0.001)0.007 *** (0.001)0.008 *** (0.001)
W × CTI −0.104 ** (0.045)
W × Ur 0.029 * (0.017)
W × Fsr 0.056 *** (0.017)
W × Open −0.009 (0.012)
W × Fin −0.002 * (0.002)
W × Tec −0.002 (0.002)
rho 0.102 *** (0.040)0.126 *** (0.040)
lambda0.117 *** (0.040)
sigma2_e 0.001 *** (0.000)0.001 *** (0.000)
R-squared0.5240.5530.532
Log-likelihood2835.2522834.3792843.8341
N975975975
Notes: Standard errors are reported in parentheses. *, **, and *** indicate statistical significance at the 10%, 5%, and 1% levels, respectively. W× denotes spatial lag terms; rho = spatial autoregressive coefficient; lambda = spatial error coefficient; sigma2_e = variance of error term.
Table 13. Decomposition of SDM effects.
VariableDirect EffectIndirect EffectTotal Effect
CTI0.094 *** (0.024)0.145 *** (0.020)0.239 *** (0.021)
Ur−0.011 (0.007)0.061 (0.043)0.051 (0.044)
Fsr−0.013 (0.009)−0.120 * (0.068)−0.133 * (0.071)
Open−0.015 ** (0.006)−0.068 * (0.040)−0.083 ** (0.041)
Fin0.002 ** (0.001)−0.001 (0.005)0.001 ** (0.005)
Tec0.008 *** (0.001)0.015 (0.010)0.023 ** (0.010)
Notes: Standard errors are reported in parentheses. *, **, and *** indicate statistical significance at the 10%, 5%, and 1% levels, respectively.
Disclaimer/Publisher’s Note: The statements, opinions and data contained in all publications are solely those of the individual author(s) and contributor(s) and not of MDPI and/or the editor(s). MDPI and/or the editor(s) disclaim responsibility for any injury to people or property resulting from any ideas, methods, instructions or products referred to in the content.