


Abstract
Monitoring whether agricultural expansion advances over native vegetation and legally protected land is central to assessing the sustainability of commodity frontiers. This study reconstructs four decades (1985–2024) of soybean expansion in the MATOPIBA region of Piauí, Brazil, from annual 30 m land-cover maps, and quantifies its overlap with the protection instruments of the Rural Environmental Registry (CAR) and with strictly protected conservation units. The region holds 32.6% of the state’s territory but accounts for 41.1% of the gross loss of native vegetation recorded in Piauí. Only 23.7% of the 2024 soybean area was converted directly from native vegetation in a single annual step, yet 98.9% of it carried native vegetation in 1985, and the median interval between clearing and the first soybean season is three years: expansion over previously cleared land is largely expansion over land cleared in the preceding seasons. Resolving overlaps between declarations reduces the area under protection instruments from an apparent 40.2% of the region to a unique 34.5%. Soybean overlaps were declared Legal Reserves and Permanent Preservation Areas, unregistered land, and the Uruçuí-Una Ecological Station, where a 6001 ha complex occupies 4.6% of the unit and was confirmed against 10 m imagery. These indicate potential non-compliance to be verified, not adjudicated violations, and support anchoring deforestation-free supply-chain screening on the date of native vegetation loss.
1. Introduction
Soybean is one of the most consequential commodities of the contemporary global economy, functioning above all as the main source of protein for animal feed. Its expansion rests on real agronomic and economic advantages: as a legume, soybean fixes atmospheric nitrogen through symbiosis with rhizobia, reducing fertiliser requirements, and it integrates well into crop-rotation systems and into a stable, well-established international market [1]. Cultivated soybean area in South America more than doubled between 2000 and 2019, the fastest expansion among the world’s major producing regions, and this growth has been consistently associated with the conversion of native ecosystems, either directly or through the displacement of pastures and other land uses toward vegetation frontiers [2,3]. Sustained demand growth, driven largely by rising incomes in China and other emerging economies, indicates that pressure on producing landscapes will persist in the coming decades [2]. From a sustainability perspective, therefore, the relevant question is not whether soybean expands, but where it expands, at the expense of which land covers, and under which governance arrangements.
Brazil became the world’s largest producer and exporter of soybean in 2020 and has since consolidated this position. In 2024, soybean occupied 65% of the country’s total cropland [4]. The core of this production is the Cerrado: in the 2023/24 season alone, 23.84 million hectares of soybean were cultivated within the biome, the equivalent of 12% of its total area [5].
The environmental stakes of this geography are high. The Cerrado is the most species-rich savanna on Earth and a global biodiversity hotspot, yet roughly half of its native cover has already been converted and it remains far less protected than the Amazon [6]. Conversion also compromises the biome’s hydrological functions: field measurements in MATOPIBA show that replacing native vegetation with cropland reduces evapotranspiration and water recycling [7], and modelling studies that combine land-use and climate scenarios project substantial reductions in river flows across Cerrado basins [8]. Empirical evidence further indicates that deforestation intensifies regional warming and rainfall disruption to the point of reducing the productivity of the agriculture that replaces it [9]. Sustaining production on this frontier therefore depends on keeping expansion away from the remaining native vegetation and from the areas that the law sets aside for its protection.
Within the Cerrado, the MATOPIBA region, an acronym formed from the names of the states of Maranhão, Tocantins, Piauí, and Bahia, comprises 337 municipalities formally delimited in 2015 as the target of a federal agricultural development plan and constitutes the most active frontier of soybean expansion in Brazil [10]. The literature on MATOPIBA has documented not only the speed of land-use change but also its contested social outcomes, including land concentration, financialisation of farmland, and the marginalisation of traditional communities [11,12].
The relationship between soybean and deforestation, however, is not static. Recent assessments show that direct conversion of native vegetation to soybean has declined as a share of total crop expansion, with most new fields established over previously cleared land [2,13], although expansion over cleared land can still displace other land uses toward the vegetation frontier, a mechanism of indirect land-use change that is documented in the literature but difficult to quantify at regional scale [3]. This partial decoupling reflects both agronomic factors and governance instruments, yet the instruments in force are markedly asymmetric across biomes: the Amazon Soy Moratorium has measurably reduced the conversion of forest to soybean in the Amazon since 2006 [14], but no equivalent sectoral agreement covers the Cerrado, where legal deforestation allowances remain extensive [15]. The European Union’s Regulation on deforestation-free products (EUDR) adds a further layer of due diligence: operators placing soybean on the European market must demonstrate that it was produced on land not deforested after 31 December 2020 and in compliance with the legislation of the producing country, and plot-level geolocation is one of the elements of that demonstration rather than proof of compliance in itself [16]. Because the regulation adopts a forest definition that leaves most non-forest formations outside its scope, analysts have identified blind spots in its coverage of the Cerrado grasslands and shrublands [17].
Domestically, compliance rests on the instruments of the Brazilian Forest Code operationalised through the Rural Environmental Registry (CAR), notably Legal Reserves (RL) and Permanent Preservation Areas (APP), and on the network of protected areas. The CAR is a self-declaratory registry: the boundaries of properties, Legal Reserves, and Permanent Preservation Areas are drawn by landholders and acquire legal force only after validation by state environmental agencies, a step that has been completed for a small fraction of registrations nationwide [18,19]. The effectiveness of these instruments is under strain: between 2019 and 2024, Brazil lost 1.96 million hectares of native vegetation inside declared Legal Reserves, and in 2024 the Cerrado concentrated 37.1% of all clearing recorded in Legal Reserves and more than half of the loss recorded within Permanent Preservation Areas, while 57,930 hectares were cleared inside conservation units nationwide [20]. Soybean grown on properties that remain unregistered in the CAR represents a further compliance risk, particularly in MATOPIBA [21]. Recent evidence for the region shows that the near doubling of CAR registrations between 2019 and 2025 was not accompanied by a reduction in pressure on native vegetation, indicating that registration alone has been insufficient to curb deforestation [22].
Within this frontier, the Piauí portion of MATOPIBA remains comparatively understudied at fine spatial scale, despite exhibiting one of the most pronounced growth trajectories in the region. Soybean was first recorded in the state in 1982, on only 10 hectares [23]; production then rose from 100,963 tonnes in 2000 to 3,811,694 tonnes in 2024, when Piauí ranked as Brazil’s tenth-largest producer and the third-largest in the Northeast, with a planted area of 956,251 hectares according to official agricultural statistics [24]. Satellite-based mapping for the same year identifies 943,763 hectares of soybean in the 33 municipalities that form the state’s MATOPIBA territory, corresponding to 98.3% of the soybean area mapped in the state [4]; the two figures derive from different sources and definitions (declared planted area versus mapped cultivated extent) and are consistent with each other. Existing assessments of MATOPIBA have either treated the four-state region as a whole or focused on its Bahia, Tocantins, and Maranhão portions; for Piauí, a spatially explicit reconstruction of how much soybean expansion occurred through direct conversion of native vegetation, and of how much of the crop overlaps the protection instruments of the CAR and strictly protected conservation units, has not yet been produced.
This study addresses that gap by reconstructing four decades (1985–2024) of soybean expansion and native-vegetation loss in Piauí’s MATOPIBA at 30 m resolution and by overlaying the resulting maps with the protection instruments of the CAR and with conservation-unit boundaries. Specifically, we ask: (i) How much of the region’s native-vegetation loss corresponds to direct transitions to soybean, and how has the balance between expansion over newly converted land and over previously cleared land evolved? (ii) To what extent do mapped soybean plots overlap the protection instruments of the CAR (Legal Reserves, Permanent Preservation Areas, and land without registration)? (iii) Are soybean plots present inside strictly protected conservation units? (iv) How robust are these overlap estimates to boundary and classification uncertainty? Throughout, we treat mapped overlaps as indicators of potential non-compliance that require administrative or judicial verification, not as confirmed violations. By answering these questions, the study contributes to the measurement and monitoring of land-use sustainability on an active commodity frontier, in line with the targets of Sustainable Development Goal 15 on halting the loss of natural habitats [25], and provides spatially explicit evidence that can inform the prioritisation of CAR validation and enforcement, the risk screening required by deforestation-free supply-chain regulations, and the reorientation of environmental public policies in one of Brazil’s most dynamic agricultural frontiers. The findings refer to the Piauí portion of MATOPIBA and are not extrapolated to the four-state region.
2. Materials and Methods
2.1. Study Area
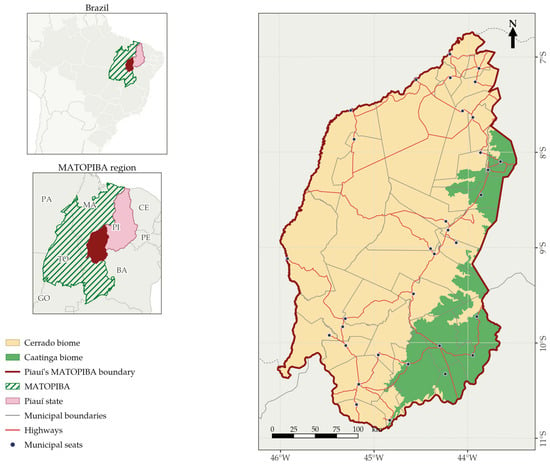
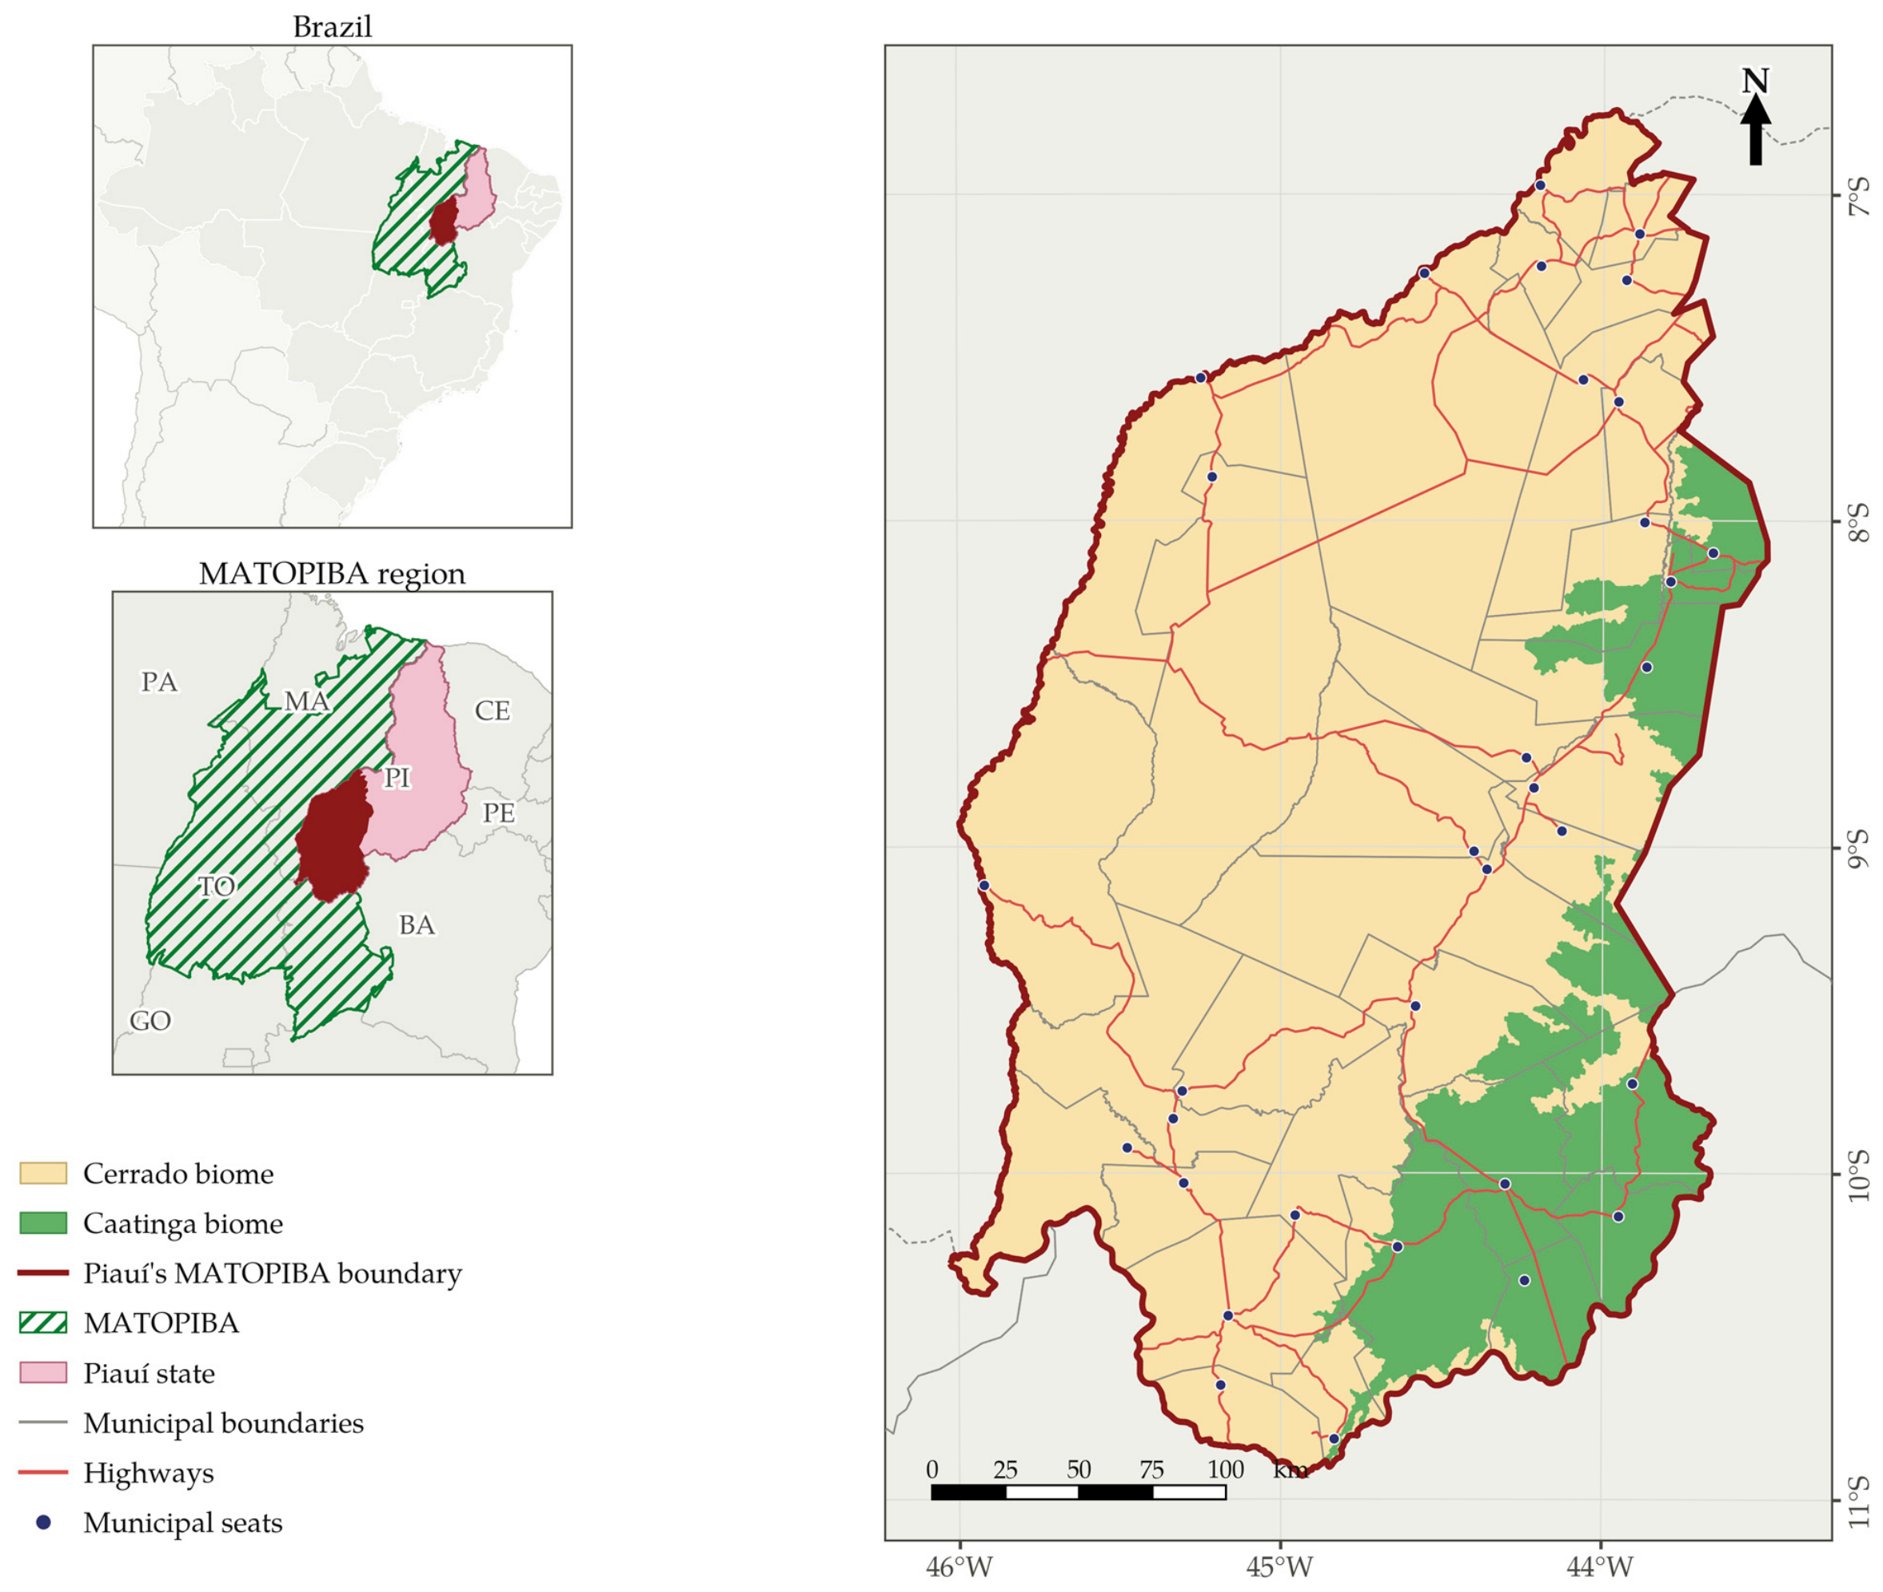
The study area comprises the 33 municipalities of the state of Piauí included in the MATOPIBA agricultural frontier (Figure 1). MATOPIBA was formally delimited by Normative Ruling No. 244/2015 on the basis of 31 geographic microregions defined by the Brazilian Institute of Geography and Statistics (IBGE), and its Agricultural Development Plan (PDA-MATOPIBA) was instituted by Federal Decree No. 8447 of 6 May 2015 and reaffirmed by Decree No. 11,767 of 1 November 2023 [10,26]. The region as a whole spans 337 municipalities across the states of Maranhão, Tocantins, Piauí, and Bahia; its Piauí portion corresponds to 9.8% of MATOPIBA’s municipalities and 14.7% of the municipalities of Piauí.
Figure 1.
Study area: the 33 municipalities of the state of Piauí within the MATOPIBA agricultural frontier, Brazil. Insets: location within Brazil (top) and the four-state MATOPIBA region (bottom). Coordinate system: SIRGAS 2000/UTM zone 23S. Data: IBGE [27]; DNIT [28]; Embrapa [10].
Piauí’s MATOPIBA covers 82,197 km2, or 11.3% of the MATOPIBA region and 32.6% of the state’s territory, in a landscape dominated by the Cerrado biome (82.4% of the area), with the Caatinga occupying the remaining 17.6% along its eastern margin. The resident population is 271,848 inhabitants, at a low demographic density of 3.31 inhabitants per km2 [27]. The region concentrates the municipalities with the largest soybean areas in Piauí, accounting for 98.3% of the state’s soybean area in 2024 [4].
2.2. Data Sources and Pre-Processing
Land-cover data were obtained from Collection 10 of the MapBiomas project, an annual series of wall-to-wall maps of Brazil produced from the Landsat archive at 30 m spatial resolution for the period 1985–2024 and generated on the Google Earth Engine platform [4,29,30]. Soybean is not a subdivision introduced by this study: the collection maps it as an independent land-cover class (code 39), generated by a dedicated classifier and evaluated by its own accuracy assessment, alongside separate classes for sugar cane, rice, cotton, other temporary crops, perennial crops, pasture, forest plantation and mosaic of uses. No aggregation of the agricultural classes into soybean was performed at any stage. The forty annual maps were retrieved as they are distributed, in their native geographic coordinate system, and clipped to the bounding box of the study region without resampling, so that the analysis is carried out on the original 30 m grid of the product.
Data on the protection instruments of the Brazilian Forest Code (Law No. 12,651/2012) [31], namely property boundaries, Legal Reserves and Permanent Preservation Areas, come from the National Rural Environmental Registry System [32], in the April 2025 snapshot, restricted to registrations with active status and processed as described by Almeida et al. [22]: invalid geometries were corrected with a zero-distance buffer and duplicated property records were resolved by hierarchical rules against the federal land cadastres. The resulting layers of Legal Reserves and Permanent Preservation Areas preserve, by construction, the overlaps that exist between declarations of neighbouring or competing landholdings; how these overlaps were treated in the present analysis is described in Section 2.4.
Boundaries of strictly protected conservation units were obtained, for the federal units, from the official layer of the Chico Mendes Institute for Biodiversity Conservation [33] distributed through the Brazilian Spatial Data Infrastructure [34], accessed on 16 September 2026, and, for the state unit, from the Piauí State Secretariat for the Environment and Water Resources. Municipal and state boundaries and the official delimitation of the study region were obtained from IBGE. Independent verification of selected results used Sentinel-2 Level-2A surface reflectance at 10 m resolution [35]. All geoprocessing was carried out in Python 3.11 with the GDAL, Rasterio, GeoPandas, Shapely and SciPy libraries; the vector operations were cross-checked in QGIS 3.40 [36].
Areas were computed on the native geographic grid rather than by reprojection, so as not to introduce resampling artefacts in a pixel-counting analysis. The area of each pixel was obtained analytically on the authalic sphere of the GRS80 ellipsoid as a function of latitude, which over the study region varies from 0.0892 ha in the north to 0.0882 ha in the south; every area reported below is the sum of the individual pixel areas rather than a pixel count multiplied by a nominal value. The study region was delimited by rasterising the official boundary of the 33 municipalities onto the same grid, which yields 8,253,987 ha against the 82,197 km2 of the official vector delimitation, a difference of 0.4% attributable to rasterisation.
2.3. Class Aggregation and Land-Cover Transition Rules
The 34 land-cover classes present in the region were aggregated into nine groups: forest formations (which, in the MapBiomas legend, comprise forest formation and savanna formation, and correspond to the level-1 forest class), non-forest natural formations (grassland, wetland, rocky outcrop and other non-forest natural formations), soybean, other crops, pasture, forest plantation, mosaic of uses, non-vegetated areas and water. Native vegetation is defined as the union of the first two groups. The two are merged for this purpose because the Forest Code protects both, because the savanna and grassland physiognomies of the Cerrado are ecologically continuous and are the formations actually being converted in this region, and because separating them would not isolate a legally distinct category. Their contributions are nevertheless reported separately in the results, and the sensitivity of the conclusions to this choice is examined in Section 2.5.
Land-cover transitions were computed between consecutive years, never by comparing the two ends of the series. For each of the 39 annual pairs, a pixel contributes to the transition matrix only if it carries a valid class in both years; pixels flagged as no data or not observed in either year are excluded from that pair and from the corresponding annual statistics. Loss of native vegetation in year t is defined as a pixel belonging to either native group in t − 1 and to any other group in t, irrespective of the destination class, and the symmetric quantity, regeneration, is reported as well. Gross soybean expansion in year t is the area entering the soybean class in that year, and is decomposed by the class occupied in t − 1; expansion classified as direct conversion is the part whose previous class was native vegetation. Because a pixel can leave and re-enter the soybean class, the areas leaving soybean are accumulated separately and reported, so that gross expansion, reversions and the net area of the crop can be distinguished. The cumulative endpoint matrix between 1985 and 2024 is computed separately and reported in Section 3.3, precisely because it answers a different question from the sum of annual transitions.
A second procedure reconstructs the trajectory of each pixel under soybean in 2024. The first soybean season of a pixel is defined as the earliest year in which it is classified as soybean in that year and also in the following one, a persistence rule that removes single-year oscillations, which are the main source of spurious transitions in annual series at this resolution; in the final year of the series, a single observation is accepted. For each pixel, we record the class in 1985, the year of the first soybean season, the class occupied immediately before it, and the last year in which the pixel carried native vegetation before that season. The interval between these last two quantities is the conversion lag reported in Section 3.3, and the area of soybean in 2024 is decomposed into three mutually exclusive pathways: direct conversion, when the class immediately preceding the first soybean season was native vegetation; indirect conversion, when it was not but the pixel carried native vegetation at some earlier point in the series; and no native vegetation in the series, for pixels that were already under another cover in 1985 and never returned to native vegetation.
2.4. Overlay with Protection Instruments and Conservation Units
The soybean extent of 2024 was intersected with the layers of Legal Reserves, Permanent Preservation Areas and conservation units, each rasterised onto the same 30 m grid. Rasterisation resolves, by construction, the overlaps that exist between individual declarations, so that the area obtained for each category is its unique spatial extent; the sum of the declared polygons is reported alongside it for comparison, and the two were cross-checked against an independent vector union computed in an equal-area projection, which agrees to within 0.4%. Pairwise intersections between categories and the union of all three were computed on the same grid, so that the total protected extent reported in Section 3.1 counts no area more than once.
Soybean cultivated on land not covered by any registered property was quantified from the property layer derived from the registry by Almeida et al. [22], on its own 30 m grid in UTM zone 23S, since that layer encodes the coverage of registered holdings and cannot be reconstructed from the public map products used elsewhere in this study; the corresponding figures are identified as such in Table 1.
Table 1.
Mapped overlap between the 2024 soybean extent and the protection instruments of the Rural Environmental Registry (CAR) in Piauí’s MATOPIBA. Shares are relative to the total 2024 soybean area of the region (943,763 ha). Patch statistics use eight-neighbour connectivity, with the four-neighbour value in parentheses where it differs; the minimum mapping unit is one pixel (0.088 ha). The last column gives the share of the overlapping area retained when the protection layer is eroded by one pixel. Data: [4,22,32].
Patches were defined as connected sets of soybean pixels within each category, using eight-neighbour connectivity, with four-neighbour connectivity computed in parallel as a sensitivity test. The minimum mapping unit is one pixel, approximately 0.088 ha, and no size threshold was applied before labelling. Patches were labelled separately within each category, so that a cultivated area straddling the boundary between two categories is counted as one patch in each of them; patch counts across categories are therefore not additive. For each category we report the number of patches, the share of patches and the share of the overlapping area in three size classes (below 1 ha, between 1 and 10 ha, and above 10 ha), and the size of the largest patch.
Municipal statistics were computed by rasterising the official boundaries of the 33 municipalities onto the same grid and accumulating the areas of each class within each municipality. Concentration was summarised by the share of the six largest producers and by the Gini coefficient of the distribution of soybean area across municipalities. Spatial autocorrelation in the share of municipal territory under soybean was assessed with the global Moran’s I statistic, using a first-order contiguity weight matrix, row-standardised, and a pseudo p-value obtained from 9999 random permutations of the observed values; the local indicator of spatial association was computed for each municipality from the same weights. Municipality-level values are reported in Table S1 of the Supplementary Materials.
2.5. Uncertainty, Sensitivity Analyses and Independent Validation
Three sources of uncertainty are distinguished and treated separately: thematic uncertainty in the land-cover classification, geometric uncertainty in the boundaries of the protection categories, and the administrative or legal uncertainty attached to self-declared data. Only the first two are amenable to quantification here.
For the first, the accuracy assessment published with Collection 10 reports a global accuracy of 93.4% at level 1 for Brazil, with allocation and area disagreements of 5.3% and 1.3%, and per-class accuracies of 96.6% (producer’s) and 95.1% (user’s) for forest formations, 80.2% and 75.9% for herbaceous and shrubby vegetation and 87.7% and 92.4% for farming [37]. A further, more specific limitation of the agricultural classes was quantified by a recent systematic comparison against official agricultural statistics, which found that the dedicated soybean class underestimates planted area by 10.4% nationally and by 31.5% in frontier municipalities, with the generic other-temporary-crops class absorbing the difference [38]. This bias affects the year in which a field is first labelled as soybean, and therefore the conversion lag, but not the endpoint composition; both are reported in Section 3.3 so that the reader can separate them.
For the second, each protection layer was eroded by one pixel and the overlap with soybean recomputed. This approximates the effect of a half-pixel geolocation error on either side of a boundary and gives a lower bound on the overlapping area; the retained fractions are reported in Table 1. The sensitivity of the results to the definition of native vegetation was examined by recomputing the transitions with forest formations alone, excluding the non-forest natural formations, which changes the cumulative direct conversion to soybean by less than 0.5% because the non-forest formations contribute only 1010 ha of the 248,426 ha involved.
Selected results were verified against imagery independent of the Landsat archive on which the classification is built. Sentinel-2 Level-2A scenes covering the 2023/24 cropping season were retrieved from the public archive [35]; digital numbers were converted to surface reflectance using the scale and offset declared in the product metadata, which, since processing baseline 04.00, includes an additive offset that must be applied before computing spectral indices, and pixels flagged as cloud, cloud shadow, cirrus or snow in the scene classification layer were discarded. For each date, the median normalised difference vegetation index was computed separately over the pixels that Collection 10 assigns to soybean and over those it assigns to forest formations and savanna within the same window, so that the phenological signatures of the two can be compared on identical dates. The procedure and its outcome for the Uruçuí-Una Ecological Station are reported in Section 3.5.
During the preparation of this manuscript, the authors used Claude (Anthropic) to assist in writing and debugging the processing and plotting scripts, in translating and drafting the English text from the authors’ original Portuguese manuscript and in language editing. No figure content, data or results were generated by artificial intelligence: all quantities reported here were computed by the scripts described above from the public datasets cited. The authors have reviewed and edited the output and take full responsibility for the content.
3. Results
3.1. Legally Protected Areas: Declared and Unique Extent
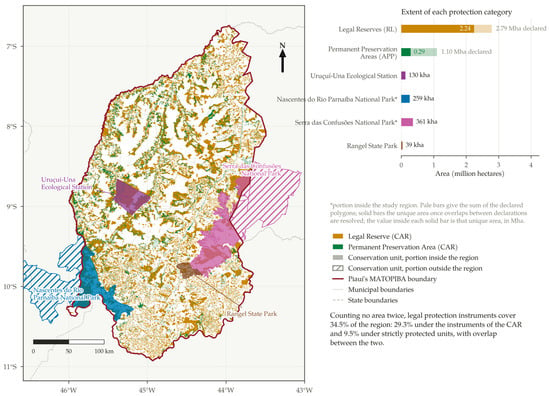
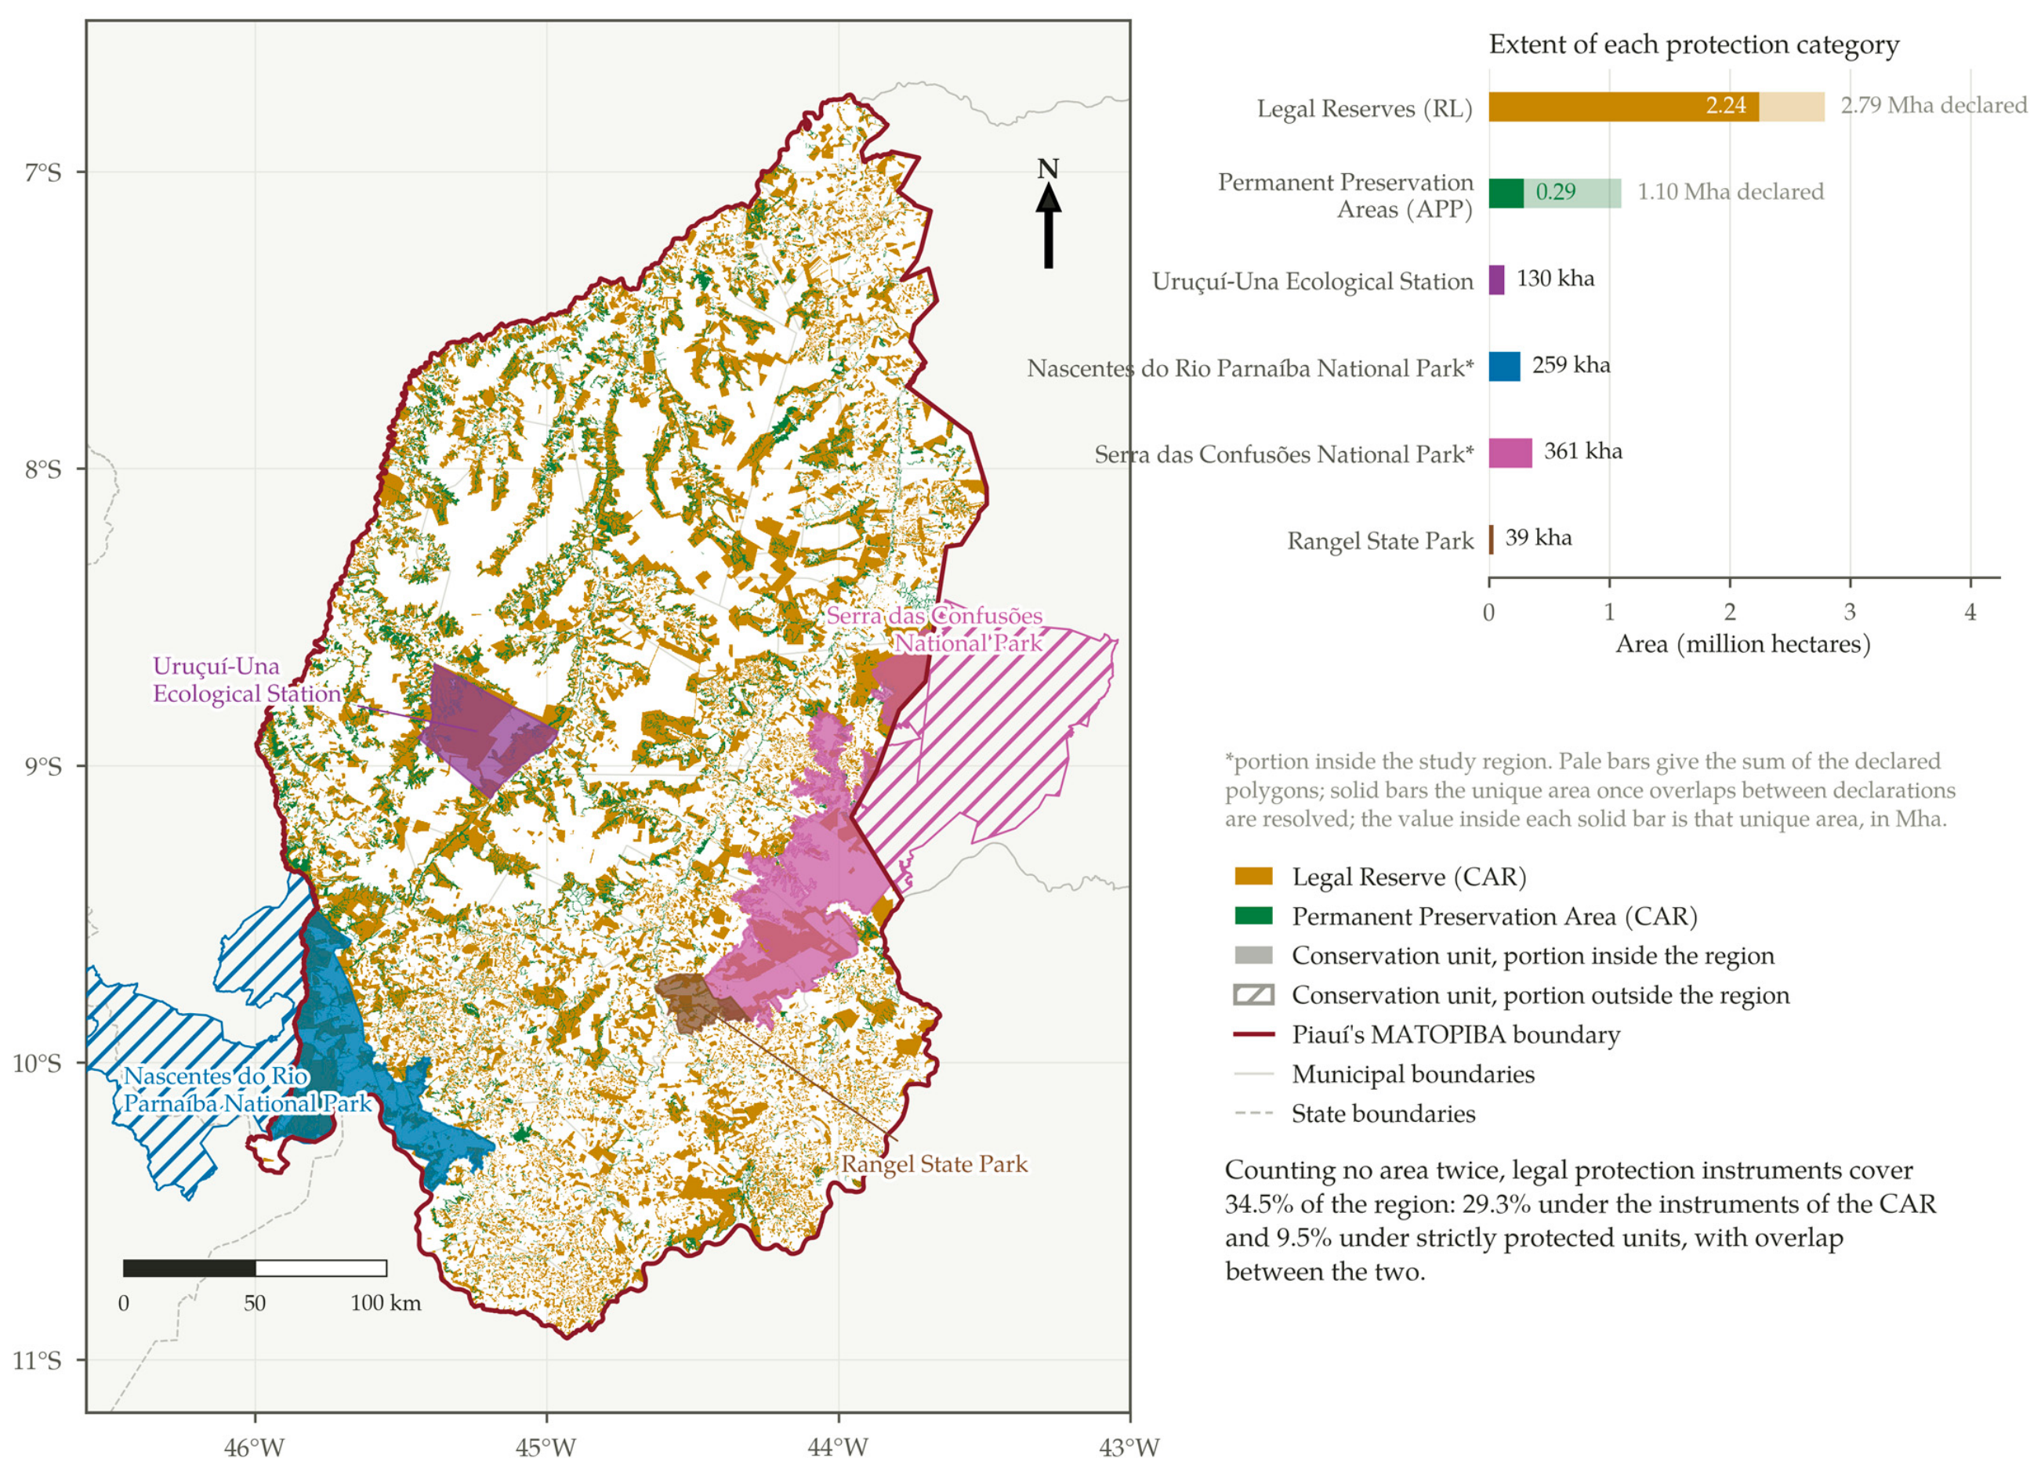
Legal Reserves and Permanent Preservation Areas declared in the Rural Environmental Registry sum to 2,790,061 ha and 1,097,431 ha, respectively, in Piauí’s MATOPIBA. These figures, however, count the same ground more than once, because declarations of neighbouring or competing landholdings overlap. The unique extent occupied by the declared Legal Reserves is 2,234,197 ha, or 80.1% of their summed area, and that of the declared Permanent Preservation Areas is 288,035 ha, or 26.2% of theirs. The duplication is therefore modest for Legal Reserves, which are property-level set-asides, and severe for Permanent Preservation Areas, where several landholders commonly declare the same riparian buffer along a shared watercourse.
Taking unique extents throughout, Legal Reserves cover 27.2% of the region, Permanent Preservation Areas 3.5% and strictly protected conservation units 9.5% (Figure 2). The categories also overlap one another: 116,168 ha are covered by both registry instruments, 345,060 ha of declared Legal Reserves and 20,621 ha of declared Permanent Preservation Areas fall inside conservation units, and 10,871 ha belong to all three. The union of the three categories, in which no hectare is counted twice, amounts to 2,846,023 ha, or 34.5% of the region, against the 40.2% that the simple sum of the three categories would give and the still higher figure that summing declared polygons would produce.
Figure 2.
Legally protected areas in Piauí’s MATOPIBA: Legal Reserves and Permanent Preservation Areas declared in the Rural Environmental Registry, and the four strictly protected conservation units that overlap the region. The side chart compares, for each category, the sum of the declared polygons with the unique area they occupy once overlaps between declarations are resolved. Data: SICAR [32]; ICMBio [34]; SEMARH-PI.
Four strictly protected units overlap the region (Table 2). Two are only partly contained in it: the Nascentes do Rio Parnaíba National Park, of which 259,491 ha lie inside, and the Serra das Confusões National Park, with 361,293 ha. The Uruçuí-Una Ecological Station, with 129,859 ha, and the Rangel State Park, with 38,756 ha, are entirely contained within the region. Their spatial distribution is uneven and concentrated along the southwestern border, the east and the centre-west (Figure 2), sectors that coincide with the most active front of the soybean frontier.
Table 2.
Soybean detected in 2024 inside the four strictly protected conservation units that overlap Piauí’s MATOPIBA. Areas refer to the portion of each unit located inside the study region. Data: [4,34] and SEMARH-PI.
3.2. Soybean Expansion and Native Vegetation Loss, 1985–2024
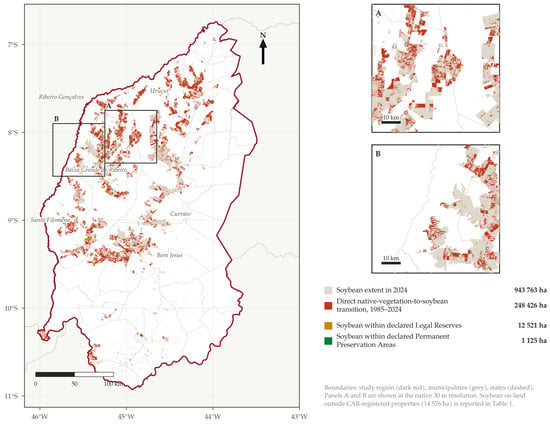
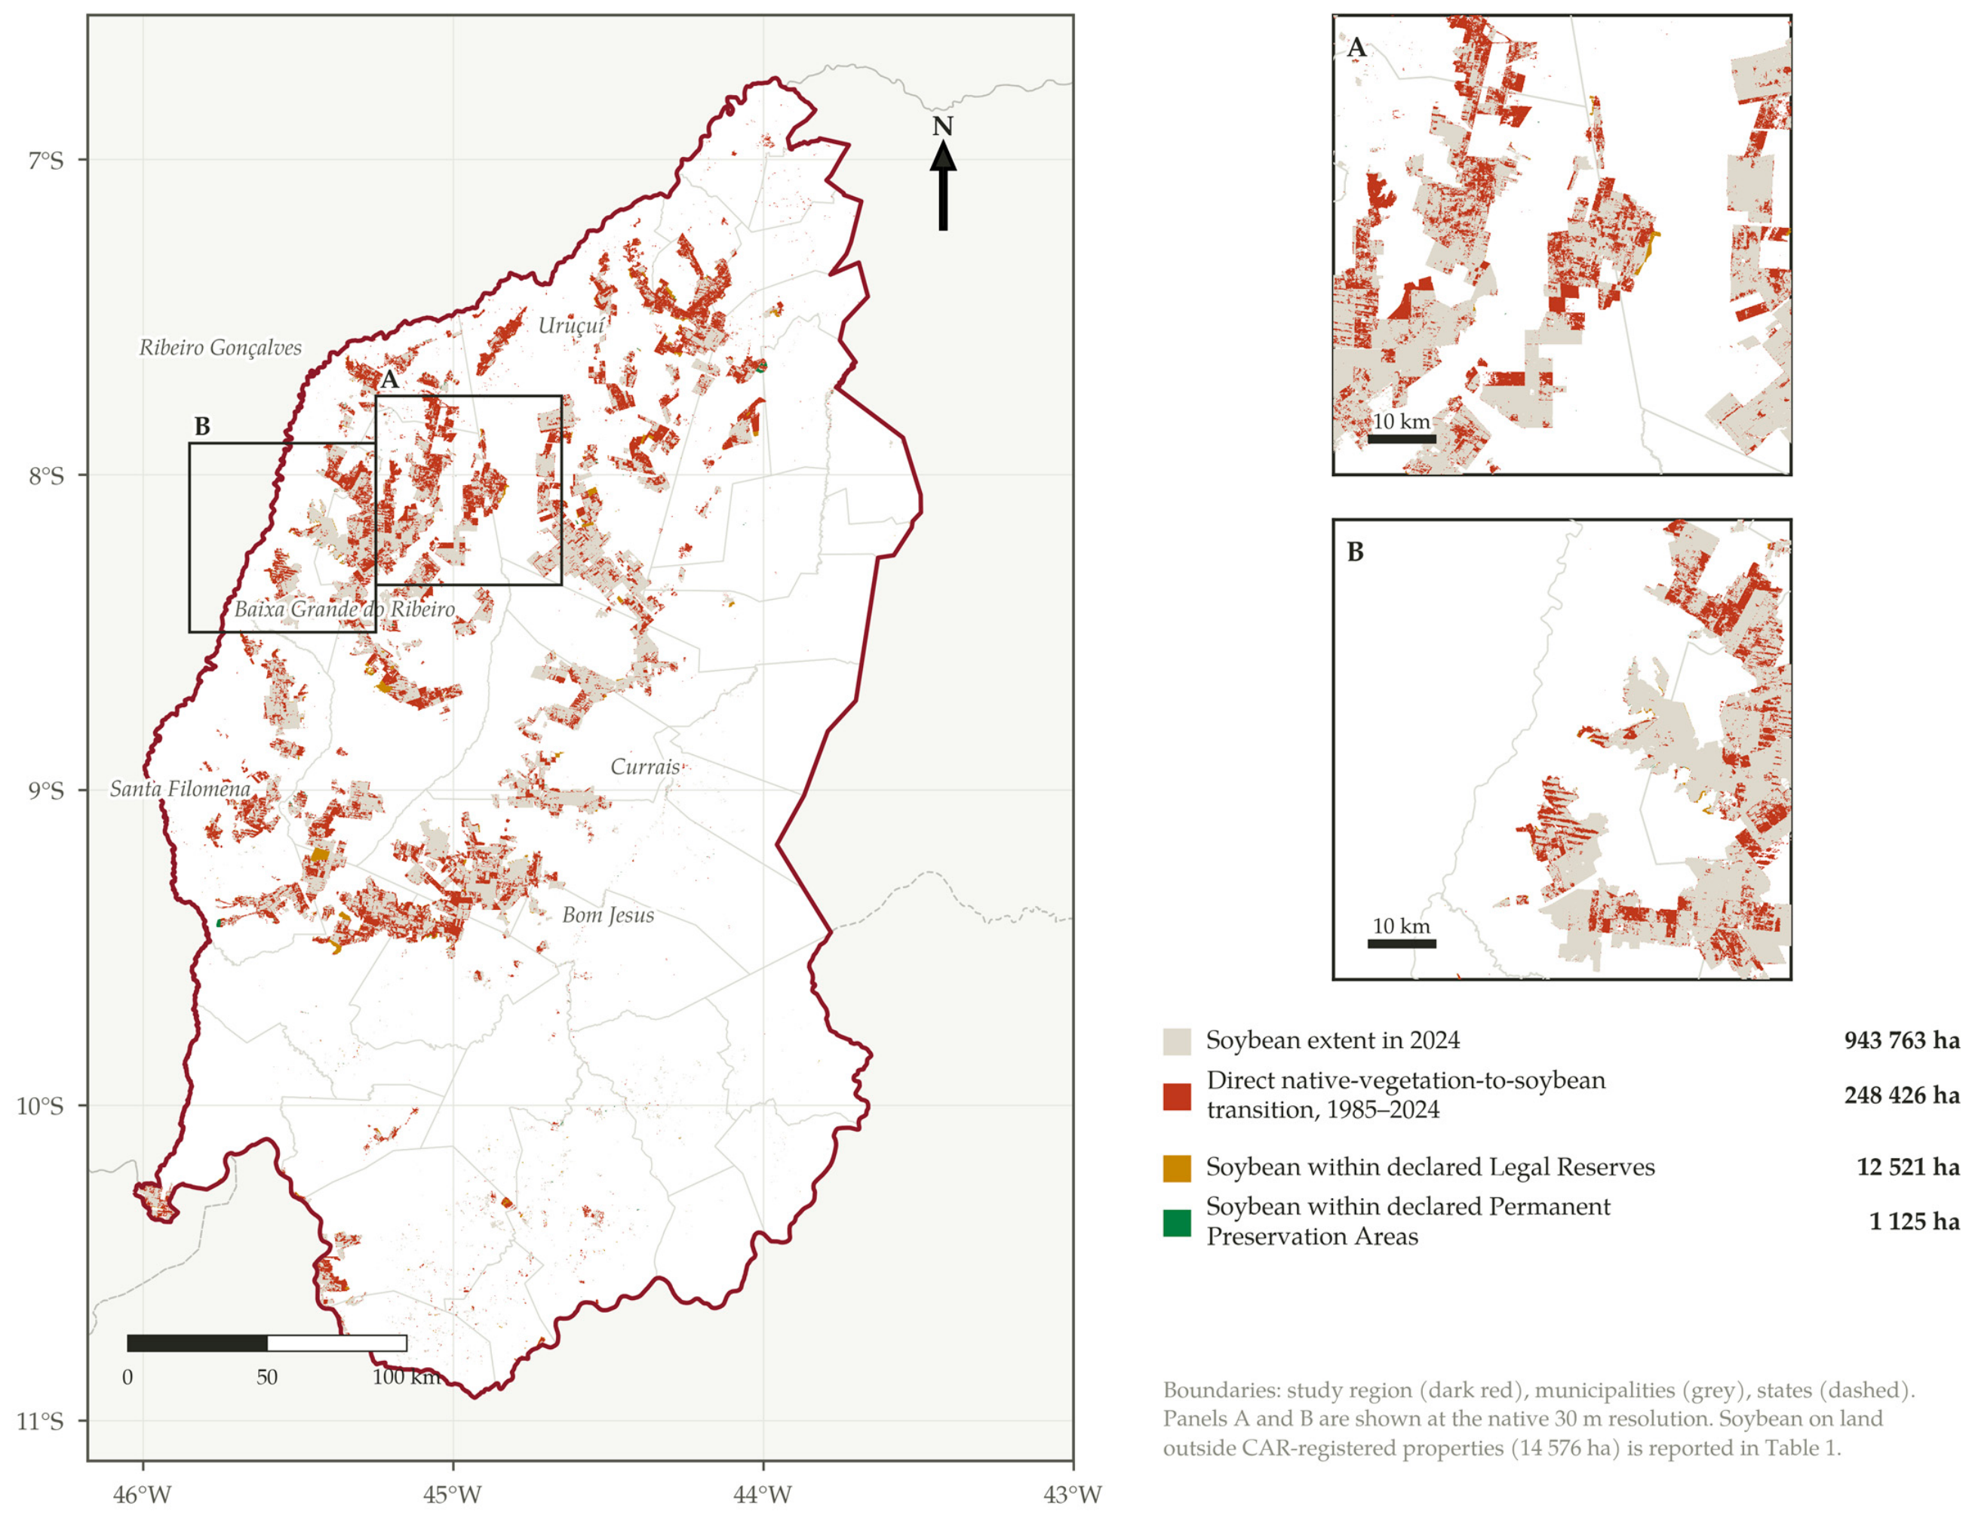
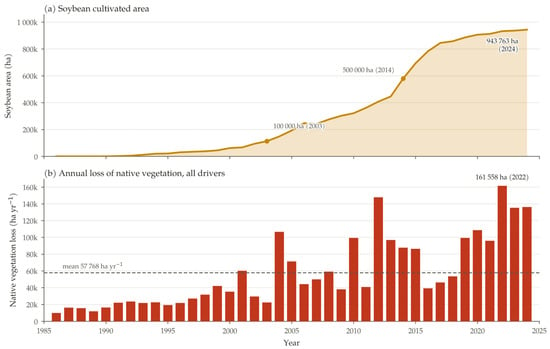
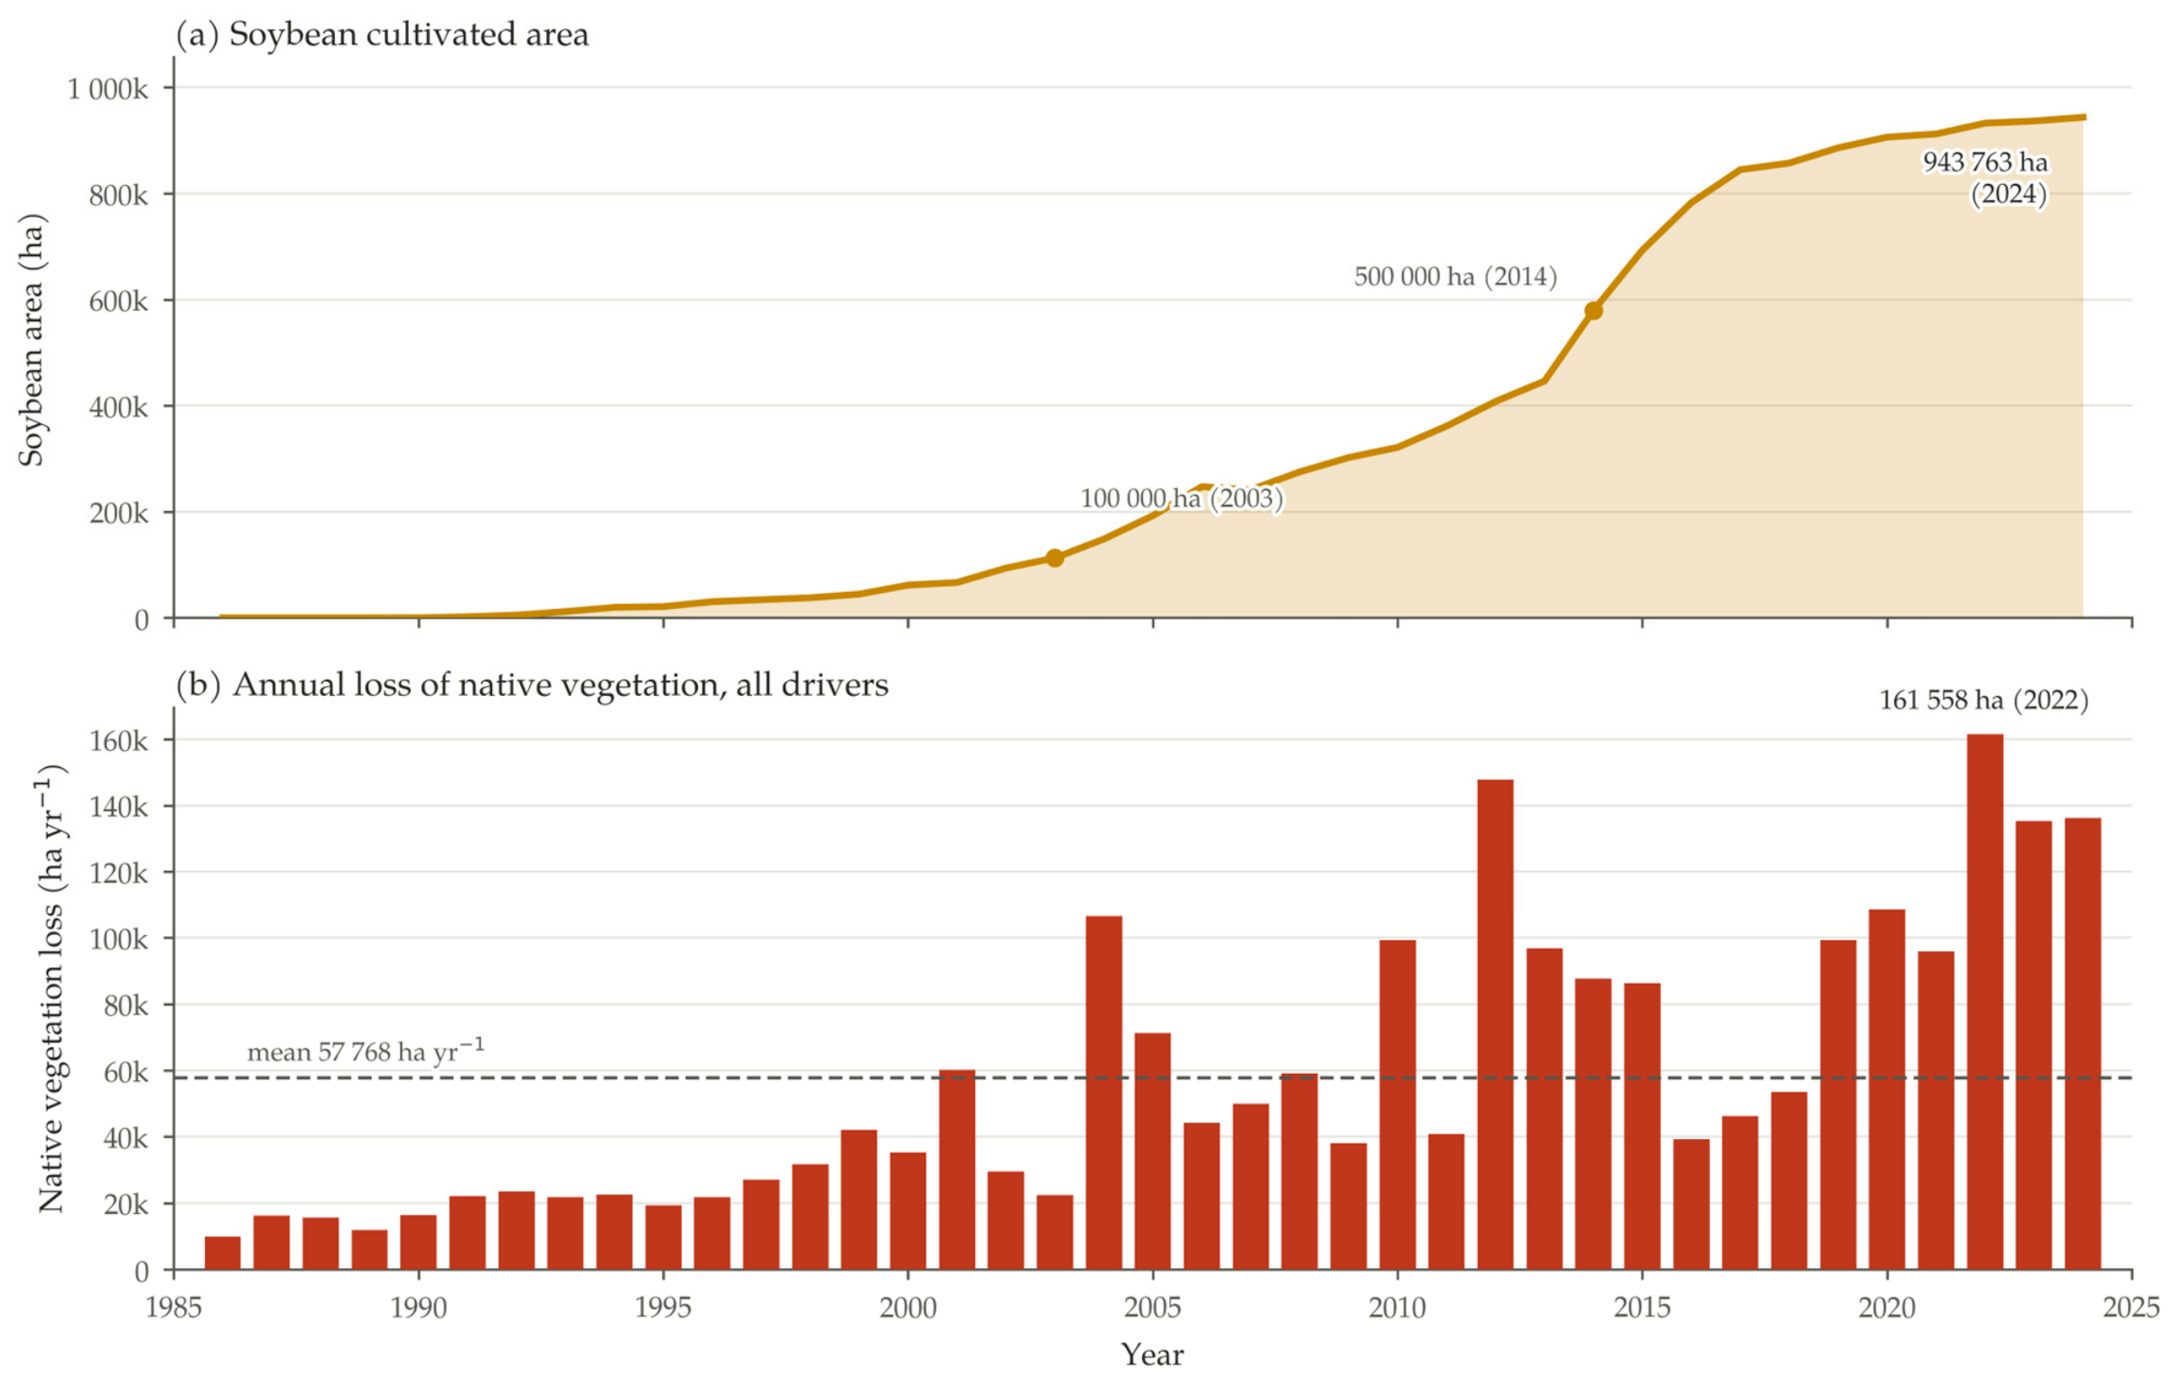
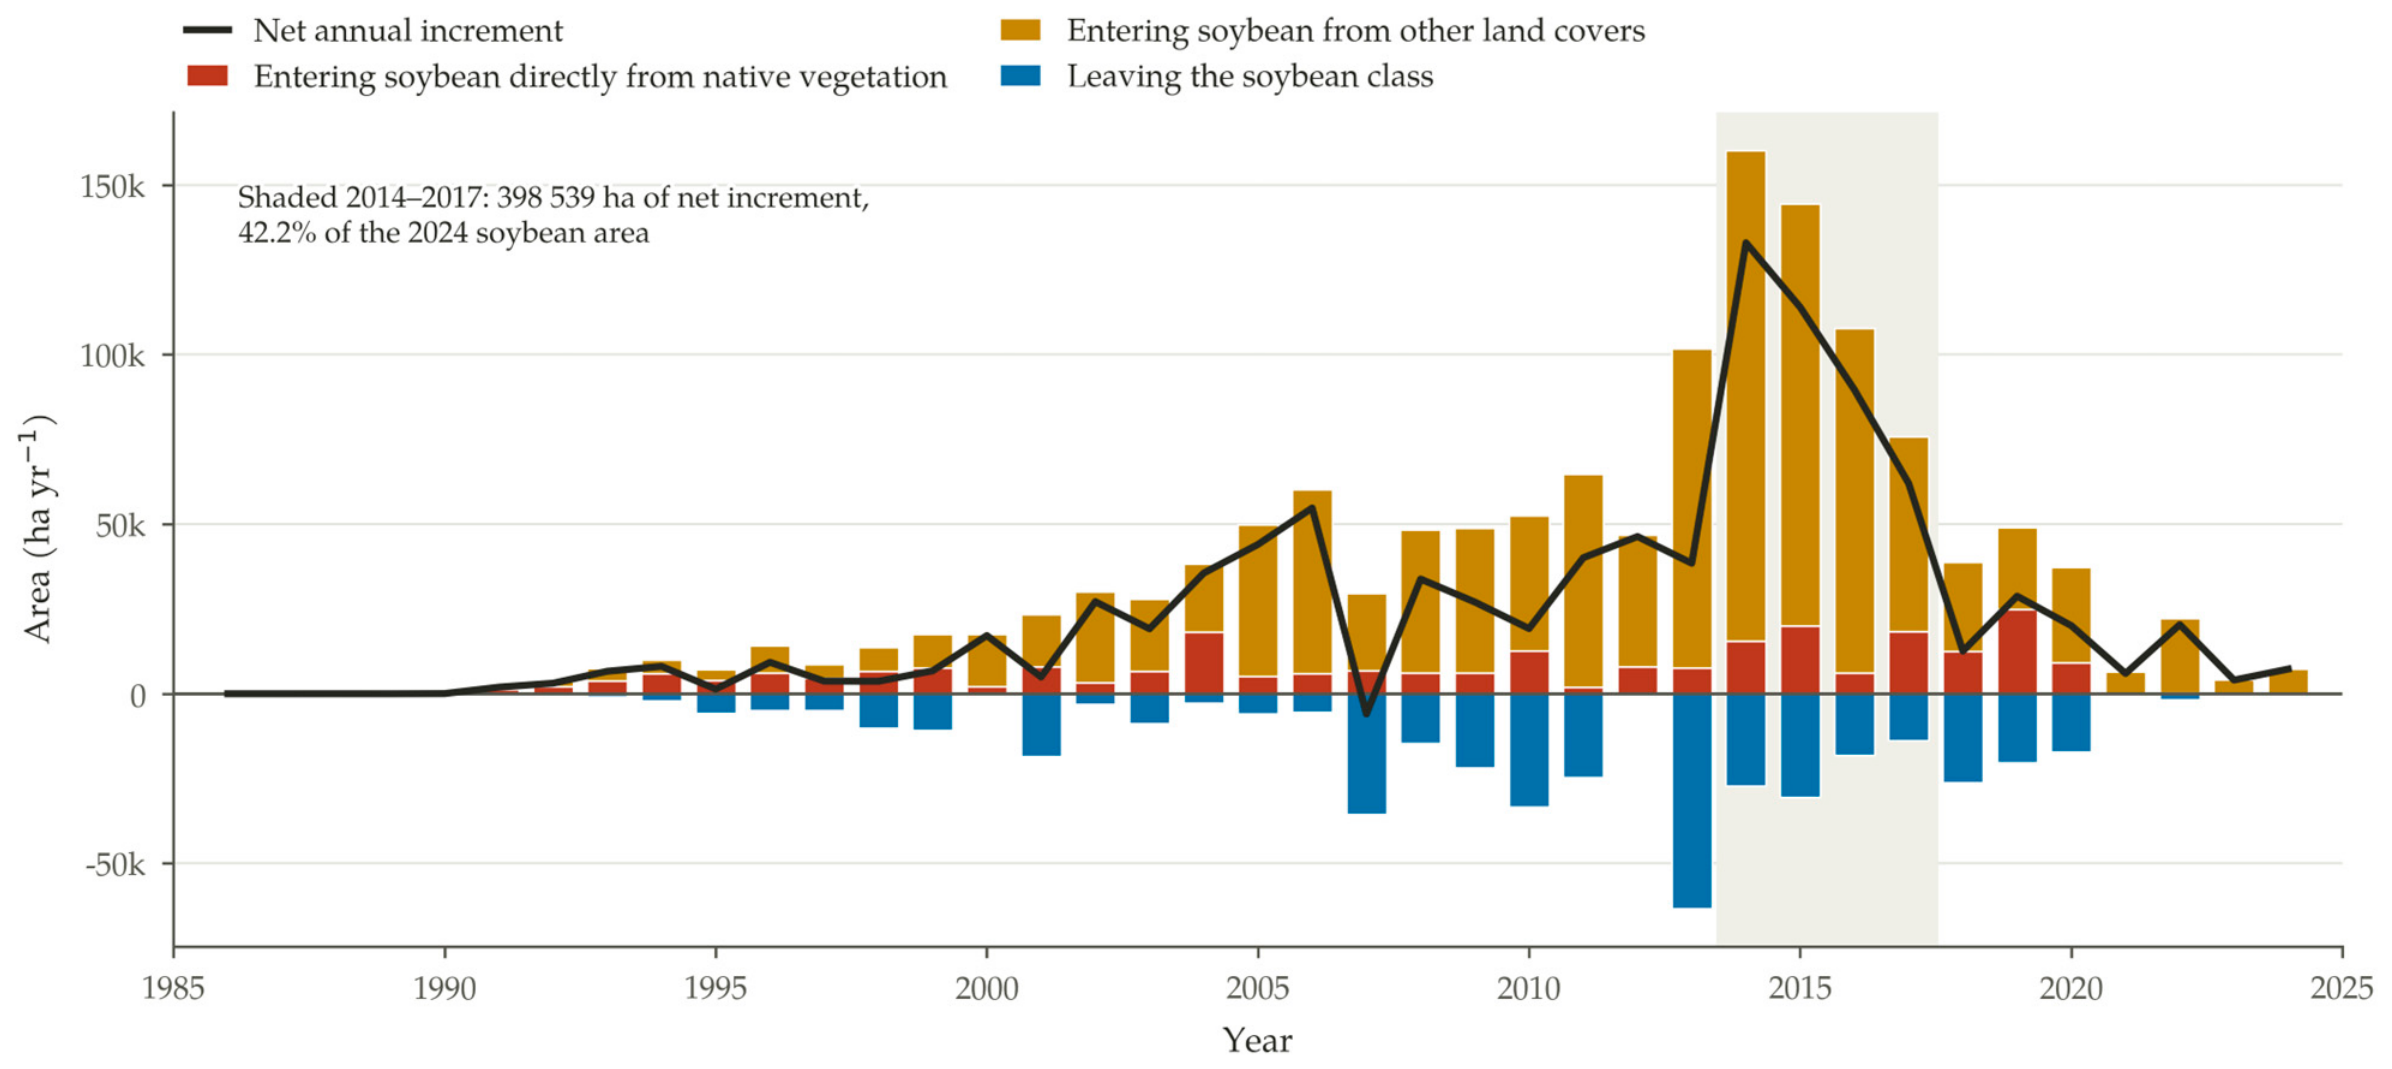
Soybean occupied 943,763 ha of Piauí’s MATOPIBA in 2024, equivalent to 11.4% of the region, concentrated in a group of municipalities on the western plateaus (Figure 3). The crop crossed 100,000 ha in 2003 and 500,000 ha in 2014, and its net annual increment averaged 24,204 ha over the series. Expansion was strongly concentrated in time: between 2014 and 2017 the crop gained 398,539 ha, or 42.2% of its entire 2024 extent, and the pace fell sharply afterwards, closing at a net increment of 7279 ha in 2024 (Figure 4 and Figure 5).
Figure 3.
Soybean extent in 2024, area of direct native-vegetation-to-soybean transition accumulated over 1985–2024, and mapped overlap between soybean and the protection instruments of the Rural Environmental Registry in Piauí’s MATOPIBA. Panels (A,B) show representative windows at the native 30 m resolution. Data: MapBiomas [4]; SICAR [32].
Figure 4.
(a) Soybean cultivated area and (b) annual loss of native vegetation in Piauí’s MATOPIBA, 1985–2024. Data: MapBiomas [4].
Figure 5.
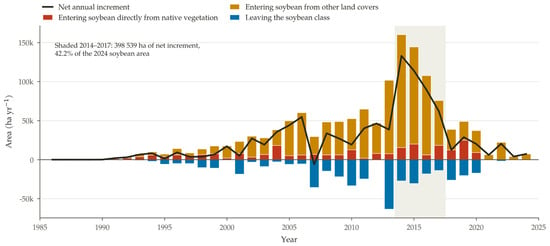
Annual soybean dynamics in Piauí’s MATOPIBA, 1985–2024: gross area entering the soybean class each year, split between direct conversion from native vegetation and conversion from other land covers; area leaving the soybean class; and the resulting net annual increment. Data: MapBiomas [4].
Distinguishing gross from net expansion matters at this resolution. Summed over the 39 annual transitions, 1,377,773 ha entered the soybean class at some point, while 433,814 ha left it, so that the net area of the crop in 2024, 943,763 ha, corresponds to less than seven tenths of the gross area ever brought into cultivation. These reversions represent crop rotation, fallow and, in part, classification instability between the soybean class and the generic temporary-crop class, and they are the reason why shares computed over gross expansion and over net area differ.
Native vegetation covered 7,999,765 ha of the region in 1985, or 96.9% of its territory, and 6,217,535 ha in 2024, or 75.3%. The net loss over the period is 1,782,230 ha, a reduction of 22.3%. Gross loss, accumulated over the annual transitions, reaches 2,252,945 ha, against 472,239 ha of regeneration or reclassification back into native classes. Annual loss averaged 57,768 ha and remains high at the end of the series: the maximum of 161,558 ha was recorded in 2022 and 136,266 ha were still lost in 2024 (Figure 4b). Direct conversion of native vegetation to soybean accumulates 248,426 ha over the period, which corresponds to 11.0% of the gross loss of native vegetation and 13.9% of the net loss; in 2024 alone, it amounted to only 168 ha. The deceleration of the crop’s advance over native vegetation therefore coincides with a continuing high rate of native vegetation loss driven by other land uses. Set against the state as a whole, the region occupies 32.6% of the territory of Piauí but accounts for 41.1% of the gross loss of native vegetation recorded in the state over the period (5,480,683 ha) and for 59.6% of the net loss (2,990,025 ha), which confirms its disproportionate weight in the state’s land-cover change.
Soybean is present in all 33 municipalities of the region but is strongly concentrated in a few of them (Table S1). The six largest producers, Baixa Grande do Ribeiro (226,198 ha), Uruçuí (203,482 ha), Bom Jesus (98,059 ha), Ribeiro Gonçalves (87,038 ha), Santa Filomena (75,192 ha) and Currais (52,170 ha), together hold 742,138 ha, or 78.6% of the regional total, and the Gini coefficient of the distribution of soybean area across municipalities is 0.804. Relative to municipal territory, the crop reaches 28.9% of Baixa Grande do Ribeiro and 24.1% of Uruçuí, against a regional average of 11.4%.
The concentration is spatial and not merely statistical. The share of municipal territory under soybean shows strong positive spatial autocorrelation (Moran’s I = 0.545, expected value under randomness −0.031, pseudo p = 0.0001 from 9999 permutations), and the local indicator identifies a single contiguous cluster of eleven municipalities with high values surrounded by high values, extending along the western plateaus from Uruçuí and Baixa Grande do Ribeiro southwards to Gilbués and Monte Alegre do Piauí. The soybean frontier of Piauí’s MATOPIBA is therefore a coherent territorial block rather than a dispersed set of producing municipalities, which is relevant both for enforcement planning and for the design of jurisdictional supply-chain instruments.
3.3. Where the 2024 Soybean Area Came from
The two ways of relating the 2024 soybean area to native vegetation give very different answers, and both are reported here (Table 3). Summed over consecutive annual transitions, direct conversion from native vegetation accounts for 248,426 ha, that is 26.3% of the 2024 soybean area. Compared between the two ends of the series, 933,074 ha of the land under soybean in 2024, or 98.9% of it, carried native vegetation in 1985: 921,084 ha were forest formations, which, in this region, are predominantly savanna physiognomies, and 11,989 ha were non-forest natural formations. Only 2836 ha of the current soybean area, or 0.3%, were under some other cover in 1985 and never carried native vegetation during the series.
Table 3.
Land-cover transition matrix between 1985 and 2024 for Piauí’s MATOPIBA, in hectares, obtained by comparing the two ends of the series. Rows give the cover in 1985 and columns the cover in 2024. This matrix answers a different question from the sum of the annual transitions reported in Section 3.2 and should not be compared with it directly. Data: [4].
The trajectory analysis reconciles the two figures. Of the 2024 soybean area, 223,503 ha, or 23.7%, entered the crop directly from native vegetation, in the sense that the class occupying the pixel immediately before its first persistent soybean season was native; 717,425 ha, or 76.0%, entered from another class but had carried native vegetation earlier in the series; and 0.3% never did. The class occupying the pixel immediately before the first soybean season was other crops in 70.3% of the area, forest formations in 23.6%, mosaic of uses in 2.8%, non-vegetated areas in 2.5% and pasture in only 0.9%.
What separates the two readings is a short interval, not a different epoch of occupation. The median interval between the last year in which a pixel carried native vegetation and its first soybean season is three years, and the mean is 3.3 years. Cumulatively, 23.8% of the area reached soybean within one year of losing native cover, 49.8% within two years and 71.2% within three; 16.6% took four or five years and only 12.1% took longer than five. The distribution of first soybean seasons follows the expansion of the crop, with 55,853 ha of the current area first cultivated in the 1990s, 278,760 ha in the 2000s, 580,754 ha in the 2010s and 28,392 ha from 2020 onwards.
3.4. Mapped Overlaps with the Protection Instruments of the CAR
Soybean was detected within both categories of registry protection instruments and on land not covered by any registered property (Table 1). The crop overlaps 12,521 ha of declared Legal Reserves and 1125 ha of declared Permanent Preservation Areas, with 58 ha in areas declared as both, so that 13,588 ha of the 2024 soybean area, or 1.4% of it, lie within one or the other instrument. On land outside any registered property, computed from the property layer of Almeida et al. [22], soybean occupies 14,576 ha, or 1.5% of the crop’s extent. These are overlaps between mapped geometries and indicate potential non-compliance requiring administrative or judicial verification; they are not adjudicated violations, and the declared boundaries on which they rest have not been validated by the competent state agencies.
The geometry of the overlaps is consistent across the three categories and robust to the connectivity rule. Within Legal Reserves, 85.0% of the 2137 patches are smaller than one hectare but account for only 3.0% of the overlapping area, while the 97 patches larger than ten hectares concentrate 91.3% of it, the largest reaching 2158 ha. Within Permanent Preservation Areas, 81.6% of the 451 patches are sub-hectare and hold 9.8% of the area, while six patches above ten hectares hold 72.9%. On unregistered land, 83.9% of the 3647 patches are sub-hectare and hold 6.2% of the area, while 58 patches above ten hectares hold 84.4%, the largest reaching 3403 ha. Recomputing every figure with four-neighbour connectivity raises the patch counts, as expected, but changes the area shares of the largest size class by at most 1.2 percentage points. For reference, the soybean extent of the region as a whole comprises 5047 patches, of which 398 exceed ten hectares and hold 99.3% of the cultivated area.
The sensitivity of these overlaps to boundary error differs markedly between categories. Eroding each layer by one pixel retains 87.4% of the soybean overlap in Legal Reserves and 98.4% in conservation units, but only 68.5% in Permanent Preservation Areas, whose linear geometry is of the same order of magnitude as the pixel. Estimates of soybean within Permanent Preservation Areas should accordingly be read as indicative rather than as precise quantities.
3.5. Cropland Inside Strictly Protected Conservation Units
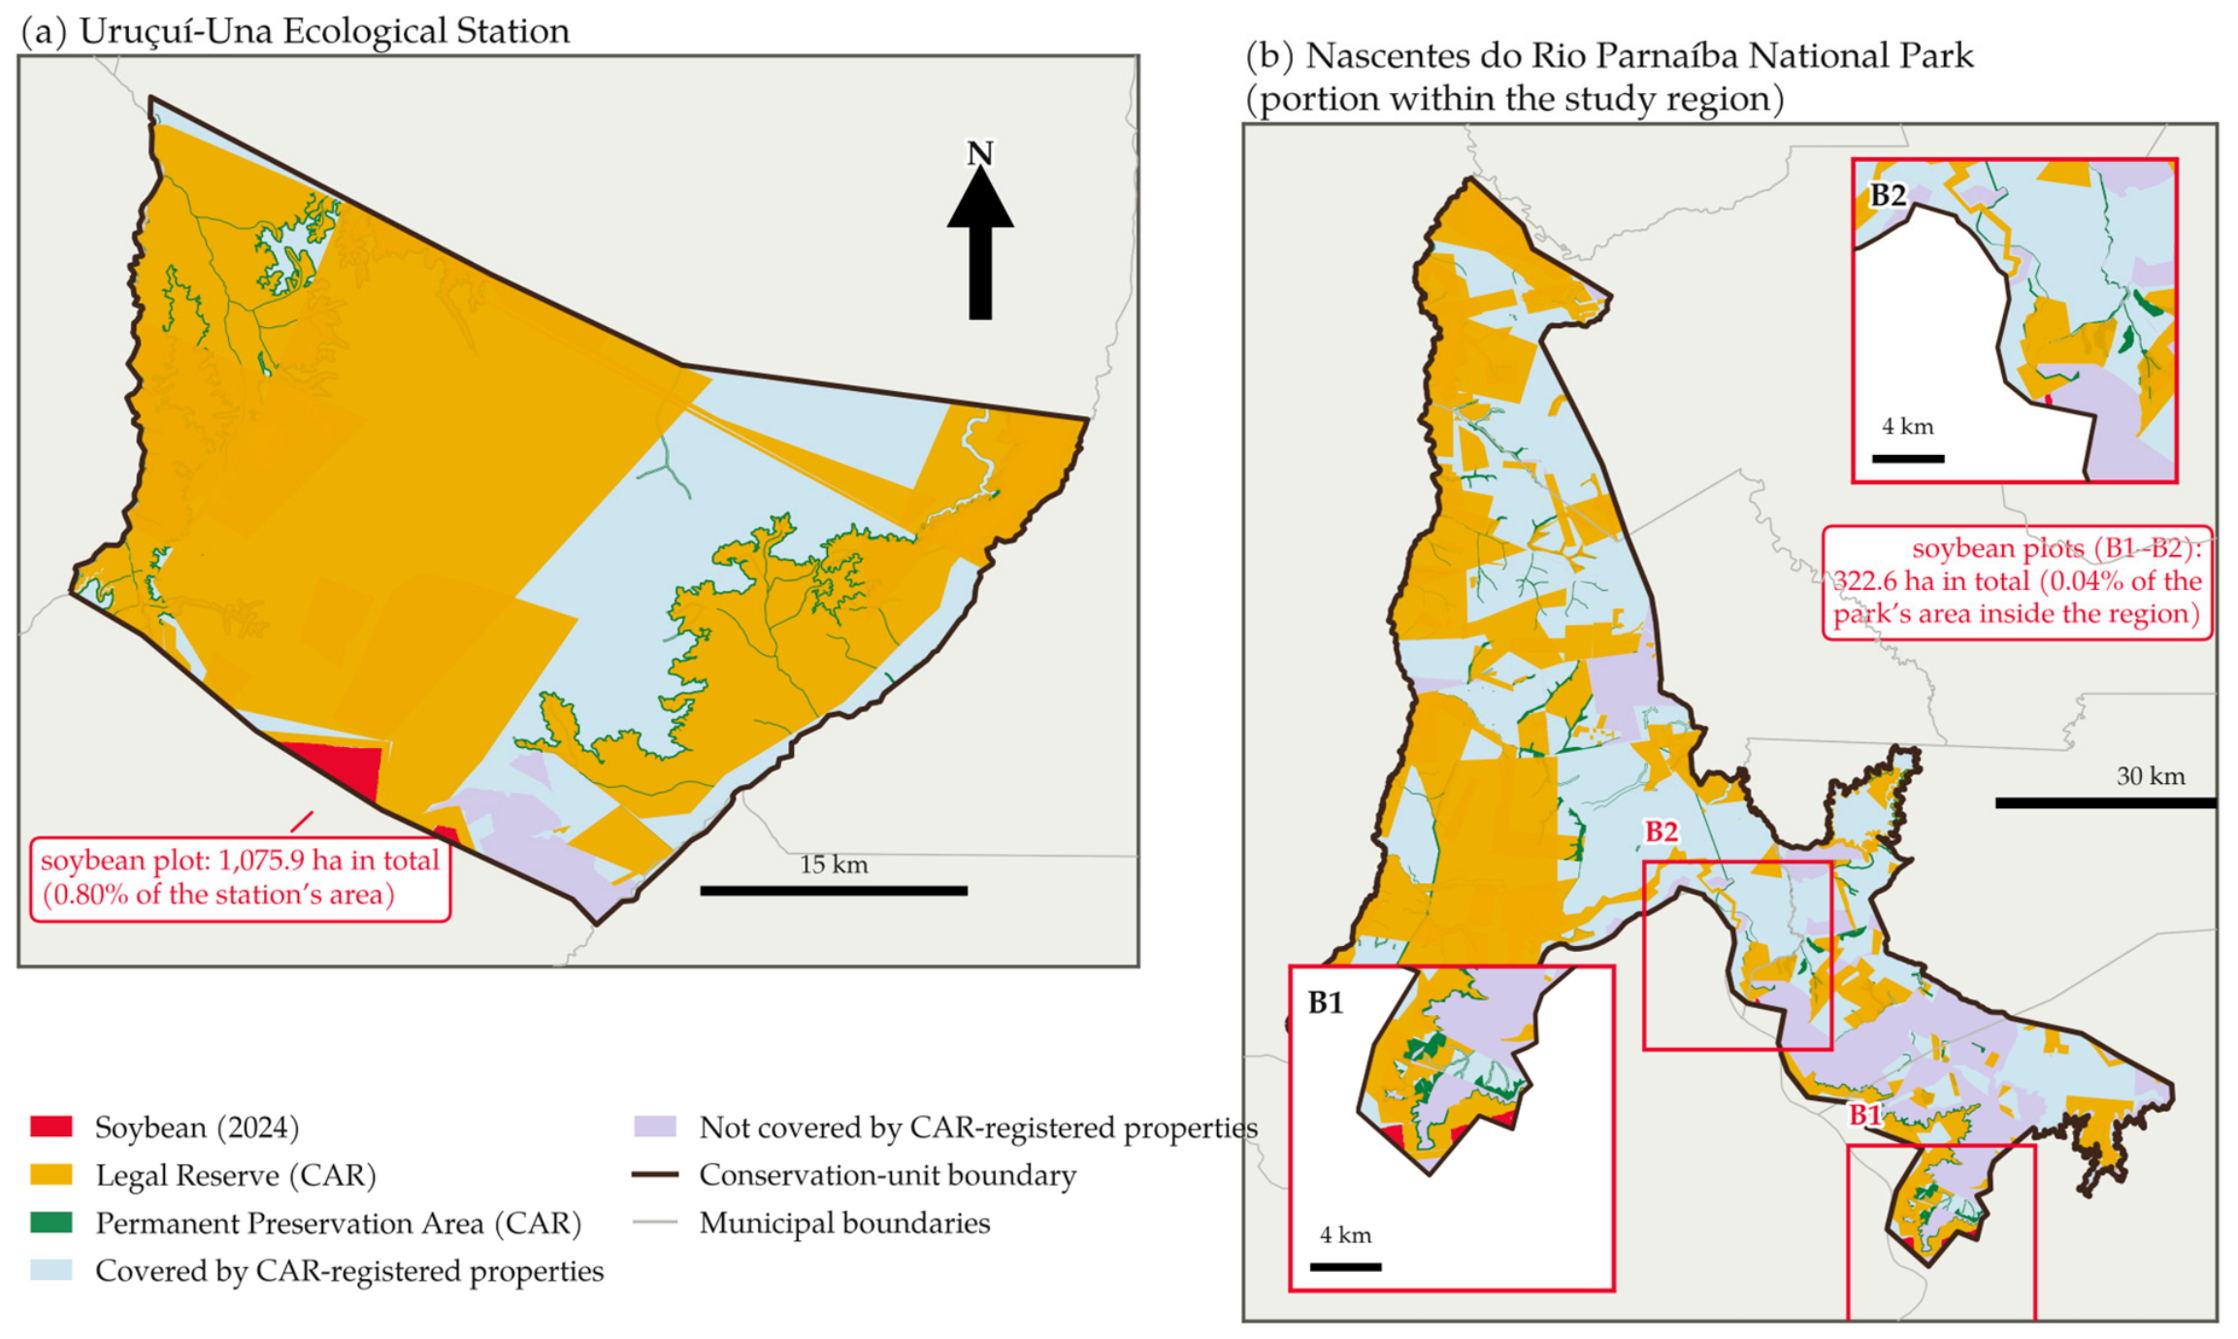
Soybean was detected inside two of the four strictly protected units that overlap the region, and was absent from the other two (Table 2). In the Uruçuí-Una Ecological Station, 6001 ha were under soybean in 2024, corresponding to 4.62% of the 129,859 ha that the unit occupies within the region (Figure 6). In the Nascentes do Rio Parnaíba National Park, the cultivated area is 314 ha, or 0.12% of the portion of the park inside the region. No soybean was detected in the Serra das Confusões National Park or in the Rangel State Park, whose areas inside the region are 361,293 ha and 38,756 ha, respectively.
Figure 6.
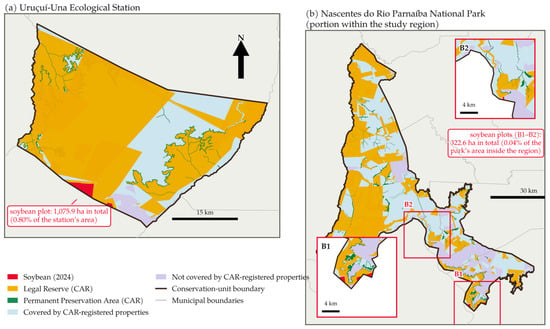
Soybean detected inside strictly protected conservation units: (a) the Uruçuí-Una Ecological Station and (b) the Nascentes do Rio Parnaíba National Park (portion within the study region), with the land-tenure context given by the coverage of properties registered in the Rural Environmental Registry. Insets (B1,B2) at higher zoom. Data: MapBiomas [4]; SICAR [32]; ICMBio [34].
The occupation of the Uruçuí-Una Ecological Station is not diffuse. A single contiguous complex of field-scale plots accounts for 6000 ha of the 6001 ha detected, that is 99.98% of the total, and the twenty patches identified inside the unit include ten of less than one hectare that together amount to 1.9 ha. The annual series places the establishment of this complex between 2013 and 2017: cultivated area inside the station rises from 14 ha in 2012 to 644 ha in 2013, 2607 ha in 2014 and 5916 ha in 2016, and has remained between 5989 and 6001 ha every year since. The complex straddles the southwestern boundary of the unit and continues outside it, where a further 9561 ha of soybean occupy the 5 km band that surrounds the station.
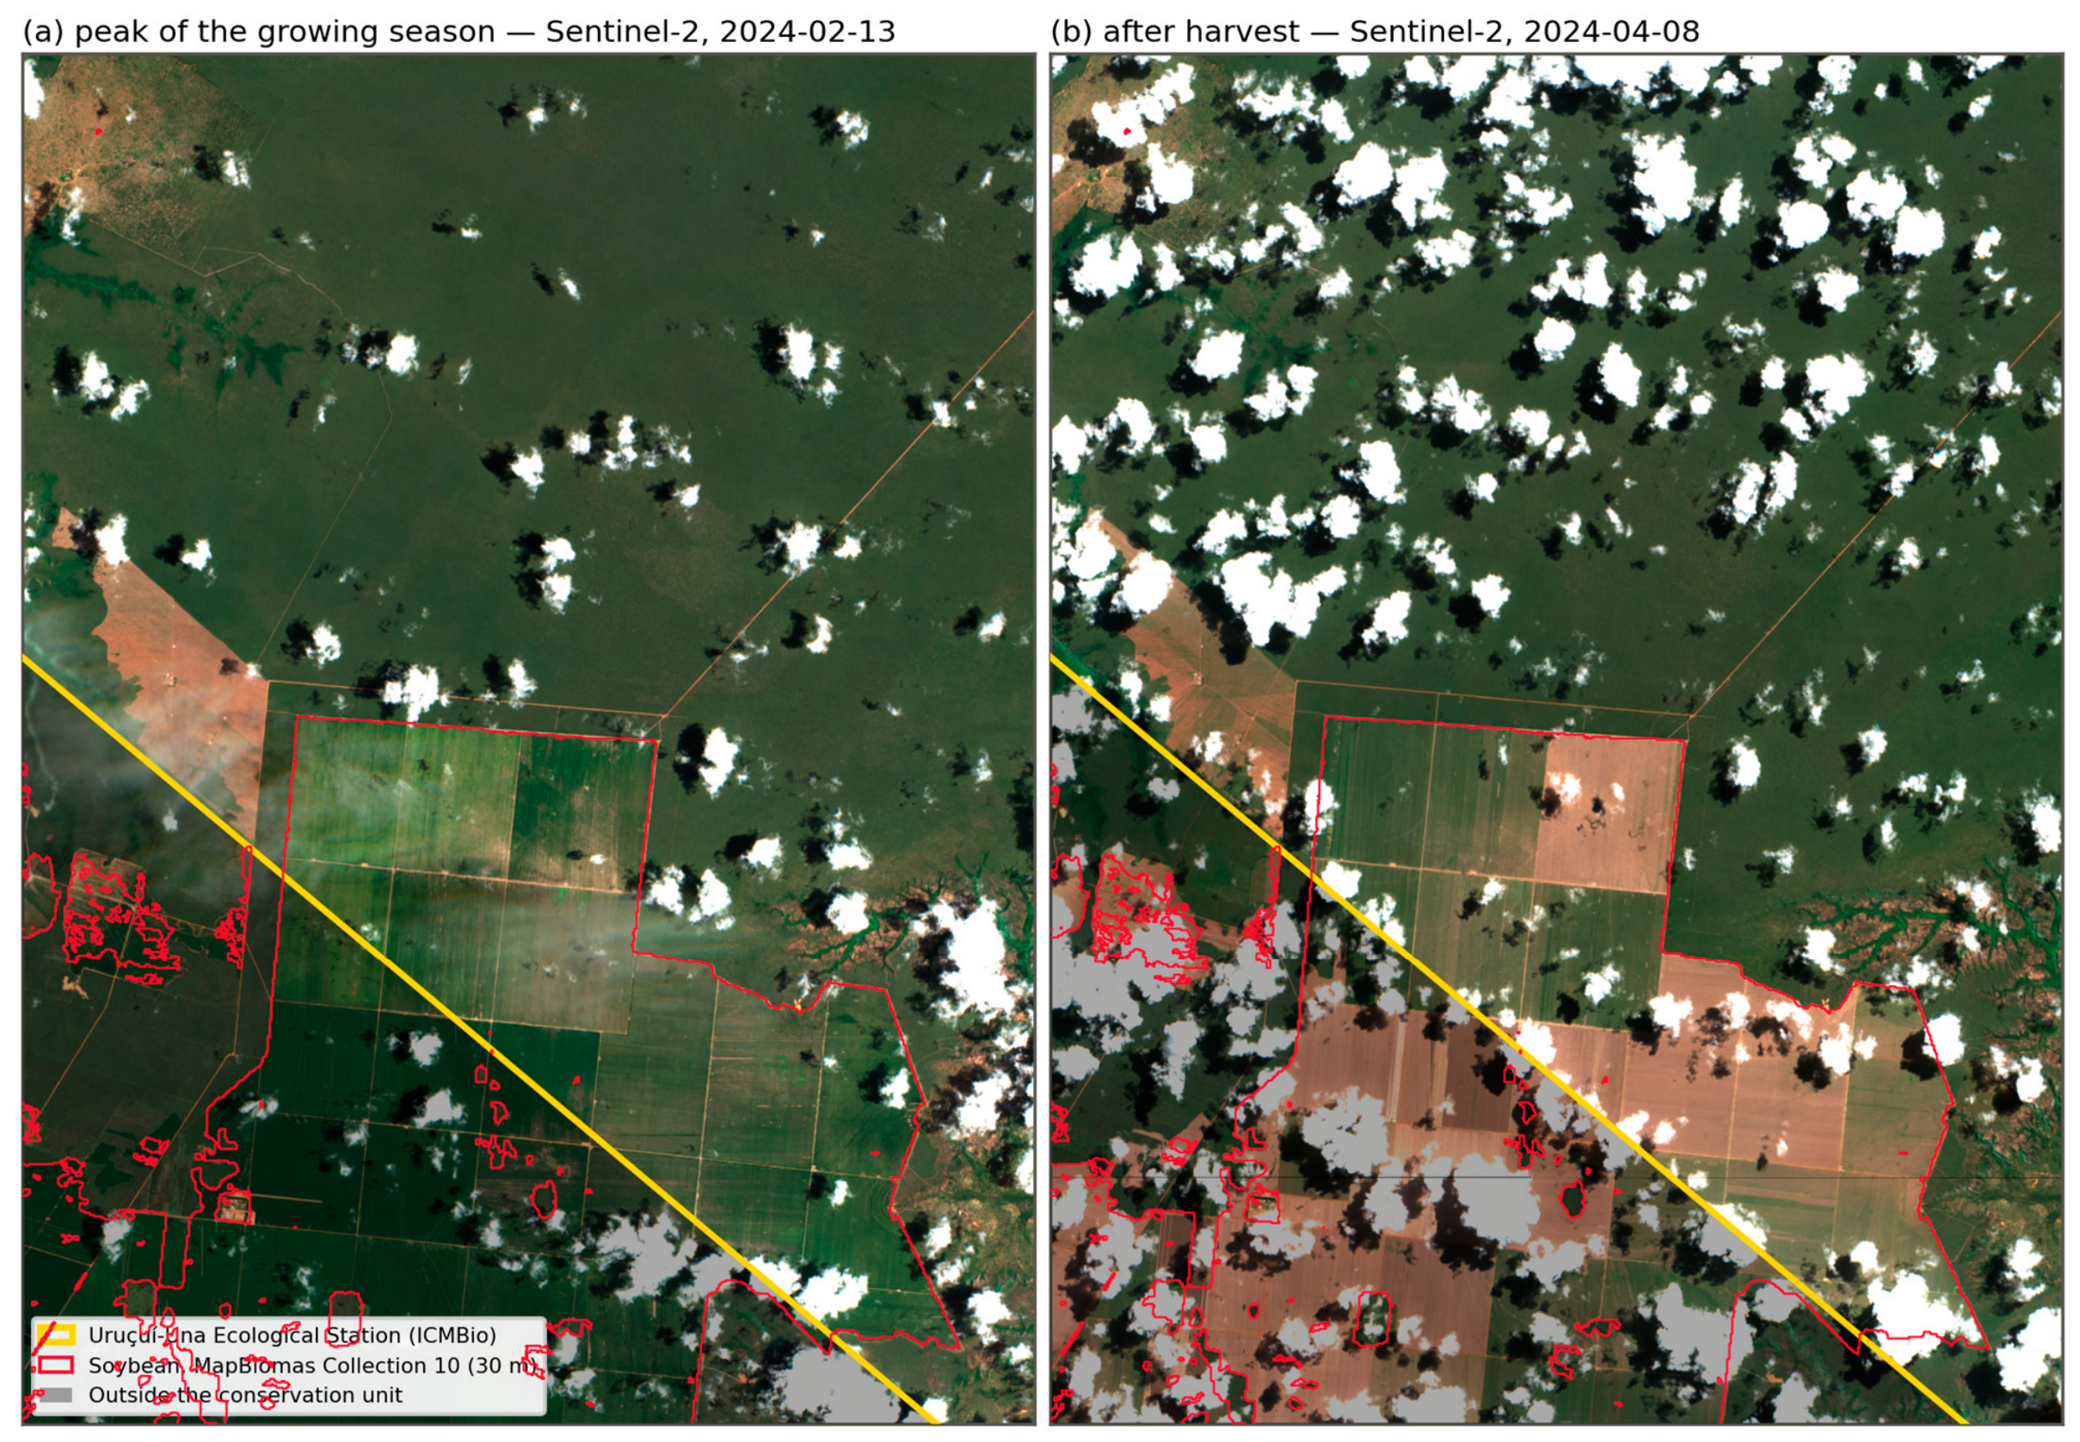
Because a result of this kind depends on the delimitation adopted and on the reliability of a 30 m classification, it was verified against independent imagery (Figure 7). At 10 m resolution, the plots inside the station appear as regular rectangular fields whose boundaries coincide with the outline of the mapped soybean class. Their normalised difference vegetation index reaches 0.65 on 13 February 2024 and falls to values between 0.15 and 0.21 between 9 March and 13 April, a bare-soil signature that follows harvest, before a second green-up in May. Over the same dates and within the same window, the pixels classified as forest formations never fall below 0.48 and those classified as savanna never fall below 0.32. The detection is therefore not a classification artefact: the area is cultivated land under a crop calendar.
Figure 7.
Independent verification of the soybean detected inside the Uruçuí-Una Ecological Station, using Sentinel-2 surface reflectance at 10 m resolution [35]: (a) 13 February 2024, at the peak of the growing season; (b) 8 April 2024, after harvest. The yellow line is the boundary of the ecological station [34] and the area outside it is shaded; red outlines delimit the soybean class of MapBiomas Collection 10 at 30 m [4]. The fields inside the station are green at the peak of the season and bare after harvest, whereas the surrounding native vegetation remains green on both dates.
The land-tenure context aggravates both cases. Registered rural properties cover the greater part of the perimeter of the two units, and Legal Reserves and Permanent Preservation Areas have been declared inside them, even though private landholdings are not admissible in either category of unit. Of the 345,060 ha of declared Legal Reserves that fall inside conservation units in the region, the greater part lies in these two units.
4. Discussion
4.1. From Apparent Decoupling to a Lagged but Tight Coupling
The forty-year reconstruction presented here gives two apparently contradictory answers to the question of how much of the soybean area of Piauí’s MATOPIBA was won from native vegetation. Measured as year-to-year transitions, only 23.7% of the 2024 soybean area passed directly from native vegetation to soybean in a single annual step, which is the figure that supports the widely reported decoupling of soybean expansion from deforestation in the Cerrado [2,13]. Measured by comparing the two ends of the series, 98.9% of the land under soybean in 2024 carried native vegetation in 1985, of which 97.6% was classified as forest formations, a group that in this region corresponds overwhelmingly to the savanna physiognomies of the Cerrado. The two numbers are not in conflict: they measure different things, and the gap between them is occupied by land that left native vegetation and reached soybean through an intermediate class.
Resolving that gap is what the trajectory analysis adds. For every pixel under soybean in 2024, we recorded the year of its first persistent soybean season and the interval since it last carried native vegetation. The median interval is three years, and the mean is 3.3 years: 23.8% of the area became soybean within one year of losing native cover, 49.8% within two years and 71.2% within three. Only about 12% of the area waited more than five years, which is the range in which a genuinely distinct land-use epoch between clearing and soybean can be postulated. The class occupying the pixel immediately before the first soybean season was, in 70.3% of the area, the generic temporary-crop class of the mapping product, and only marginally pasture (0.9%) or mosaic of uses (2.8%). The picture that emerges is therefore not one of soybean advancing over a landscape converted in some earlier cycle of occupation, but of soybean arriving two or three seasons after the clearing, at the end of a single conversion sequence.
Part of that short interval is attributable to the mapping product rather than to the land. A recent systematic comparison of MapBiomas agricultural classes against official agricultural statistics shows that the dedicated soybean class underestimates planted area by 10.4% nationally and by 31.5% in rapidly expanding frontier municipalities, and that the generic other-temporary-crops class absorbs the difference: adding it moves the aggregate gap from −10.4% to +5.7% [38]. The dominance of that same generic class immediately before the first soybean season in our series is consistent with this mechanism, in which the spectral evidence of soybean is captured but assigned to a catch-all category during the first seasons of a new field. Both readings, however, point in the same direction. Whether the two-to-three-year interval reflects the agronomic sequence of opening a new field or the delay of the classifier in labelling it, the land under soybean in this region was, with very few exceptions, native Cerrado a short time before.
This has a direct consequence for how the decoupling argument should be read for Piauí’s MATOPIBA. The share of expansion that involves no new clearing, when computed as a one-year transition, is a lower bound on the association between the crop and the loss of native vegetation, not a measure of the crop’s independence from it. The result is compatible with the evidence that the Cerrado holds enough already cleared and agronomically suitable land to accommodate substantial soybean growth without further conversion [6,15], and with recent biome-scale monitoring of agricultural expansion [39], but it cautions against reading the regional statistics as evidence that this potential is being realised here. It also gives, for this region, the empirical content that the literature on indirect land-use change has had to assert from displacement models [3]: the sequence from native vegetation to soybean is short and nearly universal, even where the final transition is not direct.
4.2. What the Rural Environmental Registry Actually Protects
The second contribution of the revised analysis concerns what the protection instruments of the Rural Environmental Registry actually cover on the ground. Summing the declared polygons, Legal Reserves amount to 2,790,061 ha and Permanent Preservation Areas to 1,097,431 ha in the region, which together would correspond to 47.3% of its territory. Computing the unique area that these polygons occupy, however, gives 2,234,197 ha of Legal Reserves and only 288,035 ha of Permanent Preservation Areas. The declared Legal Reserves overlap one another by roughly a fifth of their summed area, and the declared Permanent Preservation Areas by nearly three quarters of theirs.
This is a direct expression of the self-declaratory design of the registry [19]. Neighbouring landholders delimit the same riparian buffer along a shared watercourse, and successive or competing registrations of the same property each carry their own set-aside polygons; until the state environmental agencies validate the registrations, nothing in the system removes the duplication [18]. Taking the unique area of each category, and then the union of the two together with the strictly protected conservation units, 34.5% of Piauí’s MATOPIBA is covered by some legal protection instrument, against the 40.2% that a simple sum of the three categories would suggest and the higher figure that summing declared polygons would produce. Legal Reserves account for 27.2% of the region, Permanent Preservation Areas for 3.5% and strictly protected units for 9.5%, with 116,168 ha shared between the two registry instruments and 345,060 ha of declared Legal Reserves falling inside conservation units.
The practical implication is that areas derived from the registry should not be used as denominators without first resolving overlaps. Compliance indicators built on summed declared areas overstate the extent of protected land, and the distortion is largest precisely for Permanent Preservation Areas, the instrument that protects the riparian network on which the hydrological functions of the biome depend [7,8]. The point reinforces, from the geometric side, the finding that the rapid growth of registrations in MATOPIBA has not by itself reduced pressure on native vegetation [22].
4.3. Mapped Overlaps, Potential Non-Compliance and the Limits of Targeted Enforcement
Soybean was detected on 12,521 ha of declared Legal Reserves and 1125 ha of declared Permanent Preservation Areas in 2024, which together represent 1.4% of the crop’s extent in the region. These are mapped overlaps between two geometries, and the wording matters: a coincidence between a cultivated pixel and a self-declared set-aside polygon indicates potential non-compliance to be verified administratively or judicially, not an adjudicated violation. The declared boundaries have not been validated, some of them are demonstrably duplicated, and legally authorised uses and consolidated occupations recognised by the Forest Code cannot be identified from geometry alone.
Subject to that caveat, the geometry of the overlaps is informative. Within Legal Reserves, 85.0% of the 2137 patches are smaller than one hectare but account for only 3.0% of the overlapping area, while 97 patches larger than ten hectares concentrate 91.3% of it; within Permanent Preservation Areas the corresponding figures are 81.6% of 451 patches and 72.9% of the area. Recomputing the patches with four-neighbour instead of eight-neighbour connectivity changes the counts, as expected, but leaves the area shares essentially unchanged (90.3% and 71.7%), so the pattern is not an artefact of the connectivity rule. The multitude of sub-hectare patches is compatible with edge effects and classification noise at the 30 m resolution, whereas the overlapping area is concentrated in a small number of field-scale incursions. At the scale of protection instruments, this mirrors the concentration of potentially illegal deforestation in a small fraction of properties documented nationally by Rajão et al. [40].
That concentration is what makes targeted verification attractive, and it should be presented as a potential application rather than as a tested outcome, since neither enforcement efficiency nor legal priority was evaluated here. It should also be read against the institutional conditions under which environmental agencies operate in Brazil. Validation of registrations is itself the bottleneck, and the states of the frontier have processed only a small fraction of the registrations they hold [18,19]; field verification, administrative proceedings and the judicial disputes that follow land-tenure conflicts unfold over years, and the budgetary and staffing capacity of the agencies has not grown with the number of registrations to be examined [22]. A prioritisation rule that concentrates scarce inspection capacity on a hundred field-scale patches rather than on thousands of sub-hectare ones is defensible on those grounds, but it does not by itself create the capacity.
A further caution follows from the sensitivity test. Eroding each protection layer by one pixel, which approximates the effect of a half-pixel geolocation error on either side of a boundary, retains 87.4% of the soybean overlap in Legal Reserves and 98.4% in conservation units, but only 68.5% in Permanent Preservation Areas. Permanent Preservation Areas are narrow linear features whose width is of the same order as the pixel, so estimates of soybean overlap with them are considerably more sensitive to boundary and classification error than estimates for the other categories, and should be treated as indicative.
4.4. Cropland Inside Strictly Protected Units
Soybean was detected inside two of the four strictly protected units that overlap the region, and its absence from the other two is as informative as its presence. In the Uruçuí-Una Ecological Station, 6001 ha of the 129,859 ha that the unit occupies within the region were under soybean in 2024, or 4.6% of its area. In the Nascentes do Rio Parnaíba National Park, the figure is 314 ha, or 0.12% of the portion of the park inside the region. No soybean was detected in the Serra das Confusões National Park or in the Rangel State Park.
The case of the Uruçuí-Una Ecological Station deserves emphasis because of its legal category and because of the form the occupation takes. Under the National System of Conservation Units, ecological stations are subject to the most restrictive regime of all, dedicated exclusively to nature preservation and scientific research, and admit no direct use of natural resources [41]. What the maps show is not a diffuse set of small incursions: 99.7% of the detected area belongs to a single contiguous complex of field-scale plots, established between 2013 and 2017 and cultivated continuously since, which straddles the southwestern boundary of the unit and continues outside it, where a further 9561 ha of soybean occupy the five-kilometre band surrounding the station. Because a result of this kind is sensitive to the delimitation used, the analysis was repeated against the official federal boundary published by ICMBio [34], and the detection was verified independently against Sentinel-2 imagery at 10 m resolution [35] (Figure 7): the plots reach a normalised difference vegetation index of 0.65 in mid-February and fall to bare soil values between 0.15 and 0.21 in late March and April, a harvest signature that neighbouring forest formations, which never fall below 0.48 in the same series, do not display. The area is unambiguously cultivated land.
Two readings of these figures must be kept apart. In absolute terms, the areas involved are modest relative to the extent of the units, and it would overstate the evidence to present them as a leading driver of biodiversity loss in the Cerrado, whose protected-area network is under-dimensioned for reasons of a different order of magnitude [6,42]. In normative terms, however, any commercial cropping inside an ecological station or a national park is incompatible with the category, and the persistence of a six-thousand-hectare farming complex inside a federal ecological station for more than a decade is a symptom of an unresolved land-tenure situation rather than of an enforcement lapse at the plot level. The land-tenure context documented for these two units, in which self-declared registrations blanket most of their perimeters, corroborates prior case studies describing a process of private appropriation of public conservation land in which the registry functions as an instrument of tenure claim [43,44]. It also illustrates, in the sharpest possible way, why registration in the registry cannot be read as evidence of legitimate tenure [19].
4.5. Implications for Sustainability Governance and Deforestation-Free Supply Chains
Read together, these results describe a frontier in which the sustainability of land use depends less on the rate of agricultural expansion, which has slowed markedly since 2017, than on where the remaining expansion goes and on the capacity of the institutions that are supposed to bound it. The economic stakes are high and rising: soybean and its derivatives have become the dominant item of the state’s export basket over the period analysed [45], so that the governance of this frontier is also the governance of the state’s main commercial link to international markets. The spatially explicit indicators produced here speak to both. The interval between the loss of native cover and the first soybean season, the unique area effectively covered by each protection instrument, and the extent and geometry of the overlaps between cropland and protected categories are quantities that can be recomputed annually from public data, and they bear directly on the targets of Sustainable Development Goal 15 concerning the loss of natural habitats [25].
For international due-diligence regimes, the lag result carries a specific and practical implication. The European Union’s Regulation on deforestation-free products requires operators to demonstrate that soybean was produced on land not deforested after 31 December 2020 and in compliance with the legislation of the producing country, with plot-level geolocation as one element of that demonstration rather than as proof of compliance in itself [16]. If, as the series shows, a field typically reaches its first soybean season two to three years after the native vegetation was cleared, then a plot cultivated for the first time in 2023 or 2024 may correspond to a conversion that occurred around or after the cut-off date, and screening that starts from the date of first cultivation will systematically date the conversion too late. Risk assessment for this region should therefore be anchored on the date of native vegetation loss, which the annual series provides, rather than on the date of first detected soybean. The limitation of the regulation to areas meeting its forest definition compounds the problem in the Cerrado, where much of the vegetation converted is savanna and grassland that falls outside that definition [17], so that the domestic instruments remain the binding constraint for most of the region’s conversion. Because the crop is embedded in international trade, overlaps of this kind also expose the supply chain to reputational and market risk, given the documented association between soybean cultivation, habitat loss and biodiversity decline [46].
Domestically, three priorities follow from the results, offered as policy implications rather than as evaluated interventions. The validation stage of the registry should be treated as the limiting step, both because unvalidated declarations cannot support enforcement and because, as shown here, the declared geometries systematically overstate the protected area. Verification effort should be directed first at the small number of field-scale overlaps identified in this study and at the unregistered production areas, in line with national deforestation monitoring [20]. And the land-tenure regularisation of the Uruçuí-Una Ecological Station and the Nascentes do Rio Parnaíba National Park should be treated as a precondition for any effective protection of those units rather than as an administrative formality. Containing further conversion in the region also carries co-benefits beyond biodiversity, given the accumulated evidence that the conversion of Cerrado vegetation degrades water recycling and streamflow and worsens the climatic conditions on which regional agriculture itself depends [7,8,9].
4.6. Limitations
Several limitations bound these conclusions. The analysis rests entirely on the annual classification of the MapBiomas Collection 10 product, whose reported global accuracy for Brazil is 93.4% at the first level of the legend, with an allocation disagreement of 5.3% and an area disagreement of 1.3%, and whose per-class accuracy is high for forest formations (96.6% producer’s and 95.1% user’s accuracy) but considerably lower for the herbaceous and shrubby formations that cover much of the region (80.2% and 75.9%) [37]. Errors in those classes propagate directly to the estimates of native vegetation loss reported here. At 30 m, field boundaries, riparian strips and the edges of protected areas are resolved to within roughly one pixel, which is the motivation for the erosion test reported above and the reason why the estimates for Permanent Preservation Areas are the least robust of the set.
The transition series inherits a second, more specific limitation from the way crops are labelled. As discussed, the dedicated soybean class underestimates planted area in frontier municipalities and the generic temporary-crop class absorbs part of the difference [38], which affects the timing of first detection and therefore the interval we report, even though it does not affect the endpoint comparison. Second-crop cultivation is also structurally invisible in an annual single-class product, so the sequences reconstructed here describe the dominant annual cover and not the full cropping calendar.
The registry layers are self-declared and were taken from the April 2025 snapshot of the national system, restricted to active registrations and processed as described in Section 2; boundaries of Legal Reserves and Permanent Preservation Areas therefore reflect declared rather than adjudicated geometries, and encroachment estimates are conditioned by declaration quality. Results for conservation units depend on the delimitation adopted, and we report them against the official federal boundaries; earlier delimitations of the Uruçuí-Una Ecological Station in particular differ in the southwestern sector where the cultivated complex is located, which is why that result is accompanied by independent imagery verification.
Finally, the scope of the study is deliberately narrow in two senses. Geographically, it covers the 33 municipalities of Piauí within MATOPIBA and its findings are not extrapolated to the four-state region, whose Bahia, Tocantins and Maranhão portions differ in the age of their frontiers, in the composition of their vegetation and in the capacity of their state agencies. Thematically, the analysis measures the territorial and governance dimension of sustainability, and does not measure soil quality, carbon stocks, water use or biodiversity in the field; the consequences of conversion for those variables are taken from the literature rather than observed here. Property-level compliance trajectories, the displacement dynamics that the lag analysis makes plausible but does not demonstrate, irrigation expansion, and a validation sample large enough to produce formal accuracy statistics for the overlap estimates all remain open lines of work.
5. Conclusions
This study reconstructed four decades of soybean expansion in the MATOPIBA region of Piauí at 30 m resolution and quantified, for the first time at this scale, the crop’s overlap with the protection instruments of the Rural Environmental Registry and with strictly protected conservation units. Four answers emerge to the questions posed at the outset.
First, the region is a disproportionate locus of native vegetation loss within the state, holding 32.6% of its territory but accounting for 41.1% of the gross and 59.6% of the net loss of native vegetation recorded in Piauí over the period, and the relation between soybean and that loss is closer than a year-to-year transition accounting suggests. Only 23.7% of the 2024 soybean area was converted directly from native vegetation in a single annual step, but 98.9% of it carried native vegetation in 1985, and the median interval between the loss of native cover and the first soybean season is three years, with 71.2% of the area reaching soybean within three years. Expansion over previously cleared land, in this region and in this period, is overwhelmingly expansion over land cleared in the immediately preceding seasons.
Second, the protection instruments of the registry cover considerably less ground than their declared polygons suggest. Removing overlaps between declarations reduces Legal Reserves from 2,790,061 ha to 2,234,197 ha and Permanent Preservation Areas from 1,097,431 ha to 288,035 ha, and the union of all protected categories covers 34.5% of the region rather than the 40.2% obtained by summing categories. Areas derived from a self-declaratory registry should not be used as compliance denominators before overlaps are resolved.
Third, soybean overlaps 12,521 ha of declared Legal Reserves and 1125 ha of declared Permanent Preservation Areas, and this overlapping area is concentrated in a small number of field-scale patches, a pattern robust to the connectivity rule used to define patches. These are indications of potential non-compliance that require verification, not adjudicated violations, and the estimates for Permanent Preservation Areas are the most sensitive to boundary error.
Fourth, cropland is present inside two strictly protected units, and in the Uruçuí-Una Ecological Station it takes the form of a single contiguous complex of 6001 ha, 4.6% of the unit, cultivated continuously since the middle of the last decade and confirmed by independent 10 m imagery. Its significance is normative rather than areal: it indicates an unresolved land-tenure situation in a category of unit that admits no direct use of natural resources at all.
Taken together, the results argue for treating the date of native vegetation loss, rather than the date of first detected cultivation, as the anchor for deforestation-free supply-chain screening in this region; for prioritising the validation of registrations as the limiting step of domestic environmental governance; and for treating land-tenure regularisation inside conservation units as a precondition for their protection. The indicators proposed here are reproducible from public data and can be updated annually, which makes them usable for monitoring rather than only for diagnosis.
Supplementary Materials
The following supporting information can be downloaded at: https://www.mdpi.com/article/10.3390/su18199869/s1, Table S1: Soybean and direct native-vegetation-to-soybean transition by municipality in Piauí’s MATOPIBA, with the local indicators of spatial association.
Author Contributions
Conceptualisation, R.M.S. and G.M.d.E.; methodology, R.M.S., V.d.P.S.J. and G.M.d.E.; software and formal analysis, R.M.S. and G.M.d.E.; investigation and data curation, R.M.S.; validation, V.d.P.S.J. and G.M.d.E.; writing—original draft preparation, R.M.S.; writing—review and editing, V.d.P.S.J. and G.M.d.E.; visualisation, G.M.d.E.; supervision and project administration, G.M.d.E. All authors have read and agreed to the published version of the manuscript.
Funding
This research received no external funding.
Institutional Review Board Statement
Not applicable.
Informed Consent Statement
Not applicable.
Data Availability Statement
All primary datasets are openly available: land-cover maps from the MapBiomas project, Collection 10 (https://brasil.mapbiomas.org); Rural Environmental Registry data from SICAR (https://consultapublica.car.gov.br (accessed on 23 August 2026)); federal conservation-unit boundaries from ICMBio through the Brazilian Spatial Data Infrastructure (https://geoservicos.inde.gov.br, layer ICMBio:limiteucsfederais_a, accessed on 16 September 2026); state conservation-unit boundaries from SEMARH-PI; and Sentinel-2 Level-2A surface reflectance from the Earth Search public catalogue (https://registry.opendata.aws/sentinel-2-l2a-cogs (accessed on 23 August 2026)). The processing scripts that reproduce every figure and every quantity reported in this article, together with the derived layers, are available from the corresponding author upon reasonable request.
Acknowledgments
During the preparation of this manuscript, the authors used Claude (Anthropic; models Claude Opus 5, accessed through the Claude desktop application, September 2026) to assist in writing and debugging the processing scripts and the plotting scripts that produced the figures, in translating and drafting the English text from the authors’ original Portuguese manuscript, and for language editing. The authors have reviewed and edited the output and take full responsibility for the content of this publication.
Conflicts of Interest
The authors declare no conflicts of interest.
References
- Hungria, M.; Mendes, I.C. Nitrogen fixation with soybean: The perfect symbiosis? In Biological Nitrogen Fixation; de Bruijn, F.J., Ed.; Wiley: Hoboken, NJ, USA, 2015; pp. 1009–1024. [Google Scholar] [CrossRef] [Scilit]
- Song, X.-P.; Hansen, M.C.; Potapov, P.; Adusei, B.; Pickering, J.; Adami, M.; Lima, A.; Zalles, V.; Stehman, S.V.; Di Bella, C.M.; et al. Massive soybean expansion in South America since 2000 and implications for conservation. Nat. Sustain. 2021, 4, 784–792. [Google Scholar] [CrossRef] [Scilit]
- Barros, P.H.B. Displacement and spillover effects of soybean and sugarcane on Amazon deforestation: A spatial analysis of indirect land-use change in Brazil. Rev. Bras. Estud. Reg. Urbanos 2026, 20, 79–97. [Google Scholar] [CrossRef] [Scilit]
- MapBiomas. Coleção 10 da Série Anual de Mapas de Cobertura e Uso da Terra do Brasil; MapBiomas: São Paulo, Brazil, 2025; Available online: https://brasil.mapbiomas.org/downloads/ (accessed on 3 June 2026).
- Rudorff, B.; Aguiar, D.A.; Risso, J. Soy Expansion Dynamics in the Cerrado Biome from 2020/21 to 2023/24; Agrosatélite: Florianópolis, Brazil, 2024; 29p. [Google Scholar]
- Strassburg, B.B.N.; Brooks, T.; Feltran-Barbieri, R.; Iribarrem, A.; Crouzeilles, R.; Loyola, R.; Latawiec, A.E.; Oliveira Filho, F.J.B.; Scaramuzza, C.A.M.; Scarano, F.R.; et al. Moment of truth for the Cerrado hotspot. Nat. Ecol. Evol. 2017, 1, 99. [Google Scholar] [CrossRef] [Scilit]
- Spera, S.A.; Galford, G.L.; Coe, M.T.; Macedo, M.N.; Mustard, J.F. Land-use change affects water recycling in Brazil’s last agricultural frontier. Glob. Change Biol. 2016, 22, 3405–3413. [Google Scholar] [CrossRef] [Scilit]
- Salmona, Y.B.; Matricardi, E.A.T.; Skole, D.L.; Silva, J.F.A.; Coelho Filho, O.A.; Pedlowski, M.A.; Sampaio, J.M.; Castrillón, L.C.R.; Brandão, R.A.; Silva, A.L.; et al. A worrying future for river flows in the Brazilian Cerrado provoked by land use and climate changes. Sustainability 2023, 15, 4251. [Google Scholar] [CrossRef] [Scilit]
- Leite-Filho, A.T.; Soares-Filho, B.S.; Oliveira, U.; Coe, M. Intensification of climate change impacts on agriculture in the Cerrado due to deforestation. Nat. Sustain. 2025, 8, 34–43. [Google Scholar] [CrossRef] [Scilit]
- Miranda, E.E.; Magalhães, L.A.; Carvalho, C.A. Proposta de Delimitação Territorial do MATOPIBA; Nota Técnica 1; Embrapa–GITE: Campinas, Brazil, 2014.
- Russo Lopes, G.; Bastos Lima, M.G.; dos Reis, T.N.P. Maldevelopment revisited: Inclusiveness and social impacts of soy expansion over Brazil’s Cerrado in Matopiba. World Dev. 2021, 139, 105316. [Google Scholar] [CrossRef] [Scilit]
- Gomes, C.M.P.; Leite, S.P. Financeirização e land grabbing: Problematizando transformações recentes na expansão da fronteira agrícola do Matopiba. In A Fronteira do Matopiba: As Novas Faces da Expansão do Capital no Campo; Marques, M.I.M., Alves, V.E.L., Eds.; FFLCH/USP: São Paulo, Brazil, 2024. [Google Scholar]
- Rausch, L.L.; Gibbs, H.K.; Schelly, I.; Brandão, A., Jr.; Morton, D.C.; Carneiro Filho, A.; Strassburg, B.; Walker, N.; Noojipady, P.; Barreto, P.; et al. Soy expansion in Brazil’s Cerrado. Conserv. Lett. 2019, 12, e12671. [Google Scholar] [CrossRef] [Scilit]
- Heilmayr, R.; Rausch, L.L.; Munger, J.; Gibbs, H.K. Brazil’s Amazon Soy Moratorium reduced deforestation. Nat. Food 2020, 1, 801–810. [Google Scholar] [CrossRef] [Scilit]
- Soterroni, A.C.; Ramos, F.M.; Mosnier, A.; Fargione, J.; Andrade, P.R.; Baumgarten, L.; Pirker, J.; Obersteiner, M.; Kraxner, F.; Câmara, G.; et al. Expanding the Soy Moratorium to Brazil’s Cerrado. Sci. Adv. 2019, 5, eaav7336. [Google Scholar] [CrossRef] [Scilit]
- European Union. Regulation (EU) 2023/1115 of the European Parliament and of the Council of 31 May 2023 on the making available on the Union market and the export from the Union of certain commodities and products associated with deforestation and forest degradation. Off. J. Eur. Union 2023, L 150, 206–247. [Google Scholar]
- Oliveira, G.M.; Ziegert, R.F.; Pacheco, A.; Berning, L.; Sotirov, M.; Dürr, J.; Braun, D.; Nunes, F.S.M.; Börner, J. Blind spots in the EU’s Regulation on Deforestation-free products. Nat. Ecol. Evol. 2024, 8, 1382–1383. [Google Scholar] [CrossRef] [Scilit]
- Azevedo, A.A.; Rajão, R.; Costa, M.A.; Stabile, M.C.C.; Macedo, M.N.; dos Reis, T.N.P.; Alencar, A.; Soares-Filho, B.S.; Pacheco, R. Limits of Brazil’s Forest Code as a means to end illegal deforestation. Proc. Natl. Acad. Sci. USA 2017, 114, 7653–7658. [Google Scholar] [CrossRef] [Scilit]
- Roitman, I.; Cardoso Galli Vieira, L.; Baiocchi Jacobson, T.K.; da Cunha Bustamante, M.M.; Silva Marcondes, N.J.; Cury, K.; Silva Estevam, L.; da Costa Ribeiro, R.J.; Ribeiro, V.; Stabile, M.C.C.; et al. Rural Environmental Registry: An innovative model for land-use and environmental policies. Land Use Policy 2018, 76, 95–102. [Google Scholar] [CrossRef] [Scilit]
- MapBiomas. RAD2024: Relatório Anual do Desmatamento No Brasil 2024; MapBiomas: São Paulo, Brazil, 2025; 209p. [Google Scholar]
- Vasconcelos, A.; Guidotti, V.; Lathuillière, M.; Gardner, T.; Löfgren, P.; Guedes Pinto, L.F. Soy and Environmental Compliance in Brazil: An Undervalued Risk for Global Markets; Trase: Issue Brief 2; Stockholm Environment Institute & Global Canopy: Stockholm, Sweden, 2019. [Google Scholar]
- Almeida, J.A.S.; Sousa Júnior, V.P.; Espindola, G.M. Land-tenure dynamics and deforestation pressure in MATOPIBA, Brazil: An assessment of the Rural Environmental Registry (CAR), 2019–2025. Land 2026, 15, 700. [Google Scholar] [CrossRef] [Scilit]
- Frota, A.B.; Campelo, G.J.A. Evolução e Perspectivas da Produção de Soja na Região Meio-Norte do Brasil; Embrapa Meio-Norte: Teresina, Brazil, 1999. [Google Scholar]
- IBGE. Produção Agrícola Municipal 2024. Available online: https://sidra.ibge.gov.br/pesquisa/pam/tabelas (accessed on 23 June 2026).
- United Nations. Transforming Our World: The 2030 Agenda for Sustainable Development; Resolution A/RES/70/1; United Nations General Assembly: New York, NY, USA, 2015. [Google Scholar]
- Brasil. Decreto nº 8.447, de 6 de maio de 2015; Dispõe Sobre o Plano de Desenvolvimento Agropecuário do Matopiba. Diário Oficial da União: Brasília, Brazil, 2015.
- IBGE. Cidades e Estados, Censo Demográfico 2022. Available online: https://www.ibge.gov.br/cidades-e-estados.html (accessed on 23 August 2026).
- DNIT—Departamento Nacional de Infraestrutura de Transportes. Base Geográfica do Sistema Nacional de Viação. Available online: https://www.gov.br/dnit/pt-br (accessed on 3 June 2026).
- Souza, C.M., Jr.; Shimbo, J.Z.; Rosa, M.R.; Parente, L.L.; Alencar, A.A.; Rudorff, B.F.T.; Hasenack, H.; Matsumoto, M.; Ferreira, L.G.; Souza-Filho, P.W.M.; et al. Reconstructing three decades of land use and land cover changes in Brazilian biomes with Landsat archive and Earth Engine. Remote Sens. 2020, 12, 2735. [Google Scholar] [CrossRef] [Scilit]
- Gorelick, N.; Hancher, M.; Dixon, M.; Ilyushchenko, S.; Thau, D.; Moore, R. Google Earth Engine: Planetary-scale geospatial analysis for everyone. Remote Sens. Environ. 2017, 202, 18–27. [Google Scholar] [CrossRef] [Scilit]
- Brasil. Lei nº 12.651, de 25 de maio de 2012; Dispõe Sobre a Proteção da Vegetação Nativa (Código Florestal). Diário Oficial da União: Brasília, Brazil, 2012.
- SICAR—Sistema Nacional de Cadastro Ambiental Rural. Base de Dados do CAR. Available online: https://consultapublica.car.gov.br (accessed on 23 August 2026).
- ICMBio—Instituto Chico Mendes de Conservação da Biodiversidade. Limites das Unidades de Conservação Federais. Available online: https://www.gov.br/icmbio (accessed on 1 September 2024).
- ICMBio—Instituto Chico Mendes de Conservação da Biodiversidade. Limites das Unidades de Conservação Federais (limiteucsfederais_a); Distributed Through the Brazilian Spatial Data Infrastructure (INDE) Web Feature Service. Available online: https://geoservicos.inde.gov.br (accessed on 16 September 2026).
- European Space Agency. Copernicus Sentinel-2 Level-2A Surface Reflectance Data, 2024. Processed by ESA and Distributed Through the Earth Search Public Catalogue. Available online: https://registry.opendata.aws/sentinel-2-l2a-cogs (accessed on 16 September 2026).
- QGIS.org. QGIS Geographic Information System, Version 3.40; QGIS Association: Laax, Switzerland, 2024; Available online: https://qgis.org (accessed on 1 September 2024).
- MapBiomas. Accuracy Assessment, Appendix to the Algorithm Theoretical Basis Document (ATBD), Collection 10, 1st ed.; MapBiomas: São Paulo, Brazil, 2025; Available online: https://brasil.mapbiomas.org/wp-content/uploads/sites/4/2025/08/Accuracy-assessment-Appendix-ATBD-Collection-10-v1-1.pdf (accessed on 16 September 2026).
- Escalhão, B. Catch-all classes and invisible crops: A systematic multi-crop comparison of MapBiomas agricultural classification against official agricultural statistics in Brazil. Geomatica 2026, 78, 100109. [Google Scholar] [CrossRef] [Scilit]
- Mingoti, R.; Silveira, H.L.F. Deforestation and Agricultural Expansion in Brazil’s Amazon and Cerrado Biomes: 2020–2024; International Food Policy Research Institute (IFPRI): Washington, DC, USA, 2025. [Google Scholar]
- Rajão, R.; Soares-Filho, B.; Nunes, F.; Börner, J.; Machado, L.; Assis, D.; Oliveira, A.; Pinto, L.; Ribeiro, V.; Rausch, L.; et al. The rotten apples of Brazil’s agribusiness. Science 2020, 369, 246–248. [Google Scholar] [CrossRef] [Scilit]
- Brasil. Lei nº 9.985, de 18 de julho de 2000; Institui o Sistema Nacional de Unidades de Conservação da Natureza (SNUC). Diário Oficial da União: Brasília, Brazil, 2000.
- Pereira, C.C.; Kenedy-Siqueira, W.; Maia, L.R.; Sperandei, V.d.F.; Arantes-Garcia, L.; Fernandes, S.; Fernandes, G.F.C.; de Castro, G.C.; Rodrigues, D.d.J.; Salm, R.; et al. The Cerrado crisis review: Highlighting threats and providing future pathways to save Brazil’s biodiversity hotspot. Nat. Conserv. 2026, 61, 29–70. [Google Scholar] [CrossRef] [Scilit]
- Silva, P. Regularização Ambiental e Apropriação Verde na Estação Ecológica Uruçuí-Una. Master’s Dissertation, Universidade de Brasília, Brasília, Brazil, 2020. [Google Scholar]
- Oliveira, K.R.A. Fronteira agrícola e ameaças às Unidades de Conservação no Cerrado: O caso do Parque Nacional das Nascentes do Rio Parnaíba. Campo-Territ. Rev. Geogr. Agrár. 2021, 16, 389–408. [Google Scholar]
- Data Viva. Balança Comercial do Piauí. Available online: https://www.dataviva.info (accessed on 3 June 2026).
- Peng, D.; Zhang, H.; Zhang, Y.; Yu, L.; Chen, M.; Chen, J.M.; You, L.; Li, P.; Liu, J.; Zhang, X.; et al. Global soybean trade dynamics: Drivers, impacts, and sustainability. Innovation 2026, 7, 101124. [Google Scholar] [CrossRef] [Scilit]

Disclaimer/Publisher’s Note: The statements, opinions and data contained in all publications are solely those of the individual author(s) and contributor(s) and not of MDPI and/or the editor(s). MDPI and/or the editor(s) disclaim responsibility for any injury to people or property resulting from any ideas, methods, instructions or products referred to in the content. |
© 2026 by the authors. Licensee MDPI, Basel, Switzerland. This article is an open access article distributed under the terms and conditions of the Creative Commons Attribution (CC BY) license.