


Abstract
This study aims to evaluate whether context-dependent prediction and an explicit arrival-reserve chance constraint improve the reliability of battery electric vehicle (BEV) route decisions. The framework combines a physics-based energy backbone, grouped out-of-fold residual learning, split-conformal intervals and paired estimated-time-of-arrival (ETA)–energy scenarios. A controlled 12-week semi-synthetic replay contains 500 trips with Tesla Model Y and Volkswagen ID.7 parameterisations. In the event/pedestrian/disruption regime, ETA mean absolute error (MAE) is 0.74 min for the Model Y and 0.75 min for the ID.7 under full context, compared with 17.31 and 15.92 min under reduced context. Across all 1980 candidate routes and both vehicles, the nominal 90% full-context ETA intervals cover 91.2% of realised values. These large prediction gains are conditional on a generator whose designated delay drivers are visible to the full-context model. Relative to time-only routing, reserve violations decrease from 22.0% to 5.2% and from 19.2% to 5.6%, with increases in ratios of mean travel-time of 15.0% and 15.6%, respectively. However, the chance-constrained and quantile-robust policies choose different routes on only 3 of 500 trips and have identical realised violation indicators. The evidence supports explicit risk and fallback reporting within the replay.
1. Introduction
Battery electric vehicles (BEVs) are becoming a central component of urban transport decarbonisation, yet their large-scale adoption is still constrained by operational reliability concerns. In dense metropolitan networks, drivers do not only require a nominal remaining-range estimate; they require confidence that the vehicle will reach its destination with an acceptable energy reserve and a reliable estimated time of arrival (ETA). This requirement is particularly critical in cities where stop–go traffic, signalised intersections, pedestrian activity, roadworks, local events, weather variability and route geometry interact over short time scales. As global electric-vehicle deployment accelerates, navigation systems must therefore move beyond average travel-time optimisation and deterministic range prediction towards uncertainty-aware and risk-constrained decision support [1].
The energy demand of a BEV trip is governed by a coupled physical and behavioural system. Vehicle mass, drivetrain efficiency, battery thermal state and auxiliary loads determine the energy conversion process, while speed profile, acceleration frequency, grade, curvature, pavement condition, wind and ambient temperature shape the required traction and non-traction energy. Previous studies have shown that EV energy-consumption models should consider vehicle-related, traffic-related, environmental and route-related variables simultaneously, rather than relying on a single representative drive cycle [2]. Real-world analyses further indicate that driving style, traffic state, infrastructure and weather can produce substantial deviations from nominal energy consumption, limiting the transferability of models trained under narrow operating conditions [3]. These findings are especially relevant for urban BEV routing, where repeated low-speed acceleration, queue formation and intersection delays can dominate trip-level energy and ETA uncertainty.
Battery performance, charging capability and the availability of compatible infrastructure also influence route feasibility. Sharma et al. [4] review these links across battery technologies, charging strategies and grid integration. The present experiment addresses trips completed without an intermediate charging stop; charging time, station occupancy and charger failure are outside its evaluated decision space. Multi-criteria BEV selection similarly recognises that capacity, charging time, range and other characteristics must be considered together [5]. This motivates reporting several operational criteria, although selecting a vehicle and selecting a route for an already specified vehicle are different problems.
Existing route-level energy estimators and eco-routing methods improve expected consumption, and robust or stochastic formulations accommodate uncertain energy demand [3,6,7,8,9,10,11]. Their objectives do not necessarily answer the operational question considered here: which available route offers the lowest travel cost while keeping the estimated probability of arriving below a specified battery reserve within an explicit tolerance? An upper-quantile objective can favour conservative routes, but it does not by itself constrain that reserve event. Conversely, the presence of a chance constraint does not ensure better realised outcomes when both policies select the same route. This study tests that distinction using paired trips and a common candidate set.
ETA prediction has undergone a similar transition. Deterministic travel-time estimates are increasingly being complemented by probabilistic forecasting methods that quantify interval coverage, sharpness and tail risk. Spatiotemporal graph neural networks have become prominent in traffic forecasting because they can represent road-network topology and dynamic congestion propagation [12]. At the same time, calibrated uncertainty has become essential for downstream decisions, because route selection, replanning and driver information systems depend on the reliability of prediction intervals rather than on mean error alone [13]. In BEV routing, this issue becomes more stringent: ETA and energy are not independent outputs. The same traffic regime that increases travel time may also increase stop frequency, auxiliary-load duration and acceleration losses. Consequently, ETA and energy uncertainty should be propagated jointly through shared route scenarios.
Several high-impact sources of urban variability remain insufficiently integrated into BEV range-assurance frameworks. Signal phase and timing information can substantially affect both stop probability and delay at intersections, particularly where adaptive signal control is used [14]. Public events, school dismissal periods and local disruptions can generate structured but non-periodic traffic anomalies that are not well represented by ordinary time-of-day traffic profiles [15]. Pedestrian crossing intensity can also influence micro-delays and speed-profile smoothness, especially near schools, central business districts and event venues [16]. In addition, pavement roughness and surface condition can introduce systematic rolling-resistance-related energy biases at the link level [17]. Wind direction and magnitude should also be represented when routes include exposed corridors, because the aerodynamic component depends on the vehicle-relative air-flow condition and can vary with headwind, tailwind or crosswind exposure [18]. Rolling-resistance studies further indicate that surface-related resistance may influence both energy demand and environmental performance when route alternatives differ in pavement quality [19]. These variables are not merely secondary descriptors; under adverse or disrupted regimes, they may determine whether the vehicle reaches its destination with sufficient reserve.
Urban motion-planning research provides a complementary basis for selecting contextual inputs. Yan et al. [20] consider passenger preferences, traffic signals and road limits in speed planning, while Zhang et al. [21] address vehicle interactions and driving style in heterogeneous-traffic trajectory prediction. These studies motivate signal-delay, speed and behavioural context at the motion-planning scale. Here, aggregate speed, stop–go and exposure proxies enter a trip-level model whose decision criterion is arrival battery reserve. Individual driver preferences, microscopic interaction trajectories and personalised driving styles are not estimated in the current replay.
A further deployment challenge is data quality. Urban navigation systems rarely operate with complete and synchronous information. Signal data may be unavailable, pedestrian intensity may only be represented by weak proxies, event attendance may be uncertain, and traffic feeds may suffer from latency or sparse probe coverage. If such missingness is ignored, probabilistic models can become overconfident and may recommend routes that appear efficient but are unsafe from a reserve-risk perspective. Recent work on traffic-state estimation and privacy-preserving data fusion highlights the importance of explicitly modelling observation quality, sensor coverage and privacy-related utility loss in intelligent transportation systems [22,23]. For BEV assurance, these issues should be treated as core modelling elements: degraded observability must widen prediction intervals and trigger more conservative route evaluation.
The research aim is to determine whether an explicit arrival-reserve chance constraint changes urban BEV route decisions and their time–energy–risk trade-offs when contextual information and coupled ETA–energy uncertainty are represented consistently. A controlled semi-synthetic replay allows those mechanisms to be examined on identical trips. It also exposes a central limitation: predictive gains depend on how the generator assigns outcome effects to the observed features.
The contribution is a decision-level integration with three testable elements. First, a context-conditioned physics–residual predictor supplies coupled ETA and energy scenarios, rather than evaluating the two outcomes independently. Second, route selection uses an explicit reserve-event probability, records infeasible requests through a minimum-risk fallback, and limits route switching. Third, candidate- and trip-level records permit separate checks of prediction accuracy, interval calibration and realised reserve outcomes. The individual learning, calibration and optimisation tools are established methods. Distinctive practical value over the quantile-robust comparator must therefore be demonstrated by paired route differences, rather than inferred from the architecture alone.
The remainder of the paper critically reviews related methods (Section 2), defines the models and chance constraint (Section 3), documents the semi-synthetic replay and reproducibility protocol (Section 4), reports prediction, calibration, routing, sensitivity, ablation, convergence, and runtime results (Section 5), and concludes with the boundaries of the evidence (Section 6).
2. Related Work
2.1. BEV Energy Prediction and Route-Level Eco-Routing
The operational energy demand of a battery electric vehicle is affected by a combination of vehicle, infrastructure, traffic and environmental variables. Donkers et al. showed that driving style, weather, traffic intensity and built-environment characteristics can substantially affect BEV energy consumption and may change the energy-optimal route choice [2]. This finding is consistent with recent route-level approaches, where link attributes, speed profiles and traffic states have been used to estimate trip energy and support energy-aware path selection [3,6]. Compared with conventional distance-based range estimation, these methods provide a more realistic basis for urban BEV routing because they account for spatially heterogeneous conditions along candidate routes.
Data-driven methods have further improved energy prediction by learning non-linear relationships between driving patterns and energy demand. Deep learning models based on segmented real-world trips have been used to predict BEV energy consumption with higher accuracy than simple physics-based or distance-based models [7]. Sequence models, including long short-term memory (LSTM)–Transformer architectures, have also been proposed to capture temporal dependencies in speed, acceleration and contextual variables [8]. However, purely data-driven models may degrade under distribution shift, especially when deployed in new cities, seasons or disruption regimes. Therefore, hybrid modelling remains attractive: a physics-based backbone can preserve interpretability and extrapolation stability, while a learned residual can correct systematic errors caused by unobserved or weakly modelled factors.
Most deterministic eco-routing methods optimise an expected energy or time objective and therefore do not directly control the probability of an insufficient arrival reserve. Pelletier et al. modelled uncertain energy in EV routing [9], Jeong et al. proposed an adaptive robust formulation under energy uncertainty [10], and Han et al. considered joint travel-time and energy uncertainty [11]. Robust and stochastic formulations are important comparators, but they generally differ in uncertainty representation, operational context, or explicit treatment of correlated ETA–energy residuals. Accordingly, the present study includes a quantile-robust policy rather than comparing only with time-only and energy-only baselines.
2.2. Probabilistic ETA Forecasting and Uncertainty Calibration
Urban ETA prediction has increasingly shifted from deterministic point estimation to probabilistic forecasting. Spatiotemporal graph neural networks have become prominent because they can represent road-network topology and capture congestion propagation across adjacent links [12]. For BEV routing, this capability is important because travel time and energy demand are coupled through the same speed profile, stop frequency and delay processes. A route that appears fast under nominal traffic may become energy inefficient when repeated stopping, signal delays or queue spillback occur.
Prediction uncertainty must also be calibrated. In operational systems, an accurate mean estimate is not sufficient if the prediction interval is too narrow or systematically undercovers realised outcomes. Conformal prediction provides a practical framework for constructing prediction intervals with distribution-free coverage guarantees under exchangeability assumptions [13]. This is relevant to BEV routing because the decision layer should know whether the predicted ETA and energy intervals are reliable enough to support a reserve-sensitive route recommendation. In this context, uncertainty should not be treated as an auxiliary diagnostic; it should be propagated into the route-selection problem itself.
2.3. Urban Context: Signals, Events, Pedestrians, Weather, and Surface Effects
Dense urban networks contain several context sources that can create structured deviations from ordinary traffic profiles. Signalised intersections are a major source of ETA and energy variability because they influence stopping probability, queue delay and acceleration demand. Connected-vehicle data can be used to estimate signal phase and timing, while adaptive signal control introduces time variation that should be represented probabilistically rather than as a fixed delay [14,24].
Event-driven traffic is another important source of non-recurrent variability. Public events, school dismissal periods and local disruptions can produce predictable spatiotemporal demand surges that are not captured by average time-of-day traffic models. Event-aware traffic forecasting has shown that venue-related indicators can improve speed prediction when spatial influence zones are represented explicitly [15]. Similarly, pedestrian crossing activity affects urban driving through yielding, deceleration and micro-delays. Pedestrian intention and crossing prediction studies provide a basis for modelling stopping probability and safety-relevant delay near crossings [16]. For BEV routing, these signals should not be used to optimise aggressively through pedestrian areas; rather, they should support cautious route evaluation, smoother speed profiles and conservative uncertainty estimation.
Weather, wind and surface characteristics may also influence route-level BEV energy consumption. Pavement–vehicle interaction and road roughness can affect rolling resistance and vibration-related losses, while surface descriptors may become relevant when alternative routes differ in pavement quality [17]. Wind direction and magnitude are retained as optional context variables because headwind, tailwind and crosswind components can alter the relative air-flow condition used in aerodynamic drag modelling [18]. Rolling-resistance research further shows that surface-related resistance has measurable energy and environmental implications, particularly when high-resolution pavement descriptors are available [19]. These factors are often secondary under normal low-speed urban conditions, but they may become relevant on exposed corridors, bridges, ring-road segments or weather-affected routes.
2.4. Data Quality, Risk-Aware Routing, and Research Gap
A practical BEV assurance system cannot assume complete and synchronous data. Traffic feeds may be sparse or delayed, signal timing may be unavailable, event information may be uncertain, and privacy filters may reduce the utility of mobility traces. Traffic-state estimation studies show that sparse vehicle trajectories can be used to infer missing traffic states, but the uncertainty of such estimates must be quantified [22]. Privacy-preserving traffic data fusion further demonstrates that model utility and calibration can change when data are aggregated, filtered or distributed across parties [23]. These issues are directly relevant to BEV navigation because degraded observability can lead to overconfident ETA and energy predictions.
Recent studies also indicate why uncertainty-aware and context-sensitive prediction should be treated as a decision-layer requirement rather than only as a forecasting problem. Uncertainty-aware delay prediction has shown that the dynamic predictability of transport-system delay can vary over time and operating regime, which supports the use of calibrated prediction intervals in downstream routing decisions [25]. Connected and automated vehicle studies further show that connected-vehicle information can influence both traffic efficiency and safety, but that its operational value depends on data availability, penetration rate and system-level integration [26]. Pedestrian-interaction studies under adverse weather also suggest that vulnerable-road-user behaviour and environmental conditions should be represented cautiously when estimating crossing-related delay or uncertainty near schools, central areas and event venues [27]. In parallel, recent EV energy-prediction and optimisation studies continue to show that energy-aware routing depends on accurate and adaptive trip-energy models rather than on fixed distance-based consumption assumptions [28].
The studied gap concerns the connection between context-dependent prediction and an auditable reserve decision. Deterministic eco-routing does not explicitly limit the reserve-event probability, while a quantile-based objective need not impose a specified reserve threshold. The present framework makes that threshold, the associated risk tolerance and infeasibility visible. Its comparative benefit remains an empirical question, particularly when energy-efficient and risk-feasible routes coincide. The Vehicle Energy Dataset (VED) [29] and Extended Vehicle Energy Dataset (eVED) [30] offer possible external-validation resources, but the additional context required by the proposed architecture would need separate acquisition or a reduced-feature evaluation.
- (i)
- Fuse heterogeneous urban context and vehicle telemetry;
- (ii)
- Produce calibrated distributions for both ETA and trip energy;
- (iii)
- Select routes under an explicit arrival-reserve risk constraint.
The proposed contribution is consequently an integration contribution with a falsifiable operating criterion: among candidate routes, select the lowest-cost route whose estimated probability of an arrival reserve below Rmin does not exceed α. Prediction error, coverage, constraint satisfaction, and routing stability are evaluated separately because one does not imply another.
3. Problem Formulation and Methodology
Figure 1 summarises the proposed architecture. Vehicle and route information condition ETA and energy predictions; paired uncertainty scenarios then produce route-specific reserve-risk estimates for constrained selection and replanning. The diagram includes potential field-data inputs. The evaluated replay uses the aggregate proxy variables listed in Section 4.4, not live telemetry or all of the architectural input streams.
Figure 1.
Overview of the proposed context-aware and risk-constrained BEV routing framework.
As shown in Figure 1, the same scenario realisation feeds the ETA, energy, and reserve-risk branches; the route decision is therefore based on coupled, rather than independently generated, uncertainty estimates.
3.1. Operational Problem
At decision time t, the planner generates a finite candidate set t containing three to five network-feasible routes. For route r, Tr and Er denote coupled random travel time and trip energy demand. Bt is the estimated usable battery energy available at the decision time, Rmin is the minimum acceptable arrival reserve, and α is the maximum tolerated probability of falling below that reserve.
The assurance event and chance constraint are defined explicitly as pr = Pr(Bt − Er < Rmin) and pr ≤ α. The main operating point uses Rmin = 3.0 kWh and α = 0.10. With the assumed usable capacities, 3.0 kWh corresponds to 5.0% for the Model Y and 4.3% for the ID.7; the same absolute threshold is retained to preserve paired policy comparisons. Sensitivity to Rmin ∈ {2,3,4} kWh and α ∈ {0.05,0.10,0.15,0.20} is reported rather than treating the main values as universal.
These metrics answer different questions. Mean absolute error (MAE) measures point-prediction error. Prediction-interval coverage measures marginal uncertainty calibration. The estimated reserve-event probability determines candidate feasibility, and the realised violation rate describes the observed frequency after route selection. Neither low MAE nor marginal interval coverage alone establishes conditional reserve protection.
Rr = Eusable,t − Er,
Here, Bt and Eusable,t denote the same usable battery energy available at decision time t. The reserve-violation probability is defined as:
where Rmin denotes the minimum acceptable arrival reserve. A route is considered assurance-feasible when:
πr = Pr(Rr < Rmin),
πr ≤ α.
The decision problem minimises a normalised weighted cost among routes satisfying pr ≤ α. If no route is feasible, the planner selects the minimum-risk route, breaking ties by objective value and expected ETA, and marks the decision as a fallback. Fallback frequency is reported so infeasibility is not hidden.
Equations (1)–(3) define the study-specific reserve accounting and feasibility event. They follow by subtracting trip energy from available usable battery energy and comparing the resulting reserve with a prescribed threshold. Available energy is treated as fixed within each decision, and charging during the evaluated trip is excluded. Equations (4)–(8) express shared scenario indexing and additive link time/energy accounting; they assume consistent energy units and no double counting of auxiliary demand. The replay implements aggregate route backbones rather than a measured link-by-link traction reconstruction. Equation (9) is the standard empirical coverage measure used in conformal evaluation [13]. Equations (10)–(12) specify the study’s weighted selection rule using established stochastic/robust-routing concepts [9,10,11]; the weights and fallback rule are design choices.
3.2. Context Representation
The proposed field architecture combines vehicle state, static route attributes and dynamic urban context. Potential vehicle inputs include state of charge (SoC), usable energy, estimated payload, tyre category and thermal state. The present replay uses the smaller set of generated aggregate descriptors identified in Section 4.4; availability of a field input in the architecture does not establish that it was observed or fitted in this experiment.
Potential link inputs include length, grade, curvature, speed limits, surface class and intersection metadata. Dynamic field inputs could include traffic conditions, incidents, signal phase and timing (SPaT), weather, wind and pedestrian or event indicators. In the retained replay, these mechanisms are represented only through route-level speeds, delays, factors and flags, as listed in Section 4.4.
Separate latency, missingness, staleness and confidence channels are proposed for future field integration. The archived experiment retains one aggregate data_quality variable and a specified reduced-context residual inflation. The analysis does not establish performance for separately measured stream-quality channels.
3.3. Joint Scenario Generation and Dependence Preservation
For candidate route r, scenario m is Sr,m = (Tr,m, Er,m). Both components share the same sampled operating context and the same index from a paired fold-specific residual pool. Hence, a congestion realisation simultaneously affects movement time, signal delay, stop-and-go losses, and duration-dependent auxiliary demand.
Ωr = {ωr,1, ωr,2, …, ωr,M}.
Let (uT,m, uE,m) be a paired ETA–energy residual drawn with replacement from the calibration pool. Scenario values are and . Sampling paired residuals, rather than drawing uT and uE independently, retains the empirical cross-outcome dependence within each held-out fold. Representative correlations are documented in supporting files available from the author upon request.
M = 100 scenarios are used at the main operating point. The estimate is then used in the chance constraint. A convergence experiment compares M ∈ {25,50,100,250,500,1000} with M = 5000 and reports risk-estimation error, route agreement, and decision latency.
For 100 scenarios, the estimated probability changes in increments of 0.01. Feasibility is based on this Monte Carlo point estimate, without a one-sided confidence bound. The procedure therefore enforces an estimated scenario constraint, not a finite-sample guarantee on the unknown true probability. Split-conformal marginal coverage does not remove this distinction after adaptive route selection.
where Trun,e,m represents movement time under the sampled speed regime, Tcontrol,e,m represents delays caused by signals, crossings and turning movements, and Tdisrupt,e,m represents additional delay caused by incidents, roadworks or event-related congestion. This decomposition is useful because urban ETA uncertainty is often caused by control delay and non-recurrent disturbances rather than by link length alone.
Te,m = Trun,e,m + Tcontrol,e,m + Tdisrupt,e,m,
Route-level travel time is then obtained by summing over all links in the candidate route:
The scenario set yields empirical ETA and energy distributions, joint tail behaviour, and a directly auditable reserve-risk estimate for every candidate route.
3.4. Physics-Residual ETA and Trip-Energy Prediction
Energy prediction uses , where Ephys,r combines vehicle-specific distance consumption and duration-dependent auxiliary load, and fE is a residual learner. ETA uses an analogous nominal movement-and-delay backbone plus residual fT. This structure retains a physically interpretable baseline while allowing contextual deviations.
Ee,m = Etrac,e,m + Eaux,e,m + εe,m.
Both residual functions are gradient-boosted regression trees with 140 estimators, learning rate 0.035, maximum depth 2, minimum leaf size 8, and Huber loss. Numerical inputs are standardised and categorical vehicle, regime, departure-period, and route-type inputs are one-hot encoded. Full-context and reduced-context models are trained separately.
Evaluation is six-fold and grouped by week. In each fold, held-out weeks are never used for fitting; the final two non-test weeks form a fold-specific conformal-calibration pool, and the remaining non-test weeks fit the residual learners. Reported candidate-route predictions are out-of-fold, preventing trip or week leakage into the evaluated predictions.
Route-level energy demand under scenario m is calculated as:
The two vehicle classes have separate physical parameters but share the learning architecture. Applying the framework to another BEV requires recalibration of usable capacity, baseline consumption, auxiliary load, and the residual model; the present results do not establish vehicle-universal accuracy.
3.5. Probabilistic Calibration
Fold-specific split-conformal absolute-residual quantiles construct central 50%, 80%, 90%, and 95% intervals for ETA and energy. Calibration is evaluated through empirical coverage, coverage error relative to the nominal level, mean interval width (sharpness), and the interval score, which penalises both width and misses.
Calibration is evaluated using prediction-interval coverage probability (PICP). For a nominal (1 − β) prediction interval [li, ui], the empirical coverage is:
Coverage close to nominal is evidence of marginal calibration only. It does not by itself prove that is correct in the reserve tail or that a route will satisfy the operational chance constraint; these properties are checked separately with realised violations, sensitivity, and scenario convergence.
3.6. Chance-Constrained Route Selection
For feasible routes, Equation (10) combines candidate-set min–max-normalised expected time, expected energy, comfort cost and safety/exposure cost. For each criterion x, N(x) = (x − min x)/(max x − min x), with extrema taken over the same candidate set; a constant criterion is assigned zero. Lower values are preferred for all four terms. The fixed weights are wT = 0.45, wE = 0.25, wC = 0.10 and wS = 0.20. These weights specify a replay preference and are not estimated passenger preferences.
Jr = wT N(𝔼[Tr]) + wE N(𝔼[Er]) + wC N(Cr) + wS N(Sr)
The full policy uses joint full-context scenarios and . The reduced policy masks traffic/signal, weather/wind, pedestrian, event/disruption, and data-quality groups as defined in Section 4, then applies an 18% residual-inflation factor. A quantile-robust comparator minimises the same cost using 90th-percentile ETA and energy without an explicit chance constraint.
The selected route is obtained as:
subject to:
Pr(Rr < Rmin) ≤ α.
When no route satisfies the chance constraint, the fallback is explicit: choose the route with the smallest estimated reserve risk. This preserves a defined action while signalling that the requested risk tolerance could not be certified for the candidate set.
3.7. Rolling-Horizon Replanning and Stability Control
Four within-trip update opportunities are replayed. A replan is counted only when the selected candidate changes after hysteresis: either the incumbent exceeds α and the alternative lowers estimated risk by at least 0.02, or the alternative improves expected ETA by more than 5%. Replan rate is the number of accepted switches per 10 km.
The oscillation indicator equals one when the accepted route sequence contains A→B→A in three consecutive updates and zero otherwise. This definition captures route flapping rather than merely the number of updates. The 5% improvement threshold functions as the route-switching hysteresis requested for operational stability.
The main latency measurement covers candidate prediction, paired scenario sampling, chance-constraint evaluation, and selection; offline model training is excluded, as it would not occur inside a navigation update.
3.8. Full-Context, Reduced-Context, and Ablated Observability
Full context includes vehicle and route descriptors plus traffic/signal, weather/wind, pedestrian, event/disruption, and data-quality groups. Reduced context retains the basic vehicle, route, departure, and regime descriptors but removes these five dynamic groups. Ablation models remove one group at a time from the full specification and are evaluated on the same out-of-fold routes.
Because all settings use identical trips, candidate routes, and folds, error and routing differences are paired. The ablation asks which streams add measurable predictive value; it does not claim that the synthetic feature effects equal field-sensor value.
3.9. Evaluation and Statistical Analysis
Prediction metrics are MAE, root mean squared error (RMSE), bias, empirical interval coverage, interval width, and interval score. Routing metrics are travel time in minutes and percentage increase, energy, realised reserve violation, estimated risk, feasibility and fallback rates, replans per 10 km, and the A→B→A oscillation indicator.
All policy comparisons use the same trips. Ninety-five percent confidence intervals (CIs) are obtained from 10,000 trip-level paired bootstrap resamples within vehicle strata. Prediction absolute-error differences and travel-time penalties use one-sided Wilcoxon signed-rank tests; paired binary reserve outcomes use an exact McNemar/binomial test. p values smaller than machine-readable reporting precision are stated as p < 0.001.
Weeks are the grouping unit for train/test separation, whereas trip is the bootstrap unit. The bootstrap therefore quantifies trip-level sampling uncertainty conditional on the designed replay; it is not a substitute for multi-city or field-operational replication.
4. Case Study and Experimental Design
4.1. Study Area and Experimental Scope
The evaluation is a controlled semi-synthetic replay motivated by dense urban travel in Ankara, Türkiye. No instrumented-vehicle field trial, live route intervention or measured Ankara telemetry was used. The results test internal method behaviour under stated assumptions and must not be interpreted as deployment-level reliability.
The evaluation was designed around everyday urban travel rather than isolated drive cycles. The replay protocol included weekday commuting, afternoon school pick-up chains, weekend leisure trips and event-related trips. These trip categories were selected because they generate different combinations of traffic density, intersection delay, pedestrian activity, route choice flexibility and auxiliary energy demand. The objective was not to reproduce all possible Ankara traffic states, but to create a controlled and repeatable evaluation setting in which the marginal value of context-rich and uncertainty-aware routing could be tested.
The Tesla Model Y and Volkswagen ID.7 parameterisations were selected as two contrasting passenger-BEV examples for testing whether the same decision rule behaves similarly under different capacity, distance-consumption and auxiliary-load assumptions. The assumed usable capacities are 60 and 70 kWh, baseline consumption values are 0.175 and 0.160 kWh/km, and auxiliary loads are 0.82 and 0.74 kW, respectively. These engineering inputs provide a controlled cross-parameter comparison; they do not identify a measured model year, trim, battery chemistry or homologation specification. The two cases are neither a representative fleet sample nor an empirical brand comparison.
The replay contains 250 base trips per vehicle over 12 weeks and three to five candidates per trip. Regime probabilities are 0.40 weekday peak, 0.25 off-peak, 0.20 event/pedestrian/disruption, and 0.15 weather-affected. The fixed seed is 20260702.
4.2. Semi-Synthetic Replay Generation
All trip trajectories, traffic/signal delay factors, pedestrian activity, event/disruption indicators, weather/wind variables, data-quality descriptors, starting energy margins, candidate alternatives, and realised outcomes are generated or inferred by the replay script. Vehicle energy-capacity and baseline-consumption constants are engineering parameter assumptions. Geographic naming and regime structure provide context only; they are not evidence of a measured Ankara fleet dataset.
The supporting workbooks provide candidate-level inputs, fold assignments, out-of-fold predictions, scenario summaries, and trip-level policy decisions. Supporting documents document the semi-synthetic generation protocol, while the accompanying executable analysis operates directly on the retained candidate and scenario records. These materials, including the executable analysis script, are available from the author upon request and support reproducible evaluation of the paired policy comparisons, ETA-error diagnostics, candidate-diversity analysis, and fixed-scenario risk-tolerance assessment reported in this study. Realised ETA combines route-profile speed, regime-dependent delay, event, pedestrian, disruption, and stochastic terms. Realised energy combines vehicle-specific distance demand, auxiliary demand proportional to realised duration, route/profile effects, weather and wind terms, stop-and-go effects, and correlated stochastic error. The full-context learner observes these designated explanatory groups; reduced and ablated learners do not.
Because the full-context model receives the contextual variables associated with the simulated delay and disturbance mechanisms, the full-versus-reduced comparison should be interpreted as the value of contextual information within the controlled replay. Week-grouped out-of-fold evaluation separates fitting and test weeks, while realised outcomes are treated as evaluation targets rather than route-decision inputs. External validation using independently observed traffic and vehicle data remains an important extension of the present controlled analysis.
The main minimum reserve is Rmin = 3.0 kWh and the main risk tolerance is α = 0.10. These values define an illustrative assurance policy, not a universal safety recommendation. Sensitivity results for alternative reserve and tolerance settings are presented in Section 5; the detailed supporting results are available from the author upon request.
Prediction evaluation uses full-context, reduced-context, and deterministic-backbone settings. Routing evaluation uses time-only, energy-minimising, full-context risk-aware, reduced-context risk-aware, and quantile-robust policies. Every policy sees the same realised candidate outcomes.
Public VED and eVED resources [29,30] were not merged into this replay because they do not supply the complete context specification assumed here. Restricting the experiment to 500 generated trips over 12 weeks provides a common, inspectable set of route alternatives and operating regimes. This is a controlled experimental scope, not a power-based sample-size justification or evidence that public telemetry is unsuitable. A reduced-feature test on independent telemetry remains necessary for external validation.
Accordingly, the experiment establishes reproducibility and internal comparative validity under the stated design. External validity to other cities, vehicles, seasons, drivers, battery ages, or data-service conditions remains open.
4.3. Observability Settings
Full context retains vehicle and route descriptors together with the available traffic/signal, weather/wind, pedestrian, event/disruption and data-quality proxies. The prediction and scenario summaries are evaluated on the same candidate routes as the reduced-context setting.
Reduced context retains the basic vehicle, route, departure-period, and regime descriptors while removing the five dynamic feature groups defined in Section 3.8. Its scenario residuals are inflated by 18% to represent the increased uncertainty associated with reduced observability. The comparison is therefore conducted consistently at the documented feature-group level.
The paired comparison holds trips and candidate geometry fixed. It quantifies performance under the two stored information settings, conditional on the generator and the reported model specification. It does not identify the causal value of collecting a particular field-data stream.
4.4. Data Elements and Feature Construction
The implemented records must be distinguished from the richer field architecture in Section 3.2. The Candidate_Predictions worksheet in the supporting workbooks, available from the author upon request, stores categorical vehicle, regime, departure_period and route_type descriptors. The retained numerical/context fields are route_length_km, traffic_speed_kmh, signal_delay_min, stop_go_factor, grade_factor, weather_factor, wind_factor, event_flag, pedestrian_flag, disruption_flag and data_quality. These are generated route-level variables, not acquired vehicle or roadside measurements.
The archive also stores eta_backbone_min, eta_backbone_reduced_min and energy_backbone_kwh as derived model quantities; comfort_proxy and safety_proxy are route-objective inputs, and starting_available_energy_kwh is a reserve-accounting input. Trip, candidate, week and fold identifiers support grouping and evaluation. They should not be interpreted as physical predictors merely because they appear in the same worksheet.
Realised ETA, realised energy, realised arrival reserve, and the realised violation indicator are evaluation outcomes, whereas predictions, interval endpoints, and scenario-risk summaries are derived model outputs. The documented feature groups and preprocessing procedure used for evaluation are described in Section 3.4 and Section 4.4.
The route-level traffic speed, signal delay and stop–go fields represent aggregate operating conditions. Weather and wind are factors, and pedestrian, event and disruption inputs are flags. The archive contains no microscopic vehicle trajectories, individual driving-style labels, time-stamped GPS tracks or measured school-window feeds. Claims about those inputs are therefore restricted to possible extensions of the architecture.
A single data_quality score is retained in the replay records. Separate stream-level latency, missingness, staleness and confidence channels are architectural possibilities, not independently recorded predictors in this dataset. The reported reduced-context inflation and the data-quality ablation are interpreted within that aggregate proxy representation.
The vehicle-level energy modelling literature supports keeping platform parameters and control strategy distinct from route-level context. Electric-vehicle simulation studies have shown that vehicle parameters and regenerative braking can materially affect energy consumption and range [31], while cell-level characterisation for hybrid-vehicle batteries demonstrates the importance of representing charge–discharge behaviour explicitly [32]. In electrified powertrains, supervisory control of fuel-cell and battery sources [33] and fuzzy-logic energy management in parallel hybrids [34] further show that the same route demand can produce different energy trajectories under different component and control assumptions. These findings support the present separation between route/context descriptors and vehicle-specific energy parameters rather than treating a single consumption coefficient as transferable across powertrains.
Recent studies in Engineering Perspective provide complementary evidence for this context dependence across electrified systems. Reviews of fuel-cell hybrid architectures emphasise application-specific power-source coordination [35]; CAN-based measurements of battery-electric vehicles report distinct energy-consumption behaviour between urban and highway operation [36]; and regenerative-suspension modelling shows that vehicle speed and road roughness jointly affect recoverable energy and ride-comfort trade-offs [37]. These results are consistent with the present use of traffic, road, and operating-regime descriptors as explanatory context rather than fixed corrections.
4.5. Scenario Strata
The evaluation was stratified by operating regime because the benefit of context-rich routing is expected to be regime dependent. Four principal regime groups were defined.
The stored regime labels are weekday peak, off-peak, event/pedestrian/disruption and weather-affected. Departure period supplies a separate temporal descriptor. The analysis reports these recorded strata; it does not claim separate validated samples for school dismissal, rainfall, cold mornings or event venues that are not independently identified in the retained outputs.
Stratified reporting was used instead of relying only on aggregate averages. This is important because a method may appear only marginally better under normal conditions but may provide substantial benefits during disruptions, event dispersal, school-window periods or adverse weather.
4.6. Experimental Workflow
The experimental workflow comprises trip and candidate generation, six week-grouped folds, residual-model fitting, calibration, paired-scenario evaluation, route selection, and paired and distributional diagnostics. Candidate predictions and scenario summaries are subsequently used to evaluate routing decisions under identical candidate sets. The executable analysis script is available from the author upon request and reproduces the reported secondary diagnostics directly from the retained records.
Open-loop prediction is assessed on all held-out candidate routes. Closed-loop replay evaluates route choice and four update opportunities per base trip. Candidate generation is held constant across policies.
Additional experiments vary the risk tolerance, minimum reserve, objective time weight, and scenario count; remove one contextual feature group at a time; measure execution latency; and apply offline SoC-bias and capacity-aging perturbations. These are controlled stress tests, not substitutes for sensor-in-the-loop validation.
4.7. Baseline and Comparator Methods
All comparators use identical trips, candidates, realised outcomes, and physical parameterisations. This prevents a policy from benefiting from a different candidate set.
The routing and prediction-layer comparators are:
- B1—Time-only: minimise expected ETA; no explicit energy or reserve constraint.
- B2—Energy-minimising: minimise expected energy from the same scenario summaries; no time-risk trade-off.
- B3—Deterministic backbone: use nominal physics and delay estimates without residual calibration; prediction-layer evaluation only.
- B4—Reduced-context hybrid: retain the residual architecture but mask the five dynamic context groups.
- B5—Quantile-robust: minimise a weighted cost of 90th-percentile ETA and energy plus comfort/safety proxies, without an explicit reserve chance constraint.
- B6—Proposed full risk-aware: minimise expected multi-criteria cost subject to ; if infeasible, use the documented minimum-risk fallback.
The quantile-robust policy provides a stronger uncertainty-aware comparator than deterministic time-only and energy-only strategies. Results are interpreted by safety–time trade-off rather than by assuming that the proposed policy must dominate every metric.
4.8. Evaluation Metrics
Main-text reporting separates prediction accuracy, calibration, reserve-risk satisfaction, stability, and computation. Supporting workbooks containing candidate- and trip-level outputs, bootstrap summaries, sensitivity results, ablations, dependence diagnostics, and stress tests are available from the author upon request.
Calibration is reported at four nominal levels and includes sharpness and interval score. Reserve-risk performance is reported both as model-estimated risk and realised violation; no inference is made from MAE alone.
For travel-time cost, both minutes and within-trip percentage increase relative to time-only routing are reported. This prevents a five-minute penalty from being interpreted without reference to trip duration.
For the new full-versus-quantile comparisons, 95% percentile intervals use 10,000 paired trip-level bootstrap samples within each vehicle and a fixed analysis seed of 20260916. Route-diversity subgroups are descriptive and use the same paired procedure within subgroup. ETA distributions use all candidate records and are descriptive; multiple candidates from one trip are not treated as independent field replications.
The complete environment manifest records Python 3.12.13, NumPy 2.3.5, pandas 2.2.3, SciPy 1.17.0, and scikit-learn 1.8.0. The decision-latency benchmark runs on a Linux x86_64 environment with nine logical CPUs; it excludes offline training.
4.9. Ethical and Safety Considerations
The case study evaluates a proposed decision rule offline. No live route intervention, instrumented driving or passenger experiment was conducted. Future trials should limit replanning burden, explain uncertainty through a human–machine interface (HMI), and include fail-safe behaviour under missing or delayed information.
Pedestrian-, school- and event-related features were incorporated only to support anticipation, risk-aware decision-making and uncertainty estimation. They were not used to encourage aggressive routing through pedestrian-intensive areas. In practical deployment, these features should support smoother deceleration, safer reserve planning and more transparent driver information rather than time-minimising behaviour at the expense of vulnerable road users.
Environmental responsibility in road transport also extends beyond in-trip energy use. Inventory-based research on motor-vehicle exhaust emissions illustrates how fleet composition, fuel type, emission standard, and activity data can be combined to quantify local atmospheric pollutant burdens [38]. That broader urban-environment perspective complements the present route-level safety discussion, although emissions-inventory outcomes are outside the evaluated replay.
5. Results and Discussion
5.1. Out-of-Fold Prediction Accuracy and Calibration
Table 1 reports held-out performance in the most context-sensitive regime. Full context materially improves ETA accuracy for both vehicles. Its energy improvement is smaller in absolute magnitude because the physical backbone already captures distance and duration; nevertheless, paired absolute-error reductions remain statistically significant.
Table 1.
Out-of-fold prediction performance under event-, pedestrian-, and disruption-affected replay regimes.
For the Model Y, full-context ETA MAE is 0.74 min versus 17.31 min under reduced context; for the ID.7 the corresponding values are 0.75 and 15.92 min. Across all regimes, the paired mean reduction in absolute ETA error is 8.82 min for the Model Y and 7.82 min for the ID.7 (both one-sided Wilcoxon p < 0.001).
The reduced model’s very wide 90% ETA interval exposes an important distinction: aggregate coverage can be near nominal while predictions are too diffuse to be operationally sharp. The interval score therefore accompanies PICP, and the full-context model is preferred for both accuracy and sharpness rather than coverage alone.
Across all held-out candidate routes, nominal full-context ETA coverages of 50%, 80%, 90%, and 95% yield empirical values of 52.2%, 80.8%, 91.2%, and 96.7%. Energy coverages are 53.4%, 84.2%, 93.0%, and 96.5%. The four reliability curves in Figure 2 compare ETA and energy calibration under full and reduced context against the identity line.
Figure 2.
Nominal versus empirical split-conformal coverage for ETA and energy.
These calibration diagnostics do not establish route-risk calibration by themselves. Operational evidence is therefore based on realised reserve events in Section 5.2 and Section 5.3 and scenario-count stability in Section 5.5. Figure 2 shows that all four empirical-coverage curves remain close to or above the identity line, but the reduced-context energy curve is consistently the most conservative. This apparent over-coverage must be interpreted together with interval width and interval score: near-nominal coverage alone does not imply sharp or decision-useful uncertainty estimates.
Prediction accuracy is examined separately in Figure 3, which compares the full-context, reduced-context, and deterministic-backbone ETA MAE values for the two vehicles under event-, pedestrian-, and disruption-affected conditions.
Figure 3.
Out-of-fold ETA MAE under event-, pedestrian-, and disruption-affected regimes.
Figure 3 shows substantial error reductions within this replay. The full-context model receives variables that encode the same delay mechanisms used to generate ETA, whereas the reduced model omits major drivers. The strong full-context performance should therefore be interpreted within the controlled semi-synthetic design, where the contextual variables are aligned with the mechanisms governing the generated outcomes. Week-grouped out-of-fold evaluation limits direct train/test information transfer, while external-data validation is required to quantify generalisation beyond the replay.
5.2. Reserve Assurance and the Time–Safety Trade-Off
Table 2 compares all routing policies. The chance-constrained and quantile-robust policies attain safety close to energy minimisation, whereas time-only routing retains the shortest mean journey. The proposed policy’s value is an explicit, inspectable risk threshold and fallback status rather than universal dominance of every comparator.
Table 2.
Routing outcomes under alternative policies in the semi-synthetic replay.
For the Model Y, full risk-aware routing reduces realised reserve violations by 16.8 percentage points, from 22.0% to 5.2% (paired 95% CI for the reduction, 12.4–21.6 percentage points; exact paired test p < 0.001). For the ID.7 the reduction is 13.6 points, from 19.2% to 5.6% (95% CI, 9.6–18.0; p < 0.001).
The mean time cost is 6.28 min for the Model Y and 5.89 min for the ID.7. Dividing each difference by the corresponding time-only mean gives 15.0% and 15.6%. Averaging the percentage increase separately within each paired trip instead gives 15.6% and 15.8%; these are different estimands. The main text uses the ratio of means consistently.
5.3. Routing-Policy Outcomes
Building on the time–safety comparison above, Table 2 should be read as a paired policy-outcome summary; 95% bootstrap intervals for every entry are documented in supporting document, which is available from the author upon request. Chance-constraint feasibility and fallback are policy diagnostics and are not imputed as successful certifications.
The paired comparison indicates close agreement between the full risk-aware and quantile-robust policies. Full risk-aware minus quantile-robust mean travel time is +0.0287 min for the Model Y (95% paired-bootstrap interval 0.0000 to 0.0862) and +0.0454 min for the ID.7 (0.0000 to 0.1151). Corresponding energy differences are −0.000722 kWh (−0.002165 to 0.000000) and −0.000591 kWh (−0.001824 to 0.000051). Selected routes differ on only 1/250 and 2/250 trips. Realised violation indicators agree on every trip, giving a paired difference of zero percentage points. The zero-width bootstrap interval for this binary difference reflects the absence of discordant outcomes in this sample; it is not proof of equivalence in the population.
Candidate diversity was examined across all 1980 archived alternatives. Within-trip expected-time spans range from 1.26 to 91.50 min for the Model Y and 0.74 to 65.60 min for the ID.7; corresponding energy spans are 0.413–2.373 and 0.390–2.369 kWh. Median time spans are 15.77 and 13.38 min, while median energy spans are 0.958 and 0.922 kWh. Above-median time-span subsets contain 125 trips per vehicle, and the two policies select identical routes throughout those subsets. Even the 108 Model Y and 80 ID.7 trips with nonzero within-set risk spread show no paired difference in realised violations. Within the evaluated candidate sets, both policies remain operationally similar even when route alternatives exhibit comparatively wide time, energy, or risk spreads. This is a stratification of existing alternatives, not a newly generated set of network routes.
Estimated mean risk is approximately 6.5% under the full policy, while realised violations are 5.2% and 5.6%. Agreement at this aggregate operating point is encouraging but does not prove conditional tail calibration; larger independent field samples are required.
The reduced-context policy achieves similar aggregate violations by inflating residual uncertainty, but it falls back more often and replans more frequently. Missing context is therefore not free: it reduces decisional confidence and stability even when the final violation rate appears similar.
The realised safety outcomes and their paired-bootstrap uncertainty are visualised in Figure 4 for all five policies and both vehicle models.
Figure 4.
Realised reserve-violation rates with 95% paired-bootstrap confidence intervals.
In Figure 4, the markers denote realised violation rates and the horizontal bars denote 95% paired-bootstrap confidence intervals. The overlapping confidence intervals indicate comparable realised safety performance among the energy- and uncertainty-aware policies under the evaluated replay conditions.
5.4. Risk, Reserve, and Objective-Weight Sensitivity
The risk-tolerance sensitivity analysis uses the same candidate scenario summaries, starting energies, reserve threshold, and objective weights across all tolerance levels. At α = 0.10, the resulting decisions reproduce the main operating point reported in Table 2: a mean travel time of 48.1417 min with 5.2% realised violations for the Model Y and 43.5034 min with 5.6% realised violations for the ID.7.
Figure 5 presents the fixed-scenario sensitivity results. Model Y mean travel time remains 48.1417 min across α = 0.05–0.20, whereas ID.7 mean travel time varies slightly from 43.5034 to 43.4580 min. Realised violation rates remain 5.2% and 5.6%, respectively, while fallback frequency decreases as the risk tolerance is relaxed. The complete numerical results are stored in fixed_scenario_sensitivity.csv, which is available from the author upon request.
Figure 5.
Risk-tolerance sensitivity recomputed from fixed archived scenario summaries. Blue circles: mean travel time (left axis); orange squares: realised reserve-violation rate (right axis). The α = 0.10 values reproduce Table 2.
A chance constraint changes the selected route only when the lowest-cost unconstrained candidate fails the reserve condition and another candidate satisfies it, or when fallback ordering differs. A broad time–energy spread alone is insufficient. The retained alternatives often produce the same preferred low-energy route, so changing α mainly changes feasibility labels. Establishing a practical advantage requires independent route sets with alternatives near the reserve boundary and different time–energy–risk rankings. Accordingly, the present candidate set characterises the behaviour of the two policies under the evaluated replay conditions, while route sets containing a greater concentration of alternatives near the reserve-feasibility boundary provide an important direction for external validation.
5.5. Scenario Convergence and Computational Feasibility
With M = 100, the selected route agrees with the M = 5000 reference in 99.8% of 500 trip decisions; the 95th percentile absolute risk error is 2.52 percentage points. Increasing M further lowers risk-estimation error but does not monotonically improve route agreement because near-tied objectives can change under resampling.
The measured M = 100 decision latency has a 5.55 ms median and is 6.92 ms at the 95th percentile. Per decision, computation is O(KM + KlogK) for K candidates and M scenarios, excluding offline training. These replay measurements are far below a typical multi-second navigation refresh interval, but network acquisition latency and production-service overhead were not measured. The exact scenario-count results are reported in Table 3.
Table 3.
Scenario-count convergence relative to M = 5000 and measured per-decision latency.
Table 3 provides the numerical convergence summary, while the three panels in Figure 6 separate complementary convergence criteria: Figure 6a reports the 95th-percentile absolute reserve-risk error, Figure 6b reports route agreement with the M = 5000 reference, and Figure 6c reports median and 95th-percentile decision latency.
Figure 6.
Scenario-count convergence: (a) 95th-percentile absolute risk error; (b) route agreement; (c) median and 95th-percentile decision latency. Panels (a,b) use M = 5000 as the reference.
Taken together, Figure 6a–c support M = 100 as the declared operating point: tail-risk error has already fallen substantially, route agreement is 99.8%, and measured latency remains below 7 ms at the 95th percentile. The later non-monotonic changes in route agreement reflect near-tied candidate objectives rather than computational instability.
5.6. Feature Ablation, Stability, and Deployment Stress
Ablation identifies traffic and signal variables as the dominant ETA information group: removing them increases ETA MAE from 0.75 to 8.92 min. Removing event/disruption, data-quality, and pedestrian groups increases ETA MAE by 18.3%, 6.5%, and 5.7%, respectively. Removing weather/wind changes energy MAE by 1.3% in this replay. These marginal effects quantify model dependence under the design; they are not benefit–cost estimates for field sensors. The exact ablation values are reported in Table 4 and visualised by outcome in Figure 7.
Table 4.
One-group-at-a-time full-context ablation over all held-out candidate routes.
Figure 7.
Percentage changes in mean absolute error (MAE) relative to full context after removing each context group: (a) estimated time of arrival (ETA); (b) trip energy.
Figure 7a shows that traffic and signal removal dominates ETA degradation; the broken horizontal axis is required to display the 1087.2% increase alongside the smaller event/disruption, data-quality, pedestrian, and weather/wind effects. Figure 7b shows that energy MAE is much less sensitive overall, with the largest change (1.3%) occurring after weather and wind removal.
Replanning is rare under full context (0.010 and 0.024 switches per 10 km), with a 0.4% A→B→A indicator for each vehicle. Reduced context increases replanning to 0.099 and 0.049 per 10 km and oscillation to 4.4% and 1.6%, consistent with less stable uncertainty estimates.
Offline perturbations reveal deployment vulnerabilities. A −1.0 kWh state-of-charge (SoC) bias raises realised violation to 23.6% and 22.8%; a 10% usable-capacity aging allowance yields 18.0% and 17.2%; combining both yields 44.4% and 46.8%. These stress tests show why state-of-charge (SoC) validation, aging-aware capacity estimation, and sensor-health checks are prerequisites for a field system.
Communication delay, Global Positioning System (GPS)/map-matching error, signal-feed loss, charging-station availability, sensor failure, and adversarial or low-quality context are not validated here. The quality vector and fallback logic provide architectural hooks, but a production implementation also requires stale-data timeouts, plausibility checks, redundant SoC estimation, authenticated feeds, charger-status integration, and a safe degradation mode.
The sensitivity of energy-conversion outcomes to operating conditions is also well documented in the broader automotive literature, although these studies concern combustion or external-combustion systems rather than BEV routing. Energy/exergy analyses of biodiesel-fuelled engines report measurable changes in efficiency and exergy destruction with fuel composition and operating point [39,40], while methane–diesel dual-fuel experiments show load- and fuel-energy-fraction-dependent changes in performance and energy losses [41]. Engine-control studies likewise demonstrate that valve strategy, charge conditions, and combustion-mode parameters can materially alter efficiency, emissions, and operating range [42,43,44]. These studies are not used as validation of the present BEV replay; instead, they provide independent automotive evidence that energy response is condition dependent, reinforcing the need for platform-specific calibration and explicit uncertainty treatment.
5.7. Distribution of ETA Prediction Errors
ETA residuals are defined as predicted minus realised travel time, so negative values indicate underprediction. Across 1002 Model Y candidates, full-context median and 95th-percentile absolute errors are 0.689 and 1.939 min, compared with 6.019 and 30.085 min under reduced context. Across 978 ID.7 candidates, the corresponding values are 0.620 and 1.890 min versus 5.743 and 27.310 min. Full-context signed biases are +0.028 and −0.020 min. Reduced-context signed fifth percentiles are −29.309 and −26.783 min, showing substantial underprediction in the lower tail.
Figure 8 shows the empirical cumulative distribution of absolute errors. Maximum reduced-context errors reach 102.98 and 79.79 min, compared with 3.29 and 3.68 min for full context. Complete signed and absolute quantiles, including separate event/pedestrian/disruption results, are contained in eta_error_distribution.csv, which is available from the author upon request. The concentration of full-context errors is consistent with learning the generator’s designated drivers and cannot be treated as evidence of comparable accuracy on independently observed urban trips.
Figure 8.
Empirical cumulative distributions of absolute ETA error across all archived candidate routes. The horizontal axis is limited to 60 min for readability; complete tail maxima and quantiles are reported in eta_error_distribution.csv, available from the author upon request.
6. Conclusions, Limitations, and Future Work
This study examines a context-aware BEV routing architecture that carries coupled ETA–energy uncertainty into an explicit arrival-reserve decision. Its scientific contribution is an auditable connection between prediction, estimated constraint feasibility and observed reserve outcomes, including evidence of when the extra constraint leaves route choice essentially unchanged.
In the controlled 500-trip semi-synthetic replay, full context improves held-out ETA accuracy and sharpness; the full risk-aware policy reduces reserve violations from 22.0% to 5.2% for the Model Y and from 19.2% to 5.6% for the ID.7. The corresponding time increases are 15.0% and 15.6%. At 100 scenarios, route agreement with the 5000-scenario reference is 99.8% at a median measured latency of 5.55 ms.
The evidence supports internal comparative validity under the declared replay assumptions only. It does not demonstrate real-vehicle energy accuracy, deployment-level reliability, multi-city transfer, charger-aware operation, or robustness to actual communication and sensing failures. The two named vehicles are parameterised examples; a third vehicle requires physical and residual-model recalibration.
Full risk-aware and quantile-robust routing differ on only 3 of 500 selected routes and have identical realised violation indicators. The distinctive contribution of the chance-constrained formulation is therefore its explicit reserve-risk criterion, transparent feasibility assessment, and documented fallback behaviour.
Ablation shows that traffic and signal information is the dominant ETA stream, while event/disruption, data-quality, and pedestrian groups provide smaller marginal improvements. Reduced context can maintain aggregate safety through uncertainty inflation, but with more fallbacks and route instability.
The principal limitation is that the evaluation relies on a shared semi-synthetic generator in which the full-context model observes variables associated with the simulated outcome mechanisms. The strong ETA performance should therefore be interpreted as internal replay performance and subsequently validated using independently observed data, alternative disturbance mechanisms, and broader candidate-route sets.
The potential social value is more understandable information about low-reserve arrivals and time costs for everyday travel, including time-sensitive trip chains. Explicit infeasibility reporting could help users recognise when a requested reserve condition is unsupported. Passenger confidence, accessibility, care-related mobility, equity, collision risk and gender-specific outcomes were not measured. These are motivations for future evaluation rather than demonstrated social effects of the present replay.
Future work should conduct a preregistered instrumented-vehicle trial, validate on public telemetry where feature overlap permits, include charger occupancy and failure, estimate battery health online, model GPS and feed latency explicitly, and repeat the protocol across cities, seasons, drivers, and BEV classes. Field validation should compare the same chance-constrained and quantile-robust policies with safety-governed route interventions.
The present results establish a controlled methodological demonstration with reproducible analysis of the evaluated replay. Validation under real-world operating conditions and route sets with stronger time–energy–risk differentiation constitutes the next stage of evaluation.
Funding
This research received no external funding.
Institutional Review Board Statement
Not applicable.
Informed Consent Statement
Not applicable.
Data Availability Statement
The generated candidate records, predictions, scenario summaries, trip-level policy outcomes, and the executable analysis script are available from the author upon request. The script reproduces the paired policy comparisons, candidate-diversity assessment, ETA-error diagnostics, and fixed-scenario sensitivity analyses from the retained records.
Conflicts of Interest
The author declares no conflicts of interest. No funding body had any role in the design of the study; in the collection, analyses, or interpretation of data; in the writing of the manuscript; or in the decision to publish the results.
Abbreviations
The following abbreviations are used in this manuscript:
| BEV | Battery electric vehicle |
| CI | Confidence interval |
| ETA | Estimated time of arrival |
| eVED | Extended Vehicle Energy Dataset |
| GPS | Global Positioning System |
| HMI | Human–machine interface |
| LSTM | Long short-term memory |
| MAE | Mean absolute error |
| MPIW | Mean prediction-interval width |
| PICP | Prediction-interval coverage probability |
| RMSE | Root mean squared error |
| SoC | State of charge |
| SPaT | Signal phase and timing |
| VED | Vehicle Energy Dataset |
References
- International Energy Agency. Global EV Outlook 2025; IEA: Paris, France, 2025. [Google Scholar]
- Donkers, A.; Yang, D.; Viktorović, M. Influence of driving style, infrastructure, weather and traffic on electric vehicle performance. Transp. Res. Part D Transp. Environ. 2020, 88, 102569. [Google Scholar] [CrossRef] [Scilit]
- Boyack, J.; Choi, J.B.; Jeong, J.; Park, H.; Kim, S. LogPath: Log data based energy consumption analysis enabling electric vehicle path optimization. Transp. Res. Part D Transp. Environ. 2024, 135, 104387. [Google Scholar] [CrossRef] [Scilit]
- Sharma, S.K.; Sharma, L.K.; Milojević, S.; Sharma, Y.; Ašonja, A.; Gajević, S.; Stojanović, B. Electric Vehicles for Sustainable Transportation: Technologies, Charging Strategies, and Grid Integration. Energies 2026, 19, 3991. [Google Scholar] [CrossRef] [Scilit]
- Trung, D.D.; Dudić, B.; Bao, N.C.; Thinh, H.X.; Duc, D.V.; Ašonja, A. Applying Probability Method for Battery Electric Vehicle Selection. In Proceedings of the 2025 24th International Symposium INFOTEH-JAHORINA (INFOTEH), East Sarajevo, Bosnia and Herzegovina, 19–21 March 2025; pp. 1–5. [Google Scholar] [CrossRef] [Scilit]
- Chen, X.; Xue, J.; Lei, Z.; Qian, X.; Ukkusuri, S.V. Online eco-routing for electric vehicles using combinatorial multi-armed bandit with estimated covariance. Transp. Res. Part D Transp. Environ. 2022, 111, 103447. [Google Scholar] [CrossRef] [Scilit]
- Pan, Y.; Fang, W.; Zhang, W. Development of an energy consumption prediction model for battery electric vehicles in real-world driving: A combined approach of short-trip segment division and deep learning. J. Clean. Prod. 2023, 400, 136742. [Google Scholar] [CrossRef] [Scilit]
- Feng, Z.; Zhang, J.; Jiang, H.; Yao, X.; Qian, Y.; Zhang, H. Energy consumption prediction strategy for electric vehicle based on LSTM–Transformer framework. Energy 2024, 302, 131780. [Google Scholar] [CrossRef] [Scilit]
- Pelletier, S.; Jabali, O.; Laporte, G. The electric vehicle routing problem with energy consumption uncertainty. Transp. Res. Part B Methodol. 2019, 126, 225–255. [Google Scholar] [CrossRef] [Scilit]
- Jeong, J.; Ghaddar, B.; Zufferey, N.; Nathwani, J. Adaptive robust electric vehicle routing under energy consumption uncertainty. Transp. Res. Part C Emerg. Technol. 2024, 160, 104529. [Google Scholar] [CrossRef] [Scilit]
- Han, B.; Yan, Y.; Chi, T.; Park, Y. Electric vehicle routing with travel time and energy uncertainty. Transp. Res. Part E Logist. Transp. Rev. 2025, 202, 104211. [Google Scholar] [CrossRef] [Scilit]
- Jiang, W.; Luo, J. Graph neural network for traffic forecasting: A survey. Expert Syst. Appl. 2022, 207, 117921. [Google Scholar] [CrossRef] [Scilit]
- Angelopoulos, A.N.; Bates, S. Conformal prediction: A gentle introduction. Found. Trends Mach. Learn. 2023, 16, 494–591. [Google Scholar] [CrossRef] [Scilit]
- Islam, Z.; Abdel-Aty, M.; Ugan, J. Signal phasing and timing prediction using connected vehicle data. Transp. Res. Rec. 2024, 2678, 662–673. [Google Scholar] [CrossRef] [Scilit]
- Qiu, Z.; Zhu, T.; Jin, Y.; Sun, L.; Du, B. A graph attention fusion network for event-driven traffic speed prediction. Inf. Sci. 2023, 622, 405–423. [Google Scholar] [CrossRef] [Scilit]
- Zhou, W.; Liu, Y.; Zhao, L.; Xu, S.; Wang, C. Pedestrian crossing intention prediction from surveillance videos for over-the-horizon safety warning. IEEE Trans. Intell. Transp. Syst. 2024, 25, 1394–1407. [Google Scholar] [CrossRef] [Scilit]
- Mattinzioli, T.; Butt, A.A.; Harvey, J. Literature review on pavements and electric vehicle interaction: A research roadmap. Transp. Res. Part D Transp. Environ. 2023, 122, 103886. [Google Scholar] [CrossRef] [Scilit]
- Askerdal, M.; Fredriksson, J.; Laine, L. Development of simplified air drag models including crosswinds for commercial heavy vehicle combinations. Veh. Syst. Dyn. 2024, 62, 1085–1102. [Google Scholar] [CrossRef] [Scilit]
- Sun, Z.; Premarathna, W.A.A.S.; Anupam, K.; Kasbergen, C.; Erkens, S.M.J.G. A state-of-the-art review on rolling resistance of asphalt pavements and its environmental impact. Constr. Build. Mater. 2024, 411, 133589. [Google Scholar] [CrossRef] [Scilit]
- Yan, Y.; Han, D.; Zhang, Q.; Fang, Z.; Wang, J.; Yin, G. Speed Planning Strategy in Urban Environments Considering Passenger’s Preferences, Traffic Signals and Road Limits. In Proceedings of the 2023 7th CAA International Conference on Vehicular Control and Intelligence (CVCI), Changsha, China, 27–29 October 2023; pp. 1–6. [Google Scholar] [CrossRef] [Scilit]
- Zhang, Q.; Xing, Y.; Wang, J.; Fang, Z.; Liu, Y.; Yin, G. Interaction-Aware and Driving Style-Aware Trajectory Prediction for Heterogeneous Vehicles in Mixed Traffic Environment. IEEE Trans. Intell. Transp. Syst. 2025, 26, 10710–10724. [Google Scholar] [CrossRef] [Scilit]
- Wu, F.; Cheng, Z.; Chen, H.; Qiu, Z.; Sun, L. Traffic state estimation from vehicle trajectories with anisotropic Gaussian processes. Transp. Res. Part C Emerg. Technol. 2024, 163, 104646. [Google Scholar] [CrossRef] [Scilit]
- Wang, Q.; Yang, K. Privacy-preserving data fusion for traffic state estimation: A vertical federated learning approach. Transp. Res. Part C Emerg. Technol. 2024, 168, 104743. [Google Scholar] [CrossRef] [Scilit]
- Zhao, H.; Dong, C.; Cao, J.; Chen, Q. A survey on deep reinforcement learning approaches for traffic signal control. Eng. Appl. Artif. Intell. 2024, 133, 108100. [Google Scholar] [CrossRef] [Scilit]
- Spanninger, T.; Wiedemann, N.; Corman, F. Quantifying the dynamic predictability of train delay with uncertainty-aware neural networks. Transp. Res. Part C Emerg. Technol. 2024, 162, 104563. [Google Scholar] [CrossRef] [Scilit]
- Matin, A.; Dia, H. Impacts of connected and automated vehicles on road safety and efficiency: A systematic literature review. IEEE Trans. Intell. Transp. Syst. 2023, 24, 2705–2736. [Google Scholar] [CrossRef] [Scilit]
- Elgazwy, A.; Elgazzar, K.; Khamis, A. Predicting pedestrian crossing intentions in adverse weather with self-attention models. IEEE Trans. Intell. Transp. Syst. 2025, 26, 3250–3261. [Google Scholar] [CrossRef] [Scilit]
- Liu, C. Energy consumption prediction and optimization of electric vehicles based on RLS and improved SOA. IEEE Access 2024, 12, 38180–38191. [Google Scholar] [CrossRef] [Scilit]
- Oh, G.; LeBlanc, D.J.; Peng, H. Vehicle energy dataset (VED), a large-scale dataset for vehicle energy consumption research. IEEE Trans. Intell. Transp. Syst. 2022, 23, 3302–3312. [Google Scholar] [CrossRef] [Scilit]
- Zhang, S.; Fatih, D.; Abdulqadir, F.; Schwarz, T.; Ma, X. Extended Vehicle Energy Dataset (eVED): An Enhanced Large-Scale Dataset for Vehicle Energy Consumption Analysis. In Proceedings of the 2025 IEEE 101st Vehicular Technology Conference (VTC2025-Spring), Oslo, Norway, 17–20 June 2025; pp. 1–7. [Google Scholar] [CrossRef] [Scilit]
- Kıyaklı, A.O.; Solmaz, H. Modeling of an Electric Vehicle with MATLAB/Simulink. Int. J. Automot. Sci. Technol. 2018, 2, 9–15. [Google Scholar] [CrossRef] [Scilit]
- Solmaz, H.; Kocakulak, T. Determination of Lithium Ion Battery Characteristics for Hybrid Vehicle Models. Int. J. Automot. Sci. Technol. 2020, 4, 264–271. [Google Scholar] [CrossRef] [Scilit]
- Boyacıoğlu, N.M.; Kocakulak, T.; Batar, M.; Uyumaz, A.; Solmaz, H. Modeling and Control of a PEM Fuel Cell Hybrid Energy System Used in a Vehicle with Fuzzy Logic Method. Int. J. Automot. Sci. Technol. 2023, 7, 295–308. [Google Scholar] [CrossRef] [Scilit]
- Kocakulak, T.; Solmaz, H.; Şahin, F. Control and Optimization of Pre-Transmission Parallel Hybrid Vehicle with Fuzzy Logic Method and Comparison with Conventional Rule Based Control Strategy. J. Polytech. 2023, 26, 1035–1047. [Google Scholar] [CrossRef] [Scilit]
- Kocakulak, T.; Arslan, T.A. Investigation of the Use of Fuel Cell Hybrid Systems for Different Purposes. Eng. Perspect. 2023, 3, 1–8. [Google Scholar] [CrossRef] [Scilit]
- Simon, N.; Peszleg, R. Comparative Analysis of Electric Vehicle Energy Consumption in Urban and Highway Environments Using CAN-Based Data Collection. Eng. Perspect. 2025, 5, 8–13. [Google Scholar] [CrossRef] [Scilit]
- Demir, V.G.; Savran, E. The Role of Regenerative Suspension in Energy-Efficient and Comfortable Electric Vehicle Driving. Eng. Perspect. 2026, 6, 344–353. [Google Scholar] [CrossRef] [Scilit]
- Çetin, M.; Ergüder, T.O. Investigation of Exhaust Emission Amounts Released to the Atmosphere by Motor Vehicles for Erzincan Province. Erzincan Univ. J. Sci. Technol. 2020, 13, 1403–1412. [Google Scholar] [CrossRef] [Scilit]
- Erol, D.; Gülcan, H.E. Energy, exergy, greenhouse gas emission impact and economic analysis of a water-cooled diesel engine running on different proportions of waste cooking oil biodiesel. Int. J. Automot. Eng. Technol. 2025, 14, 154–169. [Google Scholar] [CrossRef] [Scilit]
- Çakmak, A.; Bilgin, A. Exergy and energy analysis with economic aspects of a diesel engine running on biodiesel-diesel fuel blends. Int. J. Exergy 2017, 24, 151–172. [Google Scholar] [CrossRef] [Scilit]
- Gülcan, H.E.; Ciniviz, M. The effect of pure methane energy fraction on combustion performance, energy analysis and environmental-economic cost indicators in a single-cylinder common rail methane-diesel dual fuel engine. Appl. Therm. Eng. 2023, 230, 120712. [Google Scholar] [CrossRef] [Scilit]
- Polat, S.; Solmaz, H.; Yılmaz, E.; Calam, A.; Uyumaz, A.; Yücesu, H.S. Mapping of an HCCI engine using negative valve overlap strategy. Energy Sources Part A Recovery Util. Environ. Eff. 2020, 42, 1140–1154. [Google Scholar] [CrossRef] [Scilit]
- Çınar, C.; Aksoy, F.; Solmaz, H.; Yılmaz, E.; Uyumaz, A. Manufacturing and testing of an α-type Stirling engine. Appl. Therm. Eng. 2018, 130, 1373–1379. [Google Scholar] [CrossRef] [Scilit]
- Şahin, F.; Halis, S.; Yıldırım, E.; Altın, M.; Balaban, F.; Solmaz, H.; Yücesu, H.S. Effects of Premixed Ratio on Engine Operation Range and Emissions of a Reactivity Controlled Compression Ignition Engine. SAE Int. J. Fuels Lubr. 2023, 16, 169–179. [Google Scholar] [CrossRef] [Scilit]
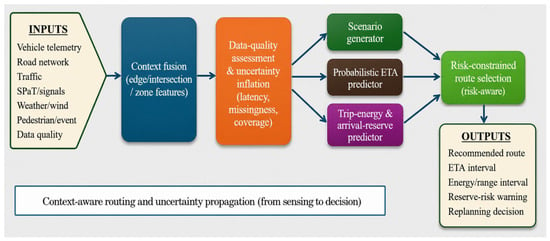
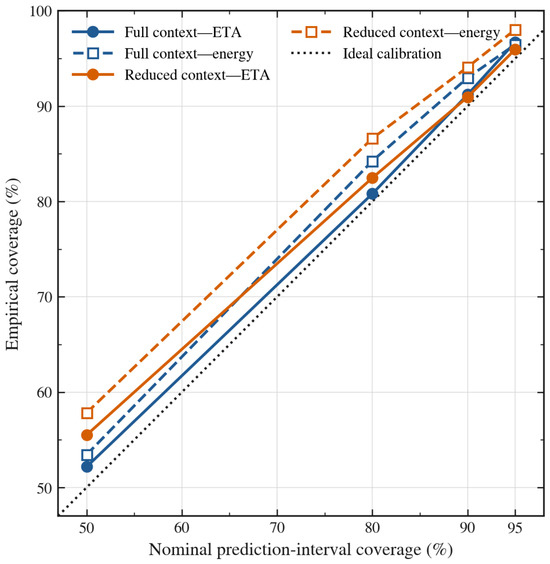
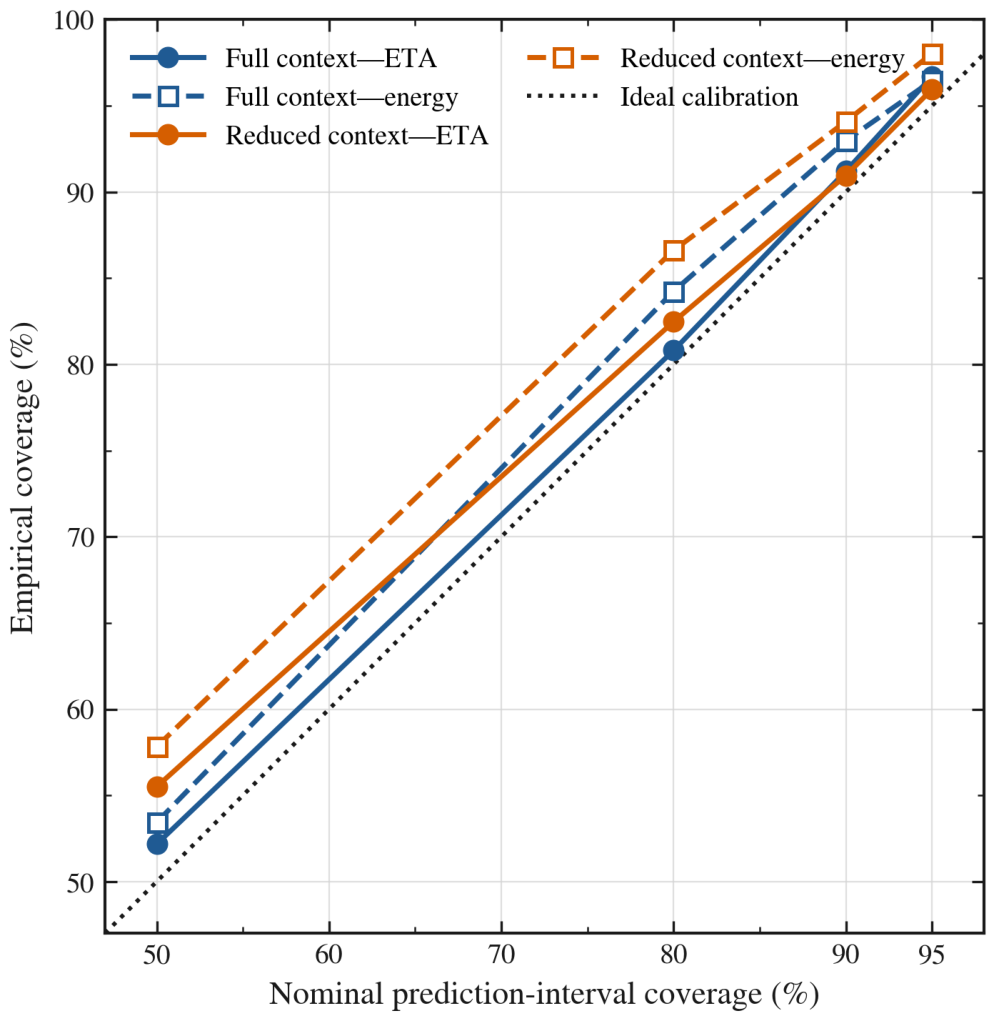
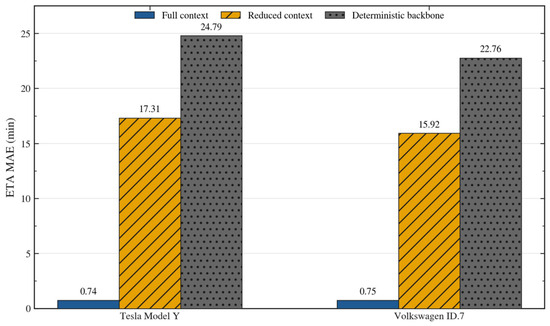
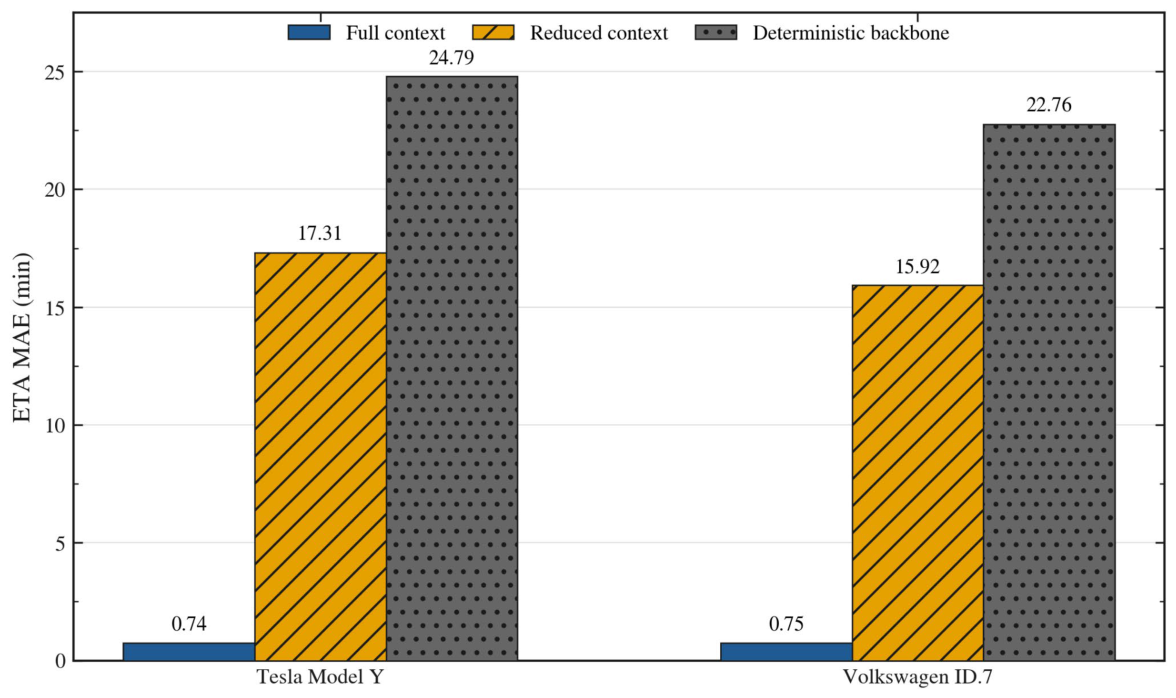
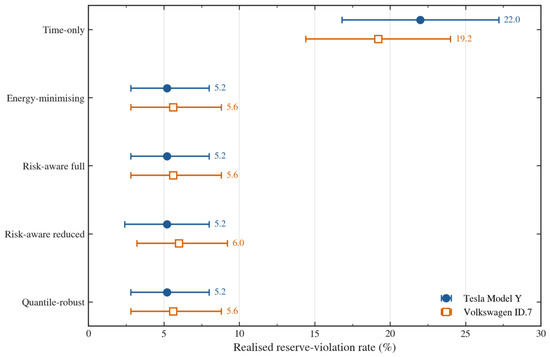
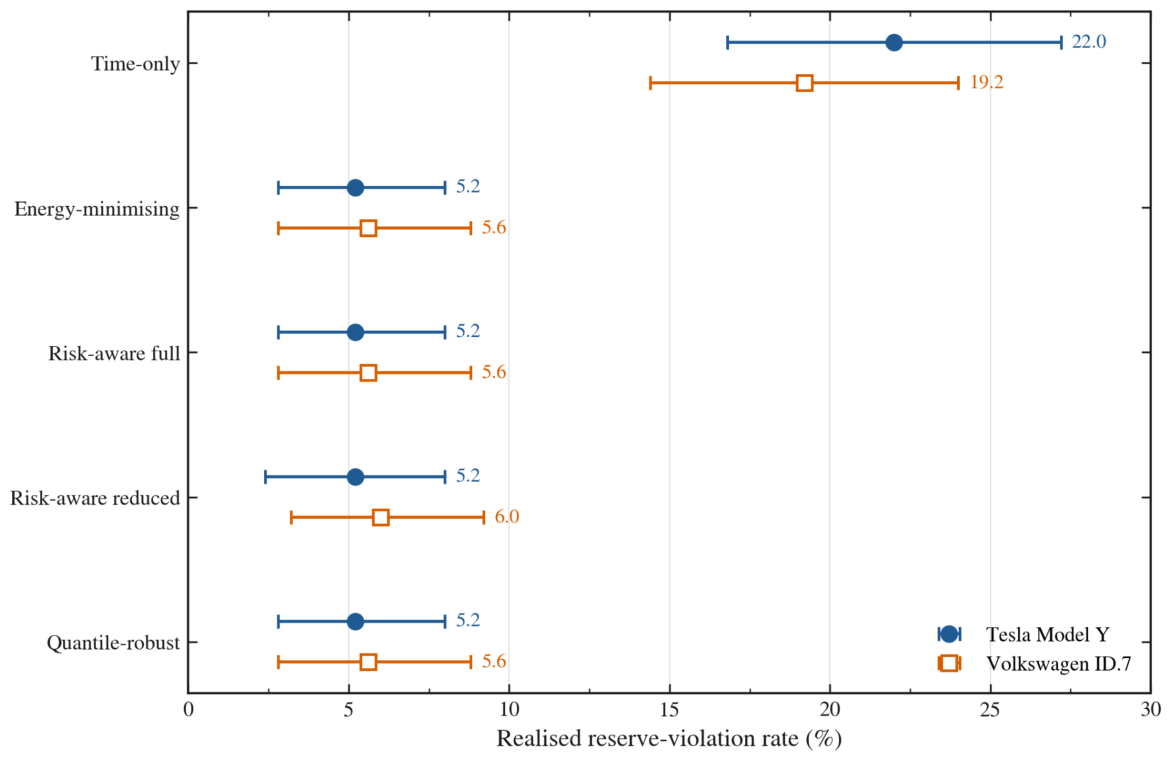
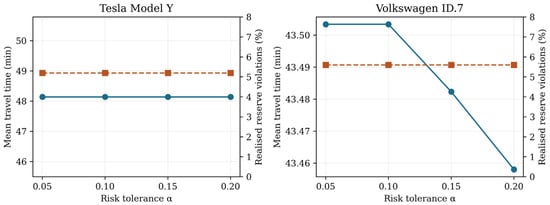
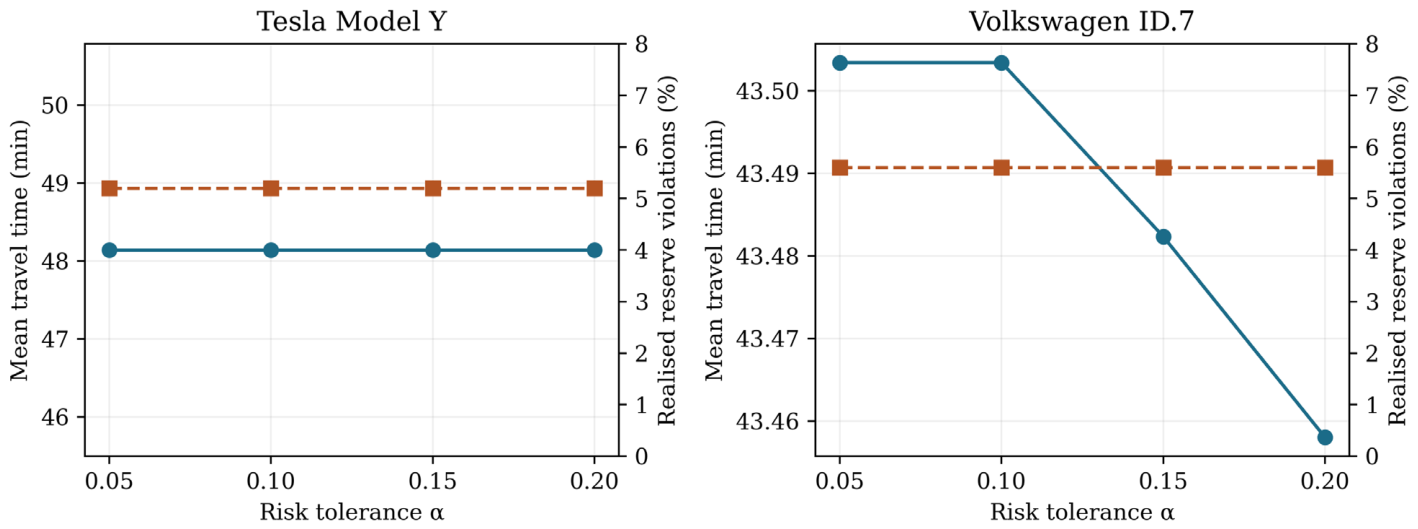
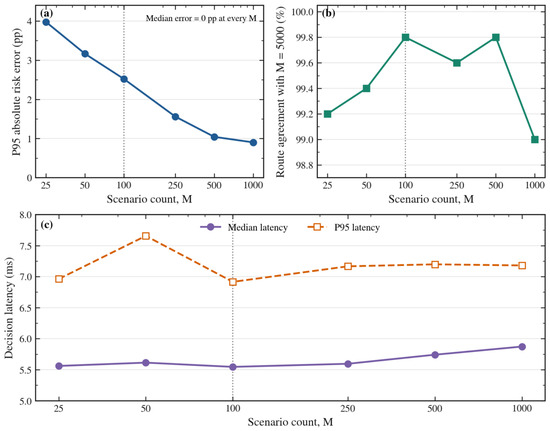
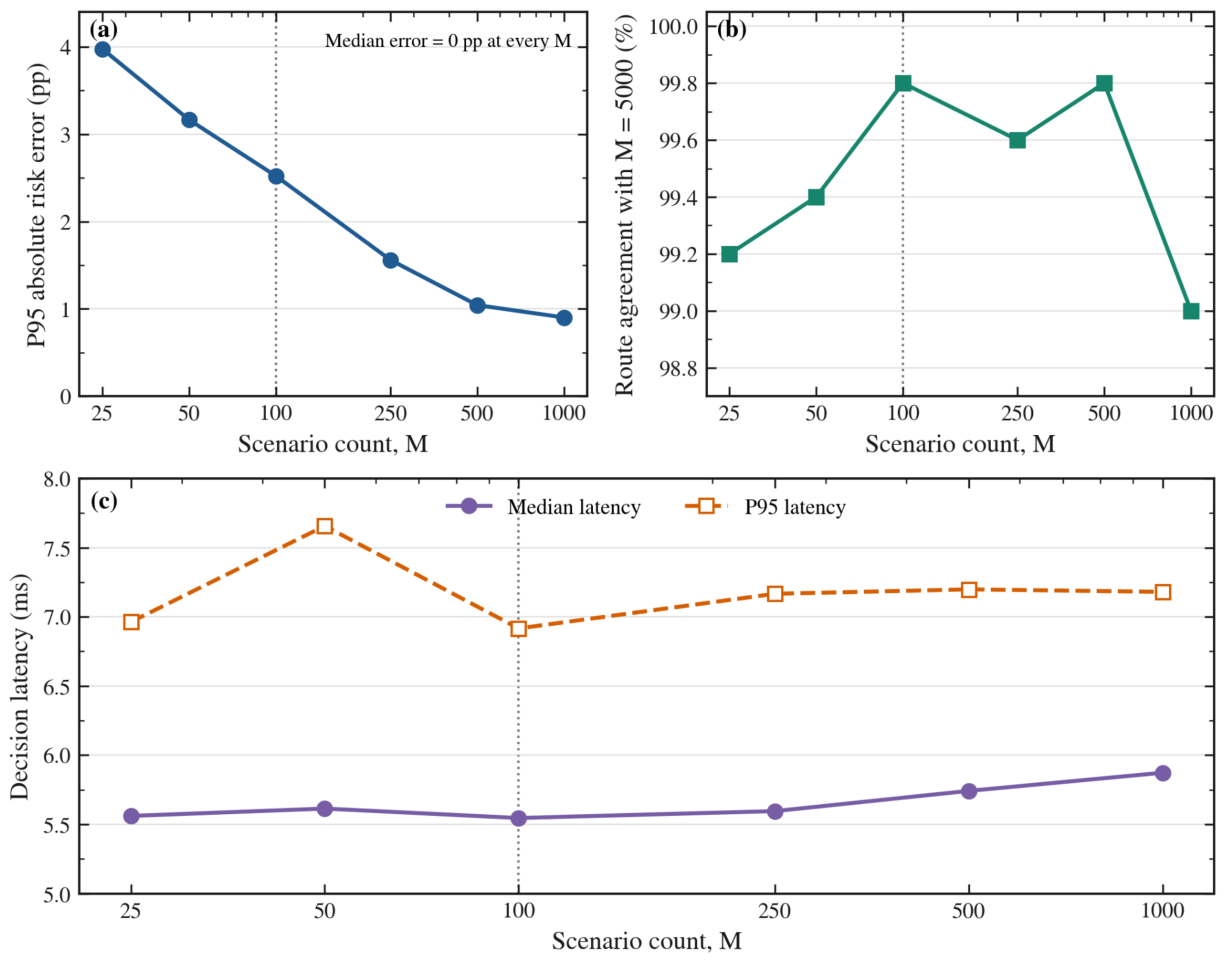
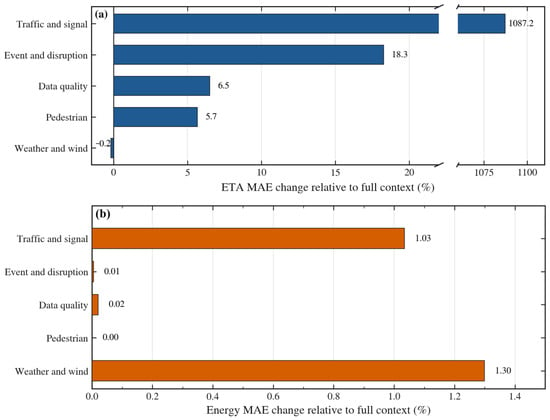
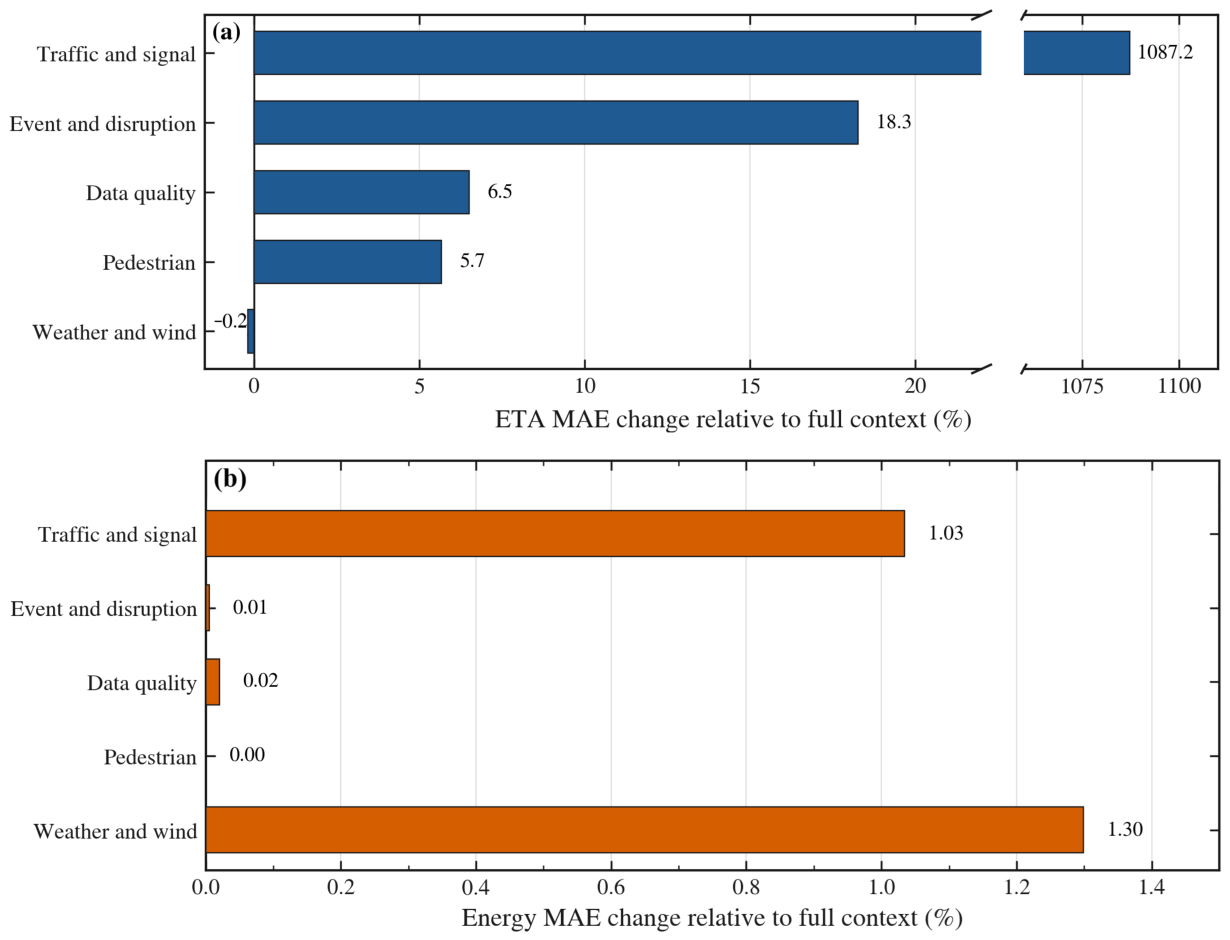
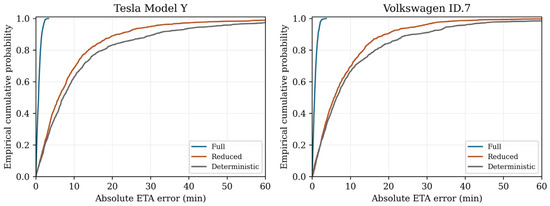
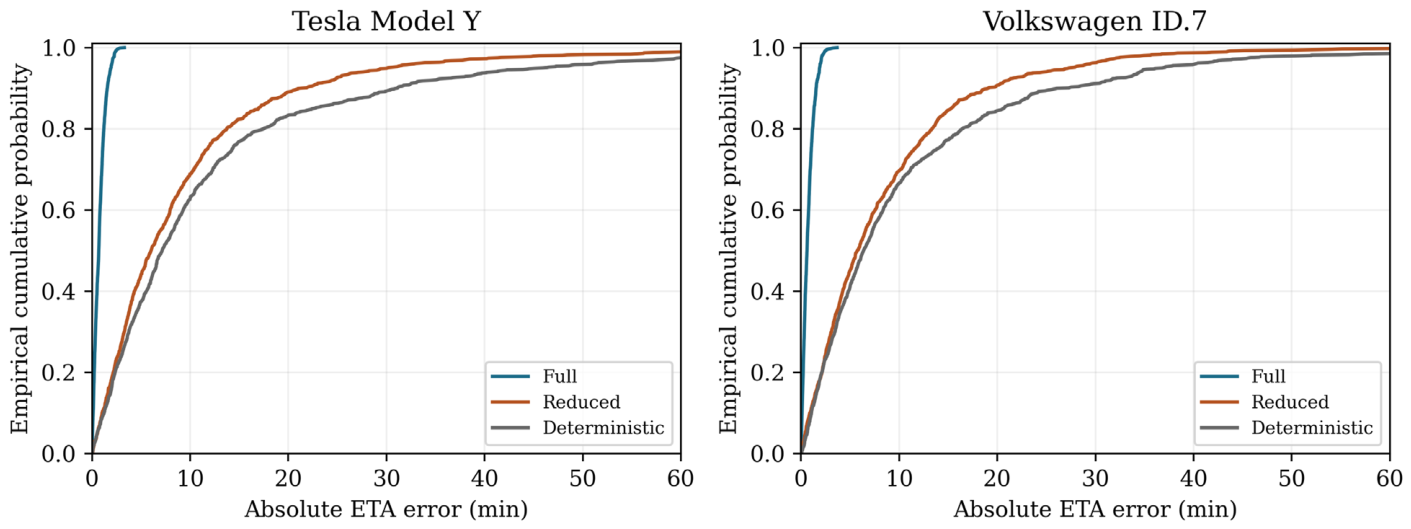

Disclaimer/Publisher’s Note: The statements, opinions and data contained in all publications are solely those of the individual author(s) and contributor(s) and not of MDPI and/or the editor(s). MDPI and/or the editor(s) disclaim responsibility for any injury to people or property resulting from any ideas, methods, instructions or products referred to in the content. |
© 2026 by the author. Licensee MDPI, Basel, Switzerland. This article is an open access article distributed under the terms and conditions of the Creative Commons Attribution (CC BY) license.