


Corporate Strategic Orientation and ESG Performance: Financial Distress and Boundary Conditions in China’s Evolving Green-Policy Environment


Abstract
1. Introduction
2. Theoretical Foundation and Hypotheses
2.1. The Time Dimension of Strategic Orientation and the Chinese ESG Context
2.2. Theoretical Dilemmas and Our Analytical Position
2.3. The Financial Distress Channel: A Possible Mediating Pathway
2.4. Contextual Conditions: Incentive-Type and Pressure-Type Operative Logics
2.5. The Moderating Role of Incentive-Type Instruments
2.6. The Moderating Role of Pressure-Type Conditions
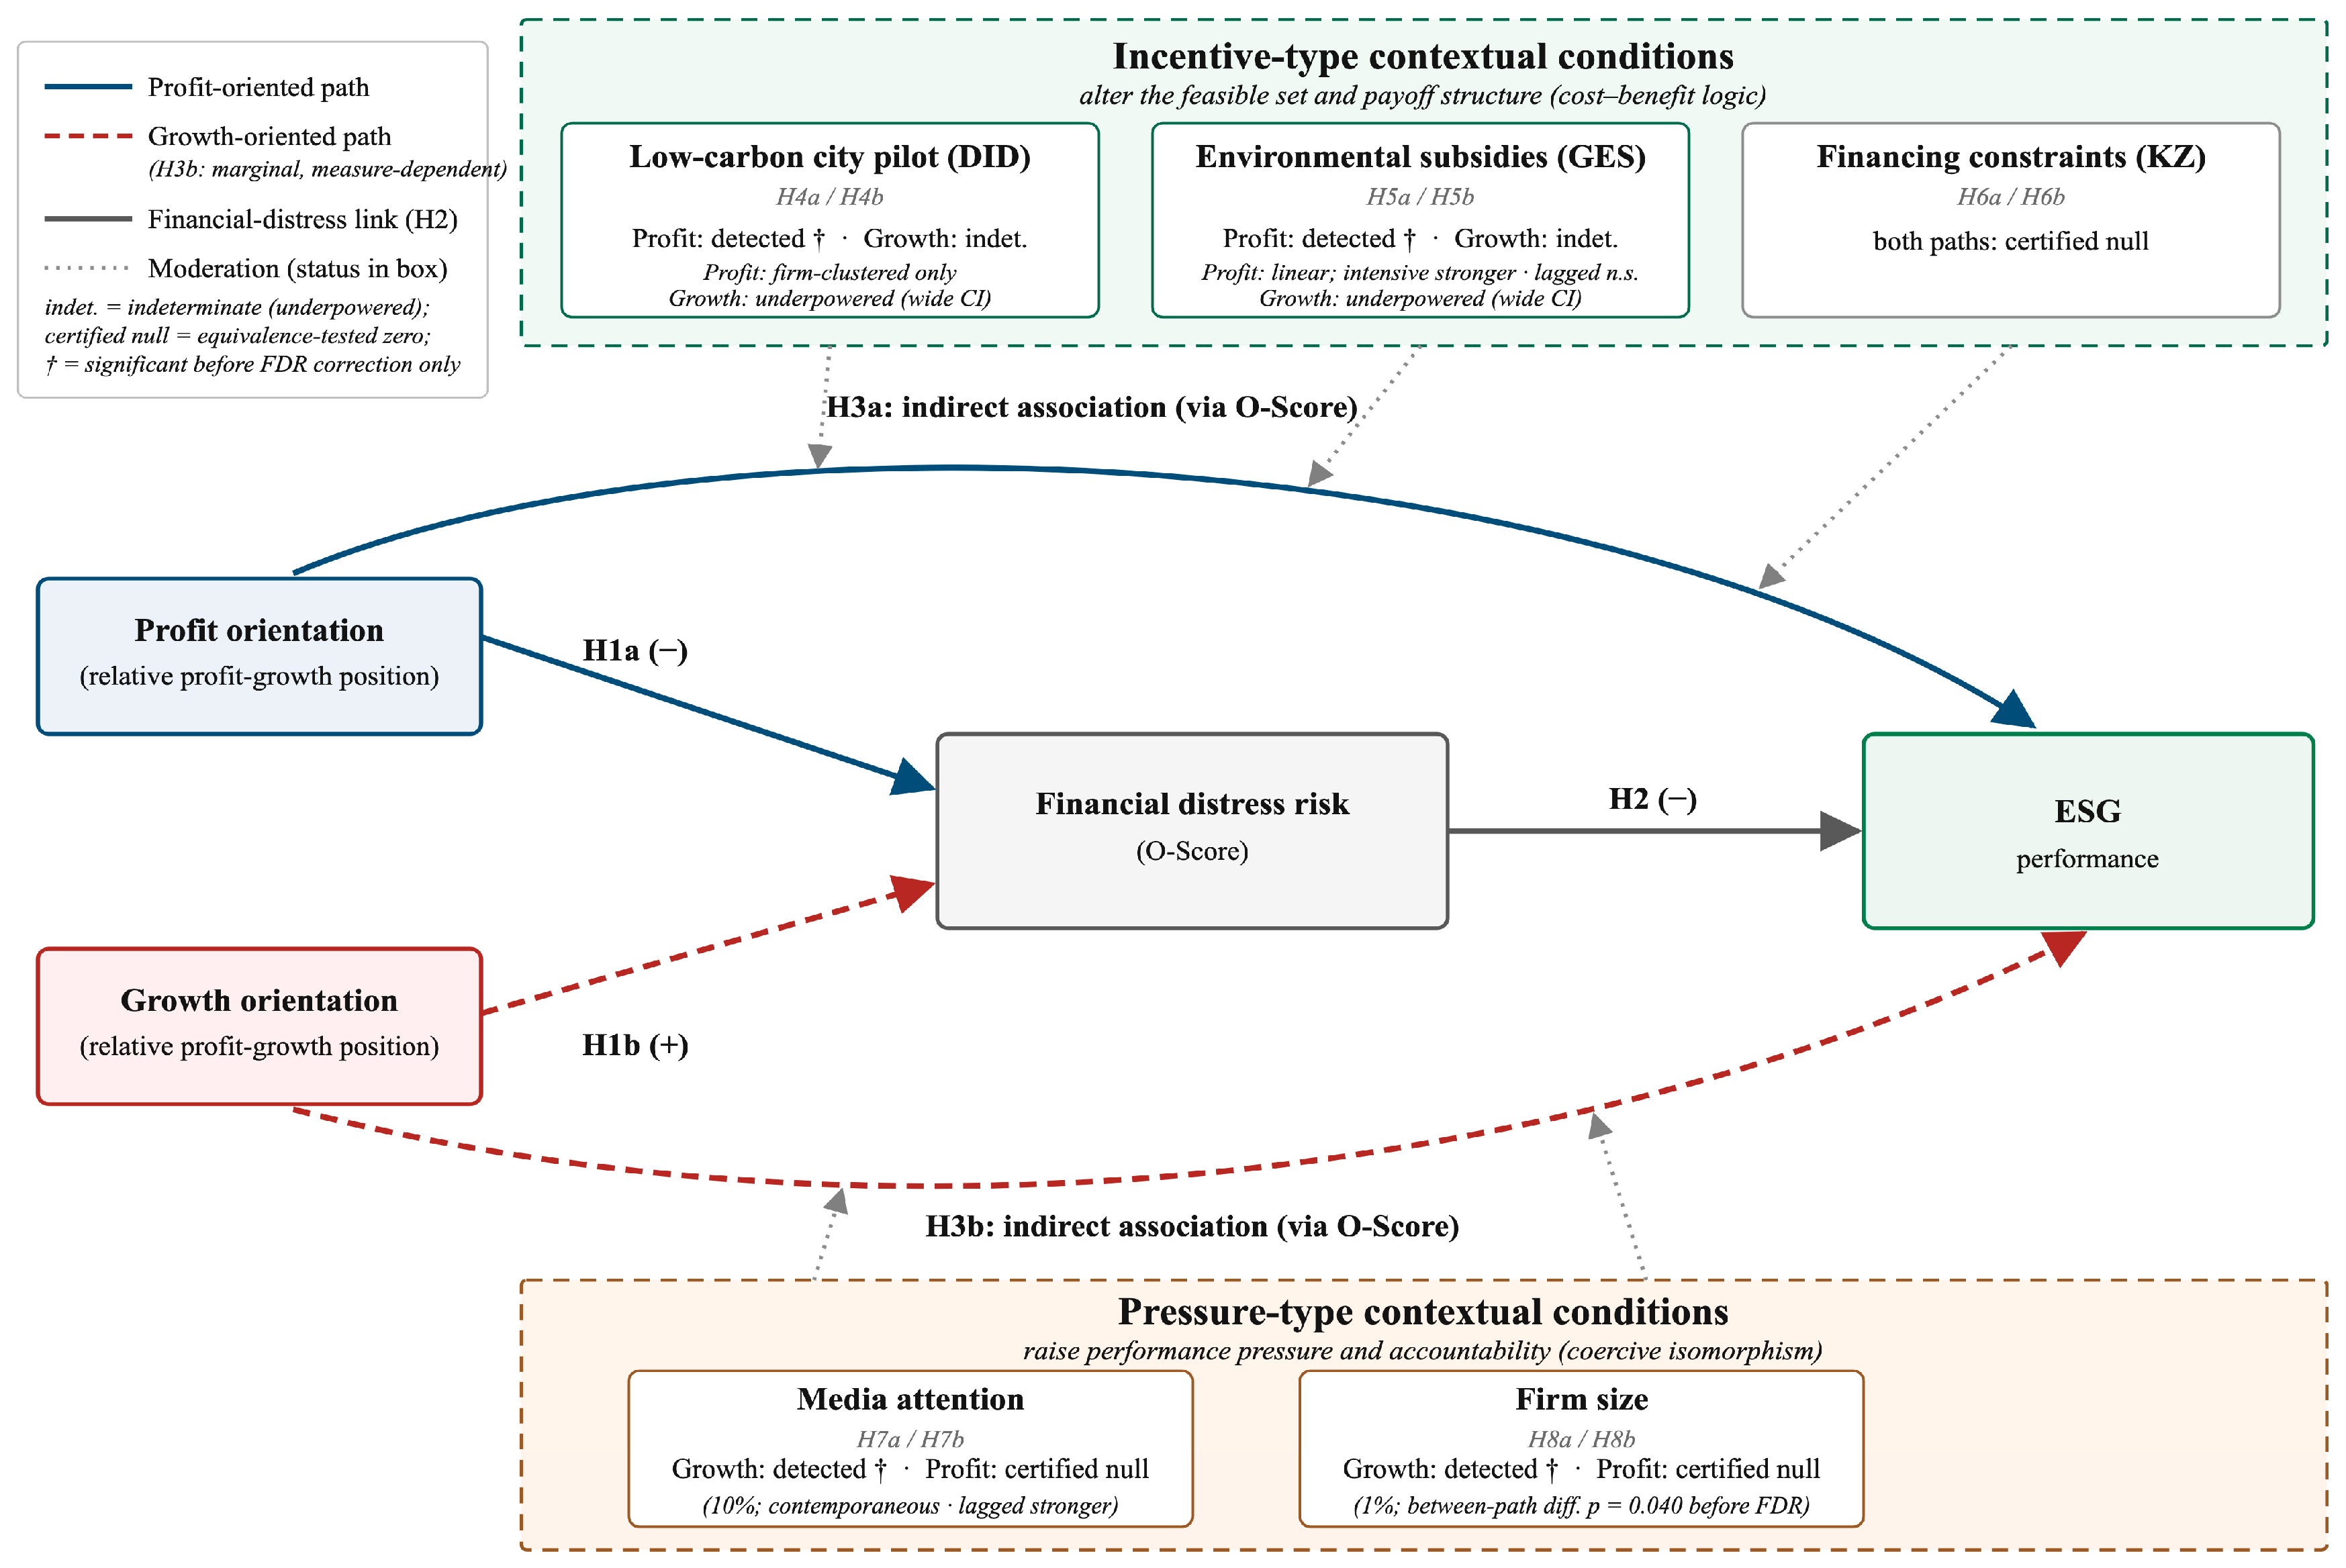
2.7. The Integrated Framework
3. Materials and Methods
3.1. Sample and Data
3.2. Variable Measurement
3.3. Model Specification
4. Results
4.1. Descriptive Statistics, Correlations, and Baseline Relations
4.2. The Mediating Effect of Financial Distress Risk

| Path and Coefficient | Profit-Oriented Path | Growth-Oriented Path |
|---|---|---|
| Strategic orientation → ESG (total effect c) | 1.773 *** (0.110) | −1.110 *** (0.167) |
| Strategic orientation → O-Score (a) | −0.267 *** (0.022) | 0.050 ** (0.025) |
| O-Score → ESG (b) | −0.262 *** (0.071) | −0.262 *** (0.071) |
| Strategic orientation → ESG (direct effect c′) | 1.703 *** (0.112) | −1.097 *** (0.166) |
| Indirect effect (a × b) | +0.070 | −0.013 |
| Indirect effect 95% CI (bootstrap) | [+0.032, +0.109] | [−0.030, −0.001] |
| Indirect effect 95% CI (Monte Carlo, benchmark) | [+0.032, +0.110] | [−0.030, −0.0001] |
| Indirect/total effect ratio (reference) | 3.9% | 1.2% |
| R2 (within), three steps in order | 0.7000/0.5474/0.7007 | 0.7000/0.5474/0.7007 |
| N/Groups | 12,629/1372 | 12,629/1372 |
4.3. Incentive-Type Instruments (I): The Low-Carbon City Pilot Policy
4.4. Incentive-Type Instruments (II): Environmental Subsidies and Financing Constraints
4.5. Pressure-Type Conditions: Media Attention and Firm Size
4.6. Robustness Checks
4.7. Summary of Hypothesis Tests
4.8. Why the Pattern Is Asymmetric: A Mechanism Reading
5. Discussion
5.1. Theoretical Contributions
5.2. Practical and Policy Implications
5.3. Limitations and Future Research
6. Conclusions
Supplementary Materials
Author Contributions
Funding
Institutional Review Board Statement
Informed Consent Statement
Data Availability Statement
Acknowledgments
Conflicts of Interest
Appendix A. Variable Construction Details
References
- People’s Bank of China; Ministry of Finance; National Development and Reform Commission; Ministry of Environmental Protection; China Banking Regulatory Commission; China Securities Regulatory Commission; China Insurance Regulatory Commission. Guidelines for Establishing the Green Financial System; Yin Fa No. 228. 2016. Available online: https://www.mee.gov.cn/gkml/hbb/gwy/201611/t20161124_368163.htm (accessed on 11 September 2026). (In Chinese)
- Shanghai Stock Exchange; Shenzhen Stock Exchange; Beijing Stock Exchange. Guidelines for the Sustainable Development Reporting of Listed Companies. 2024. Available online: https://www.szse.cn/aboutus/trends/news/t20240412_606840.html (accessed on 11 September 2026). (In Chinese)
- Wang, S.; Hu, H.; Wang, X. Green entrepreneurship orientation and environmental, social, and governance performance: Do contractual strategic alliances matter? Corp. Soc. Responsib. Environ. Manag. 2024, 31, 5275–5295. [Google Scholar] [CrossRef] [Scilit]
- de la Cruz Jara, M.F.; Spanjol, J.; Doppstadt, T. Strategic social value orientation and sustainability performance: A commensuration perspective. Organ. Stud. 2025, 46, 635–666. [Google Scholar] [CrossRef] [Scilit]
- Hamed, R.; Smolarski, J.; Al-Shattarat, W.; Al-Shattarat, B. CSR reporting and corporate performance: The role of strategic emphasis. Sustain. Account. Manag. Policy J. 2025, 16, 845–873. [Google Scholar] [CrossRef] [Scilit]
- Zhou, N.; Park, S.H. Growth or profit? Strategic orientations and long-term performance in China. Strateg. Manag. J. 2020, 41, 2050–2071. [Google Scholar] [CrossRef] [Scilit]
- Sun, X.; Zhou, C.; Gan, Z. Green finance policy and ESG performance: Evidence from Chinese manufacturing firms. Sustainability 2023, 15, 6781. [Google Scholar] [CrossRef] [Scilit]
- Chen, Y.; Zhang, Y.; Wang, M. Green credit, financial regulation and corporate green innovation: Evidence from China. Financ. Res. Lett. 2024, 59, 104768. [Google Scholar] [CrossRef] [Scilit]
- Shi, L.; Wang, Y.; Jing, L. Low-carbon city pilot, external governance, and green innovation. Financ. Res. Lett. 2024, 67, 105768. [Google Scholar] [CrossRef] [Scilit]
- Wang, S.; Cao, Y.; Wang, Y.; Wang, C. The impact of innovative and low-carbon pilot cities on green innovation. Sustainability 2024, 16, 7234. [Google Scholar] [CrossRef] [Scilit]
- Zhao, M.; Wang, X.; Cheng, L. Business strategy, green innovation, and carbon reduction performance: Evidence from China. J. Environ. Plan. Manag. 2025, 68, 3035–3062. [Google Scholar] [CrossRef] [Scilit]
- He, G.; Liu, Y.; Chen, F. Research on the impact of environment, society, and governance (ESG) on firm risk: An explanation from a financing constraints perspective. Financ. Res. Lett. 2023, 58, 104038. [Google Scholar] [CrossRef] [Scilit]
- Li, W.; Zhu, J.; Liu, C. Environmental, social, and governance performance, financing constraints, and corporate investment efficiency: Empirical evidence from China. Heliyon 2024, 10, e40401. [Google Scholar] [CrossRef] [Scilit] [PubMed]
- He, F.; Guo, X.; Yue, P. Media coverage and corporate ESG performance: Evidence from China. Int. Rev. Financ. Anal. 2024, 91, 103003. [Google Scholar] [CrossRef] [Scilit]
- National Development and Reform Commission. Notices on the Pilot Program of Low-Carbon Provinces and Cities. 2010. Available online: https://www.ndrc.gov.cn/xxgk/zcfb/tz/201008/t20100810_964674.html (accessed on 11 September 2026). (In Chinese)
- Callaway, B.; Sant’Anna, P.H.C. Difference-in-differences with multiple time periods. J. Econom. 2021, 225, 200–230. [Google Scholar] [CrossRef] [Scilit]
- Laverty, K.J. Economic “short-termism”: The debate, the unresolved issues, and the implications for management practice and research. Acad. Manag. Rev. 1996, 21, 825–860. [Google Scholar] [CrossRef] [Scilit]
- Slawinski, N.; Bansal, P. Short on time: Intertemporal tensions in business sustainability. Organ. Sci. 2015, 26, 531–549. [Google Scholar] [CrossRef] [Scilit]
- DiMaggio, P.J.; Powell, W.W. The iron cage revisited: Institutional isomorphism and collective rationality in organizational fields. Am. Sociol. Rev. 1983, 48, 147–160. [Google Scholar] [CrossRef] [Scilit]
- Cao, Q.; Xu, Q. Construction of the Financial ESG System. Financ. Regul. Res. 2019, 95–111. (In Chinese) [Google Scholar]
- Lu, Y. Corporate ESG Disclosure Practice under the Dual-Carbon Goal and Its Implications: A Case Study of Hengrui Medicine. Int. Bus. Financ. Account. 2023, 36–39. (In Chinese) [Google Scholar]
- Tsinghua University Global Sustainability Development Research Institute. Research Report on the ESG Rating Index System of Chinese Local Governments; Tsinghua University: Beijing, China, 2023. (In Chinese) [Google Scholar]
- Li, Y.; Wang, H. Environmental, social and governance performance on brand value in the context of “Dual Carbon”: The mediating effect of R&D innovation. Sustainability 2024, 16, 10046. [Google Scholar] [CrossRef] [Scilit]
- Pfeffer, J.; Salancik, G.R. The External Control of Organizations: A Resource Dependence Perspective; Stanford University Press: Stanford, CA, USA, 2003. [Google Scholar]
- Freeman, R.E.; Evan, W.M. Corporate governance: A stakeholder interpretation. J. Behav. Econ. 1990, 19, 337–359. [Google Scholar] [CrossRef] [Scilit]
- Boardman, A.E.; Greenberg, D.H.; Vining, A.R.; Weimer, D.L. Cost-Benefit Analysis: Concepts and Practice, 5th ed.; Cambridge University Press: Cambridge, UK, 2018. [Google Scholar]
- Smith, W.K.; Lewis, M.W. Toward a theory of paradox: A dynamic equilibrium model of organizing. Acad. Manag. Rev. 2011, 36, 381–403. [Google Scholar] [CrossRef] [Scilit]
- Albuquerque, R.; Koskinen, Y.; Zhang, C. Corporate social responsibility and firm risk: Theory and empirical evidence. Manag. Sci. 2019, 65, 4451–4469. [Google Scholar] [CrossRef] [Scilit]
- Boubaker, S.; Cellier, A.; Manita, R.; Saeed, A. Does corporate social responsibility reduce financial distress risk? Econ. Model. 2020, 91, 835–851. [Google Scholar] [CrossRef] [Scilit]
- Chandler, A.D. Strategy and Structure: Chapters in the History of the Industrial Enterprise; MIT Press: Cambridge, MA, USA, 1962. [Google Scholar]
- Barney, J. Firm resources and sustained competitive advantage. J. Manag. 1991, 17, 99–120. [Google Scholar] [CrossRef] [Scilit]
- Opler, T.C.; Titman, S. Financial distress and corporate performance. J. Financ. 1994, 49, 1015–1040. [Google Scholar] [CrossRef] [Scilit]
- Whited, T.M.; Wu, G. Financial constraints risk. Rev. Financ. Stud. 2006, 19, 531–559. [Google Scholar] [CrossRef] [Scilit]
- Suttipun, M. ESG performance and corporate financial risk of the alternative capital market in Thailand. Cogent Bus. Manag. 2023, 10, 2168290. [Google Scholar] [CrossRef] [Scilit]
- Lee, J.; Koh, K. ESG performance and firm risk in the U.S. financial firms. Rev. Financ. Econ. 2024, 42, 328–344. [Google Scholar] [CrossRef] [Scilit]
- Myers, S.C.; Majluf, N.S. Corporate financing and investment decisions when firms have information that investors do not have. J. Financ. Econ. 1984, 13, 187–221. [Google Scholar] [CrossRef] [Scilit]
- Stiglitz, J.E.; Weiss, A. Credit rationing in markets with imperfect information. Am. Econ. Rev. 1981, 71, 393–410. [Google Scholar]
- Liu, Y.; Jin, X.M.; Ly, K.C.; Mai, Y. The relationship between heterogeneous institutional investors’ shareholdings and corporate ESG performance: Evidence from China. Res. Int. Bus. Financ. 2024, 71, 102457. [Google Scholar] [CrossRef] [Scilit]
- Bushee, B.J.; Core, J.E.; Guay, W.; Hamm, S.J. The role of the business press as an information intermediary. J. Account. Res. 2010, 48, 1–19. [Google Scholar] [CrossRef] [Scilit]
- Dyck, A.; Volchkova, N.; Zingales, L. The corporate governance role of the media: Evidence from Russia. J. Financ. 2008, 63, 1093–1135. [Google Scholar] [CrossRef] [Scilit]
- Cai, C.; Hazaea, S.A.; Alsayegh, M.F.; Sahu, M.; Raid, M.; Al-Ahdal, W.M. Media coverage as a moderator in the nexus between audit quality and ESG performance: Evidence from China. PLoS ONE 2024, 19, e0312510. [Google Scholar] [CrossRef] [Scilit] [PubMed]
- Bloomberg, L.P. Bloomberg ESG Data Service. Available online: https://data.bloomberglp.com/professional/sites/10/389674_CDS_REF_ESG_SFCT_DIG.pdf (accessed on 20 September 2026).
- Chinese Research Data Services Platform (CNRDS): ESG Ratings Database. Available online: https://www.cnrds.com/ (accessed on 8 September 2026).
- China Stock Market & Accounting Research Database (CSMAR); GTA Information Technology Co.: Financial Statements, Government Subsidies, Corporate Governance, News, and Business Distress (KZ Index) Modules. Available online: https://data.csmar.com/ (accessed on 30 August 2026).
- China Financial News Database (CFND); Chinese Research Data Services Platform (CNRDS): News Coverage Records. Available online: https://www.cnrds.com/ (accessed on 30 August 2026).
- Dimson, E.; Karakaş, O.; Li, X. Active ownership. Rev. Financ. Stud. 2015, 28, 3225–3268. [Google Scholar] [CrossRef] [Scilit]
- Ohlson, J.A. Financial ratios and the probabilistic prediction of bankruptcy. J. Account. Res. 1980, 18, 109–131. [Google Scholar] [CrossRef] [Scilit]
- Altman, E.I. Financial ratios, discriminant analysis and the prediction of corporate bankruptcy. J. Financ. 1968, 23, 589–609. [Google Scholar] [CrossRef]
- Kaplan, S.N.; Zingales, L. Do investment-cash flow sensitivities provide useful measures of financing constraints? Q. J. Econ. 1997, 112, 169–215. [Google Scholar] [CrossRef] [Scilit]
- Baron, R.M.; Kenny, D.A. The moderator-mediator variable distinction in social psychological research: Conceptual, strategic, and statistical considerations. J. Pers. Soc. Psychol. 1986, 51, 1173–1182. [Google Scholar] [CrossRef] [PubMed]
- MacKinnon, D.P.; Lockwood, C.M.; Williams, J. Confidence limits for the indirect effect: Distribution of the product and resampling methods. Multivar. Behav. Res. 2004, 39, 99–128. [Google Scholar] [CrossRef] [Scilit] [PubMed]
- Preacher, K.J.; Selig, J.P. Advantages of Monte Carlo confidence intervals for indirect effects. Commun. Methods Meas. 2012, 6, 77–98. [Google Scholar] [CrossRef] [Scilit]
- Imai, K.; Keele, L.; Tingley, D. A general approach to causal mediation analysis. Psychol. Methods 2010, 15, 309–334. [Google Scholar] [CrossRef] [Scilit] [PubMed]
- Cameron, A.C.; Gelbach, J.B.; Miller, D.L. Robust inference with multiway clustering. J. Bus. Econ. Stat. 2011, 29, 238–249. [Google Scholar] [CrossRef] [Scilit]
- Thompson, S.B. Simple formulas for standard errors that cluster by both firm and time. J. Financ. Econ. 2011, 99, 1–10. [Google Scholar] [CrossRef] [Scilit]
- Berg, F.; Kölbel, J.F.; Rigobon, R. Aggregate confusion: The divergence of ESG ratings. Rev. Financ. 2022, 26, 1315–1344. [Google Scholar] [CrossRef] [Scilit]
- Christensen, D.M.; Serafeim, G.; Sikochi, A. Why is corporate virtue in the eye of the beholder? The case of ESG ratings. Account. Rev. 2022, 97, 147–175. [Google Scholar] [CrossRef] [Scilit]
- Oliver, C. Strategic responses to institutional processes. Acad. Manag. Rev. 1991, 16, 145–179. [Google Scholar] [CrossRef] [Scilit] [PubMed]
- Marginson, D.; McAulay, L. Exploring the debate on short-termism: A theoretical and empirical analysis. Strateg. Manag. J. 2008, 29, 273–292. [Google Scholar] [CrossRef] [Scilit]
- Boxenbaum, E.; Jonsson, S. Isomorphism, diffusion and decoupling: Concept evolution and theoretical challenges. In The SAGE Handbook of Organizational Institutionalism, 2nd ed.; SAGE Publications: Thousand Oaks, CA, USA, 2017; pp. 77–97. [Google Scholar] [CrossRef] [Scilit]
- Goodman-Bacon, A. Difference-in-differences with variation in treatment timing. J. Econom. 2021, 225, 254–277. [Google Scholar] [CrossRef] [Scilit]
| Variable | N | Mean | SD | Min | P25 | Median | P75 | Max |
|---|---|---|---|---|---|---|---|---|
| ESG | 12,998 | 30.946 | 10.011 | 12.946 | 24.605 | 29.434 | 35.499 | 61.666 |
| Profit | 12,998 | 0.384 | 0.486 | 0.000 | 0.000 | 0.000 | 1.000 | 1.000 |
| Growth | 12,998 | 0.079 | 0.270 | 0.000 | 0.000 | 0.000 | 0.000 | 1.000 |
| O-Score | 12,629 | −8.754 | 2.120 | −15.896 | −9.830 | −8.419 | −7.361 | −4.141 |
| KZ | 12,829 | 1.460 | 2.095 | −5.213 | 0.315 | 1.698 | 2.850 | 5.835 |
| Media | 12,964 | 4.734 | 1.073 | 2.197 | 4.007 | 4.700 | 5.429 | 7.619 |
| GES | 12,998 | 0.024 | 0.087 | 0.000 | 0.000 | 0.000 | 0.004 | 0.644 |
| Size | 12,998 | 23.244 | 1.291 | 20.470 | 22.317 | 23.158 | 24.073 | 26.386 |
| BM | 12,998 | 1.452 | 1.561 | 0.098 | 0.464 | 0.895 | 1.812 | 8.328 |
| Lev | 12,998 | 0.480 | 0.199 | 0.069 | 0.328 | 0.492 | 0.633 | 0.888 |
| SOE | 12,998 | 0.500 | 0.500 | 0.000 | 0.000 | 0.000 | 1.000 | 1.000 |
| CashRatio | 12,998 | 0.637 | 0.919 | 0.026 | 0.181 | 0.337 | 0.666 | 5.985 |
| Top1 | 12,998 | 0.368 | 0.161 | 0.088 | 0.240 | 0.354 | 0.488 | 0.740 |
| Variable | Model 1 (Baseline DID) | Model 2 (Policy × Orientation) | Model 3 (Event Study) |
|---|---|---|---|
| DID | −0.078 (0.314) | −0.177 (0.330) | — |
| Profit | — | 1.545 *** (0.165) | — |
| Growth | — | −1.191 *** (0.239) | — |
| DID × Profit | — | 0.390 * (0.209) | — |
| DID × Growth | — | 0.053 (0.333) | — |
| Difference of interactions | — | 0.337 (0.355), p = 0.343 | — |
| Pre3 | — | — | 0.002 (0.459) |
| Pre2 | — | — | 0.254 (0.339) |
| Current | — | — | 0.103 (0.274) |
| Post1 | — | — | 0.009 (0.231) |
| Post2 | — | — | 0.269 (0.243) |
| Joint test of pre-periods | — | — | F = 0.29, p = 0.752 |
| Lev | −3.113 *** (0.870) | −1.108 (0.872) | −4.034 *** (1.095) |
| Controls | Yes | Yes | Yes |
| Firm and year fixed effects | Yes | Yes | Yes |
| N | 12,998 | 12,998 | 9168 |
| Groups | 1404 | 1404 | 1003 |
| R2 (within) | 0.6850 | 0.6967 | 0.6815 |
| Variable | Incentive: Model 1 (GES) | Incentive: Model 2 (KZ) | Pressure: Model 3 (Media) | Pressure: Model 4 (Size) |
|---|---|---|---|---|
| Profit | 1.726 *** (0.114) | 1.817 *** (0.125) | 1.686 *** (0.460) | 3.214 (2.042) |
| Growth | −1.177 *** (0.174) | −1.248 *** (0.249) | 0.116 (0.708) | 6.771 ** (3.000) |
| Moderator main effect | −1.998 * (1.166) | −0.155 *** (0.059) | 0.568 *** (0.121) | 2.014 *** (0.225) |
| Profit × Moderator | 2.404 ** (1.201), p = 0.046; two-part: receipt −0.450 (0.217), p = 0.038; amount +3.674 (1.319), p = 0.005 | −0.016 (0.053), p = 0.755 | 0.019 (0.096), p = 0.842 | −0.060 (0.089), p = 0.499 |
| Growth × Moderator | 0.848 (1.849), p = 0.646; two-part: see Section 4.4 | 0.038 (0.082), p = 0.645 | −0.271 * (0.147), p = 0.065 | −0.346 *** (0.129), p = 0.007 |
| Difference of interactions | 1.556 (1.773), p = 0.380 | −0.054 (0.088), p = 0.539 | 0.290 (0.161), p = 0.073 | 0.286 ** (0.139), p = 0.040 |
| Controls | Yes | Yes | Yes | Yes |
| Firm and year fixed effects | Yes | Yes | Yes | Yes |
| N | 12,998 | 12,829 | 12,964 | 12,998 |
| Groups | 1404 | 1404 | 1399 | 1404 |
| R2 (within) | 0.6968 | 0.6974 | 0.6983 | 0.7042 |
| Hypothesis | Content | Key Coefficient | Conclusion | Precision of the Null |
|---|---|---|---|---|
| H1a | Profit orientation negatively related to financial distress risk | a = −0.267 *** | Supported | — |
| H1b | Growth orientation positively related to financial distress risk | a = 0.050 ** (p = 0.048) | Supported (5% level; small effect) | — |
| H2 | Financial distress risk negatively related to ESG performance | b = −0.262 *** | Measure-dependent association (O-Score only) | — |
| H3a | Financial distress risk mediates the profit-orientation/ESG relation | Indirect effect +0.070, 3.9% of total | Measure-dependent indirect association (3.9% share) | Bootstrap 95% CI [+0.032, +0.109]; excludes zero under both methods |
| H3b | Financial distress risk mediates the growth-orientation/ESG relation | Indirect effect −0.013, 1.2% of total | Measure-dependent (marginal; 1.2% share) | Bootstrap 95% CI [−0.030, −0.001]; excludes zero under both methods; significance is marginal: upper bound 0.001 from zero, one-sided p = 0.018, and the share is only 1.2% |
| H4a | Low-carbon policy weakens the growth-side negative effect | DID × Growth = 0.053 (p = 0.873) | Indeterminate (underpowered) | Insufficient evidence: 95% CI [−0.600, +0.706]; farthest endpoint 63.6% of the baseline total effect |
| H4b | Low-carbon policy strengthens the profit-side positive effect | DID × Profit = 0.390 * (p = 0.063) | Nominally supported; exploratory after FDR correction; not robust to inference level | — |
| H5a | Subsidies weaken the growth-side negative effect | Growth × GES = 0.848 (p = 0.646) | Indeterminate (underpowered) | Interval too wide to determine: 95% CI [−2.779, +4.475]; farthest endpoint 403% of the baseline total effect |
| H5b | Subsidies strengthen the profit-side positive effect | Profit × GES = 2.404 ** (p = 0.046) | Nominally supported (linear spec); association concentrated in the amount margin | — |
| H6a | Financing constraints strengthen the growth-side negative effect | Growth × KZ = 0.038 (p = 0.645) | Certified null (TOST, 10% bound) | Precisely estimated null: 95% CI [−0.123, +0.198]; farthest endpoint 17.9% of the baseline total effect |
| H6b | Financing constraints weaken the profit-side positive effect | Profit × KZ = −0.016 (p = 0.755) | Certified null (TOST, 10% bound) | Precisely estimated null: 95% CI [−0.120, +0.087]; farthest endpoint 6.8% of the baseline total effect |
| H7a | Media attention aggravates the growth-side negative effect | Growth × Media = −0.271 * (p = 0.065) | Nominally supported (10% level) | — |
| H7b | Media attention strengthens the profit-side positive effect | Profit × Media = 0.019 (p = 0.842) | Certified null (TOST, 10% bound) | Precisely estimated null: 95% CI [−0.168, +0.207]; farthest endpoint 11.7% of the baseline total effect |
| H8a | Firm size strengthens the profit-side positive effect | Profit × Size = −0.060 (p = 0.499) | Certified null (TOST, 10% bound) | Precisely estimated null: 95% CI [−0.234, +0.114]; farthest endpoint 13.2% of the baseline total effect |
| H8b | Firm size aggravates the growth-side negative effect | Growth × Size = −0.346 *** (p = 0.007) | Nominally supported (1% level) | Difference of interactions 0.286, p = 0.040 (the only between-path difference significant at 5%) |
Disclaimer/Publisher’s Note: The statements, opinions and data contained in all publications are solely those of the individual author(s) and contributor(s) and not of MDPI and/or the editor(s). MDPI and/or the editor(s) disclaim responsibility for any injury to people or property resulting from any ideas, methods, instructions or products referred to in the content. |
© 2026 by the authors. Licensee MDPI, Basel, Switzerland. This article is an open access article distributed under the terms and conditions of the Creative Commons Attribution (CC BY) license.
Share and Cite
Sun, S.; Latip, M.; Sharkawi, I. Corporate Strategic Orientation and ESG Performance: Financial Distress and Boundary Conditions in China’s Evolving Green-Policy Environment. Sustainability 2026, 18, 9731. https://doi.org/10.3390/su18199731
Sun S, Latip M, Sharkawi I. Corporate Strategic Orientation and ESG Performance: Financial Distress and Boundary Conditions in China’s Evolving Green-Policy Environment. Sustainability. 2026; 18(19):9731. https://doi.org/10.3390/su18199731
Chicago/Turabian StyleSun, Shiru, Malisah Latip, and Ismawati Sharkawi. 2026. "Corporate Strategic Orientation and ESG Performance: Financial Distress and Boundary Conditions in China’s Evolving Green-Policy Environment" Sustainability 18, no. 19: 9731. https://doi.org/10.3390/su18199731
APA StyleSun, S., Latip, M., & Sharkawi, I. (2026). Corporate Strategic Orientation and ESG Performance: Financial Distress and Boundary Conditions in China’s Evolving Green-Policy Environment. Sustainability, 18(19), 9731. https://doi.org/10.3390/su18199731

