


Abstract
Amid accelerating globalization, climate change, and the transition toward sustainable development, reconciling international trade expansion with low-carbon transformation has become a central challenge for regional economies. This study examines the coordinated evolution of provincial trade and low-carbon development in China and identifies the conditions and policy factors associated with regime upgrading. Using panel data for 31 Chinese provinces from 2000 to 2022, we construct trade and low-carbon development indices and identify their coordination patterns and latent regimes. Machine learning with SHAP is then used to predict regime upgrading, while double machine learning estimates the effects of free trade zone exposure. The coordination degree increased from 0.560 to 0.736, mainly because the initially lagging trade subsystem caught up with low-carbon development. Four regimes were identified, with 94.3% annual persistence, indicating strong path dependence. FTZ exposure significantly improved trade development and coordination but produced no significant short-run low-carbon effect. Policies should integrate trade facilitation with industrial upgrading, clean-energy transition, and stronger environmental regulation.
1. Introduction
1.1. Background
International trade and low-carbon transformation have become increasingly interconnected dimensions of regional development. Trade integration expands market access, promotes specialization, and facilitates the international diffusion of capital and technology. However, it can also increase production, transportation demand, and fossil-energy consumption. The environmental consequences of trade therefore depend on the relative strength of scale, composition, and technique effects rather than following an inherently positive or negative trajectory [1].
This tension is particularly important in China, where rapid integration into global production networks has been accompanied by substantial emissions embodied in exports. China’s export-embodied carbon emissions peaked in 2008, after which changes in domestic production structure contributed to a marked decline. Production globalization has also reduced the carbon intensity of some Chinese exports by encouraging participation in relatively cleaner production stages [2]. Moreover, green product exports may reduce carbon emissions, although their effects vary across regions and product categories [3]. These mixed mechanisms make the coordinated evolution of trade and low-carbon development a central empirical issue.
1.2. Literature Review
1.2.1. International Trade and Carbon Emissions
The environmental consequences of international trade remain theoretically and empirically ambiguous. Trade expands production and transportation, potentially increasing fossil-energy consumption and carbon emissions, but it can also improve resource allocation, facilitate technological diffusion, and shift production toward less carbon-intensive activities. A substantial body of research therefore focuses on emissions embodied in trade rather than territorial emissions alone. Using Chinese input–output data, Liu et al. showed that demand–supply chains transfer substantial carbon emissions between production and consumption locations, highlighting the importance of interregional and international carbon flows [4]. Mi et al. further found that China’s export-embodied carbon emissions peaked in 2008 and subsequently declined, largely because of changes in the domestic production structure rather than a simple contraction in exports [5].
The organization of global value chains also affects the carbon consequences of trade. Fan et al. demonstrated that the carbon intensity associated with international trade depends on countries’ positions within global production networks and the distribution of value-added activities [6]. Zhang et al. found that processing exports were less carbon intensive than ordinary exports and that deeper participation in international production networks could improve the carbon efficiency of Chinese exports [2]. These findings indicate that trade volume alone is insufficient to determine environmental outcomes; production technology, imported intermediate inputs, and value-chain position are equally important.
Nevertheless, trade liberalization can also create carbon leakage and reinforce pollution-intensive specialization. Evidence from China’s industrial sectors suggests that the environmental impact of openness differs substantially between high- and low-carbon industries and must be evaluated through sector-specific embodied-emission structures [7]. Similarly, the carbon implications of trade relationships may extend beyond China’s borders. Wu et al. showed that trade intensity with China had heterogeneous effects on emissions in Belt and Road countries, depending partly on the direction and composition of trade [8].
Export composition provides a possible mechanism for reconciling these contrasting findings. Dong et al. reported that green product exports reduced provincial carbon emissions, with stronger effects associated with technologically advanced products and particular regional conditions [3]. By contrast, trade-related logistics and transportation can increase emissions even when the production process becomes cleaner. Shen et al. examined the interaction between international trade and logistics carbon emissions, emphasizing that the environmental gains from trade restructuring may be offset by freight expansion [9]. Ma et al. similarly incorporated trade-adjusted emissions into an analysis of China’s provincial digital economy, demonstrating that digitalization, trade exposure, and carbon outcomes are interdependent rather than separable processes [10].
Research has also emphasized the efficiency and distributional dimensions of embodied emissions. Hu et al. found that the efficiency of carbon emissions embodied in China’s exports improved between 2002 and 2017, although substantial differences persisted across sectors and convergence was conditional on structural characteristics [11]. Henders et al. demonstrated that exports of forest-risk commodities can embody considerable emissions from land-use change, extending the trade–carbon debate beyond industrial energy consumption [12]. Tawiah et al. showed that China’s economic engagement with Africa also has environmental implications for partner economies [13]. Salman et al. further documented significant relationships among foreign trade openness, foreign direct investment, and carbon emissions, reinforcing the need to consider trade and investment jointly [14].
Finally, carbon transfers complicate regional responsibility for emission reduction. Zhou et al. incorporated historical interprovincial carbon transfers into the allocation of emission rights, showing that production-based accounting alone may disadvantage regions producing carbon-intensive goods for external markets [15]. Overall, this literature establishes that trade may increase, redistribute, or reduce emissions depending on industrial composition, technology, logistics, and value-chain organization.
1.2.2. Trade Openness and Green Transformation
A second strand moves beyond emissions and examines whether openness improves green productivity and structural transformation. Zhang found that ICT-based digital trade promoted green total factor productivity through technological and structural channels, although the expansion of economic scale could generate offsetting environmental pressure [16]. Liu et al. identified a nonlinear relationship between environmental-goods exports and green total factor productivity: conventional environmental exports could initially constrain productivity, whereas positive effects emerged after export scale and absorptive capacity crossed particular thresholds [17].
Environmental regulation is an important conditioning factor. Gong et al. found an inverted-U-shaped relationship between regulation and manufacturing transformation and showed that trade comparative advantage was not necessarily conducive to green upgrading in the absence of effective environmental constraints [18]. Li et al. reported heterogeneous effects of foreign investment, exports, imports, human capital, and regulation on green total factor productivity in China’s equipment-manufacturing industries [19].
The effectiveness of international knowledge spillovers also depends on domestic absorptive capacity. Wang et al. showed that marketization facilitated the diffusion of international technology from China’s first-tier cities and improved provincial green total factor productivity, but the strength of these spillovers varied with research capacity, financial development, and openness [20]. Tan et al. found that China’s carbon-regulation policies improved total factor carbon efficiency, indicating that institutional constraints can convert economic and technological development into measurable carbon-efficiency gains [21].
Related studies emphasize the role of digitalization and structural modernization. Xiao et al. documented a positive relationship between the digital economy and urban green development, while also identifying spatial and regional heterogeneity [22]. In the agricultural sector, Zang et al. examined the joint relationship among agricultural trade, economic development, and carbon-emission intensity, showing that trade–environment interactions vary across sectors and development stages [23]. Li et al. identified marked regional differences in China’s carbon-emission efficiency, suggesting that national improvement can coexist with persistent local structural disadvantages [24]. Wang et al. similarly documented substantial differences in the scale and structure of carbon emissions across Chinese cities [25].
Collectively, these studies show that openness generates green benefits only under supportive technological, regulatory, industrial, and institutional conditions. However, most evaluate trade, emissions, or green productivity as separate outcomes and do not directly assess whether trade expansion and low-carbon transformation advance synchronously.
1.2.3. Coupling Coordination and Regional Heterogeneity
Coupling-coordination methods offer a framework for evaluating interactions between multiple development systems. Nie et al. examined green finance and industrial-structure optimization across Chinese provinces and found improving coordination alongside persistent spatial differences and heterogeneous drivers [26]. Wang et al. reported similar spatial and temporal heterogeneity in the coordination between the digital economy and high-quality energy development [27].
Research on urbanization also demonstrates that economic and environmental subsystems evolve unevenly. Liu et al. showed that population, land, and economic urbanization generated different effects on carbon emissions in Shandong Province [17]. Wan et al. identified considerable spatial differentiation in county-level high-quality development and emphasized the importance of regional structural conditions [28]. Although these studies demonstrate the usefulness of coupling and spatial analysis, direct evidence on provincial trade–low-carbon coordination remains scarce. Moreover, conventional coordination classifications generally rely on predetermined thresholds and provide limited information about latent development regimes, transition persistence, or the probability of upward mobility.
1.2.4. Free Trade Zones, Trade Performance, and Environmental Outcomes
China’s pilot free trade zones provide an important policy setting for examining whether trade-oriented institutional opening produces environmental co-benefits. Yao and Whalley described the Shanghai Pilot Free Trade Zone as an experimental platform for trade facilitation, capital-account reform, and financial liberalization [29]. Subsequent evidence, however, presents a differentiated picture. Bao et al. found that FTZs promoted inward and outward foreign direct investment, while their effects on goods imports and exports remained limited [30]. Chen et al. showed that FTZ establishment significantly attracted newly registered foreign-invested enterprises [31]. Wang and Shao reported that the policy improved provincial trade efficiency, partly through reductions in trade costs [32].
FTZs may also influence firm dynamics and innovation. Jiang et al. examined their effect on new-firm entry, providing evidence that institutional opening changes local business formation [33]. Yang et al. found that FTZs promoted substantive regional technological innovation through improvements in the business environment, producer-services agglomeration, and financial development [34]. He et al. likewise reported a positive effect on regional innovation capacity [35].
Evidence on environmental outcomes is less consistent. Ma et al. found that FTZ establishment increased urban green total factor productivity, although the effect was concentrated in the early post-policy period and varied across locations [36]. Wang et al., by contrast, reported that FTZ establishment initially aggravated environmental pollution, with the adverse effect weakening as implementation matured [20]. Feng et al. found that FTZs improved urban land green-use efficiency, especially in particular regions and city types [37]. Guo and Wang reported that institutional opening reduced urban carbon emissions through technological progress and related mechanisms [38].
The divergence in these findings may reflect differences in outcome measurement, geographic scale, sample period, and adjustment horizon. Green productivity, pollution intensity, land-use efficiency, and aggregate carbon performance capture different aspects of environmental change. Consequently, a policy may enhance trade efficiency or green productivity without producing an immediate reduction in aggregate emissions.
1.2.5. Research Gaps
Three gaps remain. First, most studies examine trade, carbon emissions, or green productivity separately, making it difficult to determine whether trade expansion and low-carbon transformation occur simultaneously. Second, coupling studies emphasize continuous coordination scores but rarely identify latent development configurations or model regime persistence and upward transitions. Third, existing FTZ research generally estimates effects on individual outcomes and does not distinguish trade-led improvements in system balance from genuine dual-system upgrading. The present study addresses these gaps by combining composite-index construction, coupling coordination, Gaussian mixture regime identification, transition analysis, interpretable machine learning, and double machine learning within a unified provincial framework.
Accordingly, this study addresses an overarching research question: how do trade development and low-carbon transformation co-evolve across Chinese provinces, what conditions facilitate transitions toward more advanced trade–low-carbon development regimes, and can trade-oriented institutional opening generate simultaneous economic and environmental gains? In addressing this question, the study makes three substantive contributions. First, it demonstrates that improved trade–low-carbon coordination does not necessarily imply synchronous progress in both subsystems, showing that much of the observed improvement reflects the catch-up of initially lagging trade development rather than equivalent low-carbon upgrading. Second, it moves beyond static coordination measures by identifying latent development regimes and their transition dynamics, thereby revealing strong persistence and path dependence in provincial development trajectories and the structural conditions associated with upward mobility. Third, it distinguishes improvements in measured coordination from genuine dual-system policy gains by showing that FTZ exposure can improve trade development and overall coordination without generating an immediate, statistically detectable improvement in low-carbon performance. This distinction highlights the importance of separating trade-led convergence from simultaneous trade–environment upgrading. To establish these substantive patterns, PCA, coupling coordination, GMM, interpretable machine learning, and DML are employed as complementary analytical tools rather than treated as contributions in themselves.
2. Hypothesis Development
Trade development and low-carbon transformation are jointly shaped by scale, structural, and technological mechanisms. Trade expansion may increase production, transport demand, and energy consumption, but it can also facilitate cleaner technologies, improve resource allocation, and shift production toward higher-value activities. Evidence from China shows that export-related carbon performance has improved with changes in production structure and value-chain organization, although substantial sectoral differences remain [2,11]. Trade and low-carbon development may therefore become more balanced over time, but coordination need not arise from equal growth in both subsystems. It may also result from the catch-up of an initially lagging subsystem (Figure 1).
Figure 1.
Hypothesis framework.
Hypothesis 1.
Provincial trade development and low-carbon transformation become increasingly coordinated over time, although coordination improvement may reflect asymmetric adjustment rather than fully synchronous growth.
Regional development paths are cumulative. Existing trade capacity, industrial specialization, energy dependence, infrastructure, and institutional capability constrain the range of feasible transitions. Coupling-coordination studies similarly show that improving national averages can coexist with persistent regional disparities and spatially concentrated low-development states [26,27]. Consequently, provinces are expected to remain within their existing trade–low-carbon regimes unless sufficient structural capacity has accumulated.
Hypothesis 2.
Provincial trade–low-carbon development regimes exhibit substantial persistence, and the probability of upward transition depends strongly on the province’s initial regime position.
The structural conditions supporting regime upgrading are unlikely to operate linearly. At low development levels, urbanization and industrial expansion may intensify energy demand and carbon pressure. Beyond certain stages, however, urban concentration can improve infrastructure efficiency, innovation diffusion, and environmental governance. Trade openness and green productivity also display threshold-dependent effects, while environmental regulation can alter whether trade advantages reinforce polluting specialization or promote cleaner restructuring [16,17,39,40].
Hypothesis 3.
Economic development, urbanization, and industrial transformation affect trade–low-carbon regime upgrading through nonlinear and stage-dependent relationships.
Free trade zones directly reduce institutional and transaction costs through customs facilitation, investment liberalization, and regulatory experimentation. These mechanisms can rapidly improve market access and trade efficiency [29,32]. However, low-carbon transformation requires slower adjustments in technology, energy systems, and industrial composition. Existing studies accordingly report stronger trade and investment effects than immediate environmental improvements, while some environmental benefits emerge only after policy implementation matures [30,41].
Hypothesis 4.
FTZ exposure exerts a stronger short-run effect on trade development than on low-carbon development and may improve coordination primarily through trade-subsystem catch-up rather than immediate dual-system upgrading.
These hypotheses are consistent with the study’s four-regime analytical framework, which distinguishes trade-lagging, balanced, trade-led, and advanced development configurations.
3. Data and Methodology
3.1. Workflow
Figure 2 presents the overall research framework of this study. This study adopts a multi-stage analytical framework to examine the coordination between trade development and low-carbon transformation across Chinese provinces. First, a trade development subsystem and a low-carbon development subsystem are constructed from multiple indicators. Principal component analysis is applied to reduce dimensionality, mitigate multicollinearity, and generate data-driven composite indices for the two subsystems. Second, the coupling coordination model is used to evaluate the extent to which trade expansion and low-carbon development evolve synchronously. In addition to the coupling coordination degree, the directional gap and absolute imbalance between the two subsystem indices are calculated to distinguish high-level coordination from low-level synchronization.
Figure 2.
Research workflow.
Third, a Gaussian mixture model is employed to identify latent trade–low-carbon development regimes without imposing arbitrary classification thresholds. The resulting regime labels are then used to construct indicators of state persistence, upgrading, and downgrading. Fourth, XGBoost is applied to predict transitions toward more advanced coordination regimes. SHAP values are used to interpret feature importance, nonlinear thresholds, and interactions among industrial structure, environmental governance, digital finance, trade openness, and regional characteristics. Finally, double machine learning is used to estimate the causal effect of pilot free trade zone implementation on coupling coordination and regime upgrading while allowing for flexible nonlinear relationships among covariates. This sequential design integrates measurement, classification, prediction, interpretation, and causal inference within a unified empirical framework.
3.2. Evaluation Indicator System and Variable Construction
A three-level evaluation indicator system was established to measure the coordinated development of trade and low-carbon transformation across Chinese provinces (Table 1). The first level represents the overall objective of trade–low-carbon coordinated development. The second level consists of two criterion subsystems: trade development and low-carbon development. The third level contains the specific indicators used to construct the two subsystem indices.
Table 1.
Three-level evaluation indicator system for trade–low-carbon coordinated development.
Indicator selection followed four principles: theoretical relevance, data availability, interprovincial comparability, and avoidance of information duplication. For the trade subsystem, customs statistics based on the domestic destination and origin of goods were used as the principal measures because they better reflect the locations where traded goods are produced and consumed. Operating-enterprise-location statistics were retained for robustness analysis. For the low-carbon subsystem, total apparent carbon emissions, GDP, population, and the composition of major emission sources were combined to capture both carbon efficiency and emission structure.
Accordingly, the low-carbon development index used in this study should be interpreted as a measure of selected dimensions of provincial low-carbon performance, particularly carbon efficiency, per capita emission pressure, and the composition of major emission sources. It does not represent the full scope of low-carbon transformation, which may additionally involve consumption-based emissions, embodied interprovincial carbon transfers, renewable-energy deployment, green technological innovation, and other dimensions that cannot be consistently measured within the present provincial panel.
All indicators were transformed so that higher values represented better subsystem performance. Trade-scale variables were converted into per capita terms and logarithmically transformed. Carbon intensity, per capita carbon emissions, coal dependence, and cement-emission dependence were treated as negative indicators and reverse-coded. The natural-gas share was treated as a positive structural indicator because natural gas represents a relatively lower-carbon substitute for coal. The resulting indicators were subsequently standardized and entered into principal component analysis.
The PCA results generate two composite indices: the trade development index (trade_index) and the low-carbon development index (lowcarbon_index). These indices constitute the basis for calculating the coupling degree, comprehensive development index, coupling coordination degree, system gap, and system imbalance.
Variables included in the PCA-based evaluation system were not simultaneously used as explanatory variables in the subsequent predictive and causal models, except where they were explicitly treated as lagged state variables (Table 2). Environmental investment, industrial structure, urbanization, digital finance, regional characteristics, and FTZ implementation were retained outside the composite indices to avoid mechanical correlations between the outcome indices and their potential determinants. Because the official digital financial inclusion series primarily covers the period beginning in 2011, digital-finance variables were used only in the corresponding post-2011 extension analysis.
Table 2.
Variables retained for subsequent analysis.
3.3. Construction of the Trade and Low-Carbon Development Indices
Principal component analysis (PCA) was employed to construct composite indices of provincial trade development and low-carbon development. PCA reduces a set of correlated indicators into a smaller number of orthogonal components while retaining most of the information contained in the original variables [42].
Before estimation, all indicators were transformed so that higher values consistently represented better subsystem performance. The trade indicators were positively oriented, whereas carbon emissions, coal dependence, and cement-related pressure were reverse-coded. Continuous variables with highly skewed distributions were logarithmically transformed, and extreme observations were winsorized before standardization. Each indicator was standardized as
where Xijt denotes indicator j for province i in year t, while Xj and sj denote its sample mean and standard deviation.
The suitability of each subsystem for PCA was assessed using the Kaiser–Meyer–Olkin statistic and Bartlett’s test of sphericity. Principal components were retained according to their eigenvalues, cumulative explained variance, and interpretability. The composite score for subsystem s was calculated as
where is the score of retained component mmm, and is its explained-variance share relative to the total variance explained by all retained components.
To ensure comparability between the two subsystems, the resulting scores were normalized to the interval [0, 1]:
The normalized indices are denoted by for trade development and for low-carbon development. To examine whether the subsequent results are sensitive to the PCA-based weighting procedure, an alternative equal-weight specification was constructed as a robustness check. After applying the same directional transformation, winsorization, and normalization procedures, equal weights were assigned to the indicators within each subsystem. Specifically, each of the four trade indicators received a weight of 0.25, while each of the five low-carbon indicators received a weight of 0.20. The alternative subsystem indices were then used to recalculate the coupling-coordination measures and re-estimate the GMM regime classification. Consistency between the baseline and alternative specifications was evaluated using index correlations, temporal coordination patterns, regime-classification agreement, and the Adjusted Rand Index (ARI).
Coupling Coordination and Subsystem Imbalance
The coupling coordination model was used to characterize the degree of mathematical synchronization and relative balance between the trade development and low-carbon performance indices. The coupling coefficient was calculated as:
where Cit ∈ [0, 1]. A larger value indicates greater synchronization between the two subsystem indices. However, the coupling coefficient captures relative balance rather than the absolute level of development. Two provinces with equally low trade and low-carbon indices may therefore exhibit a high coupling value.
To incorporate the overall development level, a composite development index was defined as:
where equal weights were assigned to the two subsystems, such that α = β = 0.5 because the study treats trade development and low-carbon performance as two conceptually parallel dimensions of coordinated development and does not impose an ex ante normative priority on either subsystem. Equal weighting also provides a transparent and neutral benchmark for evaluating whether improvements in coordination arise from balanced progress or asymmetric subsystem adjustment. Because this assumption is normative rather than empirically identified, alternative weighting schemes are examined in the sensitivity analysis.
The coupling coordination degree was then calculated as:
A higher Dit indicates that the two subsystems are simultaneously more balanced and more developed. Two supplementary indicators were constructed to clarify the source of coordination. The signed subsystem gap was defined as:
where a negative value indicates that trade development lags behind low-carbon development, while a positive value indicates trade-led development. The magnitude of subsystem imbalance was calculated as:
These measures prevent an increase in coordination from being interpreted automatically as simultaneous improvement in both subsystems.
3.4. Identification of Trade–Low-Carbon Development Regimes
A Gaussian mixture model (GMM) was used to identify latent development regimes from the joint distribution of the standardized trade and low-carbon indices. Unlike classifications based on predetermined coordination thresholds, a GMM allows the number, location, dispersion, and covariance structure of development regimes to be determined from the data. Finite mixture models are particularly suitable when the observed population consists of heterogeneous latent subgroups [43]. Let
denote the standardized trade and low-carbon indices. Their joint density was specified as:
where K is the number of latent regimes, πk is the mixing probability of regime k, and μk and Σk are its mean vector and covariance matrix.
Candidate models containing two to six components were estimated under spherical, diagonal, tied, and full covariance structures. Model selection considered the Bayesian information criterion, Akaike information criterion, silhouette coefficient, minimum regime size, and substantive interpretability. To avoid selecting statistically superior but empirically unstable solutions, candidate models containing a regime with fewer than 3% of the observations were not preferred. Each province-year observation was assigned to the regime with the highest posterior membership probability [44].
The estimated regimes were subsequently ordered according to their mean trade index, low-carbon index, and coordination degree. The labels therefore represent relative development configurations rather than administratively imposed categories.
Regime Transition and Provincial Mobility Analysis
Regime dynamics were examined using one-year transition matrices. Only consecutive province-year observations were retained, ensuring that every transition represented movement from year t to t + 1. The transition probability from regime j to regime k was calculated as:
where Njk is the number of observations moving from regime j in year t to regime k in year t + 1. A transition was classified as persistence when the regime remained unchanged, upgrading when the numerical regime rank increased, and downgrading when it decreased. Provincial trajectories were also examined over the full sample period to distinguish gradual progression, persistent lock-in, temporary reversal, and metropolitan advancement. To complement the discrete transition analysis, annual changes in the two subsystem indices were classified into four mobility patterns
The resulting categories were dual improvement, trade improvement with low-carbon deterioration, trade deterioration with low-carbon improvement, and dual deterioration. This analysis determines whether regime upgrading reflects balanced progress or improvement concentrated in only one subsystem.
3.5. Machine-Learning Prediction of Regime Upgrading
Supervised machine learning was used to identify the structural conditions associated with upward regime transitions. The dependent variable was defined as
Observations already classified in the highest regime were excluded because no further upward transition was feasible. The predictors measured at year t included GDP per capita, GDP growth, population size, urbanization, secondary- and tertiary-industry shares, industrial upgrading, environmental investment, Yangtze River Economic Belt membership, and FTZ status. The main specification additionally included current-regime indicators, with the lowest regime serving as the reference category.
Seven classification algorithms were compared: Logistic Regression, Decision Tree, Random Forest, Extra Trees, Gradient Boosting, XGBoost, and LightGBM. Because regime upgrading was rare, model performance was evaluated primarily using the area under the precision–recall curve [45]. ROC-AUC, balanced accuracy, recall, F1 score, Matthews correlation coefficient, Brier score, and log loss were reported as complementary metrics.
An expanding-window out-of-time validation design was adopted [46]. Each model was trained using observations from earlier years and evaluated on subsequent years, thereby preserving temporal ordering and reducing forward-looking information leakage. Hyperparameter selection was conducted within each training window rather than on the full sample. Model selection was based on pooled out-of-fold PR-AUC.
Given the severe class imbalance, PR-AUC was treated as the primary criterion for model comparison and selection, whereas ROC-AUC, balanced accuracy, recall, and F1 were used only as supplementary metrics. Hyperparameter tuning and model selection were conducted exclusively within each expanding training window, without using observations from subsequent validation periods. This nested temporal procedure was designed to prevent information from future periods from influencing model tuning or selection.
SHAP values were used to interpret the selected tree-based model. SHAP provides an additive decomposition of each model prediction into feature-specific contributions. For observation i, the model prediction can be represented as:
where ϕ0 is the model’s baseline output and ϕij is the SHAP contribution of predictor j. Positive SHAP values increase the model-predicted upgrading probability relative to the baseline, whereas negative values reduce it.
Global feature importance was measured using the mean absolute SHAP value:
Beeswarm and dependence plots were used to identify heterogeneity, nonlinearities, and potential thresholds. Because current regime may mechanically capture transition opportunity, a supplementary specification removed the current-regime indicators. The comparison between the two specifications separates state dependence from the predictive contribution of structural characteristics. SHAP values are interpreted as predictive contributions rather than causal effects.
3.6. Double Machine Learning Estimation of FTZ Policy Effects
Double machine learning was used to estimate the treatment effects associated with FTZ exposure after flexibly adjusting for observed pre-treatment provincial characteristics and trends. The interpretation of these estimates relies on the assumption that relevant treatment selection is adequately captured by the observed covariates; unobserved time-varying confounding cannot be completely ruled out [47].
The preceding PCA and finite-mixture analyses feed into the DML stage through the construction of outcome and state variables rather than through the orthogonal-score algorithm itself. Specifically, PCA generates the trade development index and low-carbon performance index, from which the coupling-coordination degree is subsequently calculated; these three measures serve as the principal outcome variables in the DML estimations. The finite mixture model classifies each province-year observation into a latent development regime based on the joint distribution of the two PCA-derived indices. These regime assignments are then used to define baseline regime status among the pre-treatment covariates and to construct the binary regime-upgrading outcome used in supplementary DML estimations. Thus, the PCA and mixture-model stages determine the substantive outcomes and development states for which DML subsequently estimates FTZ treatment parameters.
The FTZ treatment variable was defined as an absorbing indicator:
from the year in which province i first became exposed to an FTZ onward, and zero otherwise. A province was coded as treated from the year in which the first officially established FTZ within that province became operational and remained treated thereafter. Thus, the treatment variable captures provincial exposure to FTZ policy rather than the geographic share of the province directly covered by an FTZ. Province-level treatment is consistent with the spatial scale of the outcome variables and allows for within-province spillovers from localized FTZ activity, although it may attenuate estimated effects when FTZ coverage is geographically limited. The treatment in year t was related to outcomes in year t+1. The principal outcomes were the next-year trade index, low-carbon index, and coupling coordination degree. Changes in coordination and the probability of regime upgrading were examined as supplementary outcomes.
To avoid controlling for variables already affected by FTZ treatment, the nuisance models used provincial characteristics measured in 2012, immediately before the first FTZ establishment. These included GDP per capita, GDP growth, population, urbanization, industrial structure, environmental investment, YREB membership, baseline trade and low-carbon indices, baseline coordination, and baseline regime. Province-specific pre-treatment trends in the trade, low-carbon, and coordination indices over 2010–2012 were also included, together with year indicators. The control set was specified ex ante on the basis of theoretical relevance to FTZ selection and provincial trade–environmental development rather than selected mechanically by the machine-learning algorithms. Only variables observed prior to the first FTZ establishment were retained in order to avoid conditioning on potential post-treatment mediators. Continuous controls were entered using the transformations defined in the variable-construction stage, while binary policy and regime indicators were retained as dummy variables. No additional dimensionality-reduction or outcome-based variable screening was applied before nuisance-model estimation. Because the primary nuisance learners—Random Forest, Extra Trees, and Gradient Boosting—are tree-based methods and are not sensitive to differences in variable scale, additional standardization was not required. The machine-learning estimators were therefore allowed to flexibly select nonlinearities and interactions among the prespecified pre-treatment controls during cross-fitting. Year indicators absorb nationwide macroeconomic and policy shocks common to all provinces, while YREB membership is explicitly included as an observed regional-policy control. However, province-specific time-varying environmental, trade, or industrial policies that coincide with FTZ adoption cannot be fully controlled and remain a potential source of confounding.
Let Dit denote FTZ exposure, Yi, t + 1 the outcome, and Xi the set of pre-treatment covariates. The propensity-score and outcome nuisance functions were defined as
The average treatment effect was estimated using the orthogonal augmented inverse-probability-weighted score:
Random Forest was used as the primary nuisance learner, while Extra Trees and Gradient Boosting were used as alternative specifications. Cross-fitting was conducted using repeated five-fold province-blocked sample splitting. All observations from the same province were assigned to the same fold, preventing observations from adjacent years of one province from appearing simultaneously in the training and validation samples. The procedure was repeated ten times to reduce sensitivity to a particular fold assignment.
Propensity scores were clipped to the interval [0.02, 0.98] for numerical stability. As a common-support robustness test, the model was re-estimated after excluding observations with propensity scores outside [0.05, 0.95]. The estimation sample contained 93 treated and 589 untreated province-year observations. The estimated propensity-score distributions showed substantial overlap between the treated and untreated groups, and no observations were excluded under the [0.05, 0.95] common-support restriction. Statistical inference was based on influence-function standard errors clustered at the provincial level. For continuous outcomes, the estimated coefficient represents the average change in the corresponding index. For the binary upgrading outcome, the estimate represents the change in upgrading probability and can be interpreted in percentage points.
As an additional benchmark, a modern staggered-adoption DID estimator was used to estimate group-time average treatment effects while allowing treatment effects to vary across adoption cohorts and post-treatment periods [48]. The result is listed in the Supplementary Table S1.
4. Empirical Results
4.1. PCA Results and Composite Index Construction
Principal component analysis was conducted separately for the trade development and low-carbon development subsystems. Before estimation, all indicators were directionally unified, winsorized at the 1st and 99th percentiles, and standardized. The Kaiser–Meyer–Olkin and Bartlett tests confirmed the suitability of the data for dimensionality reduction. As shown in Table 3, the KMO values of the trade and low-carbon subsystems were 0.682 and 0.701, respectively, while both Bartlett tests were significant at the 1% level.
Table 3.
Principal component analysis results.
For the trade subsystem, the first principal component explained 82.47% of the total variance. The high loadings of per capita trade, exports, and imports indicate that the composite index primarily captures provincial trade scale and international market participation. The foreign-invested enterprise trade share contributed additional information on trade structure.
For the trade subsystem, one principal component was retained, explaining 82.47% of the total variance. For the low-carbon subsystem, two principal components were retained, jointly explaining 83.16% of the total variance. The two low-carbon components were combined according to their normalized explained-variance shares. Specifically, PC1 and PC2 accounted for 58.74% and 24.42% of the total variance, corresponding to normalized weights of 0.706 and 0.294, respectively as shown in Table 4. This procedure gives greater weight to the component retaining more information while preserving the multidimensional structure captured by the second component.
Table 4.
Normalized component weight.
For the low-carbon subsystem, two principal components jointly explained 83.16% of the total variance. Carbon intensity, per capita emissions, and coal dependence mainly reflected carbon efficiency, while cement-related emissions and the natural-gas share captured changes in the composition of emission sources. All indicators were positively associated with the final low-carbon index after directional transformation.
The retained components were further combined using variance-adjusted non-negative weights, generating the normalized trade development index (trade_index) and low-carbon development index (lowcarbon_index). These two indices formed the basis for the subsequent coupling coordination and regime-identification analyses.
4.2. Coupling Coordination Between Trade and Low-Carbon Development
Based on the PCA-derived trade development index and low-carbon development index, the coupling coordination model was applied to evaluate the extent to which the two subsystems evolved synchronously. Table 5 reports the descriptive statistics of the main coordination indicators.
Table 5.
Descriptive statistics of trade–low-carbon coordination.
The mean coupling coordination degree was 0.672, indicating that trade development and low-carbon transformation had generally reached an intermediate-to-high level of coordination. However, the relatively large dispersion of the trade development index compared with the low-carbon development index suggests that interprovincial differences were driven mainly by uneven trade performance. The average coupling degree was close to one, indicating that the two normalized subsystem indices were generally similar in relative magnitude. However, because the coupling coefficient is mechanically constructed from the two indices, it should not be interpreted as independent evidence of an underlying economic interaction between trade and low-carbon performance.
Temporally, the average coupling coordination degree increased from 0.560 in 2000 to 0.736 in 2022, while system imbalance declined from 0.288 to 0.125. The average system gap also shifted from −0.266 to 0.031, indicating a transition from low-carbon-leading and trade-lagging development toward a more balanced structure with slightly stronger trade performance. Spatial differences remained substantial, with coastal provinces generally exhibiting higher coordination than inland western provinces.
These results reveal that provinces with similar coordination degrees may nevertheless possess different internal structures. For example, a high coordination value may arise from both subsystems being highly developed or from one subsystem compensating for the relative weakness of the other. Therefore, the continuous coordination indicators alone cannot fully distinguish latent development patterns. The subsequent Gaussian mixture model is used to identify data-driven trade–low-carbon regimes based on the joint distribution of the two subsystem indices.
The system gap was further used to distinguish three relative development types: low-carbon-leading, relatively balanced, and trade-leading. As shown in Table 6, the distribution of these types changed substantially during 2000–2022. In 2000, 80.6% of the provinces were classified as low-carbon-leading, mainly because provincial trade development remained at a relatively low level. By 2010, this share had declined to 38.7%, while the proportion of relatively balanced provinces increased to 32.3%. In 2022, trade-leading provinces accounted for 51.6% of the sample, indicating that trade expansion had gradually outpaced low-carbon transformation in many regions.
Table 6.
Evolution of relative development types and representative provincial trajectories.
The provincial trajectories reveal that similar coordination improvements could reflect different underlying processes. Shanghai remained trade-leading throughout the sample period, but its coordination degree increased as low-carbon performance gradually improved. Beijing followed a different path: its low-carbon index rose substantially and reached 0.954 in 2022, transforming the municipality from a relatively balanced region into a high-level low-carbon-leading region (Figure 3 and Figure 4 and Figure S3).
Figure 3.
Coupling result between trade level and low-carbon condition.
Figure 4.
Evolution of relative development types and provincial trajectories.
Several central and western provinces experienced notable catch-up. Anhui moved from a pronounced low-carbon-leading structure in 2000 to relative balance in 2022, as its trade index increased from 0.139 to 0.573. Sichuan recorded the largest increase in coordination degree, rising by approximately 0.352 over the study period and eventually entering the relatively balanced group. However, improvement in the coordination degree did not always imply simultaneous progress in both subsystems. Shanxi shifted from low-carbon leadership to trade leadership because its trade index increased while its low-carbon index declined from 0.464 to 0.309. Tibet and Qinghai remained low-carbon-leading, but this mainly reflected weak trade development rather than high-level coordination.
These heterogeneous trajectories demonstrate that identical coordination degrees may conceal fundamentally different subsystem structures. This limitation motivates the subsequent application of the Gaussian mixture model to identify latent development regimes from the joint distribution of the trade and low-carbon indices.
4.3. Robustness to Alternative Composite-Index Construction
To assess whether the main findings depend on the PCA-based weighting procedure, we reconstructed both subsystem indices using an equal-weight approach as shown in Table 7. After applying the same directional transformation, winsorization, and normalization procedures as in the baseline analysis, equal weights were assigned to the four trade indicators and the five low-carbon indicators, respectively.
Table 7.
Robustness of Composite-Index Construction.
The alternative indices show a high degree of consistency with the baseline PCA measures. The equal-weight trade index is correlated with the PCA-based trade index at 0.987, while the corresponding correlation for the low-carbon index is 0.956. The mean coupling coordination degree is 0.668 under equal weighting, compared with 0.672 in the baseline specification. More importantly, the temporal pattern remains highly similar: the coordination degree increases from 0.566 in 2000 to 0.731 in 2022, confirming a substantial improvement in provincial trade–low-carbon coordination over the study period.
The underlying interpretation is also unchanged. Under the alternative index construction, the reduction in subsystem imbalance continues to be driven primarily by the catch-up of the initially weaker trade subsystem rather than by equally rapid improvements in low-carbon performance. Thus, the central finding that increasing coordination should not automatically be interpreted as synchronous trade and environmental upgrading is robust to the weighting procedure.
In addition, to assess whether the coordination results depend on the equal-weight assumption, the coupling-coordination degree was recalculated using alternative trade/low-carbon weights ranging from 0.3/0.7 to 0.7/0.3. The results remain highly consistent across specifications. The coordination degree increased substantially between 2000 and 2022 under all weighting schemes, while Spearman rank correlations with the baseline provincial rankings remained above 0.95 as shown in Table 8. Although assigning greater weight to trade slightly increased the estimated coordination level, the magnitude and direction of the longitudinal improvement remained stable. These results indicate that the principal findings are not materially sensitive to the baseline equal-weight assumption.
Table 8.
Sensitivity to Alternative Subsystem Weights.
4.4. Identification of Trade–Low-Carbon Development Regimes Using the Gaussian Mixture Model
The coupling coordination analysis demonstrates the overall level of interaction between trade development and low-carbon transformation. However, provinces with similar coupling coordination degrees may exhibit substantially different subsystem structures. To identify these heterogeneous development patterns, a Gaussian mixture model was estimated using the standardized trade development index and low-carbon development index.
Candidate models containing two to six latent regimes and four covariance structures with full, tied, diagonal, and spherical were compared. Model selection was primarily based on the Bayesian information criterion, while the Akaike information criterion, silhouette coefficient, minimum cluster size, and posterior classification probabilities were used as supplementary criteria. Although the six-component model with a full covariance structure produced the lowest BIC, its smallest cluster contained only 15 observations, accounting for 2.10% of the sample. Such a small class was considered insufficiently representative and potentially sensitive to individual observations. The four-component model with a full covariance structure was therefore selected as the preferred specification.
The selected model had a BIC of 3562.97, an AIC of 3457.87, and a silhouette coefficient of 0.343. The smallest regime contained 28 observations, corresponding to 3.93% of the total sample. The mean maximum posterior probabilities ranged from approximately 0.782 to 0.861 across the four regimes, indicating an acceptable level of classification certainty despite some overlap at the regime boundaries.
Figure 5 summarizes the selection and evolution of the GMM-based trade–low-carbon regimes. Panel (a) shows that the full-covariance specification generally achieved the lowest BIC values. Although models with more components further reduced the BIC, the four-regime model was retained because it provided more representative cluster sizes and clearer economic interpretation. Panel (b) distinguishes four development patterns. R1 represents trade-lagging and low-carbon-leading regions. R2 denotes lower-middle balanced development. R3 reflects trade-led coordination; and R4 captures advanced metropolitan development with high levels in both subsystems. Panels (c) and (d) reveal a clear upward structural transition. The share of R1 declined substantially between 2000 and 2022, while R3 became the dominant regime. R4 gradually emerged in Beijing, Shanghai, and Tianjin, whereas several western provinces remained locked in R1. Overall, provincial development shifted toward higher coordination, but substantial regional disparities and persistent low-level path dependence remained.
Figure 5.
GMM-Based Identification and Evolution of Trade–Low-Carbon Development Regimes in China, 2000–2022. (Notes: Panel (a) compares the Bayesian information criterion across models containing two to six regimes and four covariance structures. The four-regime model with a full covariance structure was selected after considering model fit, regime size, and economic interpretability. Panel (b) presents the joint distribution of the trade development and low-carbon development indices, with crosses indicating the estimated regime centers. Panel (c) illustrates the annual regime trajectories of the 31 provincial-level regions. Panel (d) reports the annual percentage distribution of provinces across the four GMM regimes. R1 denotes the trade-lagging and low-carbon-leading regime; R2 denotes the lower-middle balanced regime; R3 denotes the trade-led coordinated regime; and R4 denotes the advanced metropolitan regime. Although the six-component full-covariance model achieved the lowest BIC, it generated a very small cluster containing only 15 observations (2.10% of the sample). The four-component solution was therefore retained as a more stable and interpretable specification, with a minimum cluster size of 28 observations (3.93%)).
R1 represents a trade-lagging and low-carbon-leading regime. Its mean trade development index was only 0.235, whereas its low-carbon development index reached 0.490 as shown in Table 9. Therefore, the relatively low coordination degree of this group mainly resulted from insufficient trade development rather than uniformly weak performance in both subsystems. This regime was particularly prevalent during the early sample period and among several inland provinces.
Table 9.
Characteristics of the GMM-based trade–low-carbon development regimes.
R2 is characterized as a lower-middle balanced regime. The trade and low-carbon indices were 0.433 and 0.440, respectively, indicating that the two subsystems developed at similar levels. Nevertheless, their absolute development levels remained below those of the more advanced regimes. This finding shows that subsystem balance does not necessarily imply a high level of coordinated development.
R3, which accounted for 44.0% of all observations, represents a trade-led coordinated regime. Its trade index reached 0.612, exceeding its low-carbon index of 0.506, while the average coordination degree increased to 0.743. This regime was widely observed among the major coastal trading provinces, including Guangdong, Jiangsu, Shandong, and Fujian. It reflects a development pattern in which trade expansion provides the main growth momentum, although low-carbon transformation has not advanced at the same pace.
R4 represents the advanced metropolitan regime. It exhibited the highest trade index, low-carbon index, and coordination degree, with respective values of 0.838, 0.784, and 0.897. This regime contained only 28 province-year observations and was concentrated in Beijing, Shanghai, and Tianjin. Its limited size suggests that simultaneous high-level trade and low-carbon development remained restricted to a small number of highly developed municipalities.
The temporal distribution of the regimes reveals a clear structural transformation. In 2000, R1 accounted for 67.7% of provinces, whereas only 19.4% belonged to R3 and no province was classified as R4. By 2022, the share of R1 had fallen to 9.7%, while R3 had expanded to 54.8% and R4 to 9.7%. This pattern indicates that provincial development generally shifted from trade-lagging structures toward trade-led coordinated development.
Provincial trajectories further demonstrate the heterogeneity of this transition. Shanghai moved from R3 to R4 in 2010 and remained in the highest regime thereafter. Beijing shifted from R2 to R4 in 2013, mainly because of its substantial improvement in low-carbon performance. Tianjin remained predominantly in R3 before entering R4 after 2018. Anhui moved from R1 to R3 in 2010 and subsequently maintained its upgraded status, whereas Xinjiang followed a more gradual path from R1 to R2 and then to R3. In contrast, Gansu, Guizhou, and Qinghai remained in R1 throughout the study period, while Tibet remained in R2, reflecting persistent differences in regional development foundations.
The four-quadrant mobility plot further compares changes in the two subsystem indices between 2000 and 2022 as shown in Figure 6. Nineteen provinces were located in the dual-improvement quadrant, where both trade and low-carbon development increased. The remaining twelve provinces experienced trade improvement accompanied by a decline in the low-carbon index. No province recorded an overall decline in trade development. This pattern confirms that provincial upgrading was primarily trade-driven, while low-carbon progress remained uneven across regions.
Figure 6.
Provincial Mobility in Trade and Low-Carbon Development, 2000–2022. Notes: The horizontal axis represents the change in the trade development index between 2000 and 2022, while the vertical axis represents the corresponding change in the low-carbon development index. The four quadrants distinguish dual improvement, trade-led improvement with low-carbon decline, low-carbon-led improvement with trade decline, and dual decline. Points may be colored according to the province’s GMM regime in 2022.
As a sensitivity check, five- and six-regime specifications were also examined (Table 10). Although additional components further reduced the BIC, they generated increasingly small and overlapping clusters. Importantly, the main transition pattern remained unchanged across alternative specifications, with regime persistence remaining above 90% and upward transitions accounting for only a small proportion of annual transitions. The silhouette coefficient of 0.343 for the four-regime solution also indicates some overlap between adjacent regimes. Therefore, the regimes are interpreted as probabilistic development configurations rather than sharply separated categories. Overall, the four-regime solution provides a reasonable balance between statistical fit, classification stability, and substantive interpretability.
Table 10.
Sensitivity Analysis of Alternative GMM Regime Specifications.
Overall, the GMM results confirm that trade–low-carbon development cannot be adequately represented by a single coordination score. The four regimes capture differences in development level, subsystem balance, and dominant development orientation. These identified regimes provide the categorical basis for the subsequent analysis of regime persistence, upgrading, and downgrading transitions.
To examine whether provincial trade–low-carbon development regimes were persistent or mobile over time, 682 one-year transitions were constructed by matching each province’s regime in year t with its regime in year t+1. Table 11 reports the resulting transition probability matrix.
Table 11.
One-year transition probability matrix of GMM regimes.
The diagonal probabilities exceeded 90% for all four regimes, indicating strong regime persistence and considerable path dependence. Of all annual transitions, 94.28% represented persistence, 4.40% were upward movements, and only 1.32% were downward movements. R3 displayed particularly strong stability, with a persistence probability of 96.97%. R4 remained fully persistent, although this result should be interpreted cautiously because the regime contained relatively few metropolitan observations. Upward mobility occurred mainly through transitions from R1 to R3 and from R2 to R3, suggesting that several provinces bypassed intermediate stages as trade development accelerated.
Provincial mobility nevertheless differed substantially. Sichuan showed the highest transition frequency, recording three upgrades and three downgrades, whereas Heilongjiang and Yunnan also exhibited relatively pronounced regime fluctuations. By contrast, Beijing, Shanghai, Anhui, Guangxi, Henan, Hebei, Hubei, Shaanxi, and Chongqing achieved positive net regime improvements with limited subsequent reversal. Gansu, Guizhou, and Qinghai remained persistently locked in R1.
4.5. Drivers of Provincial Regime Upgrading: An XGBoost–SHAP Analysis
The preceding analysis established how provincial trade–low-carbon regimes differ and evolve over time. The next question is what conditions make an upward transition more likely. To address this issue, this section evaluates the predictive importance of economic, demographic, industrial, environmental, and policy-related factors. The dependent variable, ‘upgrade_next’, equals one when a province moves to a higher GMM regime in year (t + 1), and zero otherwise. Observations already classified as R4 are excluded because no further upward transition is possible. The predictors include GDP per capita, GDP growth, population size, urbanization, secondary- and tertiary-industry shares, industrial upgrading, environmental investment, Yangtze River Economic Belt membership, free trade zone status, and current-regime indicators. Seven classifiers are compared: Logistic Regression, Decision Tree, Random Forest, Extra Trees, Gradient Boosting, XGBoost, and LightGBM. An expanding-window out-of-time validation design preserves temporal ordering and limits information leakage. Model selection is based primarily on PR-AUC, with ROC-AUC, balanced accuracy, recall, F1 score, and probability-based loss measures used as complementary criteria (Figure 7).
Figure 7.
Out-of-Time Performance Comparison of Machine-Learning Models for Provincial Regime Upgrading. Notes: Panel (a) compares PR-AUC, ROC-AUC, balanced accuracy, and F1 scores across seven candidate models. Panel (b) presents the aggregated out-of-time ROC curves, while Panel (c) reports the corresponding precision–recall curves. The dashed diagonal line in Panel (b) represents random classification, and the dashed horizontal line in Panel (c) indicates the observed upgrading-rate baseline of 0.053.
Seven classification models were compared using expanding-window out-of-time validation. After excluding observations already located in R4, 657 province-year transitions remained eligible for upgrading, of which only 30, or 4.57%, were actual upgrades. The pooled out-of-time evaluation contained 378 observations and 20 upgrading events, producing a PR-AUC baseline of 0.053 as shown in Table 6 and Table 12.
Table 12.
Comparison for different models.
Gradient Boosting achieved the strongest overall predictive performance. Given the rarity of upgrading events, model comparison focused primarily on PR-AUC. Gradient Boosting achieved the highest PR-AUC of 0.204, approximately 3.9 times the observed baseline of 0.053, and was therefore selected as the preferred model. Its ROC-AUC was also relatively high (0.851), but ROC-AUC, balanced accuracy, recall, and F1 are interpreted only as supplementary measures because they may provide an overly optimistic assessment under severe class imbalance.
LightGBM produced the lowest Brier score and probability RMSE, indicating comparatively well-calibrated probabilities, but its ability to rank rare upgrading events was weaker than that of Gradient Boosting. Because the principal research objective is to identify the determinants of rare regime upgrading, Gradient Boosting was selected as the preferred model based primarily on PR-AUC, with ROC-AUC and balanced accuracy used as supplementary criteria.
The Gradient Boosting model was subsequently interpreted using probability-scale SHAP values. A positive SHAP value indicates that a predictor increases the model-implied likelihood of regime upgrading relative to the baseline prediction, whereas a negative value decreases it. The SHAP decomposition accurately reconstructed the model output, with an R2 of 1.000 and negligible numerical error. This result verifies the internal consistency of the explanation but should not be interpreted as evidence of perfect predictive accuracy.
Current R3 status was the dominant predictor, accounting for 52.78% of total mean absolute SHAP importance. Its contribution was predominantly negative because provinces already located in R3 could upgrade only by entering the relatively exclusive R4 regime as shown in Figure 8. This result therefore reflects transition-path dependence and a ceiling effect rather than a negative substantive effect of R3 itself. Among the structural variables, urbanization was the most important predictor, followed by GDP per capita, population size, and environmental investment.
Figure 8.
Global importance of regime upward condition.
Urbanization exhibited a clear threshold relationship. Values below approximately 0.38 generally reduced the predicted likelihood of upgrading, whereas the contribution became positive once a minimum level of urban development had been reached. GDP per capita displayed a comparable pattern: very low economic capacity constrained upward mobility, while intermediate and higher levels contributed positively, although the marginal contribution weakened at the upper end of the distribution. Population size also became favorable after crossing a minimum scale threshold, suggesting that market size and agglomeration capacity supported regime mobility. Environmental investment displayed a non-monotonic association, with moderate levels contributing positively but exceptionally high levels producing negative SHAP values. The latter pattern may reflect reactive environmental expenditure, diminishing efficiency, or severe pre-existing pollution pressures rather than a harmful effect of environmental investment itself.
To assess whether the structural findings were driven entirely by the initial regime position, the models were re-estimated without the current-regime indicators. Extra Trees achieved the highest PR-AUC in this supplementary specification. However, predictive performance declined substantially: PR-AUC fell from 0.204 to 0.116 and ROC-AUC from 0.851 to 0.606. This deterioration confirms that regime upgrading is strongly path-dependent and that structural conditions alone cannot fully capture the opportunity for upward transition(Figure 9).
Figure 9.
Out-of-Time Performance Comparison of Machine-Learning Models for Provincial Regime Upgrading. Panel (a) compares PR-AUC, ROC-AUC, balanced accuracy, and F1 scores across the seven candidate classifiers. Panel (b) presents the aggregated out-of-time ROC and precision–recall curves. Panel (c) reports global predictor importance measured by mean absolute SHAP values with 95% bootstrap confidence intervals. Panel (d) visualizes observation-level SHAP contributions, with province-year observations ordered by their predicted probability of regime upgrading. Red and blue cells indicate positive and negative contributions, respectively.
Nevertheless, the supplementary SHAP results support the relevance of several structural predictors. GDP per capita and urbanization remained among the three most important variables. A high secondary-industry share was generally associated with lower upgrading predictions, whereas industrial upgrading became favorable after the ratio of tertiary- to secondary-industry value added exceeded an intermediate threshold. Membership in the Yangtze River Economic Belt also generated predominantly positive SHAP contributions. This regional association should not be interpreted causally, because it may capture differences in accessibility, infrastructure, industrial foundations, and trade connectivity.
The resulting SHAP analysis shows that the remaining predictive information is concentrated in regional location, economic capacity, urbanization, and industrial structure. Membership in the Yangtze River Economic Belt, GDP per capita, and urbanization produced the largest SHAP contributions, while secondary-industry dependence, industrial upgrading, and GDP growth also provided meaningful predictive information. Population size, environmental investment, and free trade zone status played comparatively smaller roles.
The dependence plots reveal pronounced nonlinearities as shown in Figure 10. Yangtze River Economic Belt membership generally shifted predictions toward upgrading, although this association likely captures broader differences in infrastructure, accessibility, industrial foundations, and trade connectivity rather than a causal policy effect. GDP per capita followed an inverted-U-shaped pattern that low levels constrained upgrading, intermediate levels generated the strongest positive contribution, and the effect weakened among highly developed provinces, partly because these provinces had less remaining room for upward transition. Urbanization exhibited a similar threshold structure. Values below approximately 0.38 were generally associated with negative SHAP contributions, whereas urbanization rates of about 0.40–0.55 supported upgrading. The contribution weakened again at higher levels.
Figure 10.
SHAP values without current regime controls. (a) SHAP Distribution without Current-Regime Controls, (b) SHAP Dependence Relationships without Current-Regime Controls.
Industrial structure also displayed clear threshold effects. A rising secondary-industry share progressively reduced the predicted likelihood of upgrading and became predominantly negative above approximately 0.38. By contrast, industrial upgrading became clearly positive once the tertiary-to-secondary industry ratio exceeded roughly 1.4. GDP growth contributed little at low and moderate levels but became increasingly favorable above approximately 0.15.
Overall, the supplementary results confirm that structural conditions retain predictive relevance even after current-regime status is excluded. However, their substantially weaker predictive performance relative to the main model indicates that provincial upgrading depends jointly on transition opportunity and accumulated structural capacity. Initial regime position determines the feasible upgrading path, while urbanization, economic development, and industrial transformation shape the likelihood of successful upward mobility. These SHAP results represent predictive associations rather than causal effects.
4.6. Policy Extension: Can Trade-Oriented Opening Generate a Trade–Low-Carbon Dividend?
The preceding analyses identified the evolution of provincial trade–low-carbon regimes and the structural conditions associated with upward mobility. However, predictive importance does not establish whether a specific policy intervention generates coordinated improvements in the two subsystems. We therefore use double machine learning to examine whether exposure to a free trade zone, a predominantly trade-oriented institutional policy, produces a joint trade–low-carbon development dividend. FTZ exposure in year t is linked to outcomes in year t + 1. The nuisance functions incorporate pre-treatment provincial characteristics, pre-policy trends, and year indicators and are estimated through repeated province-blocked cross-fitting. Random Forest is used as the primary learner, while Extra Trees and Gradient Boosting provide alternative specifications. Standard errors are clustered at the provincial level.
The estimates reveal a distinctly asymmetric policy effect. FTZ exposure increased the next-year trade development index by 0.093 points (95% CI: 0.035–0.151; p = 0.003). The positive trade effect remained statistically significant across the alternative nuisance learners, making it the most robust result of the analysis. FTZ exposure also increased the subsequent coupling coordination degree by 0.046 points (95% CI: 0.007–0.084; p = 0.021). Propensity-score trimming produced nearly identical estimates, and all observations remained within the prespecified common-support interval, indicating that the results were not driven by observations with extreme treatment probabilities.
By contrast, the estimated effect on the low-carbon development index was positive but statistically indistinguishable from zero. No significant effects were detected for the annual change in coordination or the probability of entering a higher GMM regime. Although the estimated effect on regime upgrading was positive at approximately 5.5 percentage points, its confidence interval was wide and included zero.
The simultaneous increase in trade development and coordination, in the absence of a significant low-carbon effect, is consistent with a trade-led coordination mechanism. Many provinces initially exhibited relatively weak trade performance compared with their low-carbon development level. FTZ exposure may therefore improve coordination by accelerating the catch-up of the lagging trade subsystem and narrowing the gap between the two dimensions, even without an immediate improvement in low-carbon performance. However, the insignificant effects on coordination growth and regime upgrading indicate that this level effect did not translate into a persistent acceleration of coordinated development or a structural transition toward a higher regime.
Overall, trade-oriented institutional opening generated a clear trade dividend but not a statistically detectable dual trade–low-carbon dividend as shown in Figure 11. FTZ exposure appears capable of reducing an initial trade deficit within the coupled system, yet it is insufficient on its own to induce low-carbon transformation or regime-level upgrading. The findings therefore distinguish improvements in measured coordination from genuine simultaneous progress in both subsystems.
Figure 11.
Integrated DML Evidence on the Effects of FTZ Exposure on Trade–Low-Carbon Development.
4.7. Robustness, Placebo Tests, and Dynamic Policy Effects
To assess whether the baseline findings are sensitive to outcome timing, treatment assignment, or influential provinces, we conducted a consolidated set of robustness and falsification tests as shown in Table 13 and Figure 12. First, the DML specification was re-estimated for outcomes measured one, two, and three years after FTZ exposure. The trade effect appeared immediately and remained positive over all horizons, although its magnitude gradually declined. By contrast, the low-carbon effect was statistically insignificant in the first two years but became positive and significant after three years. The coordination effect increased moderately over time. This temporal pattern suggests that institutional opening initially operates through trade expansion, while environmental adjustment requires a longer implementation period.
Table 13.
Relative robustness and placebo test.
Figure 12.
Dynamic Effects, Placebo Tests, and Sensitivity Analyses of FTZ Exposure. Panel (a) reports DML treatment-effect estimates for outcomes measured one, two, and three years after FTZ exposure, with vertical lines indicating 95% confidence intervals. Panel (b) presents placebo distributions obtained by randomly reassigning FTZ adoption timing while preserving the staggered and absorbing treatment structure; diamonds denote the actual estimates. Panel (c) shows staggered-adoption event-study coefficients, using the year immediately preceding FTZ establishment as the reference period. Panel (d) reports leave-one-province-out estimates, with horizontal segments denoting the corresponding full-sample estimates.
Second, assigning FTZ treatment two or three years before its actual establishment produced no statistically significant effects. The absence of anticipatory effects reduces concerns that the estimates merely reflect pre-existing provincial trends or policy selection based on expected future performance. A randomization inference exercise, in which FTZ adoption years were reassigned across provinces while preserving the staggered and absorbing treatment structure, further showed that the observed trade and coordination estimates were located in the extreme right tail of the placebo distributions. The contemporaneous low-carbon estimate, however, was not distinguishable from placebo estimates, consistent with its delayed response.
Third, the staggered-adoption event study showed no statistically significant pre-treatment coefficients [49]. The joint pre-trend tests yielded p-values of 0.641, 0.528, and 0.706 for trade development, low-carbon performance, and coordination, respectively, providing no evidence of differential pre-treatment trends. These results support, but do not definitively establish, the parallel-trends assumption. Post-treatment coefficients showed an immediate trade response, followed by a gradual improvement in coordination and a delayed low-carbon effect. Finally, leave-one-province-out estimates remained positive and relatively stable, indicating that the results were not driven by Shanghai or other early-adopting provinces.
Overall, the additional tests support a sequential policy mechanism: FTZ exposure first generates a trade dividend, which subsequently contributes to coordination, whereas measurable low-carbon gains emerge only after a longer adjustment period.
5. Discussion
5.1. Principal Findings and Explanations
This study reveals a substantial improvement in the coordination between provincial trade development and low-carbon transformation in China from 2000 to 2022. The average coordination degree increased from 0.560 to 0.736, while the absolute gap between the two subsystems decreased markedly. However, this improvement did not arise from completely synchronized progress. At the beginning of the study period, most provinces were characterized by relatively stronger low-carbon performance but weaker trade development. Much of the subsequent increase in coordination therefore reflected the catch-up of the initially lagging trade subsystem. This distinction is important because an increase in coordination does not necessarily indicate equally rapid improvements in trade and low-carbon performance. Coordination can also improve when one subsystem approaches the other, even if progress in the initially stronger subsystem remains limited.
This result is consistent with the classical proposition that trade affects environmental performance through competing scale, composition, and technique effects. Trade expansion may increase production and energy consumption, but it can also facilitate specialization, technological diffusion, and cleaner production [50]. Its net environmental effect is therefore conditional rather than inherently beneficial or harmful [1]. The nonlinear relationship between economic development and trade–low-carbon upgrading also provides a useful connection to the Environmental Kuznets Curve (EKC) framework proposed by Grossman and Krueger [43]. The EKC literature argues that environmental pressure may initially increase with economic development as scale effects dominate, but can subsequently weaken as structural transformation, technological improvement, and stronger environmental preferences become more important. Our results are broadly consistent with this stage-dependent interpretation, although they do not constitute a direct test of the conventional income–pollution EKC. In particular, GDP per capita shows a nonlinear association with the predicted probability of regime upgrading: very low levels of economic capacity constrain upward mobility, intermediate levels are associated with the strongest positive contribution, and the marginal contribution weakens among the most developed provinces. The threshold effects observed for urbanization and industrial upgrading further suggest that economic expansion alone is insufficient; movement toward more advanced trade–low-carbon regimes becomes more likely when development is accompanied by structural and institutional conditions that support cleaner production and higher-value economic activity. The weakening contribution at very high income levels should not be interpreted as renewed environmental deterioration, because the dependent variable is regime upgrading rather than pollution and highly developed provinces also face a ceiling effect with less remaining scope for upward transition [51]. The regime heterogeneity identified by the Gaussian mixture model further qualifies the conventional growth–environment trade-off. The results do not support a single, uniform relationship in which stronger economic or trade development is necessarily accompanied by weaker environmental performance. Instead, the trade-off appears to be stage dependent. The trade-lagging and low-carbon-leading regime (R1) indicates that relatively favorable low-carbon performance can coexist with limited trade development, whereas the trade-led regime (R3) shows that rapid trade advancement may outpace low-carbon improvement. This pattern is consistent with a transitional growth–environment trade-off in which economic expansion initially proceeds faster than environmental upgrading. However, the advanced metropolitan regime (R4) combines high trade and high low-carbon performance, suggesting that the trade-off is not structurally inevitable and may weaken when economic development is accompanied by cleaner energy use, technological upgrading, and more advanced industrial structures. The coexistence of these regimes therefore supports a heterogeneous and stage-dependent interpretation of the growth–environment relationship rather than a universal linear trade-off.
The machine-learning results can be further interpreted through the environmental–economics distinction among scale, structural, and technique effects. Variables such as GDP per capita, population size, and urbanization partly capture the scale and agglomeration conditions under which economic expansion may initially increase resource and energy demand, whereas industrial upgrading and changes in sectoral composition reflect structural mechanisms that can shift production toward less carbon-intensive activities. The nonlinear SHAP patterns indicate that these mechanisms do not operate uniformly across development stages. In particular, higher economic capacity and urbanization become more favorable for regime upgrading only after certain development thresholds are reached, while excessive dependence on secondary industry is associated with a lower predicted probability of upward transition. These patterns are consistent with the view that the environmental consequences of growth depend on whether scale effects are eventually offset by structural transformation, technological improvement, and stronger environmental governance. Importantly, the SHAP results should be interpreted as predictive evidence about these stage-dependent relationships rather than as causal estimates of the underlying environmental–economic mechanisms.
The observed improvement may partly reflect changes in China’s export structure and production technology. Earlier research showed that China’s export-embodied carbon emissions peaked in 2008 and subsequently declined largely because of changes in domestic production structure [5]. Production globalization has also made some Chinese exports cleaner by changing the composition of intermediate inputs and production arrangements [2]. These findings support the interpretation that trade expansion and low-carbon transformation can become more compatible as production moves toward less carbon-intensive activities. Nevertheless, the present results show that this adjustment remains incomplete, the national coordination trend improved, but many provinces continued to rely on trade catch-up rather than simultaneous advancement in both subsystems.
The GMM analysis further identified four distinct development regimes and revealed pronounced state persistence. Approximately 94.3% of province-year observations remained in the same regime in the following year, while upward transitions accounted for only 4.4%. This indicates that improvements in the national average conceal considerable provincial inertia. Regime membership reflects accumulated differences in market access, industrial specialization, energy dependence, infrastructure, urbanization, and institutional capacity. Consequently, provinces cannot readily move into advanced regimes simply through short-term increases in trade or environmental investment. This finding extends existing evidence of convergence in export-related carbon efficiency. Although previous research suggests that inefficient sectors may gradually catch up in embodied-carbon efficiency, improvement in one environmental dimension does not necessarily produce a transition into a higher multidimensional development regime [11].
The machine-learning results help explain this persistence. Current regime position was the strongest predictor of next-year upgrading, indicating that transition opportunities depend heavily on the province’s initial state. When current-regime indicators were excluded, predictive performance declined substantially, although GDP per capita, urbanization, population scale, industrial structure, and Yangtze River Economic Belt membership retained meaningful predictive importance. Their effects were strongly nonlinear. Urbanization generally constrained upgrading below approximately 0.38 but became favorable at intermediate levels, while GDP per capita displayed an inverted-U-shaped relationship. A high secondary-industry share reduced the likelihood of upgrading, whereas industrial upgrading became favorable only after the tertiary-to-secondary industry ratio crossed a discernible threshold.
These patterns suggest that economic expansion and urbanization generate upgrading opportunities only when accompanied by adequate infrastructure, human capital, technological absorption, and environmental governance. They also support the argument that trade advantages alone may reinforce existing industrial specialization unless they are combined with appropriately designed environmental regulation. Previous research similarly found that trade comparative advantage was not necessarily conducive to manufacturing transformation in the absence of environmental constraints and that the effect of regulation itself could be nonlinear [18]. The present study develops this conclusion by showing that such structural conditions are associated not only with average green performance but also with the predicted probability of crossing into a higher trade–low-carbon regime.
5.2. FTZ Effects and Comparison with Previous Evidence
The principal advantage of this study is its distinction between trade expansion, improved system balance, and genuine dual-system upgrading. Studies based solely on emissions or green productivity cannot determine whether trade and low-carbon development advance synchronously. Similarly, an analysis using only the coordination degree could conclude that FTZs promote coordinated development without identifying which subsystem generated the improvement. By estimating the effects on trade, low-carbon performance, and coordination separately, the present framework demonstrates that an increase in coordination may be driven predominantly by trade catch-up.
A second advantage is the combination of continuous and discrete perspectives. The coupling coordination degree captures gradual changes in overall balance, whereas the GMM identifies qualitatively different configurations without relying on arbitrary classification thresholds. Transition matrices then reveal whether provinces actually move between these configurations. This approach shows that a rising national coordination score can coexist with substantial regime lock-in.
A third advantage is the separation of prediction from policy-effect estimation. The expanding-window machine-learning design identifies nonlinear predictors of upgrading while limiting temporal leakage, and SHAP values clarify the predictive contribution of each factor. DML is then used separately to evaluate FTZ exposure. This prevents predictive associations—such as the importance of urbanization or current regime—from being interpreted as causal effects.
The DML-based policy analysis reveals an asymmetric effect of FTZ exposure. FTZ exposure increased the next-year trade index by approximately 0.093 points and the subsequent coordination degree by approximately 0.046 points. These estimates remained broadly stable across Random Forest, Extra Trees, and Gradient Boosting nuisance learners and after propensity-score trimming. By contrast, the estimated effect on the low-carbon index was positive but statistically insignificant. FTZ exposure also failed to produce a significant acceleration in annual coordination growth or a statistically reliable increase in the probability of entering a higher GMM regime.
The significant trade effect is consistent with evidence that FTZs reduce trade costs and improve trade efficiency. Wang and Shao found that China’s FTZ policy significantly enhanced provincial trade efficiency and that the policy effect operated partly through lower trade costs [32]. However, our finding differs partly from Bao et al., who reported strong effects on inward and outward investment but relatively limited effects on goods imports and exports [30]. This difference may arise because the present trade index captures several dimensions—including trade volume, exports, imports, and foreign-invested-enterprise participation—rather than a single bilateral or aggregate trade flow.
The combination of a significant trade effect and an insignificant low-carbon effect supports a trade-led coordination mechanism. FTZs can rapidly improve customs procedures, investment facilitation, market accessibility, and institutional efficiency, thereby strengthening the weaker trade subsystem. Environmental transformation, however, generally requires longer-term changes in energy use, industrial structure, production technology, and firm behavior. Coordination may consequently improve because the trade subsystem catches up, even when low-carbon performance does not change significantly. This interpretation prevents the positive coordination coefficient from being misread as evidence of simultaneous green upgrading.
The low-carbon result differs from studies reporting that FTZs improve urban green total factor productivity. Ma et al. found a positive FTZ effect on green productivity, primarily through foreign investment and industrial upgrading [36]. The difference does not necessarily constitute a direct contradiction because green productivity and the low-carbon index used here capture different outcomes. Productivity may improve when output becomes more efficient relative to undesirable inputs, while aggregate carbon emissions, coal dependence, and per capita carbon pressure may remain largely unchanged.
Our result is more consistent with evidence that the environmental consequences of FTZ liberalization are dynamic and may initially be weak or unfavorable. Wang et al. found that FTZ establishment could initially aggravate environmental pollution, while potential environmental benefits became more visible as policy implementation matured [27]. The insignificant next-year low-carbon effect obtained here may therefore reflect a temporal mismatch: institutional opening produces an immediate trade response, whereas environmental improvements require complementary regulation and a longer adjustment period.
5.3. Limitations
Several limitations remain. First, the composite indices depend on the selected indicators and PCA-derived weights. Although PCA reduces subjective weighting, alternative indicators or normalization procedures may change provincial rankings and regime boundaries. Second, provincial data conceal substantial within-province heterogeneity. FTZs are implemented in particular cities and districts, so province-level treatment may dilute localized effects. In addition, the analysis does not explicitly model cross-provincial spatial dependence. Trade flows, industrial relocation, energy markets, and pollution may generate spillovers across provincial boundaries, while FTZ establishment in one province may also affect neighboring regions. Such spillovers may violate the Stable Unit Treatment Value Assumption (SUTVA), under which one province’s outcome is assumed to be unaffected by treatment in other provinces. Therefore, the estimated FTZ coefficients should primarily be interpreted as province-level policy associations, while potential indirect spatial effects remain outside the scope of the present analysis. Future research could explicitly incorporate spatial weight matrices or spatial treatment models to distinguish direct and spillover effects.
Third, the low-carbon index is based mainly on territorial emissions, energy use, and environmental investment. It does not fully capture consumption-based carbon transfers, renewable-energy deployment, green innovation quality, or emissions embodied in interprovincial supply chains. Fourth, GMM regimes are statistical classifications rather than fixed economic categories, and rare upward transitions—particularly transitions into the advanced metropolitan regime—limit the power of the upgrading model. A further limitation concerns the conceptual scope of the low-carbon index. The index primarily captures territorial carbon efficiency, per capita emission pressure, and the composition of major emission sources. It does not directly incorporate consumption-based emissions, embodied carbon transfers across provinces, renewable-energy deployment, or green innovation. Consequently, the index should be interpreted as representing selected dimensions of provincial low-carbon performance rather than the complete process of low-carbon transformation. Future research could integrate these additional dimensions as consistent provincial data become available.
Finally, DML flexibly adjusts for observed covariates but cannot eliminate bias from unobserved time-varying policies or selection into FTZ treatment. Staggered-adoption event studies, randomized treatment-timing placebo tests, multi-period outcome estimates, and leave-one-province-out analyses are therefore required before making strong causal claims. Future research could additionally use city- or firm-level data to identify whether FTZ effects operate through trade costs, foreign investment, industrial upgrading, or green technological innovation.
6. Conclusions and Policy Implications
Using panel data for 31 Chinese provinces from 2000 to 2022, this study develops an integrated framework to examine the evolution, classification, transition, prediction, and policy drivers of provincial trade–low-carbon development. Principal component analysis is used to construct trade and low-carbon development indices, while the coupling-coordination model evaluates their overall balance. A Gaussian mixture model identifies latent development regimes, transition analysis measures regime mobility, and machine-learning models with SHAP explain the structural conditions associated with upward transitions. Finally, double machine learning estimates the effects of free trade zone exposure on trade development, low-carbon performance, and system coordination.
- First, provincial trade–low-carbon coordination improved markedly between 2000 and 2022, but this progress was not fully synchronous. Much of the increase resulted from the catch-up of the initially weaker trade subsystem rather than rapid low-carbon advancement. Therefore, a higher coordination degree should not automatically be interpreted as simultaneous improvement in both dimensions.
- Second, the four identified development regimes exhibited strong persistence, with most provinces remaining in the same regime from one year to the next. Upward mobility depended heavily on the initial regime position and on accumulated structural conditions. Urbanization, economic development, population scale, and industrial upgrading were nonlinearly associated with the predicted likelihood of regime upgrading.
- Third, FTZ exposure was associated with a significant trade dividend and a higher subsequent coordination level, whereas this study did not identify a statistically reliable short-run effect on the measured dimensions of low-carbon performance at the provincial level. The coordination improvement was therefore primarily trade-led. These findings suggest that trade-oriented institutional opening can reduce subsystem imbalance, but they do not establish that FTZs have no environmental effect or that low-carbon responses are absent over longer horizons. The coordination effect was therefore mainly trade-led. Trade-oriented institutional opening can reduce subsystem imbalance, but it does not automatically produce low-carbon transformation or movement into a higher development regime.
Policy Implications
First, the findings suggest that trade facilitation may need to be complemented by explicit environmental objectives. Drawing on the empirical results and related literature, potential policy directions include green investment standards, low-carbon logistics, cleaner production requirements, and carbon-accounting mechanisms. These measures are presented as policy implications rather than interventions directly tested in this study. Without complementary environmental regulation and technological support, trade expansion may improve system balance while leaving the low-carbon subsystem largely unchanged.
Second, the predictive patterns suggest that regional policy may need to be differentiated according to development regime. Trade-lagging provinces may benefit from stronger market connectivity and trade infrastructure, whereas trade-led provinces may place greater emphasis on clean-energy substitution, industrial decarbonization, and technological upgrading. Advanced regions could further promote knowledge and technology spillovers.
Thirdly, policy evaluation should distinguish improved coordination from genuine dual-system upgrading. Governments should assess trade performance, low-carbon progress, subsystem gaps, and regime mobility separately rather than relying on a single coordination indicator. Sustainable upgrading requires both a reduction in imbalance and an absolute improvement in the performance of both subsystems.
Supplementary Materials
The following supporting information can be downloaded at: https://www.mdpi.com/article/10.3390/su18199737/s1, Figure S1. Average of coupling index; Figure S2. Average of Trade_index: Figure S3. Average of Low_carbon index; Table S1. Comparison of DML and Staggered-DID Estimates.
Author Contributions
Conceptualization, X.H. and X.L.; methodology, X.H. and X.L.; software, X.L.; validation, X.H. and X.L.; formal analysis, X.H. and X.L.; investigation, X.H.; resources, X.H. and X.L.; data curation, X.H.; writing—original draft preparation, X.H.; writing—review and editing, X.L.; visualization, X.H. and X.L.; supervision, X.L.; project administration, X.L. All authors have read and agreed to the published version of the manuscript.
Funding
This research was funded by Xiaodong Liu of funder Tsinghua University Architectural Design & Research Institute Co., Ltd., grant number KYN2026-001.
Data Availability Statement
Data is contained within the article or Supplementary Material.
Conflicts of Interest
Author Xiaodong Liu was employed by the Tsinghua University Architectural Design and Research Institute Co., Ltd. The author declare that this study received funding from T Tsinghua University Architectural Design & Research Institute Co., Ltd., grant number KYN2026-001. The funder had the following involvement with the study: the collection, analyses, or interpretation of data.
References
- Antweiler, W.; Copeland, B.R.; Taylor, M.S. Is Free Trade Good for the Environment? Am. Econ. Rev. 2001, 91, 877–908. [Google Scholar] [CrossRef] [Scilit]
- Zhang, Z.; Meng, J.; Zheng, H.; Zhu, K.; Du, H.; Guan, D. Production Globalization Makes China’s Exports Cleaner. One Earth 2020, 2, 468–478. [Google Scholar] [CrossRef] [Scilit]
- Dong, K.; Li, J.; Dong, X. How Do Green Product Exports Affect Carbon Emissions? Evidence from China. Chin. J. Popul. Resour. Environ. 2023, 21, 43–51. [Google Scholar] [CrossRef] [Scilit]
- Liu, H.; Liu, W.; Fan, X.; Zou, W. Carbon Emissions Embodied in Demand–Supply Chains in China. Energy Econ. 2015, 50, 294–305. [Google Scholar] [CrossRef] [Scilit]
- Mi, Z.; Meng, J.; Green, F.; Coffman, D.M.; Guan, D. China’s “Exported Carbon” Peak: Patterns, Drivers, and Implications. Geophys. Res. Lett. 2018, 45, 4309–4318. [Google Scholar] [CrossRef] [Scilit]
- Fan, J.-L.; Zhang, X.; Wang, J.-D.; Wang, Q. Measuring the Impacts of International Trade on Carbon Emissions Intensity: A Global Value Chain Perspective. Emerg. Mark. Financ. Trade 2021, 57, 972–988. [Google Scholar] [CrossRef] [Scilit]
- Fan, B.; Zhang, Y.; Li, X.; Miao, X. Trade Openness and Carbon Leakage: Empirical Evidence from China’s Industrial Sector. Energies 2019, 12, 1101. [Google Scholar] [CrossRef] [Scilit]
- Wu, Y.; Chen, C.; Hu, C. The Impacts of Trade Intensity with China on Carbon Emissions in Belt and Road Countries. J. Asia Pac. Econ. 2023, 28, 558–577. [Google Scholar] [CrossRef] [Scilit]
- Shen, Y.; Liu, J.; Tian, W. Interaction between International Trade and Logistics Carbon Emissions. Energy Rep. 2022, 8, 10334–10345. [Google Scholar] [CrossRef] [Scilit]
- Ma, Q.; Khan, Z.; Tariq, M.; IŞik, H.; Rjoub, H. Sustainable Digital Economy and Trade Adjusted Carbon Emissions: Evidence from China’s Provincial Data. Econ. Res.-Ekon. Istraž. 2022, 35, 5469–5485. [Google Scholar] [CrossRef] [Scilit]
- Hu, J.; Yan, S.; Wang, L. Efficiency and Convergence of China’s Export Trade Embodied Carbon Emissions. Chin. J. Popul. Resour. Environ. 2021, 19, 133–142. [Google Scholar] [CrossRef] [Scilit]
- Henders, S.; Persson, U.M.; Kastner, T. Trading Forests: Land-Use Change and Carbon Emissions Embodied in Production and Exports of Forest-Risk Commodities. Environ. Res. Lett. 2015, 10, 125012. [Google Scholar] [CrossRef] [Scilit]
- Tawiah, V.K.; Zakari, A.; Khan, I. The Environmental Footprint of China-Africa Engagement: An Analysis of the Effect of China—Africa Partnership on Carbon Emissions. Sci. Total Environ. 2021, 756, 143603. [Google Scholar] [CrossRef] [Scilit] [PubMed]
- Salman, A.; Razzaq, M.G.A.; Chang, B.H.; Wong, W.-K.; Uddin, M.A. Carbon Emissions and Its Relationship with Foreign Trade Openness and Foreign Direct Investment. J. Int. Commer. Econ. Policy 2023, 14, 2350023. [Google Scholar] [CrossRef] [Scilit]
- Zhou, H.; Ping, W.; Wang, Y.; Wang, Y.; Liu, K. China’s Initial Allocation of Interprovincial Carbon Emission Rights Considering Historical Carbon Transfers: Program Design and Efficiency Evaluation. Ecol. Indic. 2021, 121, 106918. [Google Scholar] [CrossRef] [Scilit]
- Zhang, H. Trade Openness and Green Total Factor Productivity in China: The Role of ICT-Based Digital Trade. Front. Environ. Sci. 2021, 9, 809339. [Google Scholar] [CrossRef] [Scilit]
- Liu, K.; Wang, J.; Kang, X.; Liu, J.; Xia, Z.; Du, K.; Zhu, X. Spatio-Temporal Analysis of Population-Land-Economic Urbanization and Its Impact on Urban Carbon Emissions in Shandong Province, China. Land 2022, 11, 266. [Google Scholar] [CrossRef] [Scilit]
- Gong, M.; You, Z.; Wang, L.; Cheng, J. Environmental Regulation, Trade Comparative Advantage, and the Manufacturing Industry’s Green Transformation and Upgrading. Int. J. Environ. Res. Public Health 2020, 17, 2823. [Google Scholar] [CrossRef] [Scilit] [PubMed]
- Li, Y.; Wu, Y.; Chen, Y.; Huang, Q. The Influence of Foreign Direct Investment and Trade Opening on Green Total Factor Productivity in the Equipment Manufacturing Industry. Appl. Econ. 2021, 53, 6641–6654. [Google Scholar] [CrossRef] [Scilit]
- Wang, X.; Wang, L.; Wang, S.; Fan, F.; Ye, X. Marketisation as a Channel of International Technology Diffusion and Green Total Factor Productivity: Research on the Spillover Effect from China’s First-Tier Cities. Technol. Anal. Strateg. Manag. 2021, 33, 491–504. [Google Scholar] [CrossRef] [Scilit]
- Tan, X.; Choi, Y.; Wang, B.; Huang, X. Does China’s Carbon Regulatory Policy Improve Total Factor Carbon Efficiency? A Fixed-Effect Panel Stochastic Frontier Analysis. Technol. Forecast. Soc. Change 2020, 160, 120222. [Google Scholar] [CrossRef] [Scilit]
- Xiao, Y.; Wu, S.; Liu, Z.Q.; Lin, H.J. Digital Economy and Green Development: Empirical Evidence from China’s Cities. Front. Environ. Sci. 2023, 11, 1124680. [Google Scholar] [CrossRef] [Scilit]
- Zang, D.; Hu, Z.; Yang, Y.; He, S. Research on the Relationship between Agricultural Carbon Emission Intensity, Agricultural Economic Development and Agricultural Trade in China. Sustainability 2022, 14, 11694. [Google Scholar] [CrossRef] [Scilit]
- Li, J.; Ma, J.; Wei, W. Analysis and Evaluation of the Regional Characteristics of Carbon Emission Efficiency for China. Sustainability 2020, 12, 3138. [Google Scholar] [CrossRef] [Scilit]
- Wang, H.; Zhang, R.; Liu, M.; Bi, J. The Carbon Emissions of Chinese Cities. Atmos. Chem. Phys. 2012, 12, 6197–6206. [Google Scholar] [CrossRef] [Scilit]
- Nie, L.; Chen, P.; Liu, X.; Shi, Q.; Zhang, J. Coupling and Coordinative Development of Green Finance and Industrial-Structure Optimization in China: Spatial-Temporal Difference and Driving Factors. Int. J. Environ. Res. Public Health 2022, 19, 10984. [Google Scholar] [CrossRef] [Scilit] [PubMed]
- Wang, S.; Wang, A.; Liu, S.; Zhang, C.; Qiao, L.; Li, X. Research on the Coupling Coordination Relationship between the Digital Economy and High-Quality Energy Development: Evidence from China. Heliyon 2024, 10, e24637. [Google Scholar] [CrossRef] [Scilit] [PubMed]
- Wan, J.; Wang, Z.; Ma, C.; Su, Y.; Zhou, T.; Wang, T.; Zhao, Y.; Sun, H.; Li, Z.; Wang, Y.; et al. Spatial-Temporal Differentiation Pattern and Influencing Factors of High-Quality Development in Counties: A Case of Sichuan, China. Ecol. Indic. 2023, 148, 110132. [Google Scholar] [CrossRef] [Scilit]
- Yao, D.; Whalley, J. The China (Shanghai) Pilot Free Trade Zone: Background, Developments and Preliminary Assessment of Initial Impacts. World Econ. 2016, 39, 2–15. [Google Scholar] [CrossRef] [Scilit]
- Bao, T.; Dai, Y.; Feng, Y.; Liu, S.; Wang, R. Trade Liberalisation and Trade and Capital Flows: Evidence from China Pilot Free Trade Zones. World Econ. 2023, 46, 1408–1422. [Google Scholar] [CrossRef] [Scilit]
- Chen, H.; Yuan, B.; Cui, Q. Does the Pilot Free Trade Zone Policy Attract the Entering of Foreign-Invested Enterprises? The Evidence from China. Appl. Econ. Lett. 2021, 28, 1162–1168. [Google Scholar] [CrossRef] [Scilit]
- Wang, L.; Shao, J. Can China’s Pilot Free Trade Zone Improve Trade Efficiency? J. Int. Commer. Econ. Policy 2022, 13, 2250006. [Google Scholar] [CrossRef] [Scilit]
- Jiang, L.; Lu, J.; Yang, Y. Pilot Free Trade Zone Establishment and New Firm Entry: Evidence from China. Rev. Int. Econ. 2025, 33, 335–351. [Google Scholar] [CrossRef] [Scilit]
- Yang, J.; Li, Y.; Dai, F.; Ni, J. How Can Pilot Free Trade Zones Affect Regional Technology Innovation? –Evidence from China at the City Level. Appl. Econ. 2025, 57, 216–231. [Google Scholar] [CrossRef] [Scilit]
- He, B.; Tian, S.; Zhang, X. Does the Pilot Free Trade Zone Policy Increase Regional Innovation Ability? Evidence from China. Appl. Econ. Lett. 2025, 32, 576–581. [Google Scholar] [CrossRef] [Scilit]
- Ma, Q.; Zhang, Y.; Yang, K.; He, L. Have China’s Pilot Free Trade Zones Improved Green Total Factor Productivity? Int. J. Environ. Res. Public Health 2021, 18, 11681. [Google Scholar] [CrossRef] [Scilit] [PubMed]
- Feng, Y.; Li, Y.; Nie, C. The Effect of Place-Based Policy on Urban Land Green Use Efficiency: Evidence from the Pilot Free-Trade Zone Establishment in China. Land 2023, 12, 701. [Google Scholar] [CrossRef] [Scilit]
- Guo, J.; Wang, H. Study on Carbon Emission Reduction Effect of Institutional Openness in China. Sci. Rep. 2023, 13, 254. [Google Scholar] [CrossRef] [Scilit] [PubMed]
- Zhou, J.; Cui, F.; Wang, W. The Spatial Effect of Financial Innovation on Intellectualized Transformational Upgrading of Manufacturing Industry: An Empirical Evidence from China. Sustainability 2022, 14, 7665. [Google Scholar] [CrossRef] [Scilit]
- Jia, Q.; Zhang, T.; Cheng, L.; Cheng, G.; Jin, M. The Impact of the Neighborhood Built Environment on the Walking Activity of Older Adults: A Multi-Scale Spatial Heterogeneity Analysis. Sustainability 2022, 14, 13927. [Google Scholar] [CrossRef] [Scilit]
- Wang, L.; Wang, Z.; Ma, Y. Environmental Effects of Trade Liberalization–Evidence from China’s Pilot Free Trade Zone. J. Int. Commer. Econ. Policy 2021, 12, 2150013. [Google Scholar] [CrossRef] [Scilit]
- Jolliffe, I.T. Principal Component Analysis; Springer Series in Statistics; Springer: New York, NY, USA, 2002; ISBN 978-0-387-95442-4. [Google Scholar]
- McLachlan, G.; Peel, D. Finite Mixture Models. In Wiley Series in Probability and Statistics, 1st ed.; Wiley: Hoboken, NJ, USA, 2000; ISBN 978-0-471-00626-8. [Google Scholar]
- Fraley, C.; Raftery, A.E. Model-Based Clustering, Discriminant Analysis, and Density Estimation. J. Am. Stat. Assoc. 2002, 97, 611–631. [Google Scholar] [CrossRef] [Scilit]
- Saito, T.; Rehmsmeier, M. The Precision-Recall Plot Is More Informative than the ROC Plot When Evaluating Binary Classifiers on Imbalanced Datasets. PLoS ONE 2015, 10, e0118432. [Google Scholar] [CrossRef] [Scilit]
- Duan, F.; Wang, H.; Yang, H.; Wei, C.; Zhang, C.; Song, Y.; Liu, Z. MRFM-IFCOS: An Anchor-Free Interactive Detector Based on Multireceptive Field Mamba for Detecting Catenary Support Components. IEEE Trans. Instrum. Meas. 2025, 74, 2553415. [Google Scholar] [CrossRef] [Scilit]
- Chernozhukov, V.; Chetverikov, D.; Demirer, M.; Duflo, E.; Hansen, C.; Newey, W.; Robins, J. Double/Debiased Machine Learning for Treatment and Structural Parameters. Econom. J. 2018, 21, C1–C68. [Google Scholar] [CrossRef] [Scilit]
- Callaway, B.; Sant’Anna, P.H.C. Difference-in-Differences with Multiple Time Periods. J. Econom. 2021, 225, 200–230. [Google Scholar] [CrossRef] [Scilit]
- Sun, L.; Abraham, S. Estimating Dynamic Treatment Effects in Event Studies with Heterogeneous Treatment Effects. J. Econom. 2021, 225, 175–199. [Google Scholar] [CrossRef] [Scilit]
- Qin, Z.; Sha, Z. Optimizing Anthropogenic Management Practices Can Effectively Enhance the Vegetation Carbon Sequestration in China. J. Environ. Manag. 2026, 411, 130196. [Google Scholar] [CrossRef] [Scilit] [PubMed]
- Grossman, G.M.; Krueger, A.B. Economic Growth and the Environment. Q. J. Econ. 1995, 110, 353–377. [Google Scholar] [CrossRef] [Scilit]
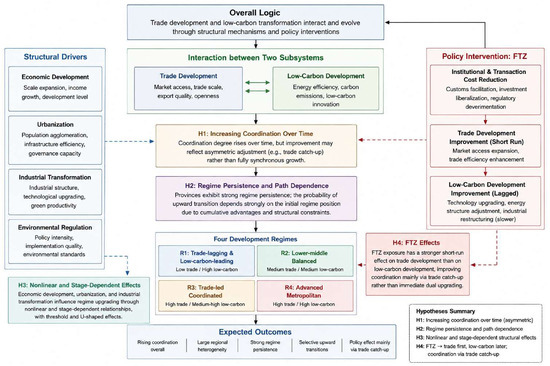
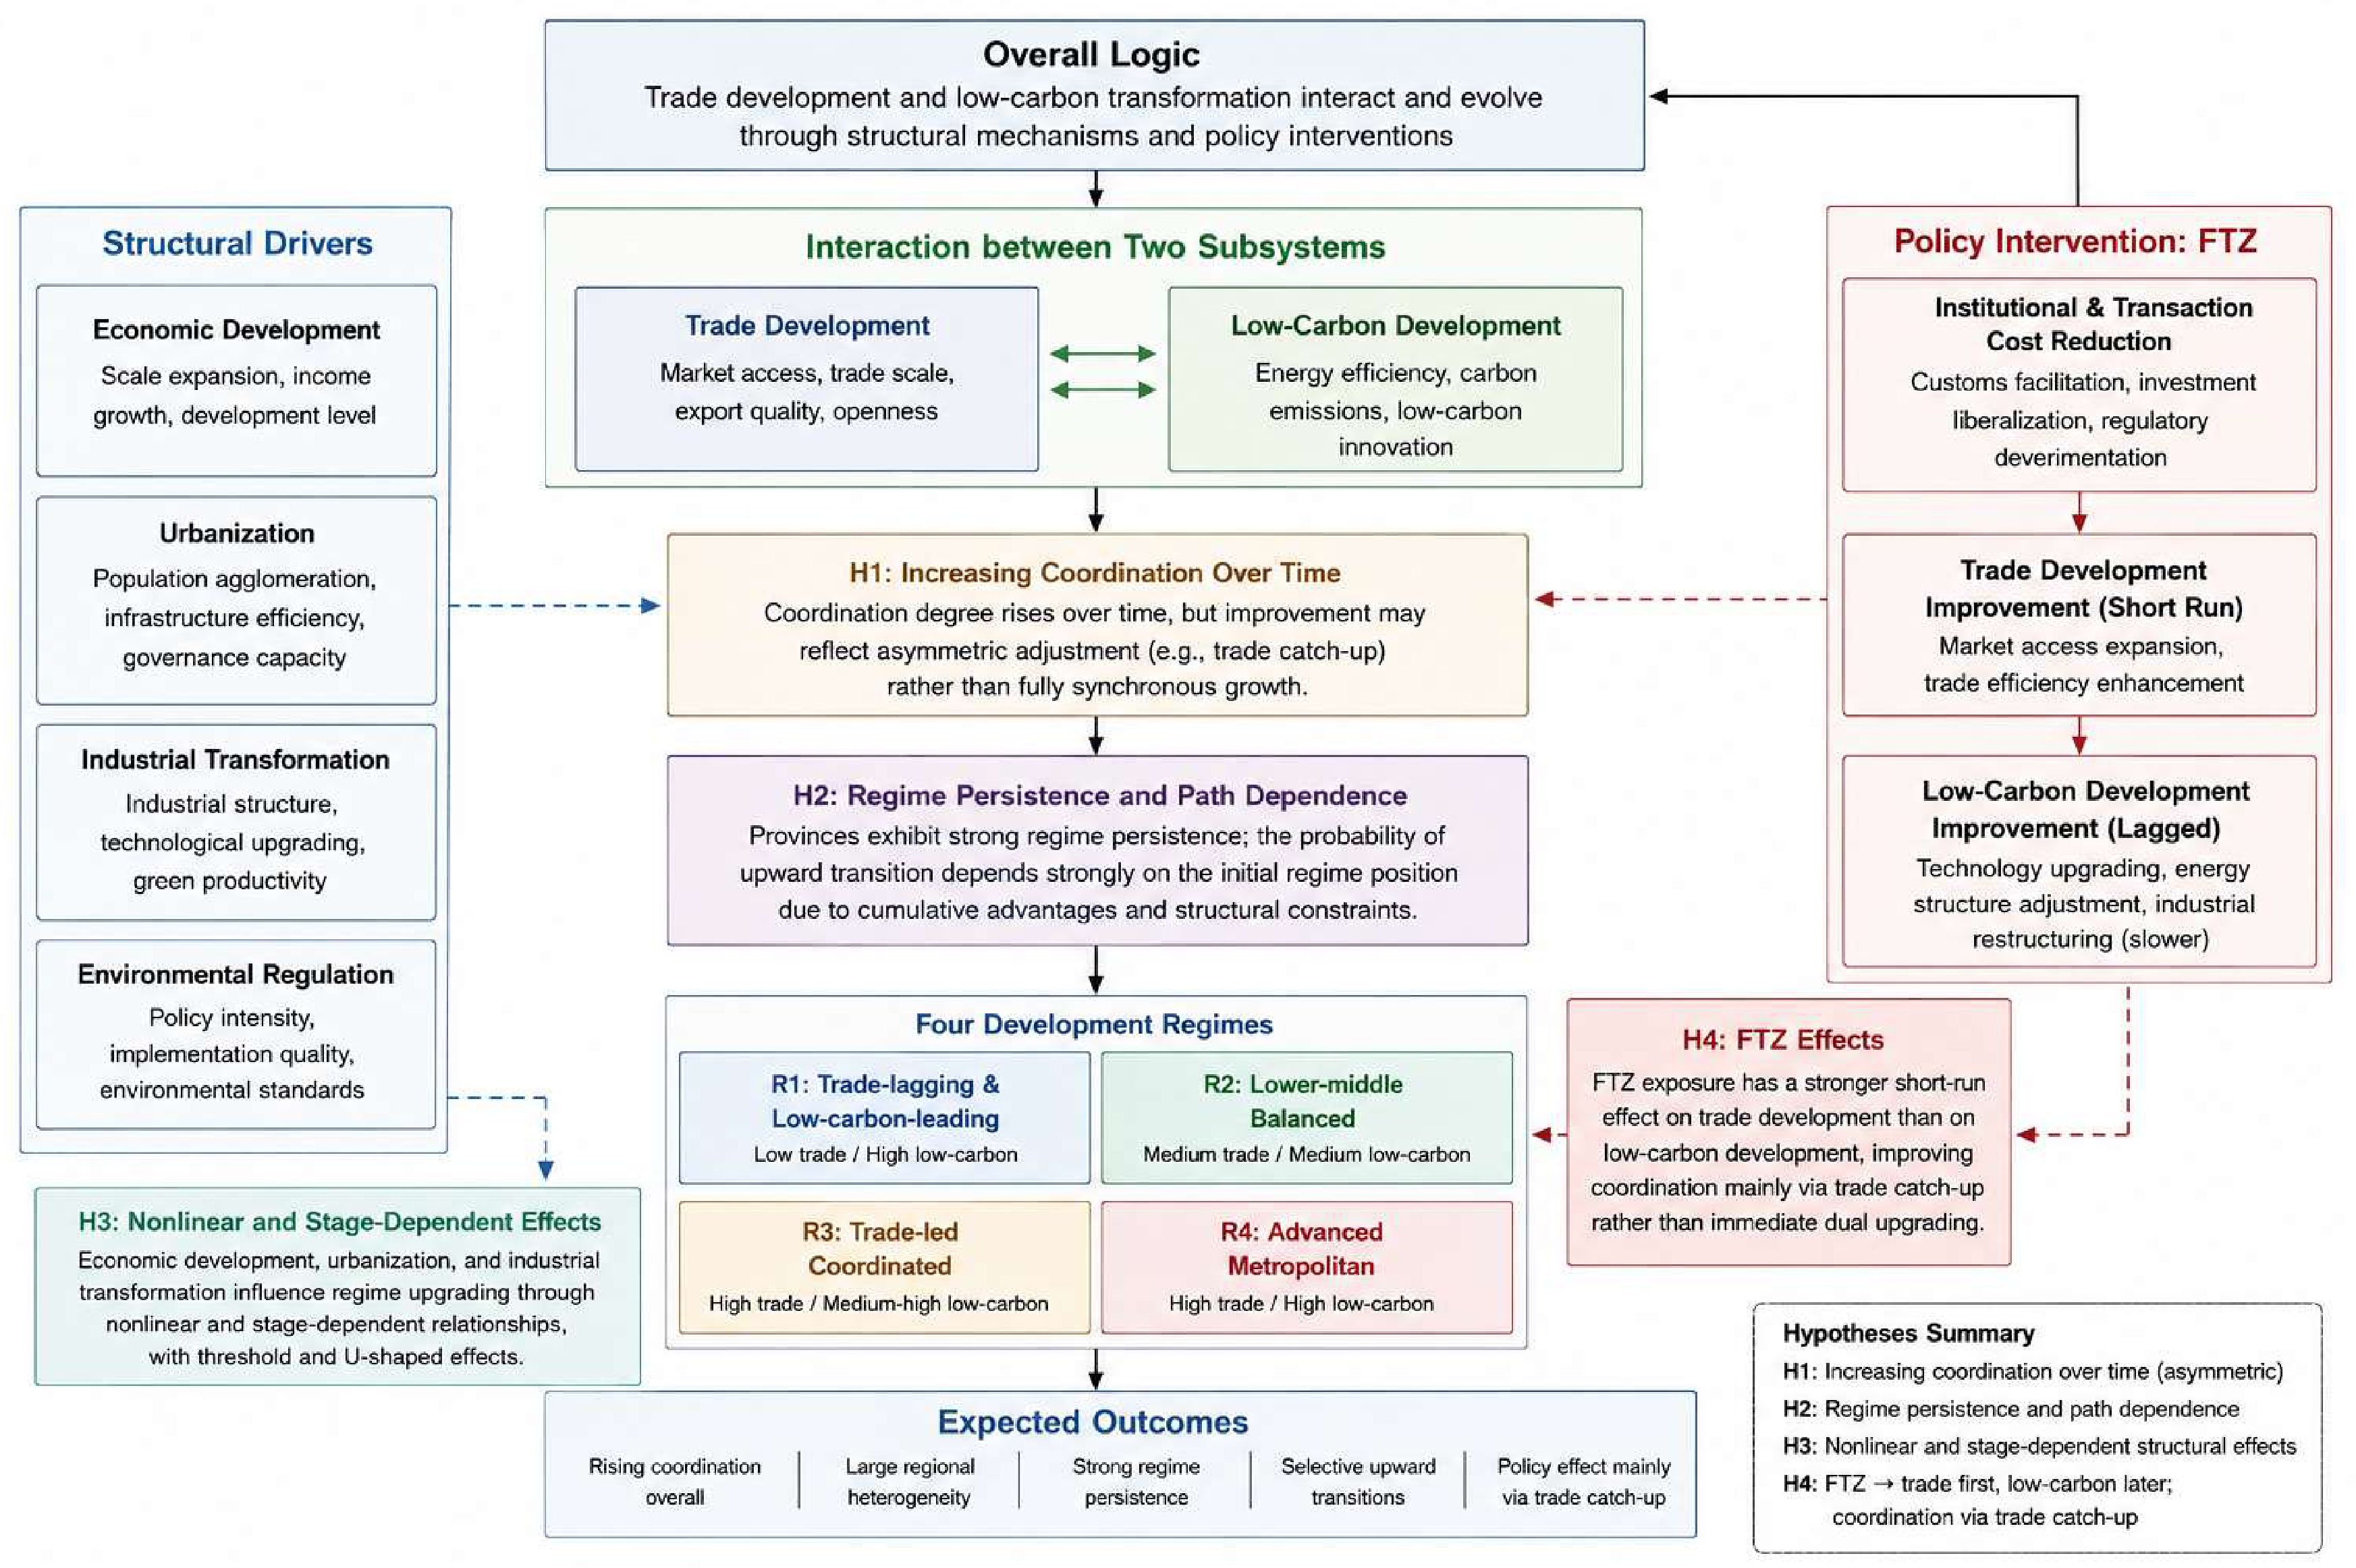
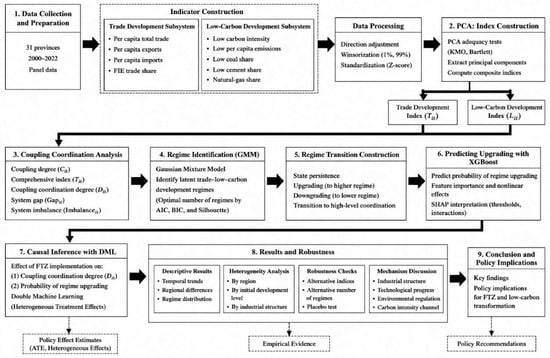
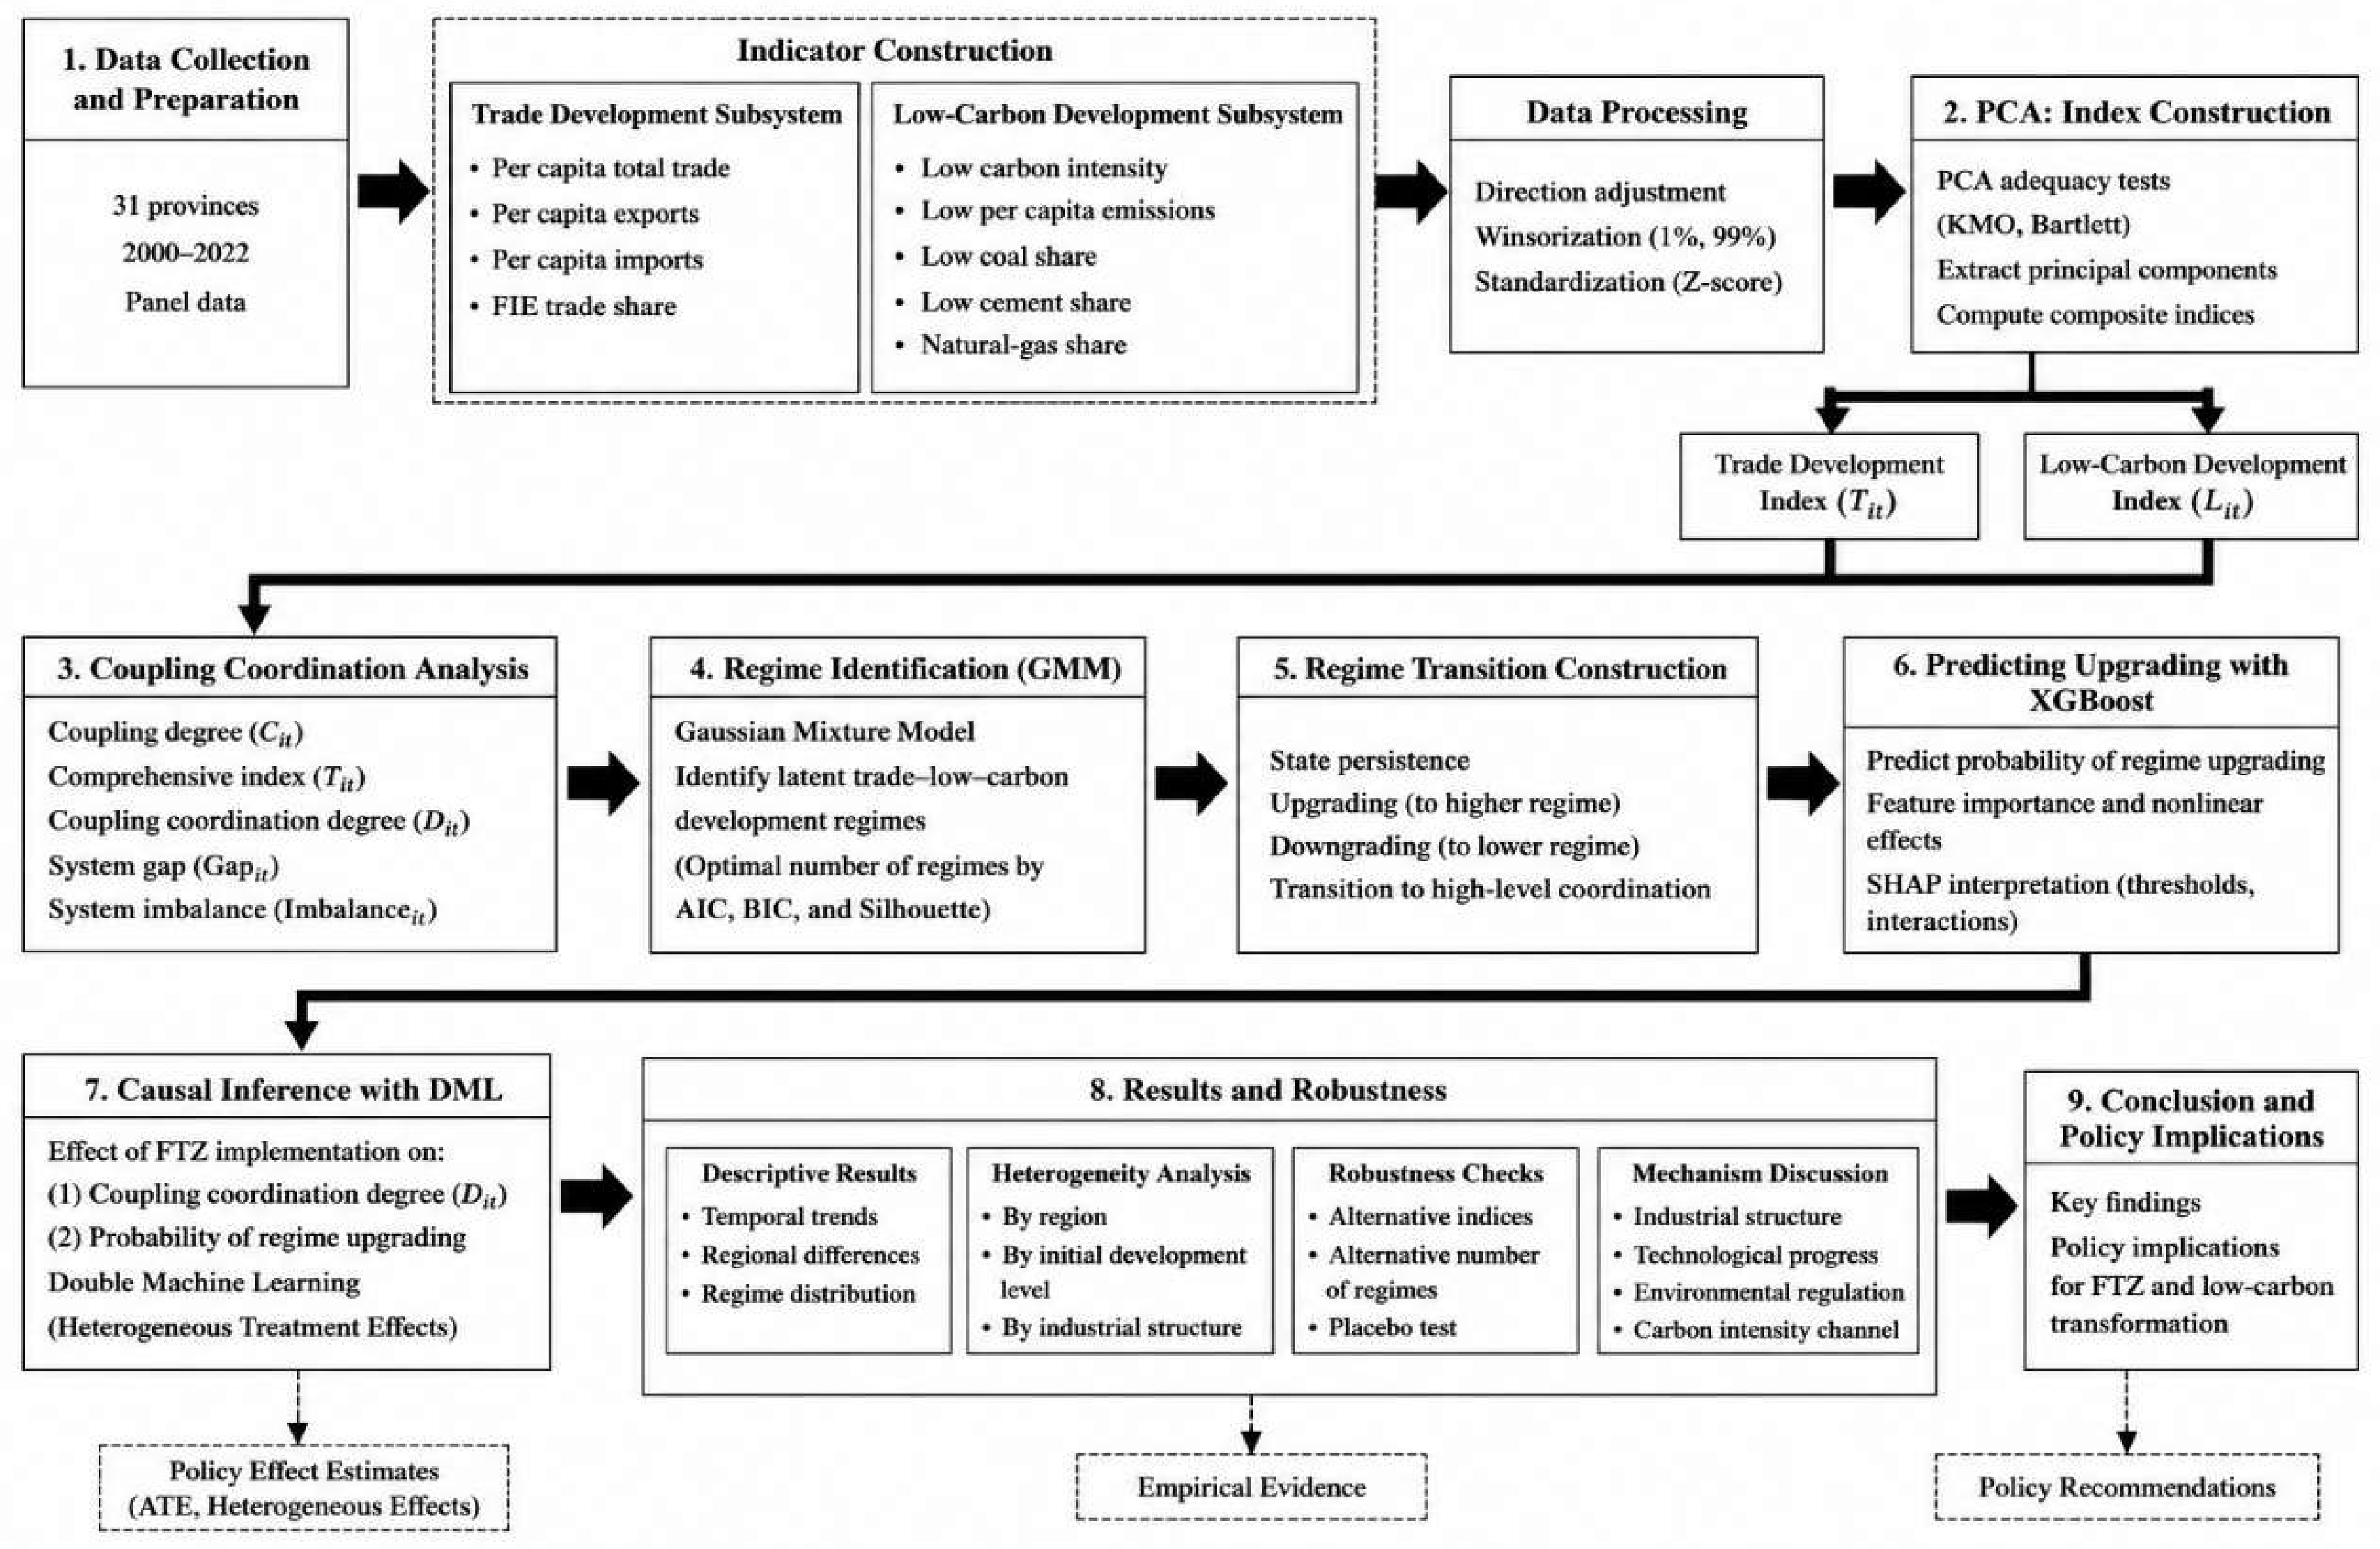
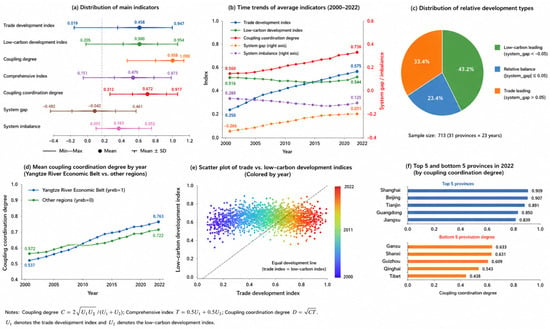
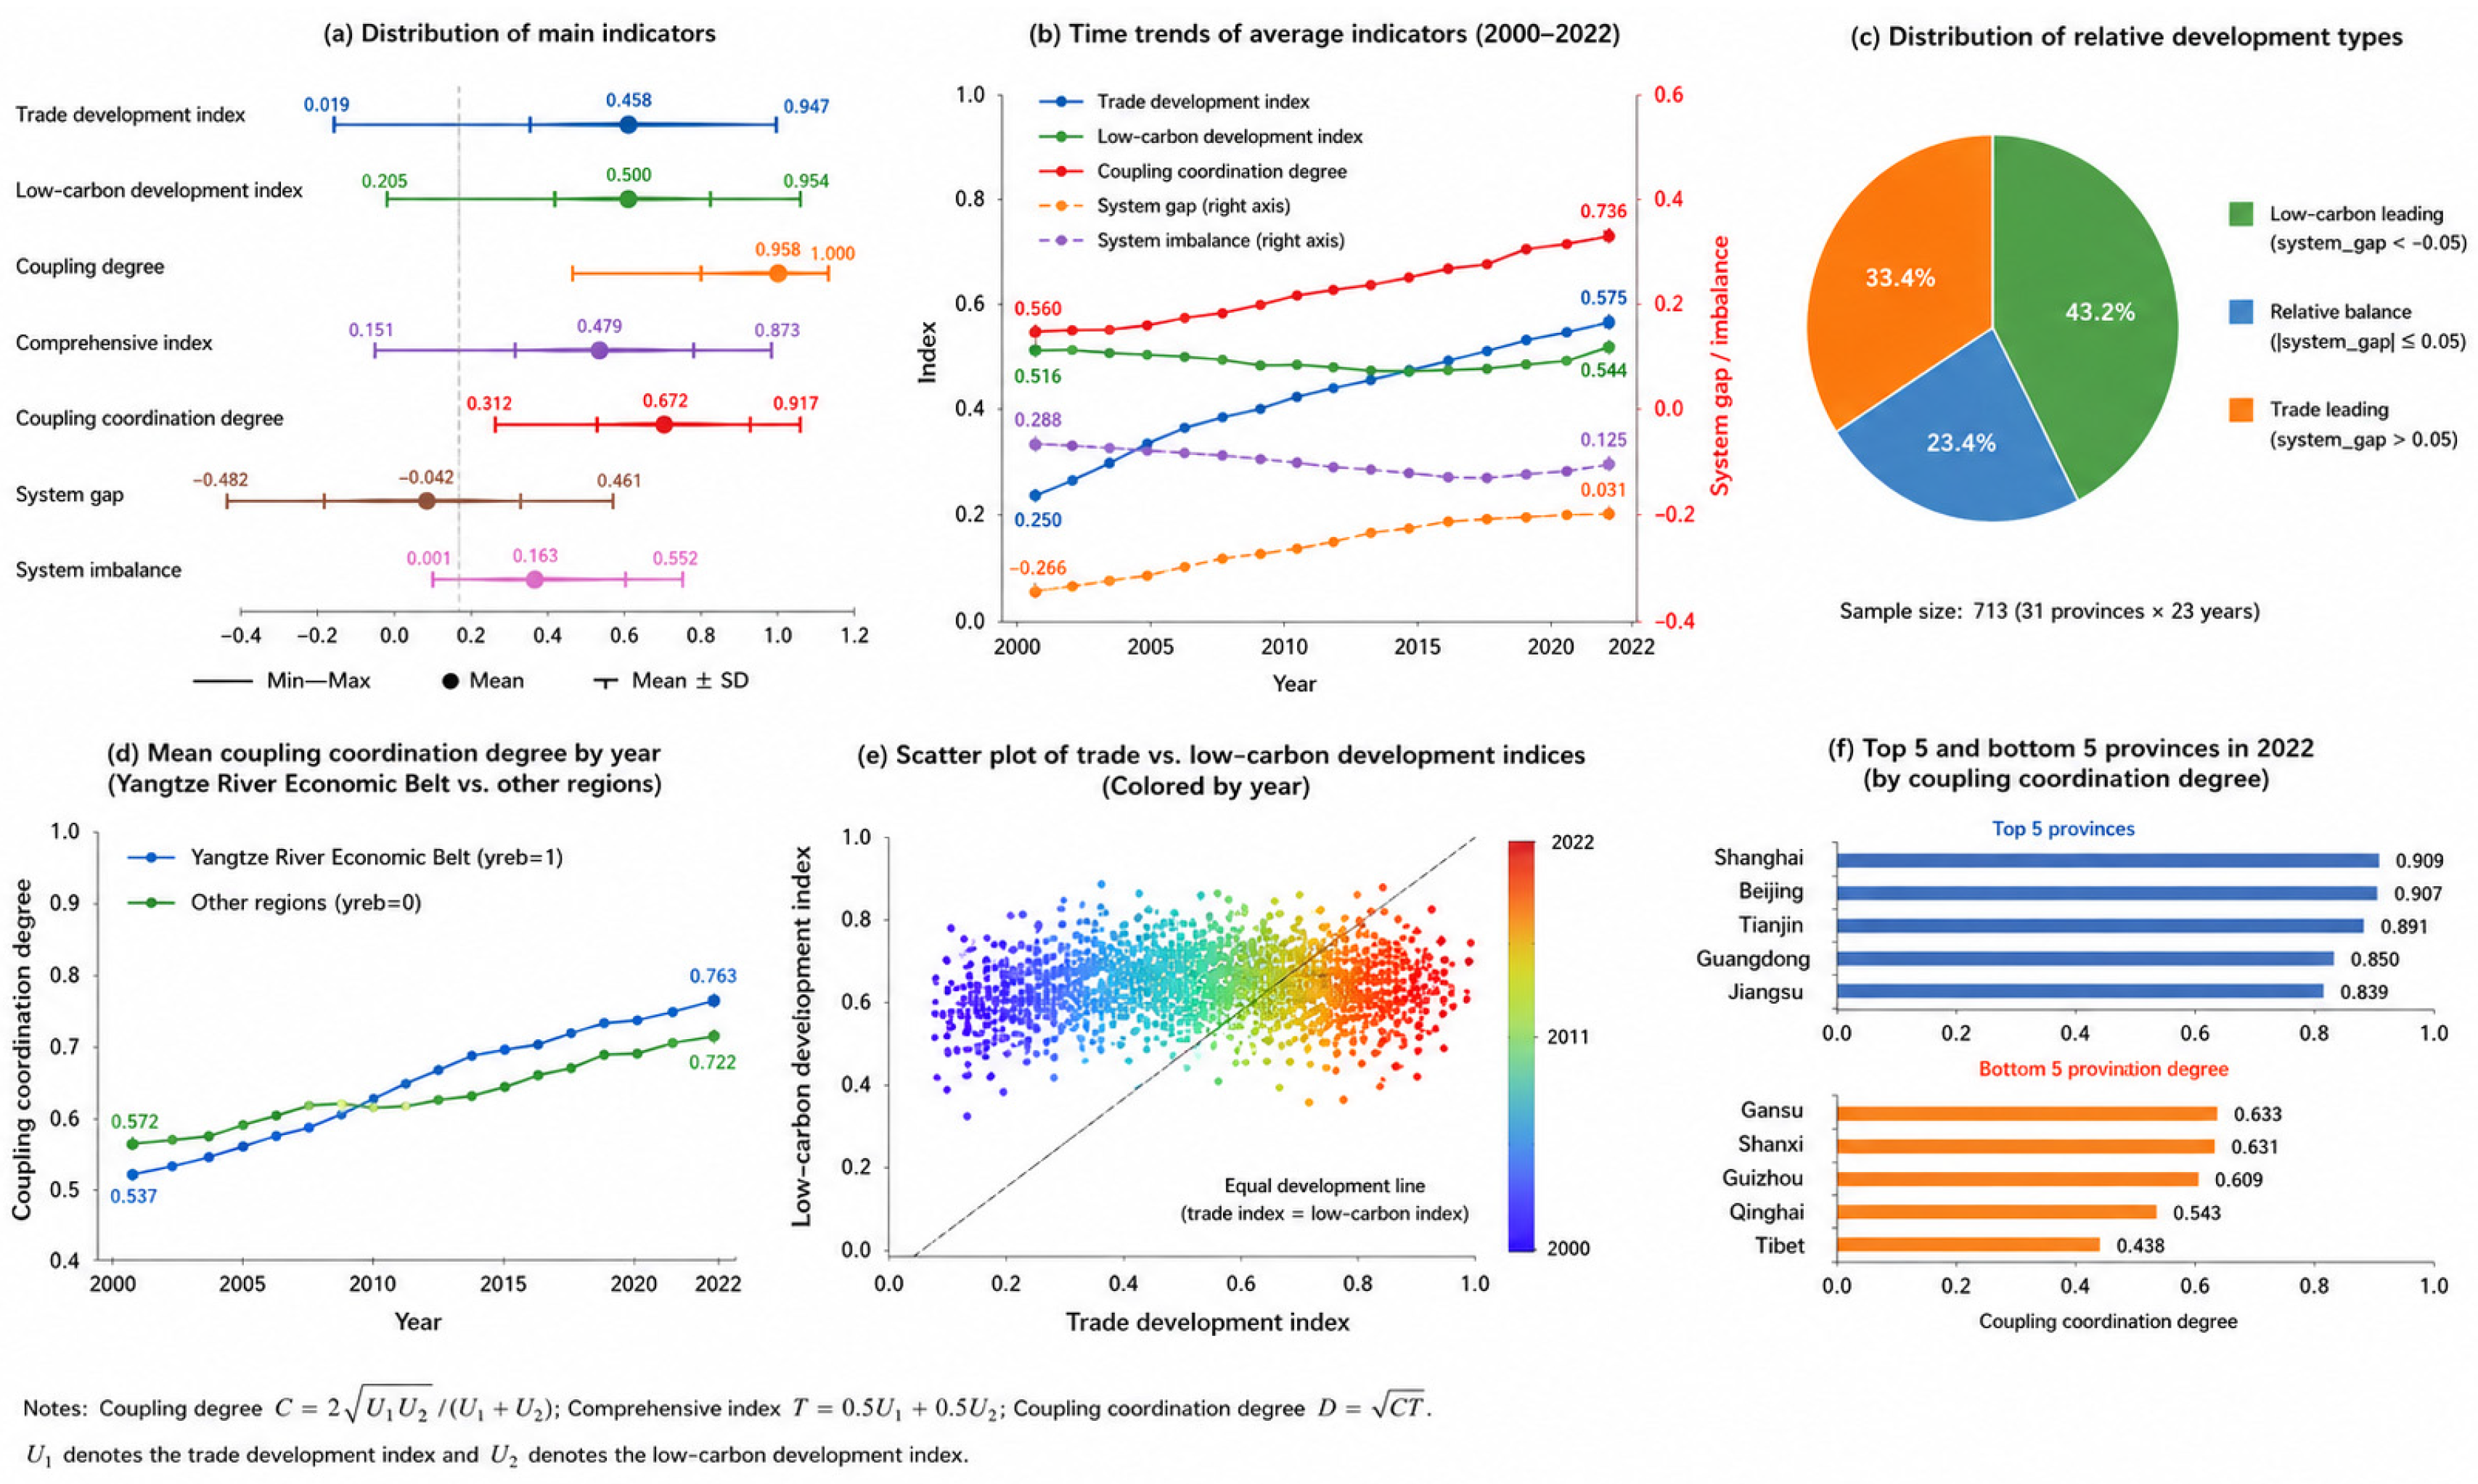
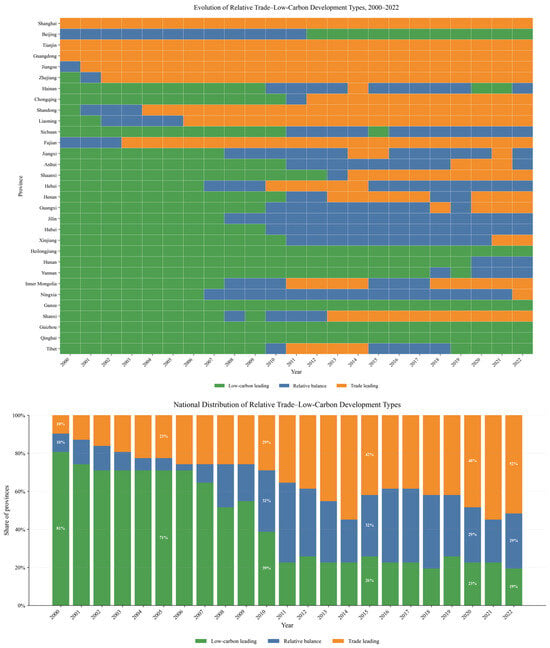
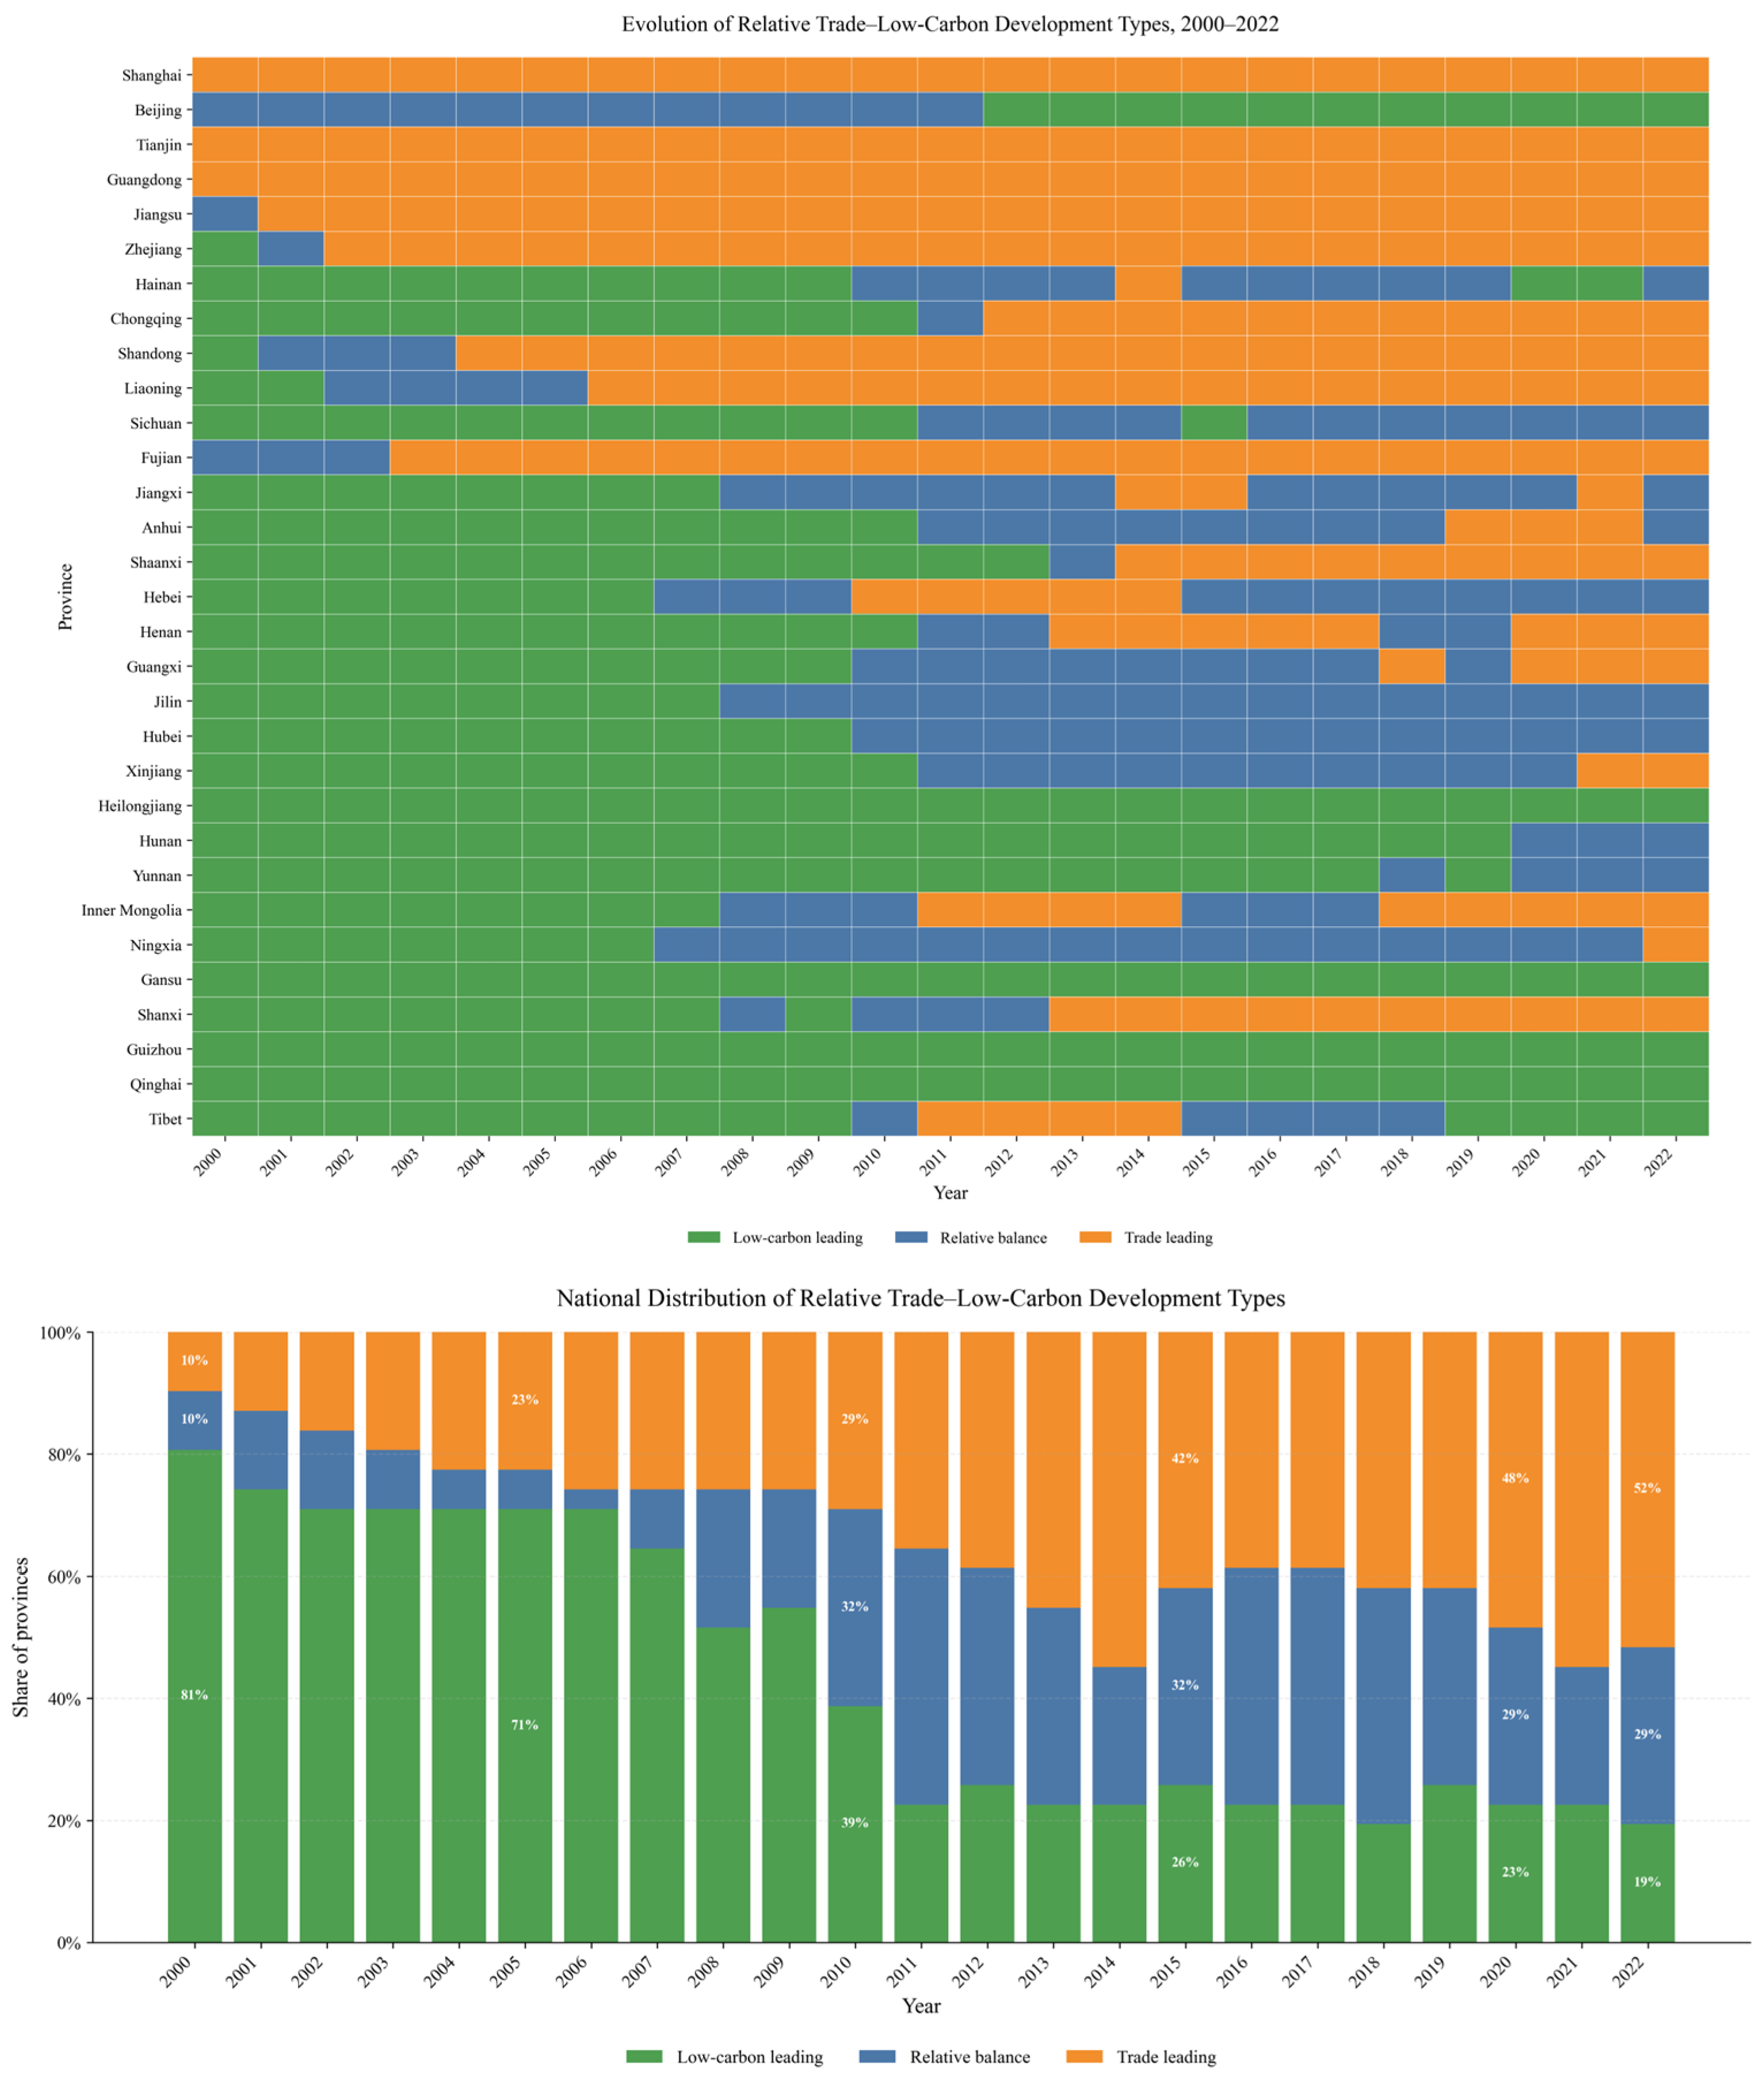
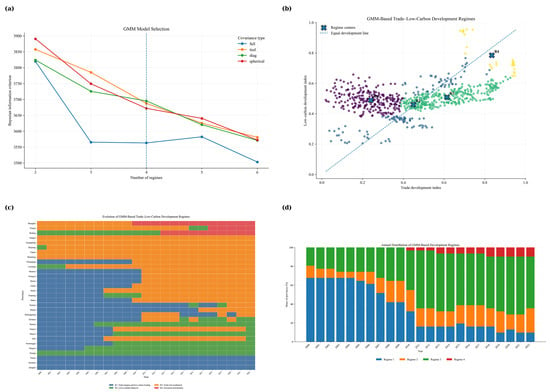
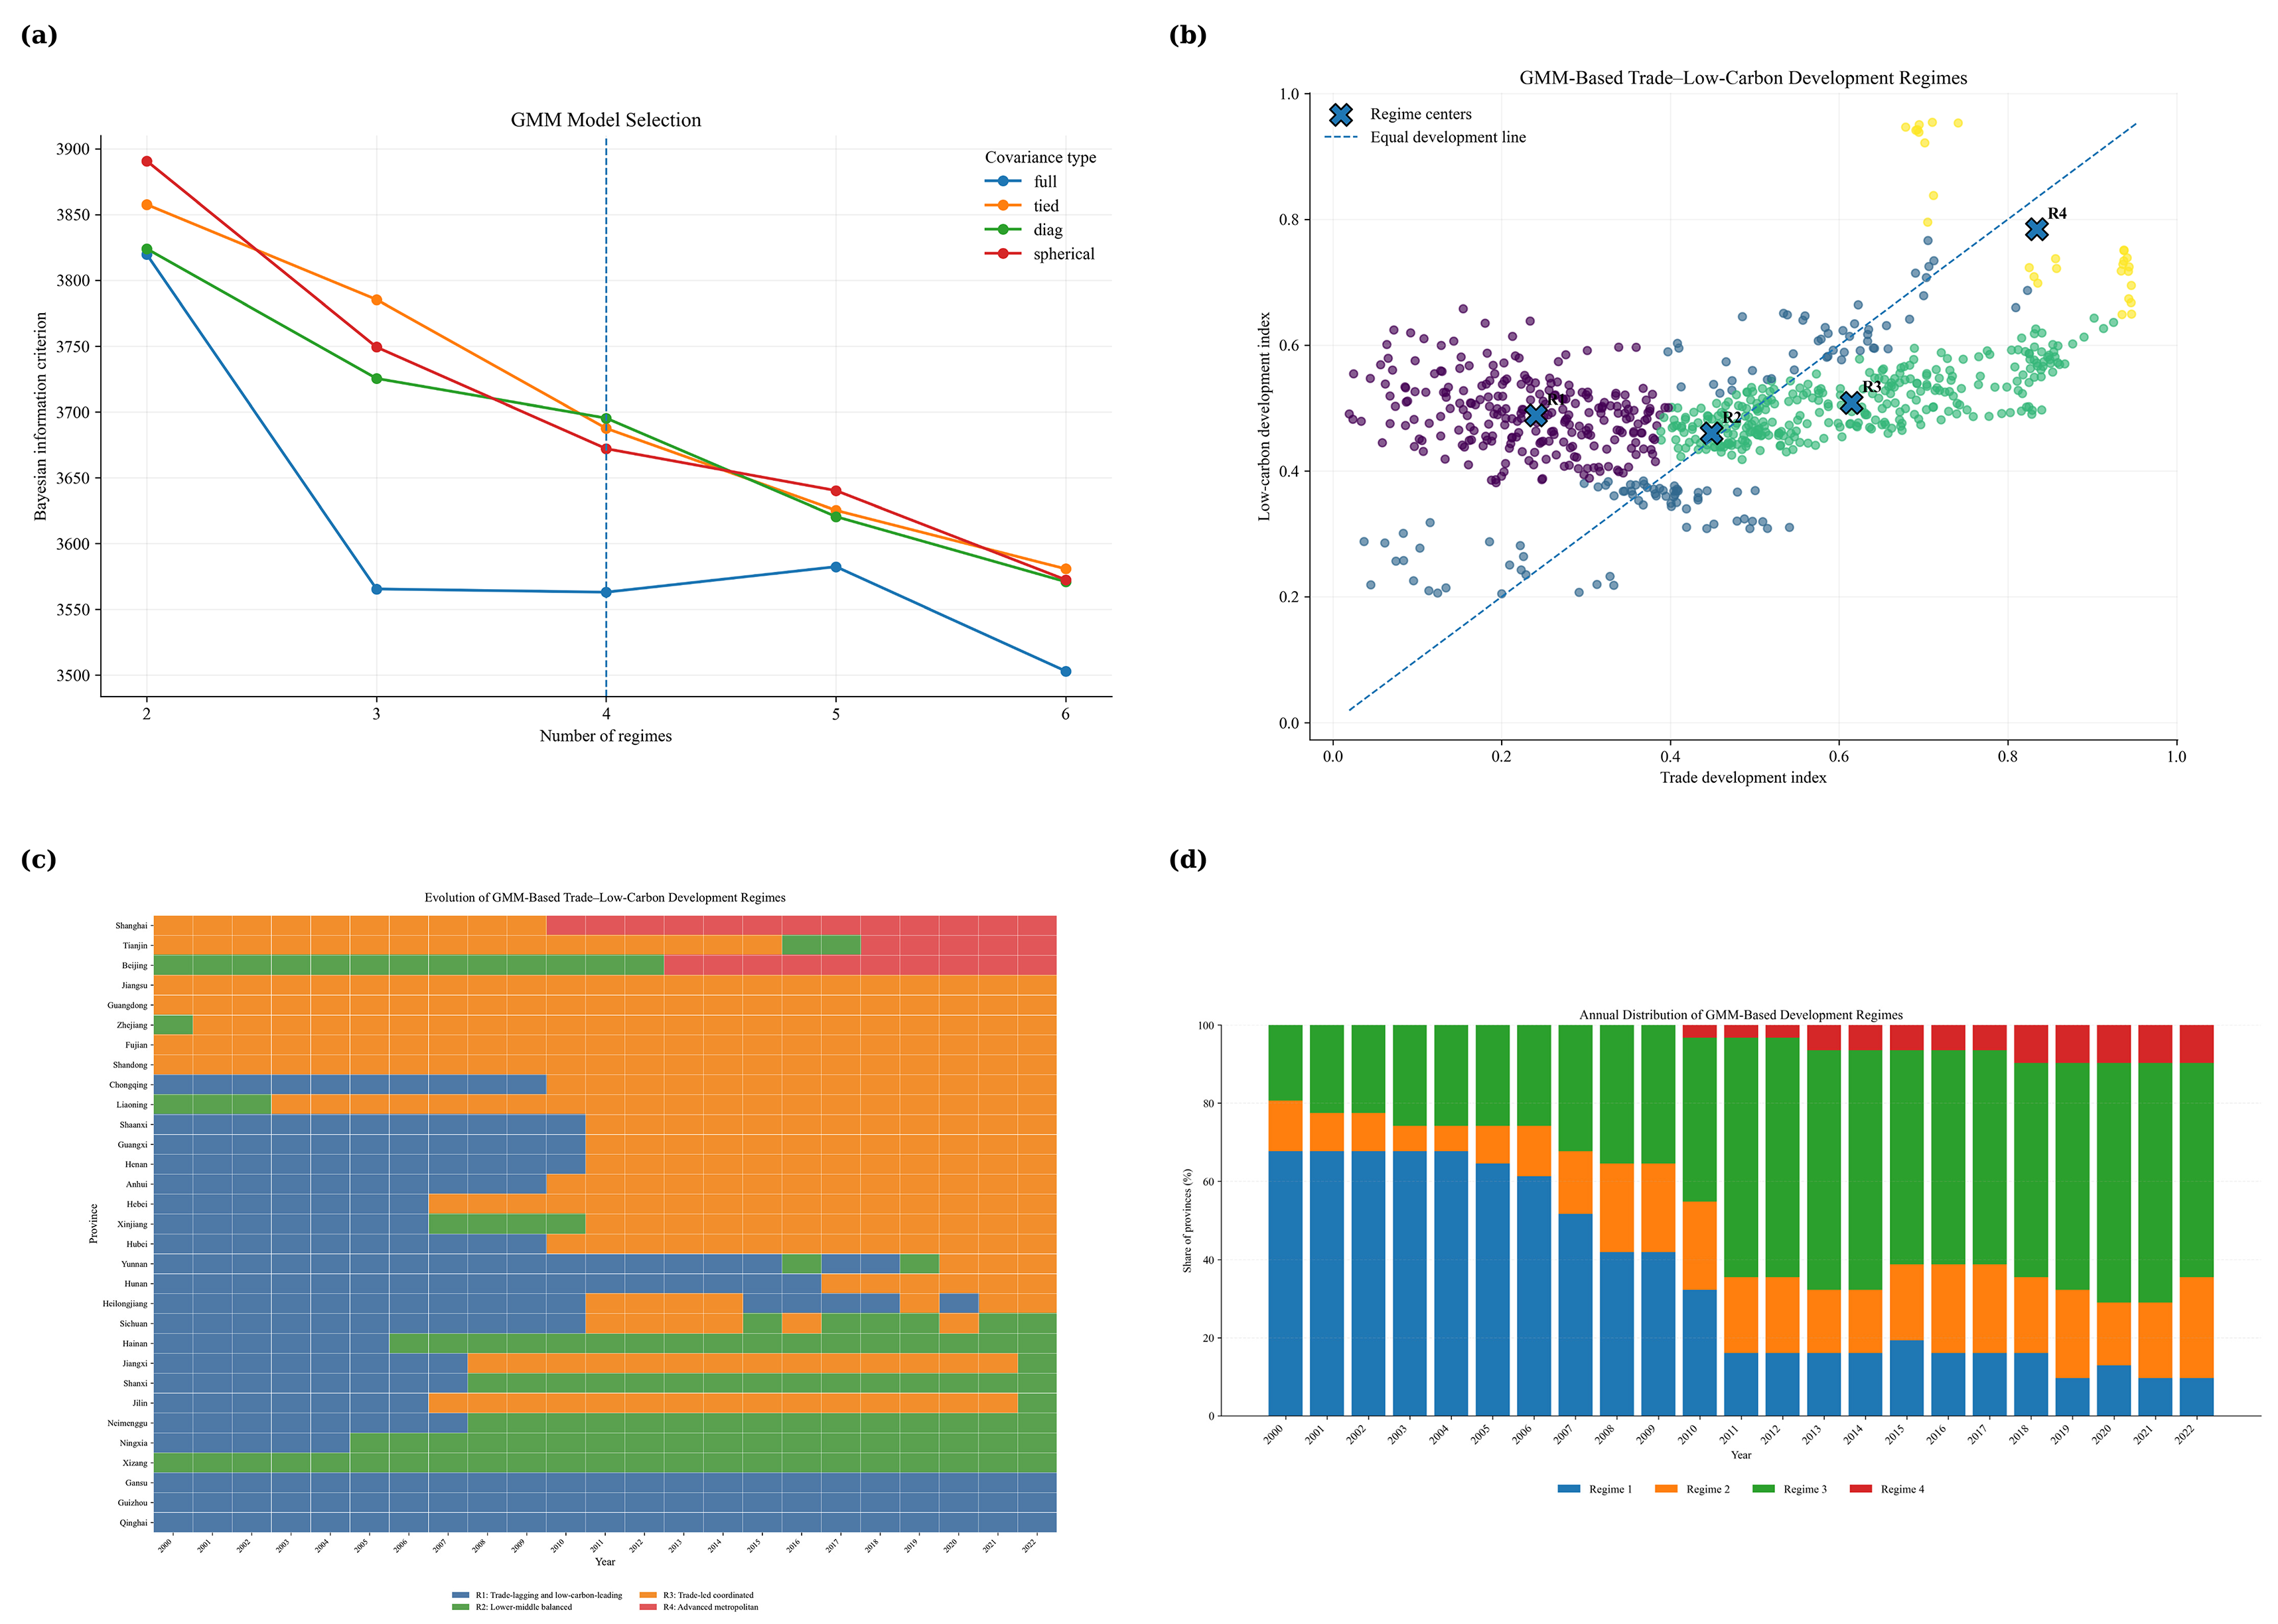
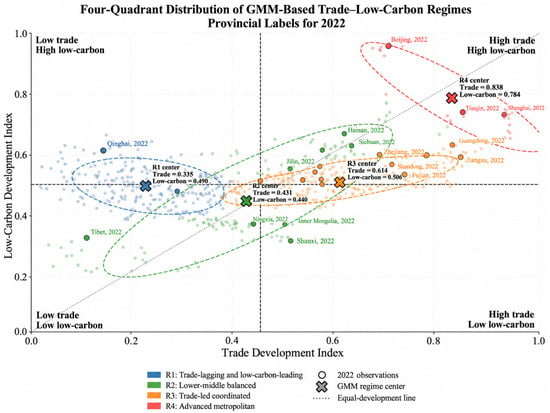
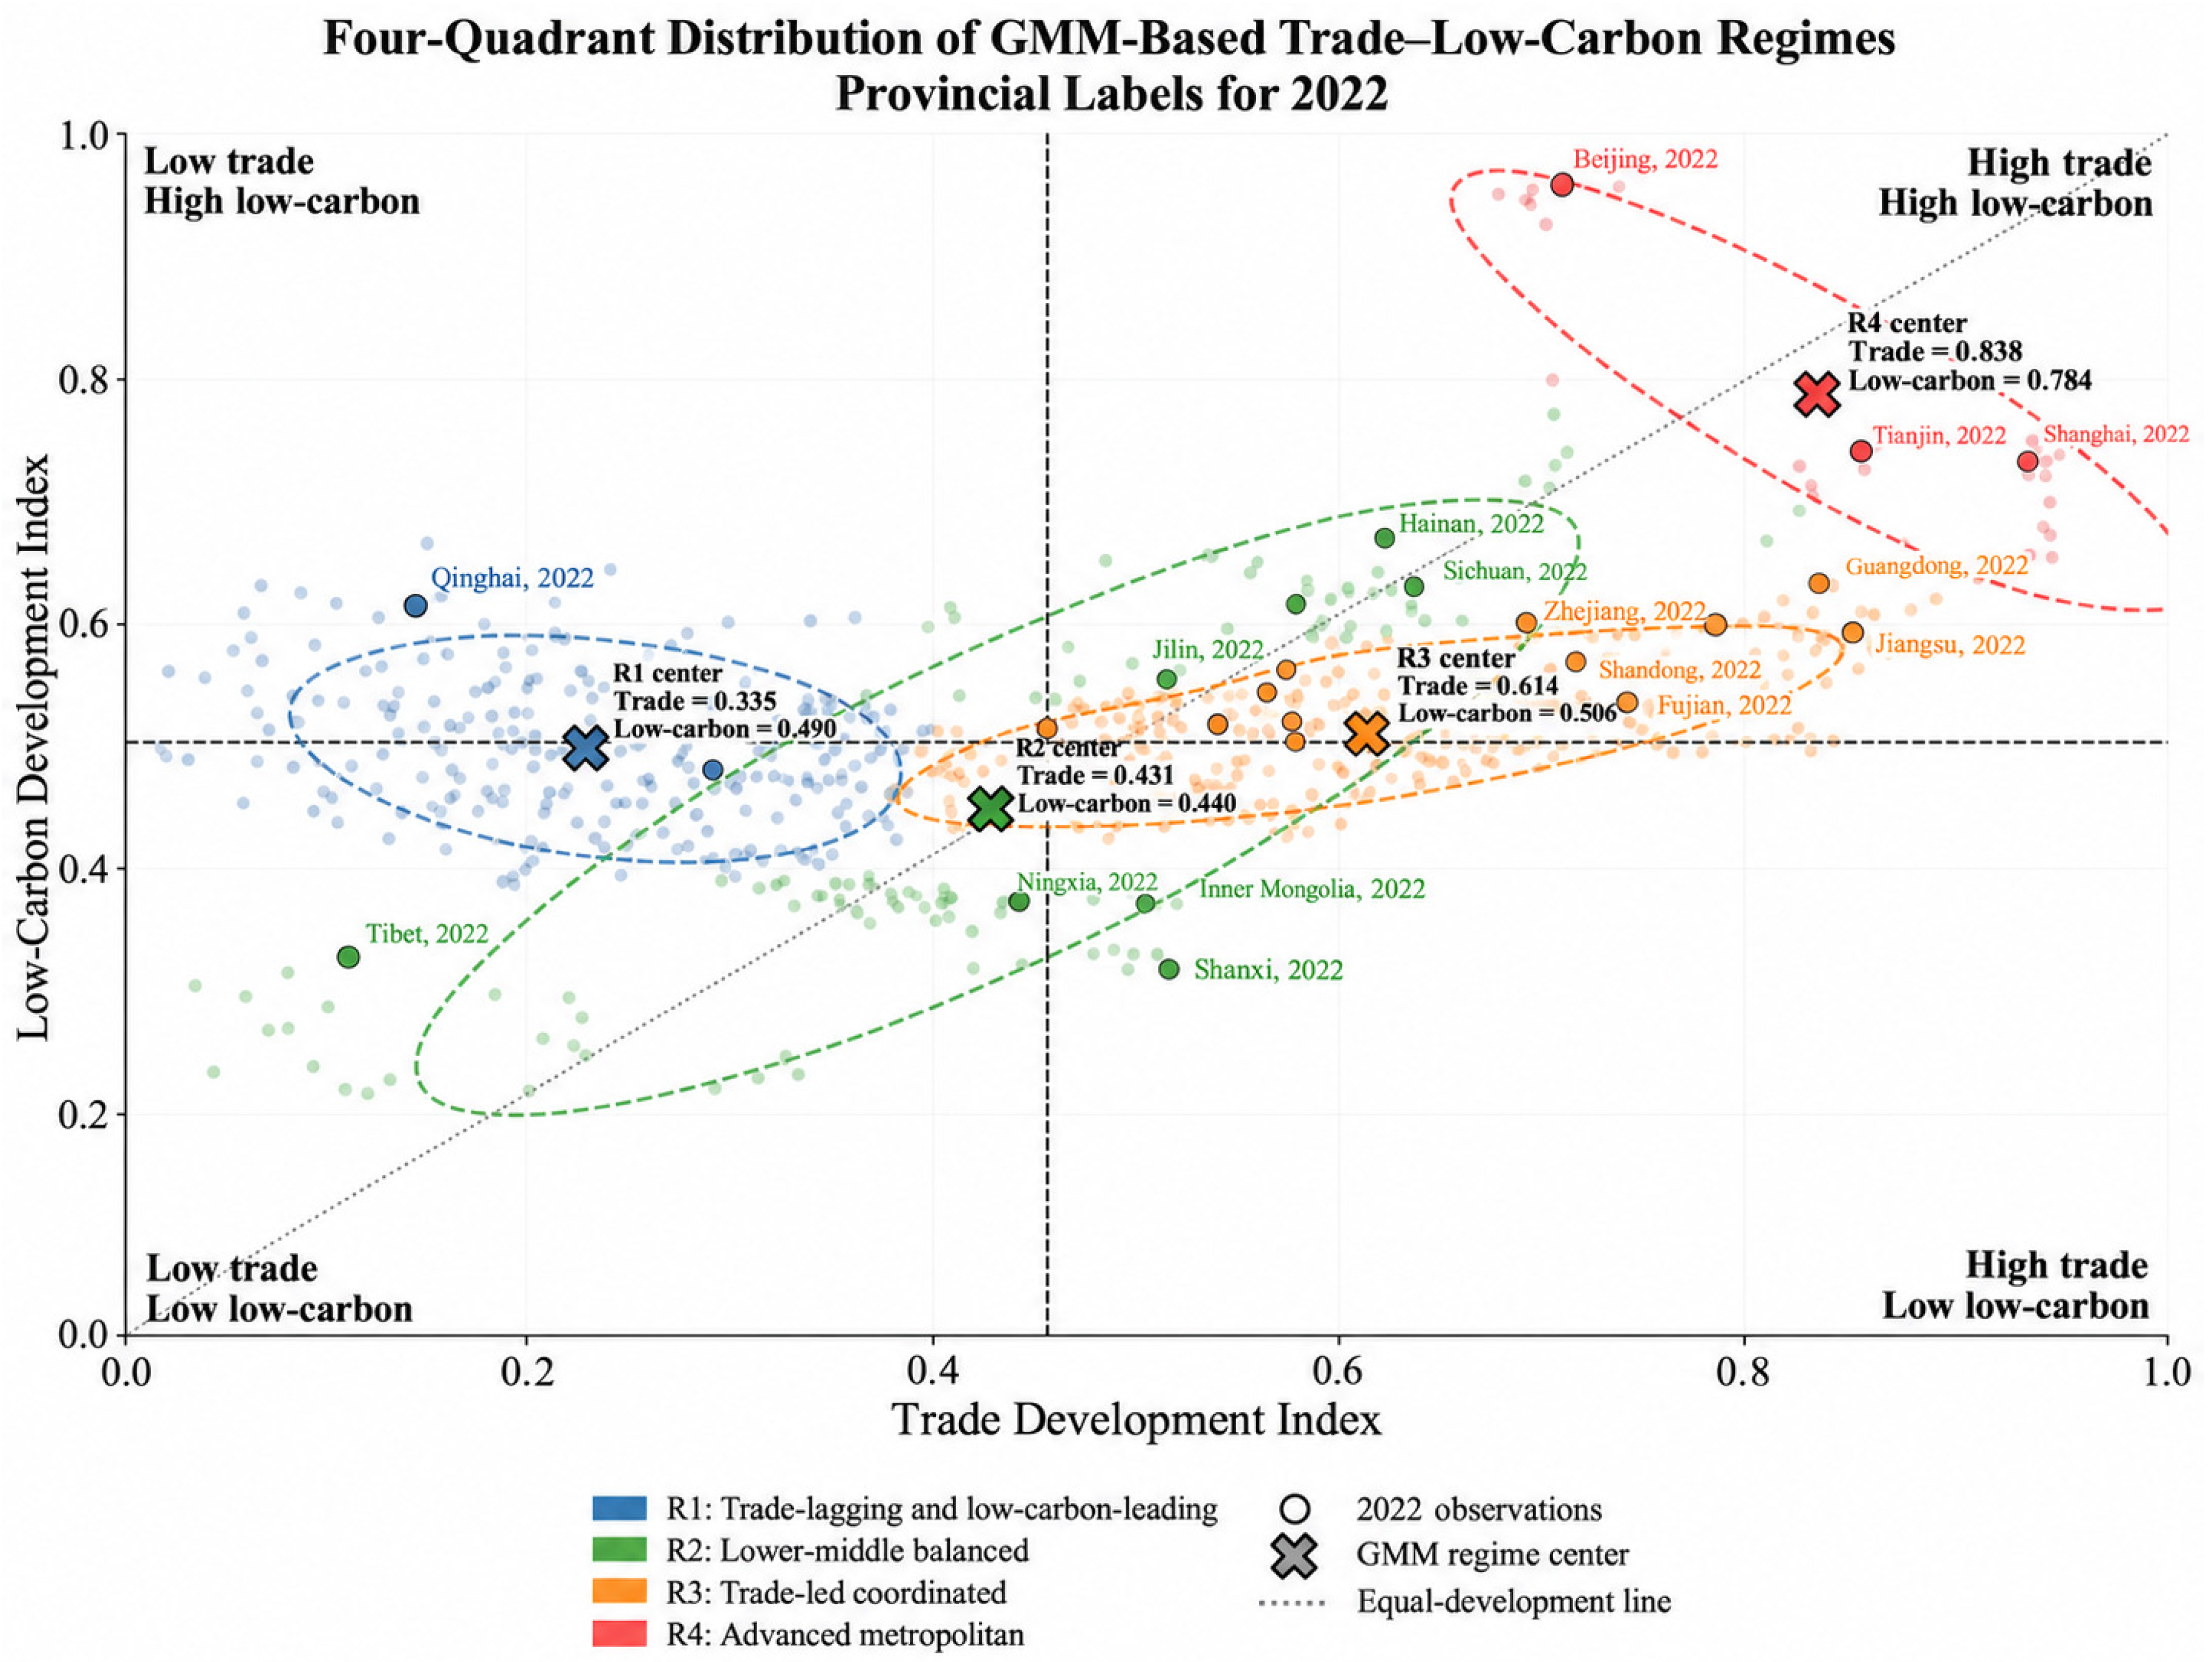
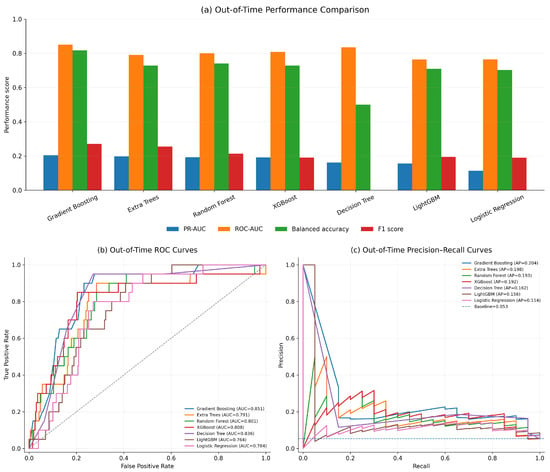
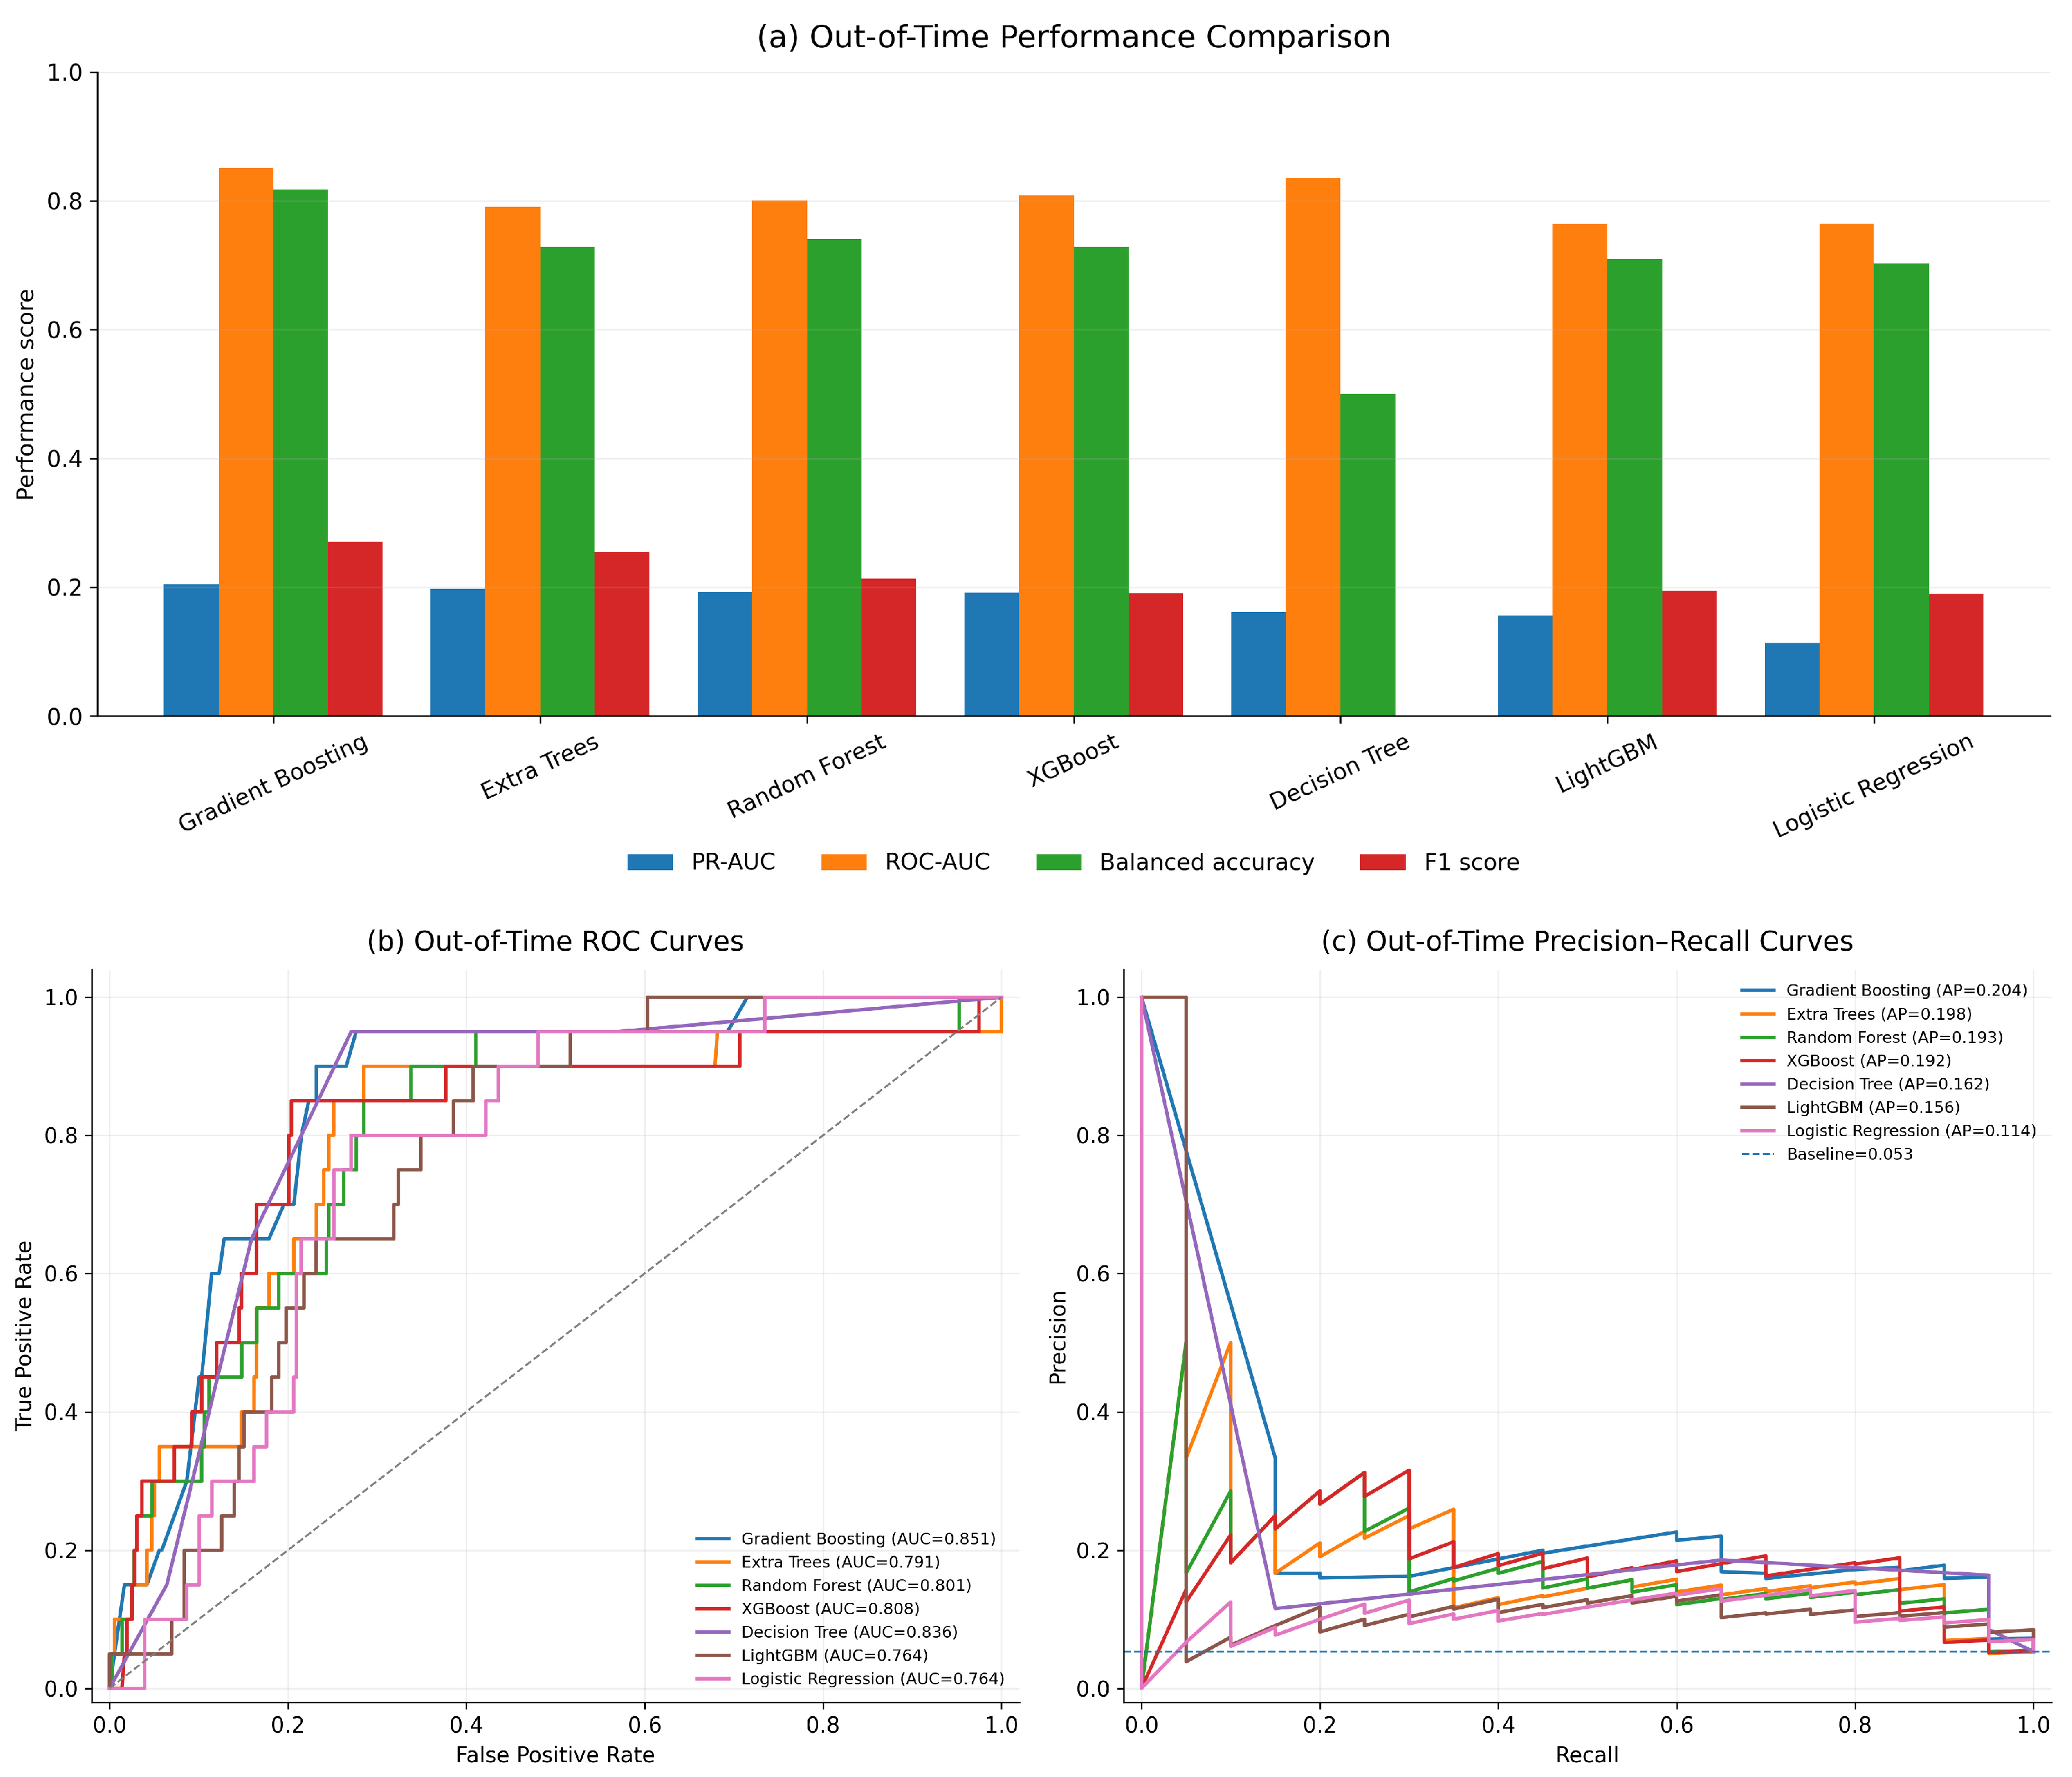
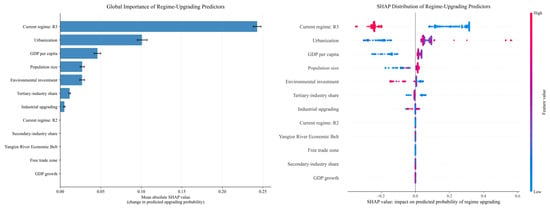
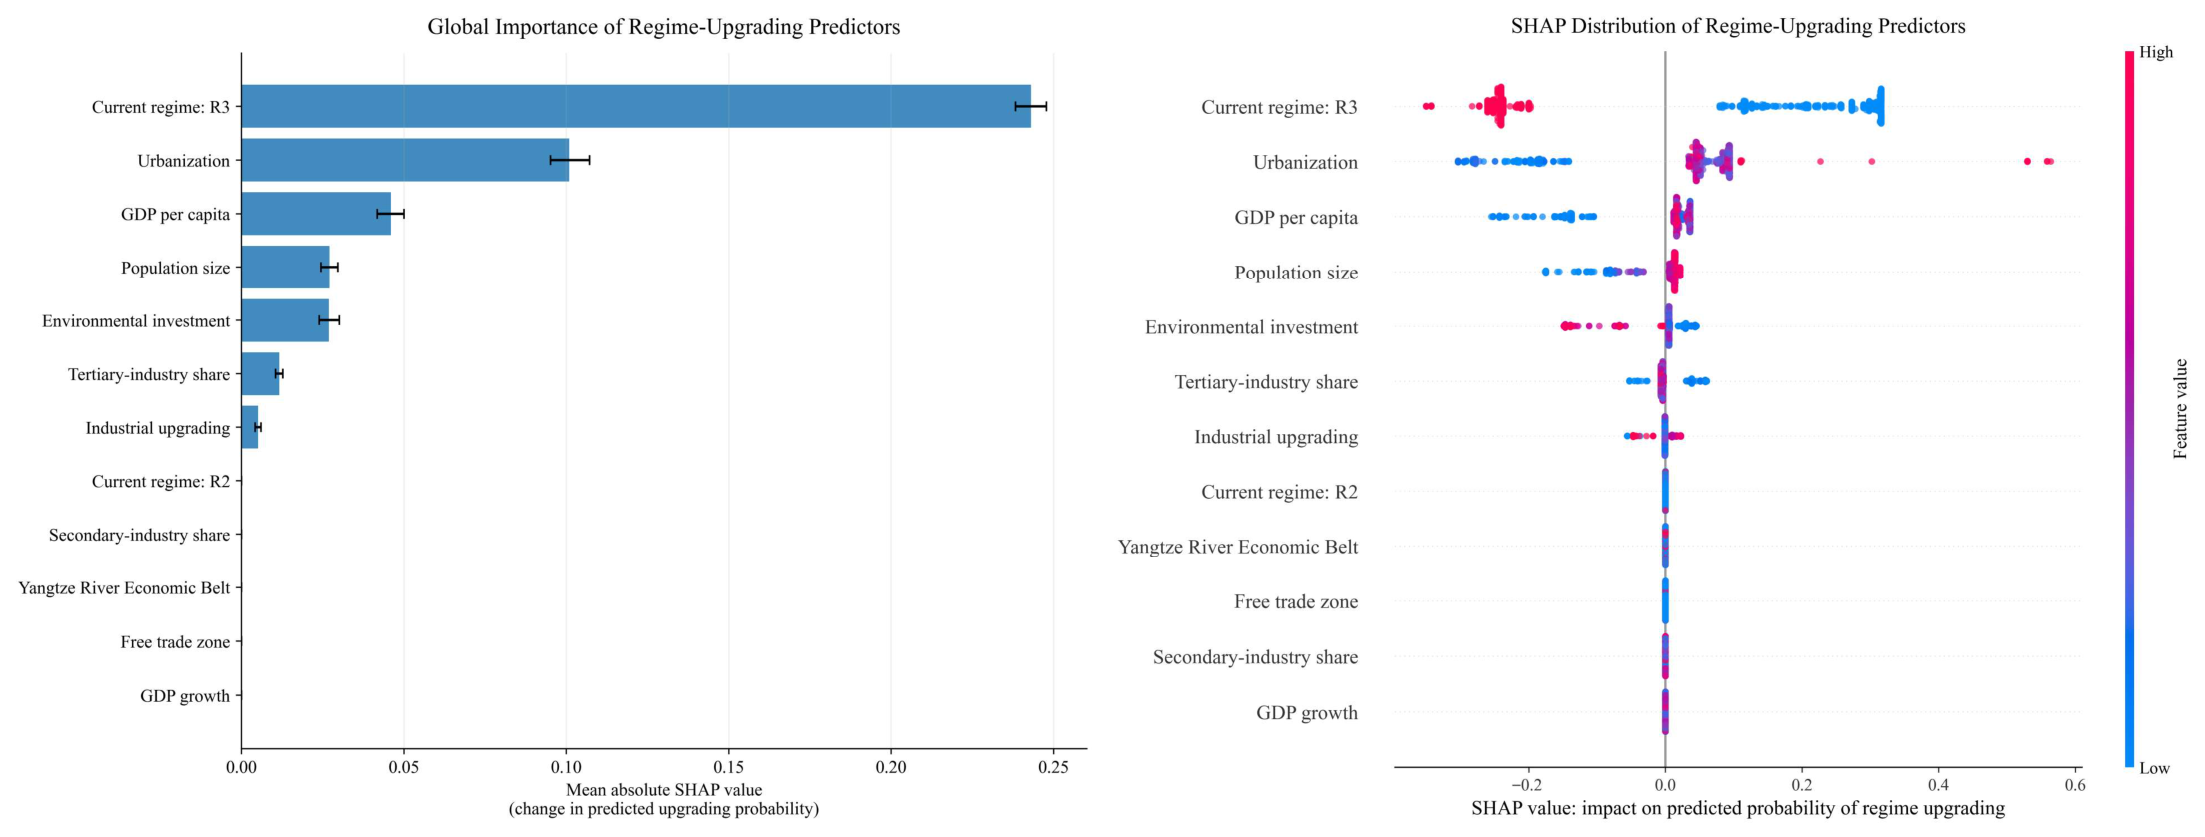
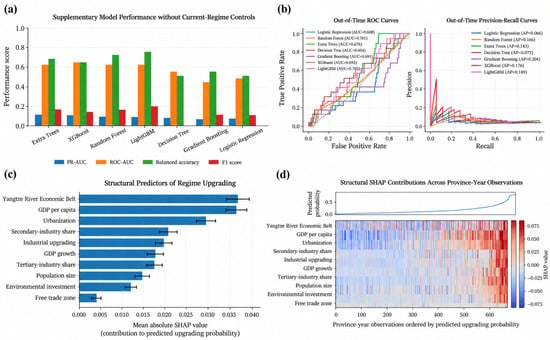
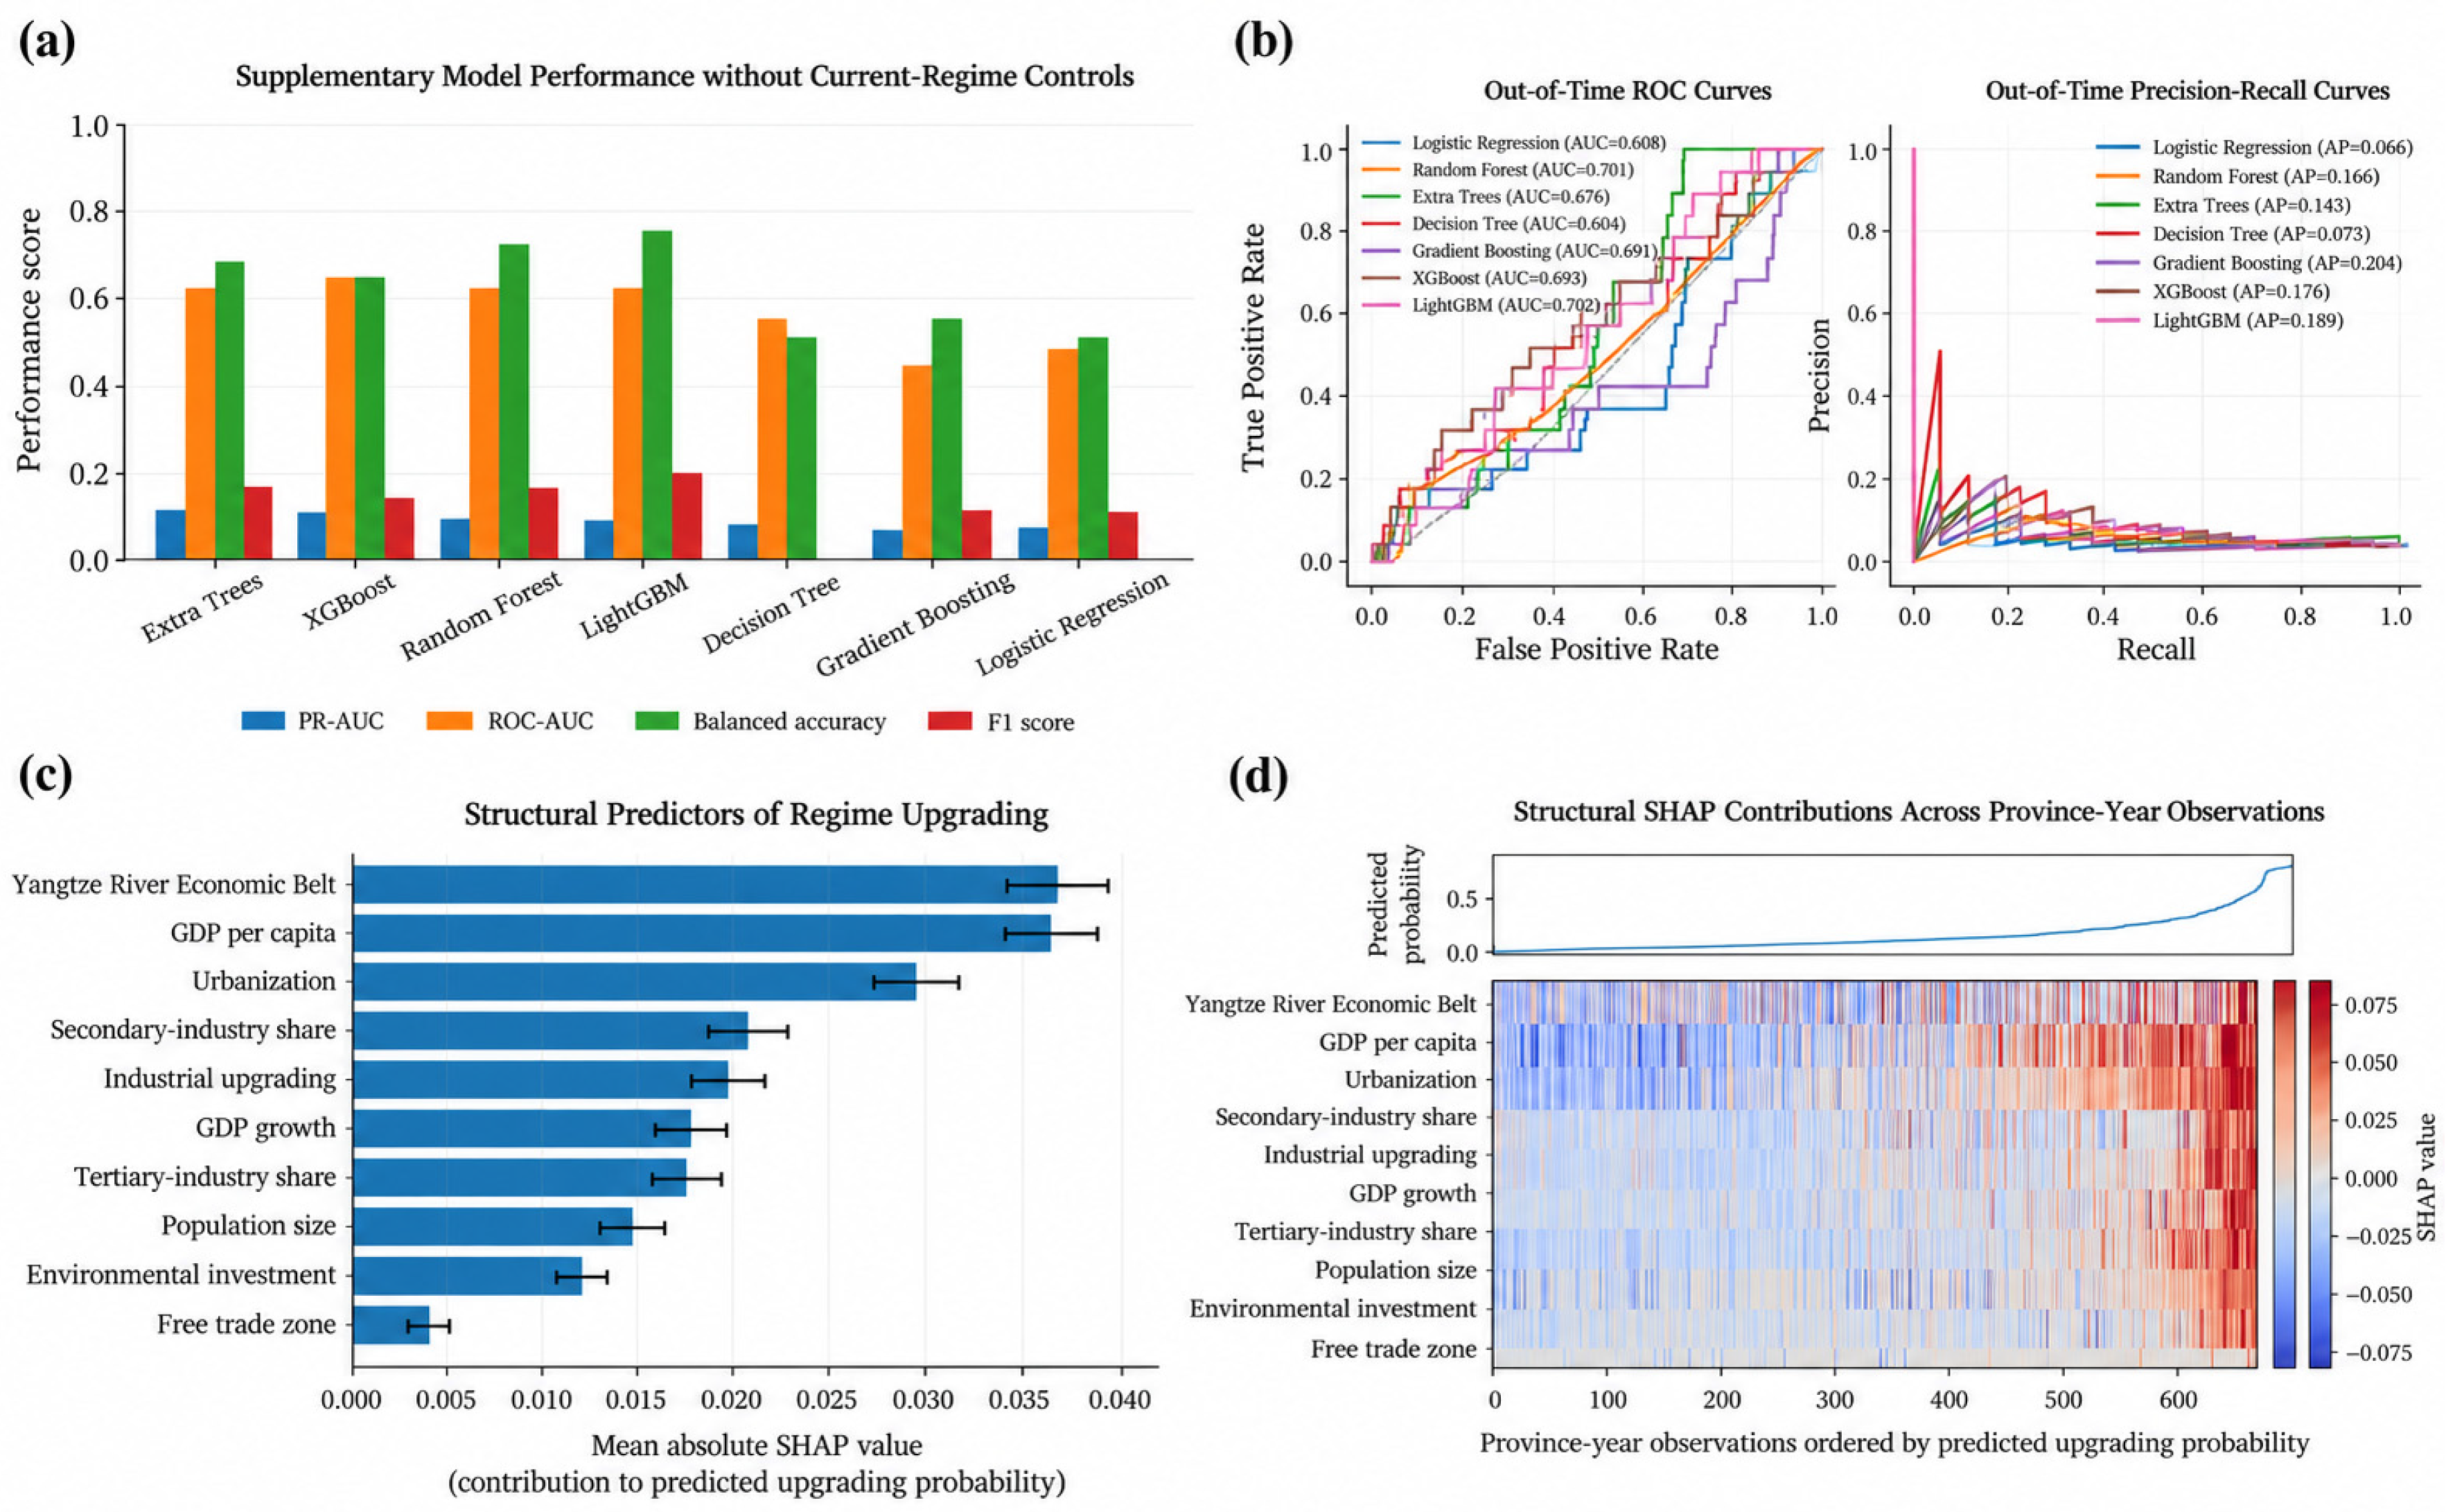
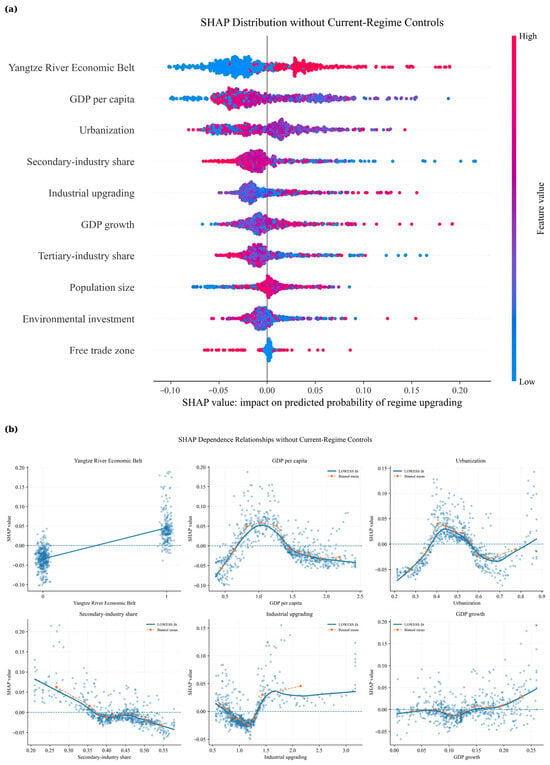
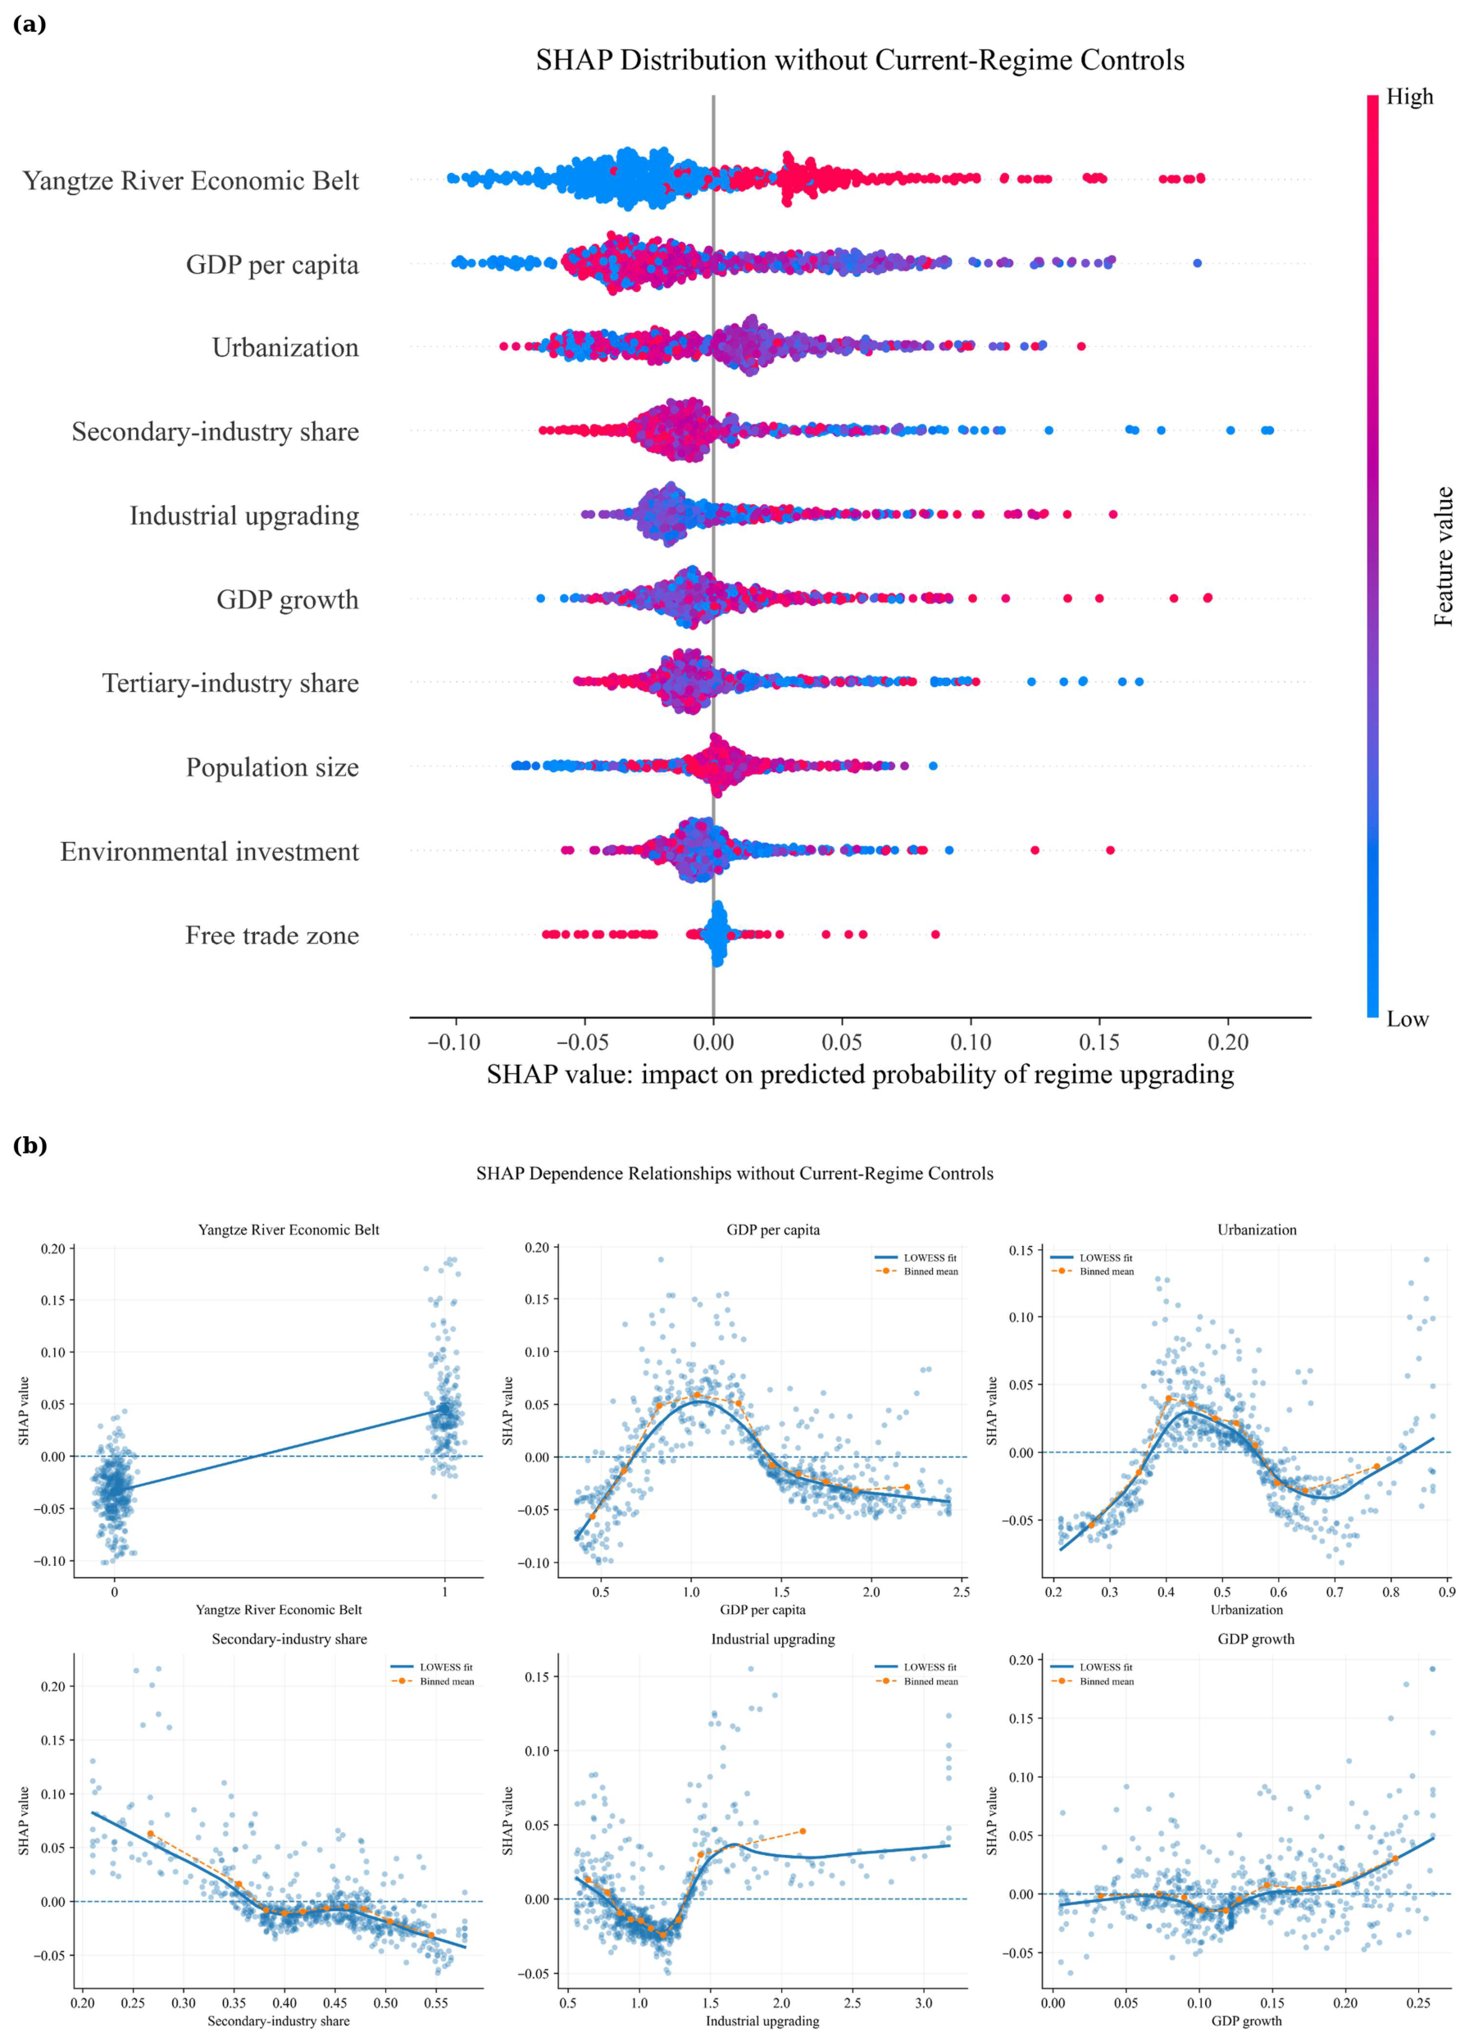
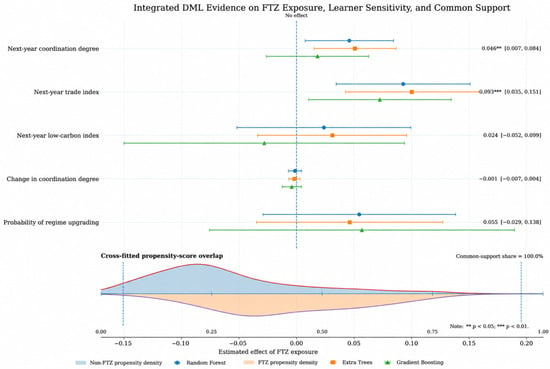
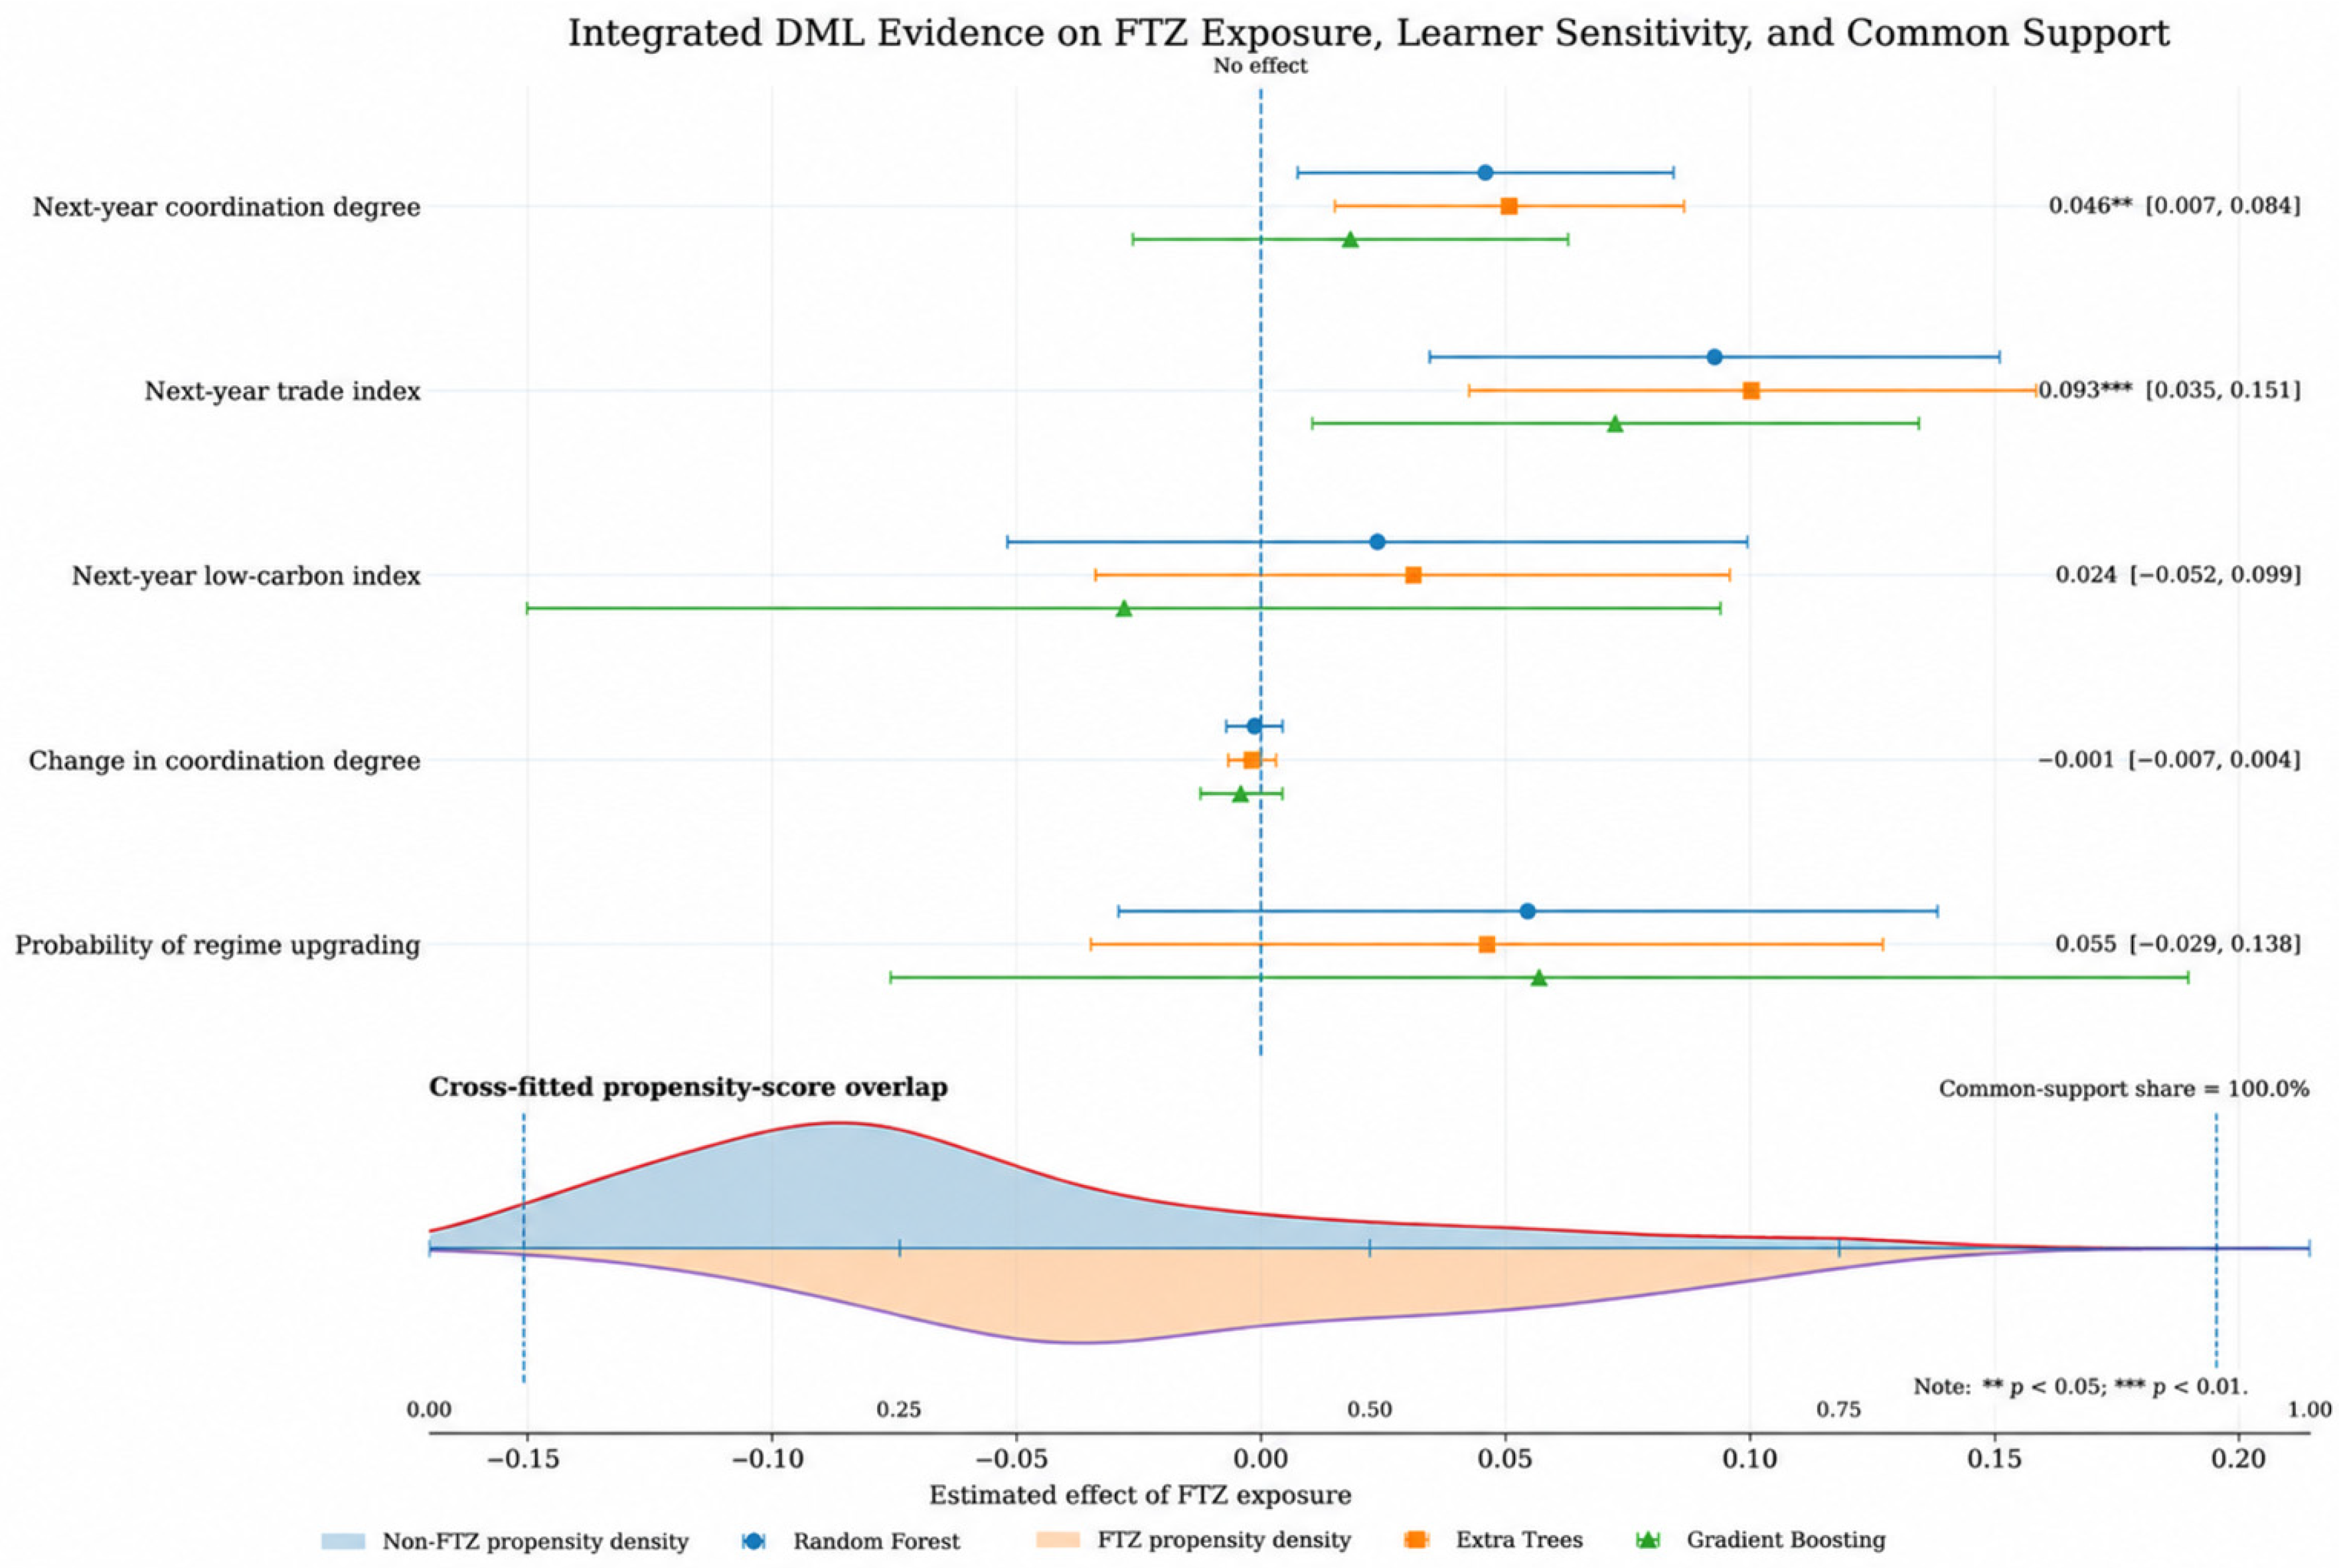
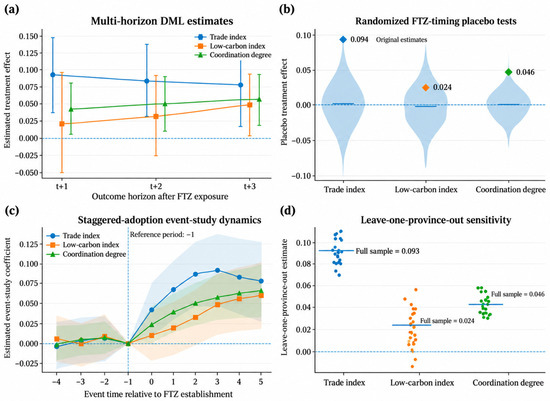
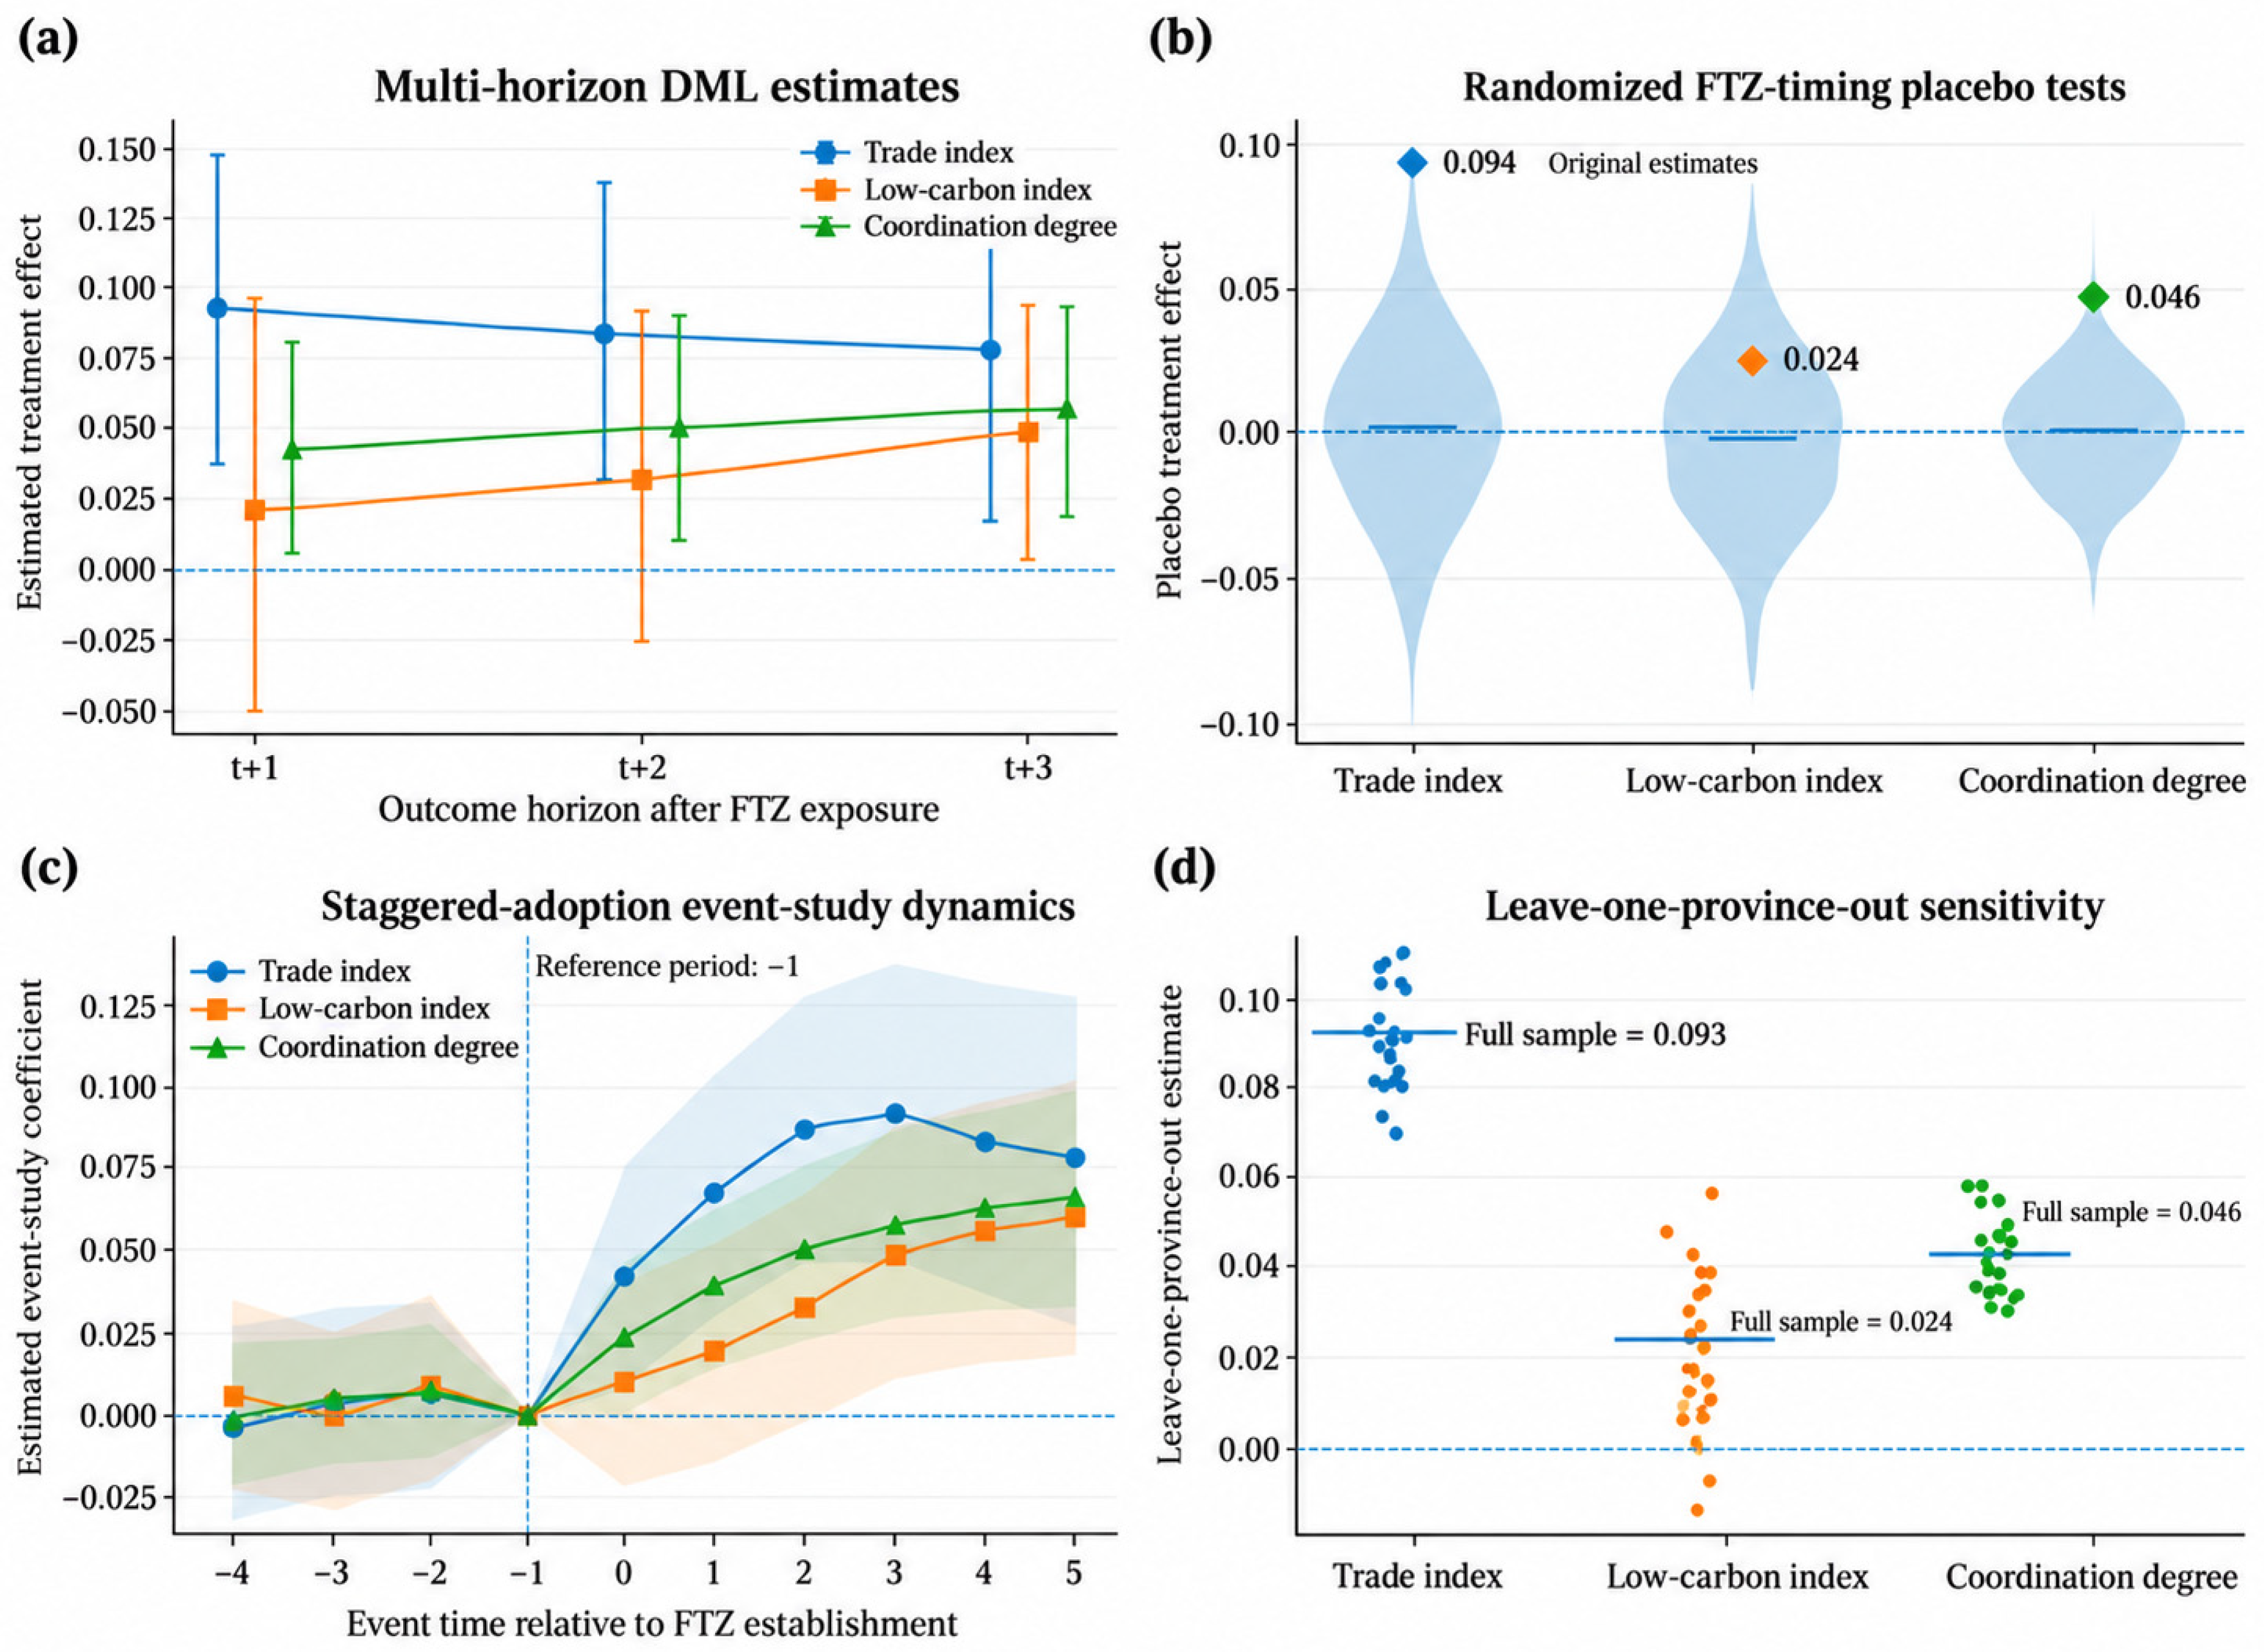

Disclaimer/Publisher’s Note: The statements, opinions and data contained in all publications are solely those of the individual author(s) and contributor(s) and not of MDPI and/or the editor(s). MDPI and/or the editor(s) disclaim responsibility for any injury to people or property resulting from any ideas, methods, instructions or products referred to in the content. |
© 2026 by the authors. Licensee MDPI, Basel, Switzerland. This article is an open access article distributed under the terms and conditions of the Creative Commons Attribution (CC BY) license.