


Abstract
Extreme heat increasingly threatens public health and urban sustainability, creating a need for fine-scale assessments that connect spatial risk patterns with climate-resilient planning. This study assessed heat risk across 1639 blocks in Tianjin’s six central districts, China. A block-scale heat-risk index (HRI) was constructed within the Hazard–Exposure–Vulnerability–Adaptability (HEVA) framework by integrating remote-sensing, population, built-environment, socioeconomic, and public-service data using a modified CRITIC weighting method. Differences in HRI among Local Climate Zones (LCZs) were examined, and three machine-learning models were compared. Among the three evaluated models, Random Forest showed the best overall test-set performance, and supplementary five-fold spatial block validation retained the same model ranking and major feature-importance ordering despite lower absolute predictive performance. Feature importance, partial dependence plots, and SHapley Additive exPlanations were subsequently used to interpret feature contributions and nonlinear associations. HRI was lower in the resource-rich urban core and higher in peripheral transitional zones, accompanied by clear spatial differences in adaptive-resource provision. The urban core generally exhibited higher adaptive-resource provision, whereas peripheral areas showed more limited provision. Under the adopted HRI formulation, higher values of this component contributed mathematically to lower composite HRI, rather than demonstrating a realised risk-reduction effect. Built LCZs generally exhibited higher HRI than land-cover LCZs; LCZ 5 (open mid-rise) had the highest median HRI, whereas LCZ G (water) had the lowest. Higher sky view factor and vegetation cover were generally associated with lower HRI, while larger blocks, taller buildings, and greater distances from water bodies were associated with higher HRI. These findings support differentiated block-scale interventions, heat-response resource allocation, and climate-resilient urban regeneration.
1. Introduction
Global warming continues to increase the frequency and intensity of extreme heat events, making heat risk a major climate-related threat to public health and sustainable urban development [1]. The Lancet Countdown reported that, in 2023, the duration of global population exposure to extreme heat was approximately 27.7% higher than the 1990–1999 average [2]. Meanwhile, the World Meteorological Organization reported that 2015–2025 was the warmest 11-year period on record and that the global mean temperature in 2025 was approximately 1.43 °C above pre-industrial levels, underscoring the continued intensification of heat risk [3]. The growing heat-related burden has substantial public health implications. Of the approximately 489,000 heat-related deaths worldwide each year, around 45% occur in Asia, highlighting the region’s particularly high level of heat risk [4]. Heat risk is also increasing in China, with the number of heat-related deaths in 2024 reaching approximately 1.7 times the 1986–2005 average [5]. Moreover, translating fine-scale heat-risk assessment into spatially differentiated adaptation and planning strategies remains challenging. A stronger linkage is therefore needed between risk composition, urban morphological characteristics, adaptability resources, and intervention priorities to support climate-resilient and sustainable urban development.
Urban heat risk is shaped not only by regional climatic conditions but also by urban morphological characteristics [6]. A systematic review of the relationship between urban morphology and the thermal environment found that characteristics such as building density, building height, sky view factor, and spatial configuration were consistently associated with variations in land surface temperature. Different combinations of these characteristics produce distinct thermal responses by altering urban energy exchange and heat-storage processes [7,8]. Based on meteorological observations from multiple cities, another study proposed the Local Climate Zone (LCZ) framework and identified consistent temperature differences among LCZ types, with different building structures and land-cover characteristics corresponding to distinct thermal patterns [9]. Differences in urban morphology and LCZ type therefore provide an important basis for explaining the spatial heterogeneity of urban heat risk.
A central issue in urban heat-risk management is determining the comprehensive risk levels of different urban spatial units and identifying the urban characteristics associated with these spatial differences. In response, research has gradually moved beyond simple descriptions of the thermal environment towards multidimensional risk assessment and analyses of associated environmental and urban characteristics, thereby improving understanding of the spatial patterns and potential processes underlying urban heat risk. However, identifying heat-risk patterns at a fine scale while retaining result interpretability and characterising the factors associated with spatial heterogeneity remains a major challenge in urban heat-risk research.
The theoretical basis of urban heat-risk assessment can be traced to Crichton’s risk triangle, which identifies hazard (H), exposure (E), and vulnerability (V) as three core dimensions of risk [10]. Building on this conceptual structure, heat-risk studies have widely adopted the Hazard–Exposure–Vulnerability (HEV) framework to characterise spatial risk patterns arising from the overlap of hazard, exposure, and vulnerability [11,12]. With the development of climate-adaptation research, some studies have further incorporated adaptability (A) into the assessment framework, forming a Hazard–Exposure–Vulnerability–Adaptability (HEVA) framework. Adaptability reflects the ability of urban systems to withstand, respond to, and mitigate the adverse effects of heat stress [13,14]. In empirical assessments, these risk dimensions can be combined using alternative mathematical formulations, including additive and multiplicative forms, which reflect different assumptions about the relationships among the components.
In empirical assessments, the analytical scale directly affects the accuracy and interpretability of heat-risk identification. A study of 13,115 urban settlements worldwide assessed spatiotemporal changes in urban extreme-heat exposure and revealed an overall increase in exposure across urban areas globally [15]. A study of 296 prefecture-level cities in China developed a heat-risk index (HRI) and identified intercity differences arising from the combined contributions of hazard, exposure, and vulnerability [16]. A 500 m grid-based assessment in the Beijing–Tianjin–Hebei region identified intra-urban high-risk clusters that are difficult to detect using administrative units [17]. Overall, studies have progressively refined the spatial scale of heat-risk assessment; however, further alignment is needed between analytical units and the actual spatial organisation of cities.
The choice of weighting method also affects heat-risk assessment results. Existing studies have mainly used equal weighting (EW), principal component analysis (PCA), the analytic hierarchy process (AHP), and the entropy weight method (EWM) to determine indicator weights [18,19]. However, EW does not account for differences among indicators; AHP relies partly on expert judgement; PCA-derived weights can be difficult to interpret substantively; and EWM mainly reflects indicator dispersion without explicitly accounting for redundancy arising from inter-indicator correlations. These methodological differences highlight the importance of considering both indicator variability and inter-indicator dependence when constructing multidimensional heat-risk indices.
As heat-risk assessment continues to develop, adequately representing variation within the urban built environment has become central to explaining the spatial heterogeneity of heat risk [20]. The Local Climate Zone (LCZ) framework represents complex urban spaces through a standardised and readily interpretable typology and helps distinguish local thermal environments among different urban forms [9,21]. Accordingly, LCZs have increasingly been incorporated into urban heat-risk assessments to identify differences among urban spatial types [22,23]. However, most existing studies focus on inter-LCZ comparisons of heat-risk levels, whereas integrated analyses that combine fine-scale heat-risk composition, LCZ-based typological comparison, and quantitative assessment of urban morphology–HRI associations remain limited.
Although LCZs provide a typological representation of urban morphology, the relationship between specific morphological characteristics and heat risk requires further examination using quantitative indicators [24]. Existing studies indicate that urban morphological indicators are associated not only with local thermal conditions but also with the spatial heterogeneity of heat risk [25]. For example, a study of high-density cities found that the associations of sky view factor, surface permeability, building surface ratio, and urban roughness with heat risk varied in direction, suggesting that both two-dimensional land cover and three-dimensional building structure are relevant to heat risk [26]. Beyond these global associations, recent studies have also begun to examine their spatial heterogeneity. At the street scale in Tianjin, geographically weighted machine learning has been used to characterise spatially varying associations between urban morphology and HRI [27]. Recent studies have further shown that urban thermal responses vary across different form-function configurations and morphological archetypes, highlighting substantial intra-urban heterogeneity in the relationship between urban form and thermal conditions [28,29]. Nevertheless, fine-scale analyses that jointly characterise nonlinear and marginal associations between multiple urban morphological indicators and heat risk remain limited. Further research is therefore needed to provide a more comprehensive understanding of urban morphology–HRI relationships at the block scale.
Model selection is a critical step in quantifying associations between urban morphological indicators and heat risk. Existing studies often use traditional regression models, such as multiple linear regression (MLR), with ordinary least squares (OLS) estimation to quantify global associations between urban morphological indicators and heat risk [30,31]. However, these models generally rely on linear assumptions or prespecified functional forms, limiting their ability to capture nonlinear relationships, threshold effects, and interactions between urban morphological indicators and heat risk. Machine-learning models, including Random Forest (RF), Gradient Boosting Decision Trees (GBDT), and Extreme Gradient Boosting (XGBoost), have therefore been increasingly applied to urban thermal-environment and heat-risk research to improve the modelling of complex relationships [32,33]. Among these models, RF aggregates multiple randomised decision trees, thereby reducing the instability of individual trees. It can flexibly model nonlinear relationships, is relatively robust to overfitting, and supports feature importance assessment, making it suitable for examining complex associations between multidimensional urban morphological indicators and heat risk [31,34]. Nevertheless, differences in model structure, fitting performance, and interpretability may affect the relationships identified between urban morphological indicators and heat risk. Comparing multiple models is therefore necessary to select a modelling approach better suited to explaining heat risk.
Despite advances in data resolution and assessment scale, several challenges remain in fine-scale urban heat-risk research. First, administrative units and regular grids do not always correspond to urban spatial units structured by roads, land-use boundaries, and the built environment, which may obscure intra-urban variations in heat risk. Second, the construction of composite HRI is sensitive to the choice of weighting scheme, particularly when multi-source indicators differ in variability and exhibit substantial intercorrelations. This highlights the importance of using transparent weighting procedures that consider both indicator variability and information redundancy. Third, although the LCZ framework provides a standardised representation of urban form and local thermal environments, its ability to differentiate heat-risk patterns among urban types, as well as the variation that remains within individual LCZ types, requires further examination.
Against this background, this study focuses on Tianjin’s six central districts. Within the Hazard–Exposure–Vulnerability–Adaptability (HEVA) heat-risk assessment framework, a block-scale heat-risk index (HRI) is constructed, and a modified CRITIC weighting method is applied to determine the weights of multidimensional indicators. The LCZ framework is then used to compare heat risk among urban spatial types, while urban morphological indicators and explainable machine learning are used to characterise nonlinear marginal associations and potential interaction patterns with HRI at the block scale. Specifically, this study addresses the following questions: (1) What spatial pattern does block-scale heat risk exhibit in Tianjin’s six central districts under the HEVA framework? (2) How does heat risk exhibit spatial heterogeneity among LCZ types in Tianjin’s six central districts? (3) Which urban morphological indicators are most strongly associated with higher or lower heat risk at the block scale, and what nonlinear marginal associations do they exhibit?
Using Tianjin’s six central districts as a case study, this study identifies block-scale spatial patterns of urban heat risk and the urban morphological characteristics most strongly associated with variations in HRI. By considering LCZ-based differences, HEVA risk composition, and nonlinear associations with continuous urban morphological characteristics, the study links fine-scale heat-risk assessment with urban sustainability and climate adaptation. Building on these analyses, the study provides an integrated perspective on intra-urban heat-risk heterogeneity by distinguishing three complementary dimensions: HEVA risk composition, LCZ-based typological differences, and continuous urban morphological variation. This framework enables the comparison of broad heat-risk differences among discrete LCZ types while also examining continuous morphological associations with HRI that are not captured by typological classification alone. In this way, the study provides an integrated analytical perspective for understanding heat-risk heterogeneity through typological, compositional, and continuous-form dimensions. Taken together, the findings provide spatially explicit evidence to support the identification of priority intervention areas, inform the allocation of heat-adaptation resources, and facilitate the translation of fine-scale heat-risk assessment into differentiated planning and climate-resilient urban regeneration, thereby supporting sustainable urban development.
2. Study Area and Data
2.1. Study Area
Tianjin is located in the northeastern part of the North China Plain and within the lower Hai River Basin. It is a centrally administered municipality in northern China characterised by predominantly flat terrain. Under the Köppen–Geiger climate classification, Tianjin has a Dwa temperate continental monsoon climate [35], with a long-term mean temperature of approximately 13.3 °C and annual precipitation of approximately 605 mm. The climate is characterised by hot, rainy summers with concentrated precipitation and cold, dry winters [36]. In recent years, rapid urbanisation and intensive land development have been accompanied by an intensification of Tianjin’s summer urban heat island effect. Previous studies indicate that, between 2006 and 2020, areas with high and moderate summer temperatures expanded from the central urban area towards the periphery. Heat patches were generally small, densely distributed, and fragmented, while the core built-up area continued to experience considerable hazard from summer heat [37]. At the same time, Tianjin’s central urban area is characterised by a high concentration of population and urban functions. In 2023, Tianjin had a permanent resident population of 13.64 million, of whom approximately 3.909 million lived in the central urban area, accounting for 28.7% of the municipal total. This concentration corresponds to high population exposure and a high degree of urbanisation in the central urban area [38]. Given the climatic background, hazard conditions, and concentration of vulnerable populations described above, this study selected Tianjin’s six central districts—Heping, Hedong, Hexi, Nankai, Hebei, and Hongqiao—as the study area. The 1639 city blocks delineated by the road network were used as the basic analytical units.
As shown in Figure 1c, land cover is unevenly distributed across the study area. Contiguous built-up land and impervious surfaces dominate, whereas blue–green spaces, including vegetated areas, water bodies, and wetlands, are relatively limited and are concentrated mainly along the Haihe River and its tributaries, within urban parks, and in some peripheral areas. The fragmentation of blue–green spaces may reduce the effectiveness of evapotranspirative cooling, shading, and ventilation, whereas high-density built-up areas are more susceptible to heat accumulation and stronger urban heat island effects. Against a background of concentrated population, buildings, and urban functions, surface thermal stress spatially overlaps with areas of high exposure and vulnerability. This combination is associated with particularly pronounced summer heat risk in Tianjin’s six central districts.
Figure 1.
Study area in Tianjin, China: (a) location of Tianjin in China; (b) location of the study area in Tianjin; and (c) urban blocks and land-cover types.
2.2. Data Sources
This study uses city blocks as the basic spatial units and integrates multi-source data on the thermal environment, population exposure, the built environment, socioeconomic conditions, and public service facilities to construct the heat-risk index (HRI), derive urban morphological indicators, and perform Local Climate Zone (LCZ) classification and mapping. Most datasets correspond to 2020, which was selected as the common assessment year; variables derived from datasets released or compiled after 2020 were processed to represent conditions in 2020. Thermal-environment data were obtained primarily from satellite remote-sensing products. Land surface temperature (LST) was derived in Google Earth Engine from 14 Landsat 8 Collection 2 Level-2 L2SP scenes acquired during June–August 2020 [39,40]. After QA_PIXEL masking of clouds, cloud shadows, and snow, eight scenes retained valid observations within Tianjin. ST_B10 temperatures were converted to degrees Celsius and median-composited at 30 m resolution, with one to seven valid observations per pixel (mean = 2.06; median ≈ 2); vegetation cover was characterised using the 2020 annual maximum NDVI dataset for China provided by the National Ecosystem Science Data Center [41]; and land-cover types and associated landscape pattern metrics were derived from the ESA WorldCover 2020 dataset [42]. Population exposure was characterised using the WorldPop 2020 gridded population dataset, supplemented with age-structure information to analyse the spatial distribution of vulnerable groups, including older adults and children [43,44]. For built-environment data, road networks were obtained from OpenStreetMap and used to derive road-network metrics, including road network density [45]. Building morphological information was obtained from the 3D-GloBFP dataset [46], Year-of-construction data were obtained from the CMAB dataset [47] and were subsequently used to derive building age referenced to the 2020 assessment year. Socioeconomic and public-service data included points of interest (POIs), GDP, and housing value. POIs were used to characterise urban functional intensity and facility clustering and were further screened to identify medical and heat-relief facilities as indicators of public-service provision and resources supporting adaptability. Medical facilities were identified from hospital, clinic, and doctor POIs, while heat-relief facilities included arts centres, community centres, department stores, libraries, malls, museums, and supermarkets. After cleaning, 888 valid POIs were retained, including 19 medical-facility POIs and 42 heat-relief-facility POIs. The cleaned POIs were spatially assigned to road-defined blocks and used to calculate block-level POI density. GDP data were obtained from relevant products provided by the Chinese Academy of Sciences [48], and housing-value data were collected from Anjuke in August 2020 and represented residential listing prices. After cleaning, 12,308 valid records were retained and aggregated to the block level.
During data preprocessing, the coordinate reference systems and spatial extents of the raster and vector datasets were standardised to ensure the consistency and comparability of multi-source spatial data at the block scale. Raster datasets with different native spatial resolutions were resampled to a common 30 m grid for spatial processing and block-scale aggregation; this harmonisation did not alter the spatial information inherent in the original datasets. Point-based data, including POIs and housing value, were additionally subjected to deduplication, correction of anomalous coordinates, and standardisation of attribute fields. Healthcare and heat-relief facilities were identified according to POI functional categories. Following preprocessing, the datasets were used to construct the HRI, classify and map LCZs, and analyse associations between urban morphological indicators and heat risk.
2.3. Variable Construction
The development of heat-risk maps enables the rapid identification of high-risk urban areas and provides a spatial basis for formulating targeted heat-risk mitigation measures. Accordingly, the block-scale heat-risk index (HRI) was specified as the dependent variable to represent the heat-risk level of each block. This study adopted the Hazard–Exposure–Vulnerability–Adaptability (HEVA) framework [49,50], in which heat risk is conceptualised as the combined outcome of hazard, exposure, vulnerability, and adaptability. Specifically, (1) hazard (H) represents the intensity of local high-temperature conditions and their potential impacts. In heat-risk assessments, it is commonly measured using indicators such as air temperature, land surface temperature, and heatwave intensity [51]. (2) Exposure (E) reflects the number, density, and spatial distribution of people, infrastructure, and urban activities in areas affected by high temperatures. Higher exposure indicates that more people and assets may be affected by high-temperature conditions [52]. (3) Vulnerability was operationalised through the spatial concentration of heat-sensitive populations and susceptible built-environment characteristics, represented by child, elderly, and female population densities and building age. Age-specific population densities were used to capture the local concentration of heat-sensitive residents, whereas total population density in the Exposure dimension represents the broader concentration of residents potentially affected by heat. This emphasis differs from proportion-based measures, which primarily describe relative demographic composition [23,53,54]. (4) Adaptability (A) is operationalised in this study as the potential provision of economic and public-service resources that can support responses to high temperatures. It is represented by healthcare services, heat-relief facilities, regional economic resources, and housing conditions [50,55]. Accessibility-based research further indicates that healthcare resource provision and residents’ effective access to medical services represent distinct constructs, because accessibility also depends on population demand, service capacity, travel impedance, and cross-boundary service provision [56]. Within this operational definition, medical facility density represents the spatial provision of healthcare resources rather than residents’ realised accessibility to medical services. GDP and housing value were used as proxies for socioeconomic resources and resource-provision capacity. Previous urban heat-risk studies have adopted additive HEVA formulations in which hazard, exposure, and vulnerability enter the composite risk positively, while adaptability is included as a negatively signed component [57,58]. Following this established specification, the four HEVA dimensions were aggregated to calculate HRI, as follows:
where denotes the heat-risk index of block; denote the normalised hazard, exposure, vulnerability, and adaptability scores, respectively; and denote their corresponding first-level CRITIC weights. In this formulation, hazard, exposure, and vulnerability contribute positively to the composite index, whereas adaptability enters as a negatively signed component.
Based on the HEVA heat-risk assessment framework, 14 secondary indicators were initially selected to construct the HRI indicator system. Hazard was represented by land surface temperature (LST). Exposure was characterised by the concentration of residents, urban functions, and mobility-related activity, using population density, point-of-interest (POI) density, road-network density, Weibo check-in density, and night-time light intensity as candidate indicators. Vulnerability was represented by the spatial concentration of heat-sensitive populations and building characteristics, including child population density, elderly population density, female population density, and building age. Adaptability was characterised by economic and public-service resources, including GDP, heat-relief facility density, medical facility density, and housing value [53,59].
The screening results showed that Weibo check-in density, night-time light intensity, and female population density were excluded from the final HRI calculation. Weibo check-in data are affected by user demographics, platform-use preferences, and individual behavioural choices. In addition, record counts and spatial coverage vary among blocks, limiting the ability of these data to represent actual urban activity exposure reliably [60]. At the block scale, night-time light data are sensitive to spatial resolution, light spillover, and saturation at high radiance values, limiting their ability to capture fine-scale differences among blocks [61]. These data were also highly correlated with population density, POI density, and GDP, indicating information overlap. In the dataset used in this study, female population density was highly correlated with total population density, child population density, and elderly population density and therefore provided limited independent information on vulnerability. By contrast, children and older adults have a clearer theoretical basis for heat sensitivity and are more widely used to represent vulnerable groups in vulnerability assessments [53]. Ultimately, 11 secondary indicators were retained to construct the block-scale HRI (Table 1).
Table 1.
Indicators considered in the heat-risk assessment framework and their data sources.
To explain the block-scale spatial heterogeneity of heat risk, 19 urban morphological indicators were initially selected: block area (BA), vegetation ratio (VR), soil ratio (SR), waterbody ratio (WR), edge density (ED), patch density (PD), largest patch index (LPI), landscape shape index (LSI), waterbody distance index (DWI), green-space distance index (DGI), block boundary length (BP), block compactness (BC), block shape index (SHI), block aspect ratio (EI), normalised difference vegetation index (NDVI), floor area ratio (FAR), building height (BH), building density (BD), and sky view factor (SVF). Together, these indicators represent block-scale urban morphological characteristics across five dimensions: building morphology, land-cover composition, distance to blue–green spaces, block geometry, and landscape configuration. These dimensions characterise the three-dimensional built form, surface composition and configuration, and spatial relationships with surrounding blue–green spaces, providing a multidimensional representation of block-scale urban morphology for subsequent HRI analysis.
To reduce indicator redundancy and improve model stability and interpretability, Pearson correlation analysis and the variance inflation factor (VIF) were used to diagnose multicollinearity among the urban morphological indicators (Figure A1, Appendix A). The results showed strong correlations or information overlap between BP and both BA and LSI, between SHI and both EI and BC, and among BD, FAR, and SVF. Notably, the VIF for BP exceeded 10, indicating substantial multicollinearity. The indicators were then further screened based on their physical meanings, suitability for block-scale analysis, and data-distribution characteristics, to reduce redundancy and improve model stability and interpretability. Ultimately, BP, SHI, EI, FAR, BD, and WR were excluded from the subsequent analysis, leaving 13 urban morphological indicators as the model’s independent variables (Table 2). Importantly, none of the 13 urban morphological indicators retained as predictors was directly used to construct HRI.
Table 2.
Urban morphological characteristics and data sources.
3. Methods
3.1. Research Framework
Using Tianjin’s six central districts as a case study, this study developed a research framework comprising heat-risk assessment, LCZ-based analysis of the spatial heterogeneity of heat risk, and analysis of associations between urban morphology and heat risk. The analytical workflow is illustrated in Figure 2. First, candidate heat-risk indicators were selected under the HEVA framework, and 11 secondary indicators were retained after correlation-based screening. A modified CRITIC weighting method was then applied to determine indicator weights, calculate hazard, exposure, vulnerability, and adaptability, and construct the heat-risk index (HRI). The spatial autocorrelation of HRI was subsequently assessed using Global Moran’s I. Second, a machine-learning approach was used to classify and map LCZs and to compare heat risk among LCZ types. Meanwhile, 13 urban morphological indicators were selected using Pearson correlation analysis and variance inflation factor (VIF) diagnostics. Finally, RF, XGBoost, and GBR were compared using the held-out test-set performance metrics, and the model with the most favourable overall performance was selected for subsequent interpretation. SHAP-based feature importance, partial dependence plots (PDPs), and SHAP analyses were then used to characterise marginal associations and potential interaction patterns between urban morphological indicators and HRI.
Figure 2.
Overall analytical workflow for block-scale heat-risk assessment, LCZ-based heterogeneity analysis, and urban morphology modelling.
3.2. Weighting of the HRI
Because the evaluation indicators were derived from different sources and varied substantially in scale and magnitude, data normalisation was required to ensure comparability and support subsequent calculations. All data were aggregated to the block scale. Min–max normalisation was then applied to transform the indicators into a dimensionless range from 0 to 1:
where denotes the normalised value of indicator , denotes its raw value, and and denote the minimum and maximum values of the corresponding indicator, respectively. Higher values of building age indicate greater vulnerability, whereas higher values of the adaptability indicators indicate greater adaptability.
Previous heat-risk assessments have often used the analytic hierarchy process (AHP), which relies on expert judgement and may introduce subjectivity [62], or equal weighting (EW), which assigns identical weights to all primary components [17,63]. However, the four primary components may contribute differently to overall heat risk, and some of the selected secondary indicators are correlated. A data-driven weighting approach was therefore adopted to determine the indicator weights. Accordingly, this study used a modified implementation of the CRITIC weighting method. The method considers indicator variability and inter-indicator correlations [64]. Compared with the conventional CRITIC method, absolute Pearson correlation coefficients were used in the correlation term so that information redundancy was determined by the magnitude rather than the direction of correlation, with both strong positive and strong negative correlations representing a high degree of redundancy. On this basis, the information content of each indicator was determined by jointly considering its variability and its correlations with the remaining indicators. The information content of indicator was calculated as
and the corresponding weight was calculated as
where is the standard deviation of indicator , is the Pearson correlation coefficient between indicators and , and is the number of indicators. A larger indicates greater indicator variability and lower redundancy with the remaining indicators, resulting in a higher weight.
The weighting procedure was implemented hierarchically. The modified CRITIC method was first applied within the exposure, vulnerability, and adaptability dimensions to determine the second-level indicator weights; because hazard was represented by LST alone, its within-dimension weight was set to 1. The resulting H, E, V, and A scores were then weighted using the same procedure to obtain the first-level weights reported in Table 3. The resulting first-level weights were then applied to the four HEVA dimension scores according to Equation (1) to calculate the final HRI. These data-driven weights reflect the statistical information characteristics of the indicators within the study dataset rather than their theoretical or causal importance.
Table 3.
Combined weights of the heat-risk indicators.
3.3. Spatial Autocorrelation and LCZ-Based Analysis of Heat Risk
Global Moran’s I was used to assess the spatial autocorrelation of block-level HRI. Spatial relationships were defined using an eight-nearest-neighbour (k = 8) spatial-weight matrix, and the weights were row-standardised before calculating the spatial lag. Statistical significance was assessed using the normal approximation implemented for Moran’s I, with p < 0.05 considered statistically significant.
Tree-based classifiers are widely used in GIS-based LCZ classification and mapping because they can distinguish LCZ types using multiple input variables [65,66]. Following the LCZ framework proposed by Stewart and Oke [9], LCZ classification was first conducted at a 30 m grid resolution using a Random Forest classifier. The predictor set included Landsat surface-reflectance bands, five spectral indices (NDVI, LSWI, NDSVI, NDBI, and MNDWI), and terrain variables derived from SRTM, including elevation, slope, and aspect. The Landsat images were cloud-masked and composited using the median to construct the predictor image.
Reference polygons for the LCZ classes were manually delineated through visual interpretation and assigned corresponding LCZ labels. Predictor values were then extracted from these reference areas at a 30 m resolution, and the resulting sample pixels were randomly divided into training and validation subsets at an 80:20 ratio. A Random Forest classifier with 200 trees was fitted using the training subset, and classification performance was evaluated using the validation subset. The overall accuracy was 80.78%, with a Kappa coefficient of 0.787. Class-specific Producer’s Accuracy and User’s Accuracy were also calculated. Detailed training and validation sample sizes, class-specific accuracy metrics, and the complete confusion matrix are provided in Table A1 and Table A2 in Appendix D.
The resulting 30 m LCZ classification was subsequently overlaid with the road-defined blocks. Because individual blocks could contain more than one LCZ class, each block was assigned the LCZ class with the largest area share within its boundary as its dominant LCZ type. In 27 blocks, this assignment rule did not yield a unique valid dominant LCZ, including cases in which two or more LCZ classes had the same maximum proportion. To avoid arbitrary assignment, these blocks were left unassigned at the dominant-LCZ level and were excluded only from LCZ-specific analyses. Accordingly, 1612 blocks with valid dominant LCZ assignments were used for LCZ composition, HRI comparison, and related statistical tests, while all 1639 blocks were retained in the overall HRI assessment and urban morphology analysis. The distributions of HRI and its four primary components—hazard, exposure, vulnerability, and adaptability—were then compared among the valid dominant LCZ types to characterise typological differences in block-scale heat risk.
3.4. Model Construction and Interpretation
To investigate nonlinear associations between urban morphological characteristics and heat risk, three models were constructed and compared: Random Forest (RF), Extreme Gradient Boosting (XGBoost), and Gradient Boosting Regression (GBR). Model performance was evaluated on the held-out test set using the coefficient of determination (R2), root mean square error (RMSE), mean absolute error (MAE), and median absolute error (MedAE), with higher R2 and lower error values indicating better predictive performance (Table 4). RF showed the highest R2 (0.684) and the lowest RMSE (0.543) among the three evaluated models, while XGBoost and GBR achieved R2 values of 0.656 and 0.628, respectively. Although the differences in predictive performance were relatively modest, RF showed the most favourable overall test-set performance and was therefore selected for the subsequent model-interpretation analyses. A supplementary five-fold spatial block cross-validation produced lower absolute predictive performance but retained the same model ranking, with RF remaining the best-performing model (mean R2 = 0.40 ± 0.08). The major feature-importance ranking also remained unchanged. Full spatial-validation results are provided in Table A3 of Appendix E.
Table 4.
Held-out test-set performance of the three machine-learning models for HRI prediction.
Random Forest (RF) is a tree-based ensemble-learning algorithm that uses bootstrap sampling and random feature selection and is widely applied to regression and classification tasks [34]. By constructing multiple regression trees and averaging their predictions, RF can capture complex nonlinear associations between urban morphological indicators and HRI. Compared with a single decision tree, RF uses bootstrap samples and random subsets of predictors during tree construction, which helps reduce correlations among trees and model variance, thereby improving predictive stability and generalisability. The RF prediction can be expressed as follows:
In Equation (5), denotes the predicted HRI for block i; denotes its urban morphological feature vector; is the number of regression trees; and represents the prediction function of the bth Classification and Regression Tree (CART). Each tree is trained independently using a bootstrap sample, and the split variable at each node is selected from a random subset of predictors. The final model prediction is obtained by averaging the outputs of all regression trees.
For consistent out-of-sample comparison among the candidate models, the dataset was randomly divided into training and test sets at a 70:30 ratio, and hyperparameters were optimised on the training set using Optuna 4.9.0. The tuned hyperparameters were the number of regression trees, maximum tree depth, and minimum number of samples per leaf node, with search ranges of 30–200, 2–8, and 1–10, respectively. Three-fold cross-validation was used during optimisation, and the best-performing parameter combination was selected by minimising the mean RMSE across folds. All other parameters were retained at their default values, and the random seed was set to 42.
Optuna was run for 120 hyperparameter-optimisation trials, and the final RF model was fitted using the best-performing parameter combination. Mean absolute SHAP values were used to quantify the relative importance of urban morphological indicators. Partial dependence plots (PDPs) were used to characterise average nonlinear associations, while SHAP summary and dependence plots were used to examine the direction and distribution of feature contributions and potential interaction patterns.
4. Results
4.1. Spatial Distribution of HRI
Figure 3a–d shows the spatial distributions of the four primary components: hazard, exposure, vulnerability, and adaptability. Using the natural breaks (Jenks) classification, each component was divided into five levels, from low to high: low, low-medium, medium, high-medium, and high.
Figure 3.
Spatial distributions of heat risk and its primary components in Tianjin’s six central districts: (a) hazard; (b) exposure; (c) vulnerability; (d) adaptability; and (e) heat-risk index (HRI).
Hazard (H) exhibits a distinct patchy spatial pattern. Blocks with high-medium and high hazard values are concentrated mainly in the Heping District and the adjoining contiguous built-up areas of the Nankai, Hexi, and Hedong Districts. Additional localised high-value patches occur in the southern Hebei District, eastern Hedong District, southwestern Nankai District, and southern Hexi District. This pattern may be associated with higher building density and larger proportions of impervious surfaces in these areas, where contiguous built-up land favours solar-energy absorption and surface heat storage. By contrast, hazard is generally low or low-medium in the northern Hebei District, western Hongqiao District, and some peripheral blocks of the Hedong, Hexi, and Nankai Districts, possibly because of their lower development intensity and larger proportions of vegetation, water bodies, and open spaces.
Exposure (E) shows a pronounced central concentration. Blocks with high-medium and high exposure are located mainly in the Heping District and extend into the eastern Nankai District, northern Hexi District, western Hedong District, and southern Hebei District. This pattern may be associated with the concentration of major transport hubs, including Tianjin Station and Tianjin West Station; core commercial areas, including the Binjiang Road–Heping Road and Nanmenwai Street–Joy City business districts; and surrounding high-density residential and public-service areas. These locations have high population density, point-of-interest (POI) density, and road network density. The co-location of transport transfers, commercial activity, commuting, and public services corresponds to a large potentially exposed population during high-temperature periods. By contrast, exposure is generally low or low-medium in the western Hongqiao District, northern Hebei District, eastern Hedong District, and some peripheral blocks of the Nankai and Hexi Districts, where population, facilities, and transport activities are less concentrated.
Vulnerability (V) generally decreases from the city centre towards the periphery. Blocks with high-medium and high vulnerability are concentrated mainly in the Heping District and in traditional residential areas bordering the eastern Nankai District, northern Hexi District, and western Hedong District, forming contiguous high-value areas in some older parts of the city. This pattern may be associated with the longer development history of these areas, where older residential developments and older buildings are concentrated. Some of these buildings may provide relatively limited thermal insulation, shading, and ventilation. In addition, higher concentrations of heat-sensitive populations, including older adults and children, correspond to greater potential health risk during high-temperature periods. By contrast, the eastern Hedong District, northern Hebei District, and some blocks in the Hexi and Nankai Districts generally exhibit low, low-medium, or medium vulnerability. These areas are mainly located in more recently developed zones, with newer residential buildings and lower concentrations of older housing and heat-sensitive populations.
Adaptability (A) also shows a pronounced central concentration. Blocks with high-medium and high adaptability are located mainly in the Heping District and extend into the northern Hexi District, eastern Nankai District, western Hedong District, and southern Hebei District. This pattern may be associated with the concentration of resources that support responses to high temperatures, including clusters of general and specialist hospitals in the central Heping, eastern Nankai, and western Hedong Districts; commercial complexes in the Binjiang Road–Heping Road and Nanmenwai Street–Joy City business districts; and public cultural facilities around the Tianjin Cultural Centre. These areas contain dense networks of hospitals and community healthcare facilities, together with commercial complexes and public cultural venues, reflecting a relatively high spatial provision of medical and heat-relief resources. Higher GDP and housing values are also consistent with stronger economic support, public-service provision, and emergency resource-mobilisation capacity. By contrast, adaptability is generally low or low-medium in the western Hongqiao District, northern Hebei District, eastern Hedong District, and some peripheral blocks of the Nankai and Hexi Districts, where medical and heat-relief facilities, economic resources, and public services are comparatively limited.
Figure 3e shows the spatial distribution of HRI across Tianjin’s six central districts. Overall, HRI displays a core–periphery pattern, with lower values in the urban core and higher values towards the periphery, together with localised clustering. Global Moran’s I was calculated to assess the overall spatial autocorrelation of HRI. The resulting Moran’s I was 0.671 (p < 0.001), indicating significant positive spatial autocorrelation at the block scale, with blocks of similar HRI values tending to cluster spatially (Figure A2, Appendix B). Blocks in the high-medium and high risk categories are distributed mainly around the outer edge of the Heping District, forming a discontinuous ring-shaped belt that extends through the western and north-western Hongqiao District, northern and eastern Hebei District, eastern Hedong District, western Nankai District, and southern Hexi District. Functionally, high-risk blocks in the northwest are concentrated around the Tianjin West Station transport hub. Those in the east are located mainly in areas of the eastern Hebei and Hedong Districts where residential, transport, and industrial functions are intermingled, whereas those in the south occur mainly in southwestern residential areas of the Nankai District and the southern periphery of the Hexi District. These blocks do not contain the highest concentrations of population or urban activity, and their exposure is mostly low or low-medium. However, hazard is generally high, and some blocks contain relatively high concentrations of older adults and children together with substantial stocks of older residential buildings, corresponding to medium, high-medium, or high vulnerability. Medical facilities, public cooling spaces, and economic resources are also comparatively limited, resulting in weaker adaptability. These blocks therefore combine relatively high hazard and vulnerability with comparatively limited adaptability, resulting in high HRI values across continuous or patchy zones.
Blocks in the low and low-medium risk categories are concentrated mainly in the Heping District and the surrounding urban core, including the Binjiang Road–Heping Road and Nanmenwai Street–Joy City commercial districts, the integrated transport and public-service area around Tianjin Station, and the waterfront commercial and public-activity area extending from Jinan Square to Jiayang North Road and the central Haihe River corridor. Although these areas contain dense populations, commercial facilities, and transport activities, and some blocks show high-medium or high exposure and vulnerability, they also contain concentrated medical institutions, commercial complexes, public cultural facilities, and heat-relief spaces. Stronger economic support and public-service provision correspond to high-medium or high adaptability, and these blocks generally exhibit comparatively low HRI values. A small number of low-risk blocks also occur around Shushing Park, Nonchipping Park, and sections of the Haihe River. Overall, Tianjin’s six central districts exhibit predominantly low and low-medium heat risk in the resource-rich urban core and high-medium and high risk in peripheral transitional zones with more limited adaptability.
4.2. Spatial Distribution and Composition of LCZ Types
Figure 4 shows the spatial distribution and proportional composition of dominant LCZ types among blocks with valid LCZ assignments across Tianjin’s six central districts. Eleven LCZ types were identified (Figure A3, Appendix C), including eight built LCZ types—LCZ 1–6, LCZ 8, and LCZ 10—and three land-cover LCZ types—LCZ B, LCZ D, and LCZ G. LCZ 7, LCZ 9, LCZ A, LCZ C, LCZ E, and LCZ F did not occur as dominant block-level types. This composition is consistent with the predominantly contiguous mid- to high-rise built-up fabric of the study area, whereas low-rise, low-density built forms and extensive continuous areas of vegetation, bare soil, and paved surfaces are relatively limited.
Figure 4.
Spatial distribution and proportional composition of LCZ types in Tianjin’s six central districts.
Among the 1612 blocks with valid dominant LCZ assignments, built LCZ types accounted for 97.6%, whereas land-cover LCZ types accounted for 2.4%. Built LCZ types were distributed throughout Tianjin’s six central districts. Compact high-rise blocks were concentrated mainly in the Heping District and the surrounding urban core, whereas open mid-rise blocks were widely distributed across peripheral areas of the Hongqiao, Hebei, Hedong, Nankai, and Hexi Districts. Land-cover LCZ types occurred mainly along the Haihe River system and within major blue–green spaces, including Shushing Park and Nonchipping Park. This distribution corresponds broadly to the spatial pattern of contiguous built-up land and blue–green spaces in the study area. Overall, the LCZ distribution exhibits a core–periphery pattern, with compact high-rise types clustered in the core and open mid-rise types widely distributed towards the periphery. Among these, LCZ 5 (open mid-rise) accounted for the largest share of blocks, at 51.0%, followed by LCZ 1 (compact high-rise), at 32.4%. Together, these two types accounted for 83.4% of the blocks with valid dominant LCZ assignments and were the predominant LCZ types in the study area. LCZ 4 (open high-rise) and LCZ 8 (large low-rise) accounted for 6.6% and 6.0%, respectively, whereas the remaining built LCZ types occurred less frequently. Among the land-cover LCZ types, LCZ G (water), LCZ B (scattered trees), and LCZ D (low plants) accounted for 1.2%, 0.8%, and 0.3%, respectively.
4.3. Heat-Risk Heterogeneity Among LCZ Types
Block-scale HRI data were overlaid with the dominant LCZ types in ArcGIS Pro 3.5.2 to quantify differences in heat risk among LCZ types (Figure 5). Overall, built LCZ types exhibited higher HRI values than land-cover LCZ types.
Figure 5.
Differences in heat risk among LCZ types: (a) HRI distributions and (b) composition of heat-risk levels. Sample sizes (n) indicate the number of blocks in each LCZ type among the 1612 blocks with valid dominant LCZ assignments.
Among the built LCZ types, LCZ 5 (open mid-rise) had the highest median HRI, whereas LCZ 3 (compact low-rise) had the highest proportion of high-risk blocks. When the high and higher categories were combined, they accounted for nearly 70% of LCZ 5 blocks, the largest proportion among the main built LCZ types. The corresponding proportions in LCZ 8 and LCZ 10 were each approximately 50%, indicating relatively high heat risk in open mid-rise, large low-rise, and some heavy-industry blocks. LCZ 1 and LCZ 4 included blocks across all five risk levels, indicating substantial within-LCZ variability. Among the land-cover LCZ types, LCZ B (scattered trees) had the highest median HRI, followed by LCZ D (low plants), whereas LCZ G (water) had the lowest. LCZ B was dominated by medium- and lower-risk blocks, while neither LCZ D nor LCZ G contained high- or higher-risk blocks. In LCZ G, low- and lower-risk blocks accounted for more than 80%. These results indicate that blocks dominated by water or low plants generally exhibit lower heat risk. Overall, HRI differed among LCZ types, but each type included multiple risk levels. Thus, although LCZs can characterise broad typological differences in block-scale heat risk, they cannot independently serve as the sole basis for assessing urban heat risk. Recent research has used the Kruskal–Wallis H test and post hoc multiple comparisons to examine significant differences in heat exposure among spatially differentiated urban clusters [67]. A Kruskal–Wallis test confirmed significant differences in HRI among LCZ types (H = 212.036, p < 0.001, ). Subsequent Dunn post hoc tests with Holm correction identified significant differences between LCZ 1 and LCZ 5, LCZ 1 and LCZ G, LCZ 2 and LCZ 5, LCZ 4 and LCZ 5, LCZ 4 and LCZ G, LCZ 5 and LCZ B, LCZ 5 and LCZ G, and LCZ 8 and LCZ G (). These results confirm overall inter-LCZ heterogeneity in HRI, although not all pairwise differences were statistically significant.
Using the natural breaks (Jenks) classification in ArcGIS, hazard, exposure, vulnerability, and adaptability were classified into five levels: low, low-medium, medium, high-medium, and high. The proportion of blocks in each category was then calculated for each LCZ type (Figure 6).
Figure 6.
Spatial distributions and level composition of the four HEVA components across LCZ types: (a) spatial distribution of hazard; (b) composition of hazard levels; (c) spatial distribution of exposure; (d) composition of exposure levels; (e) spatial distribution of vulnerability; (f) composition of vulnerability levels; (g) spatial distribution of adaptability; and (h) composition of adaptability levels.
For hazard, Figure 6a shows that the low, low-medium, medium, high-medium, and high categories accounted for 7.0%, 18.5%, 26.9%, 32.4%, and 15.1% of blocks, respectively. Together, the high-medium and high categories accounted for 47.5% of all blocks. Figure 6b shows the composition of hazard levels within each LCZ type. The combined proportion of blocks classified as high-medium or high was approximately 85.5% in LCZ 2, 56.5% in LCZ 5, and 50.2% in LCZ 1. All LCZ 3 blocks fell into the high-medium or high hazard categories. LCZ B, LCZ D, and LCZ G were dominated by low and low-medium hazard, and all LCZ G blocks were classified as low. Although LCZ 4 and LCZ 6 are built LCZ types, their hazard levels were generally low: LCZ 4 was dominated by low and low-medium hazard, whereas all LCZ 6 blocks were classified as low-medium. This pattern may be associated with their open built forms, lower building coverage, and wider building spacing, which support ventilation and heat exchange and may limit surface heat accumulation.
For exposure, Figure 6c shows that the low, low-medium, medium, high-medium, and high categories accounted for 19.0%, 31.1%, 29.0%, 17.2%, and 3.7% of blocks, respectively. The low, low-medium, and medium categories together accounted for 79.1%, indicating that exposure was predominantly medium to low across the study area. Figure 6d shows the composition of exposure levels within each LCZ type. LCZ 1, LCZ 2, and LCZ 3 contained relatively large proportions of blocks classified as medium, high-medium, or high exposure. LCZ 4, LCZ 5, and LCZ 8 were dominated by low, low-medium, and medium exposure, whereas all LCZ 6 blocks were classified as low. In LCZ G, the medium and high-medium categories together accounted for approximately 43.5%, indicating that LCZ G did not have the lowest exposure profile. This pattern may be associated with the Haihe River passing through the core built-up areas of Tianjin’s six central districts, where dense residential, commercial, transport, and public-activity spaces occur along both banks. Because the dominant LCZ type of each block was defined as the type occupying the largest area, some LCZ G blocks, although dominated by water, may contain or adjoin high-density built-up land and therefore exhibit higher exposure.
For vulnerability, Figure 6e shows that the low, low-medium, medium, high-medium, and high categories accounted for 4.0%, 14.5%, 31.8%, 39.6%, and 10.1% of blocks, respectively. Together, the high-medium and high categories accounted for 49.7% of all blocks. Figure 6f shows the composition of vulnerability levels within each LCZ type. LCZ 1 had the largest combined proportion of blocks classified as medium, high-medium, or high vulnerability, at approximately 67.5%. The corresponding proportions in LCZ 2 and LCZ 5 were both close to 50%. All LCZ 3 blocks were classified as medium vulnerability. LCZ 4, LCZ 8, and LCZ 10 included multiple vulnerability levels and therefore showed substantial within-LCZ variability. LCZ 6, LCZ B, LCZ D, and LCZ G were dominated by low and low-medium vulnerability, and all LCZ D blocks fell within these two categories. Overall, compact high-rise, compact mid-rise, and open mid-rise blocks exhibited relatively high vulnerability.
For adaptability, Figure 6g shows that the low, low-medium, medium, high-medium, and high categories accounted for 24.6%, 23.8%, 21.0%, 15.9%, and 14.8% of blocks, respectively. Together, the low and low-medium categories accounted for 48.4%, indicating that nearly half of the blocks had comparatively limited resources for responding to high temperatures. Figure 6h shows the composition of adaptability levels within each LCZ type. LCZ 2 and LCZ 1 had relatively large proportions of blocks in the three upper categories—medium, high-medium, and high—at approximately 68.8% and 54.9%, respectively. These values may be associated with the concentration of medical facilities, heat-relief spaces, and economic resources in compact core built-up areas. LCZ 4, LCZ 5, and LCZ 8 were dominated by low, low-medium, and medium adaptability, whereas all LCZ 6 blocks were classified as low. LCZ G showed a more varied composition, with high-medium and high adaptability accounting for approximately 43.7% of its blocks. This may reflect the proximity of some waterfront blocks along the Haihe River to core commercial and public-service areas. The low adaptability of LCZ 6 may also be associated with its peripheral location and the comparatively sparse distribution of healthcare, commercial, and public recreational facilities.
Overall, LCZ 1 and LCZ 2 exhibited high levels of hazard, exposure, vulnerability, and adaptability, whereas LCZ 4 and LCZ 6 generally showed lower hazard and exposure. LCZ 5 had the highest median heat risk. Within Tianjin’s six central districts, this type corresponds mainly to mid-rise residential blocks in peripheral transitional zones, where older residential buildings and heat-sensitive populations are relatively concentrated. Medical facilities, public cooling spaces, and economic resources are also less concentrated than in the urban core, corresponding to comparatively lower adaptability in these peripheral blocks. Among the land-cover LCZ types, LCZ G exhibited the lowest median heat risk, while LCZ B and LCZ D also generally showed lower risk than the built LCZ types. Overall, built LCZ types tended to have higher HRI values than land-cover LCZ types. However, heat risk among the built LCZ types did not follow a clear ordered pattern. Differences in building height and density, spatial openness, blue–green-space distribution, and functional configuration among blocks may contribute to this within-type variation. Because several LCZ types were represented by relatively small numbers of blocks, percentage-based comparisons for these less frequent classes should therefore be interpreted with caution.
4.4. Associations Between Urban Morphology and HRI
4.4.1. Relative Importance
In this study, mean absolute SHAP values were used to quantify the relative importance of urban morphological indicators in the Random Forest (RF) model [68]. SHAP values measure the contribution of each predictor to deviations in model predictions from the baseline prediction, while the mean absolute SHAP value summarises the overall magnitude of that contribution across all samples. A larger mean absolute SHAP value therefore indicates a greater overall contribution of the corresponding indicator to variation in predicted HRI. The relative percentages shown in the inset of Figure 7a were calculated by normalising each mean absolute SHAP value by the sum across all 13 predictors.
Figure 7.
SHAP-based interpretation of the Random Forest model: (a) mean absolute SHAP feature importance and relative contributions; and (b) SHAP summary plot for HRI prediction.
Figure 7a shows that SHAP-based importance was concentrated in a small number of predictors. SVF had the highest mean absolute SHAP value (0.2279), followed by NDVI (0.1769), BA (0.1476), BH (0.1194), and DWI (0.0871). VR and LPI showed lower contributions, whereas PD, BC, DGI, ED, LSI, and SR contributed comparatively little. The supplementary five-fold spatial block validation preserved the ranking of the major predictors, indicating that the dominant feature-importance pattern remained stable under spatially separated validation. These results indicate that modelled variation in HRI was captured mainly by indicators representing sky openness, vegetation conditions, block area, building height, and waterbody distance, whereas landscape pattern metrics contributed less to the overall model fit.
Figure 7b presents the SHAP summary swarm plot, which shows the distribution of feature contributions across individual blocks. The horizontal axis represents SHAP values relative to the model baseline. Positive SHAP values indicate contributions towards a higher predicted HRI, whereas negative values indicate contributions towards a lower predicted HRI. The vertical axis lists the urban morphological indicators in descending order of mean absolute SHAP value. The results show that SVF, NDVI, BA, BH, and DWI had the largest mean absolute SHAP values and therefore made the largest model-based contributions to variation in predicted HRI. Higher SVF and NDVI values occurred mainly in the negative SHAP region, whereas lower values occurred more frequently in the positive region. This pattern indicates that greater sky openness and vegetation greenness were generally associated with lower predicted HRI. BA and BH showed the opposite pattern: higher values were concentrated mainly in the positive SHAP region, indicating associations between larger block areas, greater building heights, and higher predicted HRI. Higher DWI values also corresponded mainly to positive SHAP values, indicating that blocks farther from water bodies tended to have higher predicted HRI. Higher VR values were more common in the negative SHAP region, further indicating an association between greater vegetation ratio and lower predicted HRI. By contrast, SHAP values for LPI, PD, BC, DGI, ED, LSI, and SR were concentrated mainly around zero, indicating comparatively small overall contributions to the model predictions. Taken together, the SHAP-based importance and summary results show that modelled variation in HRI across Tianjin’s six central districts was associated primarily with sky openness, vegetation conditions, block area, building height, and waterbody distance, whereas landscape pattern metrics made smaller overall contributions.
4.4.2. Marginal Effects
Partial dependence plots (PDPs) were used to characterise the average modelled association between each urban morphological indicator and HRI after averaging over the remaining predictors. In Figure 8, the horizontal axis shows the value of each urban morphological indicator, and the vertical axis shows the standardised predicted HRI. The black solid line represents the PDP curve, the red dashed line represents the fitted smooth curve, and the short vertical marks along the horizontal axis show the distribution of observations.
Figure 8.
(a–m) Partial dependence plots showing the modelled associations between urban morphological indicators and HRI.
The PDPs for SVF and NDVI showed distinct nonlinear patterns. As SVF increased from low values, predicted HRI initially increased and then declined, with a steeper decline at higher SVF values. This pattern suggests that the association between greater sky openness and lower predicted HRI became more evident only at relatively high SVF values. For NDVI, predicted HRI also increased initially at low values and then gradually declined after reaching a turning point. This pattern indicates that higher vegetation greenness was generally associated with lower predicted HRI beyond the turning point, whereas the association was less evident at low NDVI values.
In contrast, BA exhibited a clear threshold-like response. Predicted HRI increased sharply as BA rose from low values and then remained relatively high, with only minor fluctuations, across the medium-to-high range. The largest marginal change therefore occurred as block area increased from small to moderate values, whereas additional changes became smaller beyond this range. BH showed an overall positive nonlinear association that approached saturation. Predicted HRI increased with BH, levelled off at relatively high values, and declined slightly at the upper end of the observed range.
4.4.3. SHAP-Based Interaction Effects
SHAP dependence plots were used to examine how feature contributions varied across different morphological contexts. In Figure 9, the horizontal axis shows the value of the focal indicator, and the vertical axis shows its corresponding SHAP value. Positive SHAP values indicate contributions towards higher predicted HRI, whereas negative values indicate contributions towards lower predicted HRI. Point colour represents the value of a second urban morphological indicator and helps visualise how the contribution of the focal indicator varies across different morphological conditions.
Figure 9.
(a–m) SHAP dependence plots showing context-dependent contribution patterns among urban morphological indicators.
The results show that SVF exhibited a clear nonlinear contribution pattern, with its contribution varying across different BH levels. SHAP values for SVF initially increased and then declined as SVF rose, and high SVF values generally corresponded to stronger negative contributions. Higher BH values were concentrated mainly within the moderate-SVF and positive-SHAP ranges, suggesting that the association between higher SVF and lower predicted HRI may be weaker where BH is greater. NDVI showed a similar pattern, with SHAP values initially increasing and then gradually declining beyond a turning point. High NDVI values were associated mainly with negative SHAP values, and the NDVI-related contribution varied across LSI values. The SHAP contribution of BA shifted rapidly from negative to positive across the low-value range and then stabilised. Higher BA values frequently co-occurred with higher DWI values, particularly within the range of positive BA-related SHAP contributions. The SHAP contribution of BH also shifted from negative to positive as BH increased and then levelled off at high values. Higher PD values were associated with smaller positive BH-related SHAP contributions, suggesting that the positive association between BH and predicted HRI may be weaker where patch density is higher. Overall, the context-dependent contribution patterns were more evident for SVF–BH and BH–PD, whereas those for NDVI–LSI and BA–DWI were apparent mainly within specific value ranges.
5. Discussion
5.1. Spatial Heterogeneity of Urban Heat Risk Within the LCZ Framework
Previous urban heat-risk studies have generally reported that high-risk areas are concentrated in city centres with intensive human activity. A study in Birmingham, UK, found that areas of extremely high heat risk were clustered in the urban core [69]. Similarly, Xu et al. applied an integrated Hazard–Exposure–Vulnerability framework in Fuzhou and found that heat risk was highest in the central urban area [70]. This pattern differs from the findings of the present study. Although city centres often have higher population and road network densities and larger stocks of older residential buildings—conditions associated with higher exposure and vulnerability in some blocks—they also tend to have greater concentrations of healthcare services, heat-relief facilities, public-service resources, and socioeconomic resources. These more concentrated resources are reflected in higher adaptability scores, which contribute to comparatively lower composite HRI values in some central blocks. In contrast to the conventional city-centre pattern, this study found higher HRI values in some blocks at the periphery of the urban core. These peripheral blocks often exhibit higher surface temperatures and medium-to-high vulnerability. However, healthcare services, heat-relief facilities, and socioeconomic resources are comparatively limited, and this combination of lower adaptability scores with higher hazard and vulnerability corresponds to higher composite HRI. This spatial pattern provides a basis for expanding heat-relief facilities, optimising the allocation of medical resources, and strengthening community-level heatwave response capacity in high-risk peripheral blocks.
Comparisons within the LCZ framework further show that the built LCZ types associated with the highest and lowest heat risk differ among cities. A recent grid-scale heat-health risk assessment in the Beijing-Tianjin-Hebei region identified LCZ 1 and LCZ 2 as the built types with the highest heat risk [17]. In the present study, however, LCZ 5 exhibited the highest HRI. This pattern may be associated with the prevalence of open mid-rise development in Tianjin’s six central districts, particularly within contiguous built-up areas in peripheral transitional zones. These areas also have comparatively limited blue–green spaces and adaptive-resource provision, which coincide with higher HRI. A similar pattern has been reported in Shanghai [71]. Previous studies have often identified LCZ 9 as a low-risk built type, whereas LCZ 6 showed the lowest heat risk among the built LCZ types in Tianjin’s six central districts. This may be associated with its more dispersed form, lower building density, and smaller population. In Dalian, for example, LCZ 4 was identified as the low-risk built type, possibly because it is concentrated near mountains and the coast, where the mountain–sea setting may moderate local heat conditions [54]. These comparisons indicate marked within- and between-city heterogeneity in the heat risk associated with LCZ types, which may reflect differences in natural settings and urban spatial organisation. After identifying LCZ types, further analysis is therefore needed to examine the specific associations between urban morphological characteristics and heat risk, together with potential mitigation pathways at the micro- and mesoscales.
5.2. Associations Between Urban Morphological Characteristics and HRI
The LCZ analysis was used to compare HRI among discrete urban types, whereas the quantitative urban morphological indicators were analysed separately to examine continuous block-scale associations with HRI across the study area. Previous studies have shown that building form, vegetation conditions, and surface configuration are associated with spatial variations in heat risk, although the direction and magnitude of these associations differ among individual indicators. A study in Beijing showed that urban morphology parameters, including building height, building surface fraction, sky view factor, and permeable surface fraction, varied substantially among LCZ types and were closely associated with differences in urban heat risk [22]. Another study in Beijing found that different combinations of building structure and land cover corresponded to different heat-risk levels [25]. Elaraby et al. found high HRI values in high-density built-up areas with limited green space in Manchester [72]. Similarly, Song et al. reported that high residential density, extensive impervious surfaces, and limited blue–green space were associated with higher neighbourhood-scale heat risk in Shijiazhuang [73].
The present findings are broadly consistent with these studies and further show that SVF and vegetation conditions had relatively high model importance across the study area, with higher SVF values and more favourable vegetation conditions generally associated with lower predicted HRI. By contrast, larger block areas, greater building heights, and greater distances from water bodies were generally associated with higher predicted HRI. These associations may reflect differences in sky openness, vegetation conditions, built-form configuration, and proximity to blue spaces. Related evidence further suggests that the relative contributions of natural, social, and urban-form factors to urban thermal conditions may vary under different meteorological conditions, highlighting the context dependence of relationships between urban morphology and the thermal environment [74]. Greater sky openness and vegetation may support air exchange, shading, evapotranspiration, and surface-heat regulation, whereas larger blocks and taller buildings may correspond to more continuous built-up fabric and greater spatial enclosure. Similarly, greater distance from water bodies may indicate weaker proximity to the potential cooling influence of blue spaces. Accordingly, intra-urban variation in HRI is associated not only with LCZ type but also with specific urban morphological characteristics and their spatial combinations [75]. Together with the LCZ comparison, these findings suggest that LCZ-based typological differences and continuous morphological associations provide complementary perspectives on block-scale heat-risk heterogeneity. These results provide useful spatial evidence for identifying morphological characteristics that warrant attention in climate-resilient urban planning.
5.3. Implications for Climate-Resilient and Sustainable Urban Planning
This study identified high-risk areas and key urban morphological characteristics associated with HRI in Tianjin’s six central districts, providing a spatial basis for climate adaptation and sustainable urban regeneration. Rather than being concentrated exclusively in the urban core, high-risk blocks occurred mainly in peripheral transitional zones, where relatively high hazard and vulnerability coincided with comparatively limited adaptability. This pattern suggests that heat-risk planning should move beyond a conventional “centre-first” approach and adopt a risk-informed strategy that prioritises peripheral high-risk blocks while integrating physical interventions with the spatial allocation of healthcare, heat-relief, and other adaptation resources. Differentiated interventions should also account for variations in risk composition among LCZ types rather than relying on uniform planning responses.
First, building-form interventions should consider the combined and nonlinear associations of block area, building height, and sky view factor with HRI. Larger block areas and greater building heights were generally associated with higher HRI, whereas the association between sky view factor and HRI varied across its value range. These findings do not imply that reducing building height or maximising sky openness alone will necessarily reduce heat risk. Instead, regeneration in high-risk blocks should emphasise context-sensitive improvements in spatial permeability, including more articulated building massing, additional internal connections and public open spaces, and appropriate variation in building spacing and height. Such measures can be incorporated into block renewal to reduce excessive spatial enclosure while maintaining the functional requirements of high-density urban development.
Second, green-infrastructure strategies should focus not only on the amount of vegetation but also on its spatial continuity and effective distribution within high-risk blocks [76]. Higher NDVI was generally associated with lower HRI, although this relationship became more evident beyond a certain value range. This nonlinear pattern indicates that the potential contribution of vegetation to heat-risk mitigation may depend on its local configuration and level of provision rather than on isolated increases in greenery alone. Priority can therefore be given to continuous street-tree corridors, community-scale green networks, and shaded public spaces, together with stronger connections among pocket parks, residential green spaces, and public-activity areas [77]. Where substantial vegetation already exists, maintaining the continuity and integrity of green spaces should be considered during redevelopment to avoid further fragmentation.
Third, blue–green infrastructure should be more closely integrated with surrounding built-up areas. Greater distance from water bodies was generally associated with higher HRI, highlighting the potential planning relevance of improving spatial connections between built-up blocks and blue–green spaces. The Haihe River and its tributaries can therefore be considered as components of a broader climate-adaptation network by linking riparian green spaces with roadside open spaces, pedestrian routes, shaded public spaces, and public-activity nodes [78]. In high-density waterfront areas, planning should avoid excessive enclosure of waterfront spaces where feasible and improve connections between surrounding residential blocks and accessible waterfront or heat-relief spaces. Because the observed relationship between waterbody distance and HRI is associative rather than causal, these interventions should be adapted to local land-use, accessibility, and morphological conditions rather than interpreted as a universal distance-based planning threshold.
Finally, LCZ types should be considered together with HEVA risk composition when developing differentiated adaptation strategies. LCZ 1 and LCZ 2 exhibited relatively high exposure and vulnerability but also comparatively high adaptability; interventions in these areas should therefore focus on protecting heat-sensitive populations and maintaining the provision and effectiveness of emergency, healthcare, and heat-relief services during extreme-heat events. LCZ 5, which exhibited the highest overall HRI, should receive greater attention in block-scale regeneration through the combined improvement of building form, green-space networks, and public-service provision. By contrast, peripheral low-density blocks such as LCZ 6 showed relatively low hazard but limited adaptability, suggesting that improving the spatial coverage of healthcare and public cooling resources may be more relevant than intensive morphological intervention alone.
5.4. Limitations
This study has several limitations. First, hazard was assessed primarily using satellite-derived land surface temperature (LST). LST represents land-surface radiative temperature and does not fully correspond to near-surface air temperature or human-experienced heat exposure. Differences may arise across land-cover types, meteorological conditions, and observation times. Moreover, satellite imagery is acquired at specific overpass times and therefore cannot fully represent diurnal variation in the thermal environment or changes throughout prolonged heatwave events. Future research could integrate observations from ground-based weather stations, mobile monitoring systems, and urban sensors and incorporate human thermal comfort indices, such as the Universal Thermal Climate Index (UTCI) and Physiologically Equivalent Temperature (PET), to improve the physiological relevance of hazard assessment.
Second, the analysis covered a single period and a single-city case, limiting its ability to represent seasonal variation, diurnal differences, interannual variability, and the evolution of heat risk during prolonged heatwaves. Residents’ exposure patterns, public-service provision, and heat-adaptation behaviours may also vary between working and non-working days and across times of day. The identified heat-risk patterns and morphology-HRI associations therefore reflect the spatial relationships observed during the study period, and their applicability to other cities requires further validation. Future research could apply harmonised datasets to multiple cities across different climatic zones and development stages and incorporate multi-year, multi-season, and diurnal observations to assess the temporal stability of the identified risk patterns and associations. For the LCZ analysis, classification performance was assessed using the available validation subset, while block-level assignment followed the dominant-area rule. Future studies could further examine LCZ spatial transferability using geographically separated validation samples and assess the influence of mixed blocks using alternative dominance criteria.
Third, the HRI has not been externally validated against independent public health outcome data. Because block-level records of heat-related emergency department visits, hospitalisations, morbidity, and mortality are difficult to obtain, the correspondence between HRI and observed health outcomes could not be examined directly. Where such data are available, HRI could be compared with heat-related mortality, hospitalisation and emergency department visit rates, emergency-call records, or population health survey data to evaluate its external validity and public-health relevance. However, access to and use of individual-level or fine-scale spatial health data require appropriate ethical review, privacy safeguards, and data authorisation. Future work could integrate heat-risk indicators with health outcome data where these ethical and legal requirements are satisfied.
Fourth, the resulting HRI is influenced by the operationalisation of individual HEVA dimensions, as well as by the aggregation and weighting schemes used to construct the composite index. Age-specific population densities were used to represent the spatial concentration of heat-sensitive groups; however, these indicators also partly reflect overall population concentration and therefore differ from population proportions, which more directly describe relative demographic composition. Similarly, the adaptability indicators primarily represent the spatial provision of potential adaptive resources rather than residents’ effective access to them. For example, medical facility density does not account for population demand, service capacity, travel impedance, or cross-boundary healthcare use. The actual heat-relief function of these facilities may vary with opening hours, indoor environmental conditions, service capacity, and public accessibility. Alternative aggregation formulations and weighting strategies may also yield different HRI estimates and spatial patterns. CRITIC-based weighting considers statistical redundancy among indicators, while the interpretation of individual indicators remains dependent on their operational definitions. Future studies could compare density- and proportion-based demographic indicators, incorporate accessibility-based measures such as Ga2SFCA where appropriate data are available, and systematically examine the sensitivity of HRI to alternative aggregation and weighting schemes.
Finally, RF was used to identify nonlinear associations between urban morphological indicators and HRI, PDPs were used to characterise marginal associations, and SHAP was used to examine the direction of feature contributions and potential interaction patterns. These results represent modelled associations and do not imply causal effects. An additional interpretive consideration is that LST is incorporated into HRI through the hazard component. Therefore, part of the observed association between urban morphology and HRI may capture thermal-environment-related variation embedded in the composite index, which should be considered when interpreting feature importance. Beyond this hazard-related pathway, urban morphology may be linked to heat risk through multiple pathways, while factors omitted from the model, such as historical development, planning policies, residents’ activity patterns, and socioeconomic change, may jointly shape the observed associations between urban morphological characteristics and heat risk. Accordingly, the findings provide interpretable evidence on block-scale associations for identifying high-risk areas, supporting differentiated heat-risk management, and generating empirical insights and hypotheses for subsequent mechanism-oriented research. Identifying the causal effects of urban morphological change on heat risk would require longitudinal data, cross-city analyses, quasi-experimental designs, or spatial causal-inference methods. Future research could further examine the associations of urban morphology with hazard, exposure, vulnerability, and adaptability separately to clarify the pathways underlying the composite HRI.
6. Conclusions
This study developed an integrated block-scale framework for assessing urban heat risk across 1639 road-defined blocks in Tianjin’s six central districts. Multi-source geospatial, demographic, built-environment, socioeconomic, and public-service data were integrated within the Hazard–Exposure–Vulnerability–Adaptability (HEVA) framework to construct the heat-risk index (HRI). Local Climate Zone (LCZ) mapping, spatial autocorrelation analysis, and explainable machine learning were subsequently combined to characterise spatial risk patterns, differences among urban spatial types, and nonlinear associations between urban morphology and HRI.
HRI exhibited strong positive spatial autocorrelation (Moran’s I = 0.671) and a distinct core–periphery pattern, with higher-risk blocks concentrated mainly along the edge of the urban core and in peripheral transitional zones. These areas were generally characterised by higher hazard, medium-to-high vulnerability, and comparatively limited adaptive-resource provision. By contrast, although the urban core contained blocks with relatively high exposure and vulnerability, its concentration of healthcare, heat-relief, socioeconomic, and other public-service resources was reflected in higher adaptability scores, contributing to comparatively lower composite HRI values in some central blocks. This spatial contrast highlights the importance of considering not only physical heat exposure but also the uneven provision of resources that can support responses to extreme heat. LCZ-based comparisons further revealed substantial variation in HRI among urban spatial types. Built LCZs generally exhibited higher HRI than land-cover LCZs, with LCZ 5 (open mid-rise) showing the highest median HRI and LCZ G (water) the lowest.
Among the three evaluated machine-learning models, Random Forest showed the best overall test-set performance and remained the top-performing model under supplementary five-fold spatial block validation. The major feature-importance ordering was also preserved under spatial validation. Model interpretation showed that sky view factor, vegetation conditions, block area, building height, and distance to water bodies made the largest model-based contributions to predicted variation in HRI. Higher sky view factor and vegetation levels were generally associated with lower predicted HRI, whereas larger blocks, greater building heights, and greater distances from water bodies were associated with higher predicted HRI. PDP and SHAP analyses further characterised nonlinear marginal associations and context-dependent variation in feature contributions, indicating that the relationships between urban morphology and heat risk cannot be adequately represented by uniform or purely linear responses.
Overall, this study demonstrates the value of integrating HEVA risk composition, LCZ-based urban typologies, continuous urban morphological characteristics, and explainable machine learning to connect fine-scale heat-risk assessment with climate adaptation and sustainable urban planning. The results indicate that effective heat-risk management requires differentiated interventions that address both the physical characteristics of high-risk blocks and spatial disparities in adaptive-resource provision. Prioritising peripheral transitional zones, improving the provision and spatial coverage of healthcare and heat-relief resources, optimising building form, and strengthening green and blue–green infrastructure can help translate block-scale risk assessment into context-sensitive adaptation priorities. By linking risk identification with urban regeneration and resource allocation, the proposed framework provides a methodological and spatial basis for climate-resilient urban regeneration and more sustainable development in high-density cities.
Author Contributions
Conceptualization, Y.S. (Yuanyuan Sun), Y.Z. and Y.D.; methodology, Y.S. (Yuanyuan Sun), Y.Z. and Y.D.; software, Y.S. (Yuanyuan Sun), Y.Y. and K.W.; validation, Y.S. (Yuanyuan Sun), Y.Y., K.W. and Z.L.; formal analysis, Y.S. (Yuanyuan Sun) and Y.S. (Yuxiang Sun); investigation, Y.S. (Yuanyuan Sun), Y.Y., Y.S. (Yuxiang Sun) and Z.L.; resources, Y.Z., Y.D., J.S. (Junhua Shu) and J.S. (Jianghua Shen); data curation, Y.S. (Yuanyuan Sun), K.W. and Y.S. (Yuxiang Sun); writing—original draft preparation, Y.S. (Yuanyuan Sun); writing—review and editing, Y.S. (Yuanyuan Sun), Y.Z., Y.D. and Y.Y.; visualization, Y.S. (Yuanyuan Sun) and K.W.; supervision, Y.Z. and Y.D.; project administration, Y.Z., Y.D. and J.S. (Junhua Shu); funding acquisition, Y.Z., Y.D. and J.S. (Jianghua Shen). All authors have read and agreed to the published version of the manuscript.
Funding
This research was supported by the Major Project of Social Sciences of the Tianjin Municipal Education Commission, “Art and Design Empowering the Transformation of Vernacular Culture and High-Quality Rural Development” (Grant No. 2023JWZD34).
Institutional Review Board Statement
Not applicable.
Informed Consent Statement
Not applicable.
Data Availability Statement
Data are contained within the article. The data presented in this study can be requested from the authors.
Conflicts of Interest
The authors declare no conflicts of interest.
Appendix A
Figure A1.
Pearson correlations and variance inflation factors (VIFs) for the urban morphological indicators at the block scale. In the correlation matrix, the upper triangle presents the Pearson correlation coefficients and their significance levels, the lower triangle shows pairwise scatterplots with fitted regression lines, and the diagonal displays the distribution of each variable. Warm colours indicate positive correlations, whereas blue colours indicate negative correlations; greater colour intensity represents a stronger absolute correlation. Asterisks denote statistical significance: * p < 0.05, ** p < 0.01, and *** p < 0.001.
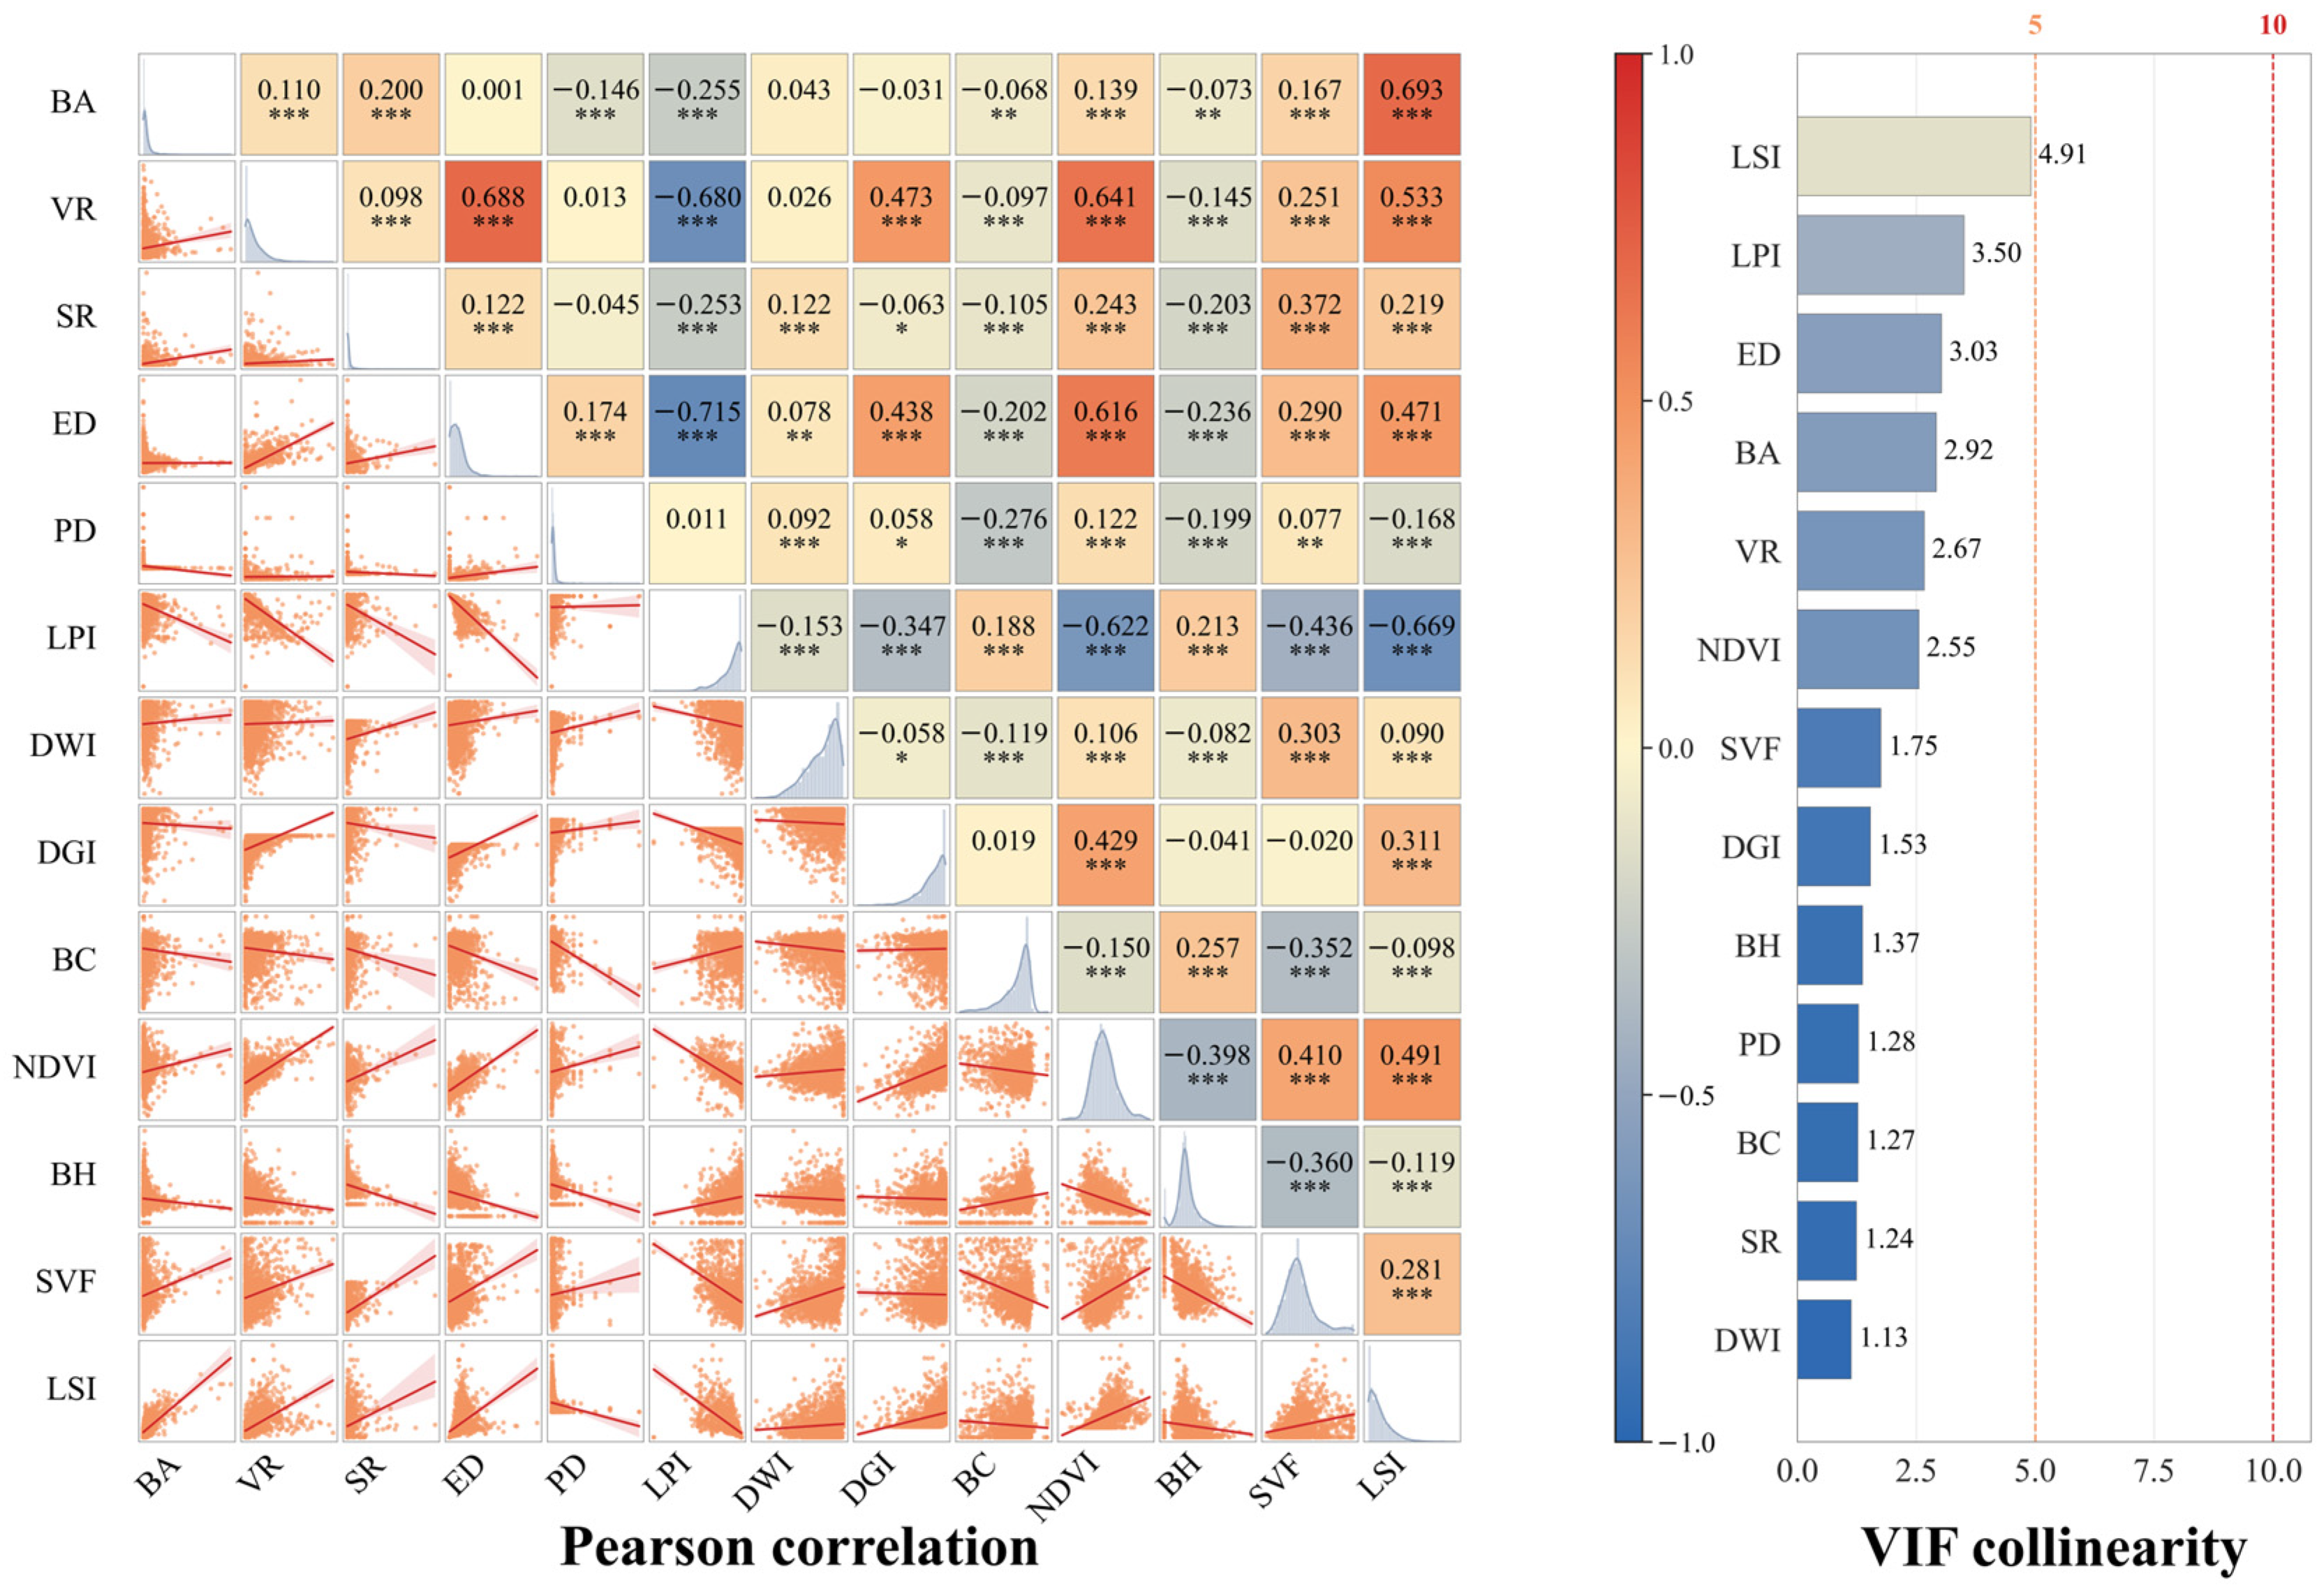
Appendix B
Figure A2.
Moran scatterplot of the heat-risk index (HRI). The x-axis represents standardised HRI, and the y-axis represents its spatial lag (Wz). The slope of the fitted line corresponds to Global Moran’s I. HRI exhibits significant positive spatial autocorrelation (Moran’s I = 0.671, p < 0.001), indicating marked spatial clustering at the block scale. The dashed horizontal and vertical lines denote zero and divide the plot into the four Moran quadrants.
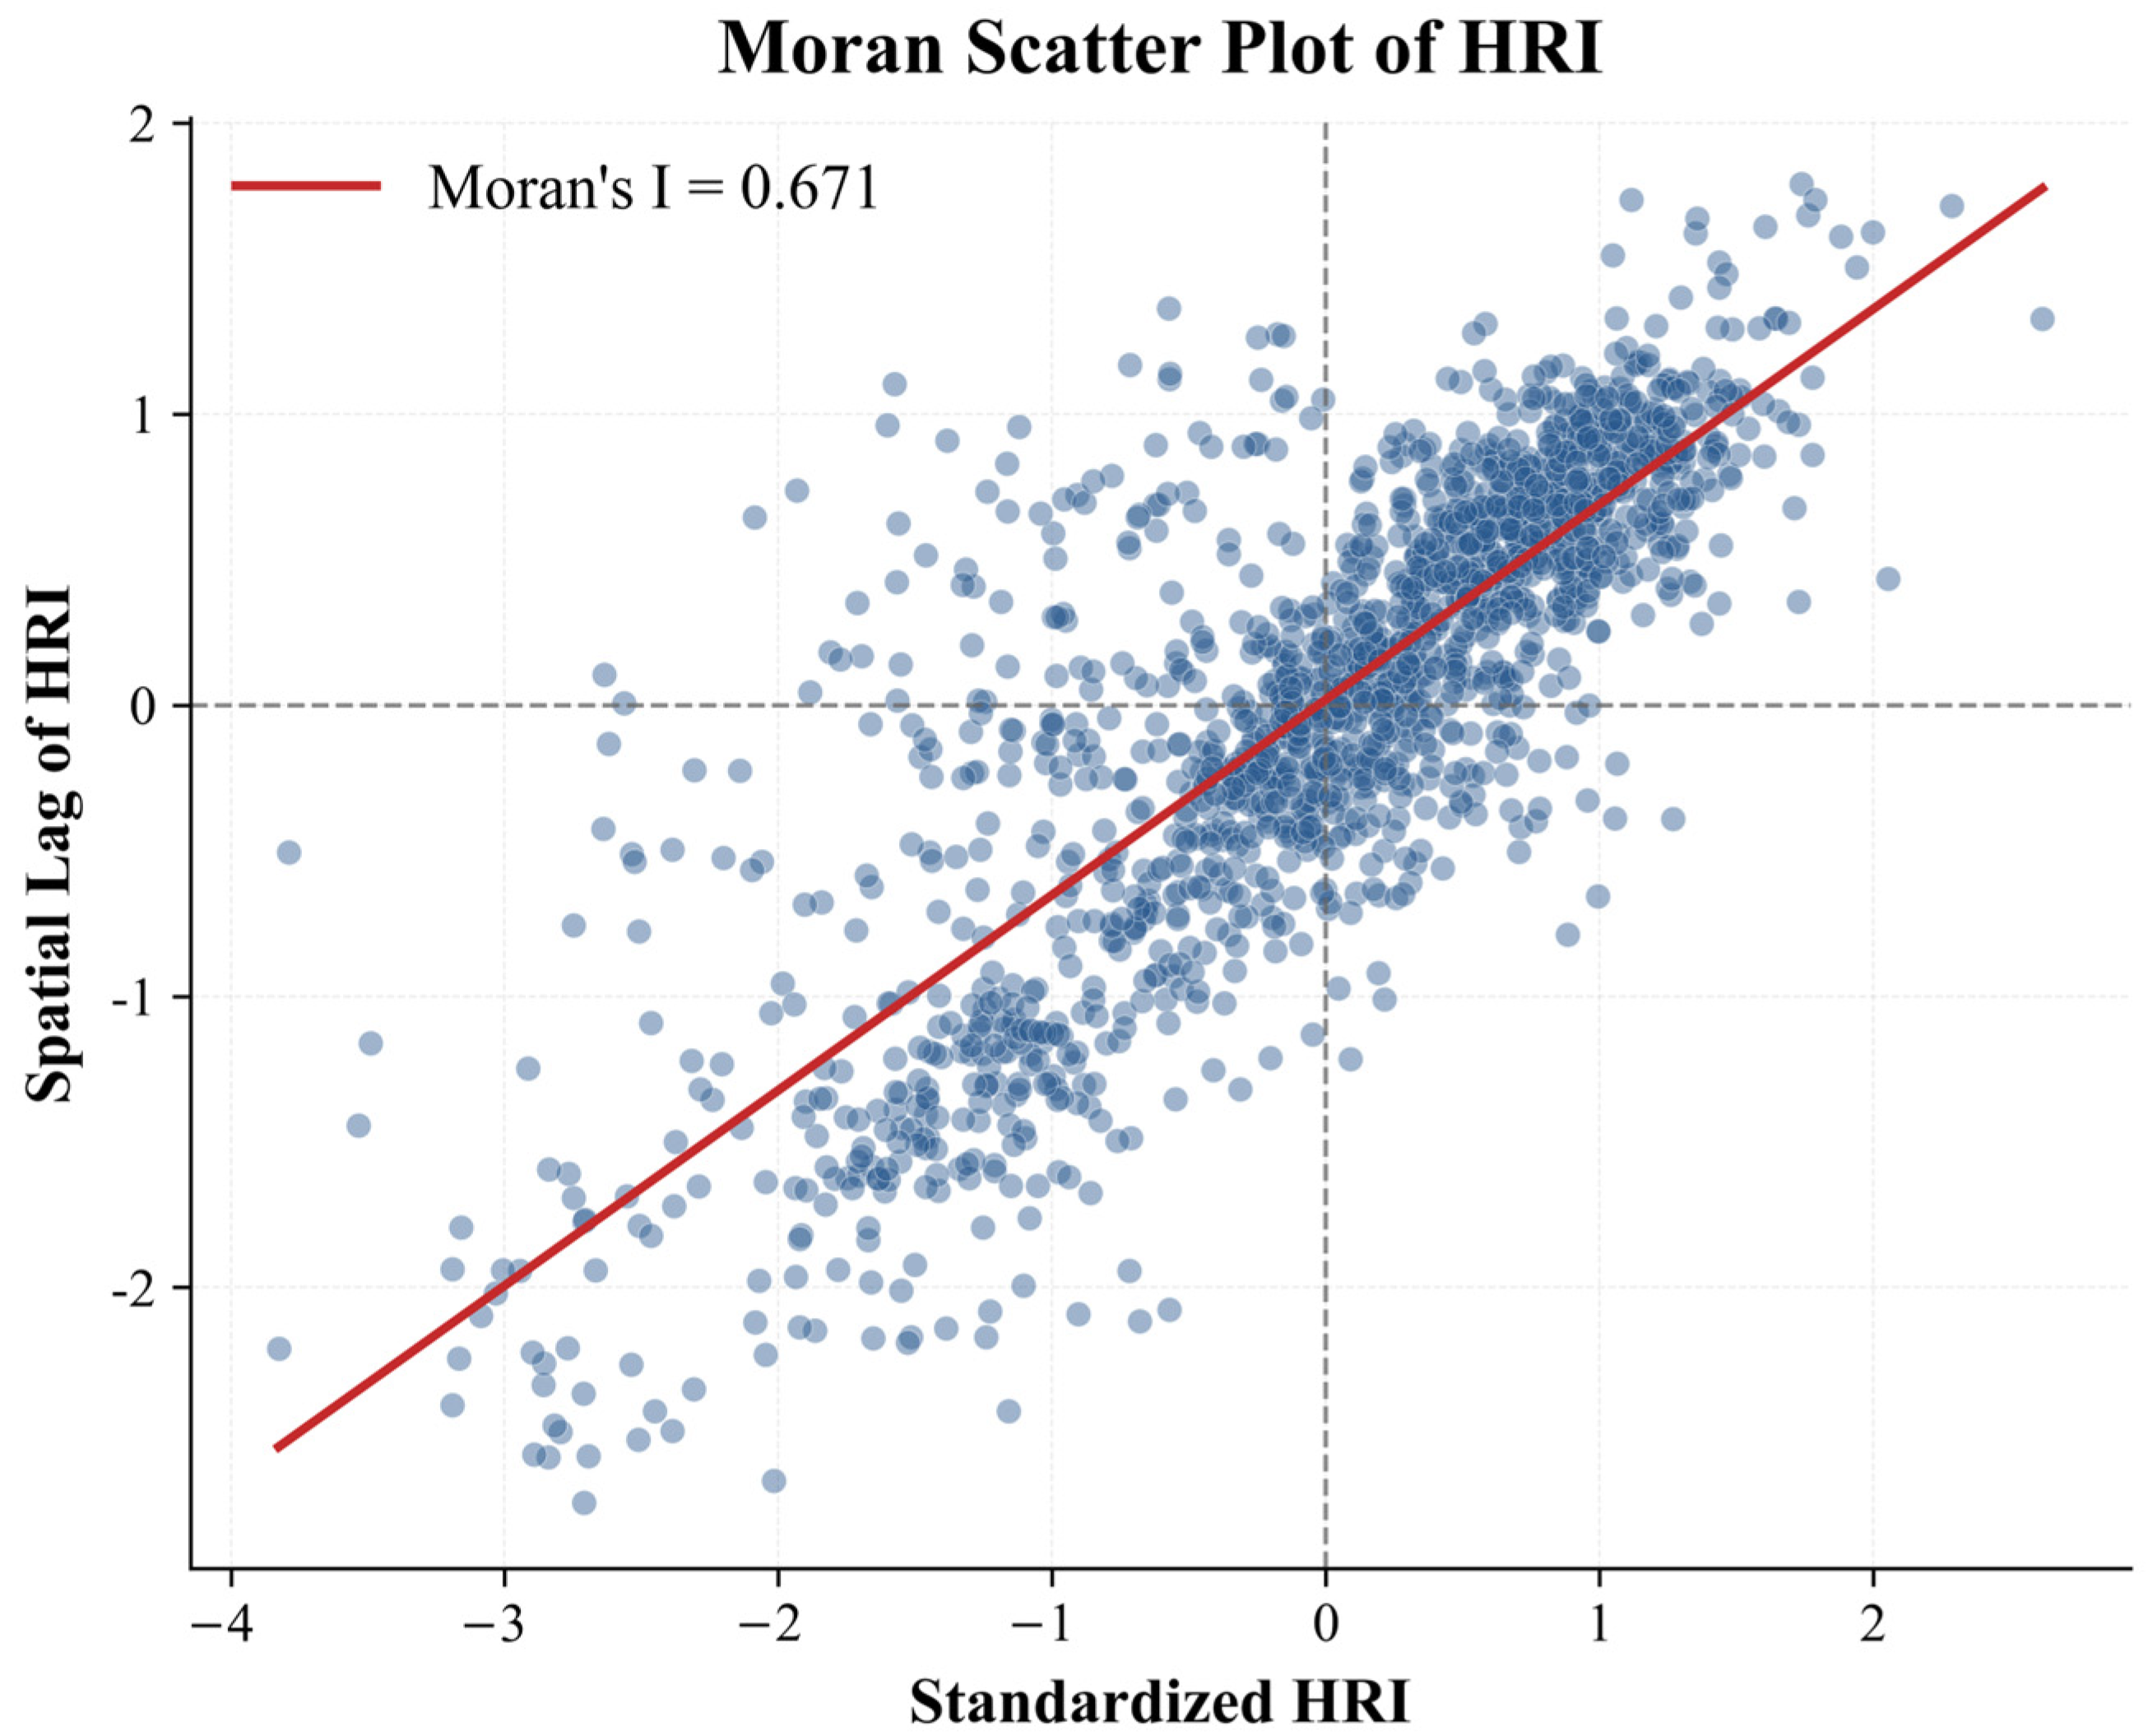
Appendix C
Figure A3.
Local Climate Zone (LCZ) types identified in the study area: eight built types (LCZ 1–6, LCZ 8, and LCZ 10) and three land-cover types (LCZ B, LCZ D, and LCZ G).
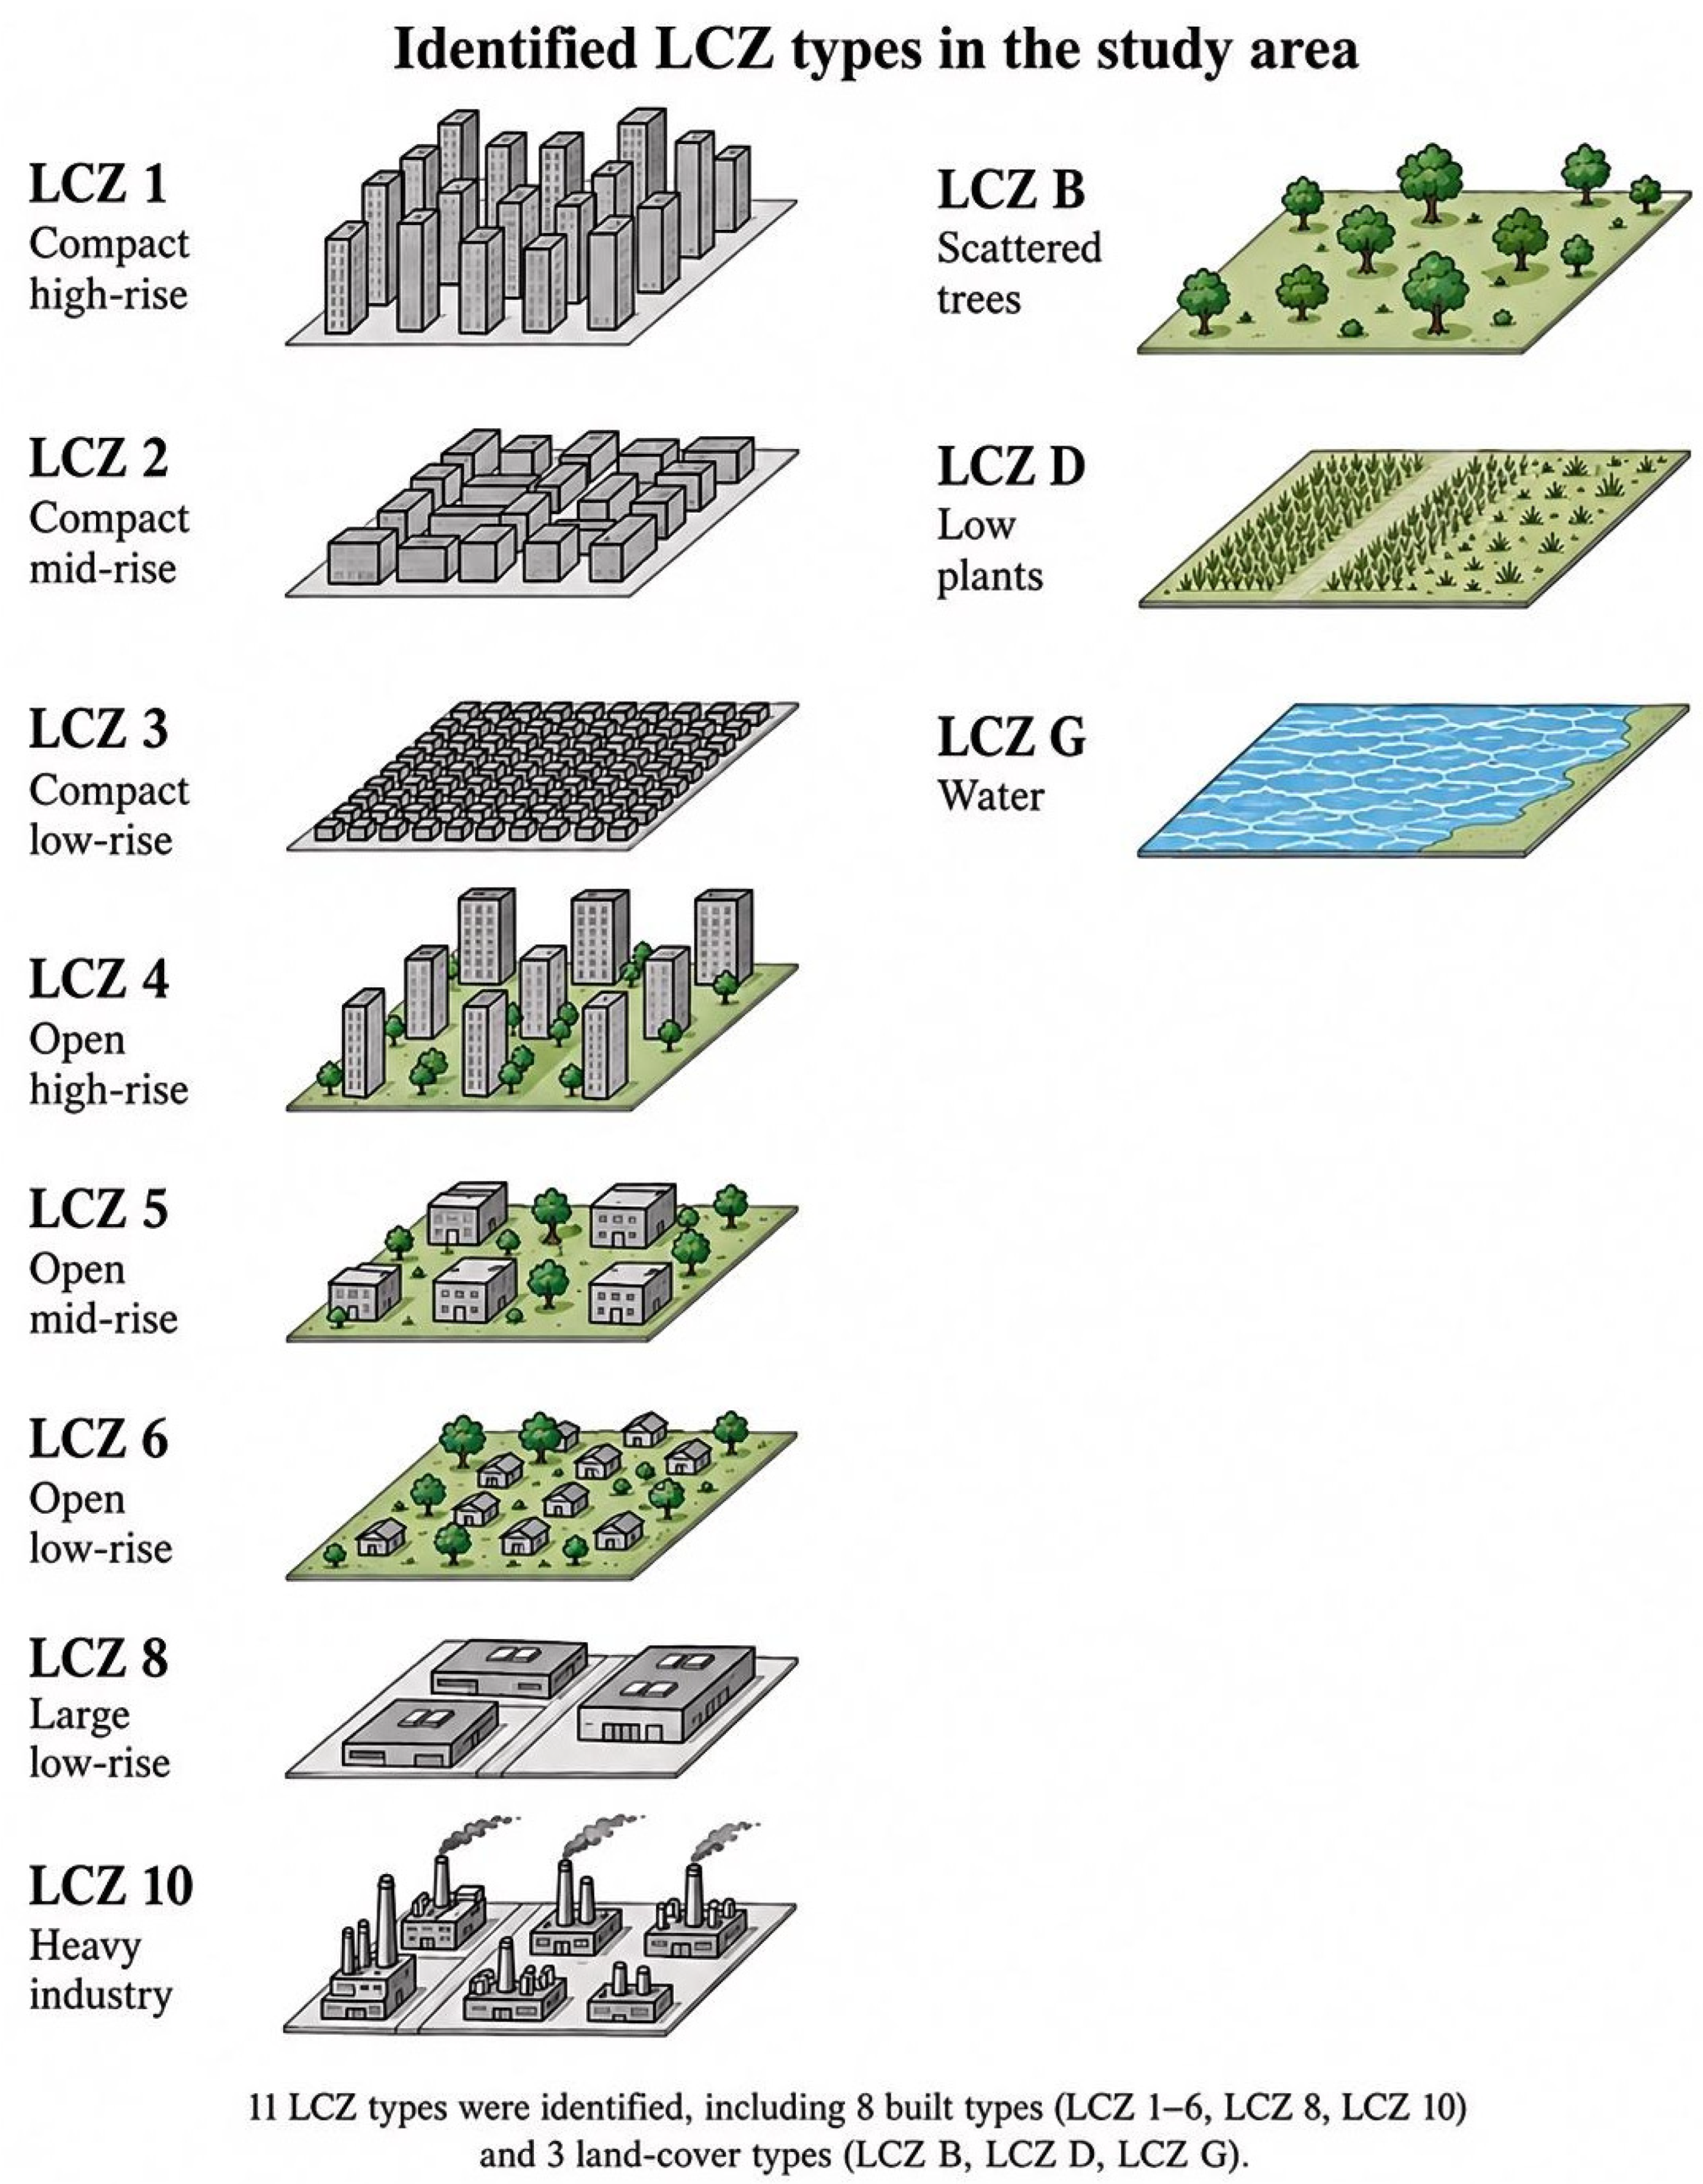
Appendix D
Table A1.
Class-specific reference sample sizes and validation performance of the Random Forest LCZ classifier.
Table A2.
Confusion matrix for validation of the Random Forest LCZ classification.
Appendix E
Table A3.
Predictive performance of the three machine-learning models under five-fold spatial block cross-validation.
References
- Lee, H.; Calvin, K.; Dasgupta, D.; Krinner, G.; Mukherji, A.; Thorne, P.; Trisos, C.; Romero, J.; Aldunce, P.; Barrett, K. Climate Change 2023: Synthesis Report. Contribution of Working Groups I, II and III to the Sixth Assessment Report of the Intergovernmental Panel on Climate Change; IPCC: Geneva, Switzerland, 2023. [Google Scholar]
- Romanello, M.; Walawender, M.; Hsu, S.-C.; Moskeland, A.; Palmeiro-Silva, Y.; Scamman, D.; Ali, Z.; Ameli, N.; Angelova, D.; Ayeb-Karlsson, S. The 2024 report of the Lancet Countdown on health and climate change: Facing record-breaking threats from delayed action. Lancet 2024, 404, 1847–1896. [Google Scholar] [CrossRef] [Scilit] [PubMed]
- World Meteorological Organisation. State of the Global Climate 2025; World Meteorological Organisation: Geneva, Switzerland, 2026. [Google Scholar]
- Qi, Z.; Yu, G.; Ye, T.; Gasparrini, A.; Tong, S.; Overctnco, A. Global, regional, and national burden of mortality associated with non-optimal ambient temperatures from 2000 to 2019: A three-stage modelling study. Lancet Planet. Health 2021, 5, e415–e425. [Google Scholar] [CrossRef] [Scilit] [PubMed]
- Cai, W.; Zhang, C.; Zhang, S.; Bai, Y.; Chen, B.; Chen, J.; Cheng, L.; Fan, W.; Feng, L.; Guan, D.; et al. The 2025 China report of the Lancet Countdown on health and climate change: Empowering cities for synergistic action. Lancet Public Health 2025, 10, e1066–e1085. [Google Scholar] [CrossRef] [Scilit] [PubMed]
- Yang, J.; Yang, Y.; Sun, D.; Jin, C.; Xiao, X. Influence of urban morphological characteristics on thermal environment. Sustain. Cities Soc. 2021, 72, 103045. [Google Scholar] [CrossRef] [Scilit]
- Banerjee, S.; Ching, N.Y.G.; Yik, S.K.; Dzyuban, Y.; Crank, P.J.; Pek Xin Yi, R.; Chow, W.T.L. Analysing impacts of urban morphological variables and density on outdoor microclimate for tropical cities: A review and a framework proposal for future research directions. Build. Environ. 2022, 225, 109646. [Google Scholar] [CrossRef] [Scilit]
- Wu, W.-B.; Yu, Z.-W.; Ma, J.; Zhao, B. Quantifying the influence of 2D and 3D urban morphology on the thermal environment across climatic zones. Landsc. Urban Plan. 2022, 226, 104499. [Google Scholar] [CrossRef] [Scilit]
- Stewart, I.D.; Oke, T.R. Local Climate Zones for Urban Temperature Studies. Bull. Am. Meteorol. Soc. 2012, 93, 1879–1900. [Google Scholar] [CrossRef] [Scilit]
- Crichton, D. The risk triangle. In Natural Disaster Management; Ingleton, J., Ed.; Tudor Rose: London, UK, 1999. [Google Scholar]
- Su, X.; Wang, F.; Zhou, D.; Zhang, H. Heat Health Risk and Adaptability Assessments at the Subdistrict Scale in Metropolitan Beijing. Int. J. Disaster Risk Sci. 2022, 13, 987–1003. [Google Scholar] [CrossRef] [Scilit]
- Xiang, Y.; Yuan, C.; Cen, Q.; Huang, C.; Wu, C.; Teng, M.; Zhou, Z. Heat risk assessment and response to green infrastructure based on local climate zones. Build. Environ. 2024, 248, 111040. [Google Scholar] [CrossRef] [Scilit]
- Thanvisitthpon, N. Statistically Validated Urban Heat Island Risk Indicators for UHI Susceptibility Assessment. Int. J. Environ. Res. Public Health 2023, 20, 1172. [Google Scholar] [CrossRef] [Scilit] [PubMed]
- Ye, J.; Yang, F. Towards multi-scale and context-specific heat health risk assessment—A systematic review. Sustain. Cities Soc. 2025, 119, 106102. [Google Scholar] [CrossRef] [Scilit]
- Tuholske, C.; Caylor, K.; Funk, C.; Verdin, A.; Sweeney, S.; Grace, K.; Peterson, P.; Evans, T. Global urban population exposure to extreme heat. Proc. Natl. Acad. Sci. USA 2021, 118, e2024792118. [Google Scholar] [CrossRef] [Scilit] [PubMed]
- Huang, X.; Li, Y.; Guo, Y.; Zheng, D.; Qi, M. Assessing Urban Risk to Extreme Heat in China. Sustainability 2020, 12, 2750. [Google Scholar] [CrossRef] [Scilit]
- Guo, J.; Lu, L.; Zha, F.; Agathangelidis, I.; Yao, Y.; Li, Q.; Shen, Q.; Li, Z. A grid-scale assessment framework for heat health risks: A case study of the Beijing-Tianjin-Hebei Region, China. Clim. Serv. 2025, 40, 100603. [Google Scholar] [CrossRef] [Scilit]
- Cresswell, K. A Florida urban heat risk index: Assessing weighting and aggregation approaches. Urban Clim. 2023, 51, 101646. [Google Scholar] [CrossRef] [Scilit]
- Guo, F.; Zheng, R.; Zhao, J.; Zhang, H.; Dong, J. Framework of street grid-based urban heat vulnerability assessment: Integrating entropy weight method and BPNN model. Urban Clim. 2024, 56, 102067. [Google Scholar] [CrossRef] [Scilit]
- Zhang, J.; Li, Z.; Hu, D. Effects of urban morphology on thermal comfort at the micro-scale. Sustain. Cities Soc. 2022, 86, 104150. [Google Scholar] [CrossRef] [Scilit]
- Han, J.; Mo, N.; Cai, J.; Ouyang, L.; Liu, Z. Advancing the local climate zones framework: A critical review of methodological progress, persisting challenges, and future research prospects. Humanit. Soc. Sci. Commun. 2024, 11, 538. [Google Scholar] [CrossRef] [Scilit]
- Zhou, Y.; Zhang, G.; Jiang, L.; Chen, X.; Xie, T.; Wei, Y.; Xu, L.; Pan, Z.; An, P.; Lun, F. Mapping local climate zones and their associated heat risk issues in Beijing: Based on open data. Sustain. Cities Soc. 2021, 74, 103174. [Google Scholar] [CrossRef] [Scilit]
- Ma, L.; Huang, G.; Johnson, B.A.; Chen, Z.; Li, M.; Yan, Z.; Zhan, W.; Lu, H.; He, W.; Lian, D. Investigating urban heat-related health risks based on local climate zones: A case study of Changzhou in China. Sustain. Cities Soc. 2023, 91, 104402. [Google Scholar] [CrossRef] [Scilit]
- Zhou, L.; Yuan, B.; Hu, F.; Wei, C.; Dang, X.; Sun, D. Understanding the effects of 2D/3D urban morphology on land surface temperature based on local climate zones. Build. Environ. 2022, 208, 108578. [Google Scholar] [CrossRef] [Scilit]
- Li, B.; Zhang, B.; Yin, L.; Chang, J. Assessing heat risk for residents of complex urban areas from an accessibility-based perspective. Sustain. Cities Soc. 2023, 88, 104278. [Google Scholar] [CrossRef] [Scilit]
- Zou, B.; Fan, C.; Li, J. Quantifying the Influence of Different Block Types on the Urban Heat Risk in High-Density Cities. Buildings 2024, 14, 2131. [Google Scholar] [CrossRef] [Scilit]
- Zhang, Y.; Wu, J.; Zhong, K.; Zhou, S.; Yuan, Y.; Wang, Q.; Liu, Y. Influence of Urban Morphological Characteristics on Street-Level Urban Heat Risk: A Geographically Weighted Machine Learning Approach. Buildings 2026, 16, 725. [Google Scholar] [CrossRef] [Scilit]
- Zeng, S.; Zhang, J.; Tian, J. Analysis and Optimization of Thermal Environment in Old Urban Areas from the Perspective of “Function-Form” Differentiation. Sustainability 2023, 15, 6172. [Google Scholar] [CrossRef] [Scilit]
- Zhang, J.; Zeng, S.; Shi, W.; Namaiti, A.; Song, Y.; Tian, J.; Ji, D. Identifying urban morphological archetypes using k-means to analyze spatial heterogeneity of the urban thermal environment. City Environ. Interact. 2026, 30, 100356. [Google Scholar] [CrossRef] [Scilit]
- Gao, Y.; Zhao, J.; Han, L. Exploring the spatial heterogeneity of urban heat island effect and its relationship to block morphology with the geographically weighted regression model. Sustain. Cities Soc. 2022, 76, 103431. [Google Scholar] [CrossRef] [Scilit]
- Oukawa, G.Y.; Krecl, P.; Targino, A.C. Fine-scale modeling of the urban heat island: A comparison of multiple linear regression and random forest approaches. Sci. Total Environ. 2022, 815, 152836. [Google Scholar] [CrossRef] [Scilit] [PubMed]
- He, J.; Shi, Y.; Xu, L.; Lu, Z.; Feng, M.; Tang, J.; Guo, X. Exploring the scale effect of urban thermal environment through XGBoost model. Sustain. Cities Soc. 2024, 114, 105763. [Google Scholar] [CrossRef] [Scilit]
- Hong, T.; Yim, S.H.L.; Heo, Y. Interpreting complex relationships between urban and meteorological factors and street-level urban heat islands: Application of random forest and SHAP method. Sustain. Cities Soc. 2025, 126, 106353. [Google Scholar] [CrossRef] [Scilit]
- Breiman, L. Random Forests. Mach. Learn. 2001, 45, 5–32. [Google Scholar] [CrossRef] [Scilit]
- Beck, H.E.; Zimmermann, N.E.; McVicar, T.R.; Vergopolan, N.; Berg, A.; Wood, E.F. Present and future Köppen-Geiger climate classification maps at 1-km resolution. Sci. Data 2018, 5, 180214, Correction in Sci. Data 2020, 7, 274. [Google Scholar] [CrossRef] [Scilit] [PubMed]
- Climate-Data.org. Climate: Tianjin. Available online: https://en.climate-data.org/asia/china/tianjin/tianjin-2606/ (accessed on 28 July 2026).
- Dai, Y.; Liu, T. Spatiotemporal mechanism of urban heat island effects on human health—Evidence from Tianjin city of China. Front. Ecol. Evol. 2022, 10, 1010400. [Google Scholar] [CrossRef] [Scilit]
- Tianjin Municipal Bureau of Statistics Survey Office of the National Bureau of Statistics in Tianjin. Tianjin Statistical Yearbook 2024; China Statistics Press: Beijing, China, 2024. [Google Scholar]
- Roy, D.P.; Wulder, M.A.; Loveland, T.R.; Woodcock, C.E.; Allen, R.G.; Anderson, M.C.; Helder, D.; Irons, J.R.; Johnson, D.M.; Kennedy, R.; et al. Landsat-8: Science and product vision for terrestrial global change research. Remote Sens. Environ. 2014, 145, 154–172. [Google Scholar] [CrossRef] [Scilit]
- Gorelick, N.; Hancher, M.; Dixon, M.; Ilyushchenko, S.; Thau, D.; Moore, R. Google Earth Engine: Planetary-scale geospatial analysis for everyone. Remote Sens. Environ. 2017, 202, 18–27. [Google Scholar] [CrossRef] [Scilit]
- Dong, J.; Zhou, Y.; You, N.; Cheng, C. 2000–2022 China 30 m Annual Maximum NDVI Dataset [Data Set]; National Ecosystem Science Data Center: Beijing, China, 2021. [Google Scholar] [CrossRef]
- Zanaga, D.; Van De Kerchove, R.; De Keersmaecker, W.; Souverijns, N.; Brockmann, C.; Quast, R.; Wevers, J.; Grosu, A.; Paccini, A.; Vergnaud, S. ESA WorldCover 10 m 2020 v100; ESA: Paris, France, 2021. [Google Scholar] [CrossRef]
- Bondarenko, M.; Kerr, D.; Sorichetta, A.; Tatem, A.J. Census/Projection-Disaggregated Gridded Population Datasets, Adjusted to Match the Corresponding UNPD 2020 Estimates, for 183 Countries in 2020 Using Built-Settlement Growth Model Outputs; University of Southampton: Southampton, UK, 2020. [Google Scholar]
- Bondarenko, M.; Kerr, D.; Sorichetta, A.; Tatem, A.J. Estimates of the Total Number of People per Grid Square in 2020, Adjusted to Match the Corresponding UNPD 2020 Estimates and Broken Down by Gender and Age Groupings, Produced Using Built-Settlement Growth Model Outputs; University of Southampton: Southampton, UK, 2020. [Google Scholar]
- Haklay, M.; Weber, P. OpenStreetMap: User-Generated Street Maps. IEEE Pervasive Comput. 2008, 7, 12–18. [Google Scholar] [CrossRef] [Scilit]
- Che, Y.; Li, X.; Liu, X.; Wang, Y.; Liao, W.; Zheng, X.; Zhang, X.; Xu, X.; Shi, Q.; Zhu, J. 3D-GloBFP: The first global three-dimensional building footprint dataset. Earth Syst. Sci. Data 2024, 16, 5357–5374. [Google Scholar] [CrossRef] [Scilit]
- Zhang, Y.; Zhao, H.; Long, Y. CMAB: A Multi-Attribute Building Dataset of China. Sci. Data 2025, 12, 430. [Google Scholar] [CrossRef] [Scilit] [PubMed]
- Xu, X. China GDP Spatial Distribution Kilometre Grid Dataset; NODA: Beijing, China, 2017. [Google Scholar]
- Yao, Y.; Lu, L.; Guo, J.; Zhang, S.; Cheng, J.; Tariq, A.; Liang, D.; Hu, Y.; Li, Q. Spatially Explicit Assessments of Heat-Related Health Risks: A Literature Review. Remote Sens. 2024, 16, 4500. [Google Scholar] [CrossRef] [Scilit]
- Intergovernmental Panel on Climate Change. Climate Change 2022: Impacts, Adaptation and Vulnerability. Contribution of Working Group II to the Sixth Assessment Report of the Intergovernmental Panel on Climate Change; Cambridge University Press: Cambridge, UK; New York, NY, USA, 2022. [Google Scholar]
- Dong, J.; Peng, J.; He, X.; Corcoran, J.; Qiu, S.; Wang, X. Heatwave-induced human health risk assessment in megacities based on heat stress-social vulnerability-human exposure framework. Landsc. Urban Plan. 2020, 203, 103907. [Google Scholar] [CrossRef] [Scilit]
- Estoque, R.C.; Ooba, M.; Seposo, X.T.; Togawa, T.; Hijioka, Y.; Takahashi, K.; Nakamura, S. Heat health risk assessment in Philippine cities using remotely sensed data and social-ecological indicators. Nat. Commun. 2020, 11, 1581. [Google Scholar] [CrossRef] [Scilit] [PubMed]
- Qian, Y.; Liu, T. Heat vulnerability assessment: A systematic review of critical metrics. Hyg. Environ. Health Adv. 2025, 15, 100138. [Google Scholar] [CrossRef] [Scilit]
- Zhang, H.; Gao, J.; Zhao, J.; Guo, F.; Bai, J.; Wang, Z.; Zhu, P. Applicability of local climate zones in assessing urban heat risk—A survey of coastal city. Cities 2025, 164, 106068. [Google Scholar] [CrossRef] [Scilit]
- Rathi, S.K.; Chakraborty, S.; Mishra, S.K.; Dutta, A.; Nanda, L. A Heat Vulnerability Index: Spatial Patterns of Exposure, Sensitivity and Adaptive Capacity for Urbanites of Four Cities of India. Int. J. Environ. Res. Public Health 2022, 19, 283. [Google Scholar] [CrossRef] [Scilit] [PubMed]
- Namaiti, A.; Zeng, S. Framework for evaluating and optimizing of supply-demand matching between medical services and heat health risks: A case study of Zhongshan, China. Sustain. Cities Soc. 2025, 131, 106760. [Google Scholar] [CrossRef] [Scilit]
- Guo, R.; Guo, F.; Dong, J.; Wang, Z.; Zheng, R.; Zhang, H. Finer-scale urban health risk assessment based on the interaction perspective of thermal radiation, human, activity, and space. Front. Archit. Res. 2024, 13, 682–697. [Google Scholar] [CrossRef] [Scilit]
- Ren, Z.; Chen, H.; Sheng, S.; Wang, H.; Zhang, J.; Lu, M. Mapping Multi-Temporal Heat Risks Within the Local Climate Zone Framework: A Case Study of Jinan’s Main Urban Area, China. Buildings 2025, 15, 3619. [Google Scholar] [CrossRef] [Scilit]
- Cheng, W.; Li, D.; Liu, Z.; Brown, R.D. Approaches for identifying heat-vulnerable populations and locations: A systematic review. Sci. Total Environ. 2021, 799, 149417. [Google Scholar] [CrossRef] [Scilit] [PubMed]
- Cui, Y.; Xie, X.; Liu, Y. Social media and mobility landscape: Uncovering spatial patterns of urban human mobility with multi source data. Front. Environ. Sci. Eng. 2018, 12, 7. [Google Scholar] [CrossRef] [Scilit]
- Levin, N.; Kyba, C.C.M.; Zhang, Q.; Sánchez de Miguel, A.; Román, M.O.; Li, X.; Portnov, B.A.; Molthan, A.L.; Jechow, A.; Miller, S.D.; et al. Remote sensing of night lights: A review and an outlook for the future. Remote Sens. Environ. 2020, 237, 111443. [Google Scholar] [CrossRef] [Scilit]
- Zhu, Q.; Liu, T.; Lin, H.; Xiao, J.; Luo, Y.; Zeng, W.; Zeng, S.; Wei, Y.; Chu, C.; Baum, S.; et al. The spatial distribution of health vulnerability to heat waves in Guangdong Province, China. Glob. Health Action 2014, 7, 25051. [Google Scholar] [CrossRef] [Scilit] [PubMed]
- Cai, Z.; Tang, Y.; Chen, K.; Han, G. Assessing the Heat Vulnerability of Different Local Climate Zones in the Old Areas of a Chinese Megacity. Sustainability 2019, 11, 2032. [Google Scholar] [CrossRef] [Scilit]
- Diakoulaki, D.; Mavrotas, G.; Papayannakis, L. Determining objective weights in multiple criteria problems: The critic method. Comput. Oper. Res. 1995, 22, 763–770. [Google Scholar] [CrossRef] [Scilit]
- Demuzere, M.; Kittner, J.; Martilli, A.; Mills, G.; Moede, C.; Stewart, I.D.; van Vliet, J.; Bechtel, B. A global map of local climate zones to support earth system modelling and urban-scale environmental science. Earth Syst. Sci. Data 2022, 14, 3835–3873. [Google Scholar] [CrossRef] [Scilit]
- Cui, S.; Wang, X.; Yang, X.; Hu, L.; Jiang, Z.; Feng, Z. Mapping Local Climate Zones in the Urban Environment: The Optimal Combination of Data Source and Classifier. Sensors 2022, 22, 6407. [Google Scholar] [CrossRef] [Scilit] [PubMed]
- Namaiti, A.; Zeng, S.; He, W.; Liu, X.; Zeng, J. Exploring diurnal spatiotemporal heterogeneity in urban heat exposure: A novel perspective from urban form-function coupling. Sustain. Cities Soc. 2026, 138, 107161. [Google Scholar] [CrossRef] [Scilit]
- Lundberg, S.M.; Erion, G.; Chen, H.; DeGrave, A.; Prutkin, J.M.; Nair, B.; Katz, R.; Himmelfarb, J.; Bansal, N.; Lee, S.-I. From Local Explanations to Global Understanding with Explainable AI for Trees. Nat. Mach. Intell. 2020, 2, 56–67. [Google Scholar] [CrossRef] [Scilit] [PubMed]
- Tomlinson, C.J.; Chapman, L.; Thornes, J.E.; Baker, C.J. Incorporating the urban heat island into spatial heat health risk assessment strategies: A case study for Birmingham, UK. Int. J. Health Geogr. 2011, 10, 42. [Google Scholar] [CrossRef] [Scilit] [PubMed]
- Xu, H.; Yang, J.; Lin, Y.; Xu, N.; Li, M.; Xu, Y.; Liu, X.; Li, F. Construction of a composite cooling network for the mitigation of urban heat risk in Fuzhou. Front. Environ. Sci. 2024, 12, 1462700. [Google Scholar] [CrossRef] [Scilit]
- Yang, L.; Yang, C.; Zhou, W.; Chen, X.; Wang, C.; Liu, L. Mapping the Spatial and Seasonal Details of Heat Health Risks in Different Local Climate Zones: A Case Study of Shanghai, China. Remote Sens. 2024, 16, 3513. [Google Scholar] [CrossRef] [Scilit]
- Elmarakby, E.; Elkadi, H. Prioritising urban heat island mitigation interventions: Mapping a heat risk index. Sci. Total Environ. 2024, 948, 174927. [Google Scholar] [CrossRef] [Scilit] [PubMed]
- Song, S.; Shang, Y.; Wang, L.; Liu, Q.; Zhao, Y. Heat health risk assessment and identification of priority control areas in residential communities of Shijiazhuang. Front. Public Health 2025, 13, 1624477. [Google Scholar] [CrossRef] [Scilit] [PubMed]
- Wang, S.; Zeng, S.; Lu, J.; Namaiti, A.; Zeng, J. Exploring the spatial response of regional heat islands to natural-social factors: A study of extreme heat and normal weather. Reg. Environ. Change 2026, 26, 52. [Google Scholar] [CrossRef] [Scilit]
- Liu, Y.; Zhang, W.; Liu, W.; Tan, Z.; Hu, S.; Ao, Z.; Li, J.; Xing, H. Exploring the seasonal effects of urban morphology on land surface temperature in urban functional zones. Sustain. Cities Soc. 2024, 103, 105268. [Google Scholar] [CrossRef] [Scilit]
- Li, Y.; Svenning, J.-C.; Zhou, W.; Zhu, K.; Abrams, J.F.; Lenton, T.M.; Ripple, W.J.; Yu, Z.; Teng, S.N.; Dunn, R.R.; et al. Green spaces provide substantial but unequal urban cooling globally. Nat. Commun. 2024, 15, 7108. [Google Scholar] [CrossRef] [Scilit] [PubMed]
- Galalizadeh, S.; Morrison-Saunders, A.; Horwitz, P.; Silberstein, R.; Blake, D. The cooling impact of urban greening: A systematic review of methodologies and data sources. Urban For. Urban Green. 2024, 95, 128157. [Google Scholar] [CrossRef] [Scilit]
- Han, M.; Zhang, T.; Si, Z. Optimizing urban blue-green space in climate adaptive planning: A systematic review of threshold value of efficiency thresholds. Landsc. Ecol. 2025, 40, 13. [Google Scholar] [CrossRef] [Scilit]
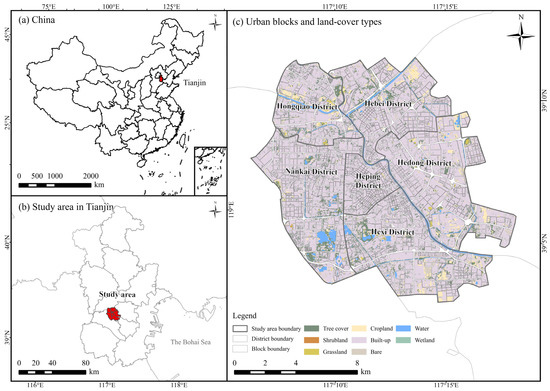
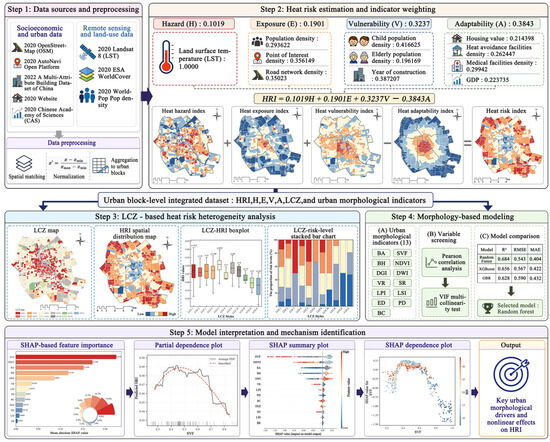
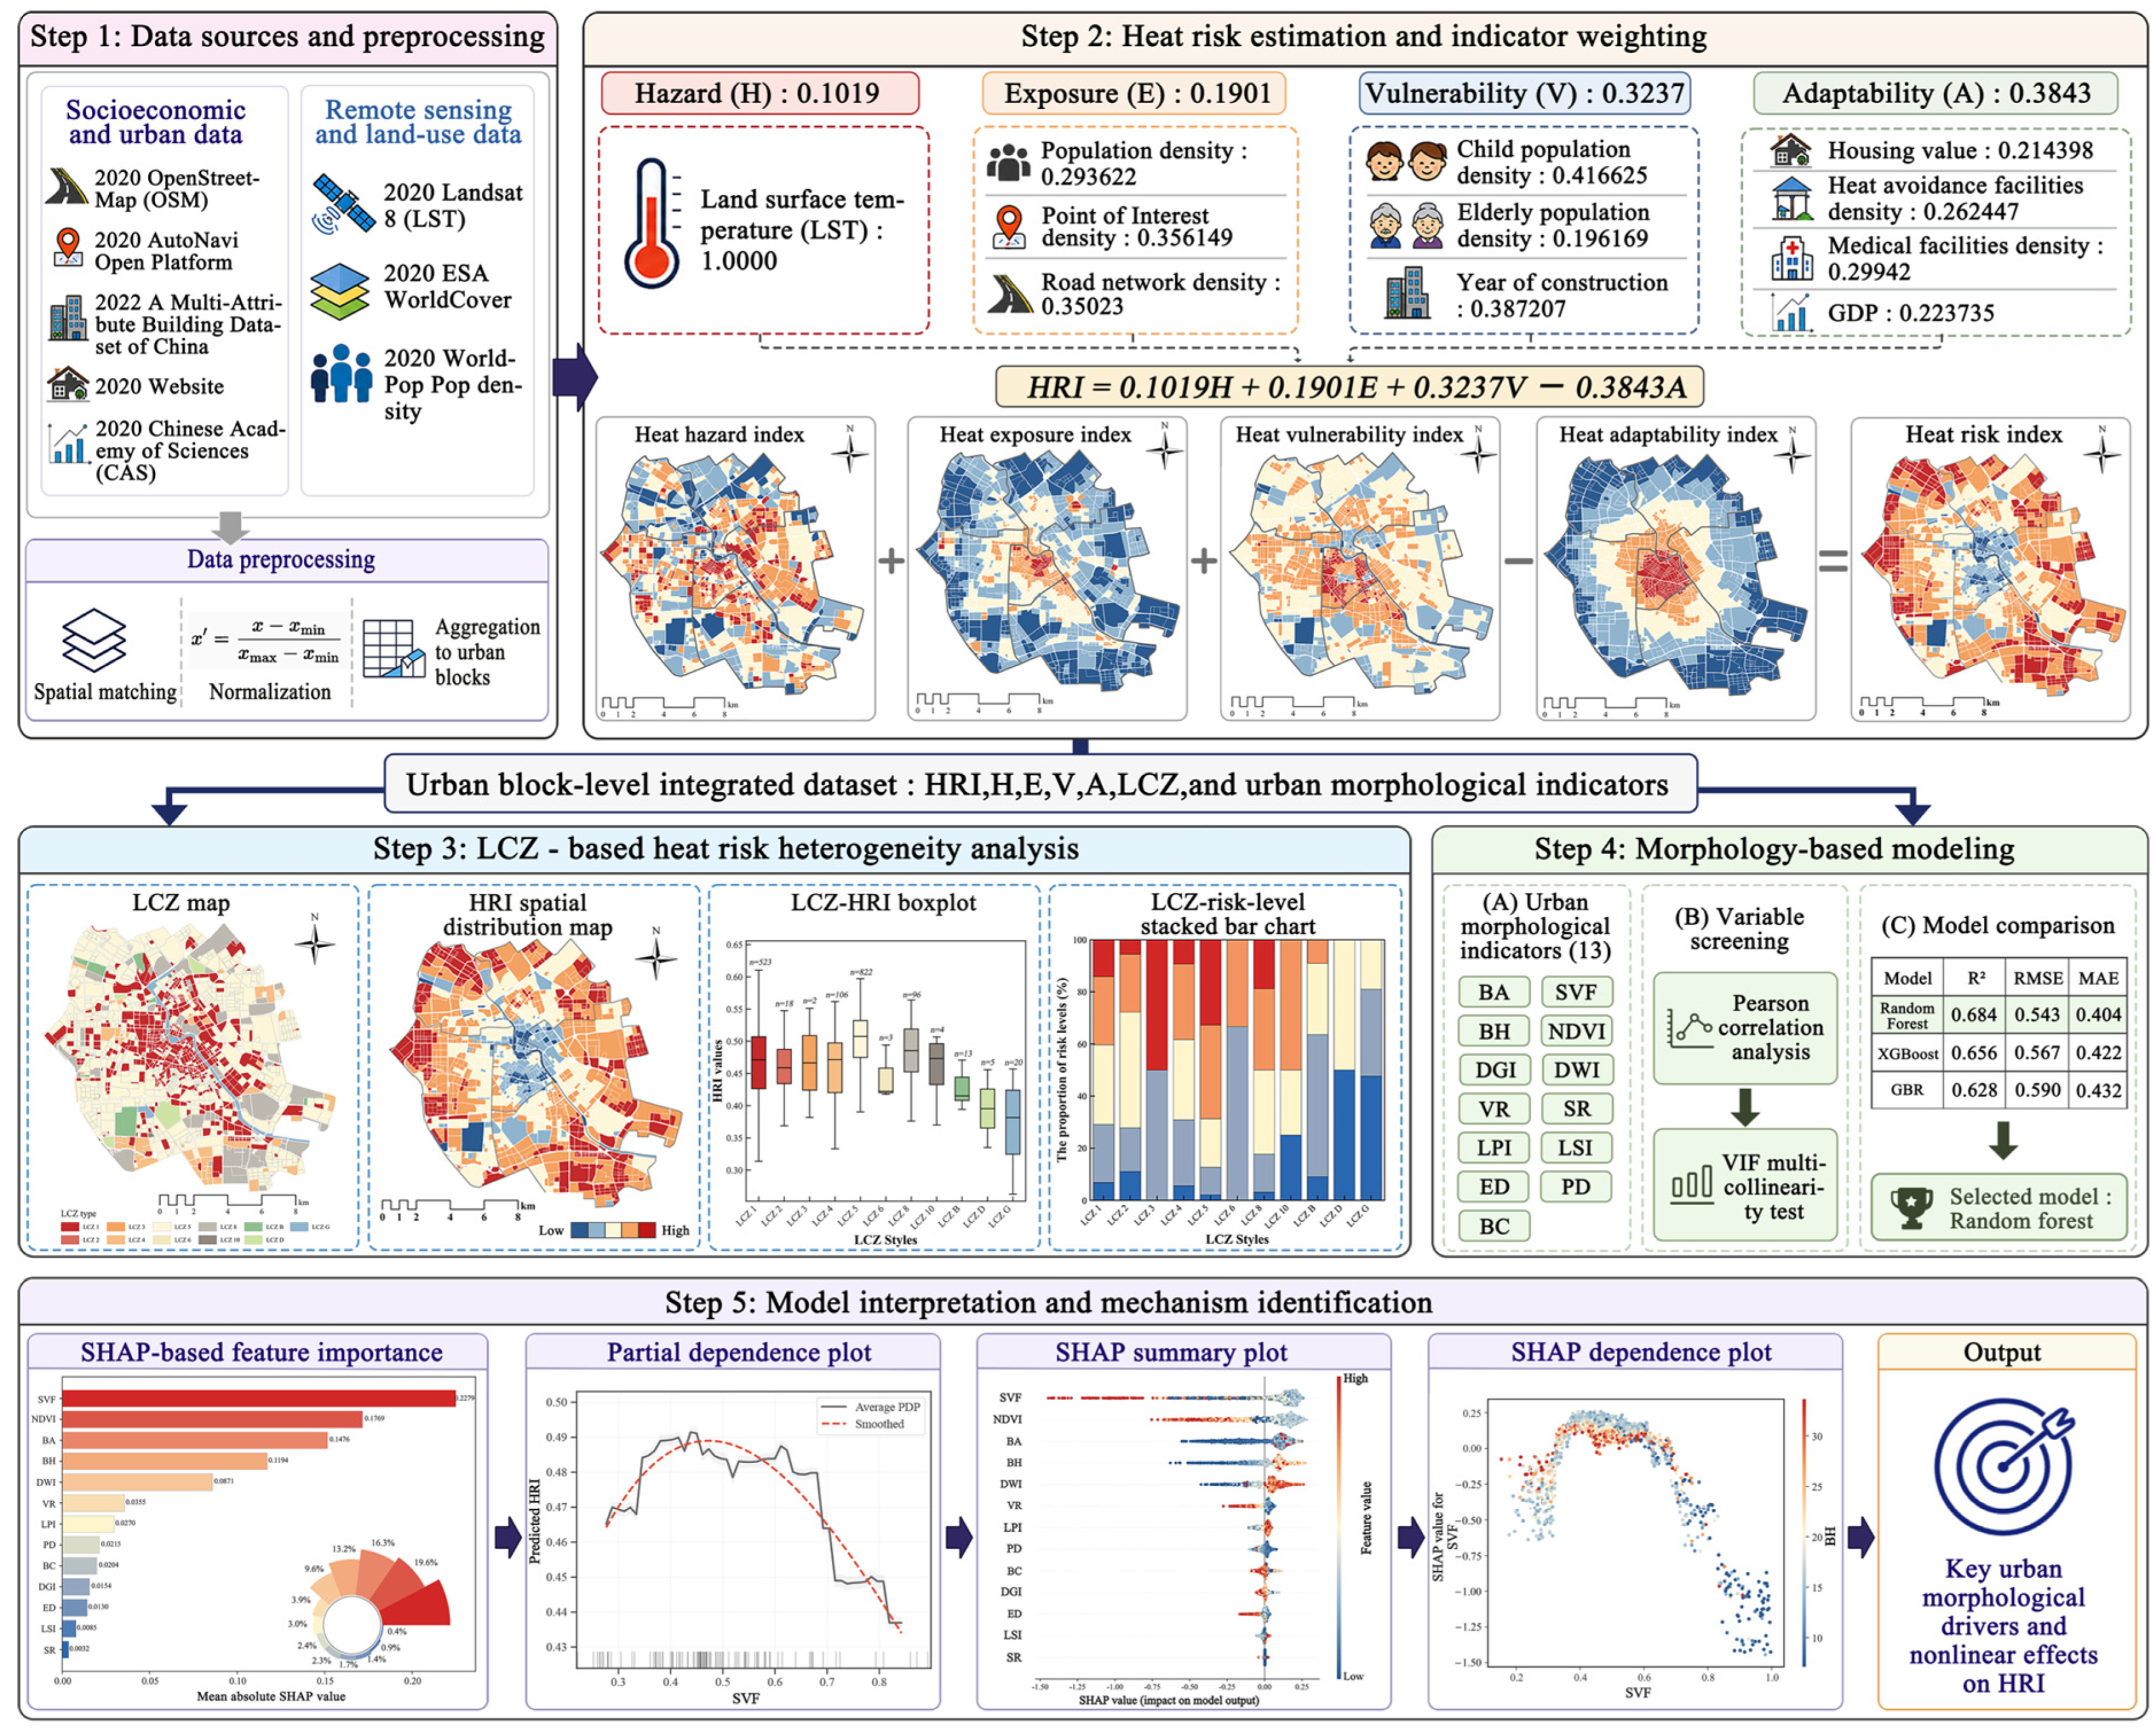
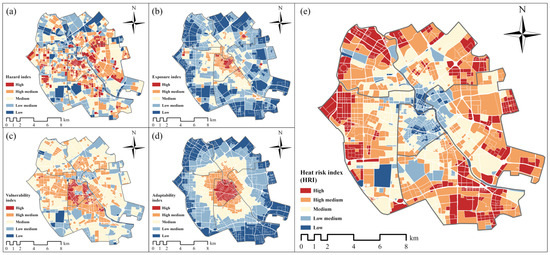
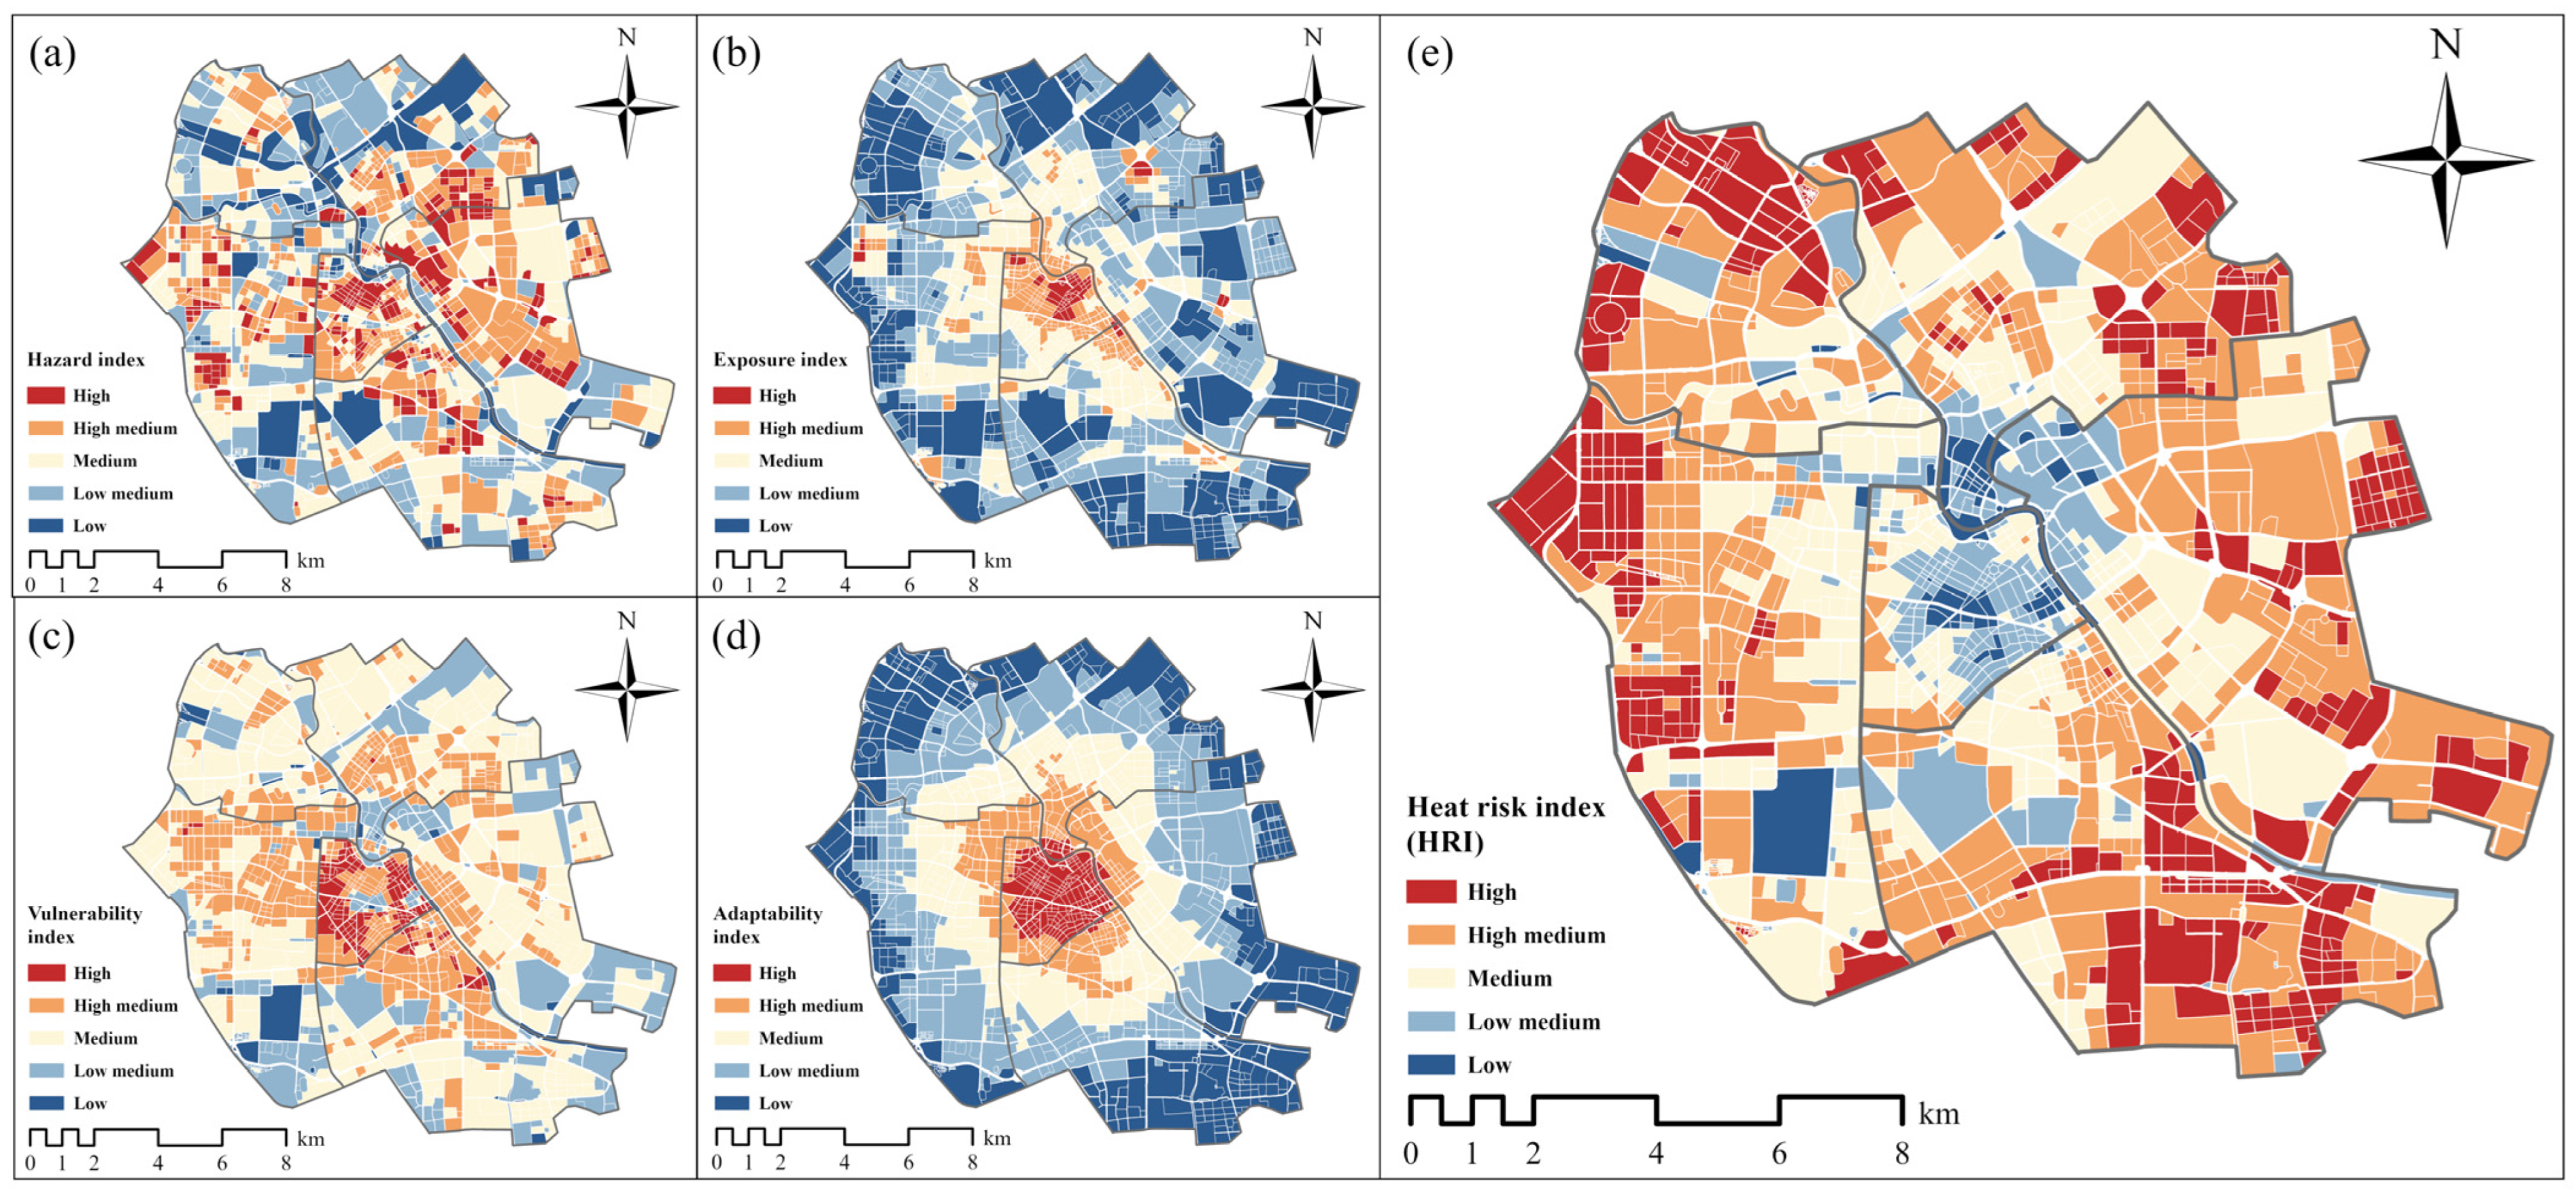
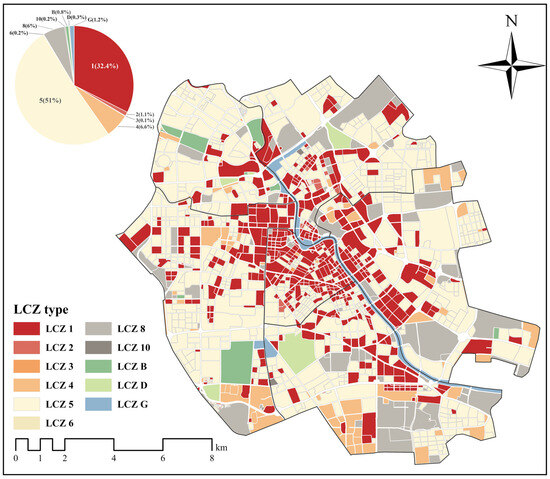
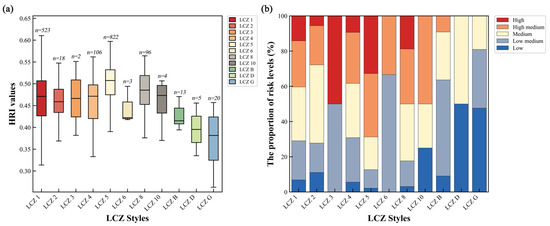
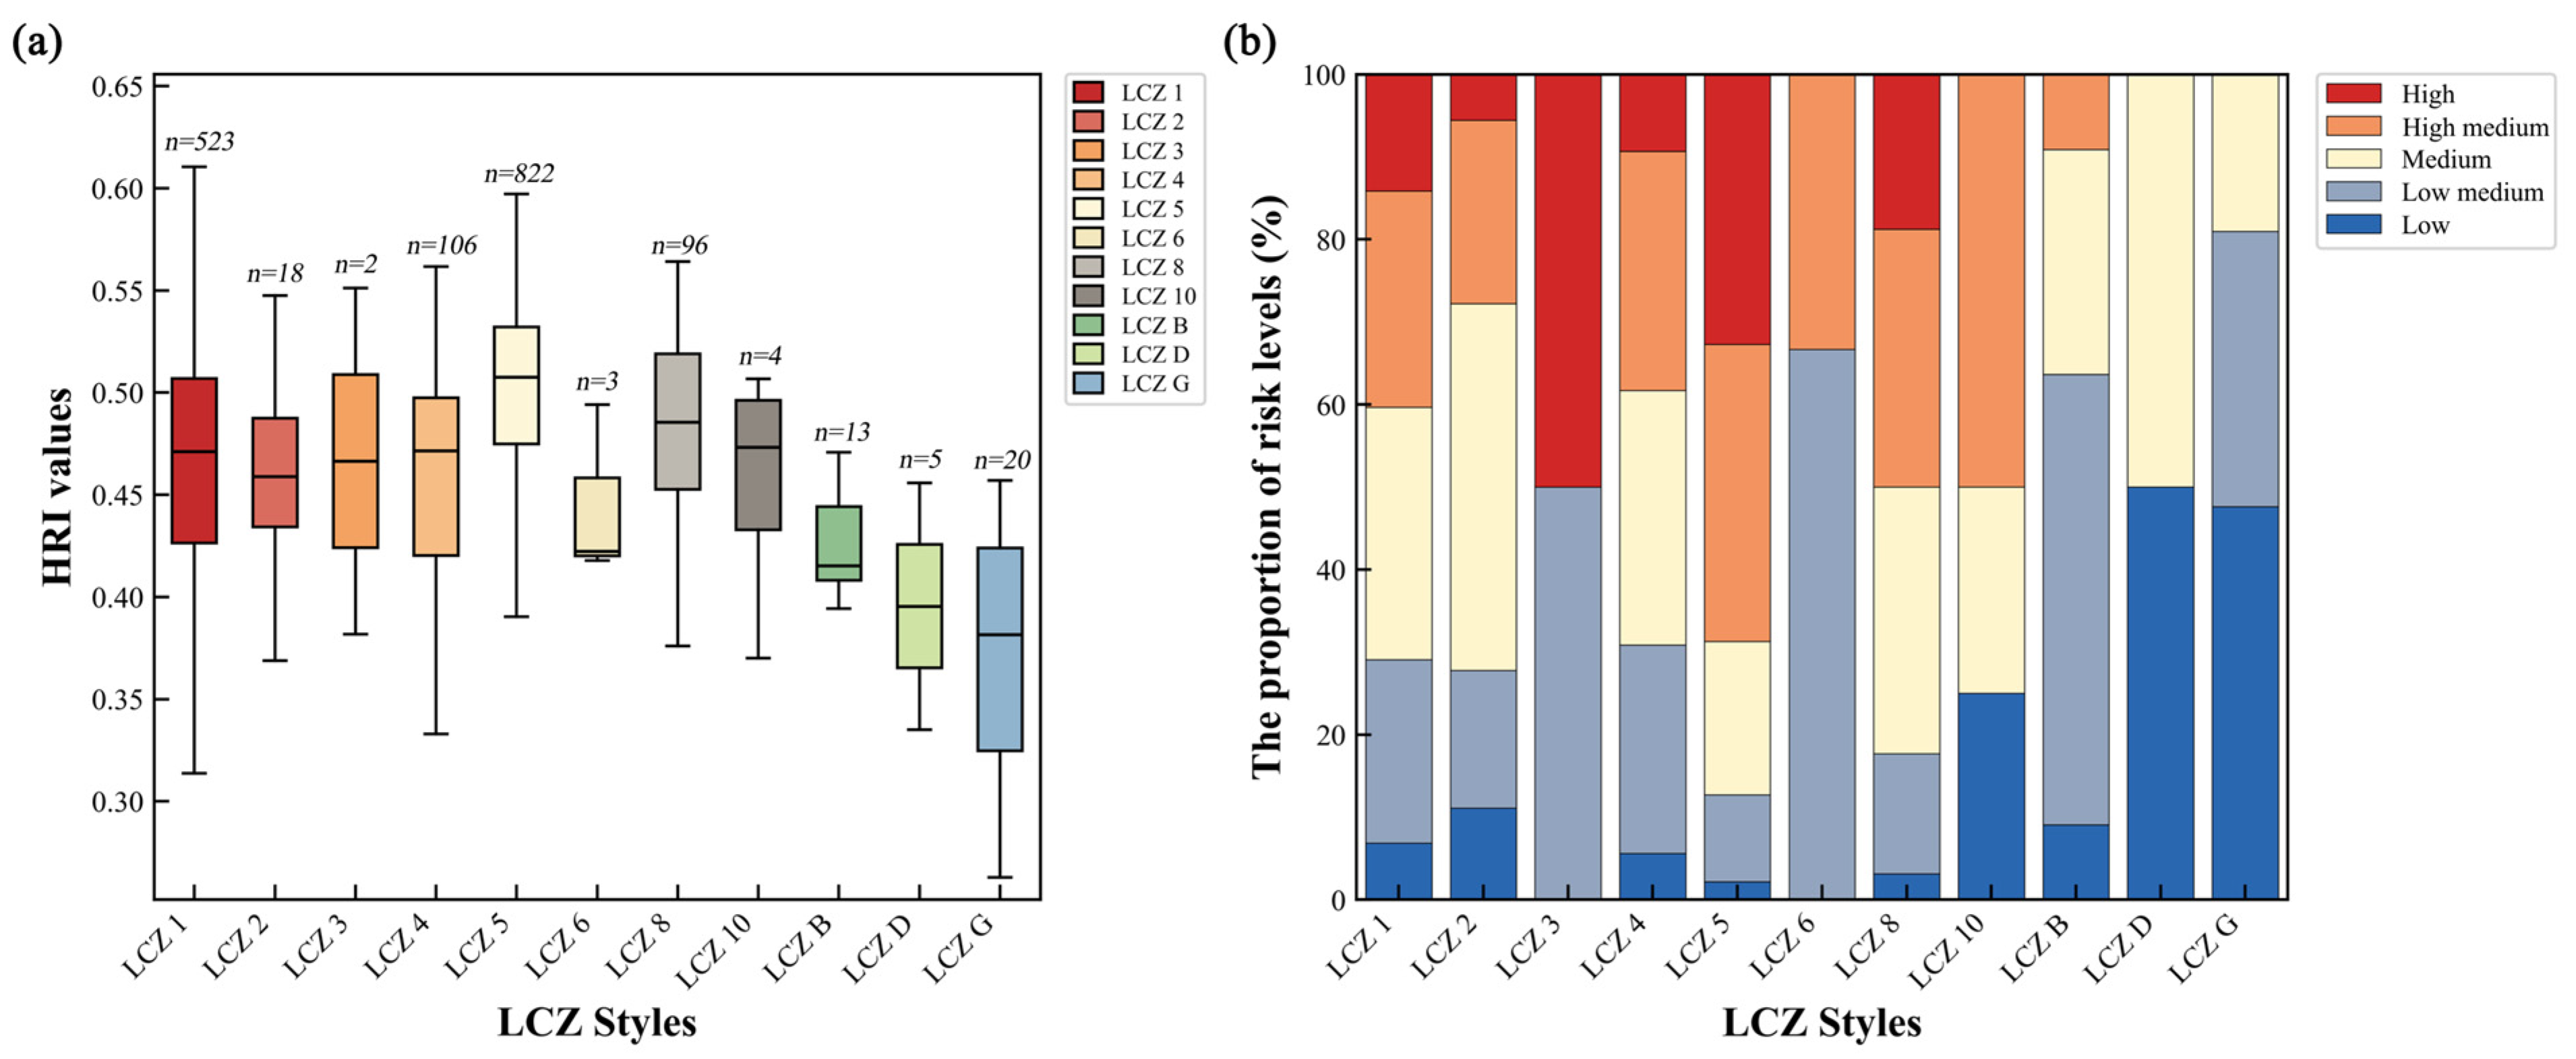
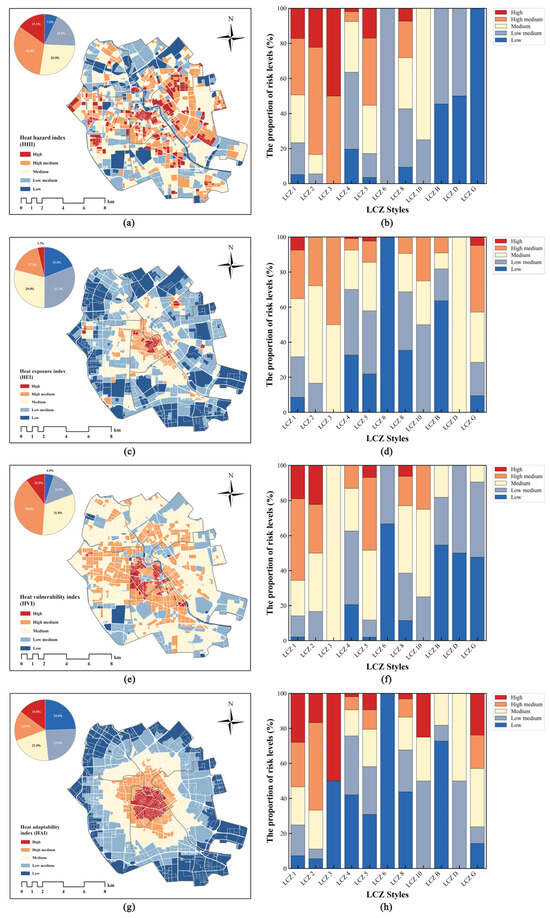
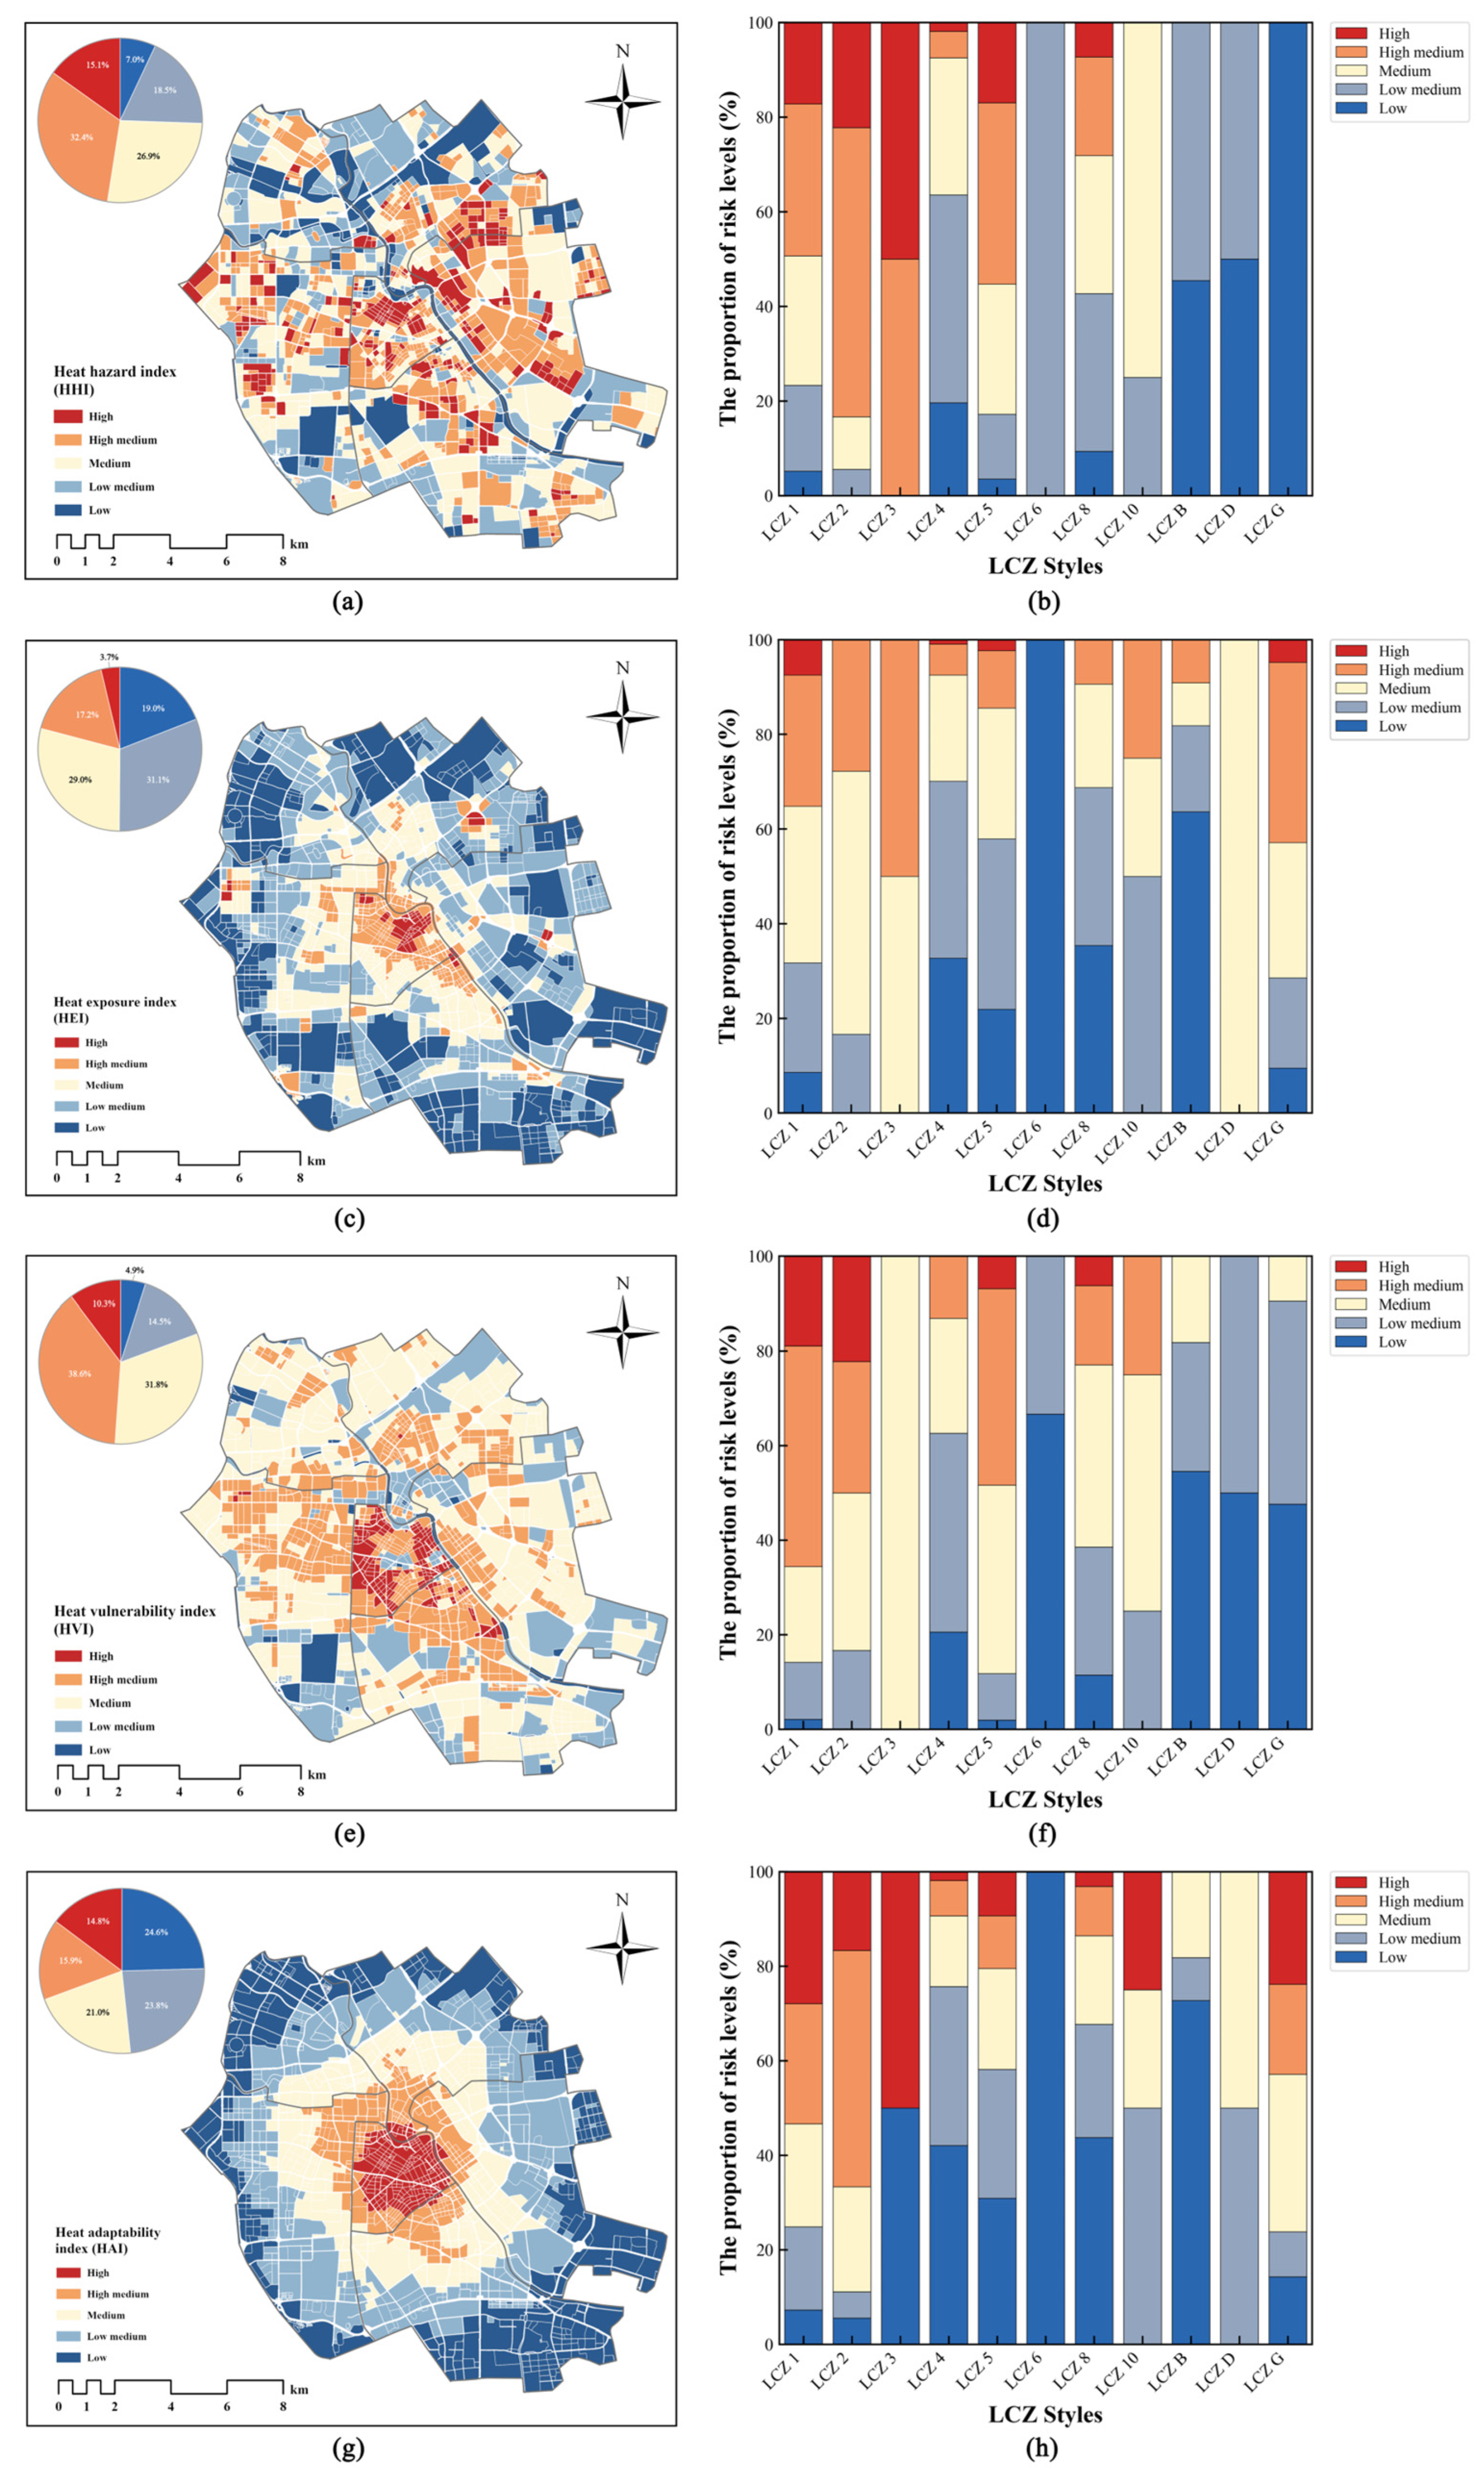
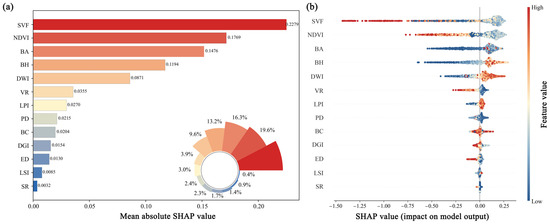
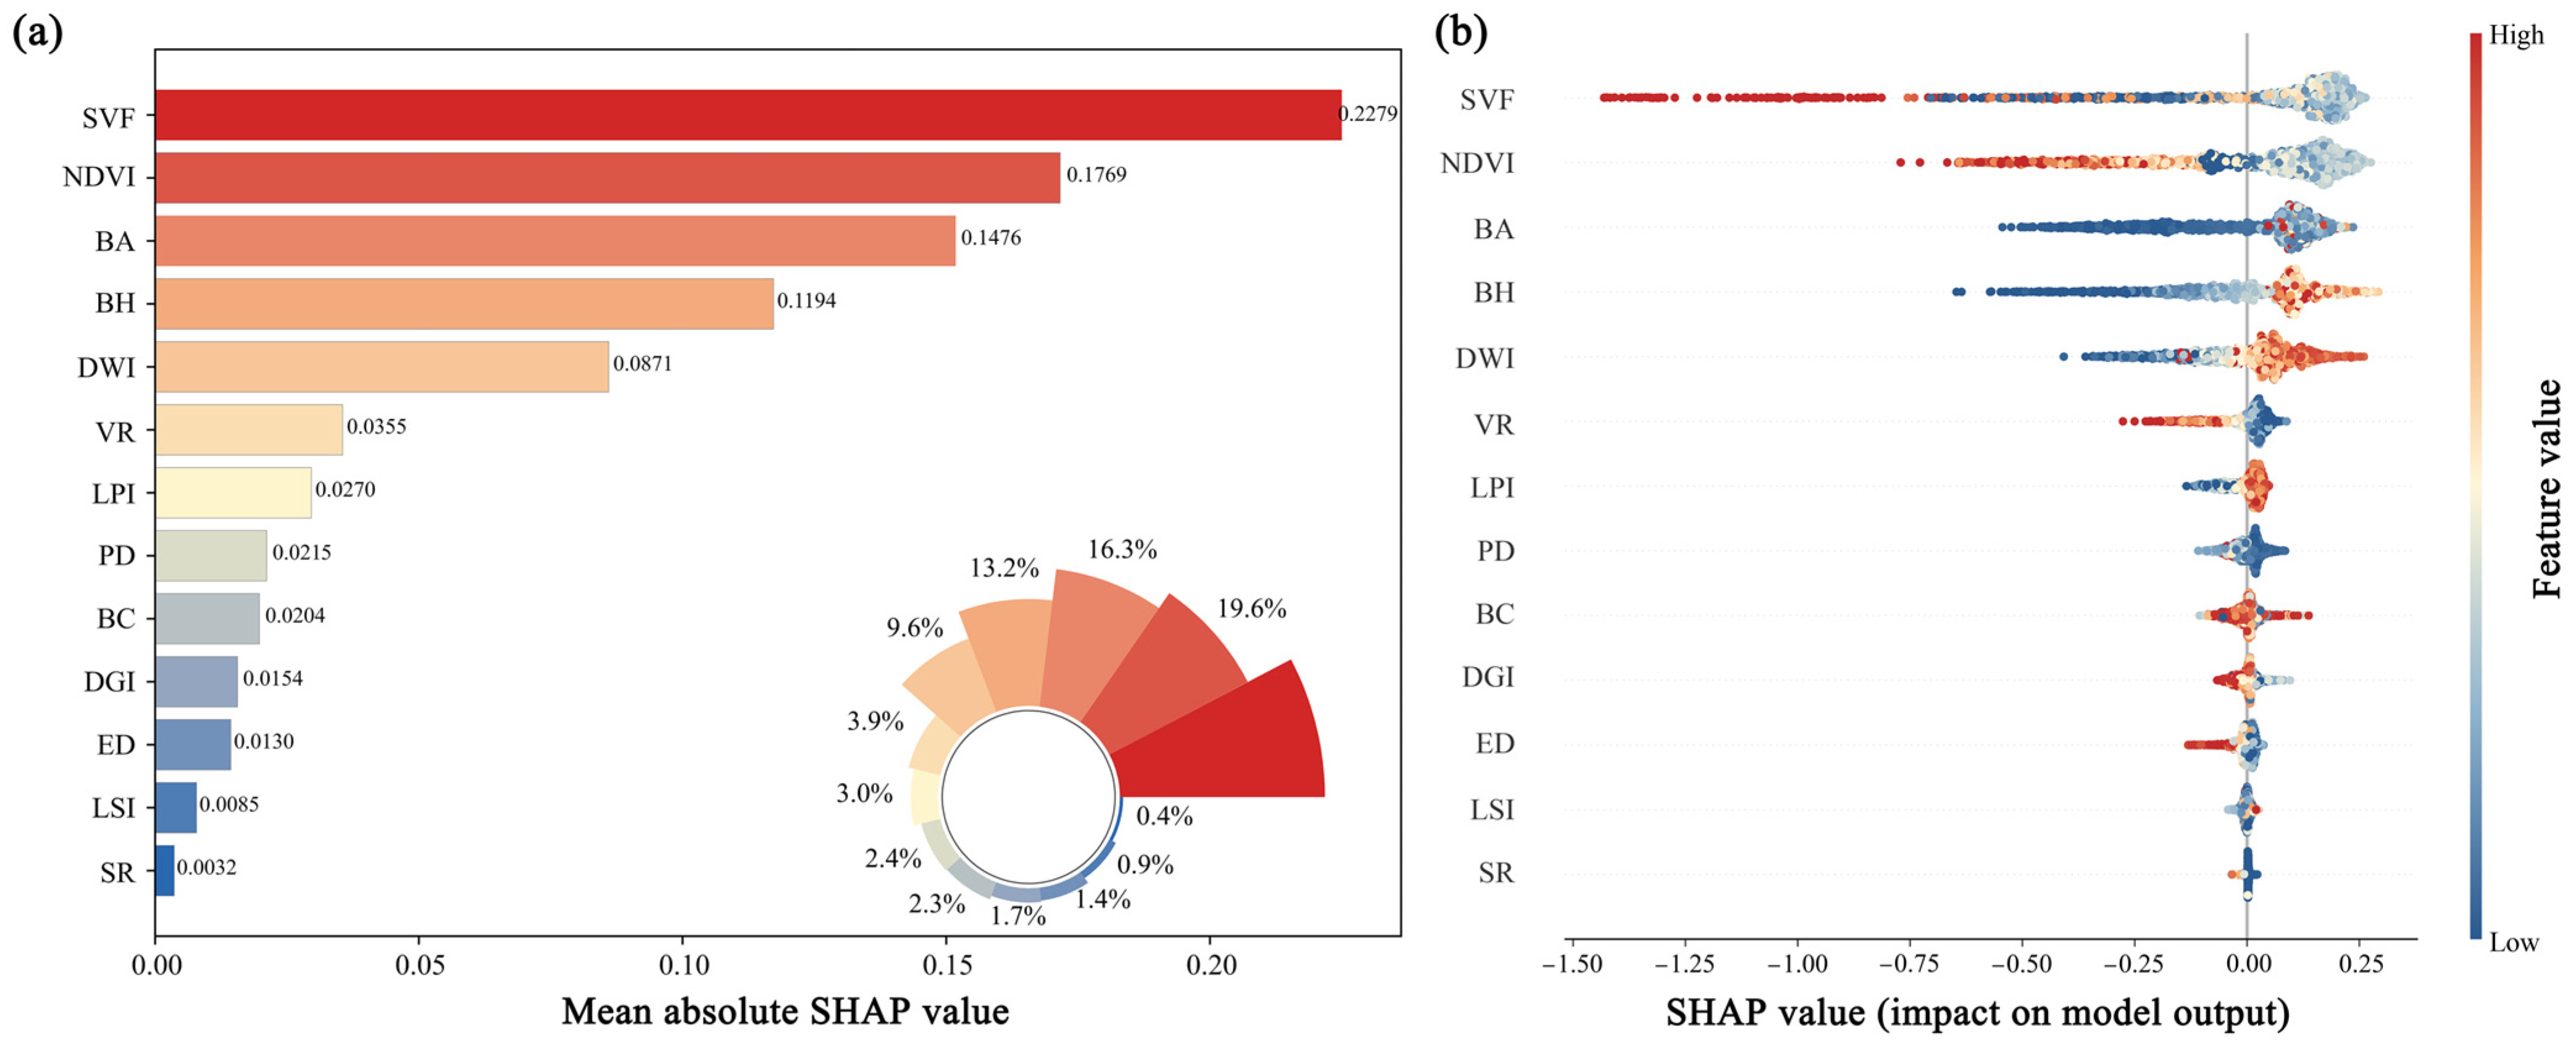
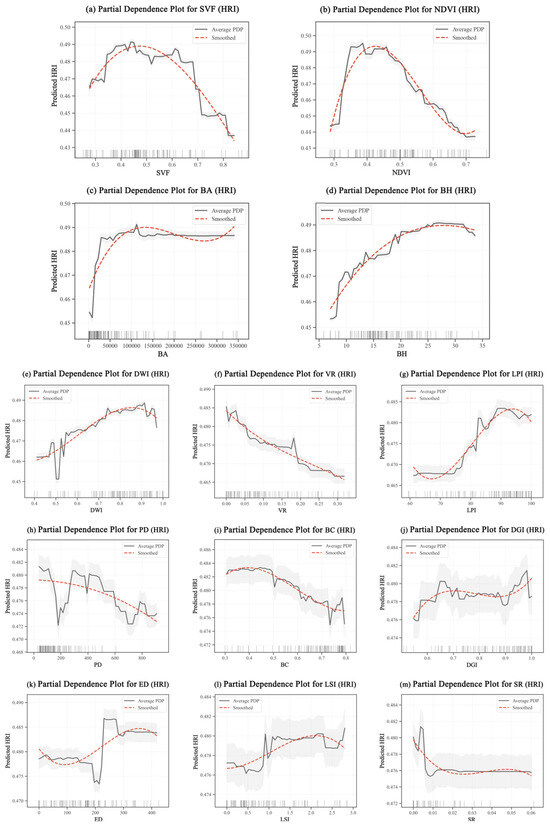
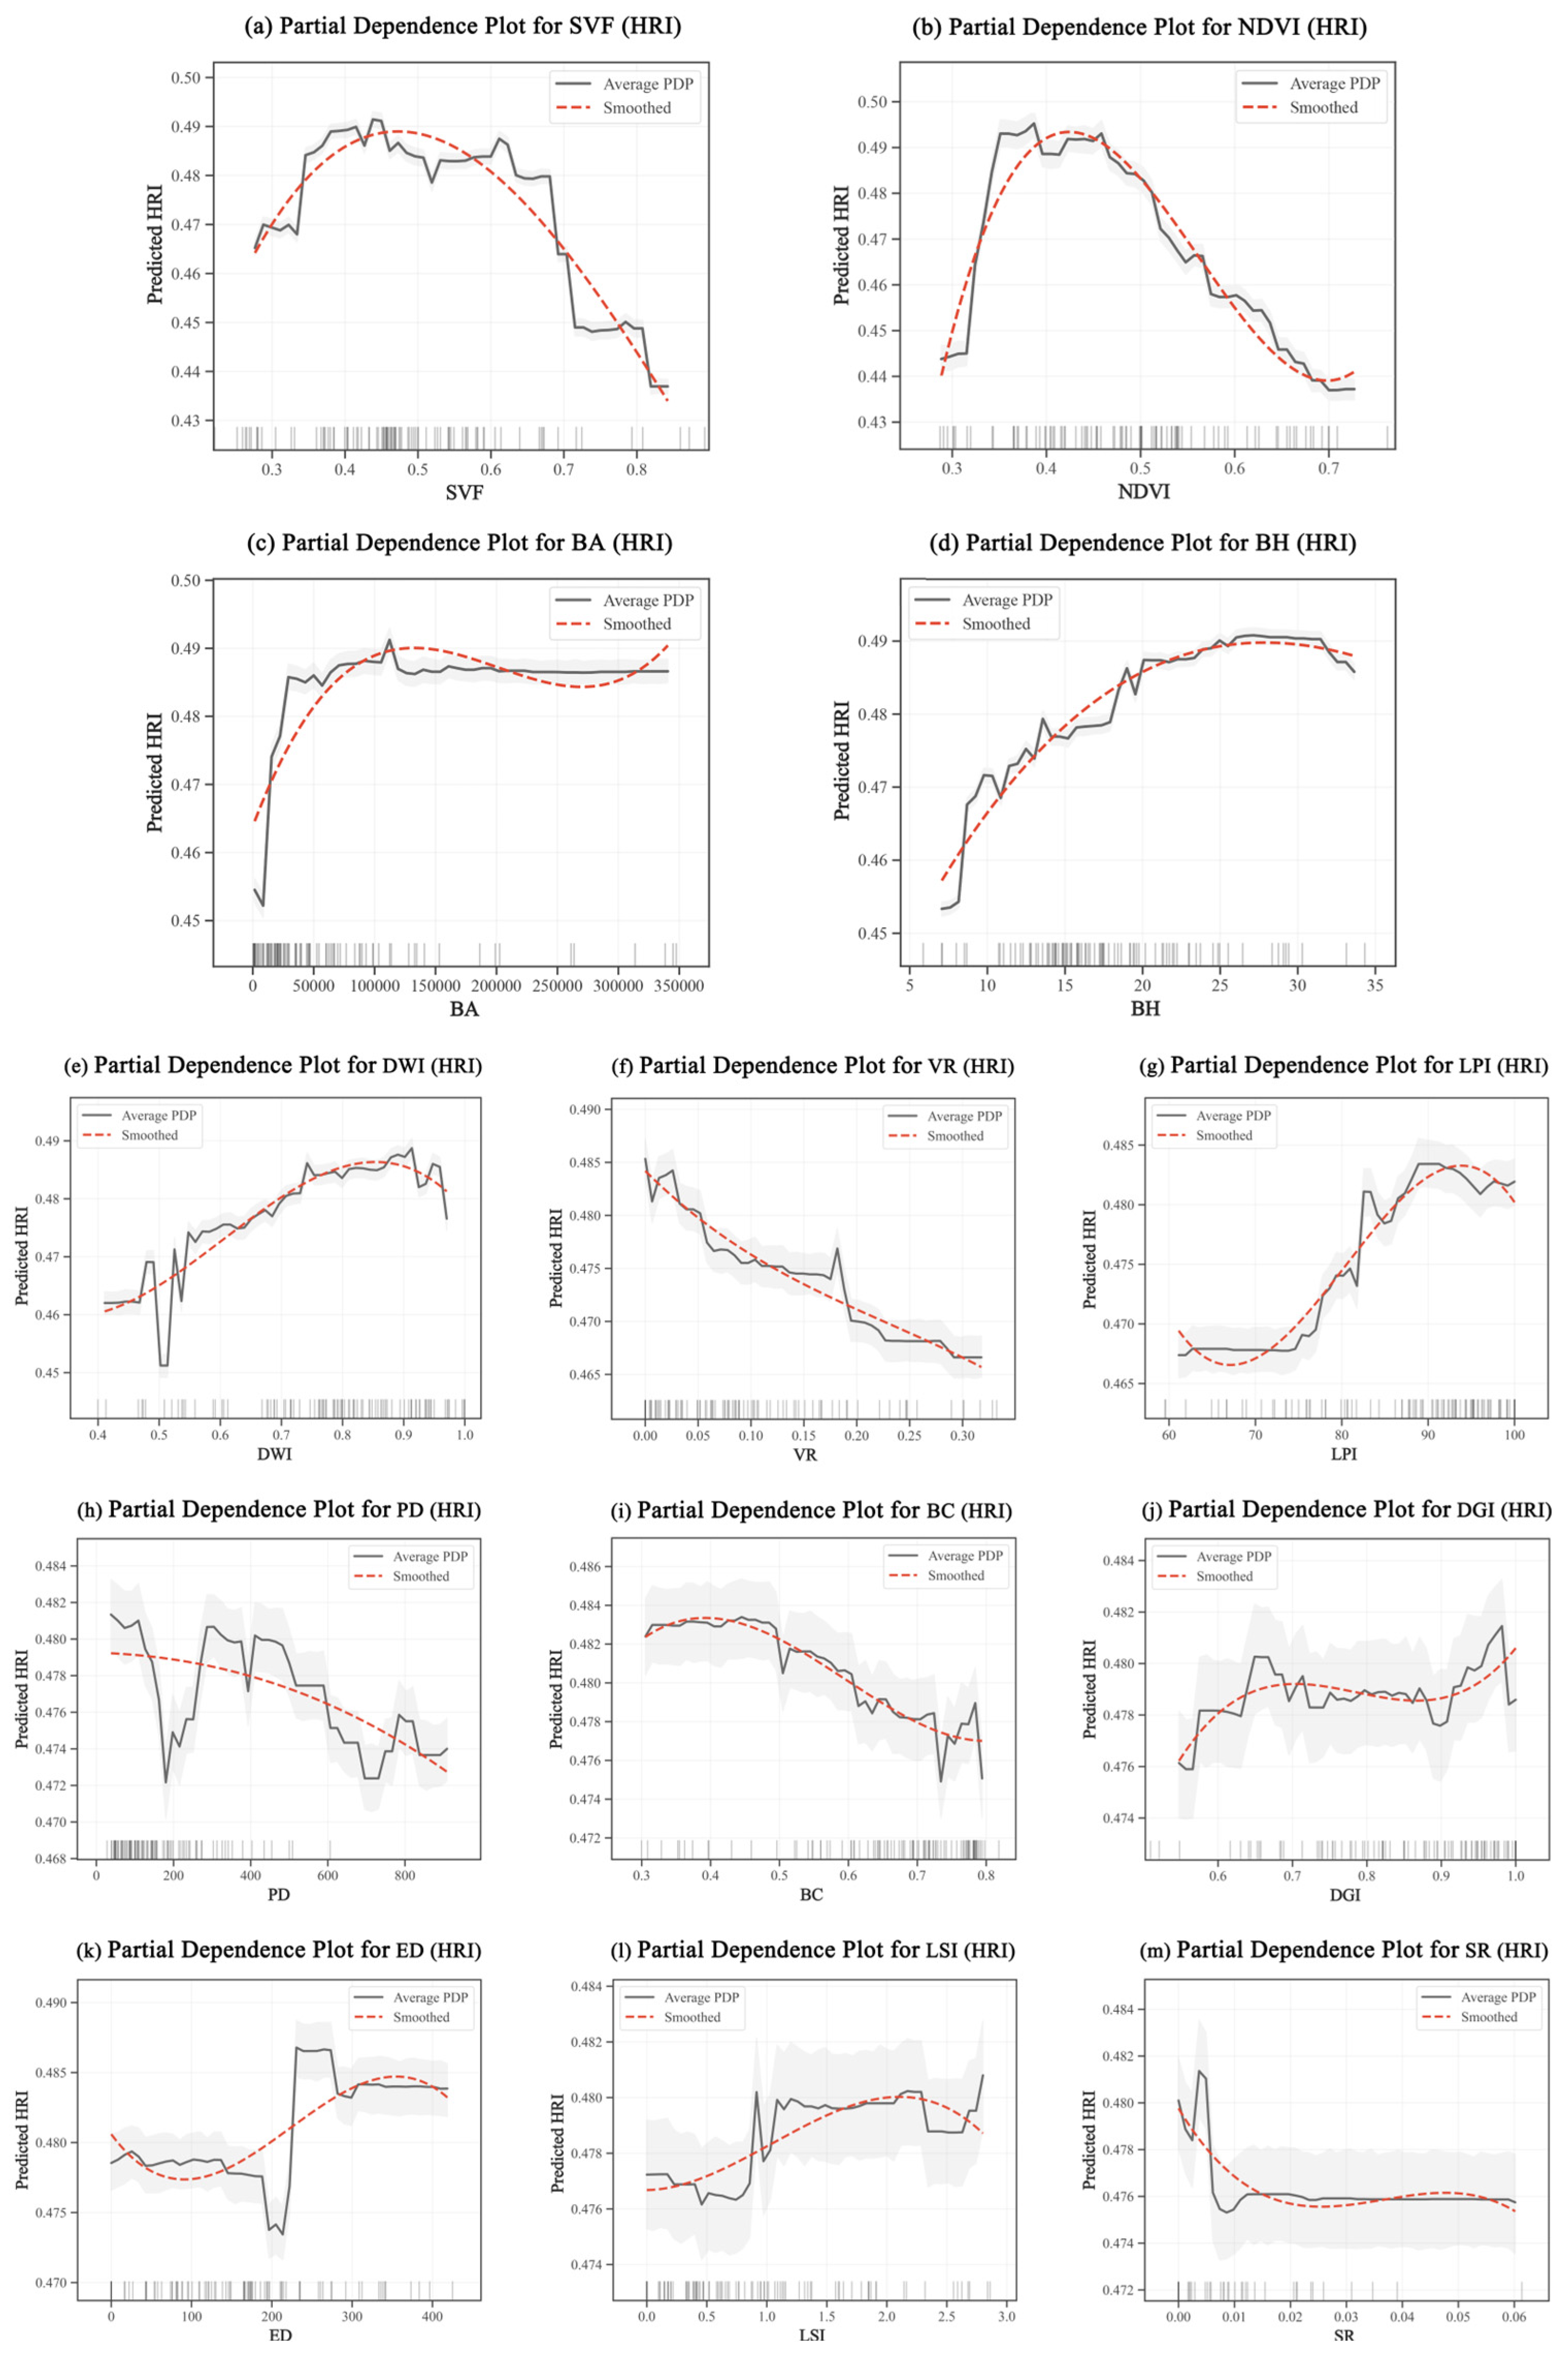
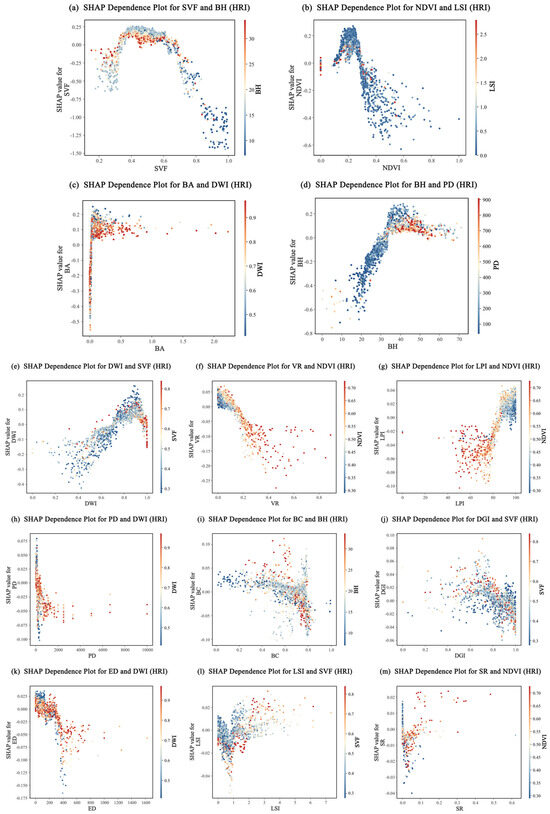
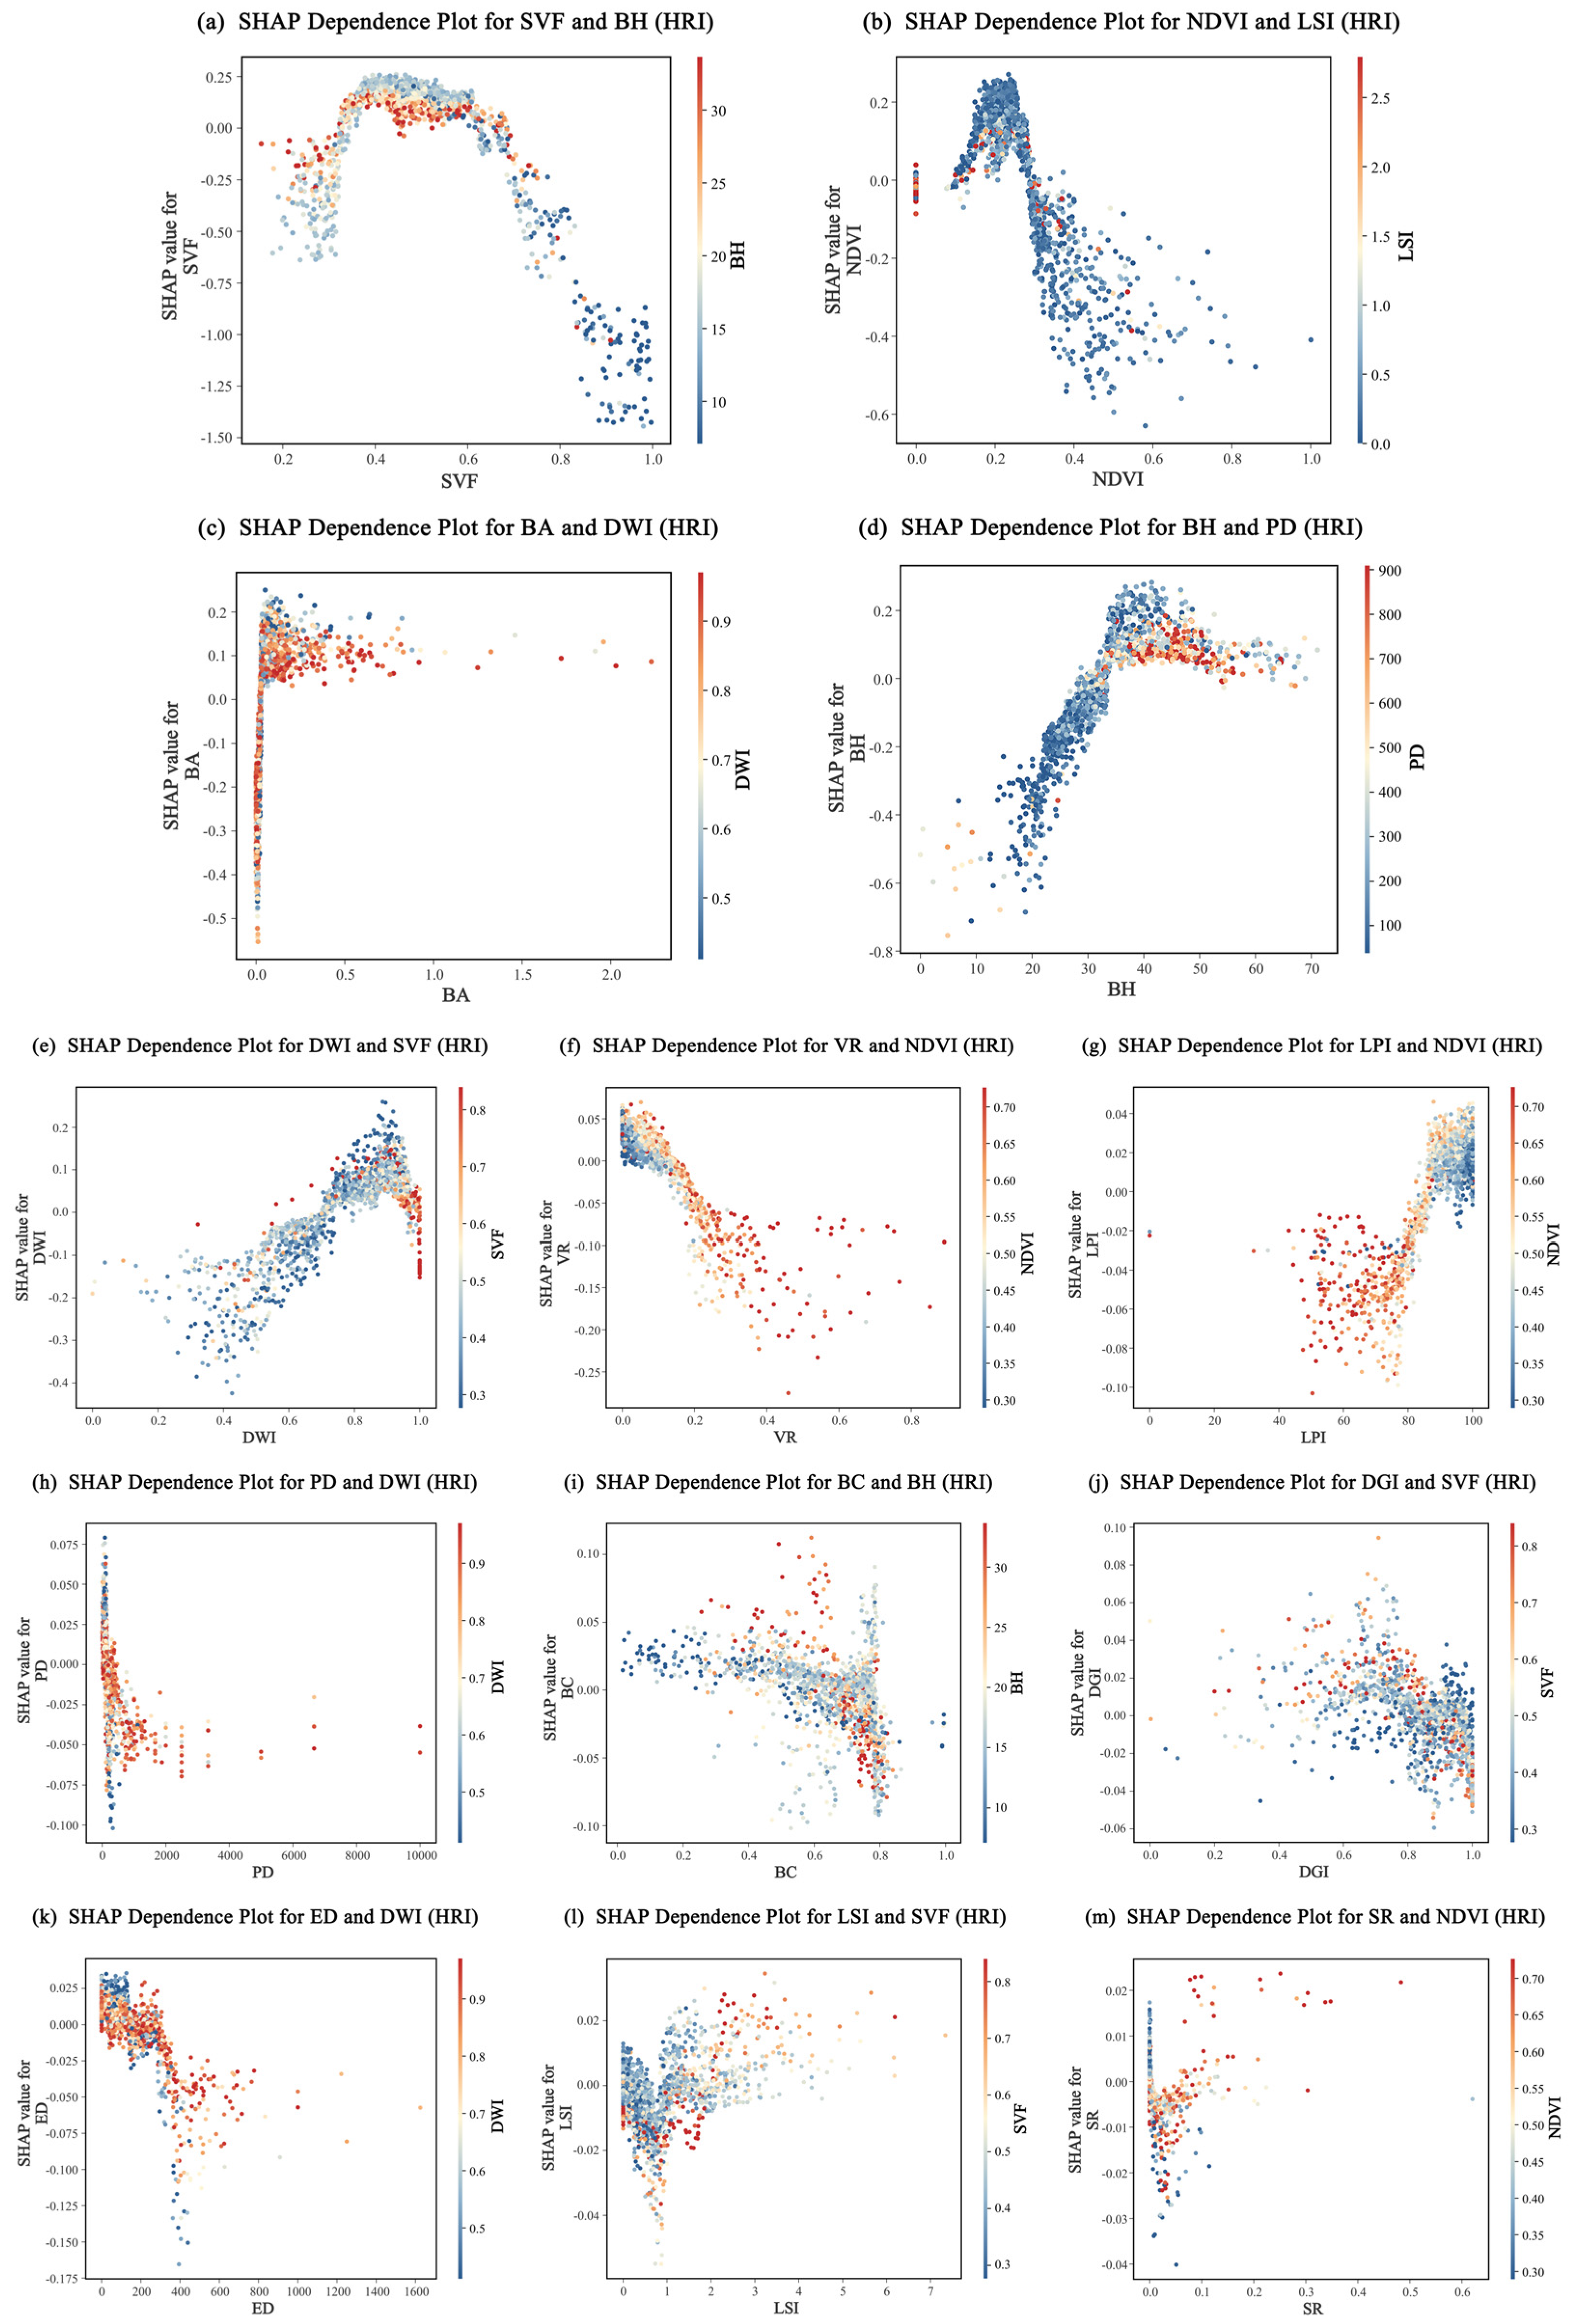

Disclaimer/Publisher’s Note: The statements, opinions and data contained in all publications are solely those of the individual author(s) and contributor(s) and not of MDPI and/or the editor(s). MDPI and/or the editor(s) disclaim responsibility for any injury to people or property resulting from any ideas, methods, instructions or products referred to in the content. |
© 2026 by the authors. Licensee MDPI, Basel, Switzerland. This article is an open access article distributed under the terms and conditions of the Creative Commons Attribution (CC BY) license.