Article

Three-Way Framework for Evaluating Regional Localization Effects in Remediation Footprint Tools

1
Soil Protection and Landscape Design Center, Chinese Academy of Environmental Planning, Beijing 100041, China
2
Nanjing Institute of Environmental Sciences, Ministry of Ecology and Environment, Nanjing 210046, China
3
School of Life Sciences, Nanjing University, Nanjing 210023, China
*
Author to whom correspondence should be addressed.
These authors contributed equally to this work.
Sustainability 2026, 18(17), 9147; https://doi.org/10.3390/su18179147
Submission received: 7 July 2026 / Revised: 10 August 2026 / Accepted: 11 August 2026 / Published: 7 September 2026

Abstract

Environmental footprint assessment is increasingly used to characterize the secondary impacts of contaminated site remediation. However, many established green and sustainable remediation tools rely on U.S.-based emission inventories and background data, raising questions about how their estimates change when applied under other regional conditions. This study proposes a three-way evaluation framework that examines Sitewise™ and SEFA outputs alongside a Sitewise-informed China-localized recalculation using domestic emission factors. The framework was applied to an excavation-and-transport brownfield remediation project in northern China using five indicators: greenhouse gas emissions (GHG), energy use, NOx, SOx, and particulate matter. In this case, Sitewise™ and SEFA produced numerically similar GHG estimates and moderately different energy estimates, with pairwise differences of 7% and 27%, respectively. Under the assumptions of this case, their GHG estimates were 26% and 20% lower, respectively, than the localized recalculation. A screening counterfactual using a common U.S. reference grid factor indicated that grid factor substitution accounted for 19.2% of the Sitewise-to-localized numerical difference and 24.5% of the SEFA-to-localized numerical difference. Air pollutant results showed stronger pathway dependence: NOx estimates differed by up to approximately eightfold, and the localized result fell between the two tool estimates under the stated assumptions. Within the tested epistemic ranges, the localized GHG result remained above both fixed tool outputs, the NOx result remained between them, and the SOx result remained below both in every draw; the baseline PM relationship was retained in 92.7% of draws, while localized energy equaled the Sitewise™ result by construction. Across the native tool runs and a transparent localized transport linkage screen, a 25% reduction in haul distance was associated with a 12.5–22% reduction in total GHG estimates. The comparison harmonized the remediation program and comparison unit, but not the complete background life cycle boundary; the results therefore represent defined-boundary pathway estimates rather than fully boundary-harmonized LCA results. Because the localized pathway retains the Sitewise-derived fuel–energy balance and activity category shares, it is interpreted as a case-specific factor localization recalculation rather than an independently documented project inventory or external comparison standard. The observed directional differences characterize the present case and tested assumptions and do not support a general judgment about the relative performance of the tools. The framework may be adaptable to other jurisdictions, but its transferability should be evaluated using additional sites, remediation technologies, and independently documented activity inventories.

1. Introduction

1.1. Environmental Footprints of Remediation and the GSR Response

Contaminated site remediation reduces risks to human health and ecosystems, yet remediation activities themselves may generate substantial secondary environmental burdens. Excavation, heavy equipment operation, and long-distance soil transport produce greenhouse gases (GHGs), nitrogen oxide (NOx), sulfur oxide (SOx), and particulate matter (PM), particularly in ex situ remediation projects dominated by excavation and haulage [1,2,3,4]. Their significance has grown considerably in China, where rapid brownfield redevelopment and contaminated site remediation are increasingly integrated into carbon management and environmental planning [5,6].
Green and sustainable remediation (GSR) addresses this issue by incorporating environmental, social, and economic performance into remediation decision-making [7,8,9,10]. Internationally, GSR practice has been formalized through U.S. EPA and ASTM guidance; in China, analogous requirements are reflected in the HJ 25 technical guideline series [11,12,13]. For GSR to meaningfully support project selection under China’s dual-carbon policy agenda, the footprint estimates used in the GSR process must remain credible when tools developed in other jurisdictions are applied to Chinese operating conditions.

1.2. Two Calibration-Divergent Tools and the Interpretation Gap

Sitewise™ and the Spreadsheets for Environmental Footprint Analysis (SEFA) are among the most widely used GSR footprint tools [14,15,16,17]. Both convert activity inventories into estimates of GHG, energy use, and air pollutant emissions. Their background data, however, are largely derived from U.S. emission inventories, grid factors, vehicle standards, and equipment datasets. When applied in China, their estimates may therefore be sensitive to regional differences in heavy-duty vehicles, non-road equipment, electricity generation, and diesel sulfur standards.
Chinese applications have generally used these tools individually [18,19,20]. A single-tool assessment does not by itself reveal sensitivity to alternative regional factors, and numerical proximity in a bilateral comparison may remain inconclusive when both tools draw on U.S.-calibrated background data. Interpretation is further complicated by their divergent classification structures: Sitewise™ employs activity-based modules, whereas SEFA aggregates many logistical activities within a transport node. Consequently, source attribution and sensitivity results may differ even when the same broad engineering program is represented [21,22]. A third, explicitly Sitewise-informed China-localized recalculation using locally applicable factors can therefore provide a case-specific diagnostic of how reported estimates change under alternative regional assumptions. Because it retains Sitewise-derived energy and activity allocations, it is not an independent activity inventory or external comparison standard.

1.3. Research Objectives

This study examines Sitewise™ and SEFA outputs alongside a Sitewise-informed China-localized recalculation for an excavation-and-transport brownfield remediation project in northern China. The analysis covers five indicators—GHG, energy, NOx, SOx, and PM—and pursues four objectives: (i) quantify case-specific numerical differences between Sitewise™ and SEFA; (ii) identify the principal activity categories represented in their respective footprint profiles; (iii) characterize the numerical direction and magnitude of the three pathway estimates under a common foreground program and retained pathway-specific assumptions; and (iv) translate the case observations into cautious, indicator-specific guidance for sensitivity screening. Broader applicability of the framework should be evaluated using additional sites, remediation technologies, and independently documented activity inventories.

2. Materials and Methods

2.1. Goal, Comparison Unit, and System Boundary

Environmental footprint analysis quantifies the secondary environmental burdens arising from remediation implementation, distinct from primary risk reduction benefits [23]. The comparison unit was one complete implementation of the two-stage remediation program for the case site. The common foreground boundary began with site investigation, drilling, monitoring well installation, and sampling. It ended when contaminated soil had reached the cement kiln receiving gate and the site had been backfilled, graded, compacted, and handed over. Included foreground activities were project-related personnel and equipment transport, mechanical excavation, dewatering and dust suppression energy and water use, on-site electricity, contaminated soil road haulage over an approximately 200 km one-way route, and site restoration. Some restoration activities were not available as separate measured quantities in the localized pathway and were represented through the Sitewise-derived aggregate fuel allocation.
The common foreground cut-off was applied symmetrically at the cement kiln receiving gate: kiln co-processing and any avoided burdens or credits from raw material or fuel substitution were both excluded. The common comparison also excluded post-remediation monitoring and redevelopment, fugitive dust from excavation, loading, unloading, handling, and storage, and deliberate modeling of vehicle, machinery, temporary facility, and infrastructure manufacture. Consequently, PM comprises combustion- and electricity-related emissions rather than total construction site particulate emissions. Any capital goods or other upstream burdens embedded in a native background database could not be disaggregated and were retained as pathway-specific background scope. The shared indicator boundary was limited to GHG, total energy, NOx, SOx, and PM; toxicity, HAP, occupational risk, endpoint characterization, and normalization were excluded from the three-way comparison.
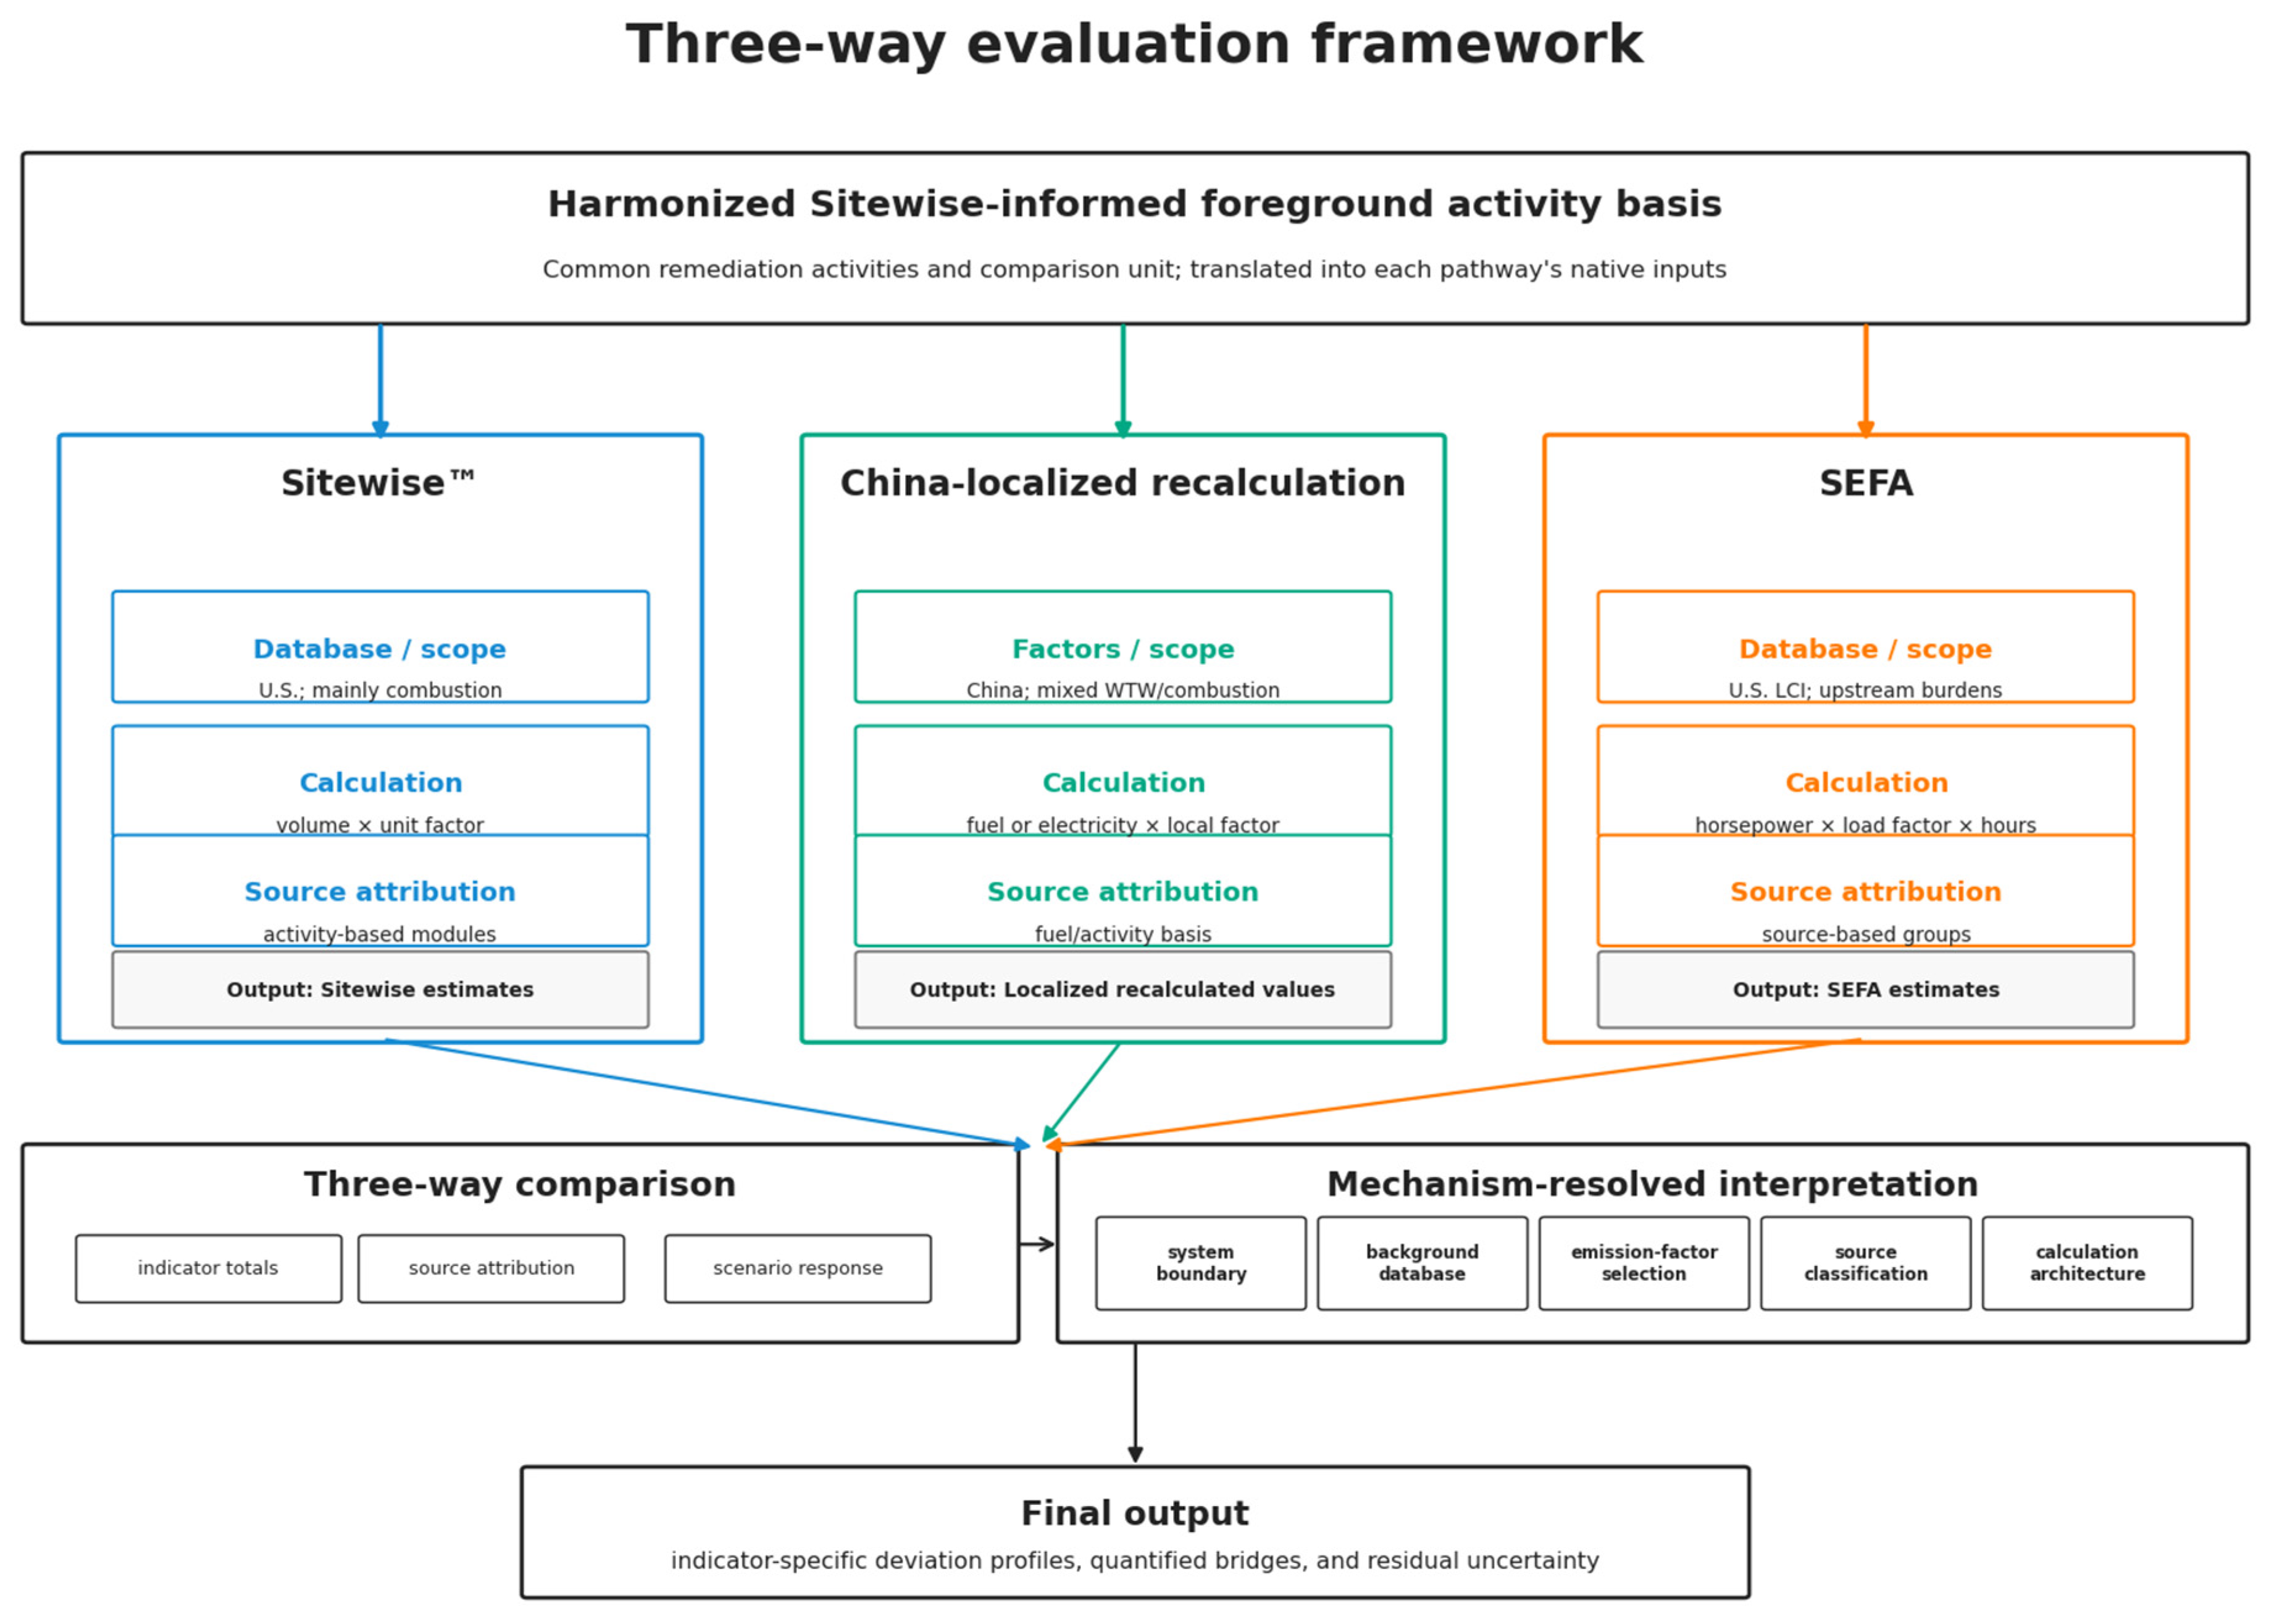
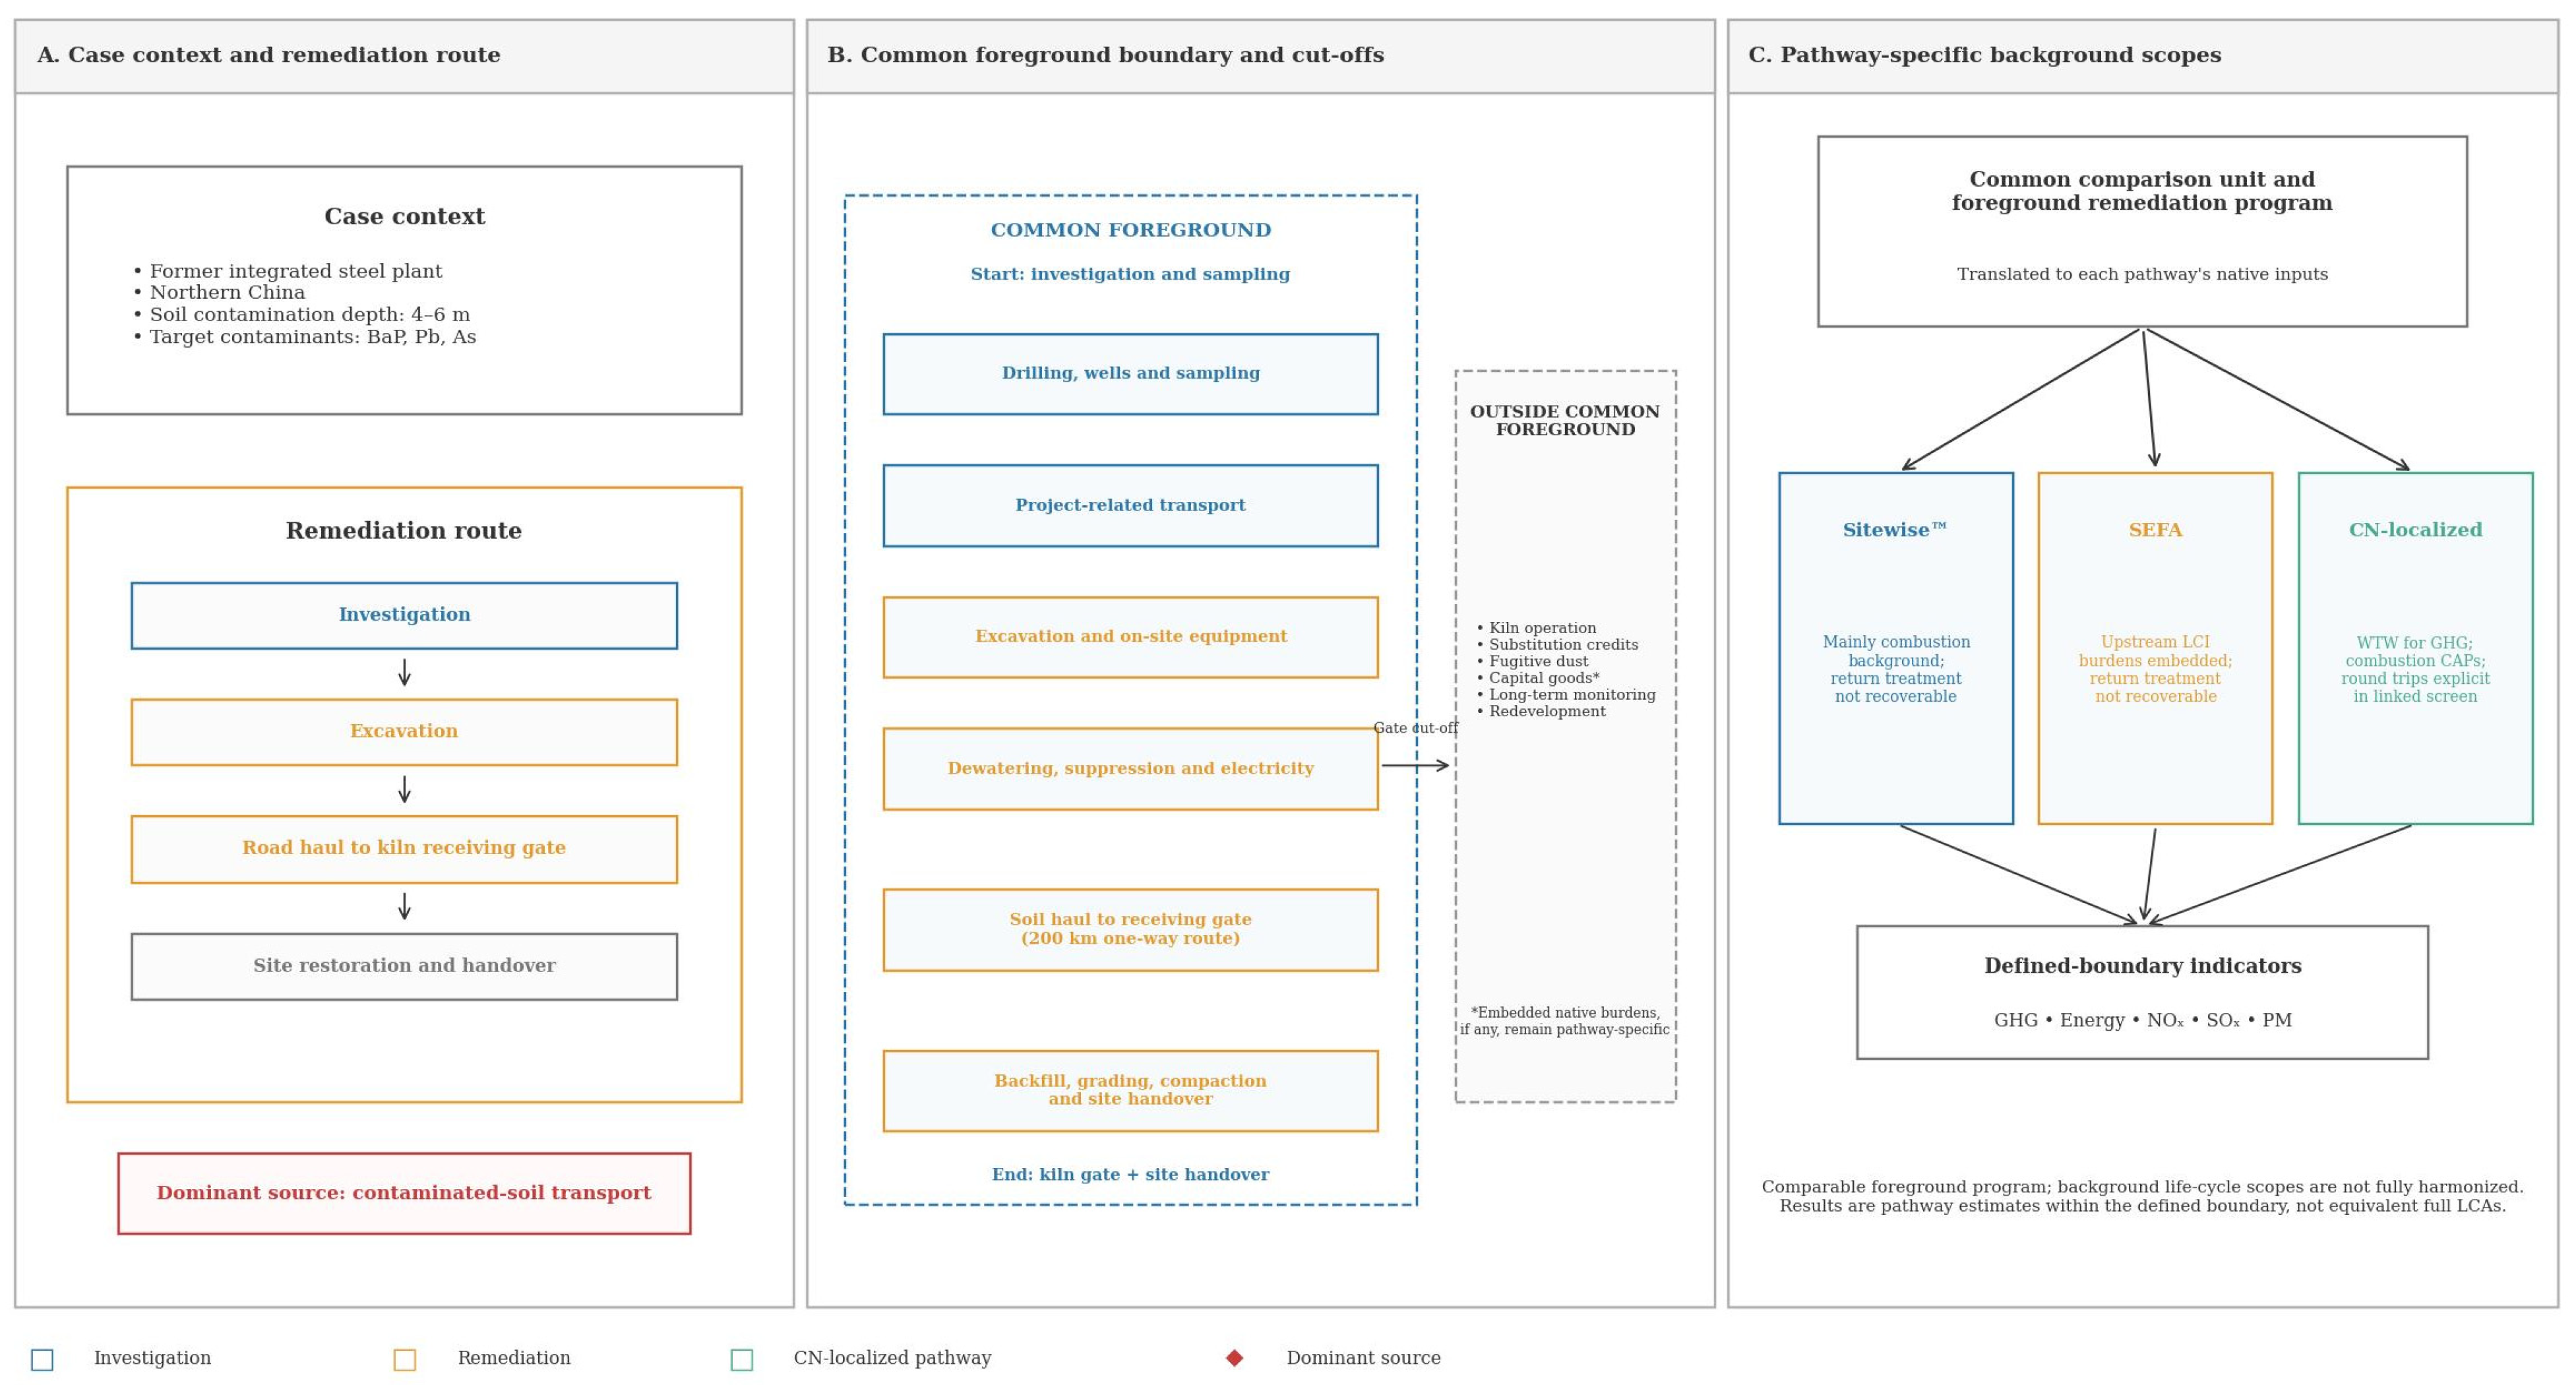
Figure 1 summarizes the quantification framework. Harmonization applies to the comparison unit and common foreground remediation program, not to the complete background life cycle boundary. Sitewise™ retains a predominantly combustion-oriented scope, SEFA retains upstream life cycle burdens embedded in its database, and the localized pathway applies well-to-wheel treatment for GHG but combustion factors for criteria air pollutants. The same engineering program was translated into each pathway’s native input structure, after which pathway-specific databases, factors, classifications, and calculation architectures were retained. Outputs were compared as defined-boundary pathway estimates for GHG, energy, NOx, SOx, and PM. Figure 2 shows the common foreground cut-offs and the retained background-scope differences; Table S14 provides the process-level inclusion, exclusion, and verification matrix.

2.2. Comparative Tool Architecture

Sitewise™ v3.1 is a spreadsheet-based tool developed by the U.S. Navy, U.S. Army Corps of Engineers, and Battelle [16]. It employs activity-based modules and draws primarily on U.S. EPA NONROAD 2005 emission factors and U.S. Department of Energy fuel economy data [24]. SEFA, developed by the U.S. EPA, organizes inputs into electricity use, transport, on-site emissions, and off-site emissions [17]. Its equipment-related calculations are based on horsepower, load factor, and operating hours, with background factors derived from EPA/600/R-16/176a [14]. The full input and output structures are provided in Table S1.
Five methodological mechanisms were separated for interpretation. First, system boundary was divided into a common foreground engineering boundary and pathway-specific background accounting scope. The common foreground terminates at the cement kiln receiving gate and site handover, with both kiln burdens and substitution credits excluded; process-level status is reported in Table S14. Second, background databases differ in geography, vintage, and inclusion of upstream energy burdens: Sitewise™ uses primarily DOE/NONROAD-based U.S. data, whereas SEFA uses the EPA life cycle inventory and the localized pathway uses Chinese national and literature-derived data. Third, emission factor selection differs for grid electricity, diesel, on-road vehicles, and non-road equipment. Fourth, source classification differs: Sitewise™ uses activity-based modules, and SEFA uses broader source groups, and the localized pathway uses fuel/activity categories. Classification primarily changes source attribution and hotspot interpretation; it does not explain large differences in indicator totals by itself. Fifth, calculation architecture differs among volume-by-unit-factor, horsepower-by-load-factor-by-hours, and fuel/electricity-by-factor formulations. Only the comparison unit and common foreground program were harmonized; the remaining mechanisms were retained, disclosed, and interpreted individually.

2.3. Case Study Site and Data Inventory

2.3.1. Site, Remediation Scheme, and Representativeness

The case study site was a former integrated steel production facility in northern China, decommissioned in 2016 after about 60 years of operation. Primary contaminants included benzo(a)pyrene, lead, and arsenic, with contamination extending to depths of 4–6 m. The remediation strategy comprised complete excavation of soils exceeding the risk-based cleanup thresholds defined in HJ 25.3-2019, followed by off-site co-processing at a cement kiln located approximately 200 km from the site [12,13,25]. Project activities spanned investigation and active remediation. The common foreground boundary included the transport leg to the kiln receiving gate but excluded kiln operation and any material or fuel substitution credit. This excavation-and-haul remediation chain is common for Chinese industrial brownfields [2,6], making the case suitable for an initial examination of localization effects when U.S.-calibrated GSR footprint tools are applied in a Chinese remediation context.

2.3.2. Data Collection and Input Inventory Construction

The input inventory was constructed following the foreground/background separation convention used in process-based LCA [26,27]. Quantitative inputs were classified as M (directly measured), C (construction or project record), E (engineering estimate or scenario assumption), or D (model-derived). No directly measured fuel or activity data and no complete, independently auditable activity-level construction records were available. The 200 km haul distance is a one-way approximate engineering route distance estimate, and 27.84 MW·h of on-site electricity is likewise an engineering estimate. The localized transport linkage screen explicitly converts the one-way distance to round trip vehicle kilometers; the treatment of return travel, empty backhaul, and load factor inside the archived native Sitewise™ and SEFA runs could not be independently verified without their project workbooks. Total diesel use and its allocation among transport, equipment, and other activities were derived from Sitewise™ outputs, while soil mass, trips, and equipment hours were back-calculated using engineering assumptions. Tables S2, S3, and S14 report the classification, derivation, and boundary status of these inputs.
A harmonized Sitewise-informed foreground activity basis was used to represent the same remediation program across the three pathways. Because Sitewise™ and SEFA require different native inputs, the common activity basis was translated rather than supplied as literally identical cells: Sitewise™ used activity quantities and unit factors, SEFA used equipment power, load factors, hours, and transport inputs, and the localized pathway used the fuel–energy balance and category shares with China-specific factors. This design controls the foreground scenario as far as the available records permit, while retaining differences in background scope, database, factor selection, classification, and calculation architecture. It therefore does not isolate emission factors as the sole cause of cross-pathway divergence.
Background factors came from three jurisdictionally distinct sources: the built-in Sitewise™ database, the SEFA inventory derived from EPA/600/R-16/176a, and the China-specific factors assembled for this study (Table 1). Table S2 provides the activity input inventory and M/C/E/D classification; Table S3 reports the energy decomposition and engineering back-calculations; Table S8 provides the equation-by-equation reproducibility ledger; Table S9 separates the five methodological mechanisms; and Table S14 records the process-level foreground and background boundary status, explicit exclusions, and items that cannot be verified from the archived outputs. Tables S1, S2, and S4 additionally report the recoverable input mapping, tool versions, and outputs.

2.4. Sitewise-Informed China-Localized Recalculation

2.4.1. Construction and Dependence of the China-Localized Recalculation

The China-localized recalculation multiplied activity quantities by corresponding emission or energy intensity factors and summed the results within the defined foreground boundary. All three pathways represented the same comparison unit and common foreground program (Figure 2), but they did not share a fully identical background life cycle scope. The localized pathway uses a mixed background treatment—well-to-wheel for GHG and combustion-based for criteria air pollutants—and therefore represents a recalculation under alternative regional factors, not an independently constructed inventory or a fully boundary-harmonized counterfactual.
The China-localized pathway is not independent of Sitewise™ at the activity data level. Both the total diesel quantity and its allocation among transport, equipment, and other activities were derived from Sitewise™ outputs. Specifically, total diesel use was obtained by decomposing the Sitewise™ total energy result, and the 61%, 34%, and 5% activity shares were taken from Sitewise™ category outputs. Soil mass, transport trips, and equipment operating hours reported for the localized pathway were then back-calculated from these allocated fuel quantities using typical engineering parameters (Tables S2 and S3). Independence is limited to the China-specific emission factors and the separate recalculation equations. Consequently, the localized pathway is used to examine how reported footprints change when selected regional factors are applied within a fixed Sitewise-informed activity structure. It is not an independently documented project inventory and does not provide an external basis for evaluating the two tools. The recalculation was implemented in Python 3.12.
Diesel use was derived from the Sitewise™ project energy balance. The Sitewise™ gate-to-gate energy result was 840.0 MMBtu. The engineering estimate of 27.84 MW·h of on-site electricity corresponded to approximately 95.0 MMBtu using 3.412 MMBtu/MW·h. The remaining 745.0 MMBtu was assigned to diesel energy use, equivalent to approximately 21,895 L using 1055.06 MJ/MMBtu and a diesel lower heating value of 35.9 MJ/L. This diesel quantity was allocated to transport, equipment, and other activities using Sitewise™ activity category proportions of approximately 61%, 34%, and 5%, respectively. Allocation uncertainty of ±5–10 percentage points was evaluated in Section 3.5. Tables S2, S3, and S8 identify all model-derived quantities, engineering assumptions, conversion coefficients, and intermediate calculations.

2.4.2. Selection of China-Specific Emission Factors

The China-localized factors in Table 1 were selected to reflect domestic vehicle standards, non-road equipment standards, grid electricity and fuel specifications. Direct diesel CO2 emissions were calculated using the IPCC Tier 1 basis of 2.66 kg CO2/L. The well-to-wheel value of 3.11 kg CO2-eq/L was retained as an explicit screening assumption by applying a 17% upstream increment to the combustion value, informed by the JEC well-to-tank accounting framework [28,30]; it is not presented as a directly reported China-specific factor. Truck NOx and PM factors were selected to represent China VI heavy-duty vehicles equipped with selective catalytic reduction (SCR) and diesel particulate filter (DPF) systems, using published portable emissions measurement system (PEMS) and on-board diagnostics (OBD) measurements converted to a per-liter fuel consumption basis [31,32,33]. Non-road equipment factors were selected to represent China Stage III construction machinery, for which measured NOx emission factors remain substantially higher than those in the U.S. Tier 4 final equipment [35,36,39]. This contrast creates an important asymmetry: transport emissions are lower under China VI truck standards, whereas equipment emissions remain elevated under Stage III non-road standards. Grid electricity uses the adopted national average screening value of 0.532 kg CO2/kWh, which is close to the subsequently published official 2023 national factor of 0.5306 kg CO2/kWh [37]. Diesel-related SOx emissions were calculated using the China VI ultra-low-sulfur diesel specification (≤10 ppm S; GB 19147-2016 [34]).

2.4.3. Three-Way Numerical Comparison and Interpretation Protocol

The three-way comparison was conducted in two steps. First, totals within the defined assessment boundary were compared across the three pathways. Pairwise numerical differences, expressed as relative percentages, were calculated for Sitewise™–SEFA, Sitewise™–localized, and SEFA–localized comparisons. For descriptive purposes in this case, numerical dispersion was classified as limited, intermediate, or wide using the predefined thresholds of ≤30%, >30% to ≤100%, and >100%, respectively. These categories summarize numerical spread only and do not represent quality or performance classes. Second, the observed differences were interpreted through system boundary, background database, emission factor selection, source classification, and calculation architecture. Where the available inputs supported a transparent calculation, a partial numerical bridge was reported; otherwise, the likely direction and unresolved joint pathway contribution were described. The comparison characterizes pathway dependence within the stated boundary and does not identify a universal correction factor.
Transport scenarios were additionally subjected to a physical linkage audit. For transported soil mass M, truck payload P, one-way haul distance D, round trips N, round trip vehicle kilometers VKT, fuel economy FC (L/100 km), and transport fuel F, the audit used N = M/P, VKT = 2DN, and F = VKT × FC/100. A linked scenario was then calculated as Fs = F0(Ms/M0)(Ds/D0), with total indicator response Ei,s = Ei,fixed + FsEFi. Only one of M or D was varied at a time. Consequently, equal proportional reductions in transported quantity and distance produce equal direct transport-fuel responses when payload, fuel economy, and non-transport emissions are fixed. Native tool field outputs were retained, but any field response that could not be traced through this chain was classified as unlinked and excluded from the physically linked comparison of scenario responses. Table S11 reports the equations and screening results.

2.4.4. Structured Uncertainty and Conditional Ordering Analysis

A 10,000-run Monte Carlo screen was applied to the transparent China-localized pathway. Triangular distributions represented epistemic ranges for engineering estimates, regional grid conditions, fuel properties, activity allocation, and vehicle/equipment factors (Table S12). The fixed Sitewise™ total energy output was retained; sampled electricity use was balanced by diesel energy, transport and equipment shares summed to 95%, and the 5% residual other-fuel share was held fixed. Criteria pollutant grid factors shared one multiplier to preserve directional correlation. Sitewise™ and SEFA outputs were held fixed because their internal factors and archived workbooks were unavailable. The Monte Carlo results therefore describe how the localized recalculation moves relative to those fixed outputs under the tested assumptions; they do not represent a joint uncertainty comparison of all three pathways. Outputs were summarized by the 5th, 50th, and 95th percentiles, the percentage of draws retaining the baseline directional relationship, and Spearman rank correlation. The distributions are screening representations of knowledge uncertainty, not fitted sampling distributions. A fixed seed of 20260726 was used for reproducibility.

3. Results

3.1. Bilateral Comparison of Sitewise™ and SEFA Outputs

3.1.1. GHG and Energy: Case-Specific Numerical Proximity

Within the defined assessment boundary, Sitewise™ and SEFA produced total GHG estimates of 61.6 and 66.2 t CO2-eq, respectively, corresponding to a pairwise difference of 7%. Their total energy estimates were 840.0 and 1064.6 MMBtu, respectively, corresponding to a pairwise difference of 27%. Both pathways used the same reported on-site electricity input of 27.84 MW·h (Table S4). Under the numerical dispersion thresholds adopted for descriptive comparison in this study, both differences were classified as limited.
The higher SEFA energy estimate is consistent with its broader inclusion of upstream life cycle energy burdens, whereas Sitewise™ retains a more predominantly combustion-oriented energy boundary. The higher investigation-stage GHG value reported by SEFA is also consistent with the inclusion of off-site laboratory-related burdens in its native calculation structure [14,17]. Because the archived project workbooks and complete source-level calculation terms were unavailable, these mechanisms are interpreted as pathway-consistent explanations rather than as a complete quantitative decomposition of the observed differences.
The bilateral comparison therefore shows close numerical proximity for GHG and a somewhat larger difference for total energy under the assumptions and assessment boundaries of this case. This proximity does not establish methodological equivalence or support a general ranking of the two tools. As examined in Section 3.3, both GHG estimates are lower than the Sitewise-informed China-localized recalculation. That directional pattern is interpreted as a case-specific difference associated with regional factor substitution, retained background scope, activity translation, and calculation architecture; it does not support a general judgment about the relative performance of the tools.

3.1.2. Air Pollutant Outputs: Strong NOx Divergence and Opposite PM Direction

Air pollutant outputs showed substantially greater pathway dependence than GHG and energy within the defined assessment boundary (Table S4). Sitewise™ and SEFA produced NOx estimates of 0.0504 and 0.3952 t, respectively, corresponding to a pairwise difference of 684%. For SOx, the SEFA estimate was 32% higher than the Sitewise™ estimate. PM showed the opposite direction, with the Sitewise™ estimate 37% higher than the SEFA estimate. These comparisons refer to combustion- and electricity-related particulate emissions within the defined boundary; fugitive dust was excluded.
Sitewise™ additionally reports an on-site NOx component of 0.0168 t, equivalent to approximately 33% of its defined boundary NOx total. A directly corresponding disaggregated value is not available from the archived SEFA output because SEFA uses broader source-group aggregation. The difference in reporting resolution affects source attribution and interpretation but, by itself, does not explain the large difference in the total NOx estimates.

3.1.3. Case-Specific Interpretation of Bilateral Similarity and Divergence

Across the five shared indicators, GHG and total energy were numerically closer between Sitewise™ and SEFA than the criteria-air pollutant estimates. In contrast, NOx, SOx, and PM differed in both magnitude and direction. These differences reflect the combined influence of pathway-specific background scope, database provenance, emission factor selection, source classification, and calculation architecture. For the present case, the two tools therefore provide broadly similar GHG estimates within their respective retained boundaries, but markedly different air pollutant profiles. This pattern should be interpreted as evidence of pathway dependence under the stated assumptions, rather than as indicating that one tool provides a generally superior estimate.

3.2. Case-Specific Footprint Hotspots and Source Attribution Differences

In this excavation-and-transport case, both Sitewise™ and SEFA assigned more than 97% of their respective GHG and total energy estimates to the active remediation stage within the defined assessment boundary (Table S4). Within that stage, contaminated soil transport and heavy equipment operation were the principal activity categories represented in the two pathways. These results indicate that transport and equipment operation are plausible candidate areas for footprint reduction screening in the present case and within the stated boundary [19,40]. They do not establish that the same activity priorities would apply to other sites, remediation technologies, or inventory structures.
The pollutant-specific source attribution results were less consistent across pathways. For NOx, Sitewise™ assigned the largest share of its estimated total to equipment operation, whereas SEFA assigned the largest share to transport (Table S6). These contrasting attribution patterns reflect differences in source classification, background scope, embedded factors, and calculation architecture. They should therefore be interpreted as pathway-specific hotspot profiles rather than as independent determinations of the actual dominant NOx source at the site.
Similarity at the broad remediation stage level does not necessarily imply similarity at the pollutant source level. Consequently, mitigation priorities inferred from either pathway should be examined together with the underlying activity mapping, factor assumptions, and reporting structure. The practical implications of these pathway-specific attribution patterns are evaluated further in Section 3.4.

3.3. Three-Way Comparison Under the Sitewise-Informed China-Localized Assumptions

3.3.1. Overview of the Three Pathway Estimates

Table 2 summarizes the defined-boundary pathway estimates generated by Sitewise™, SEFA, and the Sitewise-informed China-localized recalculation. The three pathways produced different indicator-specific patterns. GHG and energy showed comparatively limited numerical dispersion, whereas NOx, SOx, and PM showed substantially wider differences in both magnitude and direction.
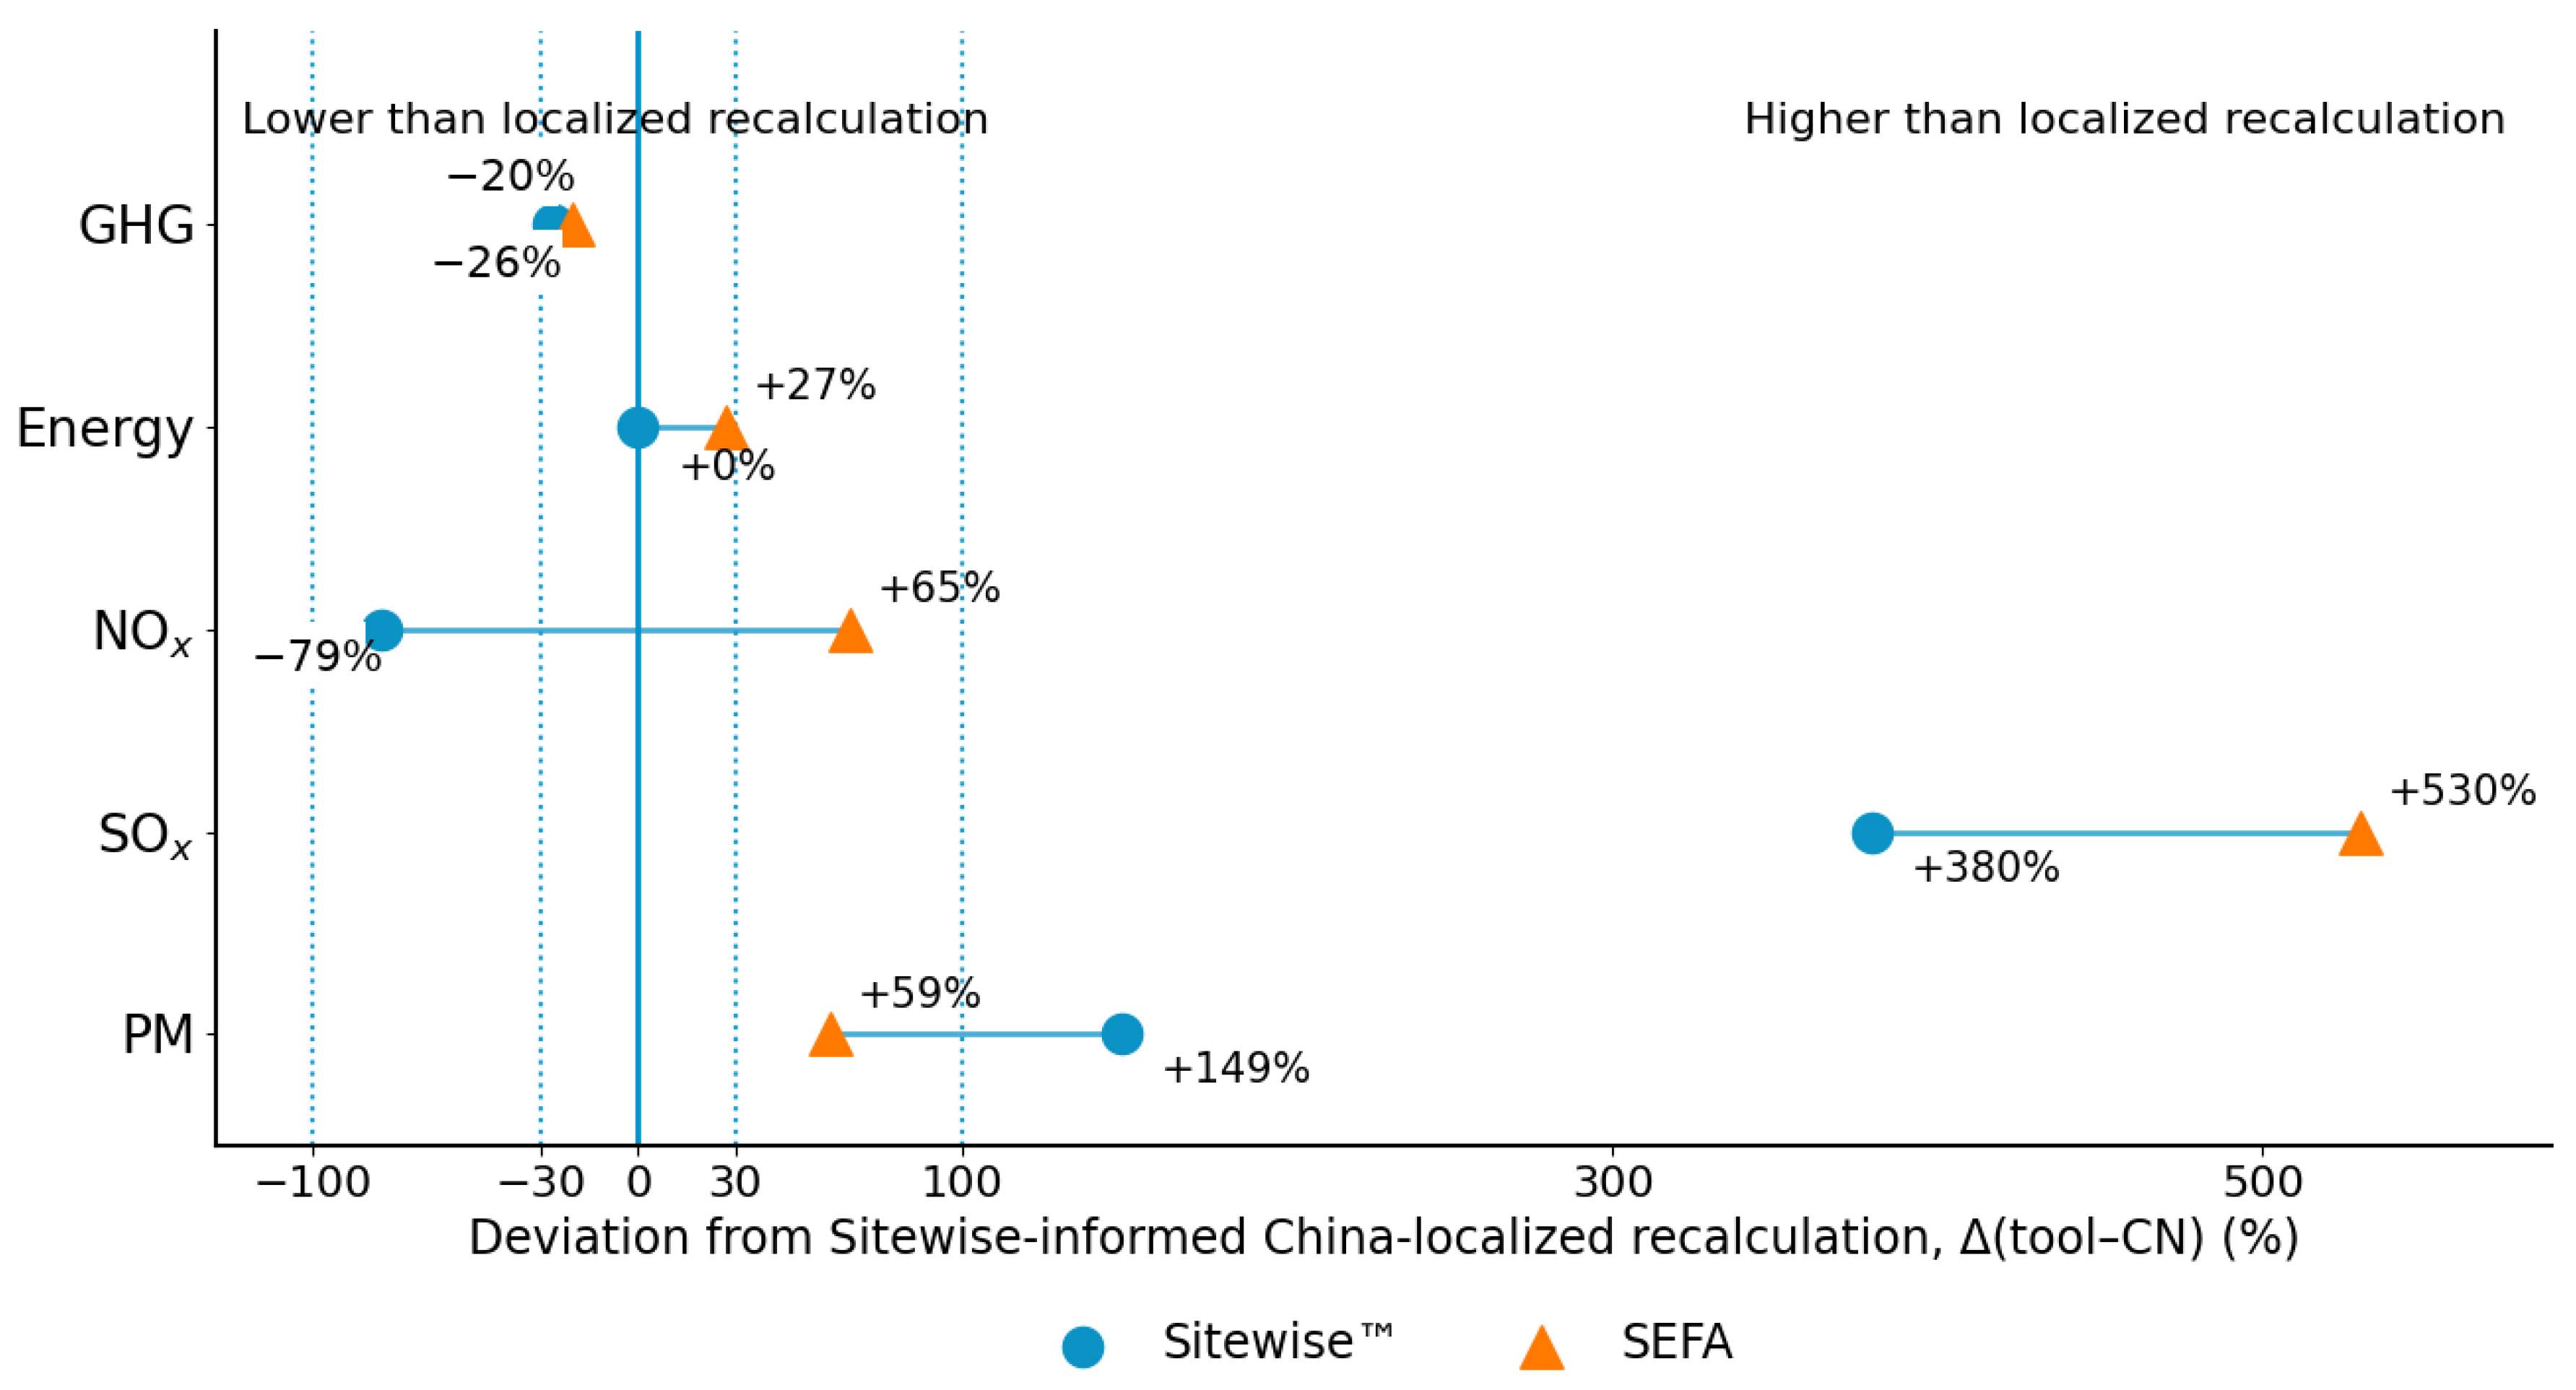
For GHG, the Sitewise™ and SEFA estimates were 26% and 20% lower, respectively, than the localized recalculation. Sitewise™ and the localized pathway produced the same total energy value because the localized energy balance was derived directly from the Sitewise™ output, whereas the SEFA energy estimate was 27% higher. For NOx, the localized estimate of 0.239 t fell between the Sitewise™ estimate of 0.050 t and the SEFA estimate of 0.395 t. For SOx and PM, both tool estimates were higher than the localized recalculation, although their relative positions differed between the two indicators.
These directional relationships describe the outputs of the three pathways under the assumptions of the present case. Because the pathways share a common remediation program but retain different background scopes, databases, emission factors, source classifications, and calculation architectures, the observed numerical differences describe case-specific pathway relationships rather than a preferred or externally confirmed result. The localized pathway serves as a conditional screening baseline within the Sitewise-informed activity structure, rather than as a reference value against which tool performance is judged.
Among the five indicators, NOx exhibited the widest bilateral tool difference. The localized value lay between the two tool outputs, but this bracketing does not establish the localized result as a preferred reference value. Instead, it illustrates how alternative combinations of background factors, source attribution, and activity-to-emission conversion can produce materially different outputs from the same broadly represented remediation program. Stage-level results are reported in Table S4.
Figure 3 presents the same three-way result set after normalizing each indicator to the Sitewise-informed China-localized recalculation and separating relative estimates from signed deviations.

3.3.2. GHG and Energy: Screening Attribution of Grid, Scope, and Residual Differences

The GHG comparison is informative because Sitewise™ and SEFA produced relatively similar values, while both were numerically lower than the Sitewise-informed China-localized recalculation. The Sitewise-to-localized and SEFA-to-localized numerical differences were 21.33 and 16.70 t CO2-eq, respectively.
Because the archived project workbooks were unavailable, the exact project-specific electricity factors embedded in the Sitewise™ and SEFA calculations could not be recovered. A common U.S. reference grid factor of 0.385 kg CO2/kWh was therefore used as a transparent screening counterfactual rather than as a reconstruction of either tool’s internal electricity module. For 27.84 MW·h, the difference between this reference factor and the Chinese national factor of 0.532 kg CO2/kWh corresponds to 4.09 t CO2-eq.
This grid factor substitution represents 19.2% of the Sitewise-to-localized numerical difference and 24.5% of the SEFA-to-localized numerical difference. Electricity grid localization alone therefore does not account for the full difference among the pathway estimates. A hypothetical zero-carbon-grid screen yields a localized total of 68.09 t CO2-eq, which remains numerically above both tool outputs. For the Sitewise comparison, replacing the direct diesel combustion factor of 2.66 kg CO2/L with the localized well-to-wheel factor of 3.11 kg CO2-eq/L contributing an additional 9.85 t CO2-eq. Together, the screened grid and diesel scope terms account for 65.4% of the Sitewise-to-localized numerical difference. The remaining 7.39 t is retained as a joint residual associated with unresolved factor, mapping, boundary, and architecture effects, rather than as evidence favoring or disfavoring either tool.
A corresponding source-level decomposition for SEFA is not supported by the available records. The total energy comparison also requires separate interpretation: equality between Sitewise™ and the localized pathway is structural because the latter retains the Sitewise-derived 840.0 MMBtu energy balance, whereas the higher SEFA value is consistent with broader upstream energy accounting. Full screening calculations are provided in Table S10.

3.3.3. NOx: Opposite Directional Differences Around the Localized Recalculation

The NOx results provide the clearest example of pathway dependence in this case. Sitewise™, the Sitewise-informed China-localized recalculation, and SEFA produced estimates of 0.050, 0.239, and 0.395 t, respectively. Thus, the Sitewise™ estimate was lower than the localized recalculation, whereas the SEFA estimate was higher.
The comparatively low Sitewise™ output is consistent with differences between its predominantly older U.S.-calibrated NONROAD/DOE background structure and the China Stage III non-road equipment factors applied in the localized recalculation. The higher SEFA output is consistent with its broader life cycle background scope, embedded upstream burdens, and different factor set. SEFA’s broader Transport category also assigns a larger proportion of estimated NOx to haulage-related activities. These mechanisms should be interpreted cautiously because their individual contributions cannot be separated quantitatively without the archived source-level workbooks.
The three pathway outputs therefore define a case-specific NOx interval of 0.050–0.395 t under the stated assumptions. The localized result provides a China-factor recalculation point within this interval, but because it retains Sitewise-derived fuel quantities and activity shares, it is not an independently documented comparison standard. The fact that the two tool outputs fall on opposite sides of the localized result is best described as a case-specific bracketing pattern under the stated assumptions.

3.3.4. SOx and PM: Directional Differences Associated with Fuel, Fleet, and Background Assumptions

For SOx, the Sitewise-informed China-localized recalculation produced 0.010 t, compared with 0.048 t for Sitewise™ and 0.063 t for SEFA. Both tool estimates were therefore higher than the localized result under the assumptions of this case. The localized SOx value is strongly influenced by the China VI ultra-low-sulfur diesel factor, but the numerical difference cannot be attributed to fuel sulfur alone because background scope, database provenance, and calculation structure also differ.
For PM, the equation-by-equation recalculation yielded 0.01224 t, reported as 0.012 t. The Sitewise™ and SEFA estimates were 149% and 59% higher, respectively, than the localized value. This comparison is limited to combustion- and electricity-related PM because fugitive dust was excluded from the common assessment boundary. Differences in fleet and equipment factors are plausible contributors, but the interacting effects of database vintage, background scope, source mapping, and activity conversion architecture prevent attribution to a single factor.
The SOx and PM results should therefore be described as higher or lower pathway estimates relative to the localized recalculation, with explicit reference to the localized recalculation and the assumptions of this case. Their practical significance lies in demonstrating that criteria air pollutant outputs are particularly sensitive to fuel specifications, fleet assumptions, equipment standards, and retained background treatment.

3.4. Pathway-Specific Responses to Transport-Related Scenarios

A one-at-a-time sensitivity analysis examined five transport-related variables using the native scenario functions available in Sitewise™ and SEFA (Table 3; see Table S5 for detailed haul distance responses). The interpretation distinguishes between native tool field responses and physically linked screening responses. Because the two tools use different input structures, propagation rules, and background scopes, the reported responses characterize pathway behavior under the configured scenarios rather than independently verified project-level mitigation effects. In the archived SEFA output, a 50% reduction in the waste volume field left energy, GHG, and NOx at 100% of baseline, whereas a reduction in haul distance produced substantial changes. This pattern indicates that the modified quantity field was not verifiably propagated through trips, vehicle kilometers, or transport fuel in the archived scenario. Because the original SEFA workbook is unavailable, the underlying reason cannot be determined. The response is therefore retained as a diagnostic native output but excluded from the physically linked comparison of scenario responses.
The native SEFA road-to-rail scenario produced GHG and NOx values equivalent to 14% and 10% of its baseline, respectively. These results are retained as pathway-specific screening outputs rather than as confirmed project-level reductions. A complete intermodal inventory was not available, including the rail route, first- and last-mile truck transport, terminal handling, return trip treatment, traction energy source, and unchanged non-transport activities. Accordingly, the rail outputs are excluded from project-level quantitative comparison and are used only to indicate that modal substitution warrants project-specific assessment.
To provide a physically auditable comparison, the Sitewise-informed localized transport screen linked transported quantity, haul distance, vehicle kilometers, and transport diesel explicitly while holding payload, fuel economy, electricity use, equipment fuel, and other non-transport components fixed. Under this linkage, a 25% reduction in either transported quantity or haul distance reduced transport diesel by 25%, total energy by 13.5%, GHG by 12.5%, NOx by 5.3%, SOx by 0.5%, and PM by 0.9%. These linked results are conditional screening calculations based on the Sitewise-derived transport-fuel baseline; they are not reconstructed Sitewise™ or SEFA outputs.
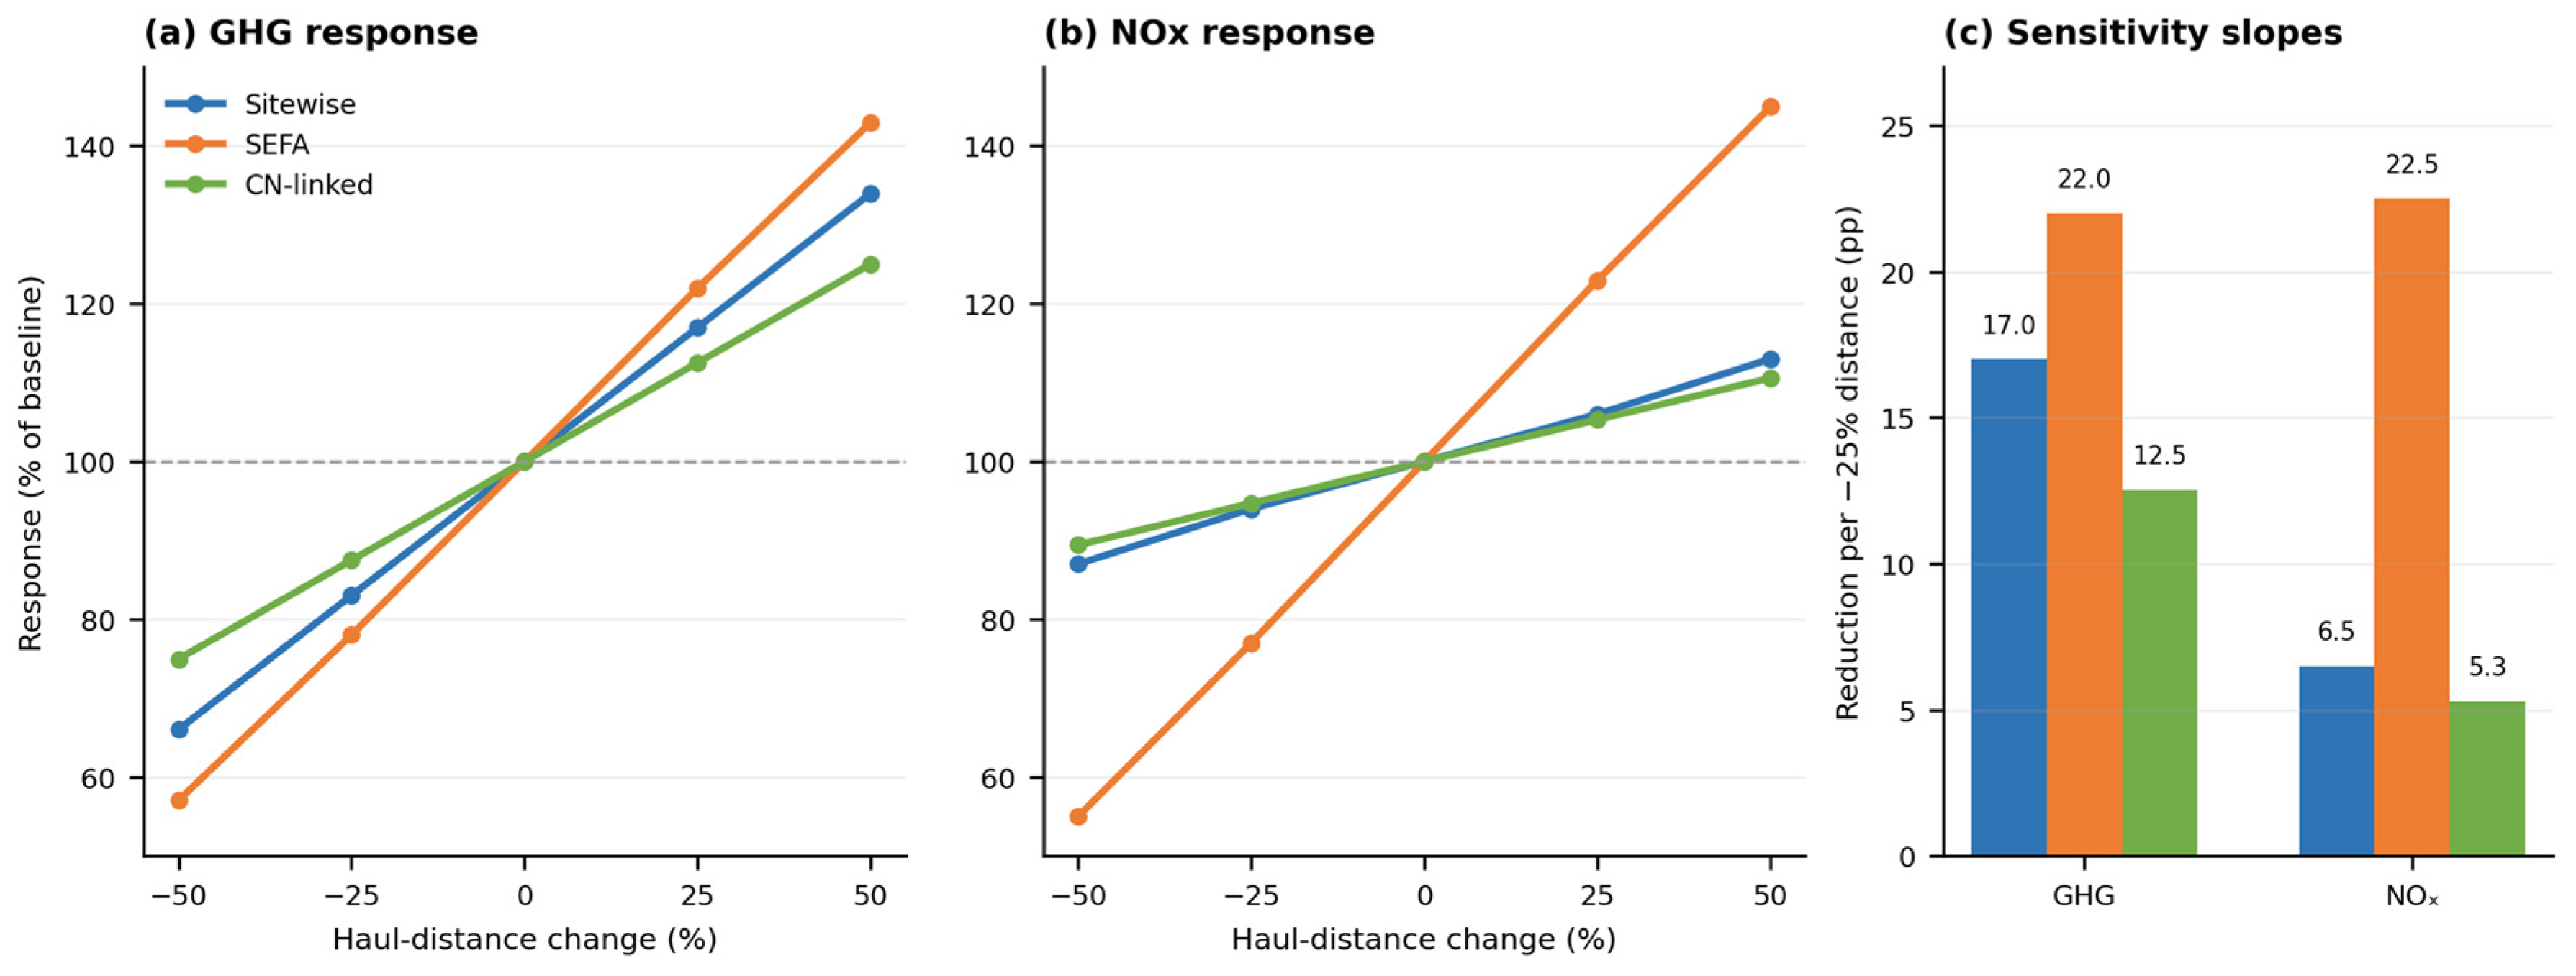
In the native tool runs, a 25% reduction in haul distance reduced the Sitewise™ and SEFA GHG estimates by approximately 17% and 22%, respectively, while the linked localized screen produced a 12.5% reduction. For NOx, the corresponding responses were approximately 6–7%, 23%, and 5.3%. These ranges describe pathway-specific responses under the present case assumptions and should not be treated as transferable reduction coefficients.
For NOx, the native response slopes differed substantially across the configured pathways. These differences are consistent with their distinct source attribution and propagation structures and should not be interpreted as alternative measurements of a single true response coefficient. The unlinked SEFA waste volume output is excluded from this comparison. These pathway-specific haul-distance responses are summarized in Figure 4.

3.5. Uncertainty Screening and Conditional Ordering Relative to Fixed Tool Outputs

The uncertainty analysis distinguishes four issues: uncertainty in the Sitewise-informed activity basis, representativeness and regional variability of the localized factors, conditional ordering under simultaneous parameter variation, and structural differences that cannot be represented through the present Monte Carlo screen (Table S7).

3.5.1. Uncertainty in the Sitewise-Informed Activity Basis

The localized recalculation combines engineering estimates and model-derived inputs. No directly measured fuel use data or complete, independently auditable activity-level construction records were available. On-site electricity use was varied by ±15% around 27.84 MW·h, while the Sitewise™ total energy output of 840.0 MMBtu was retained as the fixed energy balance starting point. The Sitewise-derived transport diesel share was varied from 51% to 71%, with the equipment share varying inversely and the 5% residual other-fuel share held fixed. This screen evaluates variation within the disclosed Sitewise-informed China-localized recalculation rather than uncertainty in a fully independent field inventory.

3.5.2. Representativeness and Regional Variability of the Localized Factors

The selected localized factors represent plausible regulatory and technology conditions for screening, rather than site-specific measurements. Their applicability depends on the actual grid region, vehicle fleet, equipment stage, maintenance condition, load, road gradient, and after-treatment performance. Official regional grid CO2 factors were used as screening bounds, while broader multipliers for grid criteria pollutants and PM were treated as epistemic assumptions rather than statistical confidence intervals.

3.5.3. Conditional Ordering Under the Tested Parameter Ranges

The localized recalculation produced P5–P95 screening intervals of 76.38–85.63 t CO2-eq for GHG, 0.198–0.280 t for NOx, 0.0068–0.0140 t for SOx, and 0.0091–0.0197 t for PM (Table S13; Figure S1). Within the tested ranges, the localized GHG estimates remained above the fixed Sitewise™ and SEFA outputs in every draw, the localized NOx estimates remained between them in every draw, and the localized SOx estimates remained below both in every draw. Total energy remained 840.0 MMBtu because the inherited energy balance was imposed by construction.
For PM, the baseline relationship localized < SEFA < Sitewise™ was retained in 92.7% of draws. The localized result exceeded the fixed SEFA output in 7.3% under higher equipment PM assumptions but did not exceed the fixed Sitewise™ output. These percentages describe conditional ordering relative to fixed archived tool outputs; they do not represent empirical probabilities of real-world ordering or a statistical performance comparison among the tools.

3.5.4. Structural Limits of the Uncertainty Screen

Sitewise™ and SEFA internal parameters were not sampled because the archived workbooks and source-level internal terms were unavailable; their totals were retained as fixed comparison outputs. The localized pathway inherits the Sitewise™ energy balance and activity category shares and retains a mixed well-to-wheel/combustion background treatment. The conditional ordering results therefore answer only whether the localized recalculation crosses the fixed tool outputs under the specified assumptions. A fuller uncertainty comparison would require independently documented activity inventories, site-specific factors, field measurements, and access to the original workbooks.

4. Discussion

4.1. Mechanisms Associated with Case-Specific Pathway Differences

The numerical differences observed among Sitewise™, SEFA, and the Sitewise-informed China-localized recalculation are associated with five interacting methodological mechanisms: system boundary, background database, emission factor selection, source classification, and calculation architecture. These mechanisms help interpret the direction and magnitude of the pathway outputs in the present case, but they do not constitute a complete causal decomposition. The comparison unit and common foreground program were harmonized, whereas complete background life cycle scope, database provenance, regional factors, source mappings, and activity-to-emission transformations remained pathway-specific. The transparent grid factor counterfactual and screened diesel term provide partial numerical bridges for GHG, while the remaining differences should be treated as unresolved joint pathway effects rather than assigned to a single mechanism or interpreted as intrinsic characteristics of tool performance.

4.2. Case-Specific Directional Relationships Relative to the Localized Recalculation

The three-way comparison can be summarized as a set of case-specific directional relationships relative to the Sitewise-informed China-localized recalculation (Table 4). These relationships describe whether each archived tool output was numerically lower than, higher than, or approximately equal to the localized recalculation under the stated assumptions. They do not support a general judgment about the relative performance of the tools.
For Sitewise™, the GHG and NOx estimates were lower than the localized recalculation, total energy was equal by construction, and the SOx and PM estimates were higher. For SEFA, the GHG estimate was lower, whereas energy, NOx, SOx, and PM were higher than the localized recalculation. The magnitude and direction differed by indicator, confirming that the comparison does not support a single correction direction or a uniform adjustment factor for either tool.
The uncertainty screen examined whether these directional relationships changed when selected localized inputs and factors were varied simultaneously. GHG, NOx, and SOx retained their baseline relationships throughout the tested ranges, whereas PM crossed the fixed SEFA output in 7.3% of draws. These percentages describe conditional ordering relative to fixed archived results, not a joint uncertainty comparison of the three pathways.
The practical value of the directional profiles is diagnostic rather than evaluative. They identify which indicators are most sensitive to regional factors and pathway structure in the present case and indicate where localized sensitivity checks may be most informative. Table 4 should therefore be read as a case-informed interpretation matrix rather than a rating or ranking of Sitewise™ and SEFA.

4.3. Implications for Case-Based Screening and Future Tool Development

The present case suggests several practical considerations for remediation footprint applications outside the original calibration context of established tools. Assessments involving substantial excavation, transport, and non-road equipment use may benefit from sensitivity checks using regionally applicable factors for electricity generation, diesel life cycle treatment, fuel sulfur content, heavy-duty vehicles, and construction equipment. Because the direction and magnitude of pathway differences vary by indicator, localization should not be implemented through a single uniform adjustment factor.
Where sufficiently transparent activity data are available, practitioners may use Sitewise™ and SEFA in parallel with a clearly documented factor localization recalculation. The purpose is to examine sensitivity to regional factors, background scope, activity translation, and calculation architecture. The localized pathway should be presented as a conditional diagnostic calculation based on the disclosed activity structure, rather than as an independent reference for judging the tools.
The transport scenario results also illustrate the importance of physically traceable activity chains. Shorter haul distance is a plausible candidate for screening in this case, but the estimated 12.5–22% GHG response to a 25% distance reduction depends on pathway-specific assumptions and should not be used as a general reduction coefficient. The native SEFA road-to-rail result likewise warrants project-specific evaluation rather than direct use as a decision-grade estimate.
For future tool development, the case highlights the value of more auditable input propagation, clearer disclosure of background scope treatment, transparent source-level outputs, and scenario modules that preserve physical linkages among activity quantity, distance, fuel use, and emissions. These priorities should be evaluated across broader datasets and remediation settings [40,41].

4.4. Limitations, Scope of Inference, and Future Research Needs

The interpretation of this study is subject to several limitations that define the scope of its conclusions.
First, the framework was demonstrated using a single excavation-and-transport remediation case; other remediation technologies, site conditions, project scales, energy systems, and logistics arrangements may produce different indicator patterns.
Second, the China-localized pathway is not independent of Sitewise™ at the activity data level. Its total energy balance, diesel quantity, and activity category allocations were derived from Sitewise™ outputs, and several activity quantities were back-calculated using engineering assumptions. It therefore evaluates alternative regional factors and equations within a Sitewise-informed activity structure and does not provide an independent field inventory or external reference value.
Third, the foreground inventory contains no direct fuel measurements or complete, independently auditable activity-level construction records. Fourth, the archived Sitewise™ and SEFA project workbooks and source-level internal calculation terms were unavailable, so several native assumptions could not be reconstructed. Mechanism-level explanations are therefore partial rather than complete causal decompositions.
Fifth, boundary harmonization was limited to the comparison unit and common foreground program. Upstream fuel and electricity treatment remained pathway-specific, and kiln co-processing, substitution credits, fugitive dust, capital goods modeling, long-term monitoring, and redevelopment were excluded. The results are therefore defined-boundary pathway estimates rather than fully harmonized LCA totals.
Sixth, the selected localized factors are standard- or literature-derived rather than project-specific measurements. Seventh, the uncertainty analysis varied only the localized pathway while Sitewise™ and SEFA remained fixed. The reported percentages therefore describe conditional ordering relative to fixed outputs, not joint uncertainty estimates for all three pathways.
Future research should use multiple sites and technologies, independently documented activity inventories, metered fuel and electricity data, project-specific fleet and equipment information, province-specific factors, and complete tool workbooks. An independent activity and emissions inventory not derived from either tool would be required for a stronger evaluation of correspondence between tool outputs and actual project conditions.

5. Conclusions

In this Chinese excavation-and-transport remediation case, Sitewise™ and SEFA produced relatively similar GHG estimates and moderately different total energy estimates within their respective retained boundaries, whereas their NOx estimates differed by nearly a factor of eight. Relative to the Sitewise-informed China-localized recalculation, the Sitewise™ and SEFA GHG estimates were 26% and 20% lower, respectively. The localized NOx estimate fell between the two tool outputs, while both tool estimates were higher than the localized recalculation for SOx and PM. These numerical relationships apply to the activity structure, system boundary, input data, and factor assumptions of the present case.
The observed differences reflect the combined influence of background accounting scope, database provenance, regional factor selection, source classification, activity translation, and calculation architecture. The reference grid screen explained only part of the GHG difference relative to the localized recalculation. The localized pathway should therefore be interpreted as a Sitewise-informed factor localization recalculation rather than as an independent reference for evaluating either tool.
Within the tested localized parameter ranges, the GHG result remained above both fixed tool outputs, the NOx result remained between them, and the SOx result remained below both in every draw. The PM relationship was retained in 92.7% of draws, while total energy remained equal to Sitewise™ by construction. These percentages describe conditional directional relationships relative to fixed archived outputs and do not support general judgments about the comparative performance of Sitewise™ and SEFA.
In the present case, the three-way framework is best interpreted as a case-based diagnostic structure for examining how regional factor substitution and retained pathway differences affect reported remediation footprint estimates. It identified indicators warranting localized sensitivity checks, distinguished broad activity hotspots from pathway-specific source attribution, and revealed where scenario responses require more physically traceable activity linkages. It does not provide a universal correction factor, a general tool ranking, or decision-grade mitigation coefficients transferable across projects.
Broader application requires evaluation across additional sites, remediation technologies, energy systems, fleet conditions, and regulatory contexts. Future studies should use independently documented activity inventories, metered fuel and electricity data, project-specific vehicle and equipment information, province-specific factors, and complete archived tool workbooks. An independent activity and emissions inventory not derived from either tool would be required for a stronger evaluation of correspondence between tool outputs and actual project conditions.

Supplementary Materials

The following supporting information can be downloaded at: https://www.mdpi.com/article/10.3390/su18179147/s1, Figure S1: Epistemic screening distributions for the Sitewise-informed China-localized recalculation shown relative to the fixed archived Sitewise™ and SEFA outputs; Table S1: Input/output indicator structures and functional capabilities: Sitewise™, SEFA, and the Sitewise-informed China-localized recalculation; Table S2: Complete activity-input inventory and data-source classification used for the three-way comparison; Table S3: Sitewise-informed energy-balance decomposition, activity allocation, and engineering back-calculations used in the China-localized recalculation; Table S4: Bilateral environmental-footprint results for Sitewise™ and SEFA by project stage; Table S5: Pathway-specific responses to haul-distance changes; Table S6: Tool-specific source-attribution contrast used to interpret NOx sensitivity results; Table S7: Case-specific uncertainty and conditional directional relationships relative to fixed Sitewise™ and SEFA outputs; Table S8: Reproducibility ledger for the Sitewise-informed China-localized recalculation; Table S9: Methodological harmonization and attribution matrix for the three calculation pathways; Table S10: Electricity-grid counterfactual, zero-grid bound, and regional screening envelope for GHG; Table S11: Transparent transport-activity linkage audit and localized screening results; Table S12: Parameterization of the 10,000-run epistemic Monte Carlo screen; Table S13: Monte Carlo screening intervals, conditional directional relationships relative to fixed tool outputs, and leading uncertainty drivers; Table S14: Process-level system-boundary inclusion, exclusion, and verification matrix.

Author Contributions

Conceptualization, Y.Z.; methodology, Y.Z.; software, Y.Z. (China-localized calculation), C.H., M.G., F.Y., L.L. and X.Y.; formal analysis, J.D.; resources, C.H., M.G., F.Y., L.L. and X.Y.; data curation, Y.Z.; writing—original draft, Y.Z.; writing—review and editing, J.D. and T.C.; visualization, J.D.; supervision, T.C. All authors have read and agreed to the published version of the manuscript.

Funding

This research was funded by the National Key Research and Development Program of China, grant number 2024YFC3713300.

Institutional Review Board Statement

Not applicable.

Informed Consent Statement

Not applicable.

Data Availability Statement

Supplementary material containing Tables S1–S14 and Figure S1 is provided with this article.

Conflicts of Interest

The authors declare no conflict of interest.

References

  1. Thoreson, K.A.; Laitinen, J.; Leonard, G. Sustainability assessment of in situ and ex situ remediation of PFAS-contaminated groundwater. Remediat. J. 2025, 35, e70034. [Google Scholar] [CrossRef] [Scilit]
  2. Hou, D.; Al-Tabbaa, A.; O’Connor, D.; Hu, Q.; Zhu, Y.-G.; Wang, L.; Kirkwood, N.; Ok, Y.S.; Tsang, D.C.W.; Bolan, N.S.; et al. Sustainable remediation and redevelopment of brownfield sites. Nat. Rev. Earth Environ. 2023, 4, 271–286. [Google Scholar] [CrossRef] [Scilit]
  3. Liang, T.; Huo, M.; Yu, L.; Wang, P.; Zheng, J.; Zhang, C.; Wang, D.; Ding, A.; Li, F. Life cycle assessment-based decision-making for thermal remediation of contaminated soil in a regional perspective. J. Clean. Prod. 2023, 392, 136260. [Google Scholar] [CrossRef] [Scilit]
  4. Meng, H.; Nie, Y.; Zhang, C.; Zhang, H.; Dong, J.; Deng, J.; Li, X. A global synthesis on intensity of greenhouse gases emissions from the remediation of contaminated sites based on LCA methodology. J. Clean. Prod. 2025, 498, 145191. [Google Scholar] [CrossRef] [Scilit]
  5. Xu, N.; Fan, Y.; Sun, N.; Ding, Z.Y.; Li, J.W.; Zhang, W.B.; Zhang, Y.K.; Wang, L.; Liu, H.; Zhao, K.; et al. 2021 Market Analysis Report on the Soil Environmental Remediation Industry; Chinese Academy of Environmental Planning and Beijing GeoEnviron Engineering & Technology: Beijing, China, 2022; Available online: https://www.solidwaste.com.cn/news/331835.html (accessed on 6 August 2026). (In Chinese)
  6. Yu, J.; Wang, P.; Yuan, B.; Wang, M.; Shi, P.; Li, F. Remediation technologies of contaminated sites in China: Application and spatial clustering characteristics. Sustainability 2024, 16, 1703. [Google Scholar] [CrossRef] [Scilit]
  7. O’Connor, D.; Hou, D. Sustainable remediation and revival of brownfields. Sci. Total Environ. 2020, 741, 140475. [Google Scholar] [CrossRef] [Scilit] [PubMed]
  8. Hou, D.; Al-Tabbaa, A. Sustainability: A new imperative in contaminated land remediation. Environ. Sci. Policy 2014, 39, 25–34. [Google Scholar] [CrossRef] [Scilit]
  9. Interstate Technology & Regulatory Council (ITRC). Green and Sustainable Remediation: State of the Science and Practice. GSR-1; ITRC: Washington, DC, USA, 2011; Available online: https://itrcweb.org/wp-content/uploads/2024/09/GSR-1.pdf (accessed on 6 August 2026).
  10. Bardos, P.; Bone, B.; Boyle, R.; Ellis, D.; Evans, F.; Harries, N.D.; Smith, J.W.N. Applying sustainable development principles to contaminated land management using the SuRF-UK framework. Remediat. J. 2011, 21, 77–100. [Google Scholar] [CrossRef] [Scilit]
  11. Han, Y.; Deng, J.; Gao, M.; Zhang, H.; Dong, J. International progresses and Chinese development path analysis of contaminated sites green sustainable remediation. Environ. Prot. 2023, 51, 62–67. (In Chinese) [Google Scholar]
  12. HJ 25.1-2019; Technical Guidelines for Investigation on Soil Contamination of Land for Construction. Ministry of Ecology and Environment of China (MEE): Beijing, China, 2019. Available online: https://www.mee.gov.cn/xxgk2018/xxgk/xxgk01/201912/t20191209_748356.html (accessed on 6 August 2026). (In Chinese)
  13. HJ 25.3-2019; Technical Guidelines for Risk Assessment of Soil Contamination of Land for Construction. Ministry of Ecology and Environment of China (MEE): Beijing, China, 2019. Available online: https://www.mee.gov.cn/ywgz/fgbz/bz/bzwb/trhj/201912/t20191224_749893.shtml (accessed on 6 August 2026). (In Chinese)
  14. Randall, P.; Meyer, D.; Ingwersen, W.; Vineyard, D.; Bergmann, M.; Linger, S.; Gonzalez, M. Life Cycle Inventory (LCI) Data—Treatment Chemicals, Construction Materials, Transportation, On-Site Equipment, and Other Processes for Use in Spreadsheets for Environmental Footprint Analysis (SEFA); EPA/600/R-16/176; U.S. Environmental Protection Agency: Cincinnati, OH, USA, 2016. Available online: https://nepis.epa.gov/Exe/ZyPURL.cgi?Dockey=P100SNDQ.TXT (accessed on 6 August 2026).
  15. U.S. Environmental Protection Agency (U.S. EPA). Green Remediation Focus: Spreadsheets for Environmental Footprint Analysis (SEFA). Available online: https://clu-in.org/greenremediation/SEFA/ (accessed on 6 August 2026).
  16. Bhargava, M.; Sirabian, R. SiteWise™ Version 3 User Guide; Report UG-NAVFAC-EXWC-EV-1302; Battelle Memorial Institute and NAVFAC Engineering and Expeditionary Warfare Center: Port Hueneme, CA, USA, 2013. [Google Scholar]
  17. U.S. Environmental Protection Agency (U.S. EPA). Methodology for Understanding and Reducing a Project’s Environmental Footprint; EPA 542-R-12-002; EPA: Washington, DC, USA, 2012. Available online: https://www.epa.gov/greenercleanups/methodology-understanding-and-reducing-projects-environmental-footprint (accessed on 6 August 2026).
  18. Liu, W.; Xia, T.; Zhang, L.; Jia, X.; Zhu, X.; Liang, J.; Cai, M. Environmental footprint analysis of contaminated soil remediation projects based on remediation effects. Res. Environ. Sci. 2022, 35, 2367–2377. (In Chinese) [Google Scholar] [CrossRef]
  19. Xiao, M.; Li, X.; Seuntjens, P.; Sharifi, M.; Mao, D.; Dong, J.; Yang, X.; Zhang, H. Qualitative and quantitative simulation of best management practices (BMPs) for contaminated megasite remediation using the SiteWise™ tool. J. Environ. Manag. 2024, 360, 121098. [Google Scholar] [CrossRef] [Scilit] [PubMed]
  20. Sang, C.; Yang, X.; Li, X.; Zhang, H. Environmental footprint analysis of ex situ soil remediation based on the SEFA method: A case study of a steel plant. China Environ. Sci. 2023, 43, 5359–5367. (In Chinese) [Google Scholar] [CrossRef]
  21. Beames, A.; Broekx, S.; Lookman, R.; Touchant, K.; Seuntjens, P. Sustainability appraisal tools for soil and groundwater remediation: How is the choice of remediation alternative influenced by different sets of sustainability indicators and tool structures? Sci. Total Environ. 2014, 470–471, 954–966. [Google Scholar] [CrossRef] [Scilit] [PubMed]
  22. Zhou, Y.; Xin, Y.; Feng, T.; Sang, C.; Xiao, M.; Zhang, H.; Li, X.; Yang, X.; Dong, J. Environmental footprint analysis of contaminated site remediation based on SiteWise™ and SEFA methods. China Environ. Sci. 2023, 43, 5339–5348. (In Chinese) [Google Scholar] [CrossRef]
  23. Favara, P.J.; Krieger, T.M.; Boughton, B.; Fisher, A.S.; Bhargava, M. Guidance for performing footprint analyses and life-cycle assessments for the remediation industry. Remediat. J. 2011, 21, 39–79. [Google Scholar] [CrossRef] [Scilit]
  24. U.S. Environmental Protection Agency (U.S. EPA). Exhaust and Crankcase Emission Factors for Nonroad Engine Modeling—Compression-Ignition; EPA-420-P-04-009, NR-009c; EPA: Washington, DC, USA, 2004. Available online: https://nepis.epa.gov/Exe/ZyPDF.cgi/P10001WF.PDF?Dockey=P10001WF.PDF (accessed on 6 August 2026).
  25. GB 30485-2013; Standard for Pollution Control on Co-Processing of Solid Wastes in Cement Kiln. Ministry of Environmental Protection of China: Beijing, China; General Administration of Quality Supervision, Inspection and Quarantine of China (AQSIQ): Beijing, China, 2013. Available online: https://www.mee.gov.cn/ywgz/fgbz/bz/bzwb/gthw/gtfwwrkzbz/201312/t20131227_265767.htm (accessed on 6 August 2026). (In Chinese)
  26. ISO 14040:2006; Environmental Management—Life Cycle Assessment—Principles and Framework. International Organization for Standardization (ISO): Geneva, Switzerland, 2006. Available online: https://www.iso.org/standard/37456.html (accessed on 6 August 2026).
  27. ISO 14044:2006; Environmental Management—Life Cycle Assessment—Requirements and Guidelines. International Organization for Standardization (ISO): Geneva, Switzerland, 2006. Available online: https://www.iso.org/standard/38498.html (accessed on 6 August 2026).
  28. Intergovernmental Panel on Climate Change (IPCC). 2006 IPCC Guidelines for National Greenhouse Gas Inventories, Volume 2: Energy; Institute for Global Environmental Strategies: Hayama, Japan, 2006; Available online: https://www.ipcc-nggip.iges.or.jp/public/2006gl/vol2.html (accessed on 6 August 2026).
  29. National Development and Reform Commission of China (NDRC). Guidelines for Accounting Methods and Reporting of Greenhouse Gas Emissions from Industrial Enterprises in Other Industries (Trial); Issued Under NDRC Climate Office Document No. 1722 [2015]; NDRC: Beijing, China, 2015. Available online: https://zfxxgk.ndrc.gov.cn/web/iteminfo.jsp?id=2313 (accessed on 6 August 2026). (In Chinese)
  30. Edwards, R.; Larivé, J.-F.; Rickeard, D.; Weindorf, W.; Godwin, S.; Hass, H.; Krasenbrink, A.; Lonza, L.; Maas, H.; Nelson, R.; et al. WELL-TO-TANK Report Version 4.a: JEC Well-to-Wheels Analysis; EUR 26237 EN; Publications Office of the European Union: Luxembourg, 2014. [Google Scholar] [CrossRef] [PubMed]
  31. Shen, X.; Yao, Z.; Zhang, Q.; Wagner, D.V.; Huo, H.; Zhang, Y.; Zheng, B.; He, K. Development of database of real-world diesel vehicle emission factors for China. J. Environ. Sci. 2015, 31, 209–220. [Google Scholar] [CrossRef] [Scilit] [PubMed]
  32. Wang, J.; Wang, R.; Yin, H.; Wang, Y.; Wang, H.; He, C.; Liang, J.; He, D.; Yin, H.; He, K. Assessing heavy-duty vehicles (HDVs) on-road NOx emission in China from on-board diagnostics (OBD) remote report data. Sci. Total Environ. 2022, 846, 157209. [Google Scholar] [CrossRef] [Scilit] [PubMed]
  33. Li, W.; Dong, Z.; Miao, L.; Wu, G.; Deng, Z.; Zhao, J.; Huang, W. On-road evaluation and regulatory recommendations for NOx and particle number emissions of China VI heavy-duty diesel trucks: A case study in Shenzhen. Sci. Total Environ. 2024, 928, 172427. [Google Scholar] [CrossRef] [Scilit] [PubMed]
  34. GB 19147-2016; Automobile Diesel Fuels. General Administration of Quality Supervision, Inspection and Quarantine of China (AQSIQ): Beijing, China; Standardization Administration of China (SAC): Beijing, China, 2016. Available online: https://openstd.samr.gov.cn/bzgk/std/newGbInfo?hcno=88F31AEECC7F7AE17C5A99496E532D2A (accessed on 6 August 2026). (In Chinese)
  35. GB 20891-2014; Limits and Measurement Methods for Exhaust Pollutants from Diesel Engines of Non-Road Mobile Machinery (China III, IV). Ministry of Ecology and Environment of China (MEE): Beijing, China, 2014. Available online: https://www.mee.gov.cn/ywgz/fgbz/bz/bzwb/dqhjbh/dqydywrwpfbz/201405/t20140530_276305.shtml (accessed on 6 August 2026). (In Chinese)
  36. Wang, C.; Duan, W.; Cheng, S.; Zhang, J. Multi-component emission characteristics and high-resolution emission inventory of non-road construction equipment (NRCE) in China. Sci. Total Environ. 2023, 877, 162914. [Google Scholar] [CrossRef] [Scilit] [PubMed]
  37. Ministry of Ecology and Environment of China (MEE); National Bureau of Statistics of China (NBS). Announcement on the 2023 Electricity Carbon Dioxide Emission Factors (Announcement No. 47 of 2025); Ministry of Ecology and Environment of China (MEE): Beijing, China; National Bureau of Statistics of China (NBS): Beijing, China, 2025. Available online: https://www.mee.gov.cn/xxgk2018/xxgk/xxgk01/202512/t20251231_1139517.html (accessed on 6 August 2026). (In Chinese)
  38. Tang, L.; Qu, J.; Mi, Z.; Bo, X.; Chang, X.; Anadon, L.D.; Wang, S.; Xue, X.; Li, S.; Wang, X.; et al. Substantial emission reductions from Chinese power plants after the introduction of ultra-low emissions standards. Nat. Energy 2019, 4, 929–938. [Google Scholar] [CrossRef] [Scilit]
  39. Shao, Z. The Updated China IV Non-Road Emission Standards. ICCT Policy Update, July 2021; International Council on Clean Transportation: Washington, DC, USA, 2021; Available online: https://theicct.org/wp-content/uploads/2021/12/china-iv-non-road-emission-standards-jul2021.pdf (accessed on 6 August 2026).
  40. Xiao, M.; Li, X.; Zhang, H.; Meng, H.; Dong, J. Environmental impact assessment and remediation decision-making of a contaminated megasite: Combining LCA and IO-LCA. J. Clean. Prod. 2024, 462, 142586. [Google Scholar] [CrossRef] [Scilit]
  41. Cappuyns, V. Environmental impacts of soil remediation activities: Quantitative and qualitative tools applied on three case studies. J. Clean. Prod. 2013, 52, 145–154. [Google Scholar] [CrossRef] [Scilit]
Figure 1. Three-way framework for examining regional localization effects in remediation footprint estimates. A harmonized Sitewise-informed foreground program is translated into the native input structures of Sitewise™, SEFA, and the China-localized recalculation. Pathway-specific background scopes, databases, emission factors, source classifications, and calculation architectures are retained. Numerical differences are interpreted through five methodological mechanisms—system boundary, background database, emission factor selection, source classification, and calculation architecture—and are separated into partially quantifiable terms and unresolved joint pathway effects. The localized pathway is a Sitewise-informed factor localization recalculation rather than an independent activity inventory.
Sustainability 18 09147 g001
Figure 2. Case context, common foreground boundary, explicit cut-offs, and pathway-specific background scopes. Panel (A) summarizes the former steel plant case and remediation route. Panel (B) defines the common foreground from investigation and sampling to two terminal conditions: delivery of contaminated soil to the cement kiln receiving gate and completion of site restoration and handover. The approximately 200 km haul distance is one-way. Kiln operation and substitution credits are symmetrically excluded, together with fugitive dust, long-term monitoring, redevelopment, and deliberate capital goods modeling. Panel (C) shows that the common program is translated into each pathway’s native inputs while background accounting remains pathway-specific. The results are therefore defined-boundary pathway estimates rather than fully boundary-harmonized LCA results.
Sustainability 18 09147 g002
Figure 3. Case-specific direction and magnitude of Sitewise™ and SEFA estimates relative to the Sitewise-informed China-localized recalculation. Pairwise numerical differences are expressed relative to the localized recalculation. The vertical zero line is a conditional comparison origin defined by the localized pathway and does not represent an independently documented project value. Negative and positive values indicate estimates numerically lower or higher, respectively, than the localized recalculation under the assumptions of this case. Dotted lines show the predefined numerical dispersion thresholds, and dumbbell connectors display the interval between the two archived tool outputs. The figure describes case-specific numerical relationships and does not support a general judgment about tool performance.
Sustainability 18 09147 g003
Figure 4. Case-specific haul distance responses in the native Sitewise™ and SEFA runs and the Sitewise-informed localized transport linkage screen. Panels (a,b) show GHG and NOx estimates as percentages of each pathway-specific baseline. Sitewise™ and SEFA represent native tool field responses. CN-linked is a transparent screening calculation in which transport diesel changes proportionally with haul distance while non-transport components remain fixed. Panel (c) shows percentage point changes per 25% reduction in haul distance. The displayed slopes characterize the configured pathways and assumptions of this case and do not represent a single transferable project response coefficient.
Sustainability 18 09147 g004
Table 1. Regional factors and screening assumptions used in the Sitewise-informed China-localized recalculation.
ParameterCN ValueUnitStandardSourceU.S. BaselineDirection Relative to Stated U.S. Screening Baseline
Diesel Combustion—GHG
CO2 emission factor2.66kg CO2/LIPCC 2006 Tier 1IPCC [28]; MEE GHG guideline [29]2.68≈equal
WTW life cycle GHG3.11kg CO2-eq/LWell-to-wheelIPCC combustion basis + explicit 17% upstream screening increment informed by JEC WTT framework [28,30]~3.0≈equal
Heavy-Duty Truck—China VI (On-Road)
Truck NOx3.78g/L dieselChina VI HDVYang et al. [31]; Wang et al. [32]; Li et al. [32]varies aCN lower (SCR)
Truck PM0.034g/L dieselChina VI (DPF)China VI certification and on-road evidence [33]varies aCN lower (DPF)
Truck SOx0.017g/L dieselULSD ≤ 10 ppm SGB 19147-2016 [34]~0.02≈equal
Non-Road Construction Equipment—China Stage III (GB 20891-2014)
Equipment NOx23.5g/L dieselStage III (no SCR)GB 20891-2014 and measurement evidence [35,36]~6–10 bCN higher (no SCR)
Equipment PM1.26g/L dieselStage III (no DPF)GB 20891-2014 and measurement evidence [35,36]~0.03 bCN higher (no DPF)
Electricity Grid—China National Average
Grid CO20.532kg CO2/kWhNational avg.Adopted screening value; official 2023 national factor = 0.5306 kg CO2/kWh [37]0.385CN +38%
Grid SOx0.36g/kWhNational avg.Screening factor derived from national power sector emission evidence in Tang et al. [38]~0.20CN +80%
Grid NOx0.32g/kWhNational avg.Screening factor derived from national power sector emission evidence in Tang et al. [38]~0.18CN +78%
Grid PM0.085g/kWhNational avg.Screening factor derived from national power sector emission evidence in Tang et al. [38]~0.04CN +113%
a U.S. on-road heavy-duty truck baseline values: NOx ~5–12 g/L diesel; PM ~0.05–0.15 g/L. Values vary by model year, duty cycle and tool-specific fuel economy assumptions (Sitewise™ and SEFA documentation [16,17]). b U.S. EPA Tier 4 final non-road equipment NOx: ~2–6 g/L diesel; PM: ~0.03 g/L (EPA 420-P-04-009 [24]). All CN factors correspond to diesel combustion; unit conversions from g/km or g/kWh to g/L use fuel economy of 34 L/100 km (truck) and fuel consumption rate of 0.24 L/kWh (equipment), respectively.
Table 2. Case-specific numerical comparison of three pathway estimates within the defined assessment boundary.
IndicatorSitewise™SEFACN-loc.Δ SW ↔ SE (%)Δ SW ↔ CN (%)Δ SE ↔ CN (%)Three-Way IntervalClass
Shared Indicators—Quantitative Three-Way Comparison
GHG (t CO2-eq)61.666.282.9+7−26−2061.6–82.9Limited
Energy (MMBtu)840.01064.6840.0+270+27840–1065Limited
Electricity (MW·h)27.8427.8427.8400027.84Limited
NOx * (t)0.0500.3950.239+684−79+650.050–0.395Wide
SOx (t)0.0480.0630.010+32+380+5300.010–0.063Wide
PM (t)0.0310.0190.012−37+149+590.012–0.031Wide
Directional Comparison (Relative To Sitewise-Informed Cn Recalculation)
Sitewise™:GHG ↓ · Energy ≈ · NOx ↓↓ · SOx ↑↑ · PM ↑↑
SEFA:GHG ↓ · Energy ↑ · NOx ↑ · SOx ↑↑ · PM ↑
Pairwise relative deviation was calculated as Δ(A–B) = (A − B)/B × 100, where A and B denote the compared pathways. Numerical dispersion was classified as limited when all pairwise |Δ| values were ≤30%, intermediate when the maximum pairwise |Δ| was >30% but ≤100%, and wide when any pairwise |Δ| exceeded 100%. Direction arrows indicate whether each tool reported a value lower than (↓), higher than (↑), or approximately matching (≈; |Δ| < 5%) the Sitewise-informed China-localized recalculation; double arrows denote |Δ| > 100%. NOx was the only indicator for which Sitewise™ and SEFA bracketed the localized recalculation from opposite directions. Stage-level breakdowns are provided in Table S4. The localized recalculation is used only as a conditional comparison point for describing numerical direction and magnitude; it is not an independently documented project inventory and does not support a general judgment about the relative performance of the tools.
Table 3. Case-specific native tool field responses to transport-related scenario changes.
VariableScenarioToolEnergyGHGNOxSOxPMInterpretation Within the Present Case
Sitewise-informed CN recalculation: 840 MMBtu · 82.9 t CO2-eq · 0.239 t NOx · 0.010 t SOx · 0.012 t PM—Sitewise-informed localized screening baseline
Transport distanceHaul distance −50%SW68%66%87%100%98%Native response; does not establish greater intrinsic leverage than quantity
SEFA67%57%55%82%73%
Transport volumeWaste volume −50%SW75%75%89%101%98%SW native response; SEFA quantity field unlinked and excluded from the physically linked comparison
SEFA100% †100% †100% †99%81%
Fuel typeBiodiesel B20SW117%91%99%101%102%GHG −9%; slight energy increase
SEFAN/AN/AN/AN/AN/ANot supported in SEFA
Transport modeTruck → RailSWN/AN/AN/AN/AN/ANot in SW—functional coverage difference
SEFA35%14%10%63%48%Native SEFA screen: GHG −86%, NOx −90%; intermodal chain assumptions unverified; excluded from project-level quantitative comparison
Emission controlDPF installationSW100%101%99%101%15%PM −85%; marginal under China VI (trucks already DPF-equipped)
SEFAN/AN/AN/AN/AN/ANot supported in SEFA
Values are percentages of each native tool baseline, with 100% representing the original remediation scheme. SW denotes Sitewise™; N/A indicates that the option is unavailable in the corresponding tool. The dagger † identifies the SEFA waste volume response that did not propagate to energy, GHG, or NOx and is excluded from the physically linked comparison. The truck-to-rail values are native SEFA screening outputs; because first- and last-mile haulage, terminal operations, return trip treatment, railway traction, and remaining non-transport emissions could not be independently verified, they are also excluded from project-level quantitative comparison. Because the scenarios engage different native modules, the table documents tool response and functional coverage rather than a universal cross-measure hierarchy. The linked activity chain screening is reported separately in Table S11.
Table 4. Case-specific directional relationships of Sitewise™ and SEFA outputs relative to the Sitewise-informed China-localized recalculation.
ToolGHGEnergyNOxSOxPMCase-Specific Numerical RelationshipInterpretation and Checks
Sitewise™↓ S
[B/D/F/A]

[A*]
↓ M
[D/F/C/A]
↑↑ L
[B/D/F]
↑↑ L
[D/F/A]
Lower GHG and NOx; higher SOx and PM in this caseScreen sensitivity to a localized grid factor; check diesel life cycle scope; test a locally applicable fuel sulfur factor; interpret NOx relative to the localized recalculation for this case.
SEFA↓ S
[B/D/F/A]
↑ S
[B/D/A]
↑ M
[B/D/F/C/A]
↑↑ L
[B/D/F]
↑ M
[D/F/A]
Lower GHG; higher energy and criteria–air pollutant values in this caseScreen sensitivity to a localized grid factor; test a locally applicable fuel sulfur factor; interpret NOx relative to the localized recalculation for this case; evaluate rail with a project-specific intermodal inventory.
Arrows indicate whether the archived tool output was numerically lower than, higher than, or approximately equal to the Sitewise-informed China-localized recalculation under the assumptions of this case. Double arrows denote absolute differences greater than 100%. Magnitude classes describe numerical size only. Driver codes refer to the five interacting methodological mechanisms: B = system/background boundary; D = background database; F = emission factor selection; C = source classification, principally affecting attribution; and A = calculation architecture. A* indicates that the Sitewise/localized energy equality occurs by construction. The arrows, magnitude classes, and mechanism codes are descriptive and do not constitute a complete quantitative decomposition or support a general judgment about the relative performance of the tools.
Disclaimer/Publisher’s Note: The statements, opinions and data contained in all publications are solely those of the individual author(s) and contributor(s) and not of MDPI and/or the editor(s). MDPI and/or the editor(s) disclaim responsibility for any injury to people or property resulting from any ideas, methods, instructions or products referred to in the content.