Article

Explaining the Reactions of Carbon Footprints to Energy and Mineral Depletions: New Insights from Fourier-Bootstrap ARDL

Department of Economics, College of Economic and Management Sciences, University of South Africa, Muckleneuk Ridge, Pretoria 0001, South Africa
Sustainability 2026, 18(17), 9148; https://doi.org/10.3390/su18179148 (registering DOI)
Submission received: 24 July 2026 / Revised: 26 August 2026 / Accepted: 28 August 2026 / Published: 7 September 2026

Abstract

An in-depth understanding of the factors that enhance carbon footprints is a plausible pathway to enthrone environmental sustainability. Currently, the implications of energy and mineral depletion for carbon footprints in South Africa and Nigeria have received minimal empirical attention. The few available studies are non-exhaustive, often limiting broad-based policy refinements. With datasets spanning more than five decades (1971–2022), the novel Fourier Bootstrap Autoregressive Distributed Lag estimator was selected to account for structural breaks and nonlinearities. The empirical findings reveal divergent environmental pathways: South Africa’s carbon footprint (0.666% increase) is more related to energy depletion, reflecting coal-dominated electricity generation. Mineral depletion emerges as the primary culprit in Nigeria (10.856% increase), attributable to unregulated mining activities, including gas flaring and deforestation. Both countries face common challenges from urbanization (0.094% and 0.087% increases) and economic growth (0.107% and 0.046% increases). Trade openness shows insignificant effects. Short-run carbon footprint reductions from resource depletion improvements do not persist, underscoring the need for policy consistency. Policy effectiveness analysis identifies coal phase-out (0.9) and carbon pricing (0.8) as South Africa’s highest-return interventions. Mining regulation (0.9), green mining (0.9), and artisanal formalization (0.9) emerge as Nigeria’s priorities. The integration frameworks outperform siloed approaches. This implies South Africa may capture higher returns from policy coherence, while Nigeria may depend more on enforcement capacity. These findings provide evidence-based guidance for context-specific environmental policy design in resource-dependent economies.

1. Introduction

Several global economies, including South Africa and Nigeria, faced the stark realities of dwindling national income and unprecedented climate unpredictability. Perhaps, without guided evidence, these countries resorted to extensive depletion of available natural resources, including energy and minerals, as a strategy to boost overall economic expansion. However, the depletion of these resources could be among other critical factors driving the unprecedented changes in climate outcomes. Surely, there is an avalanche of empirical studies that align with the above proposition [1,2,3,4,5]. Yet, others [6,7,8,9] contend that the ongoing environmental and climate challenges may not be attributable to resource depletion. Nevertheless, there is a need for continuous policy refinements to win the war against climate uncertainties in line with Sustainable Development Goal (SDG) 13. This urgent need essentially necessitates this current effort, which distinctively reappraises the implications of energy and mineral depletion for the climate footprints of two notable African countries.
A focus on the carbon footprint effects of energy and mineral depletion in South Africa and Nigeria enriches the literature on energy, resource, and environmental economics. Notably, these countries are among the top 10 resource-rich African countries [10]. Among African countries, South Africa and Nigeria annually generate $124,963m and $52,678m, respectively, from natural resource extraction. Hence, they represent the top two resource-rich African countries, followed by Algeria ($38,699m), Angola ($32,042m), and Libya ($27,027m). Regardless of the available resources, these countries are also faced with monumental environmental issues and substantial climate challenges [11]. Accordingly, both South Africa and Nigeria faced severe ecological deficits of 130% and 79%, respectively, placing them ahead of other African countries facing similar environmental challenges [12]. These highlighted realities of the two countries raise many questions that need urgent empirical verification. Perhaps it is pertinent to ask whether these resources have become an environmental burden for these countries. This question resonates with the resource curse theory popularized by Auty [13], highlighting the potential double-edged sword nature of resource availability.
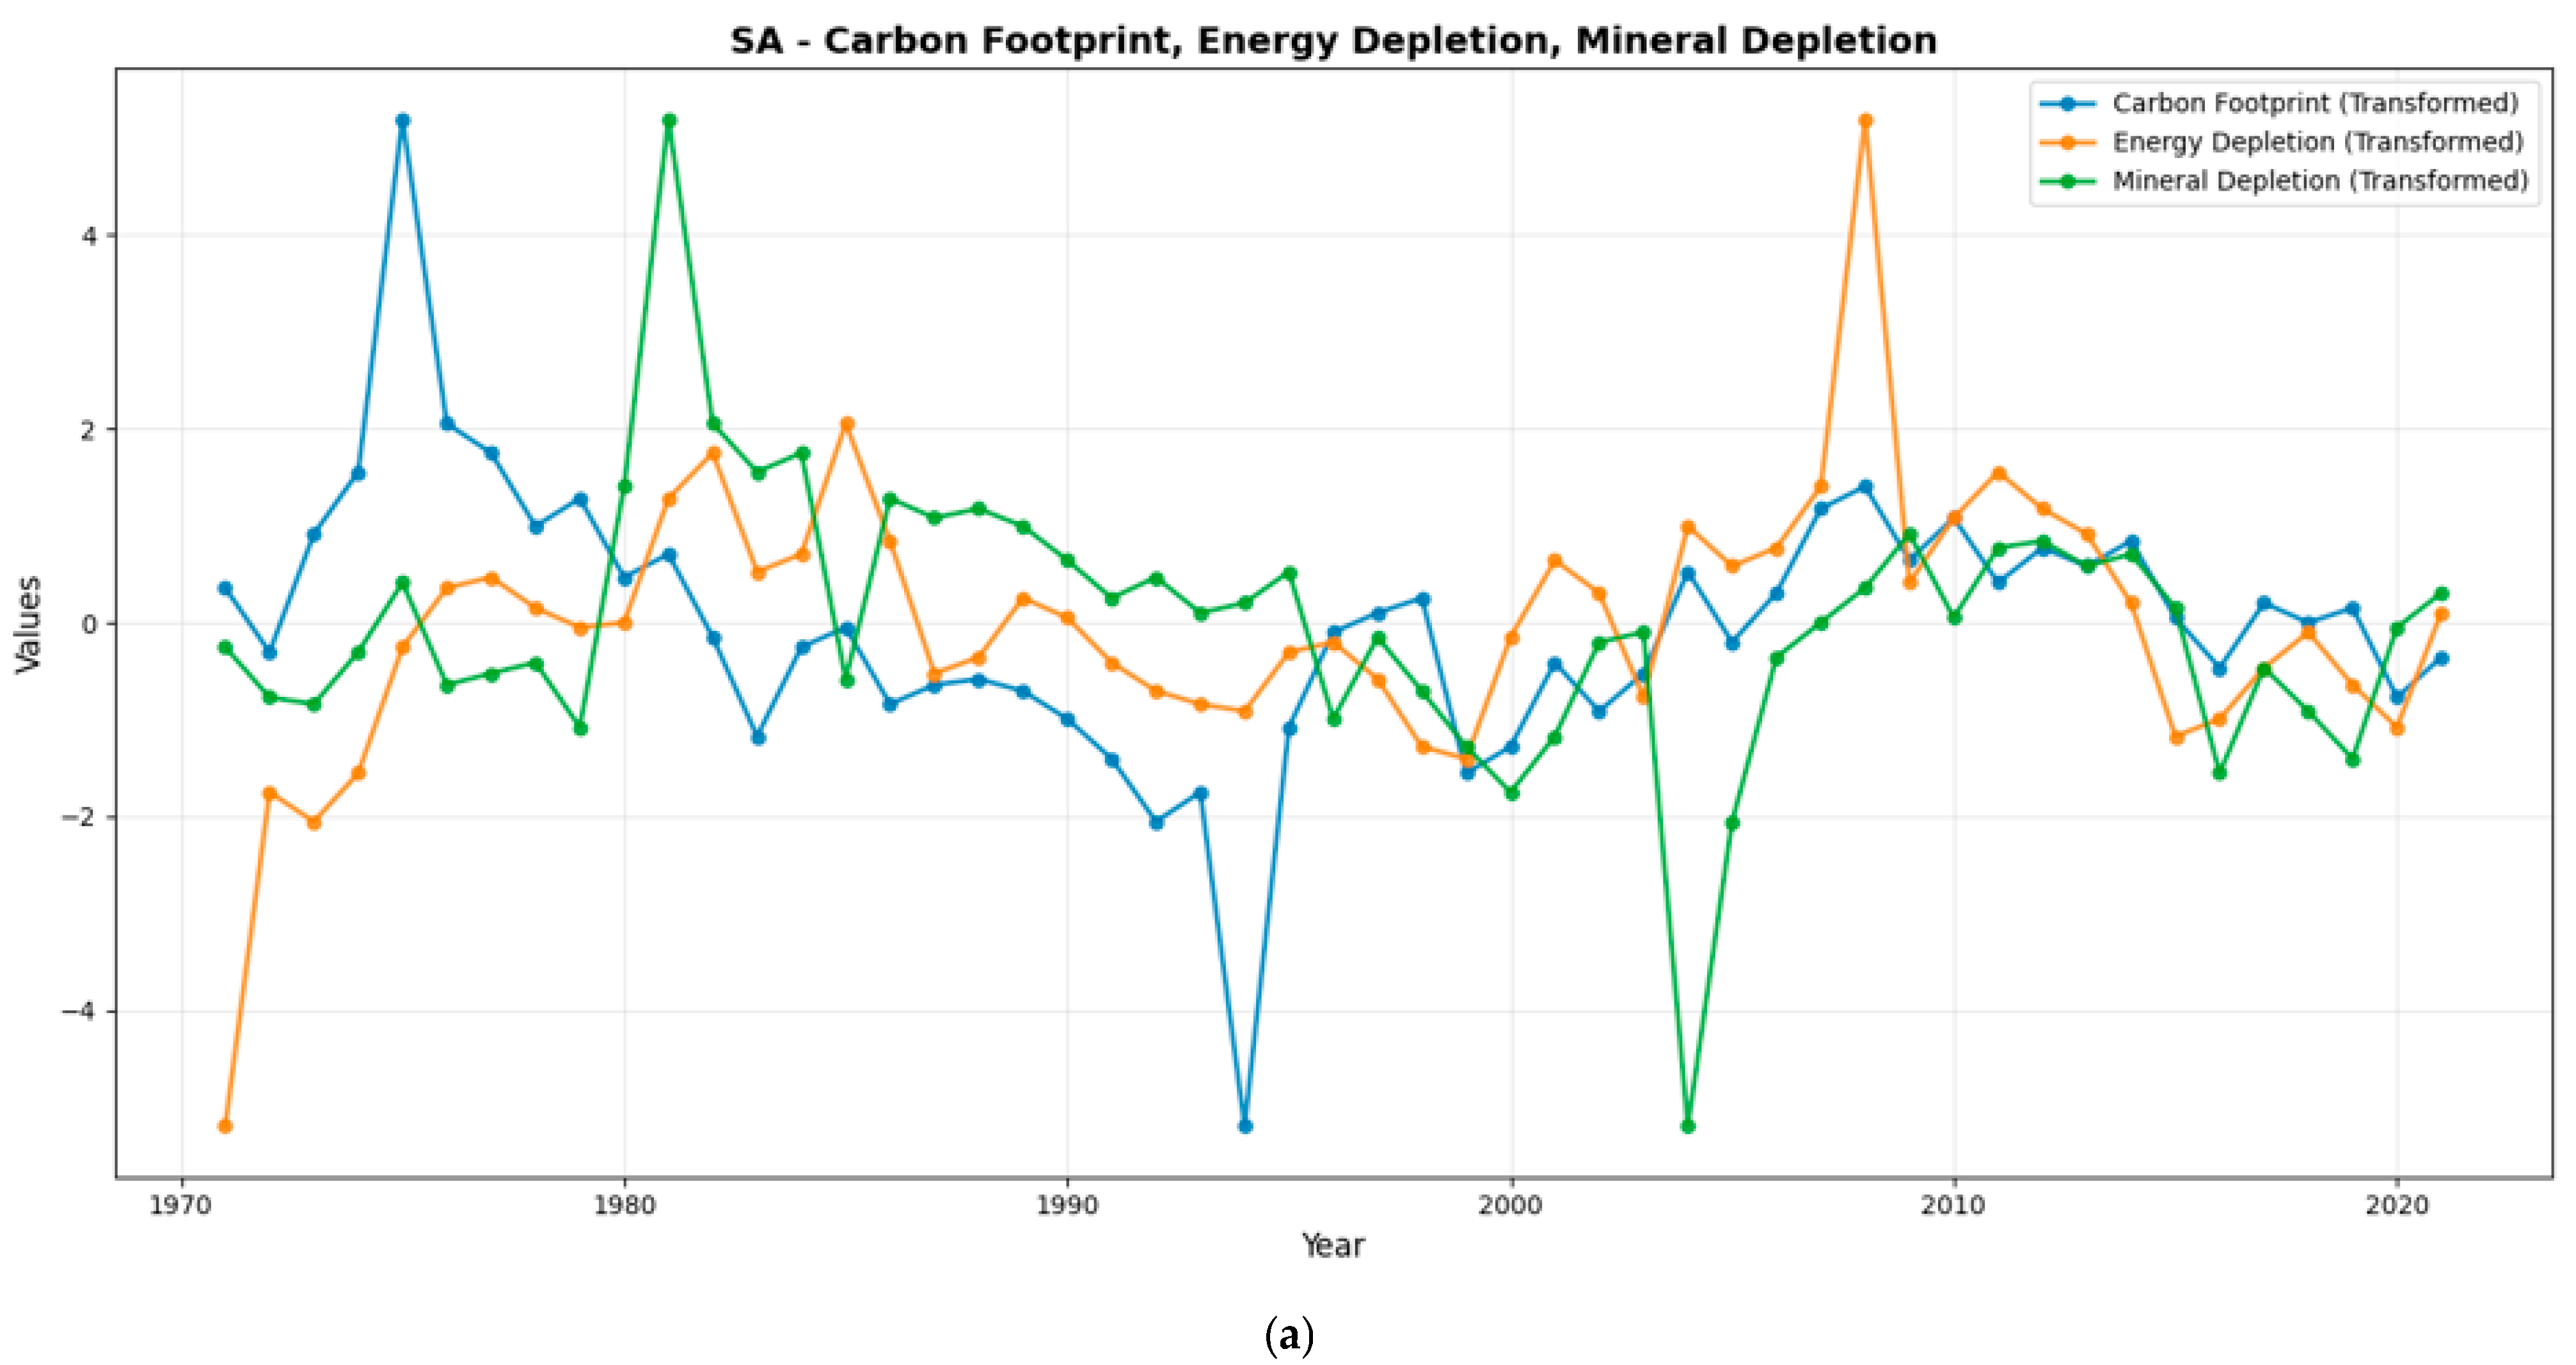
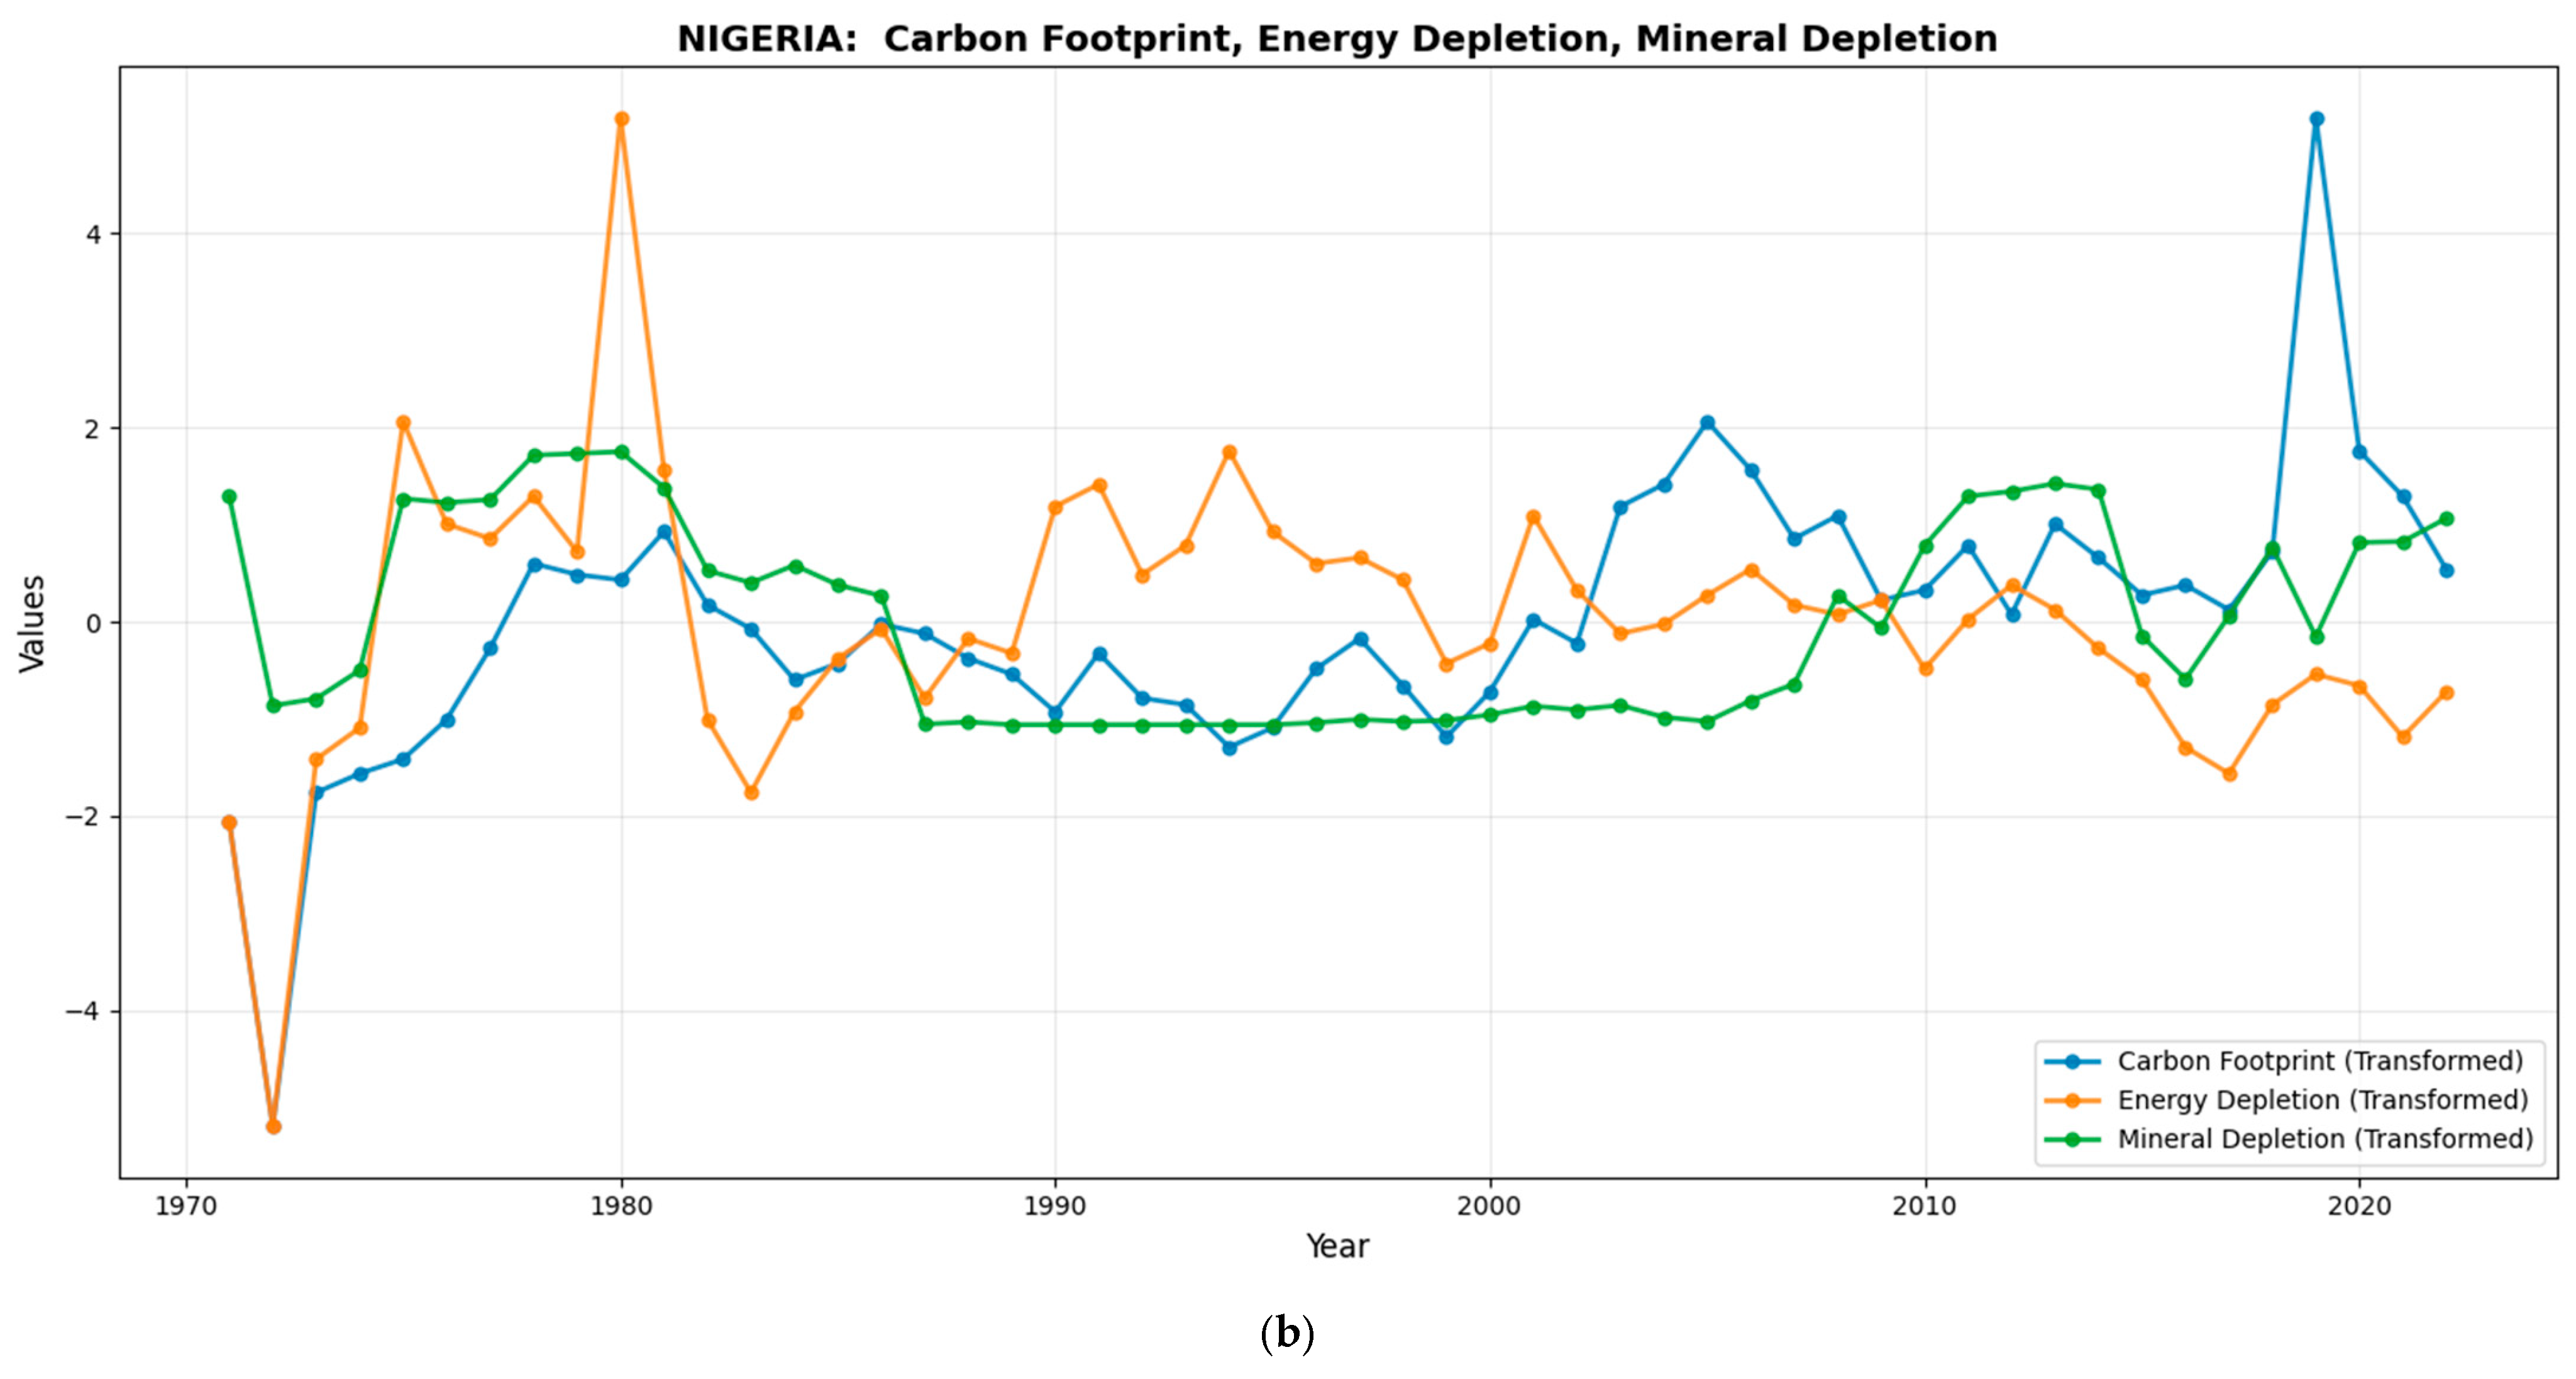
Based on the graphical illustrations (Figure 1a,b), it is evident that energy and mineral depletions have consistently trended along carbon footprints in both countries. In South Africa, carbon footprint, mineral, and energy depletions peaked in 1975, 1982, and 2005, respectively. Notably, these variables trend closely throughout the period under investigation. In Nigeria, while energy depletion peaked in 1980, the climate footprint peaked in 2019. Mineral depletion remained stable during these periods. Altogether, there is also close convergence among the three variables over the period studied. These outcomes underscore the need to empirically determine the implications of energy and mineral depletion for the carbon footprints of both countries. Such streamlined and comparative outcomes are pertinent for guiding policy adjustments for climate action in these two leading African economies and other countries with similar economic structures.
Notably, there is no shortage of empirical evidence on the resource depletion–environmental sustainability nexus [1,3,7,8,14,15,16]. As noted earlier, there are discrepancies in the submissions of these prior studies. Likewise, there is a lack of clear empirical research dedicated to unraveling the specific influence of energy or mineral depletion on the carbon footprint in South Africa or Nigeria. The lack of such specific evidence constitutes a significant gap in the literature, given the identified structures of both countries. Hence, there is a compelling need to verify the specific implications of energy and mineral depletion for the climate performance of these countries. Arguably, Nigeria has more energy endowment than South Africa. Conversely, South Africa could boast of more mineral endowment. Hence, it is desirable to ask the following questions: (i) Does mineral depletion contribute more to the climate footprint in South Africa than energy depletion? (ii) Is the climate footprint in Nigeria linked more to energy depletion than mineral depletion? This study is committed to unraveling these puzzles, yielding streamlined policy insights to minimize climate-related adversities associated with natural resource depletion in both nations.
This study is a clear departure from the choices of existing related studies, underscoring its novel contributions to the literature. As noted earlier, most existing studies [6,7,8] have focused on the implications of aggregate natural resources for environmental performance. However, identifying the contributions of each natural resource would eliminate the biases inherent in a one-size-fits-all policy implementation. Besides, there is a lack of comparative studies on the outcomes of both energy and mineral depletion in the contexts of these top two resource-endowed African countries. As expected, the comparative evidence in this study is timely, as it provides a handy empirical outline for policy adjustments specific to the realities of each country. The influence of structural breaks on the relationship under study is considered within the selected model. Unlike prior studies, the application of the Fourier-bootstrap ARDL (FBARDL) marks another significant departure herein. The FBARDL technique accounts for unknown smooth and sharp structural breaks in economic variables. This attribute eliminates potential biases arising from structural shocks. Hence, the Fourier approximation procedure produces more reliable estimates than conventional econometric estimators. Accordingly, Table 1 illustrates the novelty of the study.
The remaining sections of the study are arranged as follows: the literature review and methodology are outlined in Section 2 and Section 3, respectively. Section 4 outlines the data analysis and discussion, while Section 5 presents the summary and policy prescriptions.

2. Theoretical Literature

Accordingly, the relationship between carbon footprints and the depletion of energy and minerals is grounded in the resource curse theory [13]. This theory considers how resource dependency and dysfunctional institutions exacerbate adverse climate change through resource depletion [3,19]. Several scholars have also explored this specific relationship using this theory [5,7,14]. Resource curse theory, or the paradox of plenty [13], provides the basic framework for understanding resource governance and environmental performance through a socio-political and economic lens [26]. In particular, the theory noted that the most resource-rich nations underperform across several metrics, including poor environmental outcomes and significant climate adversities [27]. Despite theoretical articulations, the resource depletion–climate footprint nexus has been largely controversial, resulting in policy inconsistencies.
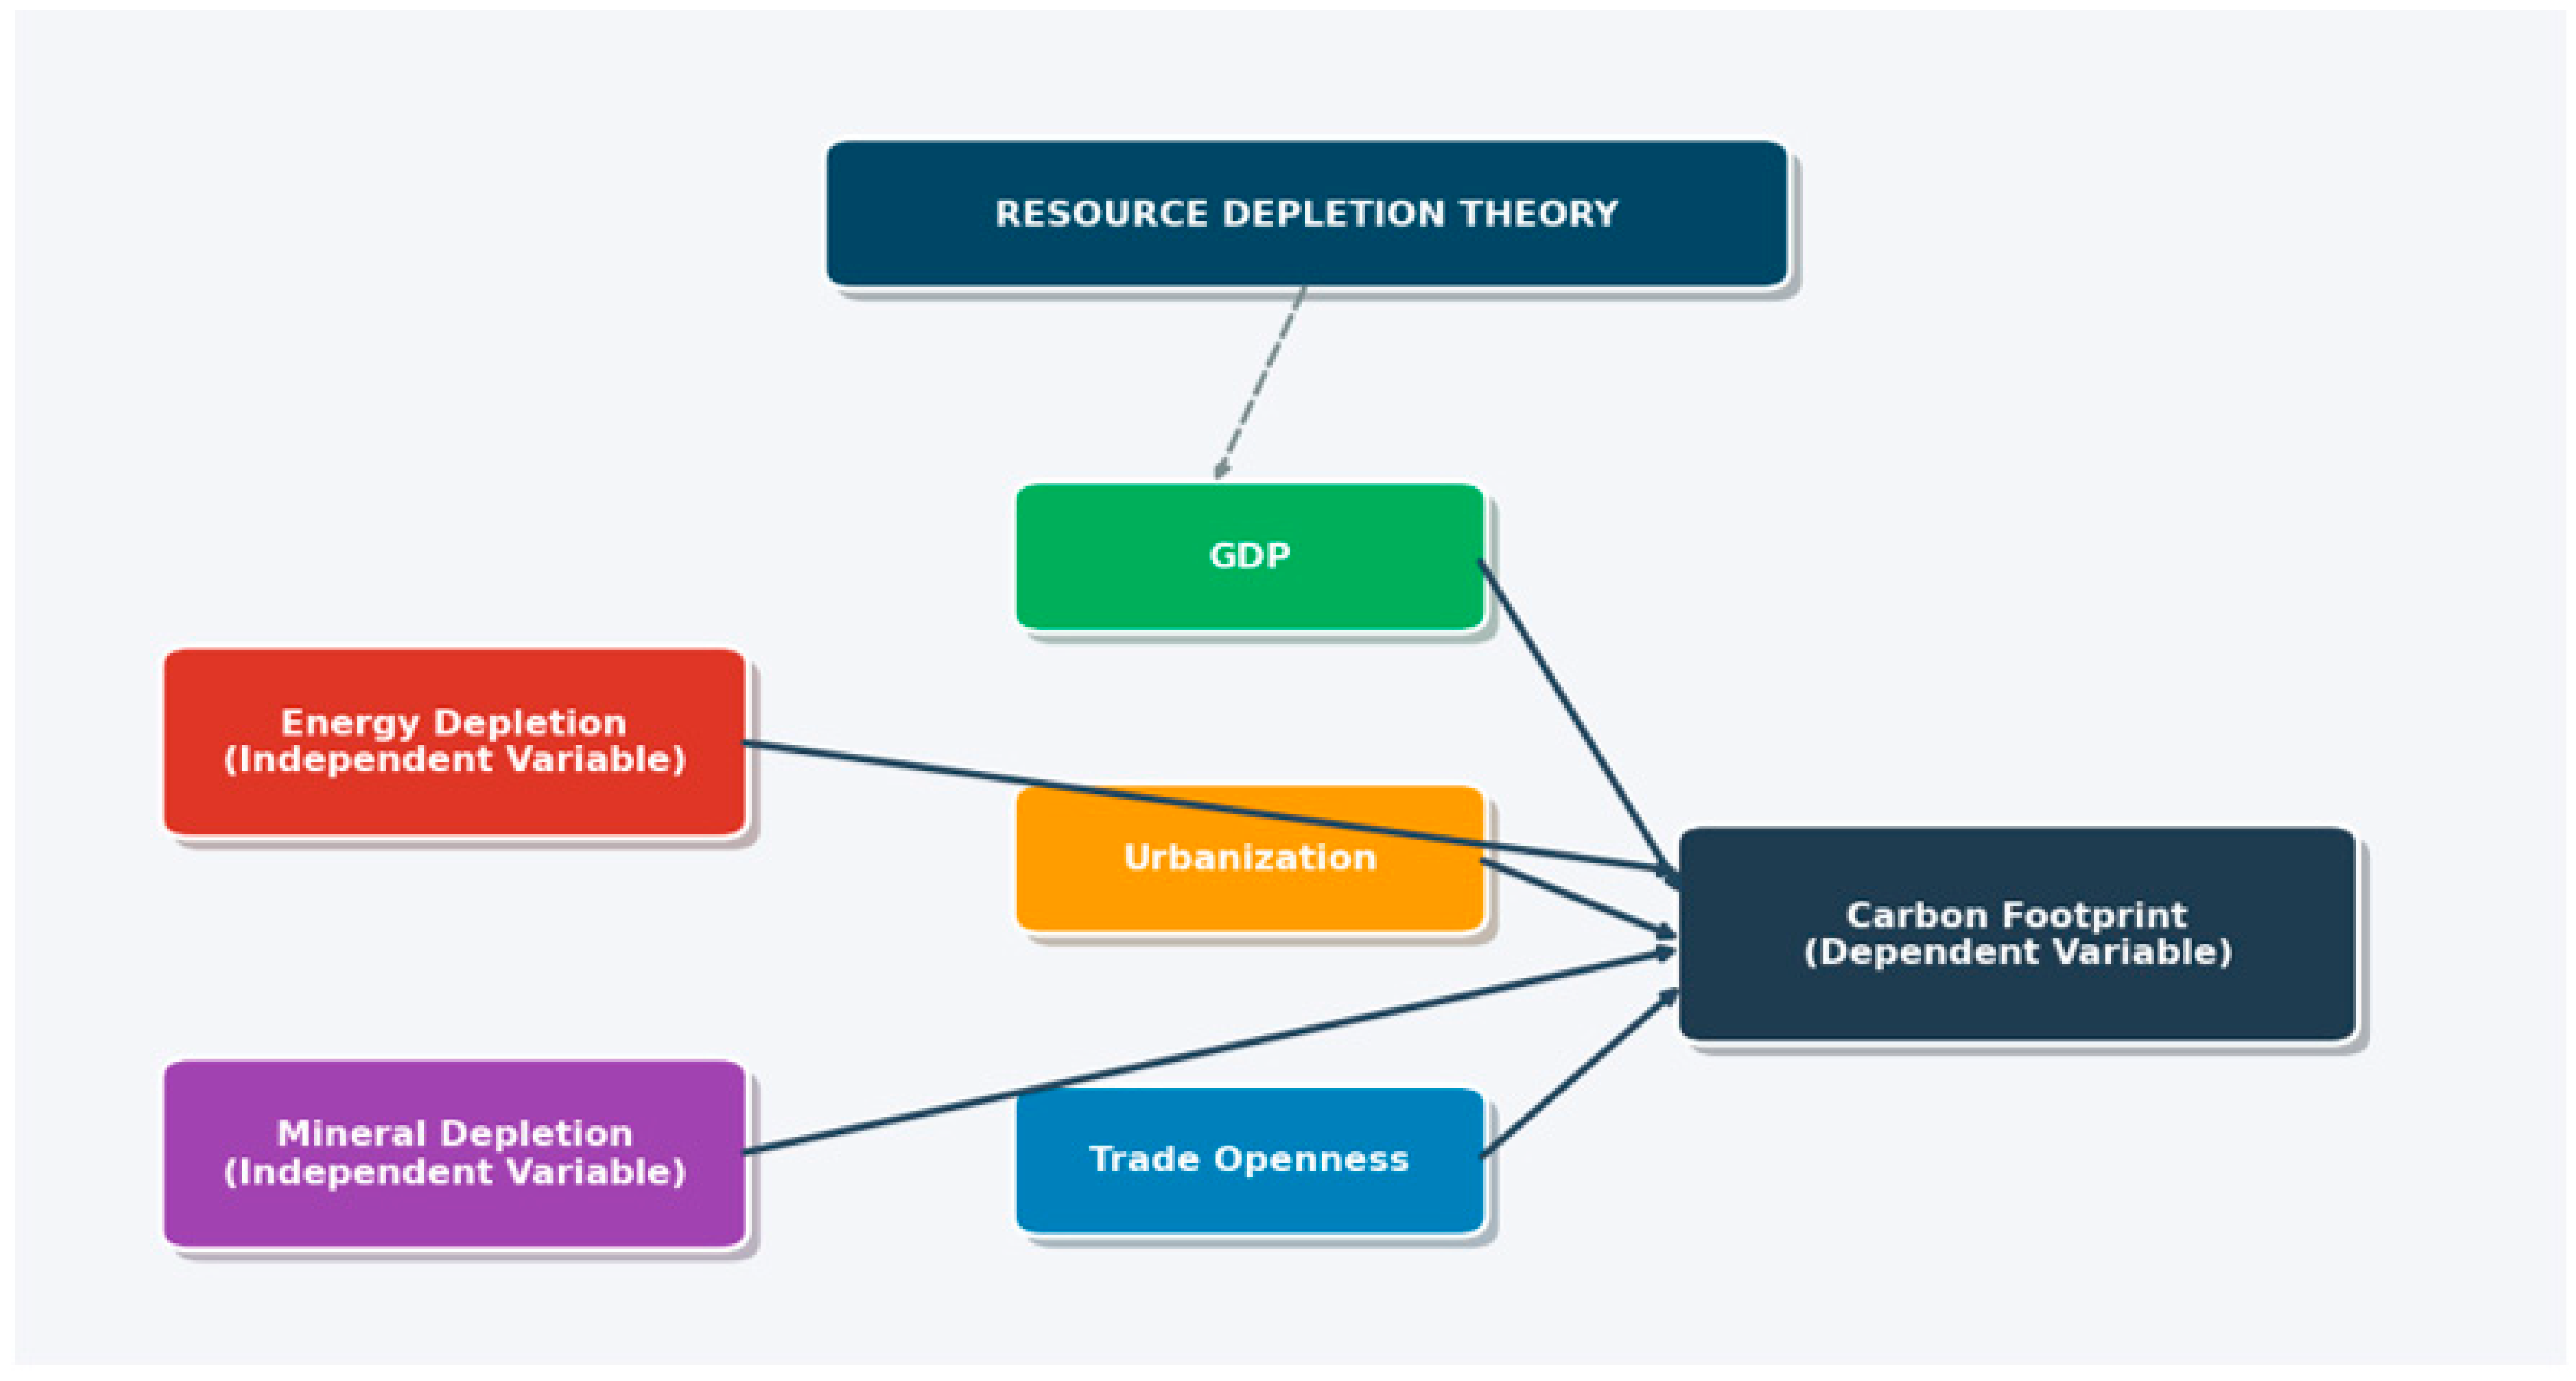
The relationship studied could also be explained by the resource depletion theory proposed by [28]. As illustrated in Figure 2, the resource depletion theory suggests that the extraction of natural resources, including energy and minerals, is detrimental to environmental harmony [6,7,8,29]. The theory envisages that these resources influence the environment through mining, processing, and transportation activities.
Likewise, it is envisaged that factors such as urbanization, economic growth, and open trade are linked to environmental performance. Nevertheless, these propositions are still contested even in recent empirical investigations. Hence, a thematic understanding of the viewpoints of recent empirical studies is provided herein to support the argument for the current investigation.

Empirical Literature

Accordingly, Nathaniel [21] explained that natural resource depletion is a positive predictor of environmental decay based on the study of BRICS economies. However, their study does not consider the explicit carbon-emission effects of energy and mineral depletion. Likewise, the comparative study of South Africa and Nigeria was lacking in their study. The submissions by Sibanda [30] and Wang [17], in the contexts of resource-rich sub-Saharan African economies and China, respectively, align with the above submissions. Aladejare and Nyiputen [20], Nguyen [31], and Zhang and Zhao [19] extended similar inferences for Africa, the US, and BRIC. However, these studies also failed to provide context-specific insights on the carbon-footprint implications of energy and mineral depletions in either South Africa or Nigeria. Conversely, Zhou [32] maintained that natural resource utilization does not negatively impact environmental health, based on a study spanning the economies of the Middle East and North Africa (MENA). Yet, their study does not answer the proposed research question of this study. Nevertheless, the observed conflicting submission is a call for reexamination of how specific natural resource depletion influences environmental quality.
To further deepen the puzzle, Tariq [23] contended that resource depletion is not linked to environmental deficiency in South Asian economies. Nevertheless, this position is contested by several related studies, including Amin [14] and Khan [33] in the contexts of BRICS and selected countries, respectively. Resource exploitation is also considered inimical to environmental health in BRICS+ nations [24], Ethiopia [25], E7 economies [34], and 146 selected countries [35]. Evidently, these studies provided varying accounts of the implications of resource utilization on the climate performance of different countries, underscoring a reevaluation of the evidence. Besides, the peculiarities of South Africa and Nigeria were not considered.
Another layer of complexity is traceable to the submissions of Pala [18] and Liu & Qiao [8]. Accordingly, the former contends that resource depletion does not significantly impact environmental decay in the CAREC nations. The latter noted that resource depletion harmed environmental quality significantly in BRICS, whereas it reduced CO2 substantially in MINT. Furthermore, Ha [7] explained that aggregate resource depletion minimized climate risks in the case of 154. However, they emphasized that while mineral rents and coal gas mitigate, oil rents exacerbate climate risk significantly. Uzar [9] also contends that natural resource rents could not generate substantial negative effects on environmental quality in E7 economies. These conflicting inferences bear strongly on policy formulations, underscoring the need for a clearer understanding of the studied relationship. Meanwhile, several others [22,36,37,38] maintained that resource depletion significantly impacts environmental pollution in various countries, including OPEC nations, BRICS, Jordan, and Africa. The significant carbon footprint effects of resource depletion are also reiterated in the contexts of OPEC states, South Asia [39], BRICS [4], and East Africa [40].
In summary, empirical evidence is yet to generate a common understanding of how resource depletion affects environmental quality across different countries. This lack of a common understanding regarding the subject matter elevates the imperative of further examination. Besides, the accounts of South Africa and Nigeria, as well as the disaggregated effects of either energy or minerals, were seldom evaluated in existing studies. The evidence from a disaggregated analysis provides context-specific policy insights and guidelines for robust environmental management.

3. Methodology

Relevant information, pertaining to data description, empirical model, and econometric estimators, is provided within this section. The adoption of this procedure is premised on ensuring clarity and replicability of the empirical analysis. Consequently, STATA 19.5 and Python codes were relied upon for all the empirical analysis.

3.1. Data Description

The relevant datasets were carefully selected to conform to the objectives of the study. Accordingly, the datasets span 1971 to 2022, totaling 52 years for each country. The selection of the data scope is principally determined by data availability and consistent outlines. Nevertheless, the selected period encompasses critical periods that shape climate and environmental outlooks in both countries and other global economies. Notably, this period saw expanded economic activities and global integration in most African countries. Other notable events during the period are the global financial crisis and the COVID-19 pandemic. Hence, the datasets are shaped by these notable global events, ultimately determining the data transformation procedures and empirical analytical techniques. The outcome variable (carbon footprint) is calculated as the average of Net CO2 to sequester (tons) and the global average forest sequestration rate [tons CO2/ha/yr] multiplied by the forest equivalence factor. Unlike conventional CO2 emissions, carbon footprint measures the emissions associated with the entire supply chain of goods and services consumed within a region, no matter where in the world those emissions occurred. Among others, this particular attribute justifies its preference over other emission metrics, thereby making it a more comprehensive environmental quality metric than CO2 and most others [2]. More details related to the description of the relevant variables are provided in Table 2. Meanwhile, all the percentage values of the variables are selected, allowing for consistent estimation with minimal bias.

3.2. Model Specification

The carbon footprint–energy and mineral depletion nexus presents a multidimensional framework that touches on both ecological, structural, and political ecology perspectives. Accordingly, the nexus is related to the material flow analysis (MFA), which extends the direct implications of energy–mineral depletion for environmental outlook [41]. The nexus could also be explained based on the ecologically unequal exchange (EUE) [42] as well as the Javon paradox [43]. Accordingly, the former explains how the international exchange of natural resources influences environmental performance. The latter suggests possible environmental quality enhancement effects of resource extraction through technological improvement. Besides, a modified IPAT framework in line with the Ehrlich and Holdren [28] proposition could explain the studied relationship. The modified framework examined how the environment (climate footprint) responds to resource depletion (energy and minerals), as well as the moderating effects of affluence (GDP), urbanization (population), and open trade. On the above premises, we examine the response of climate footprint to energy and mineral depletions, as well as the contributing effects of urbanization, trade openness, and economic growth. The selected control variables (urbanization, trade openness, and GDP) are notable determinants of climate footprint [2,6,44,45,46,47]. Hence, their inclusion in the model is consistent with economic theory. The econometric model of the proposed relationship is illustrated in Equation (1).
C a b _ f p t = ρ 0 + ρ 1 E _ d e p t + ρ 2 M _ d e p t + ρ 3 U r b t + ρ 4 O p e n _ T t + ρ 5 G D P t + ε t
where ( ρ 1 ρ 5 ) represent the coefficients of the explanatory variables. Accordingly, the subscript t denotes time, while ρ 0 and ε t are the slope and error term, respectively.

3.3. Analytical Strategies

Among the selected econometric estimators are the novel Fourier-approximation unit-root and cointegration test procedures. The unit-root test is analyzed with Enders and Lee [48] Fourier ADF and Rodrigues and Taylor [49] Fourier GLS techniques. The possible long-term convergence is analyzed with the novel Banerjee [50] residual-based Fourier Autoregressive Distributed Lag (FADL) cointegration procedure. Notably, these Fourier-approximation pre-estimation techniques are sensitive to nonlinear variables resulting from structural breaks. These Fourier approximation techniques circumvent the limitations of traditional approaches by adding another cointegration metric to the lagged dependent variable [51]. Particularly, the Fourier procedures overcome drawbacks such as inconclusive inferences and size distortions [52].
Consistent with the pre-estimation tools, the marginal effect analysis is based on recently proposed Fourier approximation econometric techniques. On this premise, the study applied the Fourier-bootstrap ARDL (FBARDL) based on insights from Yilanci [53]. In particular, the novel Fourier-approximation bootstrap procedure adopts the modifications proposed by McNown [54]. Expectedly, the Fourier and bootstrap extensions outperform the traditional ARDL estimator of Pesaran and Shin [55]. Accordingly, the Fourier procedures account for unknown smooth and sharp structural breaks in the variables, allowing for consistent empirical estimates [53,56]. The FBARDL procedure follows a Fourier approximation framework that captures smooth structural breaks of unknown form, number, and location via low-frequency trigonometric terms. Likewise, the technique is preferred to the conventional ARDL, as it can capture cyclical shifts in climate footprints with greater precision and uncover underlying structural patterns [51].
Despite acknowledged limitations such as computational complexity and interpretational challenges, the FBARDL was selected for compelling reasons. First, FBARDL captures unknown smooth and sharp structural breaks without prior break-date specification via Fourier approximation [48]. Secondly, it accommodates variables with mixed integration orders (I(0)/I(1)). Thirdly, its bootstrap extension provides reliable inference for finite samples [54]. Likewise, the technique’s improved size properties reduce Type I/II errors. Lastly, the three-test cointegration framework (F-statistic, t-statistic, F-statistic on lagged dependent variable) provides a robust assessment. Comparatively, FBARDL outperforms conventional ARDL, Markov-switching (no break-date pre-specification), and nonlinear ARDL (handles both smooth and sharp breaks). Diagnostic tests confirm model adequacy.
There could be potential reverse causality pathways, which include (i) carbon footprint → resource depletion (climate pressures may accelerate extraction for clean energy technologies), (ii) carbon footprint → urbanization (climate-induced migration), and (iii) carbon footprint → economic growth (environmental degradation constraining growth). Hence, the findings herein should be interpreted as robust conditional associations rather than definitive causal relationships.
Following the Fourier approximation steps, the relationship between climate footprint and the enlisted explanatory variable is illustrated in Equation (2), where the Fourier approximation function 1 sin 2 π k t T + 2 cos 2 π k t T is added into the model. Within the Fourier framework, T, k, and t represent the sample size, the selected frequency approximation, and the trend, respectively.
Δ C a b _ f p t = ρ 0 + 1 sin 2 π k t T + 2 cos 2 π k t T + ρ 1 E _ d e p t + ρ 2 M _ d e p t + ρ 3 U r b t + ρ 4 O p e n _ T t + ρ 5 G D P + i = 1 p 1 ϕ k 1 Δ C a b _ f p t 1 + i = 1 p 1 θ k 1 Δ E _ d e p t 1 + i = 1 p 1 θ k 2 Δ M _ d e p t 1 + i = 1 p 1 θ k 3 Δ U r b t 1 + i = 1 p 1 θ k 4 Δ O p e n _ T t 1 + i = 1 p 1 θ k 5 Δ G D P t 1 + ε t
where ρ 1 ρ 5 represent the long-run marginal effects of each explanatory variable, while θ k 1 θ k 5 represent their short-term marginal effects. The speed of adjustment to equilibrium is illustrated by i = 1 p 1 ϕ k 1 Δ C a b _ f p t 1 . The empirical flow of the study is depicted in Figure 3.

4. Data Analysis and Discussion

4.1. Data Analysis

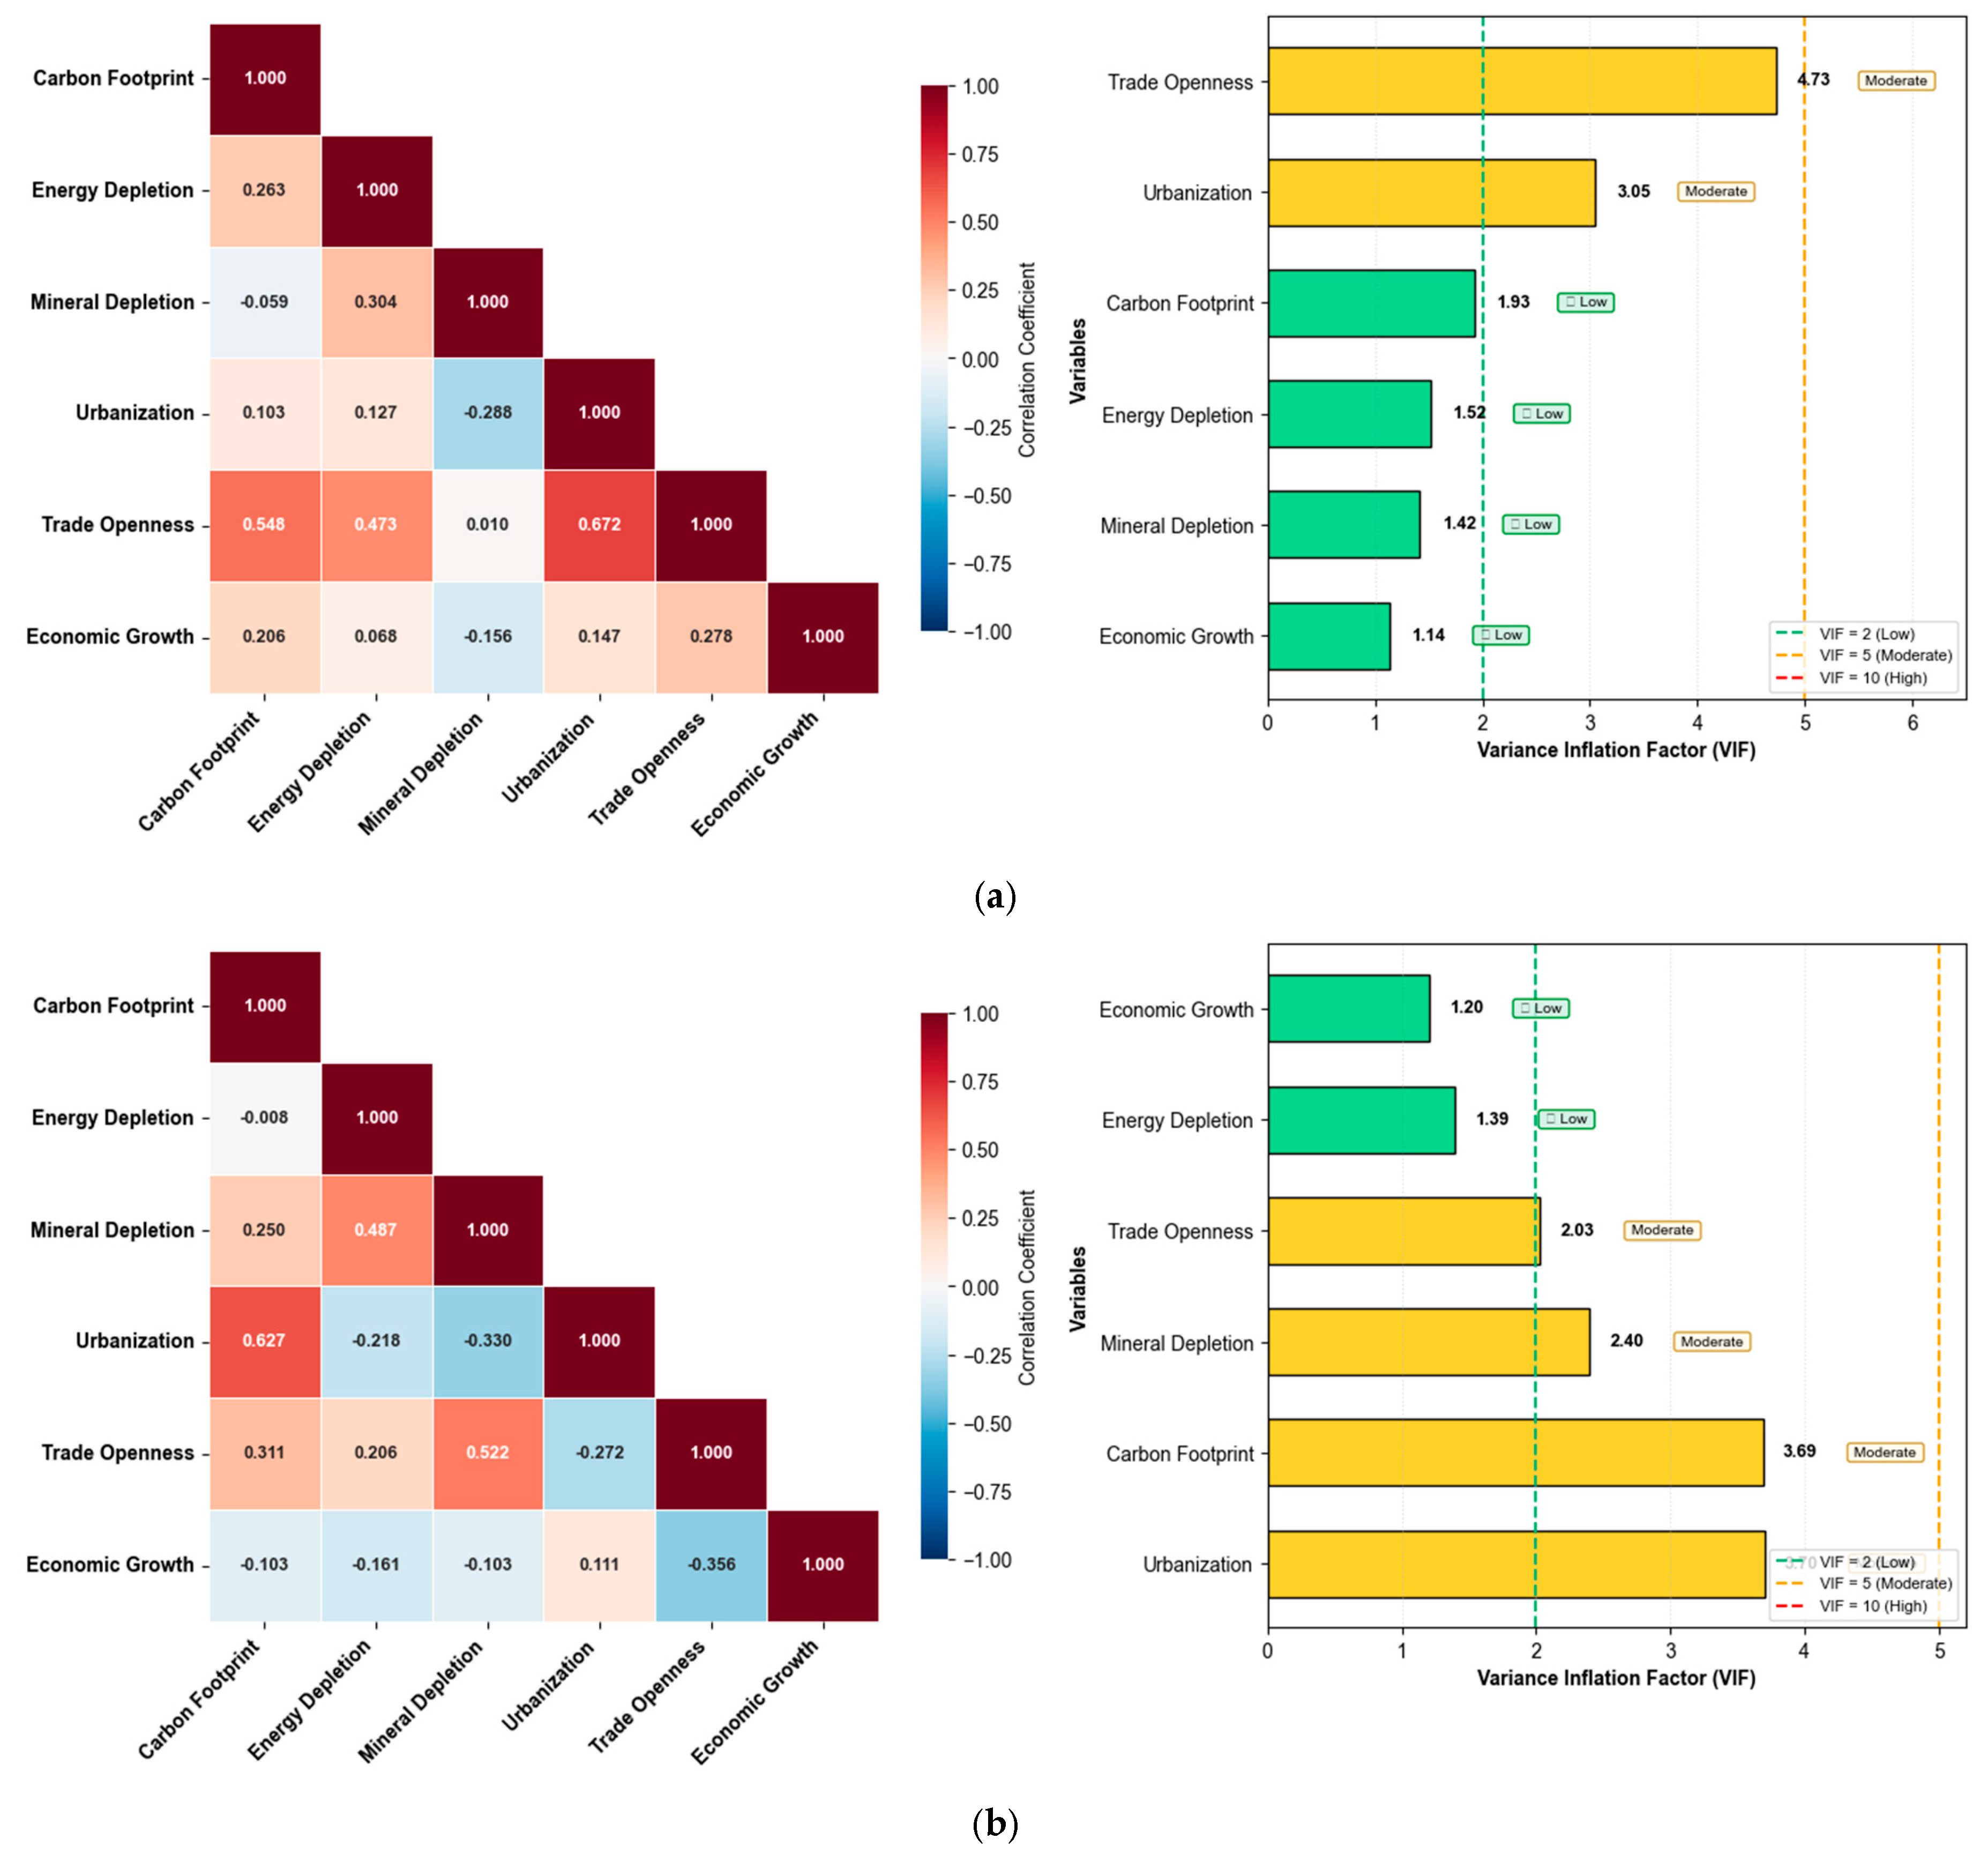
As a requirement, the empirical analysis is preceded by standard statistical analyses, including summary statistics, correlation analysis, and variance inflation factor (VIF) tests. Other essential pre-estimation evaluators included herein are the tests for stationarity and long-term convergence. Likewise, a policy effectiveness matrix and a policy integration network were provided for clearer insights into the empirical outcomes. These post-estimation steps enhanced the policy prescriptions of the study. Accordingly, the outcomes of the summary statistics for the two countries are presented in Table 3. Figure 4a,b illustrate the results of the correlation matrices and the multicollinearity tests.
Comparatively, carbon footprint is higher in South Africa (2.428) than in Nigeria (0.180). Conversely, energy depletion is higher in Nigeria (7.651) compared to its mean value in South Africa (1.829). There is evidence of more mineral depletion in South Africa (1.058) compared to 0.005 in Nigeria. South Africa leads Nigeria in both urbanization and trade openness. In contrast, the GDP growth rate is higher in Nigeria (0.690) compared to South Africa (0.259). Among other characteristics, energy and mineral depletions are non-normally distributed in both countries. Urbanization also deviates from normal distribution in South Africa, whereas it is normally distributed in Nigeria. Furthermore, GDP is non-normally distributed in Nigeria, whereas it is normally distributed in South Africa. The presence of non-normally distributed variables suggests nonlinearity, highlighting the need for nonlinearity-sensitive estimation techniques. There is also evidence of left- and right-skewed, platykurtic, leptokurtic, and mesokurtic variables in both countries. These uneven distributions of variables also underscore the preference for nonlinear estimators.
The outcomes of both the correlation analysis and the VIF test (Figure 4a,b) suggest that the predictor variables are not multicollinear. Accordingly, trade openness has the highest VIF score (4.73) in the case of South Africa, followed by urbanization (3.05). Conversely, urbanization’s VIF score of 3.73 is the highest in Nigeria, followed by carbon footprint’s 3.69. The moderate VIF scores eliminate any multicollinearity concerns in the model for both countries. This particularly allows for precise empirical estimation of the combined effects of the predictor variables on the outcome variable.
The outcomes of the stationarity and cointegration tests for both countries are summarized in Table 4 and Table 5, respectively. The outcomes of both stationarity tests suggest that the outcome variable (carbon footprint) is nonstationary. However, it attains stationarity after differencing once, making it a first-order I(1) integrated series. This outcome is consistent in both countries. Among the explanatory variables, energy depletion and GDP are level-stationary variables in both countries. Hence, the null hypothesis of a unit root is rejected. Other explanatory variables, including mineral depletion, urbanization, and trade openness, attain stationarity after first differencing. Altogether, the enlisted variables have mixed orders of integration of order-zero and order-one. This attribute is consistent with the Fourier-based cointegration test and Fourier-approximation ARDL estimators.
The Fourier-based cointegration test (Table 5) provides evidence of strong long-term convergence between climate footprint and the explanatory variables. The rejection of the null hypothesis of the absence of long-term convergence is consistent in both countries. Accordingly, the evidence of cointegration gave credence to the application of the FBARDL marginal effects estimator. The parameters of this estimator are based on the McNown [54] unconditional bootstrap and Bertelli [52] conditional bootstrap resampling procedures. Hence, the marginal effects of each included variable on the outcome variable for each country are estimated using these novel estimators. The outcomes of the FBARDL novel estimator are summarized in Table 6.
The novel FBARDL technique produces both long- and short-term estimates consistent with the conventional ARDL estimator. Hence, the marginal effects of the investigated relationship are discussed in terms of short-term dynamics and long-term outcomes. Accordingly, the long-term effects, short-run dynamics, and post-estimation diagnostics are summarized in panels A, B, and C, respectively, in Table 6. According to the long-term relationship, both energy and mineral depletion significantly magnify the carbon footprint in the context of South Africa. Specifically, while a unit change in energy depletion increases the carbon footprint by 0.666%, a proportionate change in mineral depletion warrants a 0.134% change in the carbon footprint. Although both variables contribute significantly to the climate footprint in South Africa, it is imperative to highlight that energy depletion contributes far more.
In the context of Nigeria, the long-term relationship revealed that energy depletion produced insignificant carbon footprint reduction effects, whereas mineral depletion intensified the carbon footprint significantly. The result indicates that a 1-unit increase in mineral depletion is associated with a 10.568% increase in the carbon footprint annually. Comparatively, mineral depletion produces more environmentally harmful effects in South Africa, whereas mineral depletion is the leading cause of carbon footprints in Nigeria. There is evidence of substantial short-term carbon footprint-minimizing effects arising from both energy and mineral depletions in the two countries. However, these short-term environmental sustainability effects did not persist, leading to long-term environmental decay. These outcomes underscore the need for policy consistency to counteract the long-term adverse environmental effects of energy and mineral depletion in South Africa and Nigeria.
The long-term carbon footprint implications of the selected control variables are consistent in both countries. Accordingly, urbanization and GDP exacerbated the carbon footprint significantly, whereas trade openness produced insignificant carbon-footprint-mitigating effects in both countries. In the case of South Africa, urbanization and GDP enhance carbon footprint significantly by 0.094% and 0.107%, respectively. Conversely, proportionate changes in both variables, respectively, contribute about 0.087% and 0.046% increases in carbon footprint in Nigeria. The short-term carbon footprint effects of these control variables are mixed in both countries. However, trade openness maintained its neutral effects on carbon footprint in South Africa in both periods. Unarguably, these notable outcomes hold several policy implications for environmental sustainability in both countries.
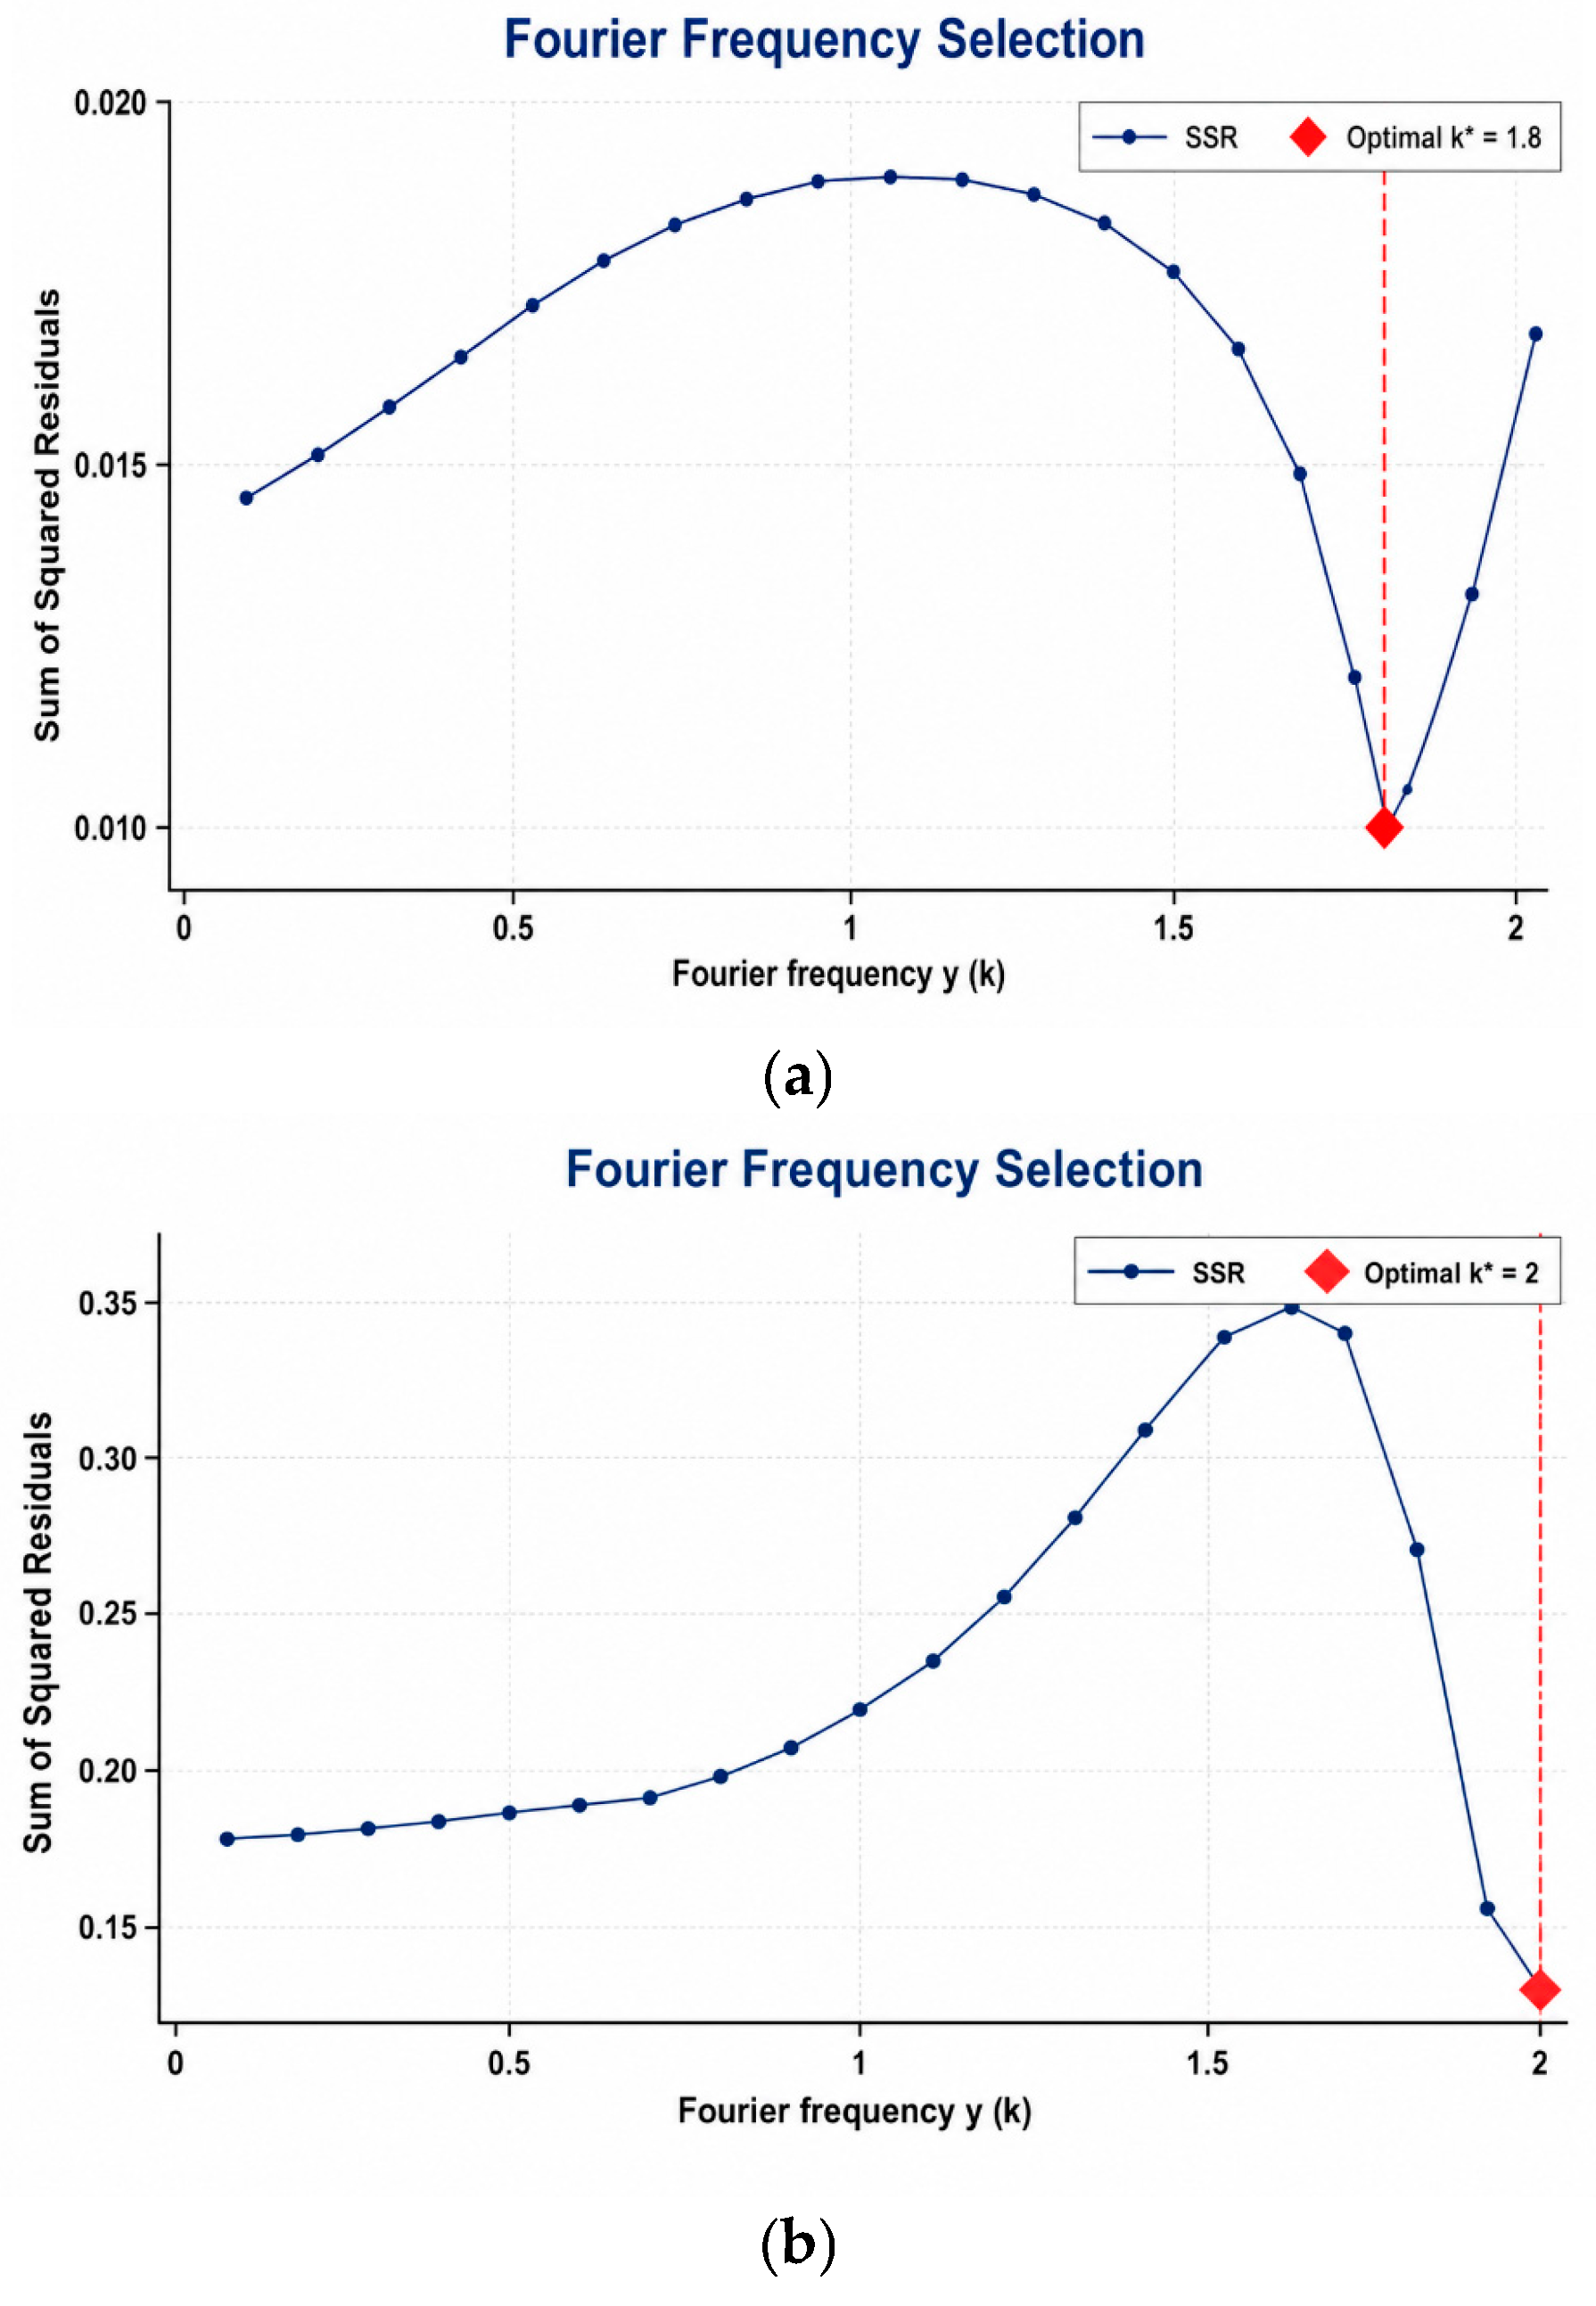
The speed of adjustment reveals that equilibrium is restored within the model by 0.488% in South Africa, whereas it is 0.514% in the case of Nigeria. The outcomes suggest that initial equilibrium within the models is restored moderately annually in both countries. However, the speed is relatively faster (0.026) in Nigeria compared to South Africa. The Fourier terms (sin and cos) are both positive and highly significant in the case of South Africa. In contrast, only one Fourier term (sin) is positive and minimally significant in the case of Nigeria. The outcomes of the Fourier terms suggest more structural break effects within the studied period in South Africa compared to Nigeria. The more pronounced structural break effects in South Africa may suggest a seasonal peak in energy demand, particularly during the winter. Such a seasonal peak in energy demand may trigger significant spikes in climate change. Meanwhile, the optimal Fourier frequency selection term (k) is 1.8 and 2 for South Africa and Nigeria, respectively (Figure 5a,b).
As previously indicated, the post-estimation diagnostic tests are summarized in the lower panel (Panel C) of Table 6. The relevant post-estimation metrics include Shapiro–Wilk W for the model normality test, BG LM for serial correlation, ARCH LM for heteroscedasticity, Ramsey RESET for the functional form test, as well as CUSUM and CUSUM-SQ for the stability test. In summary, all the post-estimation tests for both models underscore the reliability and robustness of the empirical analyses. Conclusively, the empirical outcomes of this study are fundamental for shaping environmental sustainability initiatives in both countries.

4.2. Discussion of Findings

Accordingly, the empirical results revealed distinctive environmental challenge pathways for both countries. The notably divergent pathways for climate footprints in each country largely reflect their differentiated economic structures, energy mixes, and institutional frameworks. Hence, there is a need for more differentiated policy options to promote environmental sustainability in these two nations. In particular, the severe environmental effects of energy and mineral depletion in South Africa could be traced to the heavy reliance on coal-powered energy. Consistent with findings from prior studies [6,21], South Africa must accelerate the “Just Energy Transition Partnership” to mitigate the carbon footprint effects of energy depletion. This policy option may help the country sustain the initial carbon footprint reduction effects in the long run. Although the carbon footprint of mineral depletion is lower than that of energy, South Africa should consider green mining options to eliminate the climate challenges associated with mineral depletion. Some prior studies highlighted the environmental challenges posed by mineral depletion in South Africa and other countries [57,58].
Contrary to the stated hypothesis, empirical evidence suggests that energy depletion is not the primary culprit behind environmental degradation in Nigeria. This particular evidence challenges the submissions of several prior studies [18]. Notably, most such inferences were derived from estimators that remain insensitive to nonlinearities and structural shocks. Nevertheless, its environmental sustainability effect remains ineffective. This outcome demands greater commitment to efficient energy use and the transition to green energy. Conversely, it is observed that mineral depletion is the major determinant of the carbon footprint in Nigeria. This outcome, which aligns with some prior findings [21], may not be unconnected to the activities of the mostly unregulated mining sector in Nigeria. Gas flaring at mining sites, extensive deforestation, thriving informal artisanal mining, and diesel-based energy generation at mining sites could be major drivers of the heightened carbon footprints associated with mineral depletion in the country. Hence, stringent environmental regulations are critical to eliminating the carbon footprint associated with mineral depletion in the country.
Notably, both countries faced common realities regarding the carbon footprint implications of urbanization and economic growth. Nevertheless, their carbon footprint exacerbating effects are more pronounced in South Africa. Accordingly, the outcome suggests that urbanization in both countries is insensitive to environmental sustainability. This particular outcome is at variance with SDG 11, which emphasizes the building of sustainable cities and communities with safe, inclusive, and resilient human settlements. This finding also calls into question the submissions of Akca [22] and Tariq [23] that exonerate urbanization from the environmental challenges faced by OPEC and South Asian economies. Furthermore, the adverse environmental sustainability effects of economic growth in both countries suggest that they have not been able to decouple economic growth from emissions. The carbon-footprint-exacerbating effects of economic growth contradict SDG 12, which emphasizes responsible consumption and production for environmental progress. The outcome also implies a trade-off between economic expansion and clean environments, underscoring the need to implement policies that balance economic expansion with environmental sustainability. The empirical analysis suggests that carbon footprints in both South Africa and Nigeria are not linked to their participation in international trade. Hence, both countries could leverage open trade for substantial environmental wellness. Uzar [9] extended this narrative in the context of E7 nations.

5. Conclusions and Policy Insights

5.1. Conclusions

This study is dedicated to unraveling the implications of energy and mineral depletions for the carbon footprints of South Africa and Nigeria. Given this objective, relevant time-series variables were harnessed during the 1971–2022 period for empirical assessment of the peculiarities of each country. Unlike most prior studies, we opted for the carbon footprint, which represents a more holistic measure of environmental quality. The empirical estimates were processed with the FBARDL econometric technique, given its ability to produce unbiased estimates irrespective of structural shocks. Notably, the period 1971–2022 marked significant economic and non-economic events that shaped global climate outcomes. Nevertheless, most existing studies failed to factor the implications of such economic events into their models. The omission of such factors largely undermined the policy inferences of their investigations. The current study also controlled for the effects of urbanization, trade openness, and economic growth, as they have been identified as critical determinants of environmental quality in both the countries in question and in other countries. The empirical discoveries portend several policy implications for sustainable environments in both countries.

5.2. Policy Recommendations

Several policy options critical to environmental sustainability in both countries can be derived from the empirical estimates. The policy suggestions are consistent with the empirical estimates of the studied relationship to reflect the realities of South Africa and Nigeria. Accordingly, both countries should implement policy reforms in their mining subsectors. In particular, South Africa is expected to enact a stringent policy framework to reduce the energy intensity of coal extraction.
South Africa’s carbon footprint is primarily driven by energy depletion (0.666% increase per unit), reflecting heavy coal dependence, and mineral depletion (0.134% increase). The Just Energy Transition Partnership must accelerate with binding coal phase-out timelines. A Renewable Energy Acceleration Fund should provide feed-in tariff guarantees and grid connection subsidies. Carbon pricing must be escalated per ton of CO2, with revenue recycling to fund green investments. For mining, renewable energy procurement mandates should be improved, with tax incentives for on-site solar installations. A Mining Environmental Levy based on carbon intensity should fund rehabilitation and community transition programs. “Green Mining” certification standards covering water, waste, and energy efficiency can incentivize compliance through premium export pricing. Urbanization contributes 0.094% to carbon footprints, necessitating green building codes, expanded public transport, and municipal climate action plans. GDP growth’s 0.107% emissions increase requires green industrial policy prioritizing energy efficiency, renewable manufacturing, and electric vehicle production, with 25–30% investment incentives for qualifying projects.
Nigeria’s mineral depletion drives substantial carbon footprint increases (10.856%), reflecting largely unregulated mining activities including gas flaring, deforestation, and diesel-based operations. Immediate establishment of a Mining Environmental Regulatory Commission with independent enforcement authority is critical, alongside mandatory Environmental Impact Assessments for all mining operations, including artisanal sectors. Gas flaring bans must be enforced with strict timelines, supported by gas capture and utilization programs. Reforestation requirements for mining concessions should include bonding systems for rehabilitation compliance with satellite monitoring. Artisanal mining formalization through licensing and cooperative frameworks must link formalization to environmental compliance, providing technical assistance for sustainable practices. While energy depletion shows insignificant effects (−0.014%), fossil fuel subsidies must be eliminated permanently, with savings redirected to renewable deployment and social protection. A Renewable Energy Deployment Fund should support off-grid solar solutions and grid-scale projects. Binding renewable targets of 20% by 2027, 35% by 2032, and 50% by 2040 are essential, alongside energy efficiency standards for appliances and buildings. Urbanization’s 0.087% carbon footprint increase demands state-level urban planning frameworks with climate considerations and green cities programs for most cities. Mass transit investments and green building requirements could also be considered. GDP growth’s 0.046% emissions increase requires green growth indicators integrated into economic planning, prioritizing sustainable agriculture, clean manufacturing, and digital services.
Both countries show insignificant trade openness effects, suggesting untapped environmental benefits through international engagement. Environmental provisions in trade agreements should prioritize technology transfer commitments. Green procurement policies for government contracts can incentivize sustainable practices, while strengthened customs enforcement addresses illegal resource extraction. Institutional capacity building is essential across both countries. Environmental agencies require adequate personnel, technical resources, and political independence with performance-based funding. Environmental data systems enabling real-time emissions and compliance monitoring should ensure public accountability. Cross-agency coordination mechanisms across energy, mining, environment, and planning ministries must ensure policy coherence. The Fourier analysis reveals structural break effects requiring adaptive policy frameworks. Climate action dashboards with real-time indicators, regular policy reviews aligned with nationally determined cycles, and early warning systems for emerging environmental risks should ensure proactive responses.
The two countries require sustainable urbanization governance, growth–emissions decoupling through green industrial policy, trade integration with environmental provisions, and institutional strengthening. The observed short-term carbon footprint reductions from energy and mineral depletion improvements (0.222% in South Africa, 0.049% in Nigeria) indicate decisive action yields immediate benefits. Success depends on political commitment, adequate financing, institutional capacity, stakeholder engagement, and policy coherence, with the integration premium observed in advanced economies underscoring the importance of coordinated frameworks over isolated interventions.
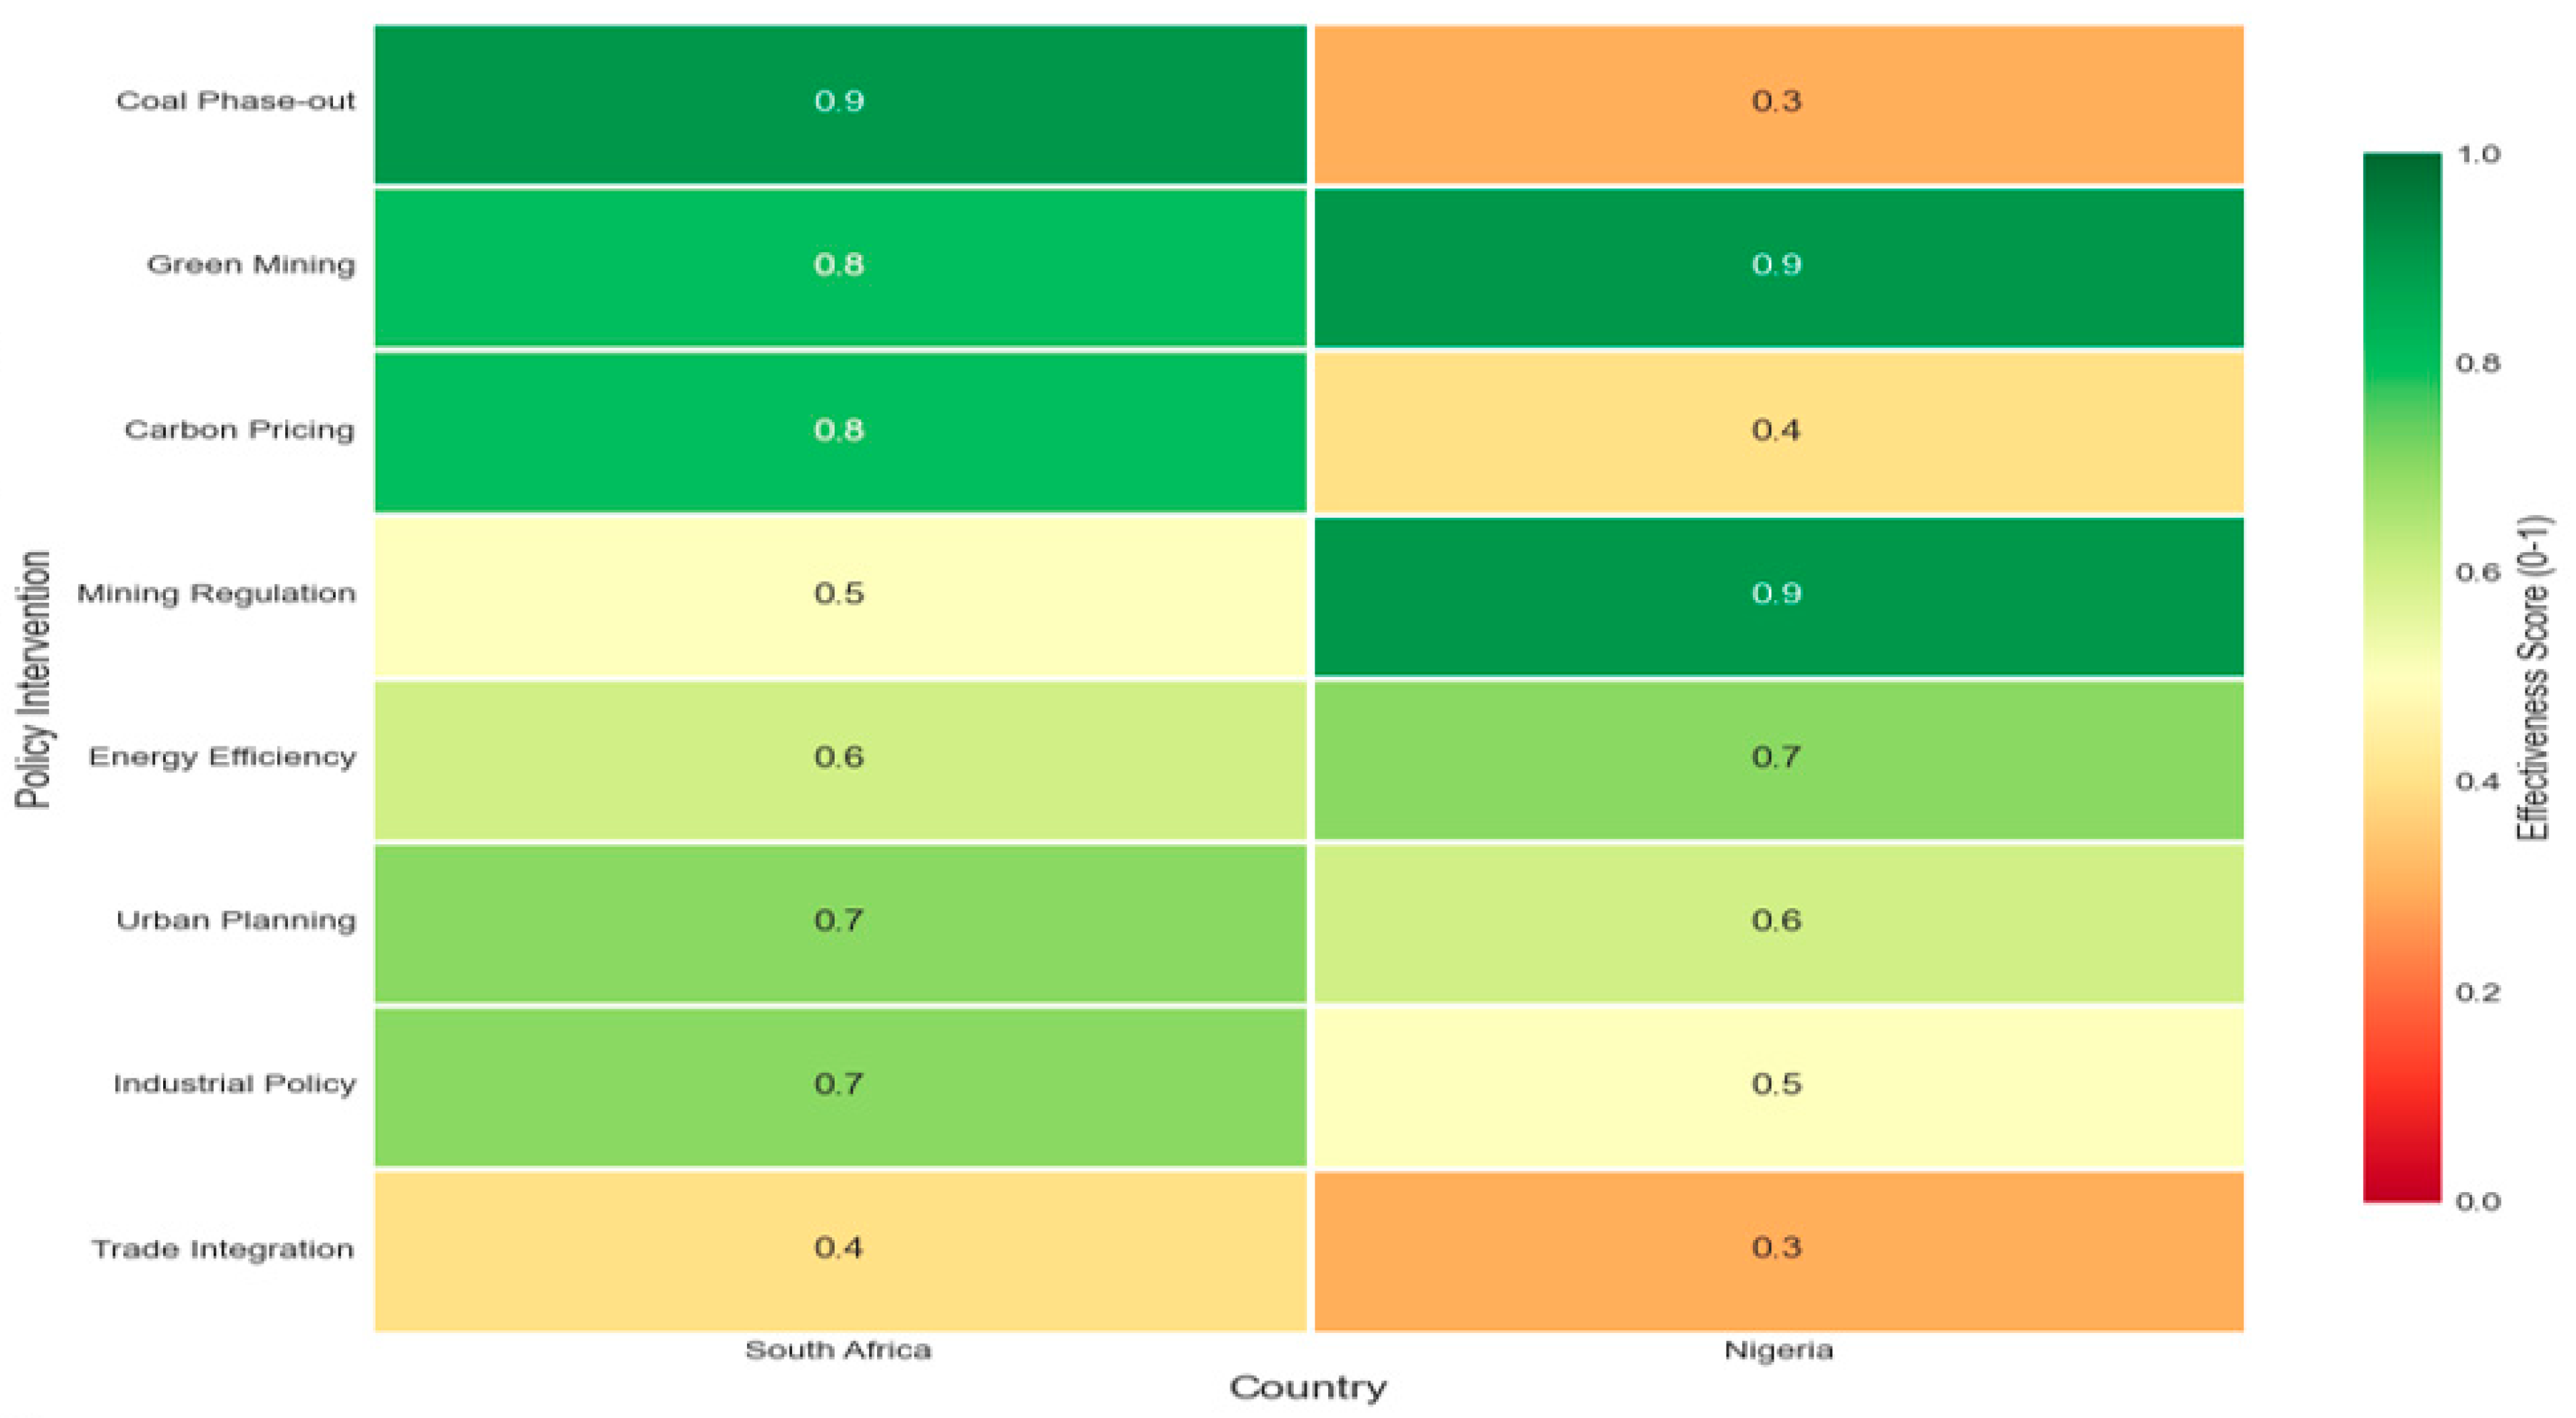
The policy effectiveness matrix (Figure 6) reveals differentiated intervention priorities for South Africa and Nigeria. South Africa achieves the highest effectiveness from coal phase-out (0.9), reflecting the 0.666% carbon footprint increase from energy depletion in its coal-dominated electricity system, with carbon pricing (0.8) providing complementary signals. Green mining (0.8), urban planning (0.7), industrial policy (0.7), and energy efficiency (0.6) form supporting interventions, while trade integration (0.4) shows limited effectiveness. Nigeria achieves the highest effectiveness from mining regulation (0.9), green mining (0.9), and artisanal formalization (0.9), reflecting the 10.856% carbon footprint increase from mineral depletion. Energy efficiency (0.7), urban planning (0.6), and industrial policy (0.5) address secondary challenges, while carbon pricing (0.4) and trade integration (0.3) show limited returns. South Africa’s diverse scores (average 0.64) suggest balanced coordination requirements, while Nigeria’s concentrated scores (average 0.60) demand regulatory enforcement capacity. The integration premium implies South Africa may capture higher returns from policy coherence, while Nigeria’s returns depend on enforcement intensity. Strategic sequencing requires South Africa to prioritize coal phase-out first, while Nigeria must focus on mining regulation and formalization. Both countries require institutional strengthening and complementary reforms to maximize environmental outcomes.
Accordingly, the policy effectiveness matrix (Figure 6) synthesizes empirical findings into structured policy priorities. Scores (0.0–1.0) derived from coefficient estimates imply the following: (i) South Africa’s energy depletion (0.666%), coal phase-out (0.9). (ii) Nigeria’s mineral depletion (10.856%), mining regulation (0.9). (iii) Control variable coefficients inform secondary priorities. A score of 0.9 indicates the highest priority for addressing primary drivers. Scores of 0.7–0.8 imply strong secondary interventions. The matrix shows that South Africa’s balanced profile (average 0.64) suggests coordination across sectors. Nigeria’s concentrated profile (average 0.60) demands a focus on enforcement capacity. The scores guide strategic sequencing, highlighting that South Africa should prioritize coal phase-out, while Nigeria should prioritize mining regulation and formalization.
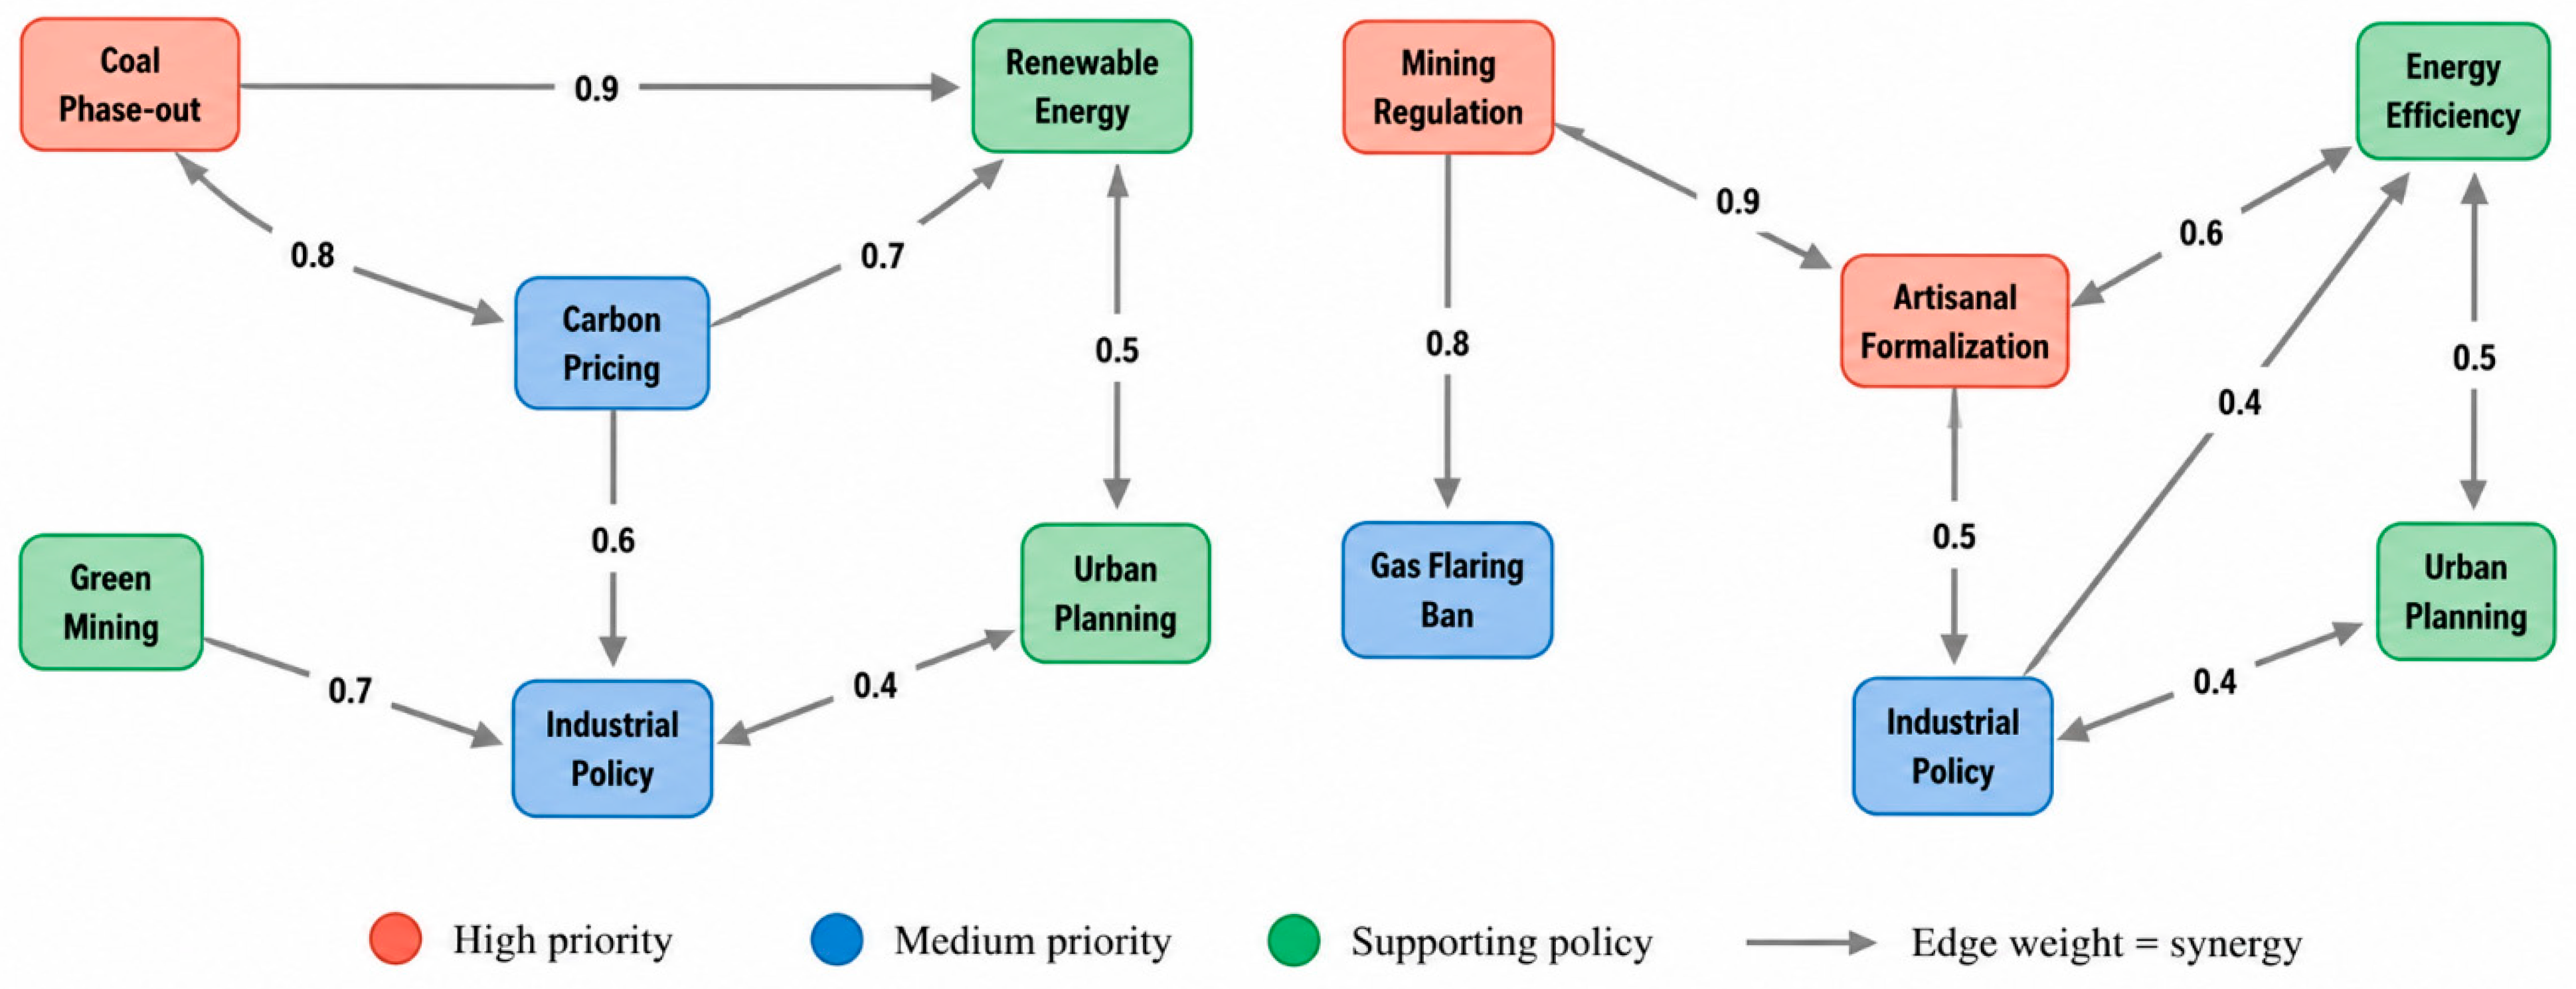
The policy integration networks (Figure 7) reveal fundamentally different intervention architectures for each country. South Africa’s network centers on coal phase-out (0.9) as the primary driver, with carbon pricing (0.8) providing complementary price signals. Green mining, industrial policy, renewable energy, and urban planning (0.7 each) form a supporting tier with moderate synergies (0.6–0.9 edge weights). This balanced structure requires cross-sectoral coordination to maximize the integration premium. Conversely, Nigeria’s network concentrates on mining regulation and artisanal formalization (0.9 each) as the dominant priorities. Gas flaring bans (0.8), energy efficiency (0.9), industrial policy, and urban planning (0.7) form secondary interventions. Nigeria’s concentrated structure reflects mineral depletion’s overwhelming dominance (10.856% coefficient), requiring regulatory enforcement capacity rather than broad coordination. The integration premium frameworks outperform isolated interventions. This implies South Africa may capture higher returns from policy coherence, while Nigeria’s returns depend on enforcement intensity.
The figure visualizes intervention interconnections and synergies. The nodes represent policy interventions; edge weights (0.0–1.0) quantify synergies—0.8–0.9 strong complementarity; 0.6–0.7 moderate compatibility; 0.3–0.5 weak interaction. Edge weights are informed by policy coherence literature, institutional analysis, implementation feasibility, and country context. It identifies that South Africa’s network centers on coal phase-out (0.9) with a supporting tier (carbon pricing 0.8, green mining 0.8, industrial policy 0.7). Moderate edge weights (0.6–0.9) indicate balanced coordination requirements. Nigeria’s network concentrates on mining regulation and artisanal formalization (0.9 each) with secondary interventions (gas flaring bans 0.8, energy efficiency 0.9). The concentrated structure reflects mineral depletion dominance. There are enhanced returns from coordinated frameworks over isolated interventions. South Africa may capture higher returns from policy coherence; Nigeria’s returns depend on enforcement intensity.
The policy effectiveness matrix and integration network are qualitative decision-support tools derived from the quantitative FBARDL coefficient estimates. These tools translate empirical findings into structured, actionable policy guidance. They provide relative priorities rather than deterministic predictions, facilitating systematic evaluation of competing interventions and stakeholder consensus-building. The tools bridge rigorous economic analysis and practical environmental policy formulation. However, it is imperative to state that the policy effectiveness matrix and integration network present exploratory analytical frameworks requiring empirical validation. Validation requirements may include: (i) comparison with observed policy outcomes; (ii) stakeholder feedback and refinement; (iii) expert panel review; (iv) implementation monitoring and environmental outcome evaluation; and (v) cost-benefit analysis of recommended interventions.

5.3. Limitations

Accordingly, this study is able to achieve its objectives, which largely shaped the steps taken within it. The particular focus on the two leading African countries (South Africa and Nigeria) may limit the generalizability of its inferences. The climate realities of every country are largely shaped by several factors, including economic structures, institutional frameworks, and geopolitical events. On these premises, we advocate that future studies should extend the narratives by exploring how energy and mineral depletions affect their climate footprints. The adoption of the carbon footprint is insightful; however, a comparative assessment of other metrics may provide more policy directions. Future studies may also examine the carbon footprint implications of other variables, including forest and other natural resource depletions, which were not included herein based on the specified objectives. The moderating effects of technology, environmental regulation, and governance may also influence the effects of energy and mineral depletions on carbon footprints. This is another suggestion that future researchers may consider since such options are not within the scope of the present study. Likewise, future studies are encouraged to test for causality between these variables and carbon footprints in these resource-rich countries.
Likewise, future studies may employ multi-criteria decision analysis (MCDA) approaches. This may include the following: (i) the analytic hierarchy process (AHP) for expert pairwise comparisons; (ii) TOPSIS for multiple criteria integration; and (iii) data envelopment analysis (DEA) for efficiency frontier estimation. Other future research directions include sensitivity analysis of score robustness; country-specific score calibration; integration of cost-effectiveness; alternative methodology comparison; and validation benchmark establishment.

Funding

This research received no external funding.

Institutional Review Board Statement

Not applicable.

Informed Consent Statement

Not applicable.

Data Availability Statement

The raw data supporting the conclusions of this article will be made available by the author on request.

Conflicts of Interest

The author declares no conflicts of interest.

References

  1. Raihan, A.; Rahman, J.; Tanchangya, T.; Ridwan, M.; Bari, A.M. Influences of economy, energy, finance, and natural resources on carbon emissions in Bangladesh. Carbon Res. 2024, 3, 71. [Google Scholar] [CrossRef] [Scilit]
  2. Sogut, Y.; Degirmenci, T.; Aydin, M. Determinants of carbon footprint in the USA: The role of public energy technology R&D, energy security risk, renewable energy transition, and population density. J. Environ. Manag. 2025, 392, 126803. [Google Scholar] [CrossRef] [Scilit]
  3. Sun, W.; Yao, G. Impact of mineral resource depletion on energy use: Role of energy extraction, CO2 intensity, and natural resource sustainability. Resour. Policy 2023, 86, 104175. [Google Scholar] [CrossRef] [Scilit]
  4. Wang, C.; Thomas, C. Energy Choices, Institutional Governance, and Financial Development: Pathways Toward Sustainable Development and Carbon Mitigation. Sustain. Dev. 2026, 34, 1074–1087. [Google Scholar] [CrossRef] [Scilit]
  5. Xu, M.; Akram, F. Toward a Sustainable Future: The Roles of Finance, Energy, and Human Capital in Shaping Carbon Outcomes in E7 Economies. Sustain. Dev. 2026, 34, 4603–4621. [Google Scholar] [CrossRef] [Scilit]
  6. Balsalobre-Lorente, D.; Shahbaz, M.; Roubaud, D.; Farhani, S. How economic growth, renewable electricity and natural resources contribute to CO2 emissions? Energy Policy 2018, 113, 356–367. [Google Scholar] [CrossRef] [Scilit]
  7. Ha, L.T. An investigation of the relationship between climate risk and efficient use of natural resources: New findings from new estimation. Environ. Chall. 2026, 22, 101419. [Google Scholar] [CrossRef] [Scilit]
  8. Liu, J.; Qiao, C. The green paradox of digital finance: Fintech, resource dependence, and energy transition in CAREC economies. Energy Strategy Rev. 2026, 65, 102260. [Google Scholar] [CrossRef] [Scilit]
  9. Uzar, U.; Eyuboglu, K.; Alola, A.A. Ecological effects of income inequality, financial development, and natural resources in E7 Countries. Innov. Green Dev. 2026, 5, 100336. [Google Scholar] [CrossRef] [Scilit]
  10. Uche, E.; Ngepah, N.; Dey, L.; Das, N. How sustainable is the ecological environment in resource-rich African countries in the face of profound resource depletion, energy poverty, and modernization? Energy Econ. 2025, 151, 108889. [Google Scholar] [CrossRef] [Scilit]
  11. Maumoh, I.; Onoja, A. Climate change policy uncertainty and challenges in carbon emission for east and southern African regions. Trans. Energy Sustain. 2024, 1, 24–40. [Google Scholar] [CrossRef] [Scilit]
  12. Global Footprint Network. National Ecological Footprint and Biocapacity Accounts, 2025 Edition. Ecological Indicators. 2025. Available online: https://footprintnetwork.org/what-ecological-footprints-measure/ (accessed on 15 May 2026).
  13. Auty, R. Sustaining Development in Mineral Economies. In The Resource Curse Thesis; Routledge: Cambridge, MA, USA, 1993. [Google Scholar]
  14. Amin, N.; Sharif, A.; Tayyab, M.; Pan, Y. Green Technological Advances and Resource Rents as Levers for Carbon Reduction in BRICS: Implications for SDGs 7, 8, 9, 12, and 13. Sustain. Dev. 2025, 33, 3171–3195. [Google Scholar] [CrossRef] [Scilit]
  15. Okere, K.I.; Fasanya, I.O.; Dimnwobi, S.K. Environmental Impacts of Natural Resource and FinTech in Oil-Rich Economies: The Role of FinTech in Mitigating the Carbon Curse. Nat. Resour. Forum 2025, 50, 1178–1197. [Google Scholar] [CrossRef] [Scilit]
  16. Opuala, C.S.; Omoke, P.C.; Uche, E. Sustainable environment in West Africa: The roles of financial development, energy consumption, trade openness, urbanization and natural resource depletion. Int. J. Environ. Sci. Technol. 2023, 20, 423–436. [Google Scholar] [CrossRef] [Scilit]
  17. Wang, W.; Niu, Y.; Gapich, A.; Strielkowski, W. Natural resources extractions and carbon neutrality: The role of geopolitical risk. Resour. Policy 2023, 83, 103577. [Google Scholar] [CrossRef] [Scilit]
  18. Akça, E.E.; Tosun, T.T. Testing the Natural Resource Curse Hypothesis from an Environmental Perspective: Empirical Evidence from OPEC Countries. Nat. Resour. Forum 2026. [Google Scholar] [CrossRef] [Scilit]
  19. Wang, H.; Lei, Z. Energy supply from oil and gas, mineral depletion, and total natural resource rents: Impact of oil equivalent energy use CO2 intensity. Resour. Policy 2023, 86, 104172. [Google Scholar] [CrossRef] [Scilit]
  20. Aladejare, S.A.; Nyiputen, I.R. Ecological response to industrialisation drivers in Africa. Environ. Dev. 2023, 47, 100896. [Google Scholar] [CrossRef] [Scilit]
  21. Nathaniel, S.P.; Solomon, C.J.; Khudoykulov, K.; Fakher, H.A. Linking Resource Richness, Digital Economy, and Clean Energy to Ecological Footprint and Load Capacity Factor in Emerging Markets. Nat. Resour. Forum 2025, 50, 727–742. [Google Scholar] [CrossRef] [Scilit]
  22. Alam, N.; Alam, M.M. The role of natural resources, financial development, renewable energy, and technology in mitigating carbon emissions in BRICS. Miner. Econ. 2026. [Google Scholar] [CrossRef] [Scilit]
  23. Tariq, N.; Ali, M.; Usman, M. Impact of human capital and natural resources on environmental quality in South Asia. Environ. Dev. Sustain. 2025, 27, 30649–30669. [Google Scholar] [CrossRef] [Scilit]
  24. Riaz, M.H.; Alam, M.; Ali, A.; Ahmed, Z.; Raihan, A. The role of growth, energy, and resource utilization in ecological footprints: Navigating BRICS + environmental challenges. Lett. Spat. Resour. Sci. 2025, 18, 8. [Google Scholar] [CrossRef] [Scilit]
  25. Tarekegn, J.; Ayalew, Z.; Muchie, M.; Adugna, M. The nexus among natural resources, globalization, and energy consumption for environmental sustainability in the case of Ethiopia. GeoJournal 2025, 90, 279. [Google Scholar] [CrossRef] [Scilit]
  26. Badeeb, R.A.; Lean, H.H.; Clark, J. The evolution of the natural resource curse thesis: A critical literature survey. Resour. Policy 2017, 51, 123–134. [Google Scholar] [CrossRef] [Scilit]
  27. Yi, S.; Abbasi, K.R.; Hussain, K.; Albaker, A.; Alvarado, R. Environmental concerns in the United States: Can renewable energy, fossil fuel energy, and natural resources depletion help? Gondwana Res. 2023, 117, 41–55. [Google Scholar] [CrossRef] [Scilit]
  28. Ehrlich, P.R.; Holdren, J.P. Impact of Population Growth. Science 1971, 171, 1212–1217. [Google Scholar] [CrossRef] [Scilit]
  29. Yong, Y.; Ahmed, Z.; Wang, S.; Rjoub, H.; Bilan, Y. Minerals, natural resources, government instability, and growing ecological challenges: Can we achieve SDGs 12 and 13? Resour. Policy 2024, 88, 104507. [Google Scholar] [CrossRef] [Scilit]
  30. Sibanda, K.; Garidzirai, R.; Mushonga, F.; Gonese, D. Natural Resource Rents, Institutional Quality, and Environmental Degradation in Resource-Rich Sub-Saharan African Countries. Sustainability 2023, 15, 1141. [Google Scholar] [CrossRef] [Scilit]
  31. Nguyen, T.H.; Deng, H.; Abbas, Z.Z.; Lam, T.T.; Abbas, H.R. The effect of natural capital, regional development, FDI, and natural resource rent on environmental performance: The Mediating role of green innovation. Resour. Policy 2024, 91, 104923. [Google Scholar] [CrossRef] [Scilit]
  32. Zhou, X.; Patel, G.; Mahalik, M.K.; Gozgor, G. Effects of green energy and productivity on environmental sustainability in BRICS economies: The role of natural resources rents. Resour. Policy 2024, 92, 105026. [Google Scholar] [CrossRef] [Scilit]
  33. Khan, S.; Suplata, M.; Pawera, R.; Waris, A. Do natural resources, energy consumption, and financial development increase carbon emissions? The role of globalization and green technology. Discov. Sustain. 2025, 6, 108. [Google Scholar] [CrossRef] [Scilit]
  34. Marshadi, A.H.A.L.; Aslam, M.; Janjua, A.A. Ecological footprints, global sustainability, and the roles of natural resources, financial development, and economic growth. PLoS ONE 2025, 20, e0317664. [Google Scholar] [CrossRef] [Scilit]
  35. Pala, F.; Barut, A.; Torusdağ, M.; Pilatin, A.; Henni, M.D. Financial Inclusion, Energy Intensity, and Natural Resources: Environmental Insights From BRICS and MINT Economies. Geol. J. 2026. [Google Scholar] [CrossRef] [Scilit]
  36. Alnsour, J. Dynamic links between renewable and nonrenewable energy, natural resources, technological innovation, urbanization, and environmental sustainability in Jordan. Int. J. Energy Water Resour. 2025, 10, 19. [Google Scholar] [CrossRef] [Scilit]
  37. Daly, S.; Belkhamsa, M. Unveiling the Path to Sustainability in Africa: Insights from Education, Resource Management, and Economic Complexity. Sage Open 2026, 16, 21582440251409119. [Google Scholar] [CrossRef] [Scilit]
  38. Imran, M.; Xu, H.; Naz, A.; Aslam, M.; Alzuman, A.; Zhang, X.; Wei, N. Renewable energy, digitalization, and governance effectiveness: Pathways to environmental sustainability in South Asia. Energy Strategy Rev. 2026, 64, 102052. [Google Scholar] [CrossRef] [Scilit]
  39. Warsame, A.A.; Daror, H.O.; Jama, M.A. Toward effective climate policy in the East African region: The impact of corruption control and natural resource rents on environmental pollution. Int. J. Urban Sustain. Dev. 2026, 18, 54–68. [Google Scholar] [CrossRef] [Scilit]
  40. Pérez-Rincón, M.A. Materials Flow Analysis in Latin America. In The Barcelona School of Ecological Economics and Political Ecology: A Companion in Honour of Joan Martinez-Alier; Villamayor-Tomas, S., Muradian, R., Eds.; Springer International Publishing: Cham, Switzerland, 2023; pp. 123–135. [Google Scholar]
  41. Vesia, D.J.; Mahutga, M.C.; Buì, B.K.H. Flattening the curve? The structure of the natural resource exchange network and CO2 emissions. Soc. Netw. 2023, 75, 118–136. [Google Scholar] [CrossRef] [Scilit]
  42. Alcott, B. Jevons’ paradox. Ecol. Econ. 2005, 54, 9–21. [Google Scholar] [CrossRef] [Scilit]
  43. Akadiri, S.S.; Ozkan, O. Tourism, energy use, and urban growth: Implications for load capacity and sustainable development. Lett. Spat. Resour. Sci. 2026, 19, 2. [Google Scholar] [CrossRef] [Scilit]
  44. Caglar, A.E.; Daştan, M.; Avci, S.B.; Avcı, T.; Gökçe, N. Asymmetric relationship between load capacity factor and mineral rents: Evidence from Brazil. Environ. Dev. Sustain. 2025. [Google Scholar] [CrossRef] [Scilit]
  45. Cong, Y.; Ren, C. Does Natural resource dependency impede sustainable development? Exploring the non-linear consequence of economic complexity. Resour. Policy 2023, 85, 103972. [Google Scholar] [CrossRef] [Scilit]
  46. Xie, C.; Yang, X.; Wang, Y. Carbon footprint and the silver wave: How population ageing affects household indirect carbon emissions. Humanit. Soc. Sci. Commun. 2026, 13, 815. [Google Scholar] [CrossRef] [Scilit]
  47. Enders, W.; Lee, J. The flexible Fourier form and Dickey–Fuller type unit root tests. Econ. Lett. 2012, 117, 196–199. [Google Scholar] [CrossRef] [Scilit]
  48. Rodrigues, P.M.M.; Robert Taylor, A.M. The Flexible Fourier Form and Local Generalised Least Squares De-trended Unit Root Tests. Oxf. Bull. Econ. Stat. 2012, 74, 736–759. [Google Scholar] [CrossRef] [Scilit]
  49. Banerjee, P.; Arčabić, V.; Lee, H. Fourier ADL cointegration test to approximate smooth breaks with new evidence from Crude Oil Market. Econ. Model. 2017, 67, 114–124. [Google Scholar] [CrossRef] [Scilit]
  50. Georgescu, I.; Kinnunen, J. An augmented fourier ARDL analysis of CO2 emission determinants in Spain: The role of growth, innovation, and trade. Lett. Spat. Resour. Sci. 2025, 18, 12. [Google Scholar] [CrossRef] [Scilit]
  51. Bertelli, S.; Vacca, G.; Zoia, M. Bootstrap cointegration tests in ARDL models. Econ. Model. 2022, 116, 105987. [Google Scholar] [CrossRef] [Scilit]
  52. Yilanci, V.; Bozoklu, S.; Gorus, M.S. Are BRICS countries pollution havens? Evidence from a bootstrap ARDL bounds testing approach with a Fourier function. Sustain. Cities Soc. 2020, 55, 102035. [Google Scholar] [CrossRef] [Scilit]
  53. McNown, R.; Sam, C.Y.; Goh, S.K. Bootstrapping the autoregressive distributed lag test for cointegration. Appl. Econ. 2018, 50, 1509–1521. [Google Scholar] [CrossRef] [Scilit]
  54. Pesaran, M.H. Testing Weak Cross-Sectional Dependence in Large Panels. Econom. Rev. 2015, 34, 1089–1117. [Google Scholar] [CrossRef] [Scilit]
  55. Naimoglu, M.; Dam, M.M.; Tiwari, A.K. Assessing the role of energy R&D efficiency in advancing environmental sustainability: Evidence from France with new ILCC hypotheses and soft structural changes. J. Environ. Manag. 2025, 394, 127459. [Google Scholar] [CrossRef] [Scilit]
  56. Fatima, S.; Khan, I.; Rehman, M.Z.; Khalid, M.H. The role of tourism, natural resources, and renewable energy in enhancing economic growth and combating climate change in OPEC economies. Environ. Dev. Sustain. 2026, 28, 2437–2458. [Google Scholar] [CrossRef] [Scilit]
  57. Li, Q.; You, D.; Li, Q.; Wang, F.; Wang, Y.; Yang, Y. Analysis of Sedimentation Behavior and Influencing Factors of Solid Particles in CO2 Fracturing Fluid. Processes 2025, 13, 4049. [Google Scholar] [CrossRef] [Scilit]
  58. Wu, J.; Li, Q.; Li, Q.; Wang, F.; Cheng, Y.; Yan, C. Design and Optimization of Bottom-Hole Temperature–Pressure Combinations in Gas Production from Gas Hydrates via Carbon Dioxide Replacement Strategy. Energies 2026, 19, 3536. [Google Scholar] [CrossRef] [Scilit]
Figure 1. (a) Trends in carbon footprint, energy, and mineral depletions in South Africa. (b) Trends in carbon footprint, energy, and mineral depletions in Nigeria.
Sustainability 18 09148 g001aSustainability 18 09148 g001b
Figure 2. Theoretical illustration.
Sustainability 18 09148 g002
Figure 3. Methodological flow.
Sustainability 18 09148 g003
Figure 4. (a) Correlation matrix and VIF test (South Africa). (b) Correlation matrix and VIF test (Nigeria).
Sustainability 18 09148 g004
Figure 5. (a): Optimal Fourier frequency (k)—South Africa. (b): Optimal Fourier frequency (k)—Nigeria.
Sustainability 18 09148 g005
Figure 6. Policy effectiveness matrix.
Sustainability 18 09148 g006
Figure 7. Policy integration networks.
Sustainability 18 09148 g007
Table 1. Novelty comparison table.
FeatureThis StudyPrior Studies
Thematic FocusDisaggregated effects of energy and mineral depletion on carbon footprintAggregate natural resource depletion effects on CO2 emissions [1,3,7,8,14,15,16]
Geographical CoverageComparative analysis of South Africa and Nigeria (top two resource-rich African countries)Single-country or panel studies without comparative insights [16,17,18]
Environmental MetricCarbon footprint (comprehensive supply-chain measure)CO2 emissions only [5,6,9,19,20]
MethodologyFourier-bootstrap ARDL (accounts for unknown structural breaks)Conventional ARDL or panel estimators [20,21,22]
Policy IntegrationPolicy effectiveness matrix and integration networkSiloed policy recommendations [23,24,25]
Structural Break HandlingFourier approximation captures smooth/sharp breaksOften ignored or addressed via dummy variables
Table 2. Data information.
VariableNotationMeasurementSource
Outcome variable
Climate footprintCab_fpGlobal hectares (gha)Global Footprint Network https://data.footprintnetwork.org
URL (accessed on 12 May 2026)
Policy variables
Energy depletionE_depAdjusted savings: energy depletion (% of GNI)World Development Indicators (WDI)
https://data.worldbank.org/indicator
URL (accessed on 8 May 2026)
Mineral depletionM_depAdjusted savings: mineral depletion (% of GNI)WDI
Control variables
UrbanizationUrbUrban agglomeration (% of total population)WDI
Trade opennessOpen_TTrade (% of GDP)WDI
Economic growthGDPGDP per capita growth (annual %)WDI
Table 3. Descriptive statistics.
SeriesMeanMaximumMinimumStd_DevSkewnessKurtosisJ-BJ-B p-Val
South Africa
Cab_fp2.4283.1121.8940.2770.4350.2071.5250.466
E_dep1.8295.4260.5210.8471.6505.44070.882 ***0.000
M_dep1.0585.6460.1250.9762.5098.903184.328 ***0.000
Urb26.97536.17622.2064.6650.640−1.1386.065 **0.048
Open_T48.15165.97434.3217.0650.033−0.4120.5150.772
GDP0.2594.530−7.6782.660−0.7360.3844.4580.107
Nigeria
Cab_fp0.1800.2710.0390.064-0.403−0.8733.1030.211
E_dep7.65129.4220.4105.8511.3642.65326.577 ***0.000
M_dep0.0050.0540.0000.0123.1169.697242.450 ***0.000
Urb12.83816.8516.9702.883−0.587−0.8584.5390.103
Open_T41.22965.41226.0989.3500.725−0.0794.3760.112
GDP0.69012.210−15.7585.386−0.7441.5388.083 **0.017
*** = p < 1%; ** = p < 5%.
Table 4. Stationarity test.
SeriesEnders and Lee [48] Fourier ADFRodrigues and Taylor [52] Fourier GLS
LevelFirst DifferenceLevelFirst Difference
South Africa
Cab_fp−3.340−7.742 ***−3.807−7.759 ***
E_dep−2.931 *-−6.111 ***-
M_dep−1.689−5.123 ***−2.630−5.868 ***
Urb−2.749−3.992 *−2.835−4.630 **
Open_T−2.659−3.004 *−2.204−4.345 **
GDP−5.563 ***-−6.003 ***-
Nigeria
Cab_fp−2.877−4.328 ***−2.121−4.284 ***
E_dep−7.031 ***-−8.228 ***-
M_dep−2.752−6.614 ***−2.125−7.480 ***
Urb−3.392−3.873 **−2.797−4.022
Open_T−2.710−3.852 *−3.392−7.804 ***
GDP−6.009 ***-−3.738−4.629 ***
*** = p < 1%; ** = p < 5%; * = p < 10%.
Table 5. Fourier ADL Cointegration Test (FADL).
ModelsCoefficientStd. Errort-Stat1% CV5% CV10% CV
South Africa
delta(y_{t-1})−1.1830.225−5.237 ***−5.069−4.448−4.1310
Nigeria
delta(y_{t-1})−2.4587560.151−16.292 ***−4.900−4.160−3.7900
*** = p < 1%.
Table 6. Marginal effects estimates-FBARDL.
SeriesSouth AfricaNigeria
Coeff.z-statp-val Coeff.z-stat p-val
Long-run marginal effect—Panel A
E_dep0.666 ***7.5460.000−0.014−1.0010.316
M_dep0.134 ***2.8910.00310.856 *1.8690.061
Urb 0.094 ***4.0130.0000.087 ***2.8080.005
Open_T−0.005−0.4290.667−0.014−1.4110.158
GDP0.107 ***5.0110.0000.046 ***3.0760.002
Short-run marginal effects—Panel B
∆E_dep0.0621.4630.161−0.049 ***−4.0970.000
∆E_dep_1−0.722 ***−5.4050.000−0.033 *−1.9860.058
∆M_dep0.0020.0850.9322.1080.3490.729
∆M_dep_1−0.222 ***−4.5240.000−18.288 **−2.2350.035
∆Urb−0.076−0.3670.717−0.954−0.7630.452
∆Urb_1−0.951 ***−3.2440.0044.204 ***3.1600.004
∆Open_T0.0070.8000.4340.0070.6000.553
∆Open_T_1−0.002−0.1810.8580.027 **2.5050.019
∆GDP0.027 **2.4270.0260.029 **2.0700.049
∆GDP_1−0.041 **−2.2890.035−0.012−1.2870.210
ADJ.−0.488 ***−5.4940.000−0.514 ***−7.2690.000
sin(2pi*k*/T)0.949 ***5.9790.0000.259 *1.7780.088
cos(2pi*k*/T)0.768 ***5.3700.000−0.129−1.2190.234
Post estimation tests—Panel C
MetricsStatp-val MetricsStatp-val
Normality Test (Shapiro–Wilk W)0.97240.327 Normality Test (Shapiro–Wilk W)0.9780.534
Serial correlation (BG LM)0.1490.699 Serial correlation (BG LM)0.9350.333
ARCH LM1.9910.115 ARCH LM0.3790.540
Ramsey RESET0.5910.624 Ramsey RESET1.1450.343
CUSUM (5%)Stable CUSUM (5%)Stable
CUSUM-SQ (5%)Stable CUSUM-SQ (5%)Stable
Note: *** = p < 1%; ** = p < 5%; * = p < 10%.
Disclaimer/Publisher’s Note: The statements, opinions and data contained in all publications are solely those of the individual author(s) and contributor(s) and not of MDPI and/or the editor(s). MDPI and/or the editor(s) disclaim responsibility for any injury to people or property resulting from any ideas, methods, instructions or products referred to in the content.