


Abstract
The operation and management of urban dynamic systems often rely on information, including holiday and event calendars, to anticipate deviations from routine demand. However, such calendars cannot capture irregularly announced holidays or undocumented physical disruptions and require continuous maintenance. This study proposes Structural Equilibrium, a reference state for interpreting urban dynamic systems without external calendars. Temporal variation is represented as Concentration–Dispersion–Relative Balance (CDR) structural states under two representative Structural Equilibria: Information-oriented and Stability-oriented Equilibria. Applying the two Equilibria to Jeju Airport electricity consumption and Gangnam Station subway passenger-flow data showed that structural representations diverged at specific times, producing structural Gaps. Moving-block bootstrap analysis showed that these divergences exceeded the range typically expected under the dataset’s own temporal dependence structure. Without calendar information, the divergences corresponded to the 2024 Chuseok holiday period in the subway data and a government-designated temporary public holiday and major snowstorm in the airport data. One high-Gap observation at Jeju Airport had no external cause despite an unremarkable raw magnitude, showing that structural analysis can reveal unusual conditions overlooked by magnitude-based monitoring. These findings indicate that Structural Equilibrium supports calendar-independent interpretation and adaptive monitoring under changing conditions, contributing to resilient and sustainable urban infrastructure operation.
1. Introduction
1.1. Beyond Magnitude: From Temporal Variation to Structural Interpretation
Understanding and operating urban dynamic systems requires identifying deviations from routine activity patterns caused by holidays, festivals, and other socially or physically irregular conditions. In practice, such deviations are often managed through manually maintained calendars that identify dates requiring adjusted operations. However, these calendars cannot anticipate irregularly announced holidays, localized events, or undocumented physical disruptions, and they require continuous maintenance as institutional and social conditions change. An analytical approach that can identify such deviations directly from activity data, without relying on externally supplied calendars, would therefore support more adaptive interpretation and operation of urban systems.
Urban activities can be understood as dynamic systems that change over time through interactions among diverse components [1,2,3,4]. Transportation, energy consumption, human movement, and other urban activities do not remain in fixed states; their temporal changes reflect how urban systems operate under different conditions. Accordingly, time-series data have been widely used to observe urban activities and examine temporal dynamics and urban rhythms. In this study, power consumption and passenger flow are used as representative empirical data for examining the proposed structural perspective [5,6].
Conventional urban time-series analysis has primarily focused on describing when and how much observed activity changes. Temporal characteristics such as increases and decreases, peaks, periodicity, and trends have been used to identify changes in population mobility, energy consumption, traffic volume, and other urban activities [7,8,9,10,11,12]. These approaches have made important contributions to observing and describing the temporal behavior of urban systems, and related forecasting approaches have likewise been applied to urban environmental time series [13].
However, observed temporal variation and the structural characteristics underlying that variation are not necessarily the same information. A change in magnitude does not directly indicate how activity is organized into different structural states. For example, the same increase in activity may result from activity becoming concentrated in particular periods, existing activity becoming dispersed across multiple periods, or a transition from one structural state to another. These possibilities cannot be distinguished from magnitude alone [14,15].
This issue is particularly important when the temporal information available for observing urban systems is limited. Although urban activities may be associated with multiple forms of information with different temporal and spatial characteristics [16,17,18,19], analysis often relies on a single time series representing a specific activity. The central challenge is therefore not simply to obtain additional data, but to represent the structural information embedded in limited temporal observations but not directly revealed by magnitude. Understanding temporal variation in urban systems consequently requires moving beyond what and how much has changed to examine how changes are structurally organized and expressed as different structural states.
1.2. Reference Points Shape the Structural Interpretation of Urban Rhythms
Various statistical references, including the mean, median, moving average, and seasonal patterns, have been used to assess observed activity levels and their deviations from typical levels. These references are useful for identifying how far an observation departs from an expected magnitude and how activity changes over time. However, they primarily provide a basis for evaluating changes in observed levels rather than for determining how temporal variation should be interpreted as different structural states.
Understanding the dynamic structure of urban systems therefore requires an analytical reference that can organize temporal variation into interpretable structural states and their transitions. Such a reference should not simply represent the typical level of observed activity. Instead, it should provide a basis for determining how changes in temporal activity are interpreted from a specified structural perspective [14,15]. This study proposes Structural Equilibrium as such a reference state. Structural Equilibrium is an analytical reference for interpreting temporal activity changes and state transitions that emerge in urban rhythms. It is not an assumed state of rest or an optimal condition toward which urban activities are expected to converge. Rather, it determines how continuously changing urban activities are represented and interpreted as structural states.
This study examines two representative principles: Information-oriented Equilibrium, which emphasizes the informational organization of temporal activity, and Stability-oriented Equilibrium, which emphasizes the stability of that organization, as illustrated in Figure 1.
Figure 1.
Multiple Structural Perspectives for Interpreting Urban Dynamic Systems. Left: a fixed criterion yields one fixed interpretation. Right: each candidate Structural Equilibrium yields its own decomposition and interpretation of the same activity.
1.3. Research Questions
Urban dynamic systems cannot be sufficiently explained by changes in observed magnitude alone. This study examines how structural characteristics can be represented and interpreted from limited temporal information and how the interpretation changes when different Structural Equilibria are applied to the same temporal dynamics. The proposed perspective is examined empirically using power-consumption data from Jeju Airport and passenger-flow data from Gangnam Station as representative examples of urban activity systems.
The study addresses the following research questions:
- RQ1. What structural characteristics of an urban dynamic system can be identified from limited temporal information?
- RQ2. How does Structural Equilibrium function as a reference state for identifying structural states and state sequences in urban dynamics?
- RQ3. What structural differences emerge under different Structural Equilibria when analyzing the same temporal dynamics?
2. Conceptual Foundation
2.1. Structural Decomposition of Urban Dynamic Systems
Urban dynamic systems change over time through interactions among diverse components, and their temporal dynamics can be understood in relation to the organization and evolution of the system [2,3,4,19,20]. In this study, these temporal dynamics are structurally decomposed using Structural Equilibrium as a reference state, and the resulting representations are expressed as structural states that vary over time.
To this end, this study represents the temporal characteristics of urban activities using a structural representation of Concentration, Dispersion, and Relative Balance (CDR). CDR is not a set of independent temporal features, but a relational structural representation derived from a common reference-relative temporal deviation. Specifically, an observed temporal characteristic is first expressed as a deviation from the Structural Equilibrium and then decomposed into Concentration and Dispersion according to the operational definitions provided in the Appendix A. Relative Balance represents the relationship between these two structural components.
Concentration and Dispersion therefore do not represent independent activity characteristics, but two interrelated structural expressions derived from the same reference-relative temporal deviation. Relative Balance likewise does not represent a separate temporal phenomenon, but indicates the relative relationship between the two structural components within the same deviation structure. Together, these components describe how a temporal deviation forms a particular structural configuration. This relational representation is consistent with the broader view of urban rhythms as temporally organized patterns in which different aspects of activity are interconnected rather than isolated temporal features [5,9,10,21].
The resulting structural decomposition may vary depending on the selected Structural Equilibrium. Even for the same temporal dynamics, the reference-relative deviation can differ depending on which Structural Equilibrium is established as the reference state. This difference can lead to different structural expressions of Concentration and Dispersion and to corresponding changes in their Relative Balance. Consequently, the same temporal activity within an urban dynamic system can produce different structural representations when different Structural Equilibria are applied.
Thus, the CDR representation does not describe the temporal dynamics of an urban dynamic system simply as changes in activity magnitude. Instead, it expresses temporal variation as a relational structure formed relative to a specific Structural Equilibrium. How these structural states are connected over time is addressed in the following section in terms of structural sequences.
The formal definition and mathematical operationalization of the CDR structural representation, including the calculation of Relative Balance, are provided in the Appendix A, and Figure 2 summarizes these multiple structural perspectives.
Figure 2.
Structural Equilibrium and Concentration–Dispersion Decomposition under Alternative Structural Equilibria. Panels show the same activity curve under three different reference lines; the axis labels A and B denote the arbitrary start and end points of the interval shown.
2.2. From Structural States to Temporal Sequences
Concentration, Dispersion, and Relative Balance are not independent temporal features, but interrelated components of a single CDR structural state that emerges as urban activities change over time within a dynamic system. Accordingly, a structural state is not interpreted independently at a particular point in time. Rather, it is connected to other states over time to form a structural sequence [20,22].
From this perspective, the temporal behavior of an urban dynamic system can be represented not as a collection of individual activity levels, but as a sequence of structural states connected over time. The structural representation of urban activity at each time point is expressed as follows.
- : Normalized concentration value at time t (0 ≤ ≤ 1);
- : Normalized dispersion value at time t (0 ≤ ≤ 1);
- : Relative Balance ratio computed from the relationship between and at time t (0 ≤ ≤ 1).
The three components do not represent independent temporal features. Rather, they jointly describe a single structural configuration derived from the same reference-relative temporal deviation. Accordingly, the CDR representation does not simply list activity levels at each time point; it represents how urban activity changes through different structural states over time. While conventional time-series representations directly describe activity levels and their temporal changes, the CDR representation captures how these changes are organized as a sequence of structural states. This enables the temporal behavior of urban dynamic systems to be analyzed in terms of structural states and transitions between them [20,22,23].
Structural Equilibrium is thus not assumed to be a universally unique reference. Rather, multiple Structural Equilibria may be used to interpret the same urban dynamic system from different structural perspectives. The following section examines how these alternative Structural Equilibria produce differences in the structural decomposition and sequence of the same temporal dynamics, as illustrated in Figure 3.
Figure 3.
Structural Equilibrium shifts in urban rhythm. The dotted line marks the Structural Equilibrium; when it shifts between regimes (arrow), the same activity converts into a different Concentration/Dispersion split.
3. Methodology
3.1. Structural Equilibrium Is Not Unique
As described above, the temporal activity of the same urban dynamic system can be decomposed into and interpreted as different structural states depending on which Structural Equilibrium is defined as the reference state [3]. Therefore, it is difficult to fix a single Structural Equilibrium as an absolute criterion for interpreting the structure of an urban dynamic system [2].
This implies that the structural characteristics considered important in urban dynamic systems may vary depending on the system under analysis and the purpose of analysis. For example, in mobility- and flow-oriented urban activities, the continuity and temporal consistency of recurring state transitions may represent important structural characteristics. In contrast, for commercial activities characterized by diverse temporal variations and complex activity patterns, distinguishing among diverse structural states and fine-grained structural variations may be more important.
Structural Equilibrium is not an absolute value or universal criterion that can be applied uniformly across all urban dynamic systems, but an analytical criterion that can be defined according to which structural characteristics of urban activity are considered important.
In this study, to examine such differences, two representative Structural Equilibria are designed by applying different structural principles to the temporal activity of the same urban dynamic system. This allows us to compare how different equilibria structure and interpret the same temporal dynamics in different ways.
3.2. Information- and Stability-Oriented Equilibria
Urban dynamic systems maintain recurring temporal regularities over time while continuously generating diverse structural changes in response to changes in the external environment and urban activities [24]. In other words, urban dynamic systems can simultaneously exhibit structures maintained through repetition and diverse structures generated through processes of change.
Based on this characteristic, this study establishes two representative approaches for defining Structural Equilibrium. One is the Information-oriented Equilibrium (), which seeks to distinguish and represent diverse structural states and changes emerging in urban activities as much as possible, while the other is the Stability-oriented Equilibrium (), which emphasizes the temporal consistency of recurring structural organization. Although both equilibria are applied to the temporal activity of the same urban dynamic system, they differ in their purposes and in the structural characteristics they emphasize when defining the Structural Equilibrium.
3.2.1. Information-Oriented Equilibrium ()
The Information-oriented Equilibrium refers to a reference state that preserves, as much as possible, information on structural diversity and change within an urban dynamic system. Here, information does not simply refer to the amount of information, but to the extent to which diverse structural states and state transitions emerging in urban activities can be distinguished and represented. This perspective is related to the view that information can be understood through the distinguishability of possible states [25].
In this approach, the Structural Equilibrium is selected to enable clearer differentiation of the various states and transitions embedded in the temporal variation of urban activity.
The purpose of this criterion is to capture, as fully as possible, the diverse structural states and fine-grained structural variations embedded in the same temporal dynamics. Accordingly, the Information-oriented Equilibrium focuses on revealing the various changes and detailed structural differences that emerge in urban rhythms.
3.2.2. Stability-Oriented Equilibrium ()
The Stability-oriented Equilibrium is defined based on how consistently recurring structural organization in an urban dynamic system is maintained over time. Here, stability does not refer to a state in which change is absent, but rather to the extent to which a particular structural organization is repeatedly maintained despite continuous temporal variation [26,27].
Its objective is to maximize temporal consistency.
This criterion focuses on identifying structures that are continuously maintained in urban rhythms characterized by periodicity and stable patterns.
Intuitively, can be understood as a sensitive reference that closely tracks the fine-grained variations occurring within each week, prioritizing the ability to distinguish subtle structural changes. , by contrast, can be understood as a conservative reference that resists being pulled by short-term fluctuations, prioritizing continuity with the structural organization established in the preceding period. Consequently, on days when activity deviates sharply from the recent pattern, tends to treat the deviation as a genuine shift in structure, while tends to treat it as a temporary fluctuation around an otherwise stable baseline. This divergence in interpretation is precisely what the Gap measure is designed to capture.
This does not mean that one equilibrium is more accurate or that another equilibrium is incorrect.
Rather, the two Structural Equilibria emphasize different structural characteristics within the same temporal dynamics. emphasizes structural diversity and fine-grained structural variation, whereas emphasizes structural organization maintained through recurrence and temporal consistency.
Therefore, selecting a Structural Equilibrium is not simply a process of calculating or setting a reference value. Rather, it is an analytical design process that determines what structural information is extracted from the temporal activity of the same urban dynamic system and which structural characteristics are emphasized when interpreting its temporal behavior. The methodological definitions established in this section (, , and the resulting CDR representation) are evaluated empirically in Section 5 and Section 6, with dedicated robustness, benchmark, and sensitivity analyses presented separately in Section 6.
4. Experimental Design and Data
4.1. Comparative Experimental Design
This experiment was designed to compare how differences in the reference state influence the structural decomposition and interpretation of temporal dynamics by applying different Structural Equilibria to the same urban activity data. Specifically, the Information-oriented Equilibrium () and the Stability-oriented Equilibrium () were applied separately to the same dataset under identical temporal conditions, and the resulting CDR structural representations were compared.
The primary objective of the comparison is not to determine which Structural Equilibrium is more appropriate for a particular dataset. Rather, it is to identify which structural characteristics are emphasized or represented differently when different structural principles are applied to the same temporal dynamics. Accordingly, the results obtained from the two equilibria are compared as representations of the same urban activity from different structural perspectives.
The experiment was therefore organized around three key aspects. First, it examines whether different Structural Equilibria generate distinct CDR structures from the same urban activity data. Second, it analyzes what structural information the differences between the equilibria provide for explaining temporal changes in urban rhythms. Third, it compares the relationships among the structural representations derived from the different Structural Equilibria to explore latent structural characteristics that do not appear directly in the observed temporal information.
Through this comparison, the experiment evaluates how the Structural Equilibrium influences the structural interpretation of the temporal behavior of the same urban dynamic system, beyond merely determining a reference value.
4.2. Data Selection
In this experiment, two urban activity datasets with different temporal characteristics were selected to compare how the choice of Structural Equilibrium affects the structural interpretation of different urban dynamic systems. The purpose of selecting these datasets was not to determine which Structural Equilibrium is more suitable for a particular type of data, but rather to compare the structural representations generated by the same structural principles when applied to urban activities with different temporal organizations.
4.2.1. Jeju Airport Energy Consumption Dataset
The first dataset consists of electricity consumption data from Jeju International Airport, representing an energy-based urban activity [28]. Although airport electricity consumption exhibits recurring temporal patterns, it can also vary over time under the influence of external factors such as weather conditions, economic changes, and the broader socioeconomic environment [29]. Thus, this dataset captures both persistent temporal organization and the variations that emerge within it, making it suitable for analyzing urban activities characterized by recurring structures and temporal consistency.
4.2.2. Gangnam Station Mobility Flow Dataset
The second dataset consists of subway passenger flows at Gangnam Station in Seoul and represents mobility-based urban activity [30]. Mobility activity exhibits substantial temporal fluctuations and diverse activity transitions across different time periods [11]. Even in routine mobility processes, complex temporal structures emerge in relation to commuting patterns and differences between weekdays and weekends [11,12]. Therefore, this dataset captures not only recurring temporal organization but also diverse structural changes and state transitions, making it suitable for analyzing urban activity characterized by fine-grained structural variation.
For Gangnam Station, the raw activity variable represents the net inflow population, defined as the difference between alighting and boarding counts at the station (alighting minus boarding) for each hour. This signed measure captures the directional imbalance of passenger movement: positive values indicate a net inflow into the station area (e.g., during morning commuting hours, when alighting exceeds boarding), while negative values indicate a net outflow (e.g., during evening commuting hours, when boarding exceeds alighting). Unlike a simple passenger count, this measure can take negative values by construction. In contrast, the Jeju Airport electricity consumption variable is a non-negative physical quantity (kWh) with no such directional structure.
4.3. Periodic Organization of Urban Rhythms
Before defining Structural Equilibrium, we first examined the temporal periodicity and recurring structures formed by urban rhythms in the two datasets. To this end, we compared the characteristics of recurring urban rhythms across daily, weekly, and monthly temporal scales using 365 days of electricity consumption data from Jeju Airport in 2023 and 365 days of mobility data from Gangnam Station in 2024 [5], the results of which are presented in Figure 4.
Figure 4.
Multi-scale urban rhythm patterns across different urban activities. Daily, weekly, and monthly patterns for both sites; weekday structure recurs clearly, while monthly variation reflects seasonal influences rather than a repeating cycle. The overall mean is used solely for visualization purposes. The Structural Equilibrium proposed in this study is defined separately and is introduced in the following methodology.
Figure 5A presents the Weekday Distance Matrix, which shows the distances between average urban rhythms for each day of the week [31]. In both datasets, the distances between the same weekdays were very small, whereas the distances between different weekdays were relatively large. In particular, the largest distances were observed between weekdays and weekends, indicating that weekday-based activity patterns are repeatedly maintained.
Figure 5.
Weekday Distance Matrix (A) and Hierarchical Clustering of Weekday Rhythm (B). (A) Pairwise distance between weekday rhythms; (B) resulting clustering, where Saturday-Sunday separate from weekdays at both sites. Pink denotes the weekend cluster (Saturday, Sunday); gray denotes the weekday cluster. This grouping directly reflects the distance matrix in Panel (A), where the Saturday–Sunday distance is substantially smaller than any other pair of days, indicating that weekend and weekday rhythms are structurally distinct.
Figure 5B shows the results of hierarchical clustering of weekday urban rhythms. In both Jeju Airport and Gangnam Station datasets, weekdays and weekends were clearly separated into different clusters. Within weekdays, Monday through Friday formed similar rhythm structures. This indicates that urban activity is not merely changing on a daily basis, but is organized around a repeating weekly structure.
In contrast, monthly patterns do not maintain a stable repetitive structure like weekly patterns, but instead exhibit long-term variations reflecting external factors such as seasonal changes, weather conditions, vacation periods, and socio-economic environments. Therefore, monthly variation is characterized more by trend-like changes influenced by exogenous factors rather than stable structural repetition.
These results indicate that the urban rhythms observed in the two datasets are not simply a collection of daily fluctuations but exhibit a temporal organization characterized by recurring patterns centered on weekly activity cycles. Therefore, rather than applying a single fixed reference across the entire observation period, it is more appropriate to establish the temporal basis of Structural Equilibrium by reflecting the observed weekly repetition [21].
Accordingly, this study establishes the 7-day temporal organization commonly observed across the two datasets as the temporal basis for designing Structural Equilibrium. Based on this temporal basis, we then define Information-oriented Equilibrium () and Stability-oriented Equilibrium () separately and apply them to the same urban activity data to compare the resulting structural representations.
5. Result
5.1. Structural Equilibria Across Urban Temporal Dynamics
As demonstrated in Section 4, both the electricity consumption data from Jeju Airport and the mobility data from Gangnam Station exhibit recurring temporal organization at the weekly scale. Accordingly, this study estimates Information-oriented Structural Equilibrium () and Stability-oriented Structural Equilibrium () separately using a common 7-day temporal basis established from the observed weekly repetition structure.
Figure 6 presents the estimated results of the two Structural Equilibria together with the raw time series for each dataset. Although and are derived using the same 7-day temporal basis and the same urban activity data, they produce different reference trajectories according to the structural characteristics they emphasize.
Figure 6.
365-day trajectories of the raw data, and Grey: raw data; colored lines: the two weekly Structural Equilibria.
The Gangnam Station mobility data exhibit substantial intraday temporal variation, together with recurring temporal patterns centered on commuting periods and differences between weekdays and weekends. Within this recurring structure, epresents a more stable reference structure that preserves the temporal consistency of the weekly organization, whereas responds more sensitively to temporal variations occurring within the recurring structure and captures more fine-grained changes.
The electricity consumption data from Jeju Airport exhibit relatively gradual temporal variation, while their weekly patterns change over time under the influence of factors such as weather conditions, tourism demand, and seasonal changes. In this case, forms a reference structure that reflects the repeatedly maintained weekly organization, whereas more sensitively reflects structural changes occurring within that recurring structure.
These results indicate that the two Structural Equilibria do not simply provide different numerical references. Rather, they represent the same temporal activity from different structural perspectives. emphasizes structural variation and distinguishability, whereas emphasizes repeatedly maintained structural organization and temporal consistency.
Furthermore, because these differences consistently emerge across the two datasets with distinct activity characteristics, the distinction between the two Structural Equilibria can be understood not as a phenomenon specific to a particular type of urban activity, but as reflecting different principles for structuring and interpreting temporal dynamics.
5.2. Structural Decomposition Under Different Equilibria
Information-oriented Structural Equilibrium () and Stability-oriented Structural Equilibrium () were separately applied to the same urban activity data to generate the corresponding CDR structural representations. Figure 7 presents the CDR trajectories generated by the two equilibria and their temporal changes.
Figure 7.
CDR composition trajectory and CDR time-series comparison. (A) Ternary composition by equilibrium (vertex proximity = dominance; high-Gap days circled) and (B) Corresponding C, D, R time series, with divergence period boxed. The triangular CDR frame is a conceptual representation, not an absolute coordinate system. Each point’s position reflects the relative dominance of Concentration, Dispersion, and Relative Balance for that day, via barycentric projection of their normalized shares; proximity to a vertex indicates that component’s dominance, while a central position indicates balance. Unlike a conventional ternary plot, Concentration and Dispersion are independently normalized beforehand, so position reflects relative dominance within the dataset rather than absolute proportion. Trajectory movement toward a vertex indicates that component’s growing dominance over time.
For the Jeju Airport electricity consumption data, the two equilibria generally produce similar recurring structural patterns, but differences are observed in the timing and duration of Concentration, Dispersion, and Relative Balance states. This indicates that, as changes in external conditions affect recurring temporal organization, the same temporal activity can be decomposed into different structural states depending on the reference state used.
For the Gangnam Station mobility data, the two equilibria exhibit relatively similar recurring structural patterns over a substantial portion of the observation period. However, during specific periods, particularly between days 250 and 300, a clear divergence emerges in how () and () represent the same urban activity as different CDR structures. During this period, the Information-oriented Equilibrium captures more fine-grained structural variations embedded in activity changes, whereas the Stability-oriented Equilibrium forms a more stable structural representation that reflects the recurring weekly organization.
5.3. Structural Divergence Across Structural Equilibria
Section 5.2 demonstrated that the same urban activity dynamics can be represented as different CDR structures when different Structural Equilibria are used as reference states. Because and emphasize different structural principles—structural variation and recurring structural consistency, respectively—the differences between their results indicate that the same urban dynamics can be configured differently from different structural perspectives.
Accordingly, this section examines the structural divergence between the CDR representations generated by the two Structural Equilibria. Gap is defined as the Euclidean distance between their normalized CDR representations:
Specifically, Gap is computed from the independently min–max normalized C and D components together with R, which is bounded between 0 and 1 by construction:
where and denote independently min-max normalized values of C and D across the observation period. A small Gap indicates similar structural representations under the two reference principles, whereas a large Gap indicates greater structural divergence and stronger sensitivity to the selected Structural Equilibrium.
Figure 8 presents the CDR representations generated by the two Structural Equilibria, their Gap, and raw activity over time at Gangnam Station. The two CDR trajectories overlap across much of the observation period but separate during specific episodes accompanied by increased Gap, indicating that structural divergence is concentrated in particular temporal states.
Figure 8.
Temporal variation in CDR structures and structural divergence under the two Structural Equilibria. Parallel-coordinates linking Day, C, D, R, Gap, and Raw activity; labeled lines trace the five highest-Gap days across all axes.
However, the magnitude of Gap alone cannot explain how the two structural interpretations differ. The same level of Gap may arise from different forms of structural divergence depending on the differences in Concentration, Dispersion, and the Relative Balance between them, represented by R. Therefore, the differences in each CDR component were analyzed as follows:
ΔC and ΔD indicate the extent to which the two Structural Equilibria differently configure the Concentration and Dispersion components, respectively, for the same urban dynamics. In contrast, ΔR does not represent a difference in an independent temporal phenomenon. Because R represents the Relative Balance between Concentration and Dispersion, ΔR indicates the extent to which the two Structural Equilibria differently configure the C–D relationship.
The component-level differences for representative high-Gap observations are presented in Table 1. The results show that high-Gap observations are primarily characterized by substantial differences in both C and D, whereas differences in R are comparatively small. For example, on 19 September 2024, ∣ΔC∣ = 0.2517 and ∣ΔD∣ = 0.2957, while ∣ΔR∣ = 0.0013. Similarly, on 20 September, ∣ΔC∣ = 0.2344 and ∣ΔD∣ = 0.2763, whereas ∣ΔR∣ = 0.0017. These results indicate that structural divergence between the two Structural Equilibria primarily arises from differences in the magnitudes of C and D, while the relative relationship between them changes comparatively little.
Table 1.
Component-level differences in high-Gap observations between the Structural Equilibria.
The direction of divergence also varied across observations. Both C and D were higher under one Structural Equilibrium on 19 and 20 September, whereas they were lower under the same equilibrium on 17, 22, and 30 September (Table 1). Thus, neither Structural Equilibrium consistently produced higher or lower structural values. Rather, the direction of divergence varied according to the temporal state.
Gangnam Station provides several examples of how these high-Gap states correspond to observable social conditions. Among the representative high-Gap observations, three dates corresponded to the 2024 Chuseok holiday period (16–18 September) or its immediate aftermath. 17 September was Chuseok Day, September 19 was the first working day after the holiday period, and 22 September was the Sunday following the holiday. These dates were identified by Gap without providing the method with any information about the holiday calendar (Table 2). This indicates that Gap did not directly detect a predefined social event, but that structurally irregular periods associated with social activity changes could be identified from mobility dynamics alone.
Table 2.
High-Gap observations at Gangnam Station and their correspondence with the 2024 public holiday calendar.
At Jeju Airport, two of the representative high-Gap observations corresponded to identifiable external events. 2 October 2023 was a government-designated temporary public holiday between Chuseok and National Foundation Day, while 18 December was associated with a cold wave and heavy snowfall that caused flight delays and cancellations and road-traffic restrictions across Jeju Island (Table 3). A residual effect of the snowfall was also observed on 19 December. In contrast, May 31 showed no identifiable calendar or weather correspondence, and its raw electricity consumption ranked only 129th among 365 days by daily mean. Nevertheless, it was identified as one of the most structurally divergent observations of the year.
Table 3.
High-Gap observations at Jeju Airport and their correspondence with calendar and weather records.
These observations indicate that Gap is not simply a measure of high activity magnitude. Rather, it can identify structural changes both when identifiable external events are present and when no corresponding event or unusually high raw activity is evident. In this sense, Gap captures changes in how urban activity is configured relative to the two Structural Equilibria rather than changes in activity magnitude alone.
Taken together, the high-Gap observations include (1) structural changes corresponding to identifiable social or physical events, (2) structural changes for which no direct external correspondence was identified, and (3) changes that cannot be readily explained by the magnitude of raw activity alone. The direction of divergence also varied across temporal states, while differences in C and D provided the primary contribution to Gap and changes in R remained comparatively small. Therefore, Gap is better interpreted not as a detector of specific events or increases in activity magnitude, but as an indicator of specific structural states in which different Structural Equilibria configure the same urban dynamics differently.
The stability and generalizability of these findings are examined in Section 6 through independent follow-up-year validation, benchmark comparison, and additional sensitivity analyses. These analyses assess whether the structural divergence remains consistent across independently observed years and under alternative analytical conditions.
6. Valdiation
This section validates Section 5’s findings using an additional year of data at each site (Jeju Airport, 2024; Gangnam Station, 2025). Section 6.1 tests if high-Gap observations remain statistically extreme out-of-sample and whether frozen equilibria retain discriminative power. Section 6.2 evaluates baseline replication on follow-up years, and Section 6.3 tests sensitivity to temporal design choices like weekly periodicity stability.
6.1. Cross-Year Validation
At Jeju Airport, all top-5 Gap observations from 2023 exceeded the 99th percentile of the independently observed 2024 Gap distribution (empirical p < 0.015 for all five; p = 0.000 for 2 October 2023). At Gangnam Station, all top-5 Gap observations from 2024 exceeded the 95th percentile of the 2025 distribution (p < 0.03), and all top-5 observations from 2025 exceeded the 99th percentile of the 2024 distribution (p = 0.000 for all five), coinciding precisely with the 2025 Seollal holiday (28–30 January) and Chuseok holiday (6 October) (Figure 9). These results indicate that the identified high-Gap observations are not artifacts of within-sample ranking, but represent structural divergences that remain extreme when evaluated against an independently observed reference period at the same site. As a further test of whether the framework supports genuinely adaptive monitoring rather than retrospective interpretation, the equilibria estimated from the original year were frozen (without re-estimation) and applied directly to the independently observed follow-up year. At Jeju Airport, the frozen 2023 equilibria applied to 2024 data flagged 10 February 2024 (within the 2024 Seollal holiday period) and 14 December 2024—a date corresponding to a major, unannounced national political event—among the highest-Gap days of the year. At Gangnam Station, the frozen 2024 equilibria applied to 2025 data flagged multiple high-Gap days coinciding with Seoul’s documented 2025 heatwave periods (7–12 July and 23–31 July). These findings demonstrate that the proposed equilibria retain meaningful discriminative capacity when applied without re-estimation to unseen periods.
Figure 9.
Cross-year Gap distribution comparison with 95th/99th percentile thresholds (evaluated against an independently observed refer-ence year) and raw-magnitude percentile bars (Jeju 2023 vs. 2024; Gangnam 2024 vs. 2025).
6.2. Benchmark Comparison
To evaluate whether the detected high-Gap observations are uniquely identifiable by the proposed structural representation or are also identifiable by standard methods, three conventional baselines were implemented and compared against Gap using an independently constructed ground truth comprising major national holiday periods and confirmed severe-weather advisories, defined without reference to Gap’s outputs: (1) change-point detection via binary segmentation with a sum-of-squared-errors cost function, (2) seasonal residual analysis, and (3) a weekday-matched anomaly z-score. For each method, the top-10 flagged days were compared against the ground-truth event set using precision, recall, and false-positive rate (FPR) (Table 4).
Table 4.
Precision, recall, and false-positive rate (FPR) for Gap versus three baseline methods.
At Jeju Airport 2024, Gangnam Station 2024, and Gangnam Station 2025, Gap achieved the highest precision and recall among all four methods (Jeju 2024: 0.40/0.33; Gangnam 2024: 0.50/0.71; Gangnam 2025: 0.80/0.73), while the three baselines remained substantially lower at each of these site-years. At Jeju Airport 2023, however, Gap performed comparably to, but not better than, the strongest baselines: seasonal residual analysis and weekday z-score both reached precision 0.50 and recall 0.33, slightly exceeding Gap’s precision of 0.40 and recall of 0.27. This pattern was consistent across two independently constructed ground-truth definitions of differing scope (Appendix A), suggesting that Gap’s advantage over conventional baselines, while evident at three of the four site-years, is not universal and may be domain- or year-specific rather than a general property of the method.
To investigate this exception further, the raw-magnitude characteristics of the ground-truth events were examined. Calendar holidays (Seollal, Chuseok) consistently ranked low in Gap across both years despite real magnitude shifts (7–24% below average in 2023; 4–12% below average in 2024), whereas weather events varied substantially in structural impact: Typhoon Khanun (2023) left the daily structural pattern largely unchanged (ranking 284th–351st of 365 days) despite a large magnitude shift (26–40% above average), while the 2024 heavy-rain event and Typhoon Kong-rey both coincided with sharp structural divergence (ranking within the top 11).
Separately, the baselines’ complete failure at Jeju Airport 2024 (0% precision and recall for all three baselines) was traced to a crowding-out effect: despite comparable overall data variability between years (coefficient of variation: 19.7% in both), several days with no identified external cause at Jeju Airport 2024 exhibited magnitude deviations (mean 30.1%, up to 65.3%) substantially larger than the documented calendar and weather events themselves (mean 15.9%), displacing the true ground-truth events from the magnitude-based baselines’ top-10 rankings. Gap’s comparable performance across both years (precision 0.40 in both; recall 0.27 vs. 0.33) suggests that its structural definition is less susceptible to this crowding-out effect than raw-magnitude-based detection (Figure 10).
Figure 10.
Precision, recall, and false-positive rate for Gap versus three baseline methods (change-point detection, seasonal residual analysis, weekday z-score), replicated independently across two years at Jeju Airport (2023, 2024) and Gangnam Station (2024, 2025).
The absolute top-10 Gap thresholds differed between years (Gangnam: 0.32 in 2024 vs. 0.54 in 2025, a 67% relative difference; Jeju: 0.82 in 2023 vs. 0.76 in 2024, a 7% relative difference), reflecting differences in each year’s overall Gap distribution scale (Figure 11, left). Under the independently constructed ground truth, precision and recall remained closely consistent between years at Jeju Airport (Δ ≤ 0.06) and Gangnam Station recall (Δ = 0.02), with a larger but still non-significant difference in Gangnam Station precision (0.50 in 2024 vs. 0.80 in 2025, Δ = 0.30). Fisher’s exact tests found no statistically significant difference at either site (Jeju: precision p = 1.00, recall p = 1.00; Gangnam: precision p = 0.35, recall p = 1.00; Figure 11, right), indicating that detection performance under the independent ground truth—including the Jeju 2023 result in which Gap did not exceed the strongest baselines—is not an artifact of the originally studied year.
Figure 11.
(Left) Full-year Gap distributions across all four site-years, overlaid with each year’s top-10 detection threshold. (Right) Preci-sion/recall consistency between the original (hollow markers) and follow-up (filled markers) year at each site, with Fisher’s exact test p-values.
6.3. Temporal Basis Sensitivity
To examine the extent to which the study’s conclusions depend on the choice of a 7-day temporal basis (motivated by the periodicity analysis in Section 4.3), two complementary sensitivity analyses were conducted. First, the moving-block bootstrap [32] was re-run using alternative block lengths (5, 10, and 14 days). The resulting 95th- and 99th-percentile thresh-old estimates and their bootstrap confidence intervals remained overlapping and stable across all tested block lengths. Second, the equilibria themselves were re-estimated using alternative re-estimation windows (14 and 30 days) not sup-ported by the periodicity structure identified in Section 4.3.
This block-length stability was compared against three conventional baselines’ sensitivity to their own tuning parameters, aggregated across all four site-years (original and follow-up year at each site): Gap’s top-10 stability remained at 100% with no variance, whereas change-point detection averaged only 27% (range 7–50%) and seasonal residual analysis averaged 78% (range 67–87%); the weekday z-score baseline was excluded from this comparison as it has no tunable parameter (Figure 12).
Figure 12.
Parameter sensitivity comparison: mean top-10 stability across each method’s own tuning parameters (Gap: bootstrap block length; change-point detection; seasonal residual analysis), with individual site-year values shown as markers (fill color = site, connected by dotted lines) across Jeju Airport (2023, 2024) and Gangnam Station (2024, 2025).
Figure 13 illustrates the impact of alternative temporal windows (14 and 30 days) on the identified high-Gap observations. The resulting high-Gap observations under alternative windows (14 and 30 days) showed 0% overlap with those obtained under the 7-day basis at both sites, indicating that the method’s conclusions are anchored to the empirically con-firmed weekly rhythm rather than being an arbitrary or freely tunable parameter. This check was repeated using the frozen-equilibrium methodology of Section 6.1: equilibria trained on the original year at each window were frozen and applied without re-estimation to the follow-up year. The frozen 7-day-basis top-5 dates again showed 0% exact overlap with those from the 14-day and 30-day windows at both sites; however, this reflected a graded rather than binary degradation—individual dates typically retained moderate-to-high percentile rank under the alternative windows (pre-dominantly 65–87% at Jeju Airport; more variable at Gangnam Station, 14–78%), and the full-series Gap correlation be-tween windows remained consistently positive (r = 0.41–0.61).
Figure 13.
Percentile rank of the frozen 7-day-basis top-5 dates under alternative frozen windows (14-day, 30-day; equilibria trained on the original year, applied without re-estimation to the follow-up year), at Jeju Airport (2023 → 2024) and Gangnam Station (2024 → 2025). Individual points show each date’s percentile rank; the short horizontal line at each window marks the mean percentile rank across the five dates; the dashed grey line at 80% marks the top-quintile reference threshold.
A supplementary check using the newly obtained follow-up year at each site further examined whether this weekly periodicity remains stable across years. At Gangnam Station, the weekday–weekend distinction remained essentially unchanged (ratio of cross- to within-weekday distance: 7.93 in 2024 vs. 8.51 in 2025). At Jeju Airport, this distinction weakened somewhat in the newer year (2.13 in 2023 vs. 1.33 in 2024); this attenuation was concentrated in the late-night and early-morning hours (00:00–02:00), where the divergence between average Saturday and Sunday profiles increased from 223.3 to 283.1 (Euclidean distance), while daytime hours showed comparable Saturday–Sunday differences across both years—suggesting increased variability in late-night operational or leisure-related activity rather than a general breakdown of the site’s weekly rhythm. This localized finding illustrates a concrete instance in which part of the framework’s underlying periodicity assumption can weaken, and underscores the value of periodically re-validating this assumption in operational deployments.
In addition, to assess the sensitivity of Gap to its Relative Balance component (R), we compared Gap computed with and without R. At Gangnam Station, the two versions were nearly identical (r = 0.9999; the top-5 and top-10 sets fully overlapped), indicating that R contributes negligibly at this site. In contrast, the two versions diverged substantially at Jeju Airport (r = 0.69; 0/5 overlap in the top-5 observations), revealing an asymmetry between the two sites. This asymmetry reflects a structural difference in how each signal deviates from its reference within a day, rather than a difference in the strength of their underlying weekly periodicity. As shown above, both sites exhibit comparable weekday–weekend regularity; however, across all 364 days at Jeju Airport, daily directional purity—the proportion of hours deviating from the weekly reference profile in the same direction—averaged 0.76, with 5.2% of days showing completely one-sided deviations. Directional purity was also strongly correlated with the extremity of R (r = 0.60). At Gangnam Station, by contrast, daily purity averaged only 0.61, no days exhibited completely one-sided deviations, and its correlation with R extremity was negligible (r = −0.03). This pattern is consistent with the regular reversal of net inflow between the morning and evening commuting periods at Gangnam Station. These results further reveal a domain-specific asymmetry: at Gangnam Station, divergence is expressed primarily through differences in the magnitude of Concentration and Dispersion, whereas at Jeju Airport, differences in the directional structure of Relative Balance play a more substantial role.
7. Discussion
7.1. Reference Dependence in Structural Interpretation
The results of this study demonstrate that the structural representation of an urban dynamic system can vary not only according to the observed activity dynamics but also according to the structural principles used to organize and interpret them. The fact that applying different Structural Equilibria to the same activity data generated different CDR representations indicates that a single dynamic system does not necessarily need to have one fixed structural representation [24,26,33].
The Information-oriented Equilibrium and the Stability-oriented Equilibrium provide complementary interpretations of the same temporal dynamics. The former emphasizes structural changes and differentiation emerging from activity dynamics, whereas the latter emphasizes repeatedly maintained organization and temporal consistency. Therefore, rather than regarding either Equilibrium as a universally superior reference, each should be understood as a reference for examining different structural characteristics of the same system.
From this perspective, Structural Equilibrium can be understood not simply as a normalization criterion or fixed baseline, but as a reference for constructing and interpreting particular structural characteristics from observed dynamics [1,24,33].
In addition, the differences between the two Structural Equilibria can be interpreted not as simple numerical discrepancies or analytical errors, but as reference dependence, indicating the extent to which structural interpretation varies according to the selected reference principle. In this study, these differences were primarily expressed as differences in the magnitudes of Concentration and Dispersion, while the Relative Balance between the two components remained comparatively stable. Accordingly, Gap and its component-level decomposition can be used to identify structural characteristics that may not be sufficiently revealed by a single structural representation [26,27,34].
This reference-dependent perspective also distinguishes Structural Equilibrium from conventional anomaly detection and change-point approaches. Whereas conventional methods primarily identify unusual activity magnitudes, residual deviations, or temporal change points [35], Structural Equilibrium examines how the same activity dynamics are configured differently under alternative structural principles. Gap therefore captures divergence in structural interpretation rather than activity magnitude or change-point occurrence alone. The benchmark comparison in Section 6.2 indicates that this additional structural perspective can provide useful information for identifying unusual temporal states beyond that captured by conventional methods.
At the same time, structural interpretation, anomaly detection, and the explanation of external events should be distinguished. Structural interpretation, that is, the generation of different representations of the same dynamics by the two Structural Equilibria, follows directly from the definitions of CDR and Gap. Anomaly detection, that is, whether high Gap represents unusually large structural divergence beyond ordinary within-sample variation, was examined through validation using an independently observed follow-up year and comparison with conventional anomaly detection methods (Section 6). In addition, the correspondence with external events may have different interpretive implications depending on the data domain. At Gangnam Station, social schedules such as public holidays are likely to have a direct influence on mobility activity, whereas electricity consumption at Jeju Airport may be jointly influenced by weather conditions, operational circumstances, and other factors. Therefore, the meaning of the event correspondences identified in this study should be interpreted in consideration of the characteristics of activity in each domain, and they do not constitute causal evidence that a specific external event caused a high Gap and should not be generalized as a causal relationship.
7.2. Scope and Limitations of the Structural Approach
However, the approach proposed in this study should not be regarded as a universal methodology that can be applied in the same form to all temporal data or dynamic systems. This study examined the approach using urban activity data with recurring temporal organization and constructed the analysis around a 7-day temporal cycle. When recurring patterns are largely absent or dynamics change in a highly irregular manner, defining Structural Equilibria and interpreting their differences may be more difficult [5,6].
Given the characteristics of the data, the findings of this study should primarily be interpreted within the scope of recurring or patterned dynamic systems. In addition, this study examined only two structural principles: the Information-oriented Equilibrium and the Stability-oriented Equilibrium. For different temporal scales and more complex system configurations, including seasonal dynamics, irregular regime shifts, non-periodic dynamics, and spatially coupled dynamics, the definition of Structural Equilibrium and the comparison of structural sequences may need to be modified.
Finally, the differences observed between the two datasets should be interpreted as exploratory findings rather than as evidence of a general domain effect. This is because the two datasets differ not only in activity domain but also in signal type. Subway passenger flow is a relatively direct behavioral signal, whereas airport electricity consumption is an indirect infrastructural signal that supports, rather than directly records, human activity. Therefore, the current data cannot distinguish between the effects of activity domain and signal type. Future studies using direct and indirect signals within the same domain may help distinguish these effects.
Despite these limitations, the results of this study suggest that Structural Equilibrium can support calendar-independent monitoring based on the internal organization of temporal activity. Rather than replacing operational calendars or external contextual information, it provides an additional detection layer for identifying periods in which the structural interpretation of activity becomes unusually sensitive to the selected structural principle. This approach may be particularly useful for identifying irregularities whose causes are not yet known or are not documented in available records.
This characteristic is further underscored by the fact that external information was not provided in advance during the analytical process. Calendar and weather information were not used as inputs to the method at any stage of estimation, and the event correspondences reported in Section 5 were interpreted post hoc by comparing them with external records after structural divergence had been computed solely from the activity data. However, the unusualness and detection performance of high-Gap observations were not assessed on the basis of these post hoc event correspondences. Section 6 separately examined the stability and generalizability of high-Gap observations using an independently observed follow-up year, benchmark comparison with conventional anomaly detection methods, and alternative analytical conditions. Moreover, not all high-Gap observations corresponded to an identifiable external event, and for some observations, no clear cause could be identified even through external records. Rather than being treated simply as false positives, these observations can be interpreted as candidate signals of internal structural changes whose specific causes have not yet been determined. This illustrates that calendar-independent structural monitoring can surface irregularities whose origins have not yet been established, rather than merely reproducing already-documented external events.
7.3. Domain Differences in Structural Divergence and Implications for Operational Dynamic Systems
The patterns of correspondence between high-Gap observations and external events differed between the two datasets. At Gangnam Station, structural divergence was concentrated around a socially defined event, the Chuseok holiday, whereas at Jeju Airport, structural divergence corresponded to a government-designated temporary public holiday and a physical weather disturbance, while no identifiable external cause was found for some observations. These differences may be related to the characteristics of the activity signals represented by the two datasets. Subway passenger flow is a direct behavioral signal that aggregates individual decisions about whether to travel, and the activities of many people may change relatively abruptly in response to a shared social schedule. In contrast, airport electricity consumption is a continuous physical quantity shaped by heating and cooling, lighting, operational loads, and other factors, and is influenced not only by social schedules but also by weather conditions and operational circumstances. Thus, even when the same Structural Equilibria are applied, the structural divergence between the two Equilibria may differ according to the characteristics of changes in the underlying activity.
However, the current data are limited in their ability to interpret these differences as a general domain effect. The two datasets differ not only in activity domain but also in signal type. Passenger flow at Gangnam Station directly represents human behavior, whereas electricity consumption at Jeju Airport is an indirect signal of infrastructure that supports rather than directly records human activity. Therefore, the current two datasets cannot distinguish whether the observed structural differences arise from differences in activity domain or from differences between direct behavioral and indirect infrastructural signals. To clarify these differences, direct behavioral and indirect infrastructural signals should be analyzed within the same domain; for example, comparing subway passenger flow and subway electricity consumption over the same period would provide one way to examine this issue.
From this perspective, the structural approach proposed in this study may also be applicable to other energy and mobility systems. For example, in electric vehicle mobility and vehicle-to-grid (V2G) capacity planning, feasible discharge capacity is related to recurring travel and charging patterns. The proposed approach could therefore be used to identify structural changes in EV travel or charging demand that may not be sufficiently captured by fixed planning schedules [36,37]. A similar possibility can be found in energy-harvesting-based sensing, where temporal patterns of harvested power may contain activity information that is not revealed by raw power magnitude alone; power fluctuations from RF energy harvesters provide an example [38,39,40]. Although these systems differ from the present study in scale and purpose, they are connected to the proposed approach in that structural changes formed by activity or system states over time can be interpreted separately from the absolute magnitude of the signal.
This potential for extension suggests that the applicability of Structural Equilibrium is not limited to specific activity domains or types of external events, but depends on how structural changes in temporally organized activity and infrastructural signals are interpreted. In particular, the ability to identify temporal states that may not be sufficiently explained by predefined schedules or the absolute magnitude of observed activity suggests that the approach may provide additional analytical information across a range of systems.
8. Conclusions
This study moves beyond the conventional view of urban rhythms as being represented by a single fixed structural representation and proposes an approach that considers how the structure of a dynamic system is constructed through different structural principles. To this end, the role of the reference point is extended beyond simple normalization or baseline setting to become an element that shapes structural interpretation, which is formalized in this study as the analytical concept of Structural Equilibrium.
In particular, this study demonstrates that not only structural interpretations themselves but also the divergence between different interpretations can be used as an analytical object for understanding a system. This extends the scope of analysis from defining the structure of a dynamic system as a single outcome to a systemic perspective that jointly examines the commonalities, differences, and relationships that emerge across different structural perspectives.
This approach also has implications for resilient and sustainability-oriented urban infrastructure operation. Without any calendar or event information being supplied to the method, the identified structural divergences showed post hoc correspondence with documented external conditions, including a public holiday period, a government-designated temporary holiday, and a severe weather event. These findings suggest the potential of adaptive monitoring that does not depend on manually maintained exception calendars. Unlike calendar-based rules, which cannot anticipate irregularly announced holidays or undocumented physical disruptions, structural divergence is computed directly from activity data and may support the identification of such periods, thereby contributing to more resilient and adaptive operation of urban infrastructure systems.
Funding
This research was supported by the KU Specialized Priority Research Project Support Program of Konkuk University.
Institutional Review Board Statement
Not applicable.
Informed Consent Statement
Not applicable.
Data Availability Statement
The data presented in this study are available on request from the corresponding author, as they are associated with ongoing follow-up research.
Conflicts of Interest
The author declares no conflicts of interest.
Appendix A
Appendix A.1
CDR is defined as a structural representation of temporal characteristics based on their deviation from a reference state. Rather than treating C, D, and R as independent temporal features, CDR represents the relational structure of a common reference-relative temporal deviation. The resulting CDR representation can be expressed as a structural vector, while its components retain the relational structure from which they are derived
Given a temporal deviation Δt, the deviation is first represented through two directional accumulations:
Thus, C and D represent two directional structural expressions derived from the same temporal deviation, rather than two independent characteristics. The relationship between these two accumulated components is then represented by R:
Accordingly, R does not represent a separate temporal phenomenon. Instead, it characterizes the relative balance between the two directional accumulations within the common deviation structure. The CDR representation can therefore be understood as a relational and hierarchical representation:
The resulting structural state may be represented as a CDR vector:
where the three elements jointly describe the structural configuration of the same reference-relative temporal deviation rather than constituting independent temporal features. Thus, CDR should be understood as a relational structural representation in which C and D capture directional deviations from a common reference state, while R characterizes their relative balance.
Appendix A.2
CDR representation converts raw urban time-series data into structural states based on deviations from an endogenous reference state. This study considers two structural principles: the Information-oriented Equilibrium () and the Stability-oriented Equilibrium (). Both equilibria are estimated on a weekly (7-day) basis and re-estimated sequentially across the observation period.
Let denote the mean 24 h activity profile of week w. For each week, a candidate equilibrium E is defined within the observed activity range, with each element bounded by [min(X),max(X)].
The Information-oriented Equilibrium is defined to preserve the information contained in the directional structure of deviations from the candidate reference. Information is operationalized through the entropy of the C–D deviation split: entropy is maximized when positive and negative deviations from E are balanced and minimized when one direction dominates. Thus, maximizing entropy favors a reference state that preserves the finest-grained distinguishability between the two directional components.
Accordingly, the Information-oriented Equilibrium is obtained for each week by solving
where denotes the normalized two-component distribution of positive and negative deviations of from E, and H(⋅) is the entropy of this C–D deviation split. MSE(, E) = ∑()2, Var(X) is the variance of the full observation period, and λ = 0.05 is a fixed regularization weight. The first term therefore favors an equilibrium that maximizes the distinguishability of the two directional deviation components, while the second term prevents the reference from departing excessively from the observed activity profile.
The Stability-oriented Equilibrium is obtained by solving
The first term measures fidelity to the current week’s activity profile, whereas the second term penalizes deviation from the preceding week’s equilibrium and thereby imposes temporal continuity. For the first week, the continuity term is omitted because no preceding equilibrium is available.
Both equilibria are bounded elementwise within [min(X),max(X)] and estimated using the L-BFGS-B optimization algorithm(implemented in SciPy 1.10, Python 3.11). The resulting equilibrium is held constant across all seven days of the corresponding week and is re-estimated sequentially for the following week.
For each daily observation , the reference-relative deviation is then calculated against the corresponding weekly equilibrium. Positive and negative deviations are accumulated to obtain the two directional components, and . These components are independently min–max normalized across the observation period:
The Relative Balance component is then calculated from the normalized components:
where ϵ is a small constant to avoid division by zero.
Each observation is represented as a structural state:
The same procedure is applied separately using and , thereby producing two CDR representations of the same temporal dynamics. Their structural divergence is then quantified using Gap, as defined in the main text.
References
- Li, X.; Wang, Q.; Tang, Y. The Impact of Artificial Intelligence Development on Urban Energy Efficiency—Based on the Perspective of Smart City Policy. Sustainability 2024, 16, 3200. [Google Scholar] [CrossRef] [Scilit]
- Batty, M. The New Science of Cities; MIT Press: Cambridge, MA, USA, 2013. [Google Scholar]
- Portugali, J. Complexity, Cognition and the City; Springer: Berlin/Heidelberg, Germany, 2011. [Google Scholar]
- Portugali, J. Complexity, coordination dynamics and the urban landscape. Buildings 2024, 14, 1327. [Google Scholar] [CrossRef] [Scilit]
- Schönfelder, S.; Axhausen, K.W. Urban Rhythms and Travel Behaviour: Spatial and Temporal Phenomena of Daily Travel; Routledge: Oxfordshire, UK, 2016. [Google Scholar]
- Du, H.; Zhan, W.; Liu, Z.; Wang, C.; Wang, S.; Li, L.; Li, J.; Bechtel, B.; Sismanidis, P. Weekly rhythms of urban heat islands: A multicity perspective. Sustain. Cities Soc. 2024, 106, 105385. [Google Scholar] [CrossRef] [Scilit]
- Zhou, Y.; Wang, H.; Chen, S.; Jiang, J.; Wang, Z.; Liu, W. Investigating Holiday Subway Travel Flows with Spatial Correlations Using Mobile Payment Data: A Case Study of Hangzhou. Sustainability 2025, 17, 5873. [Google Scholar] [CrossRef] [Scilit]
- Du, F.; Wang, J.; Mao, L.; Kang, J. Daily rhythm of urban space usage: Insights from the nexus of urban functions and human mobility. Humanit. Soc. Sci. Commun. 2024, 11, 49. [Google Scholar] [CrossRef] [Scilit]
- Gökçe Kılıç, P.; Terzi, F. Big Data, Mobility and Rhythms in Istanbul: A Data-Driven Analysis of Urban Temporal Dynamics. Appl. Spat. Anal. Policy 2025, 18, 144. [Google Scholar] [CrossRef] [Scilit]
- Güller, C.; Varol, C. Unveiling the daily rhythm of urban space: Exploring the influence of built environment on spatiotemporal mobility patterns. Appl. Geogr. 2024, 170, 103366. [Google Scholar] [CrossRef] [Scilit]
- Gonzalez, M.C.; Hidalgo, C.A.; Barabasi, A.L. Understanding individual human mobility patterns. Nature 2008, 453, 779–782. [Google Scholar] [CrossRef] [Scilit] [PubMed]
- Song, C.; Qu, Z.; Blumm, N.; Barabási, A.-L. Limits of predictability in human mobility. Science 2010, 327, 1018–1021. [Google Scholar] [CrossRef] [Scilit] [PubMed]
- Wang, P.; Feng, H.; Zhang, G.; Yu, D. A Period-Aware Hybrid Model Applied for Forecasting AQI Time Series. Sustainability 2020, 12, 4730. [Google Scholar] [CrossRef] [Scilit]
- Song, S.; Xia, T.; Jin, D.; Hui, P.; Li, Y. UrbanRhythm: Revealing urban dynamics hidden in mobility data. arXiv 2019, arXiv:1911.05493. [Google Scholar]
- Liu, Y.; Hu, Y.; Wang, D.; Cheng, Y.; Yan, L.; Wei, D.; Jiao, J. Decomposing urban spatial rhythms: A big-small data fusion framework for activity pattern identification. Cities 2026, 169, 106548. [Google Scholar] [CrossRef] [Scilit]
- Ou, J.; Li, J.; Zhang, W.; Yue, P.; Nie, Q. Understanding Congestion Evolution in Urban Traffic Systems Across Multiple Spatiotemporal Scales: A Causal Emergence Perspective. Systems 2025, 13, 732. [Google Scholar] [CrossRef] [Scilit]
- Yin, H.; Ren, M.; Zhou, T. Asymmetric bidirectional interaction of EVCS infrastructure and urban spatial structure within diurnal rhythms. Sustain. Cities Soc. 2026, 143, 107350. [Google Scholar] [CrossRef] [Scilit]
- Lyu, F.; Kiv, D.; Ma, X.; Wang, S. A Video Machine Learning Framework for Spatiotemporal Analysis of Complex Urban Dynamics. Trans. GIS 2025, 29, e70096. [Google Scholar] [CrossRef] [Scilit]
- Liu, Z.; Liu, H.; Lang, W.; Fang, S.; Chu, C.; He, F. Scaling law reveals unbalanced urban development in China. Sustain. Cities Soc. 2022, 87, 104157. [Google Scholar] [CrossRef] [Scilit]
- Wang, N.; Yi, J.; Liang, F.; Qian, J.; Tu, W.; Huang, S.; Luo, P.; Du, Y. Unravelling urban dynamics: Understanding urban structures in Chinese cities using large-scale human location data. Cities 2025, 164, 106096. [Google Scholar] [CrossRef] [Scilit]
- Lefebvre, H. Rhythmanalysis: Space, Time and Everyday Life; Bloomsbury Publishing: London, UK, 1992. [Google Scholar]
- Rabiner, L.R. A Tutorial on Hidden Markov Models and Selected Applications in Speech Recognition. Proc. IEEE 1989, 77, 257–286. [Google Scholar] [CrossRef] [Scilit] [PubMed]
- Bishop, C.M. Pattern Recognition and Machine Learning; Springer: Berlin/Heidelberg, Germany, 2006. [Google Scholar]
- Holland, J.H. Hidden Order: How Adaptation Builds Complexity; Addison-Wesley: Boston, MA, USA, 1995. [Google Scholar]
- Shannon, C.E. A mathematical theory of communication. Bell Syst. Tech. J. 1948, 27, 379–423. [Google Scholar] [CrossRef] [Scilit]
- Nicolis, G.; Prigogine, I. Self-Organization in Nonequilibrium Systems: From Dissipative Structures to Order Through Fluctuations; Wiley: Hoboken, NJ, USA, 1977. [Google Scholar]
- Strogatz, S.H. Nonlinear Dynamics and Chaos: With Applications to Physics, Biology, Chemistry, and Engineering; Westview Press: Boulder, CO, USA, 2015. [Google Scholar]
- Korea Airports Corporation. Jeju International Airport Hourly Electricity Consumption. Public Data Portal. Available online: https://www.data.go.kr/data/15144969/fileData.do (accessed on 15 March 2026).
- Gajowniczek, K.; Ząbkowski, T. Short-term electricity forecasting using individual smart meter data. Procedia Comput. Sci. 2014, 35, 589–597. [Google Scholar] [CrossRef] [Scilit]
- Seoul Metro. Station-Level Daily Hourly Boarding and Alighting Passenger Information. Public Data Portal. Available online: https://www.data.go.kr/data/15048032/fileData.do (accessed on 15 March 2026).
- Murtagh, F.; Contreras, P. Algorithms for hierarchical clustering: An overview. Wiley Interdiscip. Rev. Data Min. Knowl. Discov. 2012, 2, 86–97. [Google Scholar] [CrossRef] [Scilit]
- Kunsch, H.R. The jackknife and the bootstrap for general stationary observations. Ann. Stat. 1989, 17, 1217–1241. [Google Scholar] [CrossRef] [Scilit]
- Gershenson, C. Design and Control of Self-organizing Systems. Complexity 2007, 12, 22–26. [Google Scholar] [CrossRef] [Scilit]
- Holling, C.S. Resilience and Stability of Ecological Systems; International Institute for Applied Systems Analysis: Laxenburg, Austria, 1973. [Google Scholar]
- Oprea, S.-V.; Bâra, A.; Puican, F.C.; Radu, I.C. Anomaly Detection with Machine Learning Algorithms and Big Data in Electricity Consumption. Sustainability 2021, 13, 10963. [Google Scholar] [CrossRef] [Scilit]
- Fan, P.; Bu, S.; Wen, Y.; Ke, S.; Li, S.; Fang, S. Electric Vehicle User-Centric Guidance on Travel and Charging Decisions to Enhance Time and Energy Efficiency. IEEE Trans. Transp. Electrif. 2026, early access. [Google Scholar] [CrossRef] [Scilit]
- Ke, S.; Zhang, K.; Mai, W.; Guo, R.; He, S.; Tian, J. Maximizing Intraday V2G Feasible Capacity of EVs: A Cross-Disciplinary Approach with Traffic Flow and Prospect Theory. IEEE Trans. Transp. Electrif. 2026, 12, 5078–5091. [Google Scholar] [CrossRef] [Scilit]
- Ma, D.; Lan, G.; Hassan, M.; Hu, W.; Upama, M.B.; Uddin, A.; Youssef, M. Solargest: Ubiquitous and battery-free gesture recognition using solar cells. In Proceedings of the 25th Annual International Conference on Mobile Computing and Networking, Los Cabos, Mexico, 21–25 October 2019; pp. 1–15. [Google Scholar]
- Ni, T.; Chen, Y.; Song, K.; Xu, W. A simple and fast human activity recognition system using radio frequency energy harvesting. In Proceedings of the 2021 ACM International Joint Conference on Pervasive and Ubiquitous Computing and Proceedings of the 2021 ACM International Symposium on Wearable Computers, Virtual, 21–26 September 2021; pp. 666–671. [Google Scholar]
- Ni, T.; Sun, Z.; Han, M.; Xie, Y.; Lan, G.; Li, Z.; Gu, T.; Xu, W. Rehsense: Towards battery-free wireless sensing via radio frequency energy harvesting. In Proceedings of the Twenty-Fifth International Symposium on Theory, Algorithmic Foundations, and Protocol Design for Mobile Networks and Mobile Computing, Athens, Greece, 14–17 October 2024; pp. 211–220. [Google Scholar]
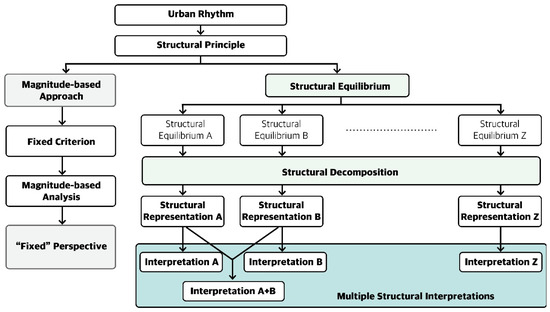
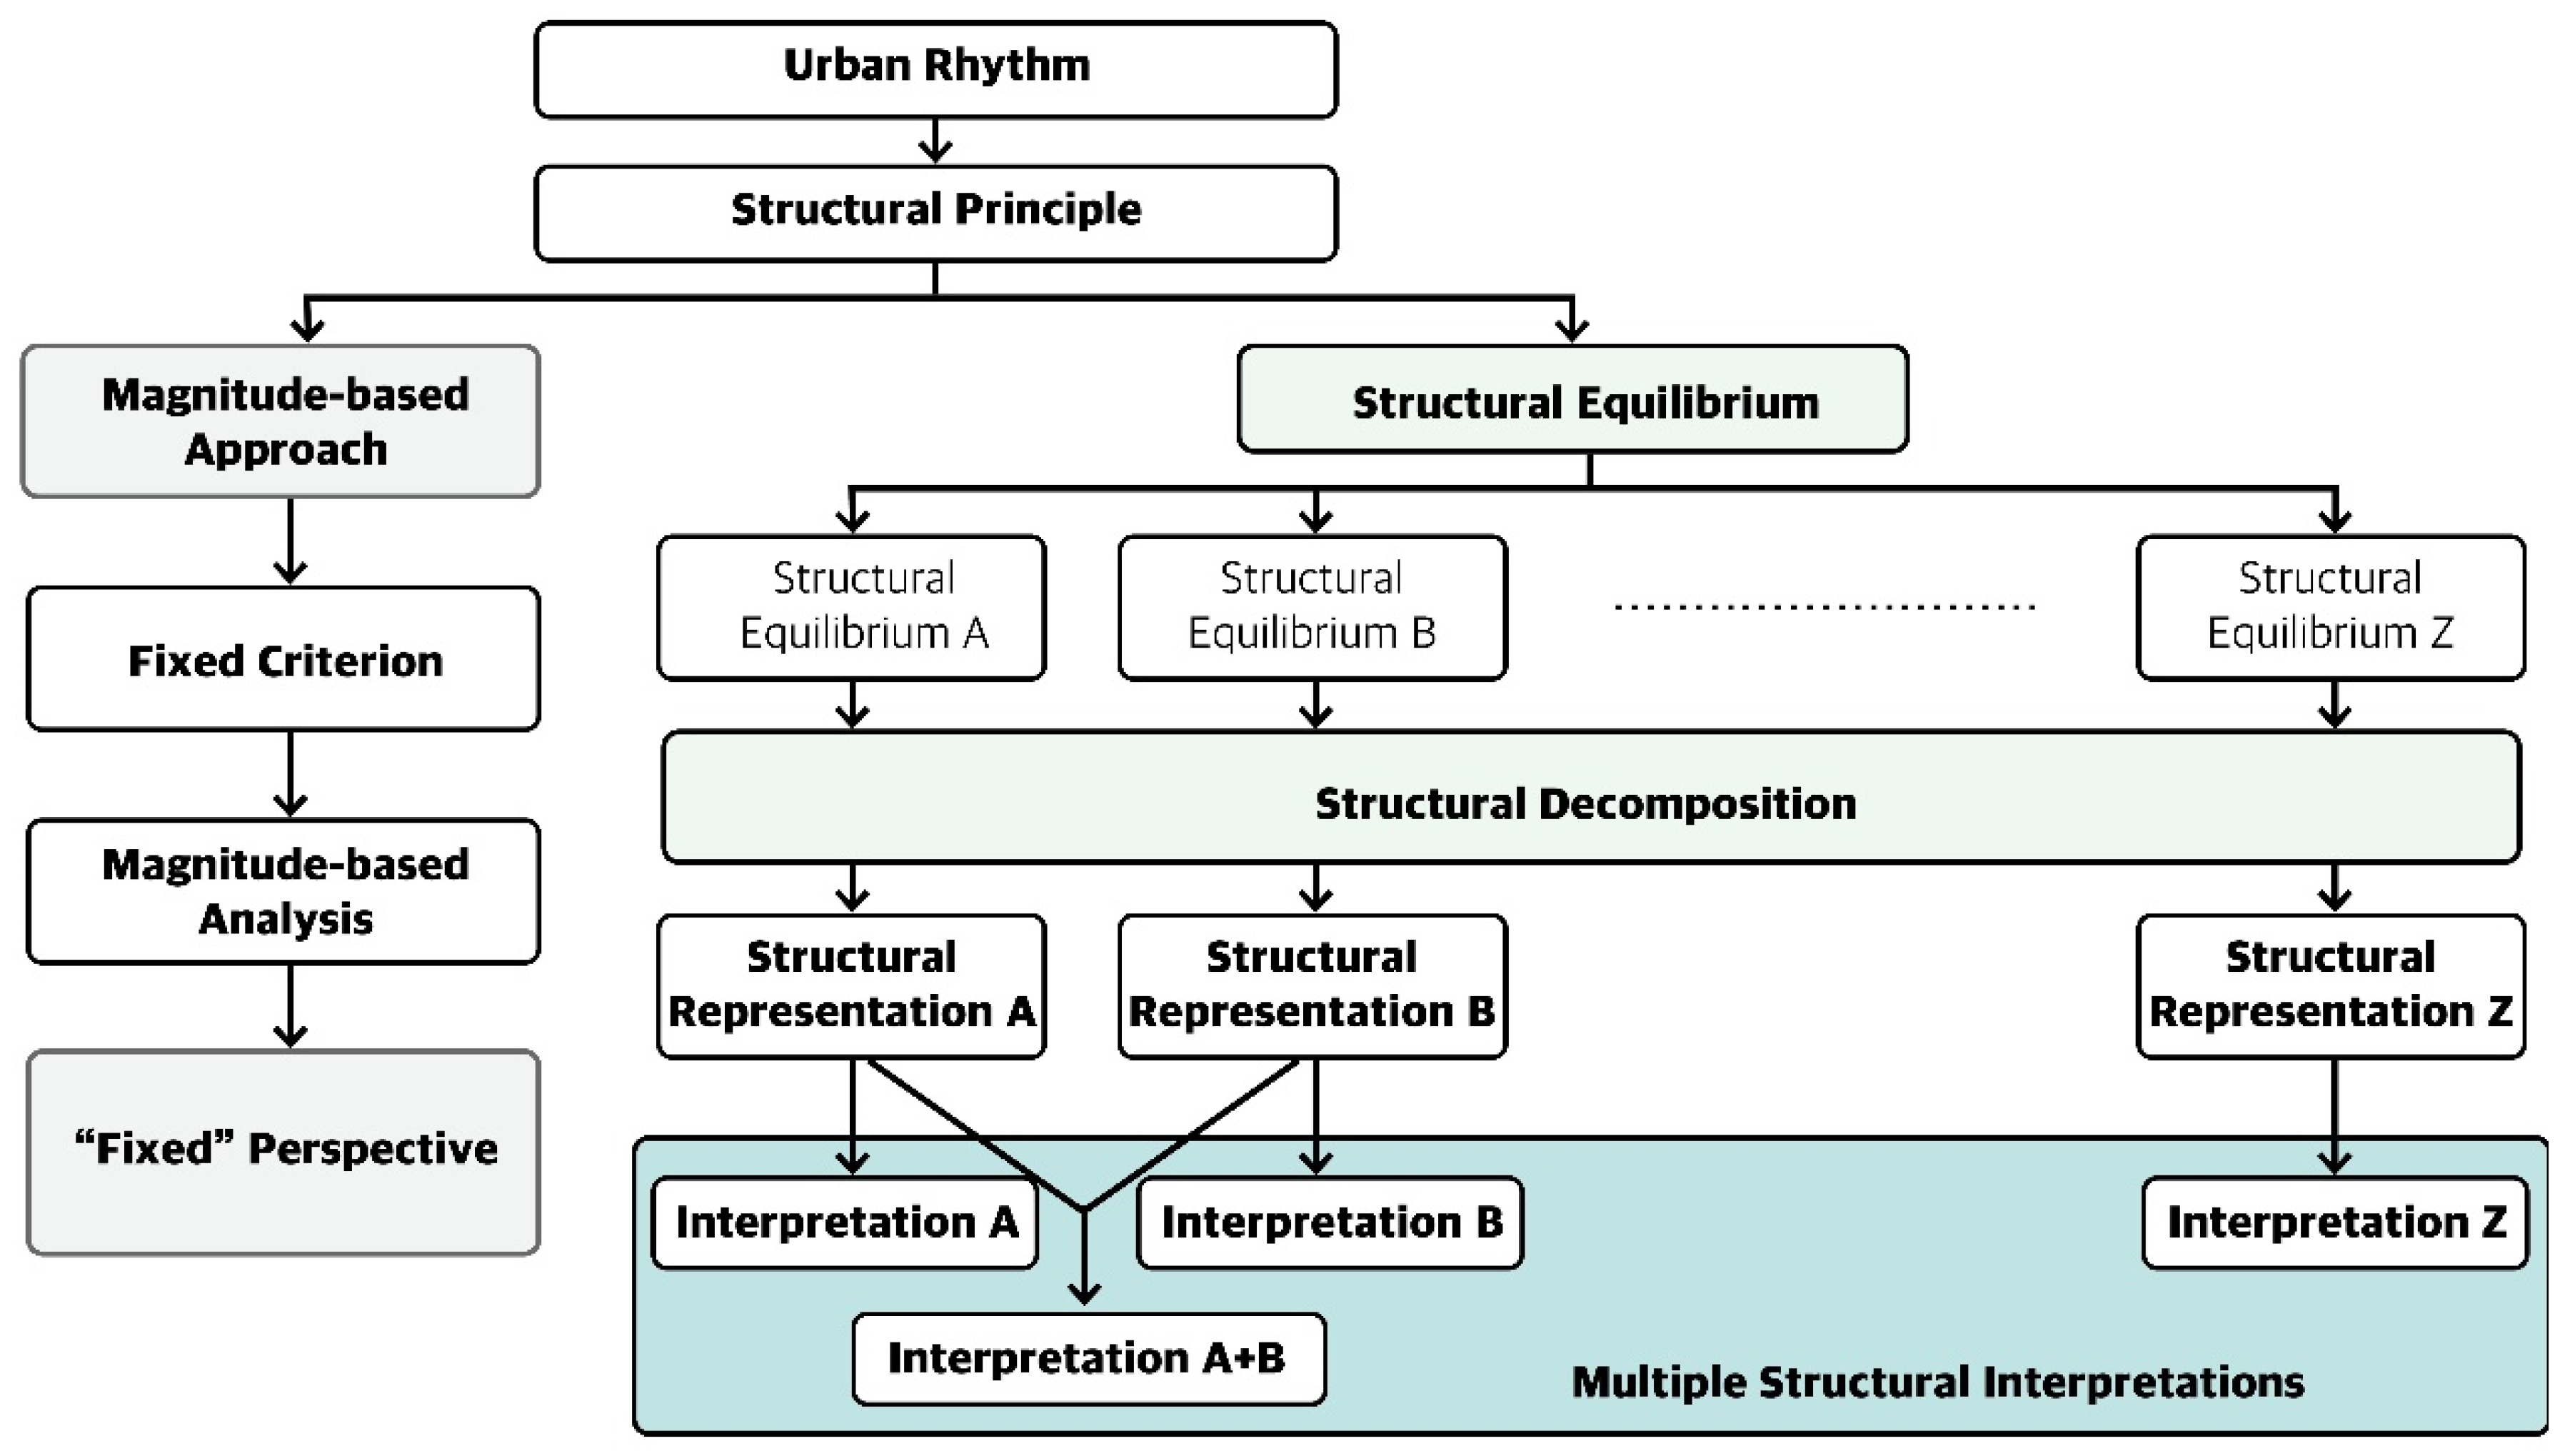
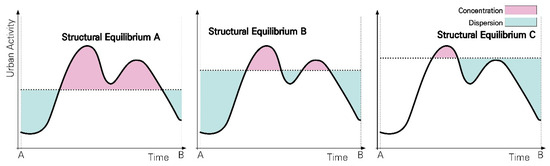
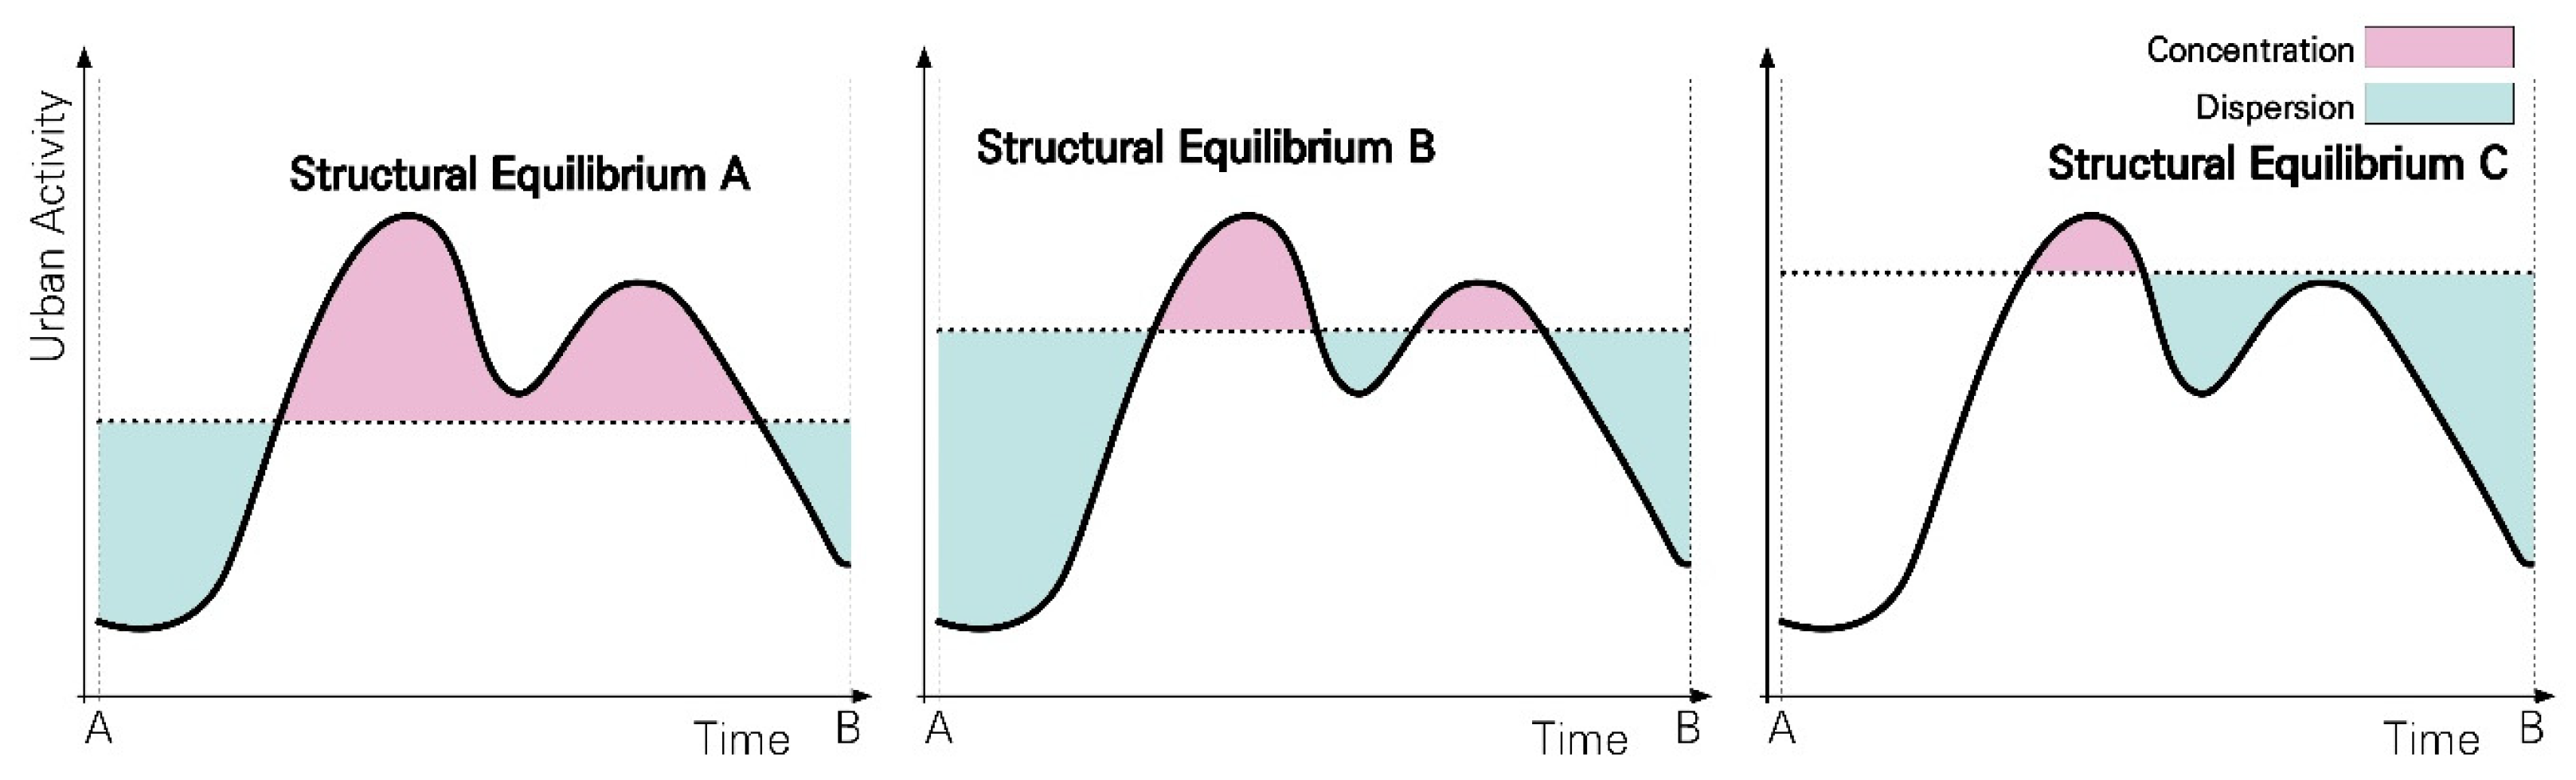
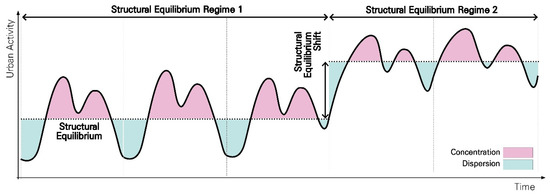
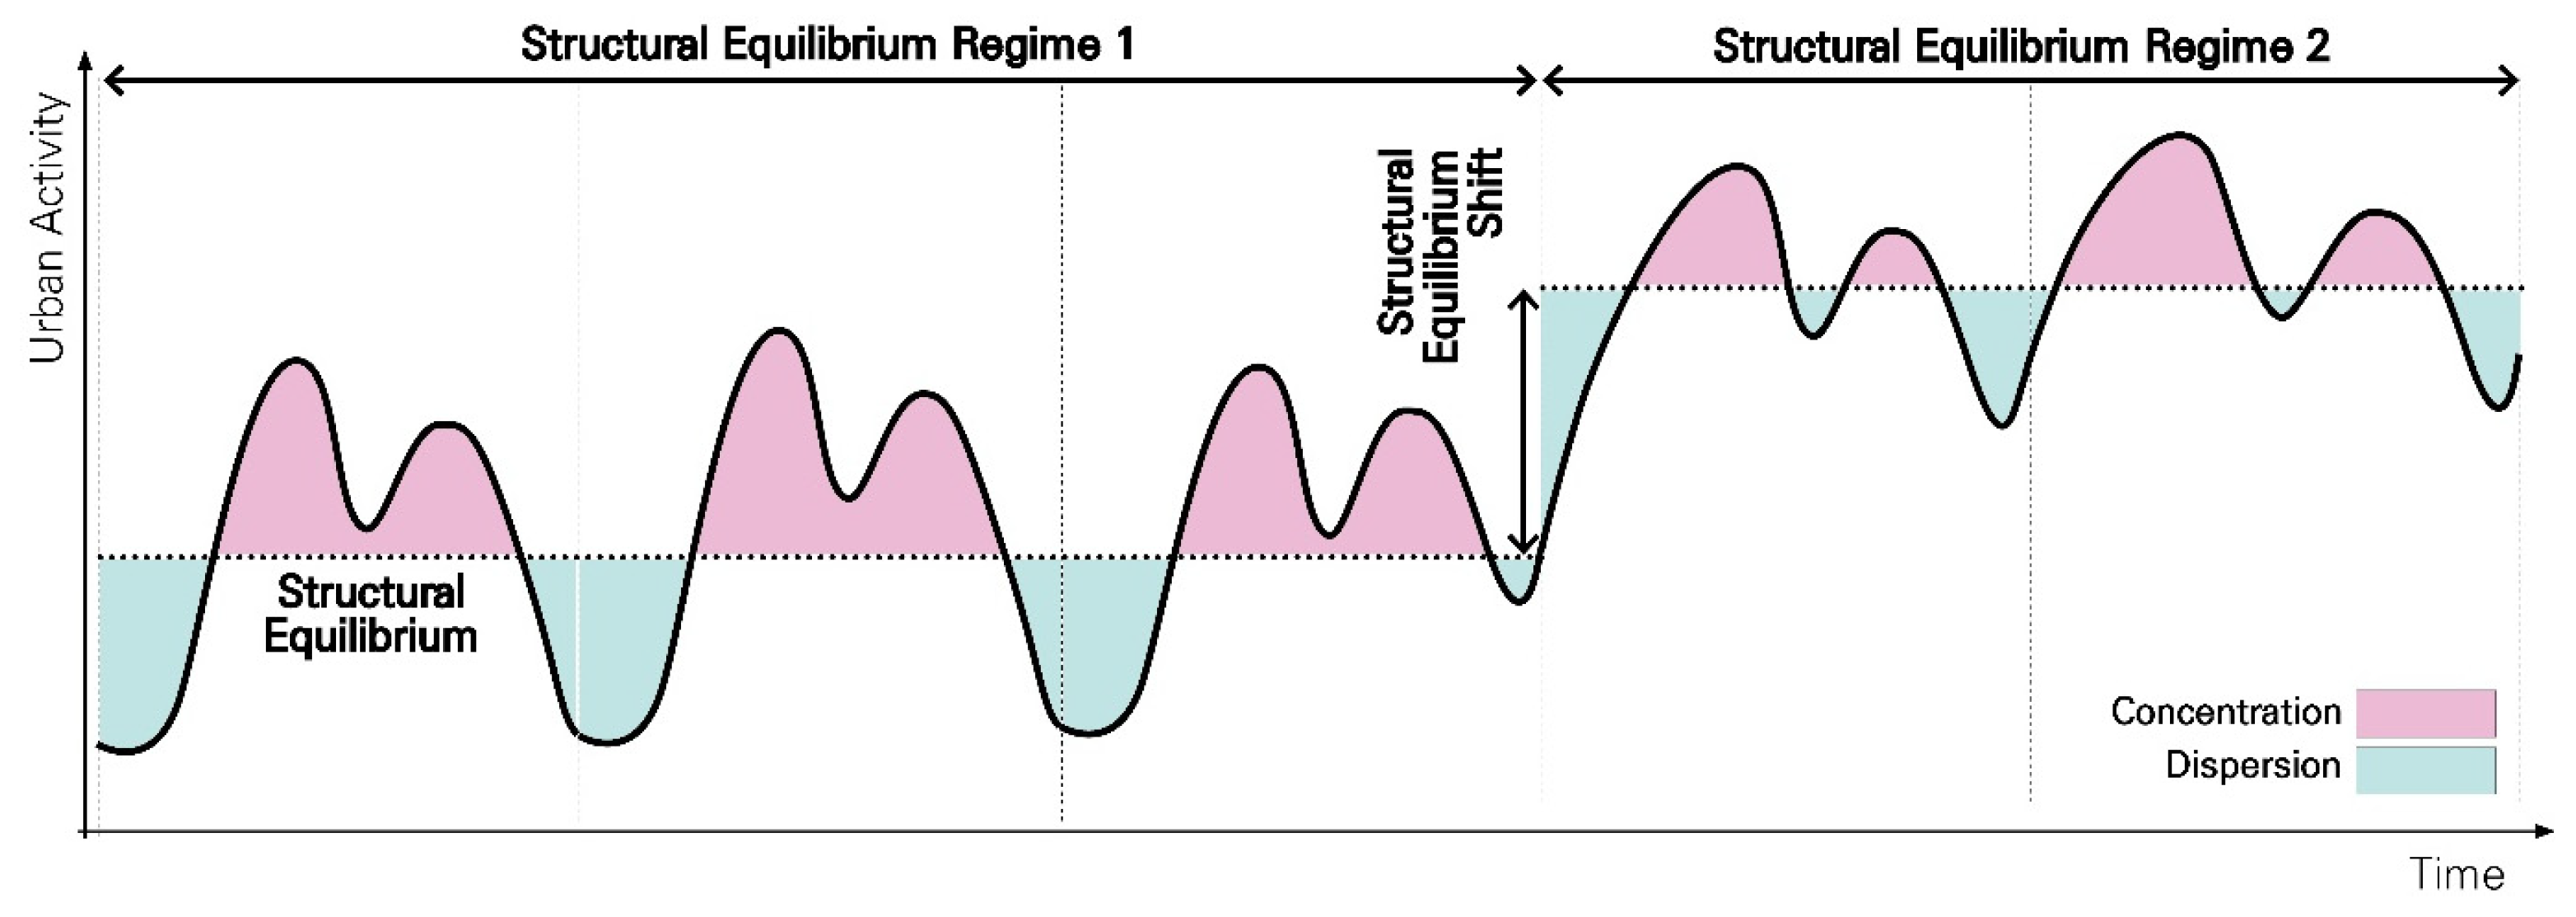
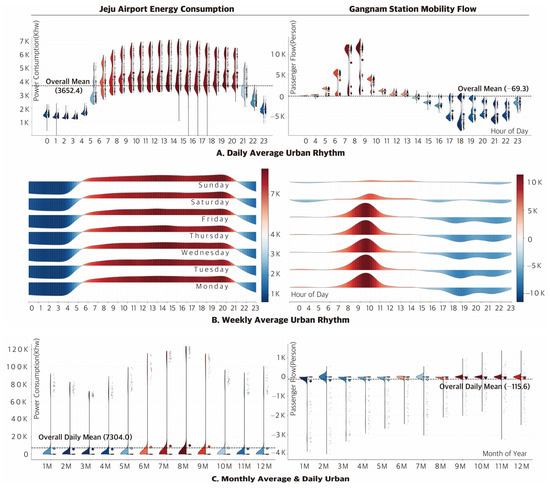
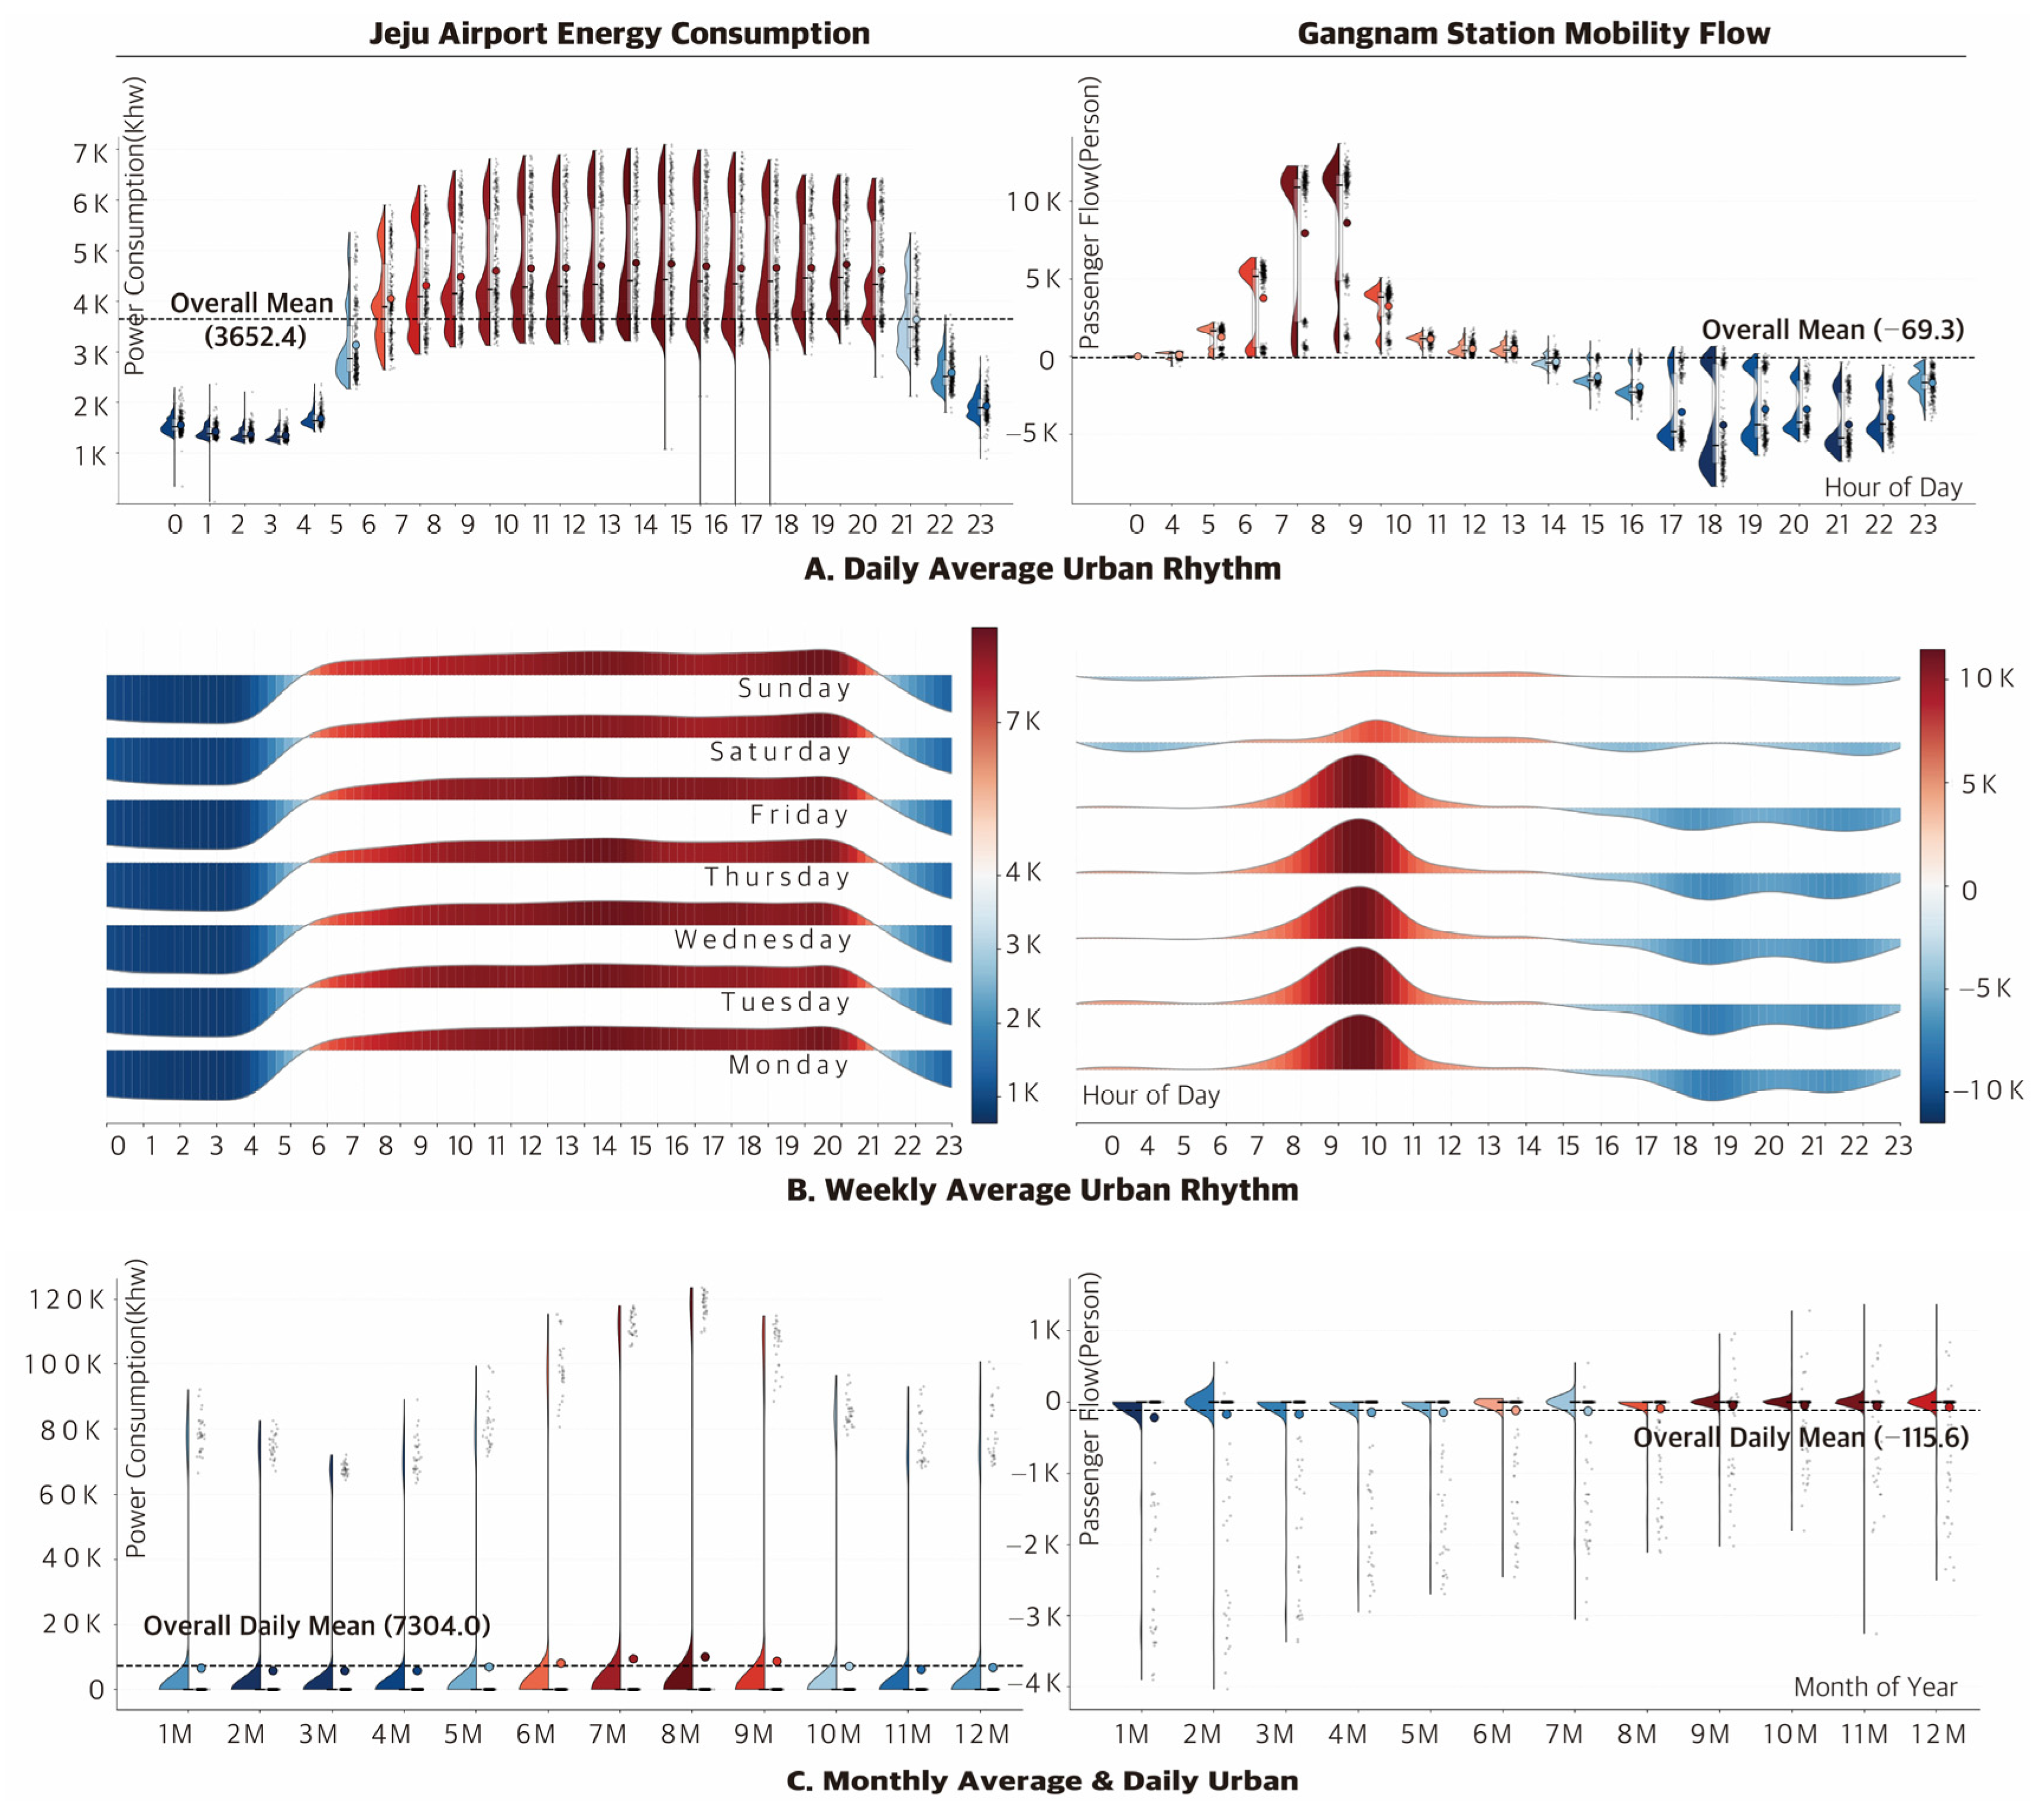
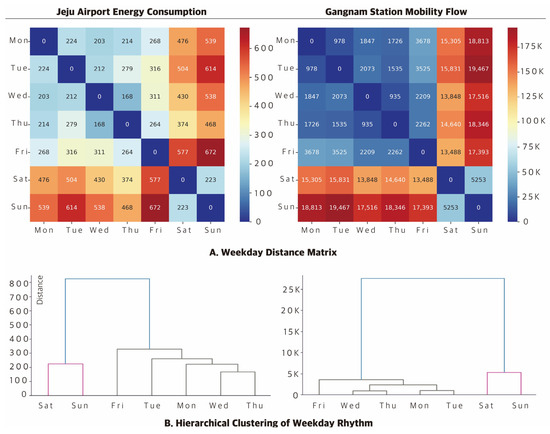
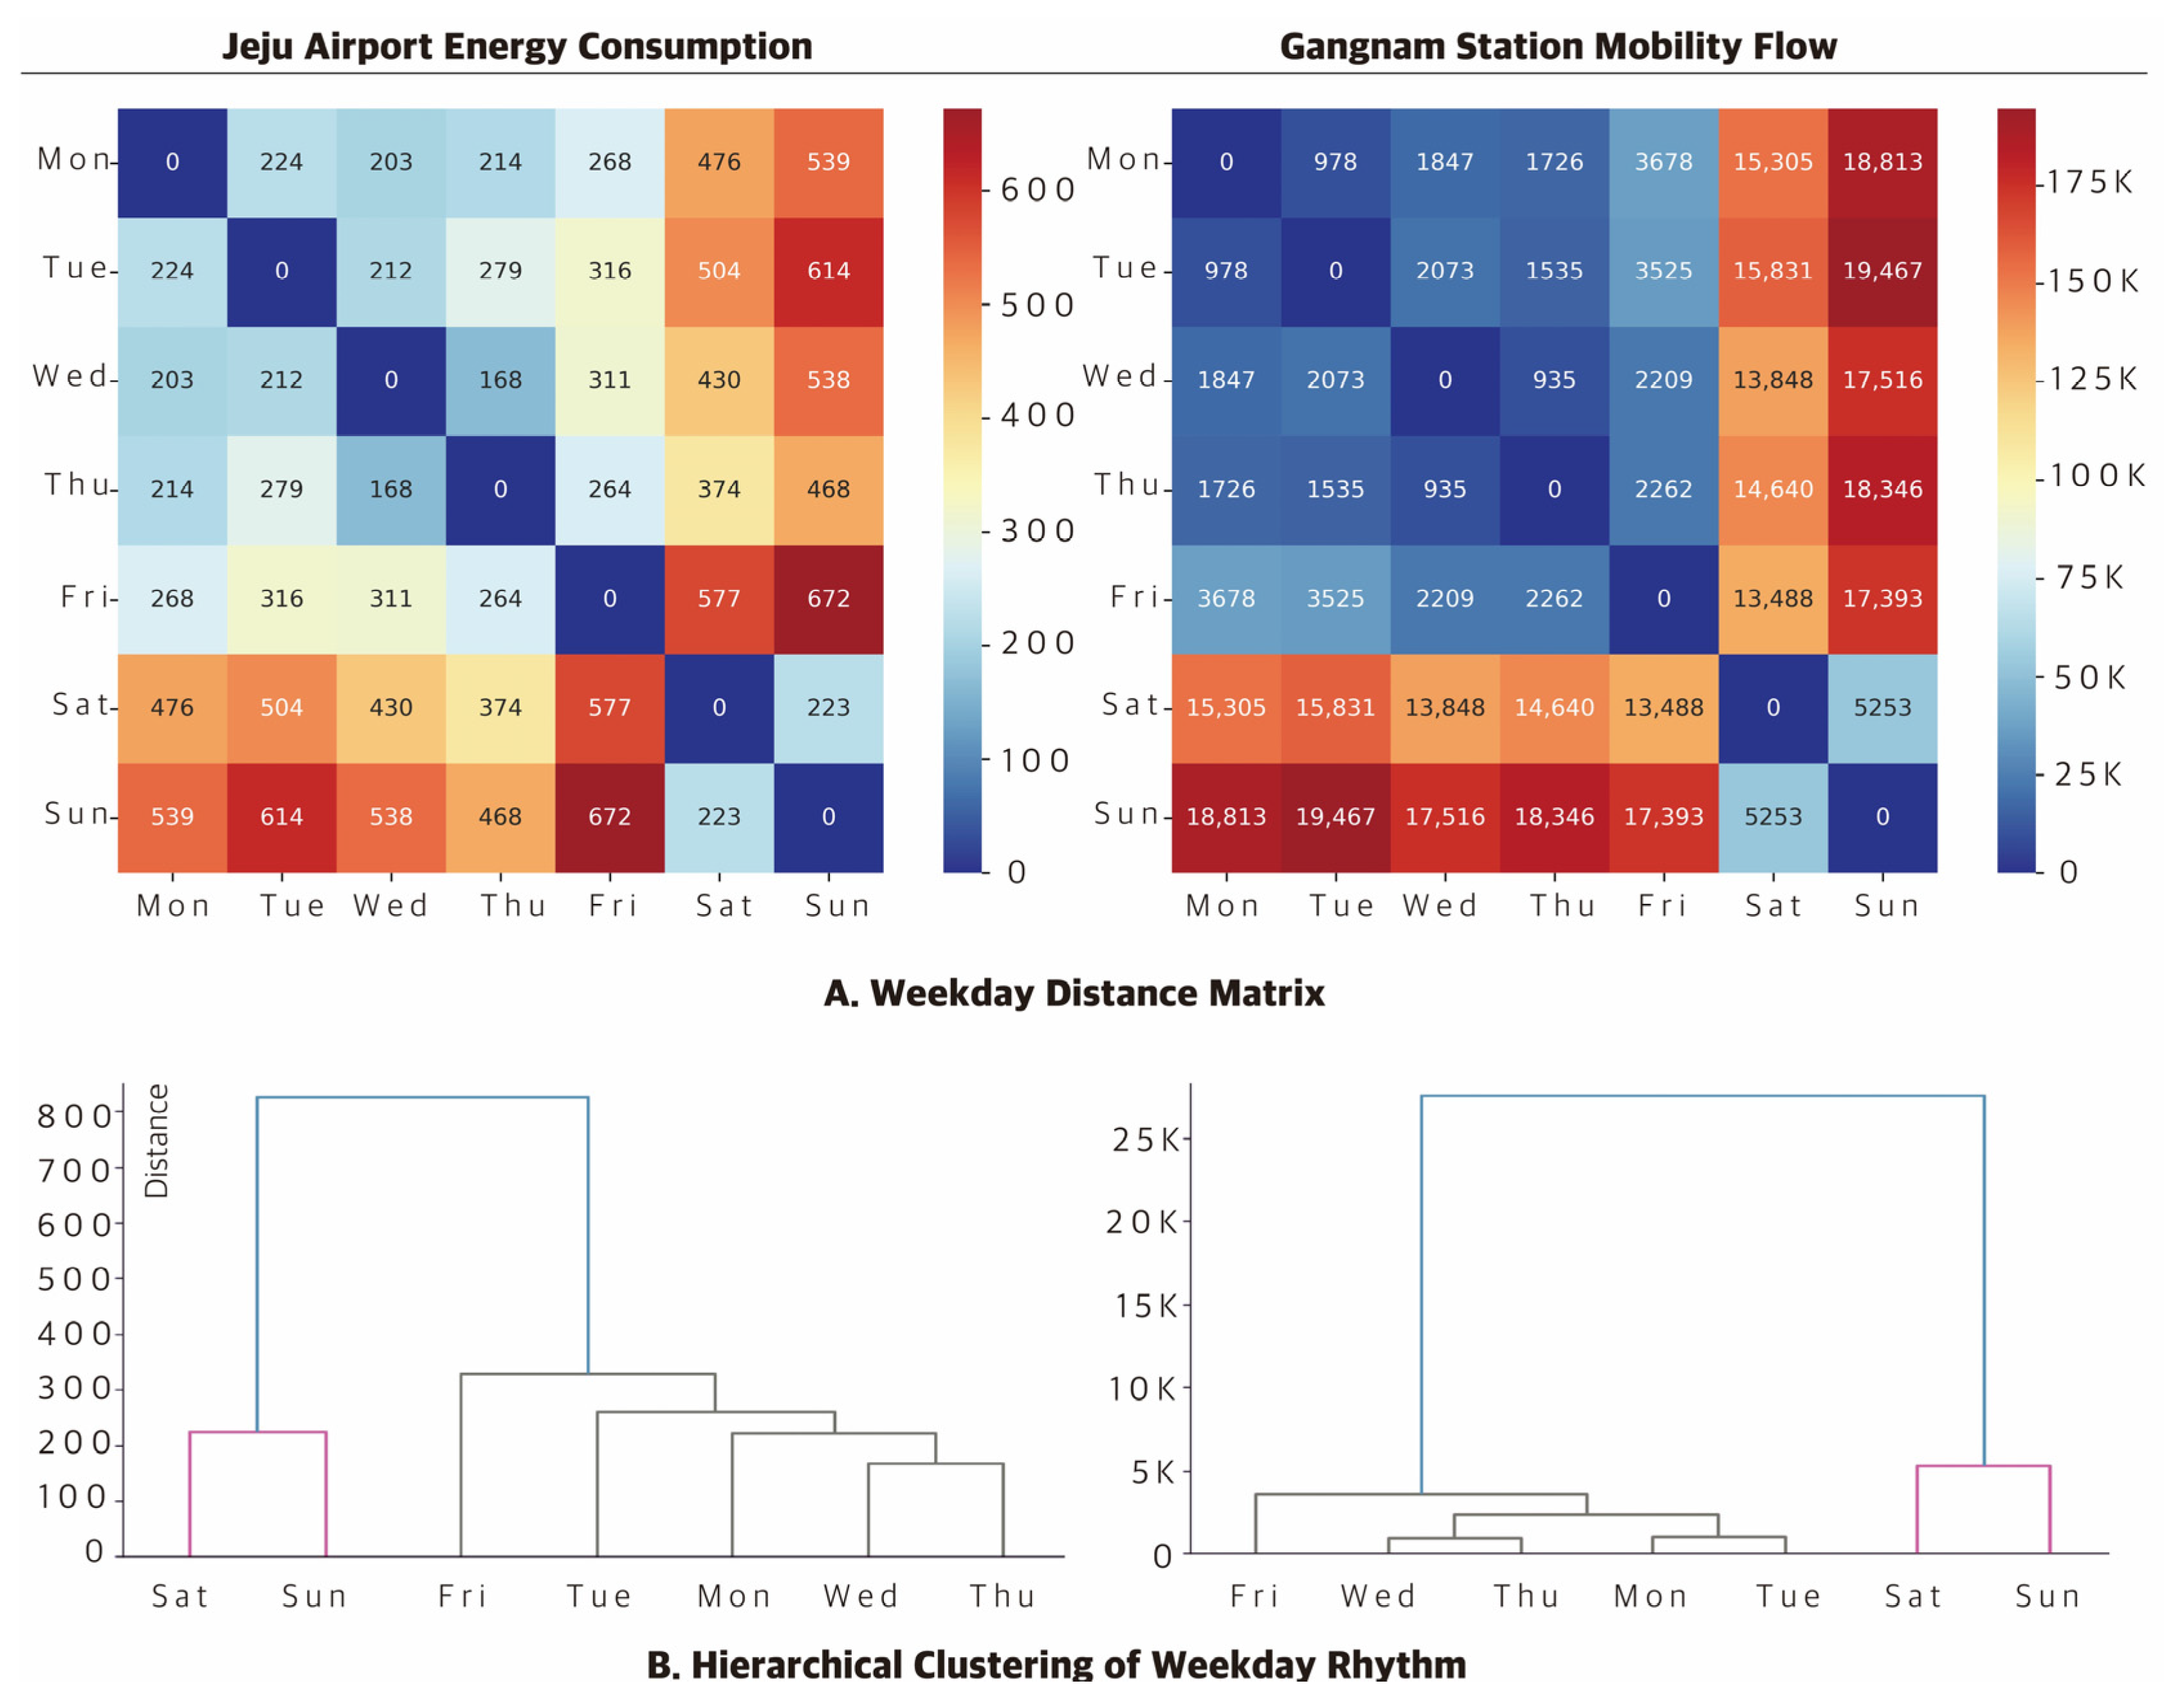
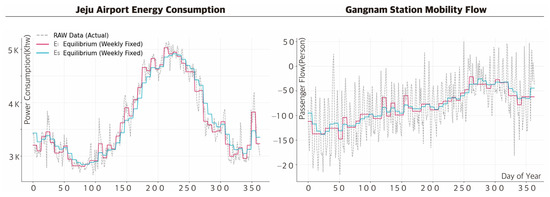
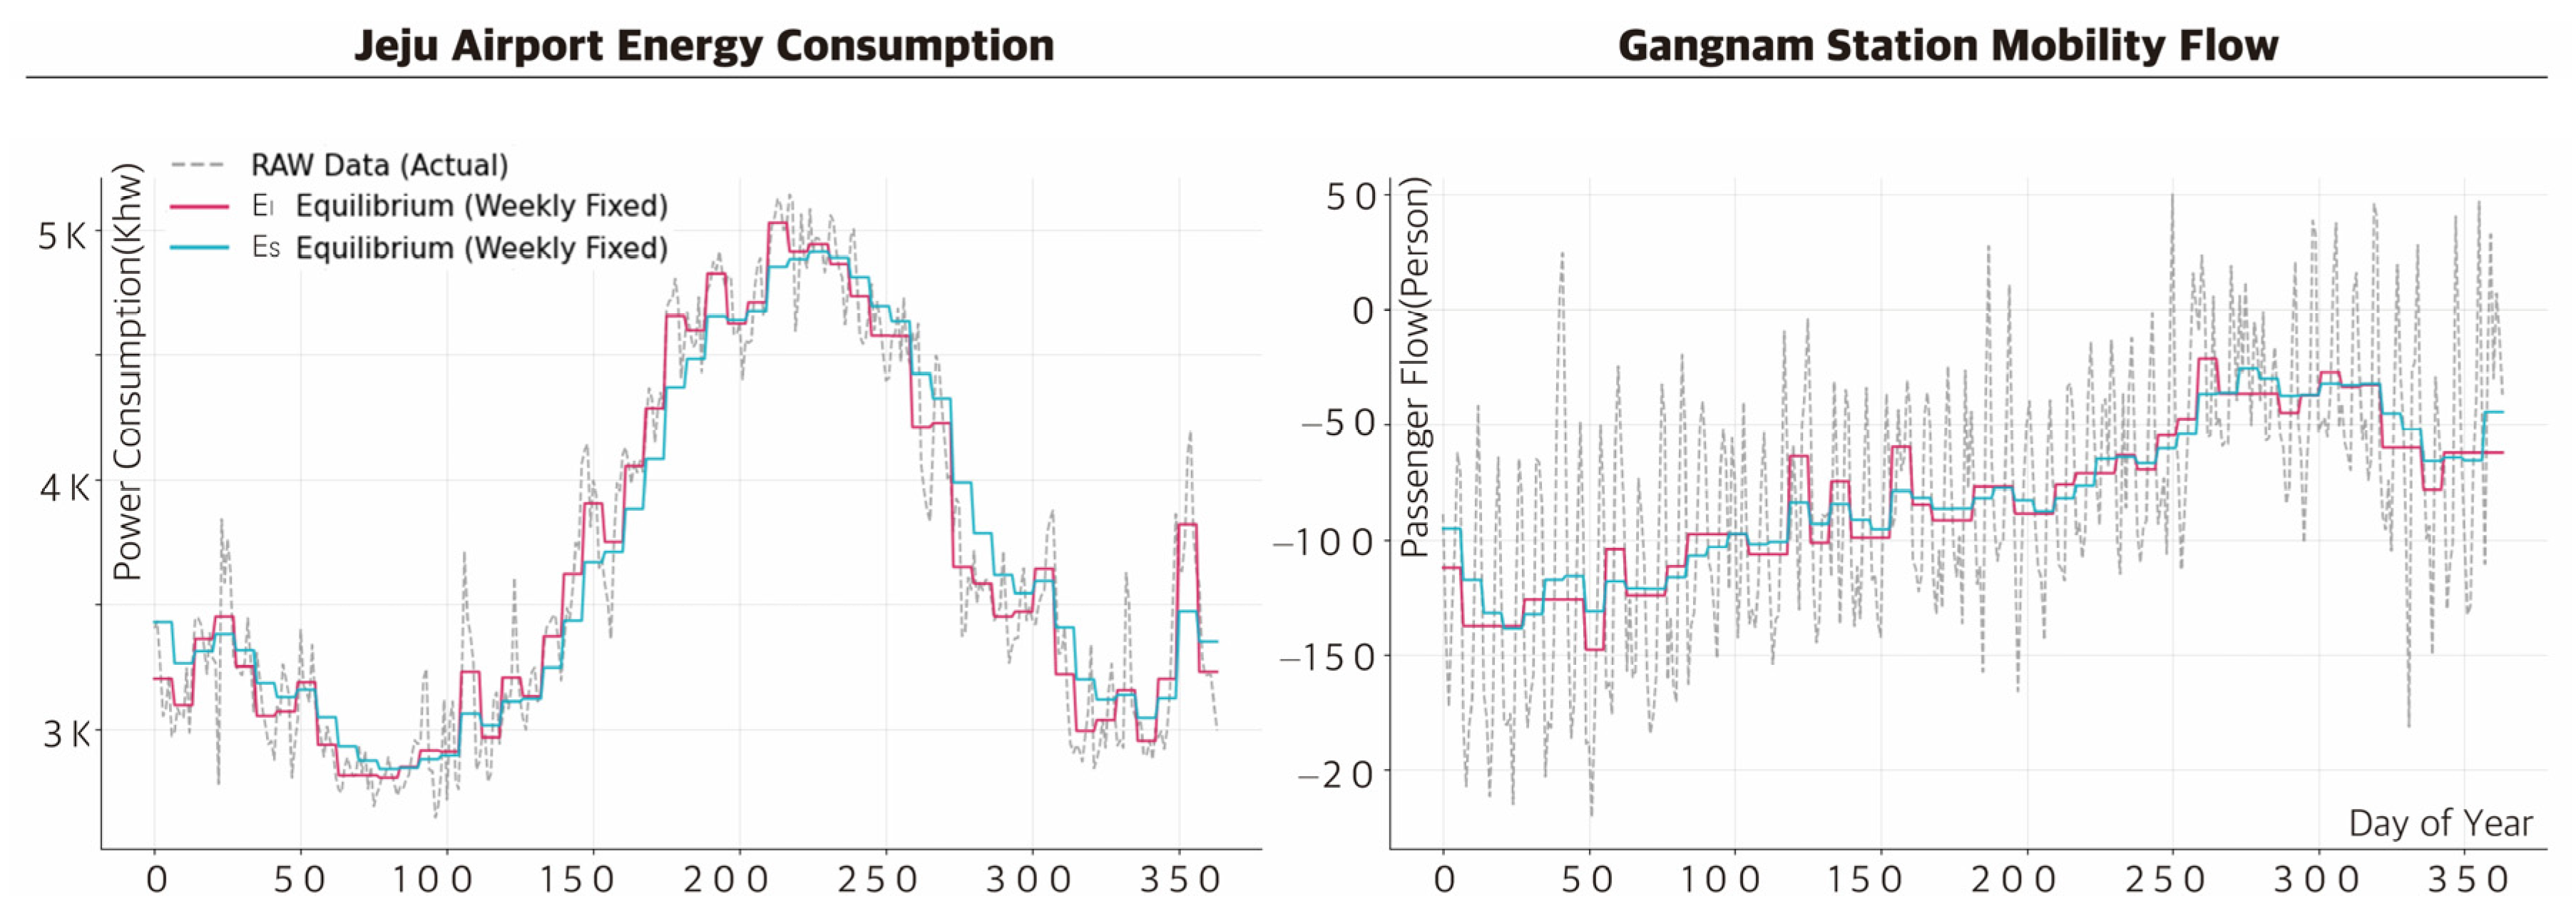
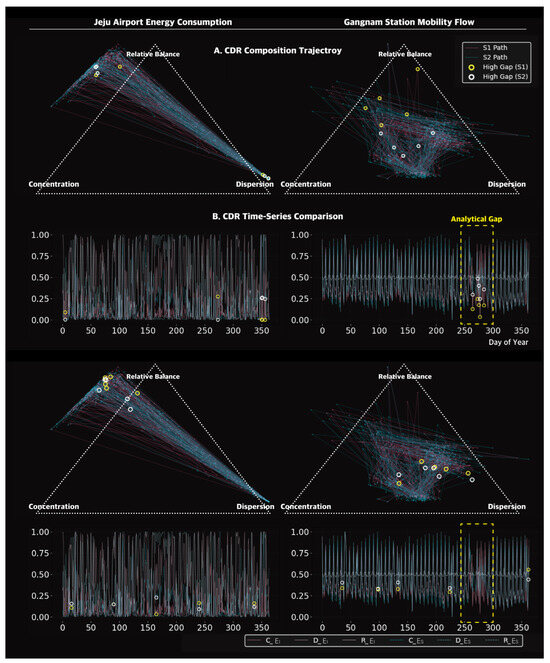
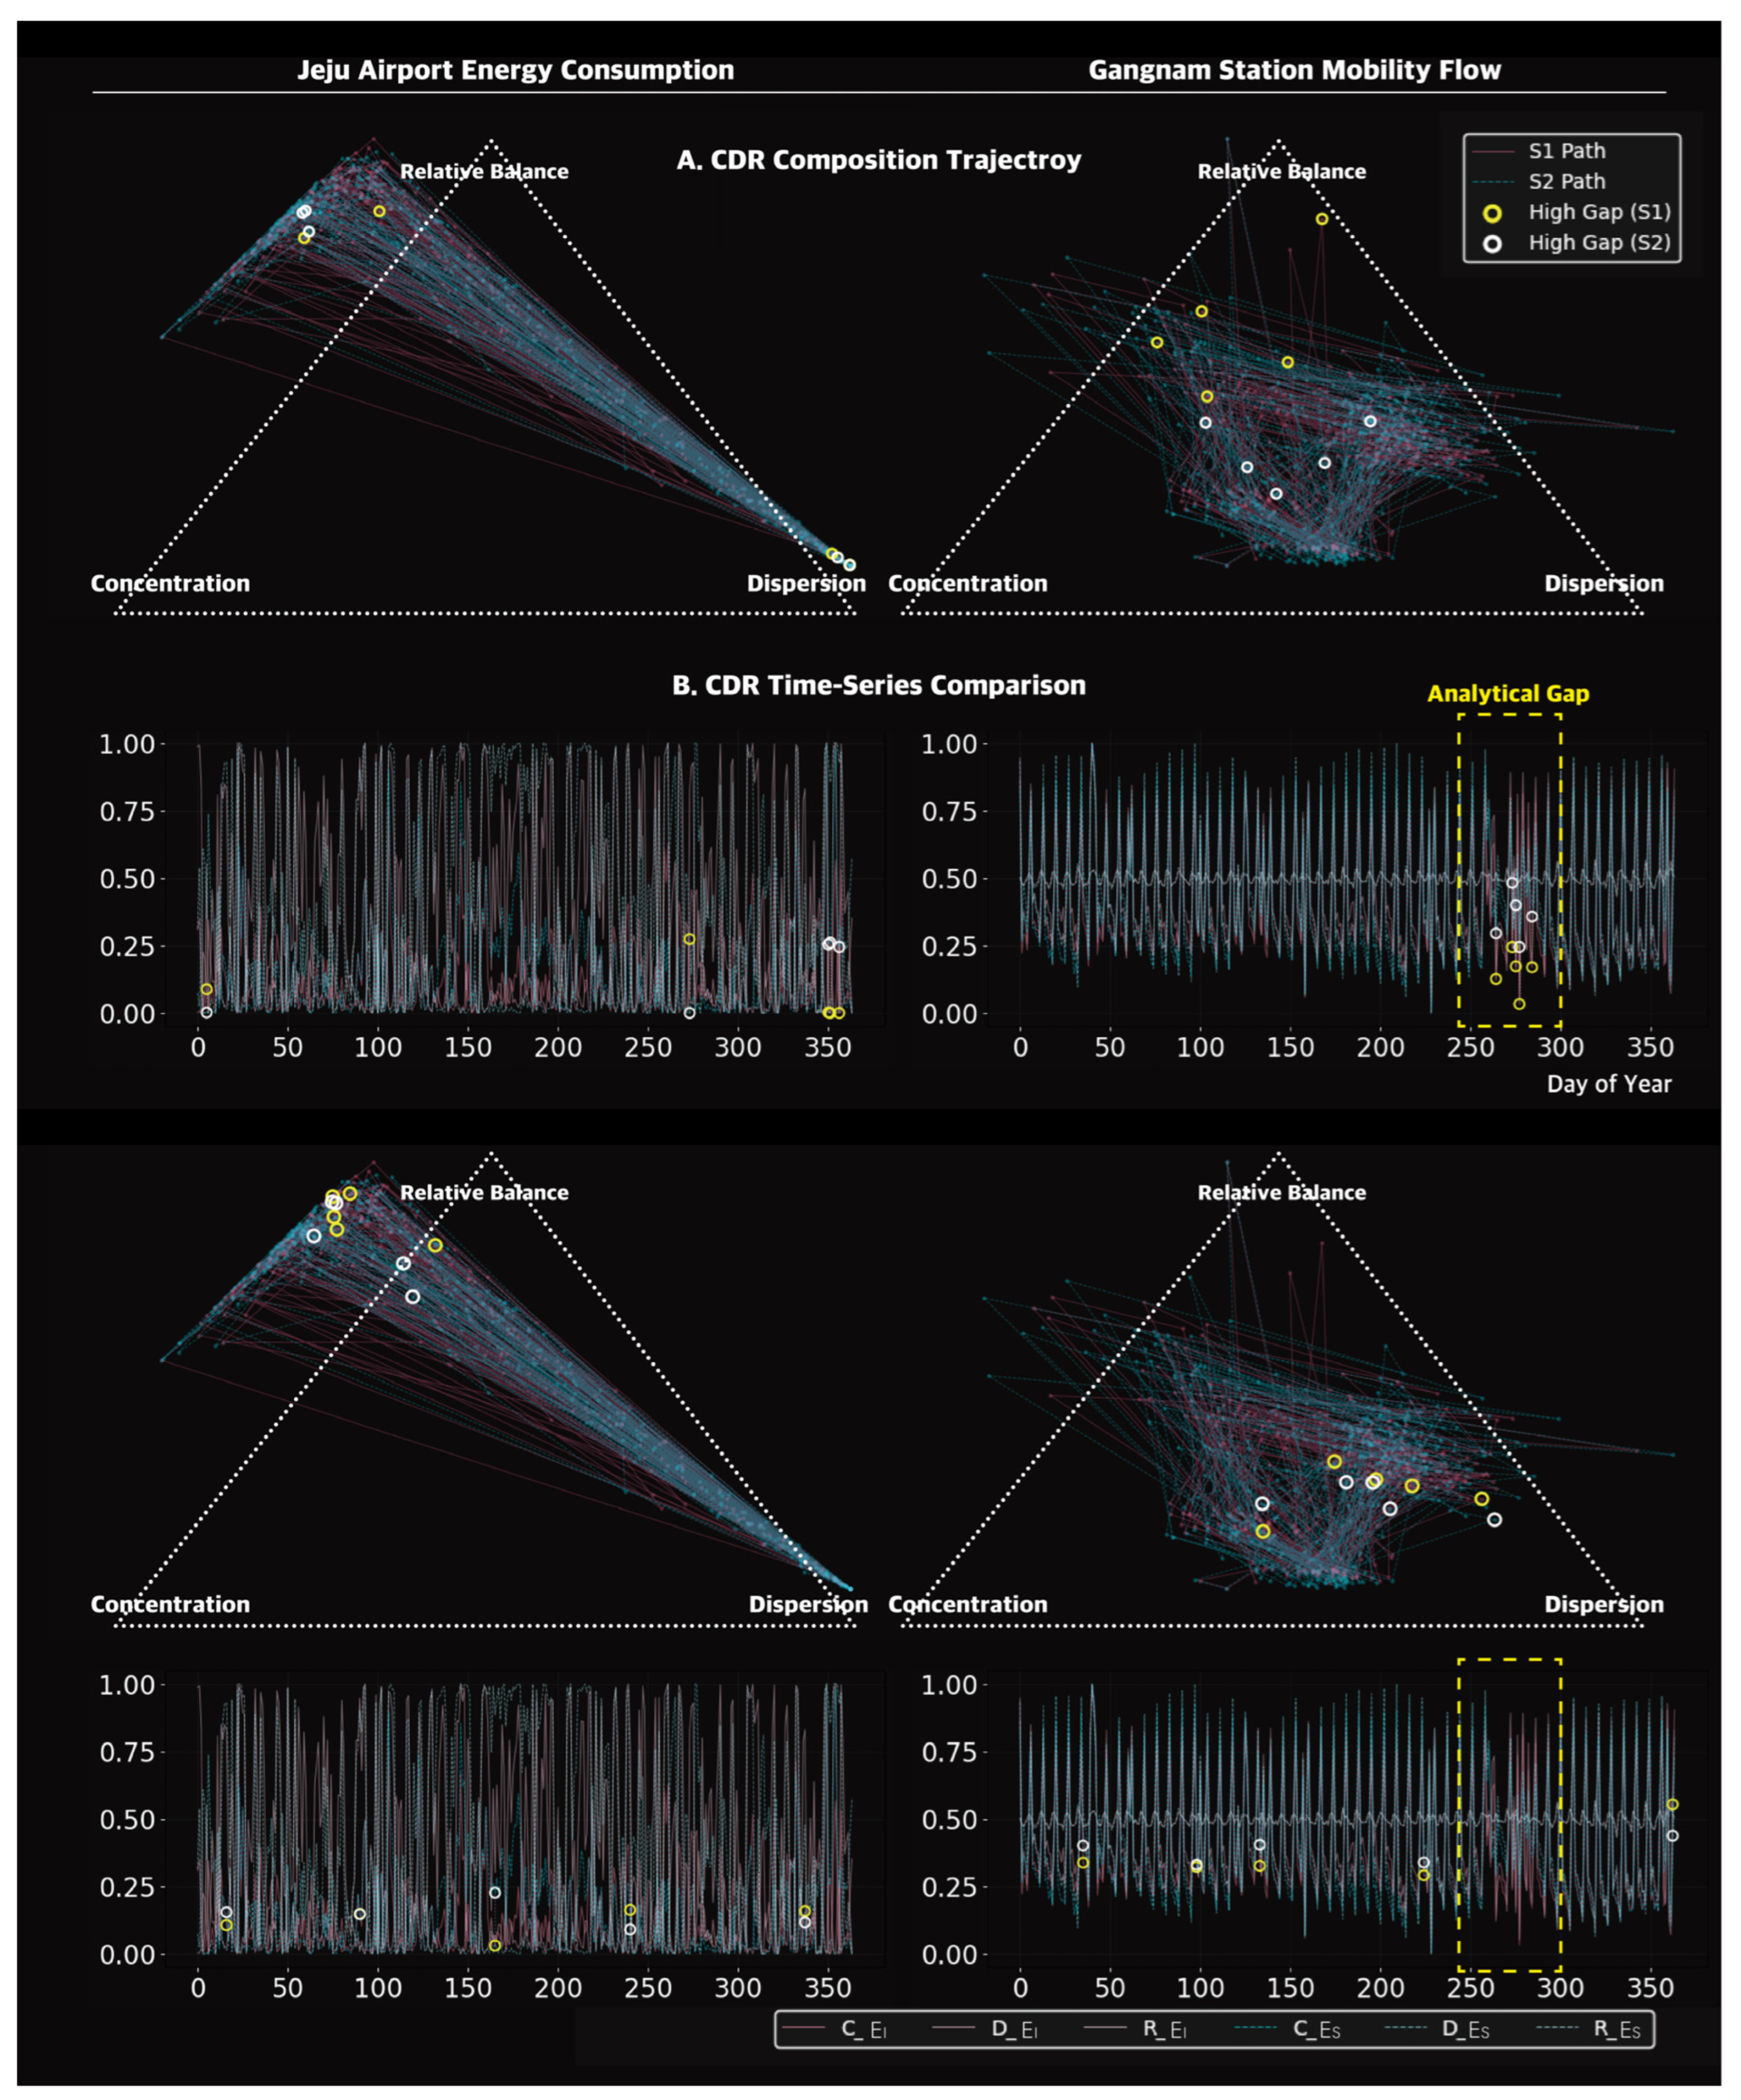
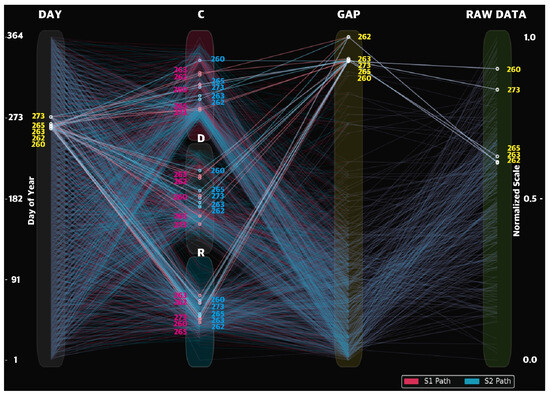
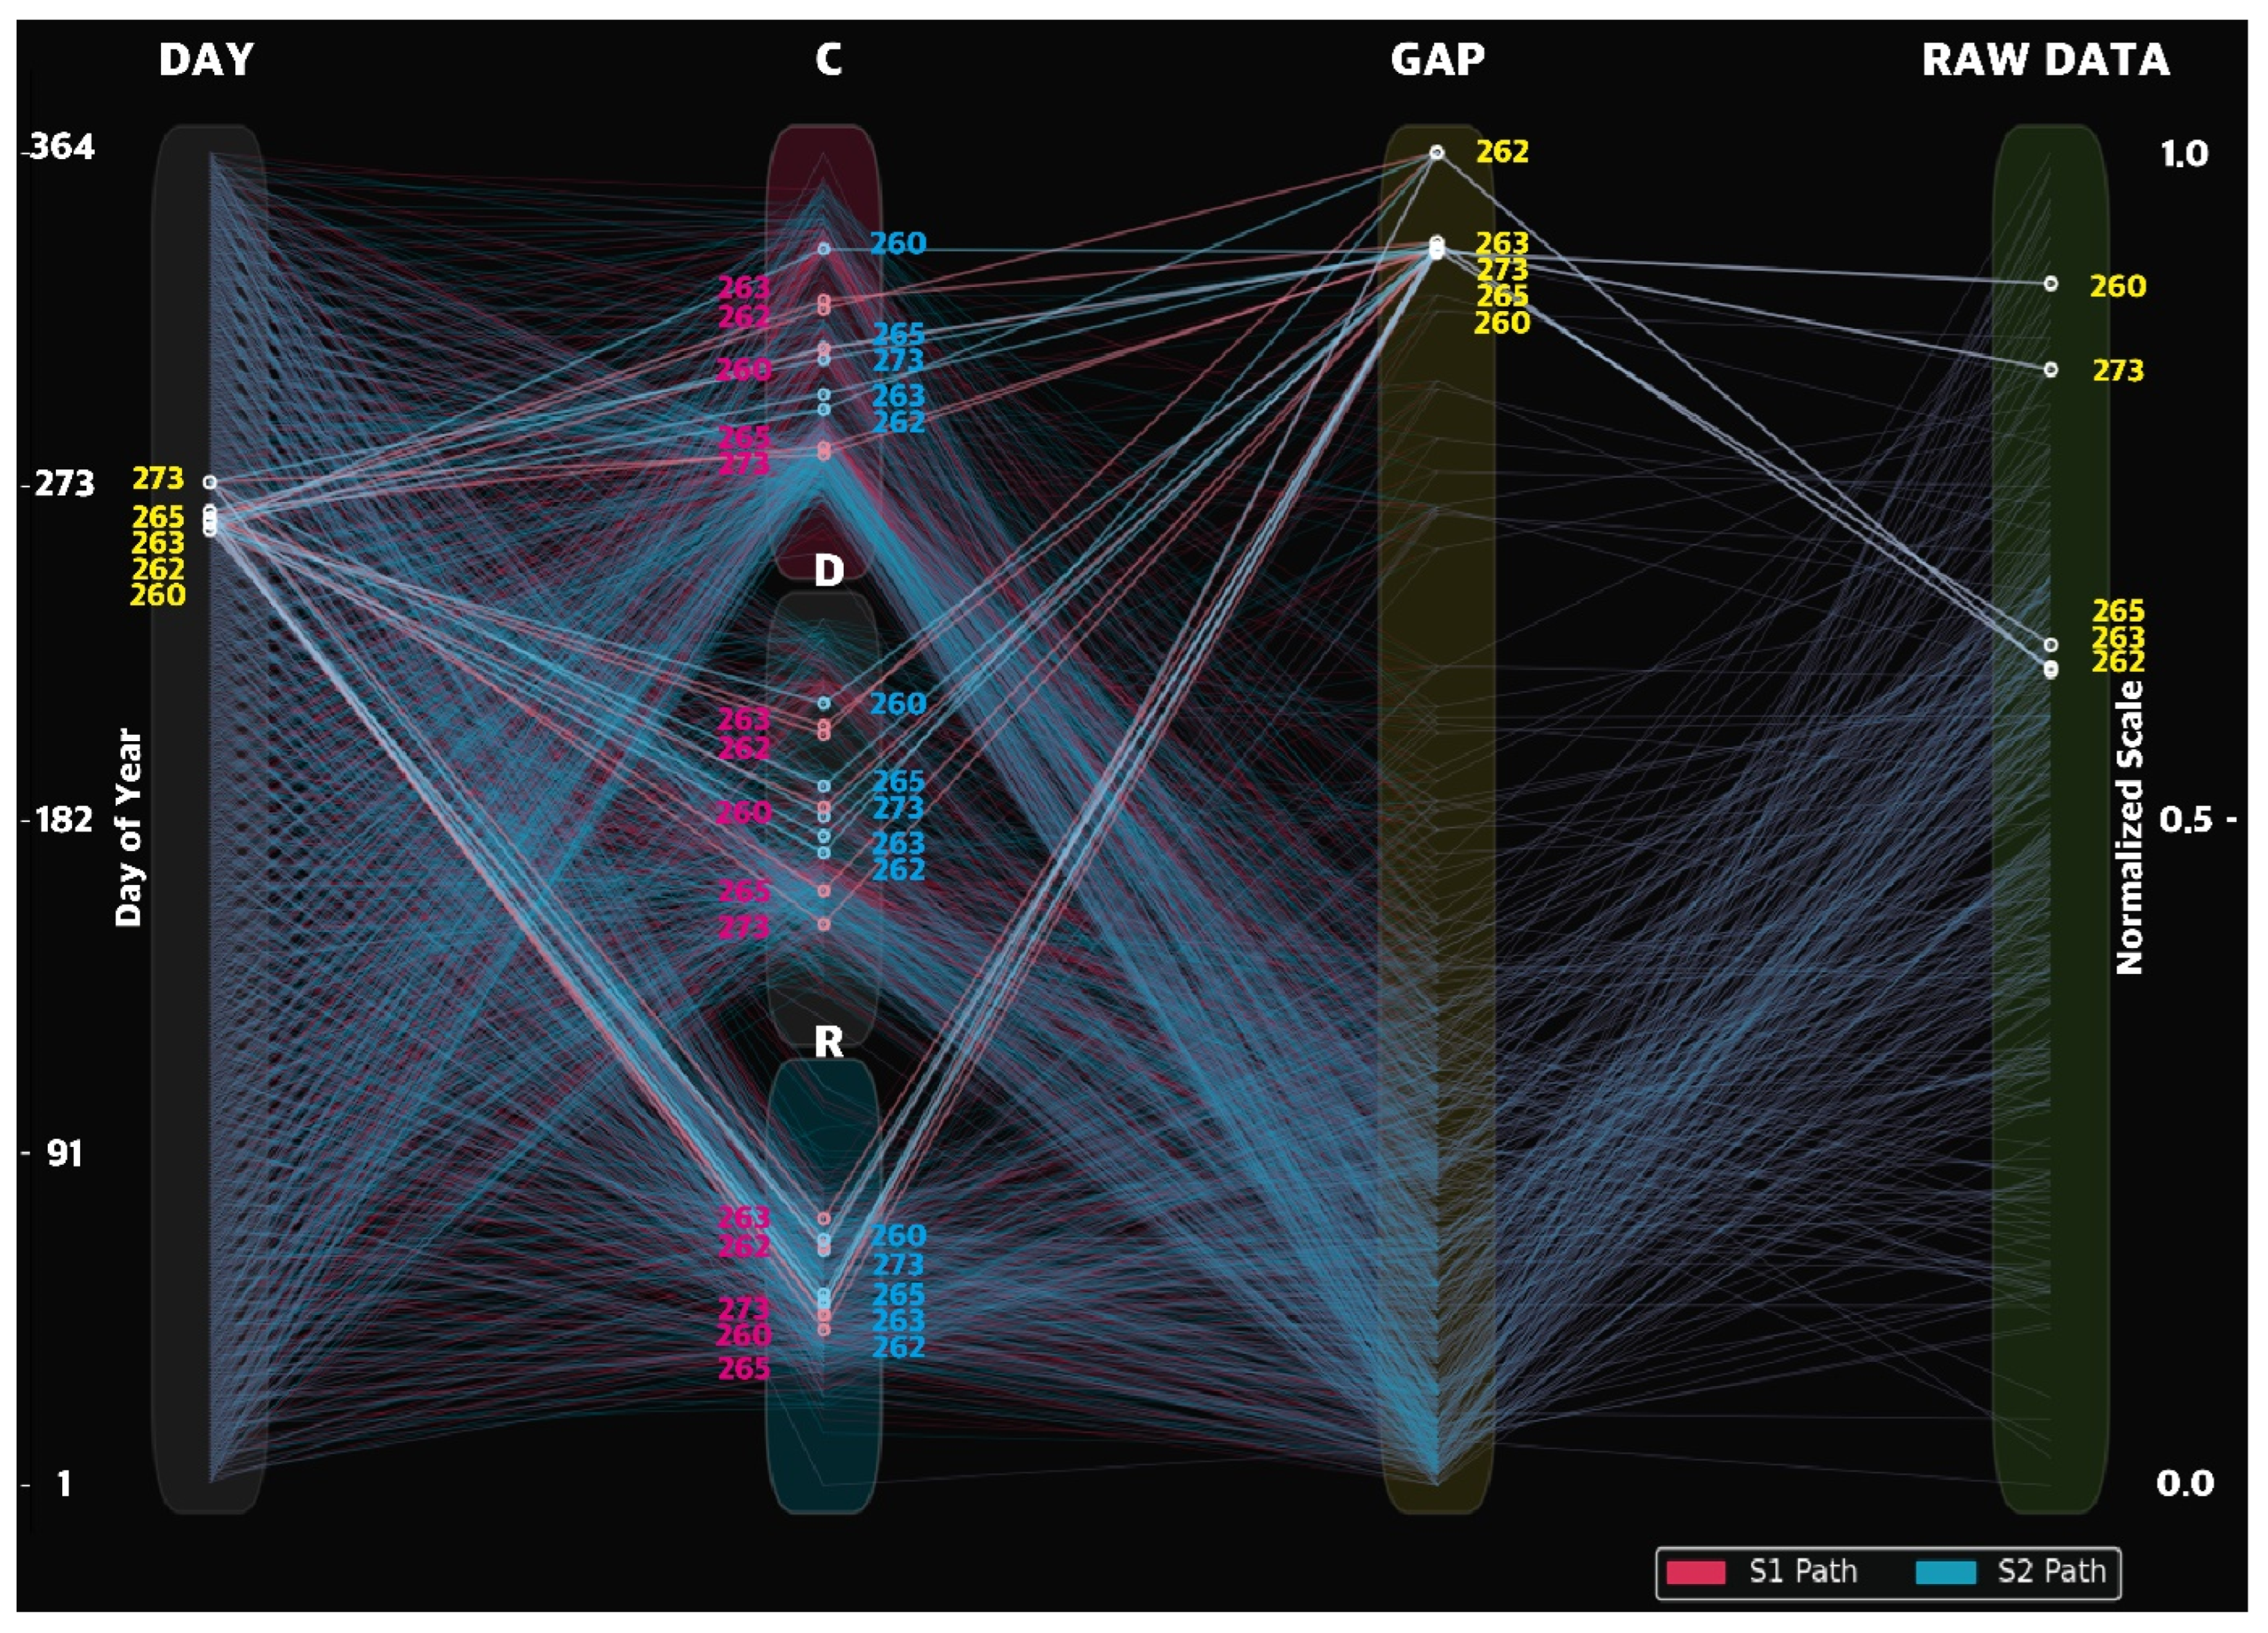
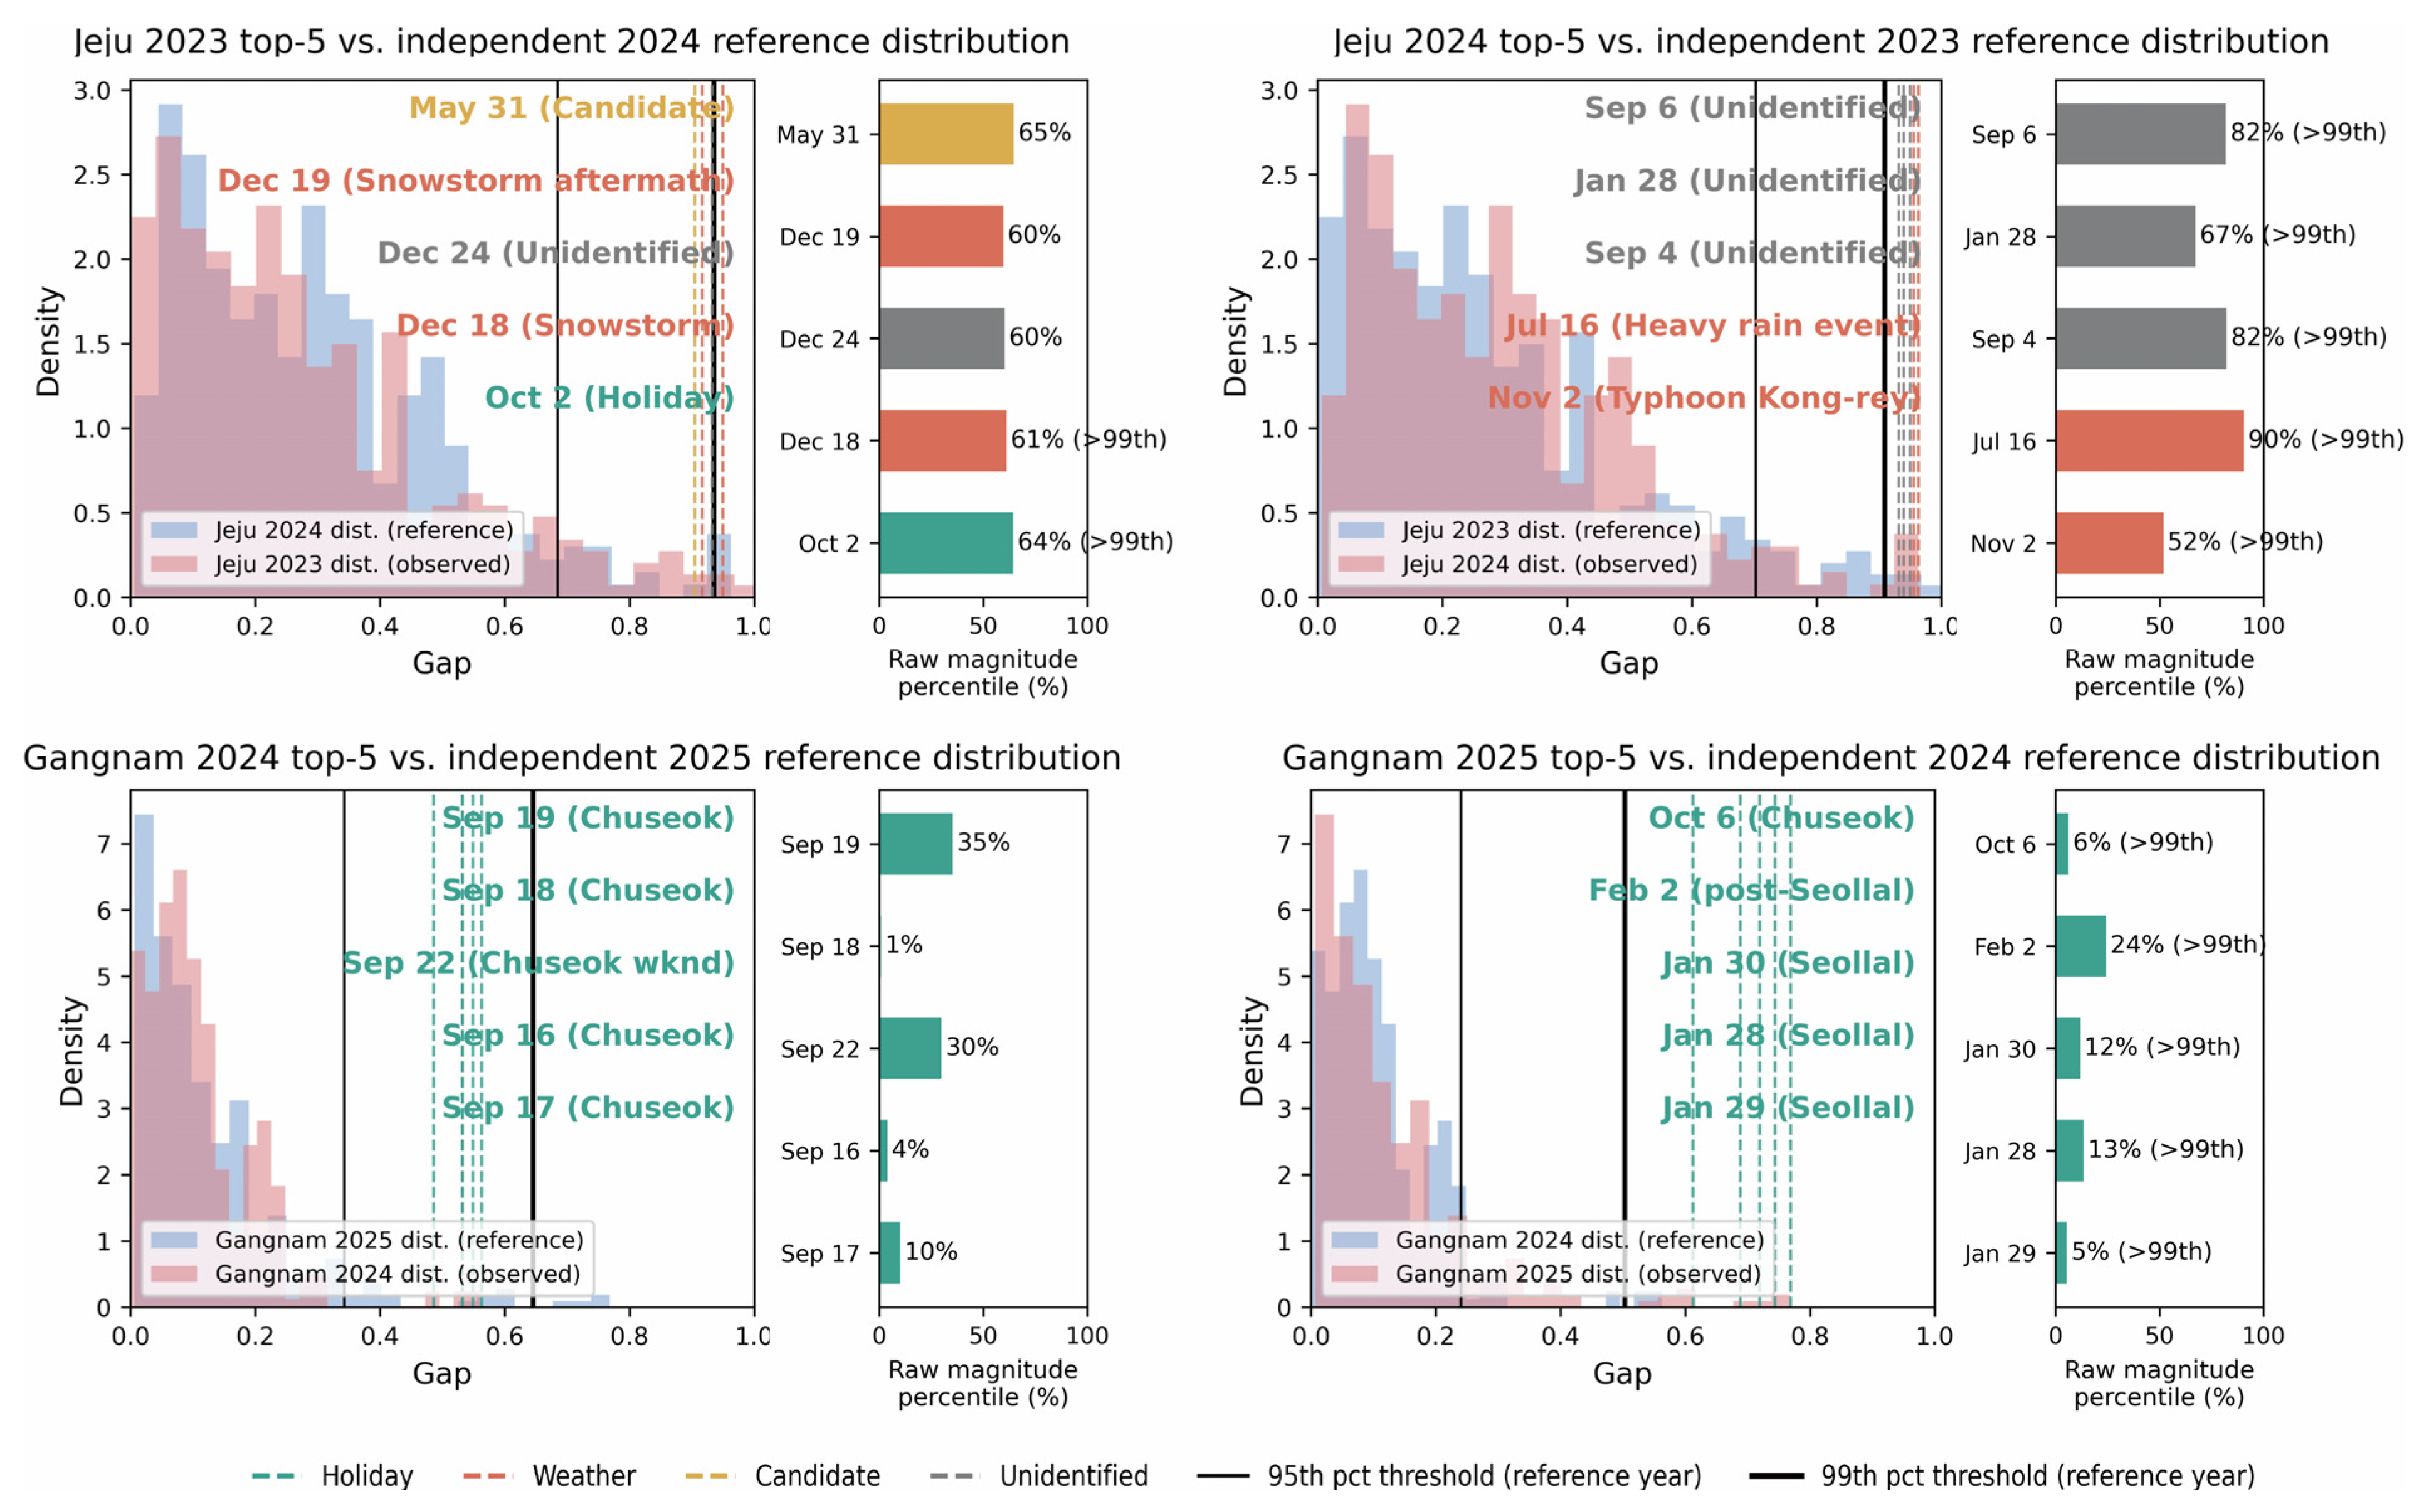
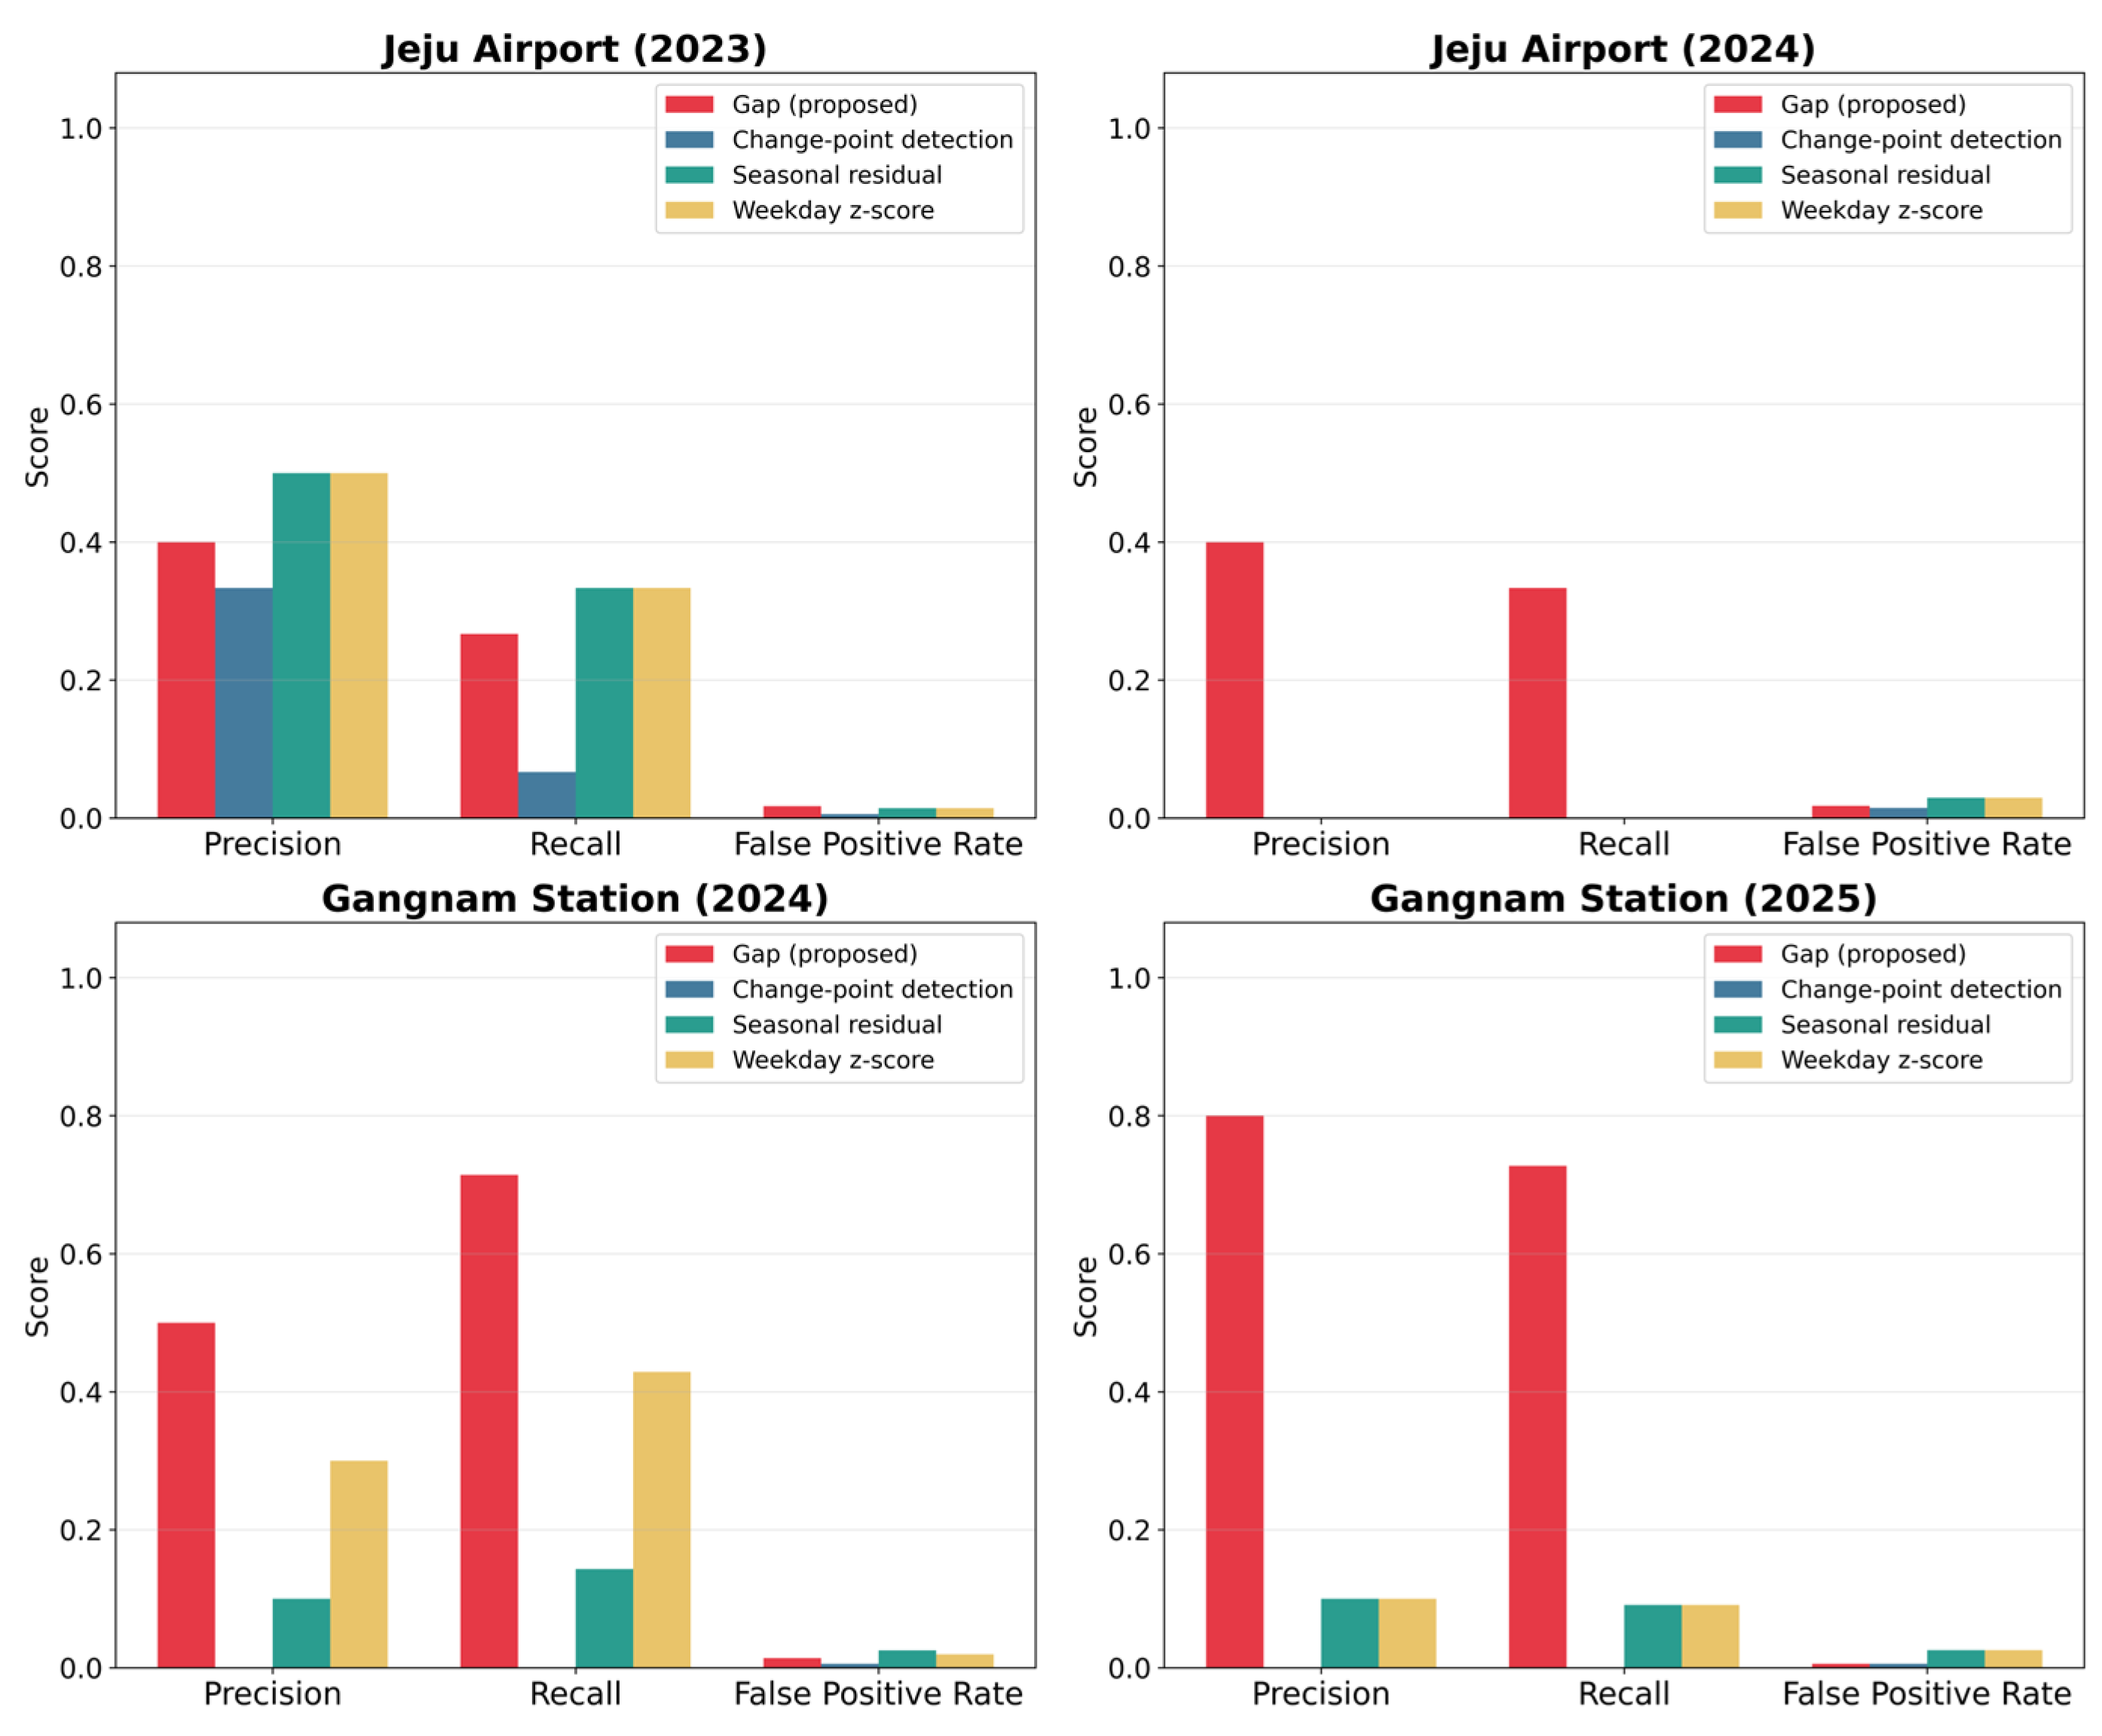
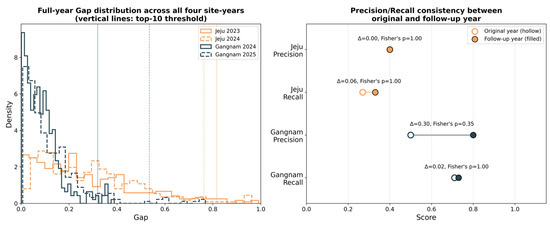
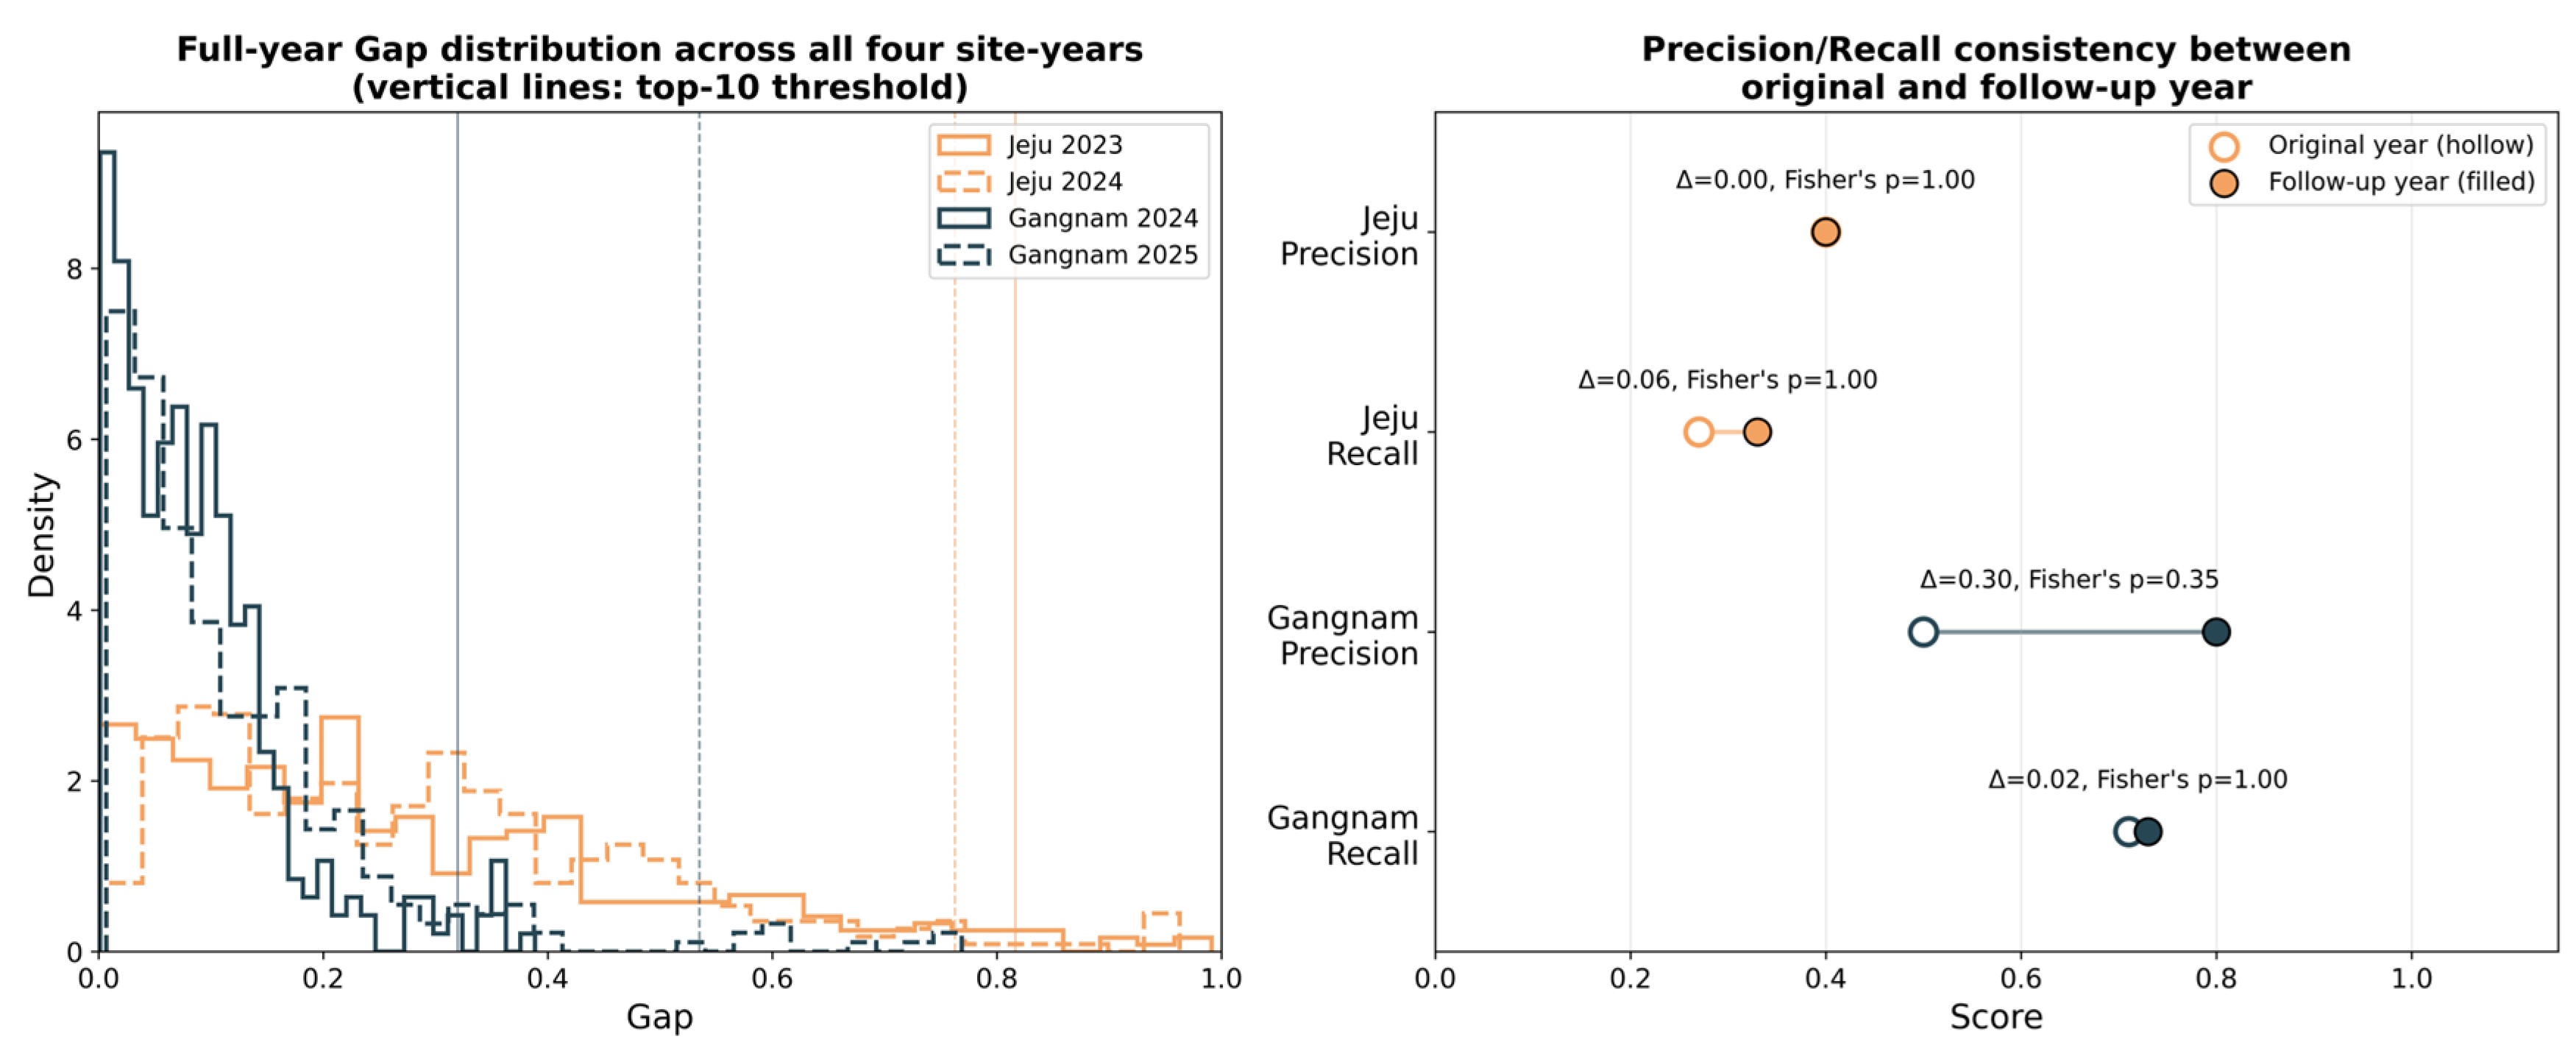
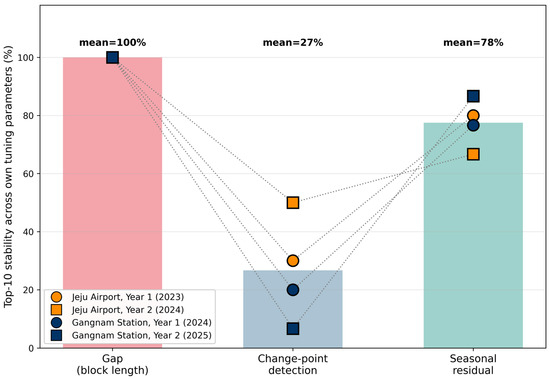
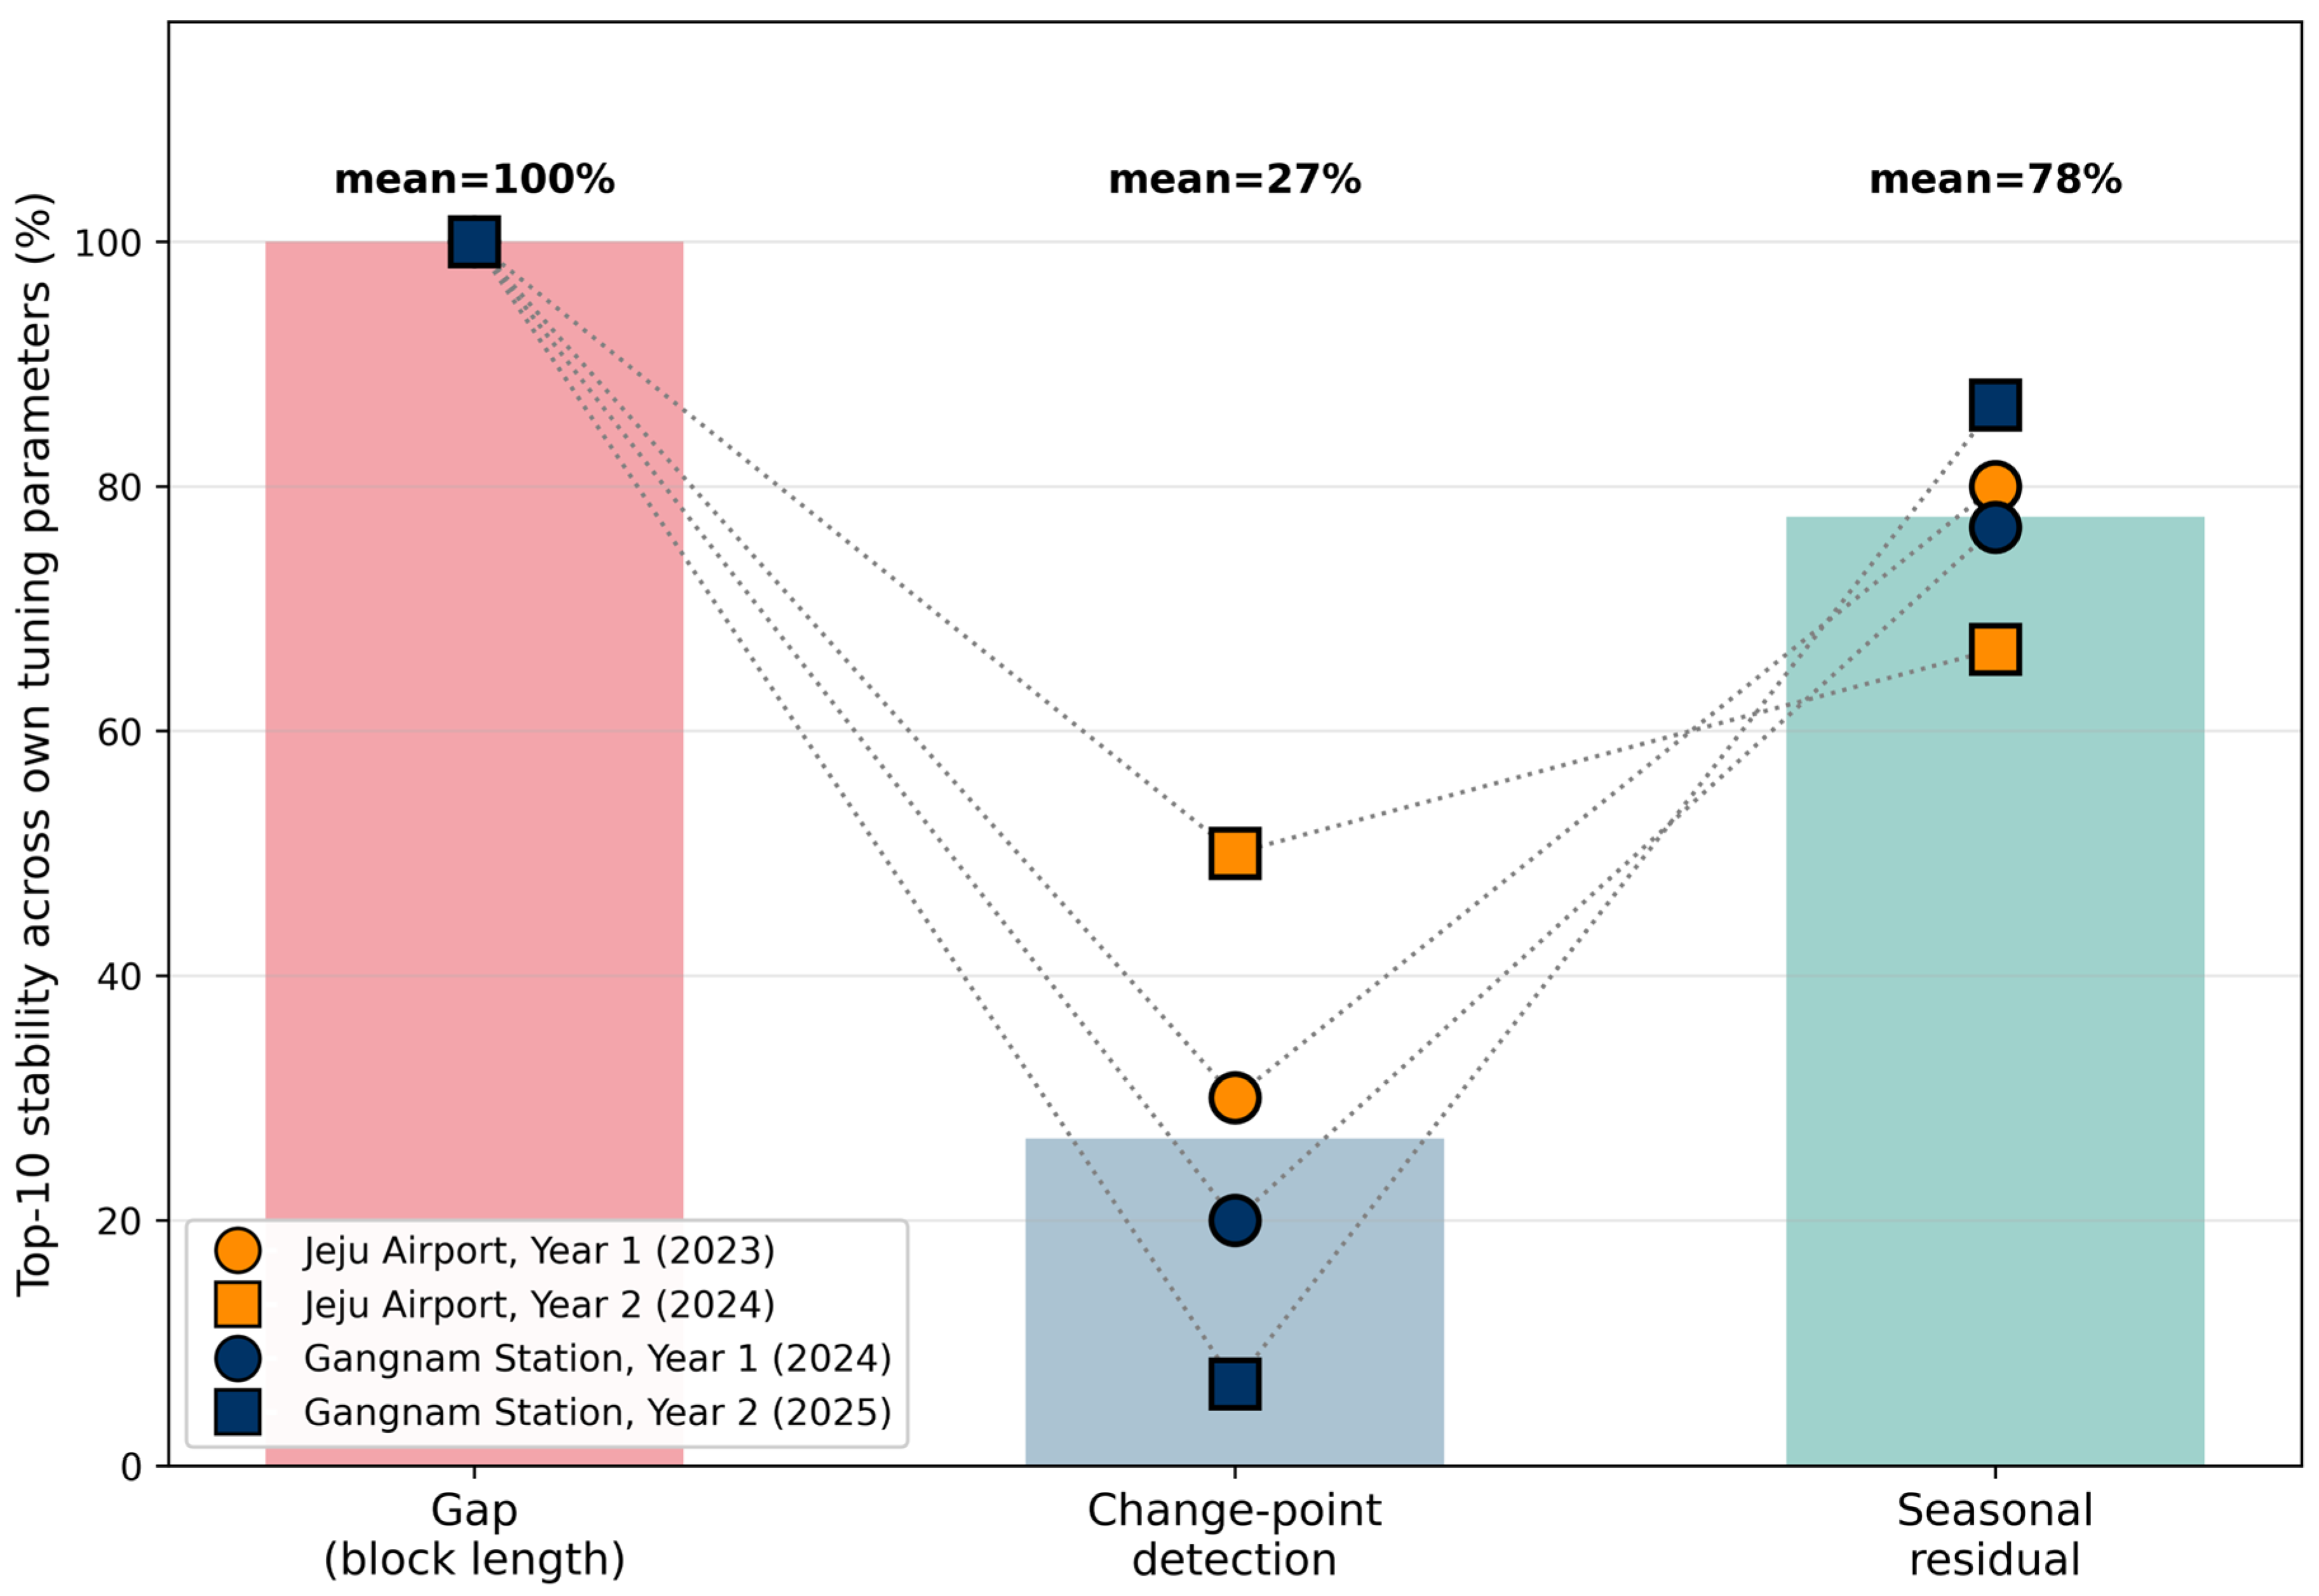
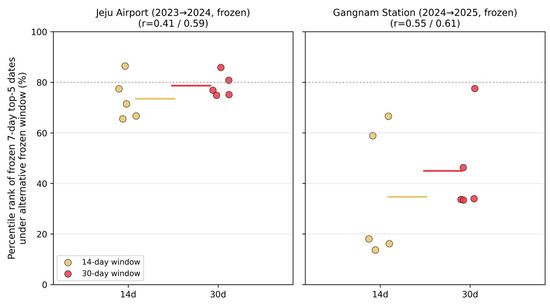
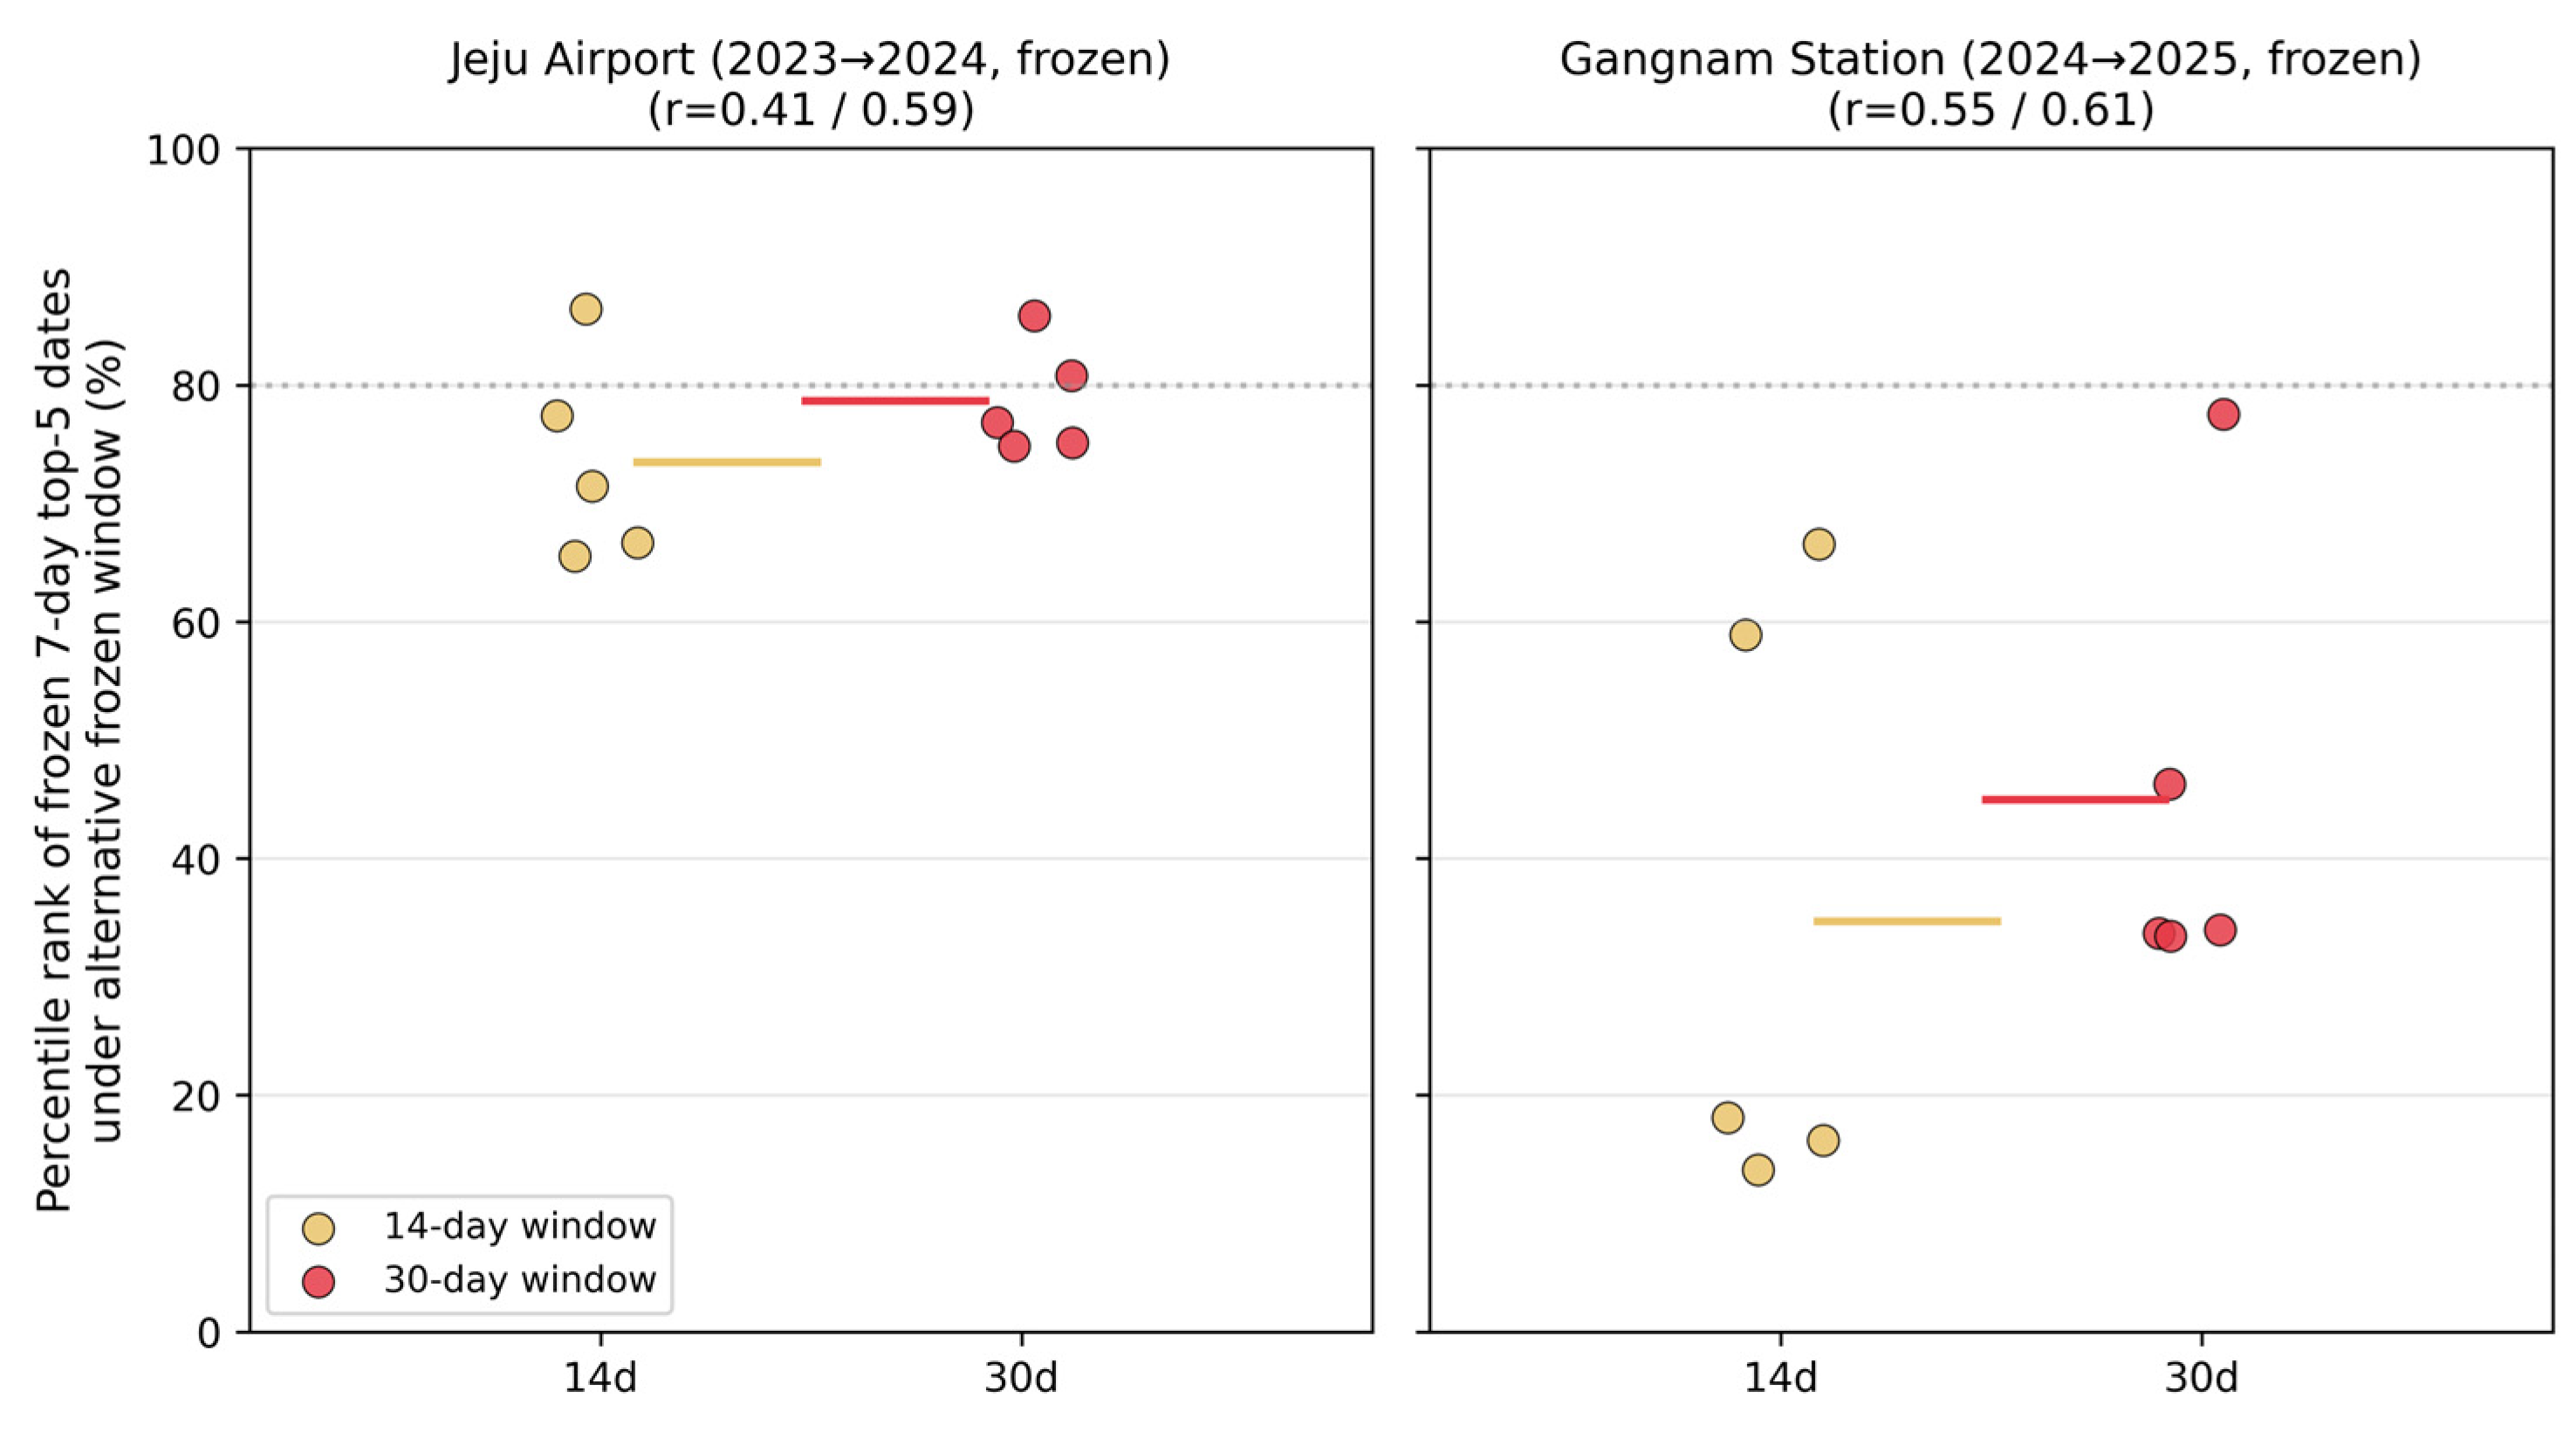

Disclaimer/Publisher’s Note: The statements, opinions and data contained in all publications are solely those of the individual author(s) and contributor(s) and not of MDPI and/or the editor(s). MDPI and/or the editor(s) disclaim responsibility for any injury to people or property resulting from any ideas, methods, instructions or products referred to in the content. |
© 2026 by the author. Licensee MDPI, Basel, Switzerland. This article is an open access article distributed under the terms and conditions of the Creative Commons Attribution (CC BY) license.