1. Introduction
Groundwater plays a crucial role in regulating streamflow and thermal regimes in mountain headwaters [
1]. In semiarid mountain regions, groundwater sustains baseflow during dry periods and buffers stream temperatures against short-term atmospheric forcing. Climate change is expected to alter these systems through earlier snowmelt, reduced snowpack persistence, and shifts in precipitation regimes, with consequent impacts on both hydrological and thermal dynamics [
2,
3].
Stream temperature is increasingly recognized as an integrated indicator of hydrological, climatic, and geomorphological processes, directly influencing biogeochemical cycling and habitat suitability for aquatic organisms [
4]. Because groundwater temperatures are generally more stable than surface runoff, groundwater inflows reduce diel and seasonal thermal variability and generate delayed thermal responses in streams [
5,
6]. These thermal patterns can therefore be used as natural tracers of groundwater–surface water interactions, allowing identification of groundwater contributions, flow paths, and subsurface residence times without the need for chemical tracers [
7,
8]. Studies comparing air and stream temperatures have shown that strong thermal coupling reflects dominant atmospheric control and shallow flow paths, whereas thermal decoupling indicates groundwater influence and longer subsurface residence times [
9]. Focused groundwater inflows may also create localized cold-water refugia that enhance ecosystem resilience in mountain streams [
4].
The spatial variability of stream thermal regimes is strongly controlled by geology, groundwater storage, and snow dynamics. Previous research [
10] have demonstrated that streams draining volcanic terrains exhibit lower thermal sensitivity to atmospheric forcing due to focused groundwater discharge, whereas sedimentary catchments tend to show stronger air–water thermal coupling. At the basin scale, snowpack persistence and groundwater storage regulate summer low flows and peak stream temperatures, particularly in mountain watersheds affected by drought and declining snow accumulation [
3]. In deglaciated basins, the progressive loss of glacial meltwater further increases the importance of groundwater and subsurface storage in controlling streamflow and thermal behavior [
11].
The Sierra Nevada mountain range (southern Spain) represents a distinctive example of Mediterranean high-mountain systems under semiarid conditions. Recent hydrogeological studies have improved the understanding of groundwater–surface water interactions through the investigation of careo channels, ancestral artificial recharge systems that enhance snowmelt infiltration and aquifer storage [
12,
13].
The Alhorí River basin, located in central Sierra Nevada, has previously been investigated using hydrogeochemical approaches, which indicate that approximately 53% of annual basin outflows correspond to groundwater contributions [
14]. The basin is fully deglaciated, with headwaters developed over glacial and periglacial deposits that promote snowmelt infiltration and groundwater recharge, whereas middle and lower reaches are dominated by weathered schists. Despite relatively low annual precipitation (~600 mm), the basin maintains perennial flow, highlighting the importance of subsurface storage and delayed groundwater release.
Previous hydrogeochemical and isotopic studies in the Alhorí catchment have highlighted the strong influence of altitude and groundwater–surface water interactions on water composition. In [
14] it is shown that groundwater exhibits a progressive enrichment in δ
18O with decreasing elevation compared with surface waters, suggesting the contribution of recharge occurring at different altitudes and the influence of subsurface circulation processes. The isotopic imprint of traditional careo channels has also been identified, reflecting their role in promoting managed aquifer recharge through the infiltration of surface water transported along mountain channels.
Against this background, long-term water temperature and discharge records provide an opportunity to refine the conceptual hydrogeological model of the system and evaluate the role of groundwater in regulating stream thermal dynamics. The main objective of this study is to characterize the hydrodynamics of a Mediterranean high-mountain stream using water temperature and discharge observations along an altitudinal gradient. Specifically, this study aims to: (a) develop an integrated conceptual hydrogeological model for the Alhorí River basin and (b) assess the influence of groundwater on the spatial and temporal variability of stream water temperature under current climatic conditions. By integrating multi-year air and water temperature records with discharge observations, this work contributes to the growing use of thermal signals as tracers of groundwater–surface water interactions and provides new insight into the functioning of deglaciated mountain catchments under future hydroclimatic changes worldwide. From a sustainability perspective, understanding the role of groundwater storage in maintaining streamflow and thermal stability is essential for assessing the resilience of mountain water resources and groundwater-dependent ecosystems under increasing hydroclimatic variability.
2. Study Site
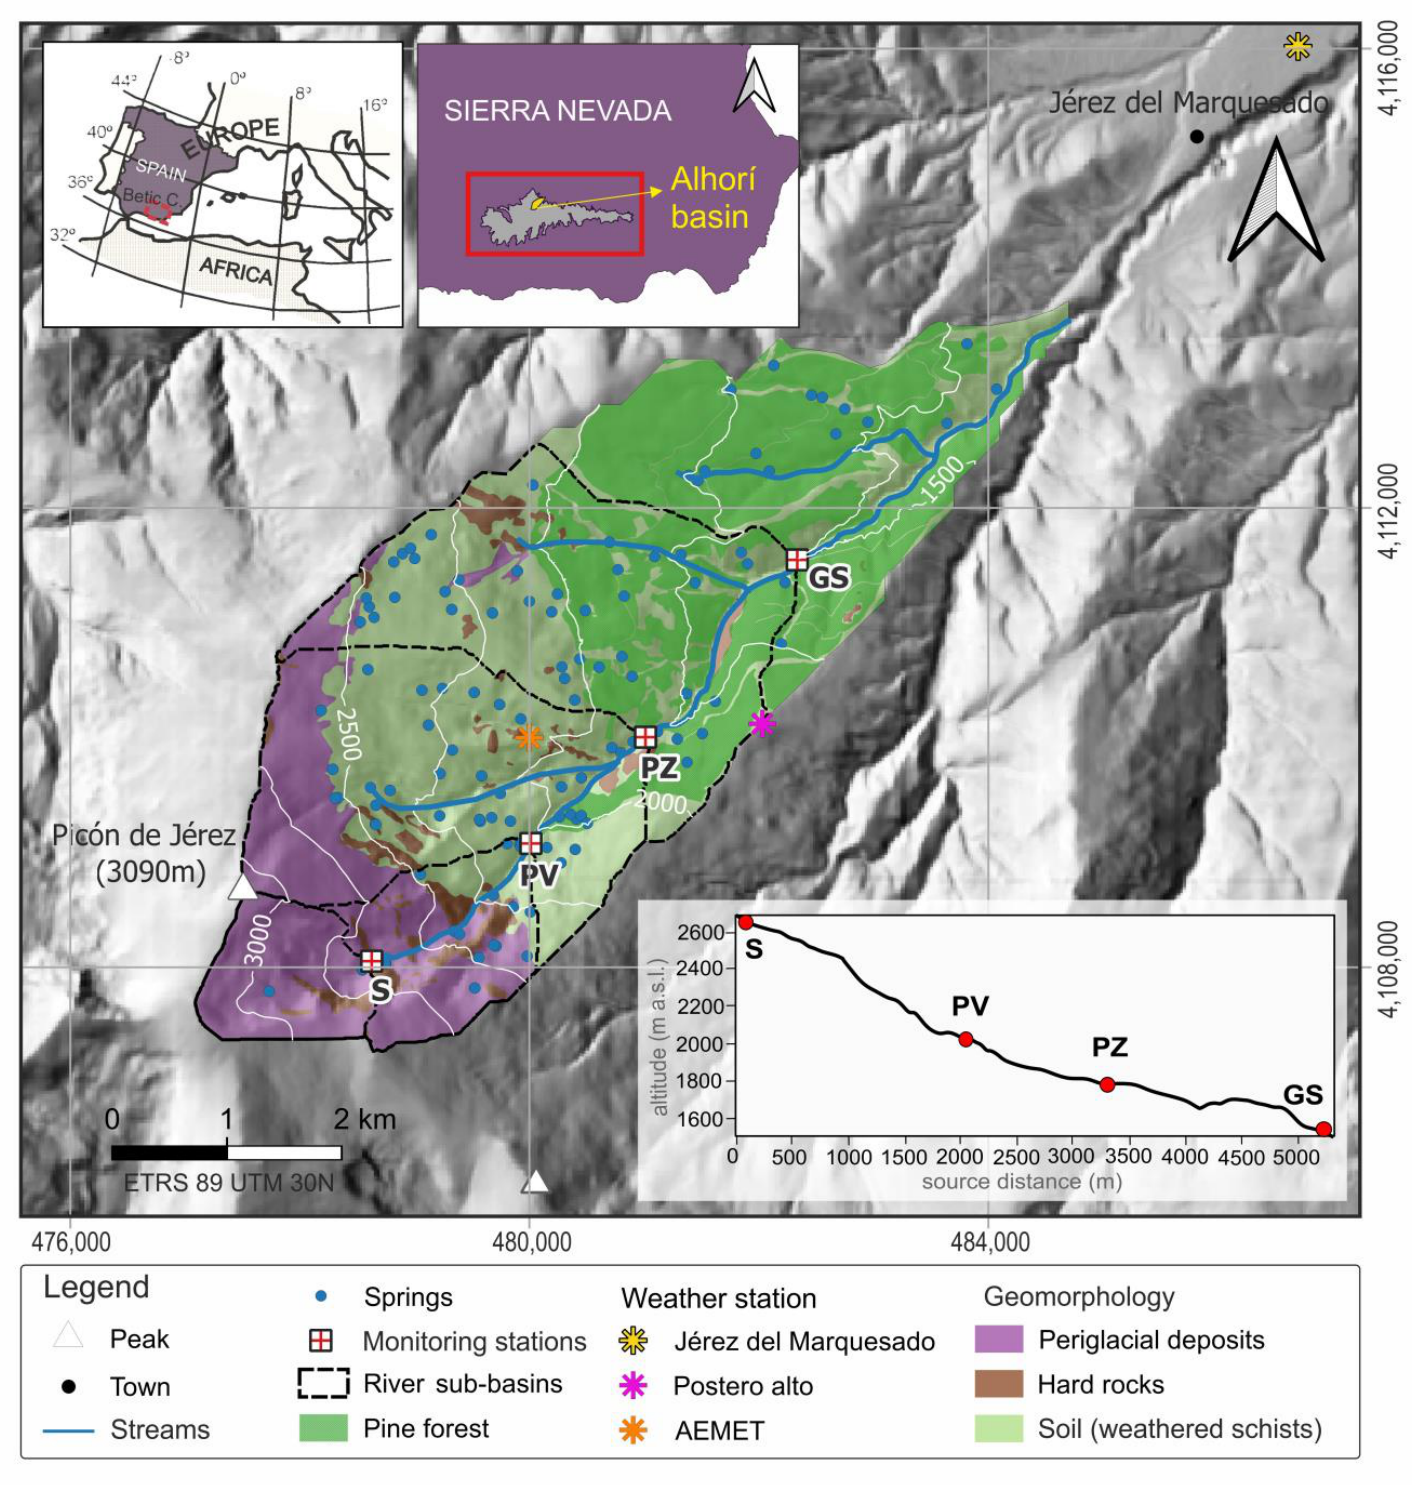
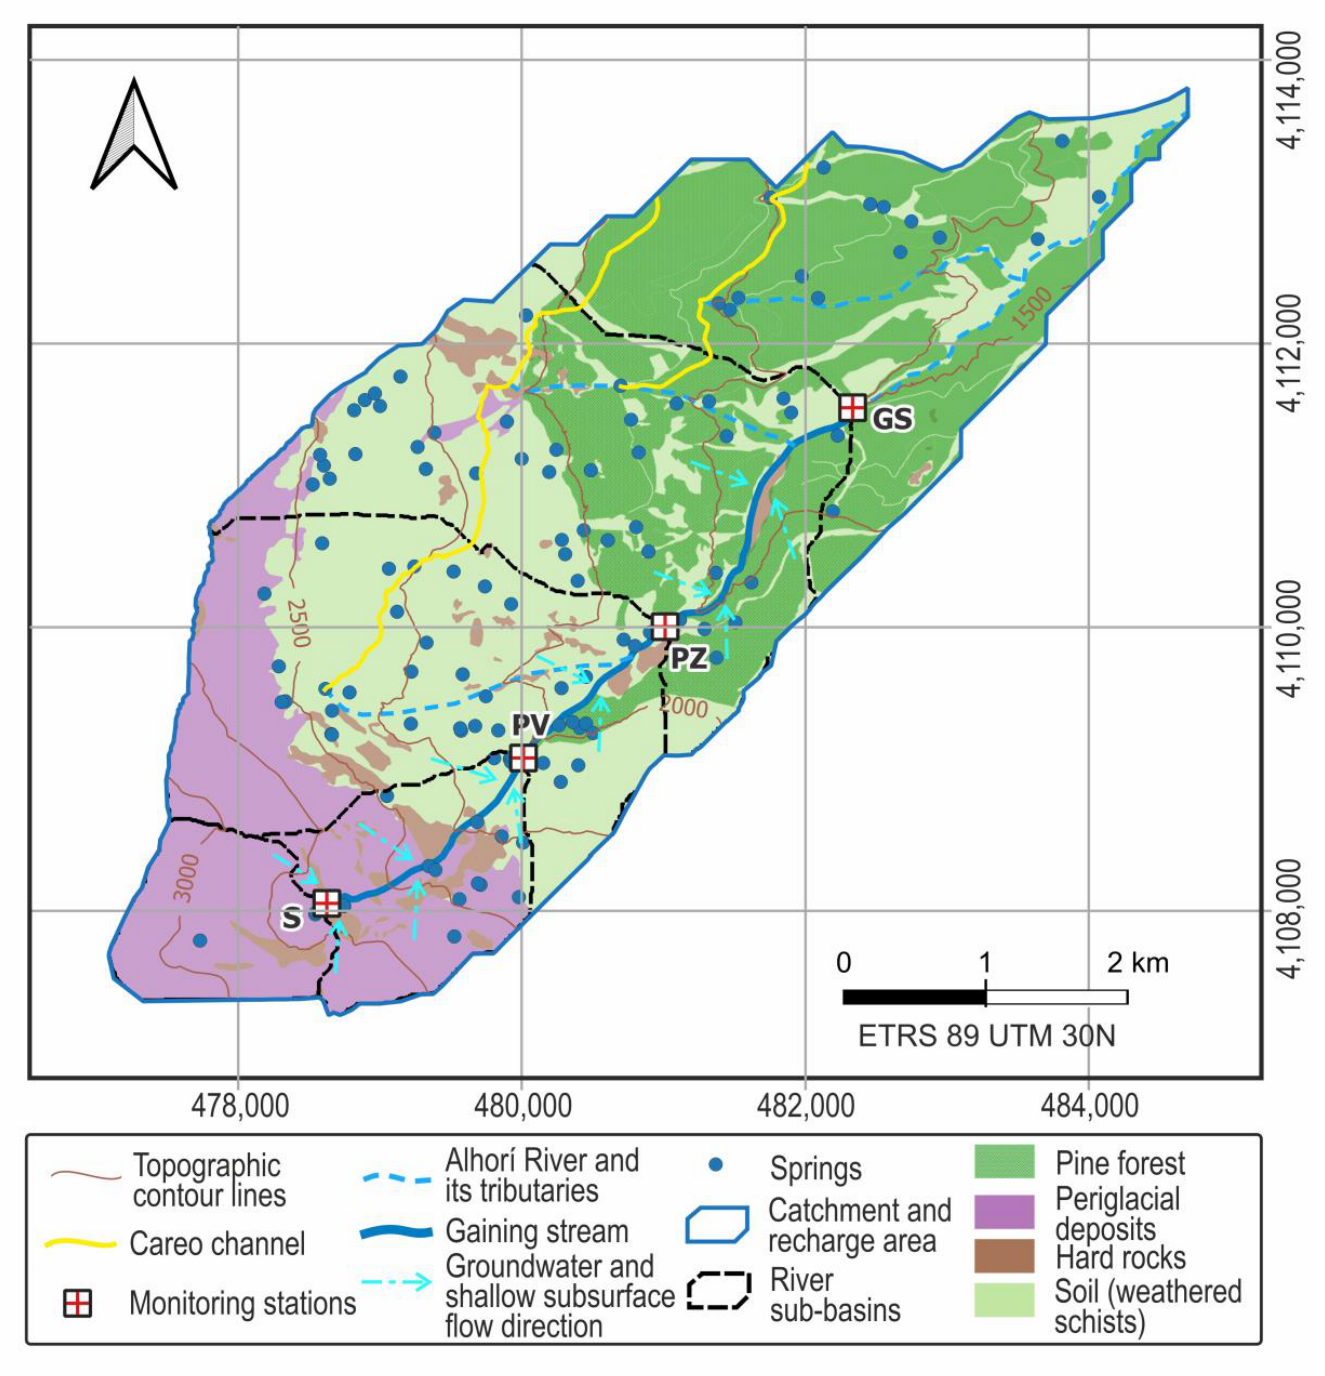
The Alhorí River basin is on the northern slope of central Sierra Nevada, in southern Spain (
Figure 1). Upstream of its confluence with the Alcázar River, the basin covers 24 km
2 and has a mean elevation of 1925 m a.s.l. The study area focuses on the sector of the hydrographic basin upstream of the Alhorí River gauging station (GS), whose surface occupies 17 km
2. Approximately 58% of the area lies between 1600 and 2400 m a.s.l., and 24% is above 2400 m a.s.l. The remaining 18% of the basin lies below 1600 m a.s.l. [
14]. No perennial or ephemeral tributaries discharge directly into the Alhorí River between the monitoring stations. The only ephemeral streams within the catchment (
Figure 1) flow exclusively during the snowmelt period in their headwaters and divert water into the traditional careo channels system at high elevations [
15], where it infiltrates and recharges the shallow aquifer rather than contributing directly to streamflow. Consequently, water derived from snowmelt is redistributed through subsurface flow paths and subsequently reaches the Alhorí River as diffuse lateral groundwater inflow and hypodermic flow.
From a climatological point of view, the area has a cold climate, with mild and cold dry summers, together with significant altitudinal and thermal variations [
12] following the classification of Köppen–Geiger [
16] as Continental with Mediterranean influence climate. According to the SARAI climatic data set [
17], the mean temperature at the AEMET-207 meteorological station, for the last 25 years, is 5.82 °C, and the mean annual precipitation is 549 mm/year. The orographic factor for the precipitation is around 18.3 mm/100 m.
Vegetation within the basin is distributed along distinct altitudinal zones. Areas below 2000 m a.s.l. have been significantly modified by human activity conducted over the last century [
18]. Although holm oak forests (
Quercus ilex subsp.
rotundifolia) historically occupied much of the Sierra Nevada slopes up to this elevation, extensive reforestation programs with species of the genus Pinus (
sylvestris, pinaster and
halepensis) were carried out during the twentieth century. Above 2000 m a.s.l., vegetation is dominated by high-mountain grasslands together with shrub and rocky plant communities, which are characteristic of alpine environments, such as broom shrubland or creeping juniper. The high mountain grasslands, locally called borreguiles, are humid alpine meadows linked to groundwater discharge that form after snowmelt in the Sierra Nevada mountains. They play an important ecological role by regulating water, contributing to the recharge of groundwater through infiltration [
2,
15]. Over 2500 m a.s.l., vegetation is very sparse.
From a geomorphological perspective, the study area preserves clear evidence of glacial modeling associated with the cold phases of the Quaternary [
19]. During these periods, snow accumulation in the high mountain sector led to glacier formation, whose erosive activity shaped the relief and generated the semicircular depression currently recognized as the Alhorí glacial cirque [
20]. Periglacial processes, particularly frost weathering, also contributed significantly to the production of detrital material that now forms part of the cirque substrate. At the source of the Alhorí River, several deposits and landforms provide additional evidence of former glaciation, including moraines, polished and steepened rock surfaces aligned with ice flow, and rocky thresholds associated with the advance of the glacier tongue [
20].
The bedrock on which the Alhorí basin is located is fundamentally made up of mica schists of varied composition and quartzites, so edaphic processes have influenced the development of Regosols. The schists behave as hard rocks with very low primary porosity, but weathering and fracturing processes have generated secondary permeability that enables groundwater storage and flow [
14]. In addition, glacial and periglacial processes produced highly permeable moraine deposits, while chemical weathering and rock fragmentation promoted the development of a permeable alteration layer within the metamorphic substrate, as also occurs in other alpine aquifers worldwide [
21]. The Alhorí watershed aquifer is a hydrogeological system composed of two main units: (i) the weathered zone of the schists from the metamorphic core of Sierra Nevada and (ii) overlying glacial and periglacial deposits. Although its average thickness is unknown, maximum depths of 30–50 m have been estimated [
22].
The basin water balance is driven by water inflows from rainfall and snowmelt, and by water outflows through evapotranspiration and stream discharge from the Alhorí River. Groundwater recharge of the Alhorí aquifer occurs through two main mechanisms: distributed natural infiltration of precipitation and managed recharge associated with the alpine meadows and traditional careo channels. Precipitation, both as snowfall and rainfall, infiltrates throughout the basin, as alpine aquifers and weathered metamorphic rocks are exposed at the surface. Where precipitation reaches the few outcrops of unweathered schist, it runs off over these relatively impermeable surfaces and eventually infiltrates into the permeable materials located downstream. Part of the infiltrated water percolates vertically, contributing to aquifer recharge, while another fraction moves laterally as interflow and emerges downslope through springs. A total of 111 springs have been inventoried (6 springs/km
2), with a mean discharge flow and temperature of 0.9 L/s and 8.16 °C, respectively [
14]. Ultimately, groundwater discharge constitutes an important contribution to the total outflow of the Alhorí River basin [
14].
The mean discharge flow rate of the Alhorí River, measured at the homonymous Gauging Station (GS) during the last 20 years is 8.5 hm
3/year (476 mm/year). The river exhibits a pluvio-nival discharge regime dominated by snowmelt. Seasonally speaking, the maximum river discharge occurs in June after snowmelt begins in March, then gradually decreases, dropping below 0.5 mm/day by October. Flow remains relatively stable between November and March (~0.8 mm/day), indicating a strong and persistent groundwater contribution, which accounts for at least 61% of total runoff [
14].
4. Results
4.1. Analysis of Hydrometeorological Data
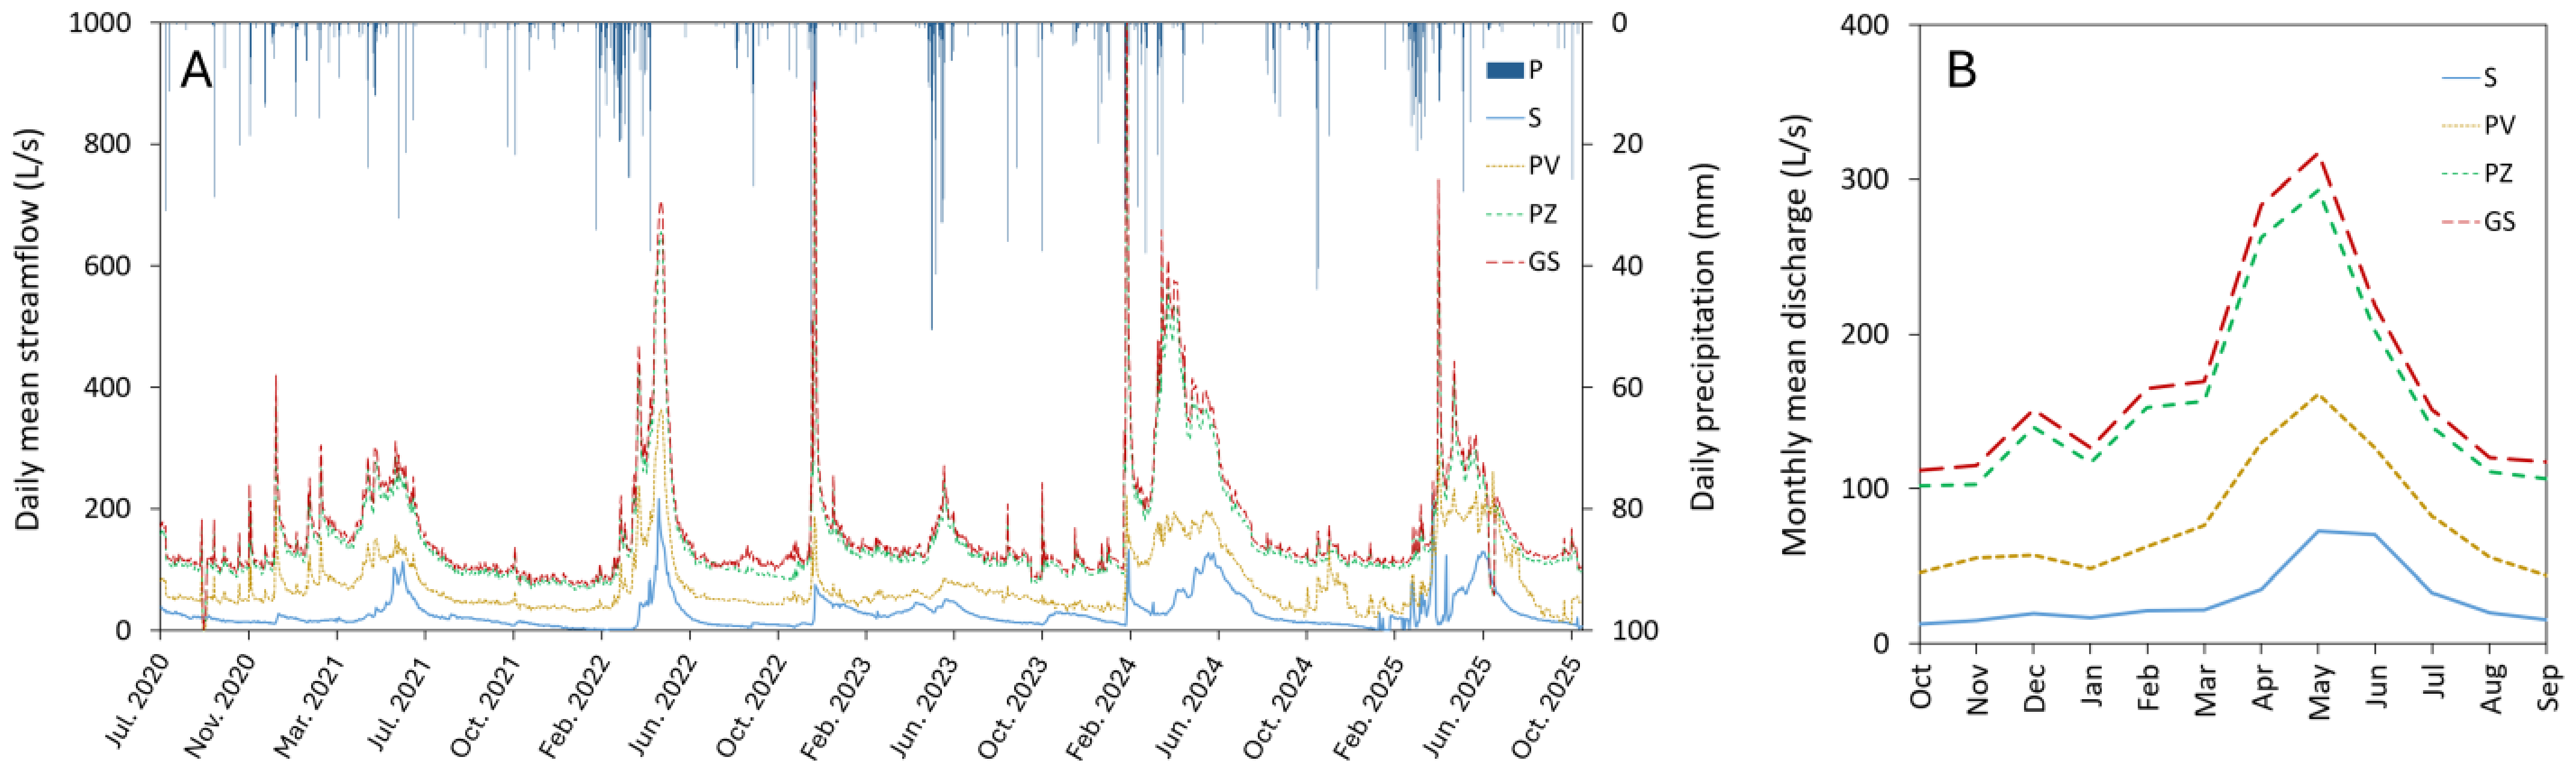
Annual precipitation was below average during the monitored period. In the hydrological year 2020–2021 it was 346 mm. This value increased to 413 mm in 2021–2022, reflecting wetter conditions across all stations. In 2022–2023, the mean precipitation increased to about 462 mm. A pronounced increase was observed in 2023–2024, with precipitation reaching 517 mm, making it the wettest year of the period. Finally, in 2024–2025, the mean precipitation was 436 mm. At a finer temporal scale, river discharge closely follows variations in precipitation (
Figure 2A). As shown, discharge increases as the elevation of the control point decreases.
From a seasonal perspective, river discharge at the control points exhibits a snowmelt-dominated regime (
Figure 2B), with peak flows occurring during the spring snowmelt period. In May, snowmelt generates a mean discharge of 300 L/s at the lowermost control point (GS). However, daily discharge at the same control point exceeds 700 L/s during May in most observed hydrological years.
Snowfall at high elevations, identified by subzero air temperatures, plays a key role in regulating discharge timing and magnitude. At the basin scale, minimum and maximum flows, observed in all the control points, consistently coincide with winter low flow conditions and spring snowmelt peaks, respectively.
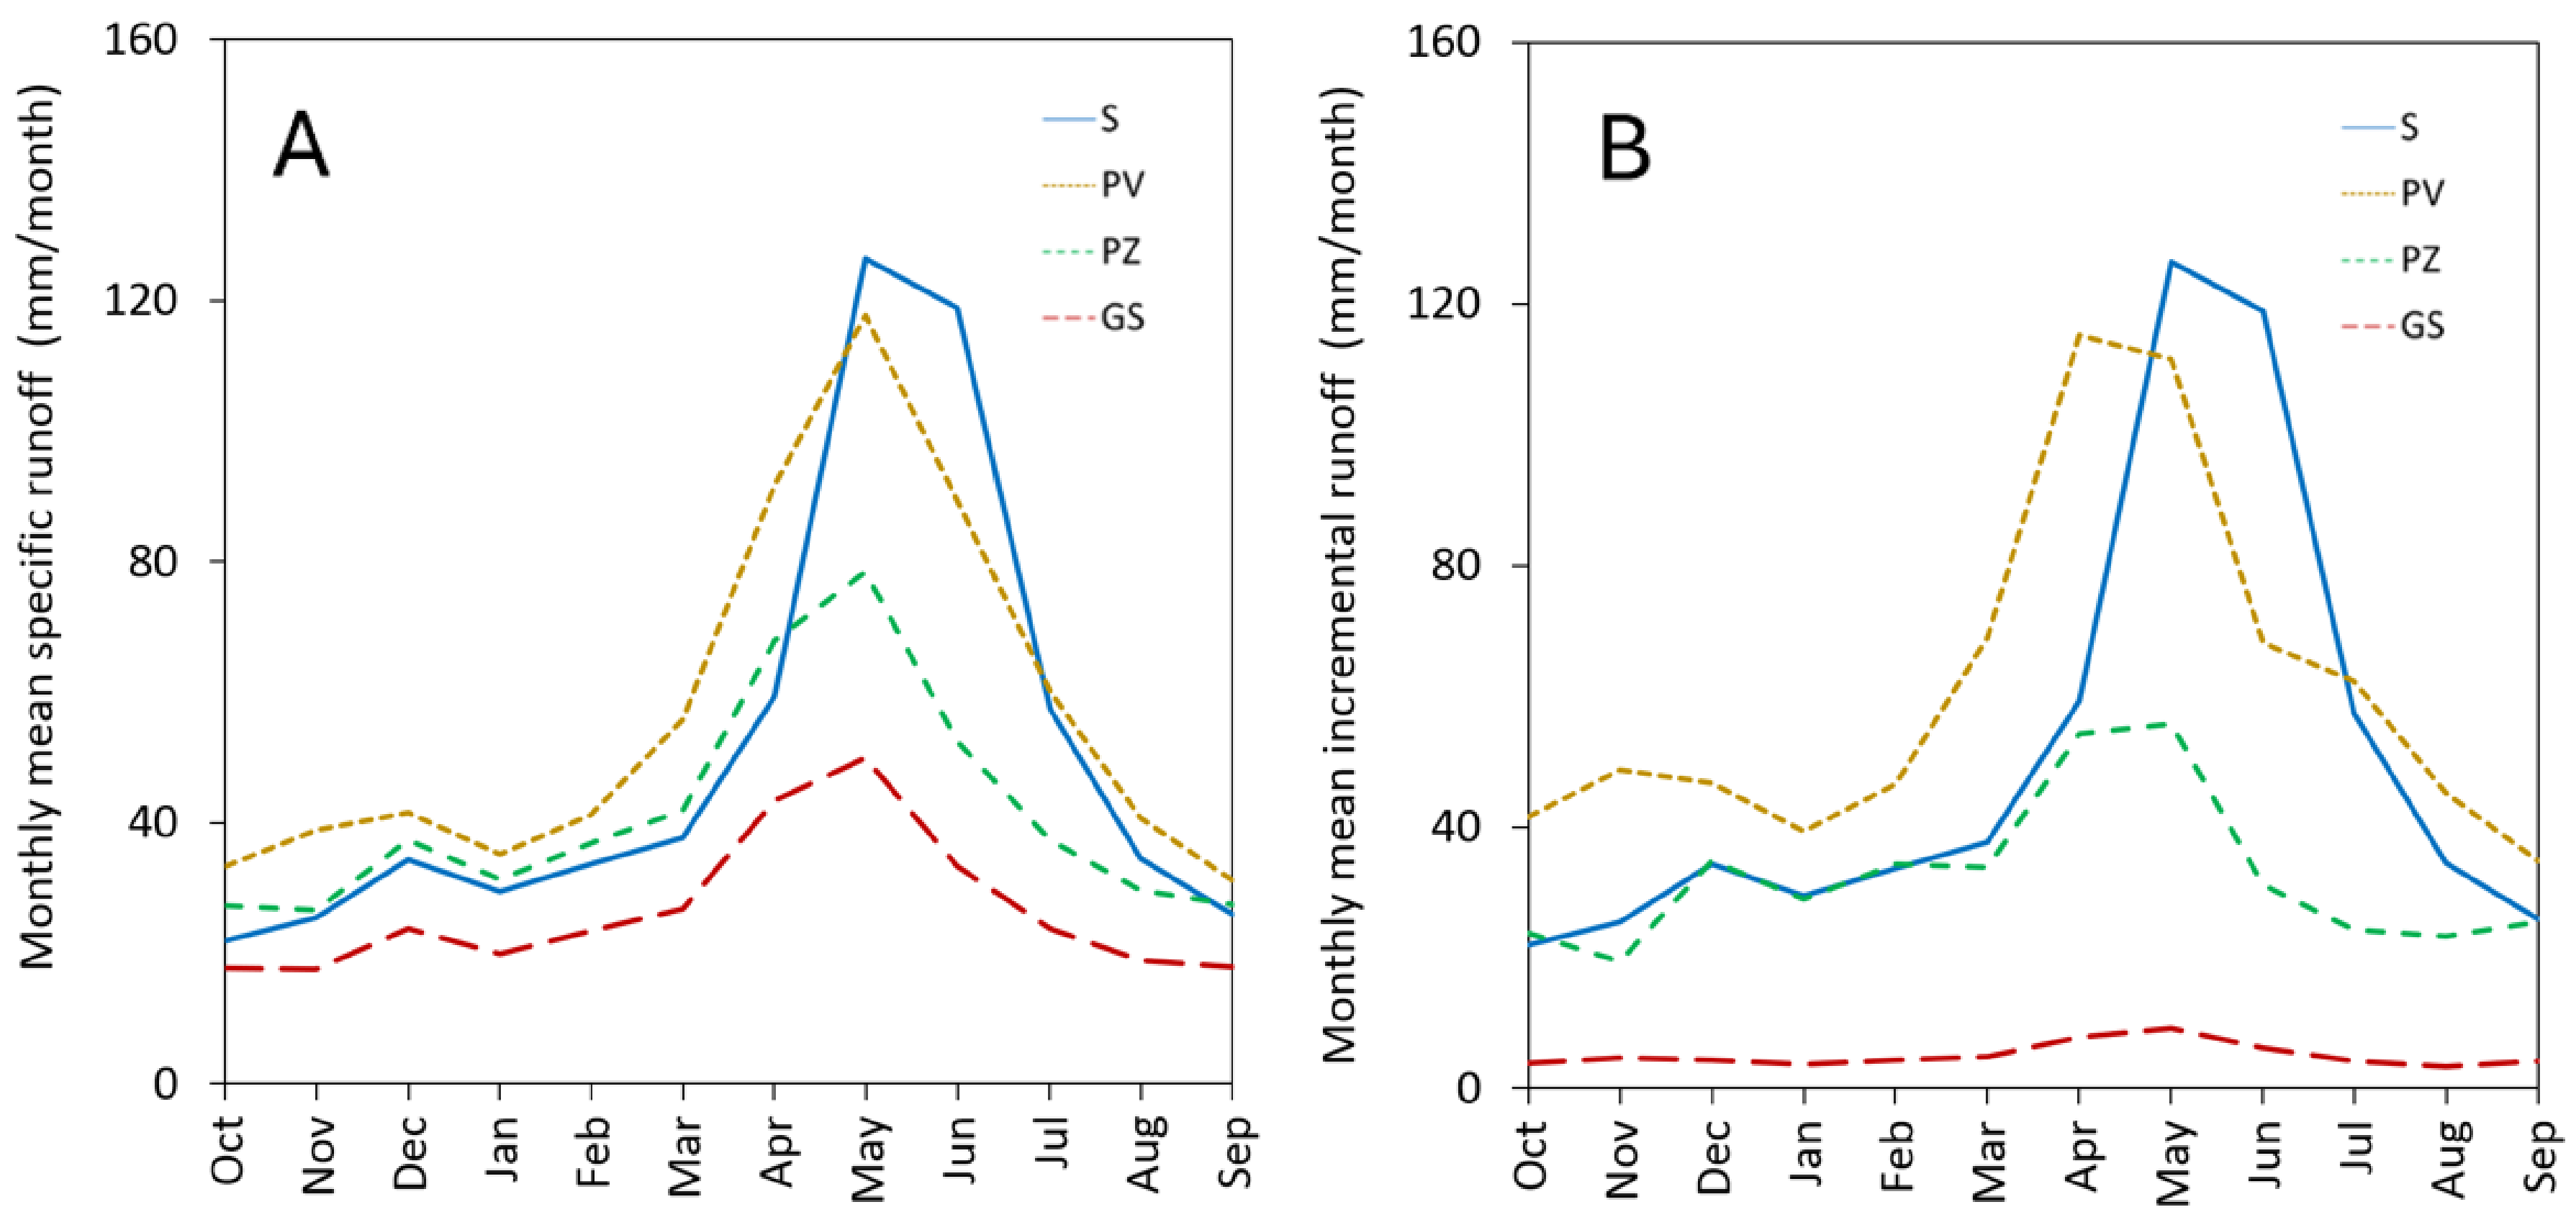
The specific runoff (
Figure 3A) provides additional insight into the hydrological behavior of the basin. The mean annual specific runoff values at control points S, PV, PZ, and GS are 605, 677, 495, and 317 mm/yr, respectively. It is noteworthy that, despite being located at a lower elevation, discharge at point PV exceeds that at point S. Although both control points drain areas dominated by periglacial materials, this behavior suggests that the spring forming the headwaters of the Alhorí River may not capture the entire meteoric input from the upstream catchment. A fraction of the water may bypass the spring through lateral surface or subsurface flow paths and subsequently emerge downstream, contributing to the higher discharge observed at control point PV. In contrast, specific runoff at the lower-elevation control points PZ and GS is the lowest within the basin. This pattern may be partly related to the presence of pine forests distributed across the catchment, from its lower reaches to the area immediately downstream of control point PV. Forest cover decreases progressively with elevation and is absent upstream of PV (
Figure 1), which may contribute to enhanced evapotranspiration losses in the lower sectors of the basin. Although evapotranspiration was not directly quantified in this study, these potential losses may contribute to the lower specific runoff observed at PZ and GS.
In general, the magnitude of the seasonal runoff peak increases with elevation. Furthermore, unlike the lower-elevation control points, the highest control point (S) still exhibits high specific runoff values in June. This behavior is attributed to prolonged snowmelt during late spring under the alpine climatic conditions prevailing in the upper Alhorí basin, which allow the snowpack to persist into early summer. In contrast, low flows, which are typically sustained by baseflow, do not vary substantially among the different control points. Nevertheless, control point PV exhibits higher low-flow values. This difference is related to the characteristics of the periglacial materials distributed across the slopes draining to these two control points (
Figure 1). These materials appear to provide greater water-storage capacity and lower drainage efficiency at lower elevations, thereby sustaining higher baseflow contributions during periods of low flow.
The mean annual incremental runoff values at control points S, PV, PZ, and GS are 605, 729, 389, and 61 mm/yr, respectively. The corresponding monthly discharge, drainage area, specific runoff, and incremental runoff values for each control point are provided in
Table S2.
Figure 3B illustrates the seasonal variability of incremental runoff at different control points. The results reinforce the patterns identified from specific runoff. The lower runoff values observed in the downstream sector coincide with areas of greater pine forest cover, although the relative contribution of forest evapotranspiration was not quantified in this study. While the sectors draining S, PV, and PZ generate relatively high incremental runoff, the basin area contributing exclusively to control point GS exhibits substantially lower values. This pattern is consistent with a possible contribution of evapotranspiration losses in the pine-covered lower catchment.
With respect to the air temperature data, at most stations, the mean air temperature approximately matches the median, indicating a symmetric distribution. However, the air temperature recorded at the Alhorí Spring shows a slight asymmetry, with the mean value exceeding the median. This asymmetry may be attributable to periods when snow cover affected the sensor, causing recorded temperatures to remain close to 0 °C while actual air temperatures may have been lower, slightly inflating the mean value of the series (
Table 3).
Consistent with this pattern, the descriptive statistics show broadly similar central tendencies across stations, with mean temperatures ranging from about 6.8 °C at the Alhorí Spring (~2600 m) to 14.5 °C at the lowest site (~1200 m), with medians closely aligned with these values. This vertical thermal gradient reflects the expected inverse relationship between air temperature and altitude. Minimum temperatures are generally below 0 °C at higher-elevation stations, while lower sites reach values about 30 °C at the lowest station. Variability is moderate across sites (SD ≈ 5.7–7.7 °C). Differences among stations may be related to altitude and differences in solar radiation exposure. Mean air temperature showed an inverse relationship with elevation (R2 = 0.85), yielding an altitudinal lapse rate of −0.54 °C per 100 m (95% CI: −1.23 to 0.15 °C per 100 m) using the synchronized common monitoring period (15 July 2020–31 December 2022).
4.2. Thermal Behavior of the Alhorí Spring
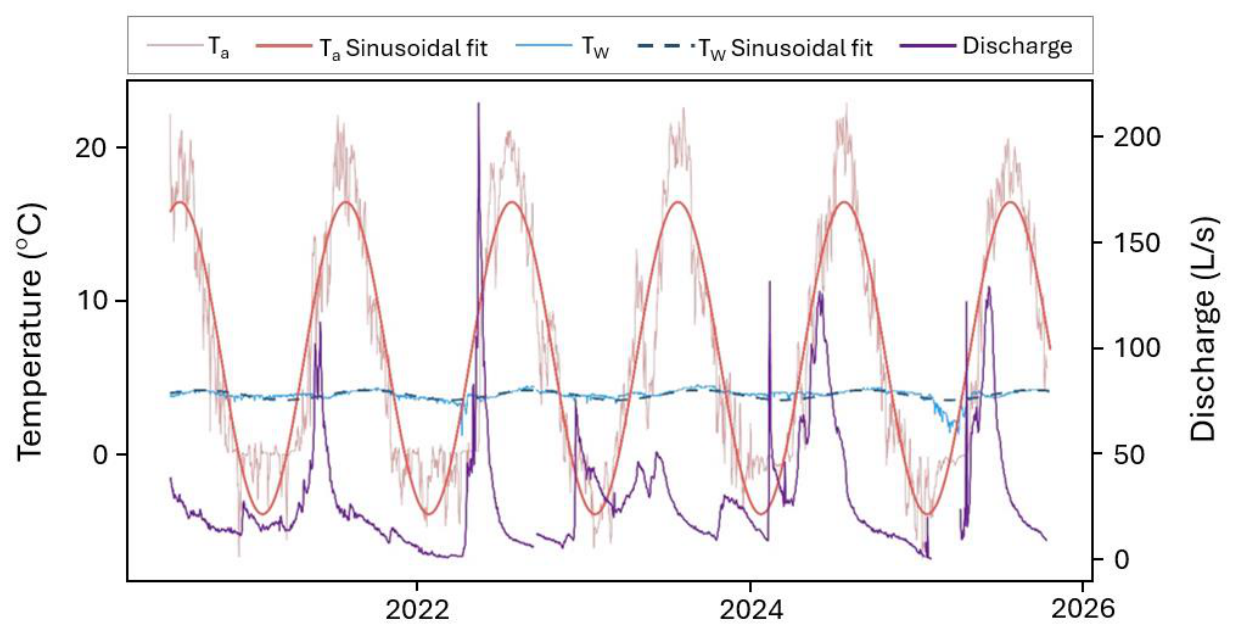
There is a substantial difference between the mean air temperature (
) at the Alhorí spring (~6.8 °C) and the mean spring water temperature (
) (~3.95 °C), as shown in
Figure 4, which indicates that local atmospheric conditions at the discharge point do not control the thermal signal of the spring.
Air temperature exhibits strong seasonality, with an intra-annual thermal amplitude of approximately 10 °C, whereas the spring water temperature shows a much lower amplitude of about 0.3 °C (
Figure 4).
Annual sinusoidal models captured the seasonal thermal signal of both air and spring water, with RMSE values of 2.85 °C and 0.30 °C, respectively. The fitted curves allowed the quantification of a thermal lag of approximately 49 days between the atmospheric signal and the spring response. This indicates that the thermal signal is not transmitted instantaneously from the air to the discharge point but shows an estimated delay of 48.7 ± 1.98 days (95% confidence interval, p < 0.001).
As illustrated in
Figure 4, the air temperature shows pronounced seasonal oscillations that are well captured by a sinusoidal fit, while the spring water temperature remains nearly constant throughout the year, with only minor fluctuations. Both sinusoidal fits reflect the delayed transmission of the seasonal thermal signal within the aquifer, consistent with thermal buffering. Additionally, spring discharge exhibits episodic peaks that appear decoupled from short-term atmospheric temperature variations, further supporting the interpretation of a buffered groundwater system dominated by internal storage and delayed recharge processes.
The monthly distribution of mean spring discharge exhibits clear maximum values between May and June, reaching approximately 70 L/s (
Figure 4). Discharge increases sharply from early spring (around 30 L/s in April) to its annual peak in late spring, followed by a rapid decline during summer. Minimum mean discharges are observed in early autumn, with values of approximately 16 L/s between September and October, before gradually increasing again towards winter (around 22 L/s).
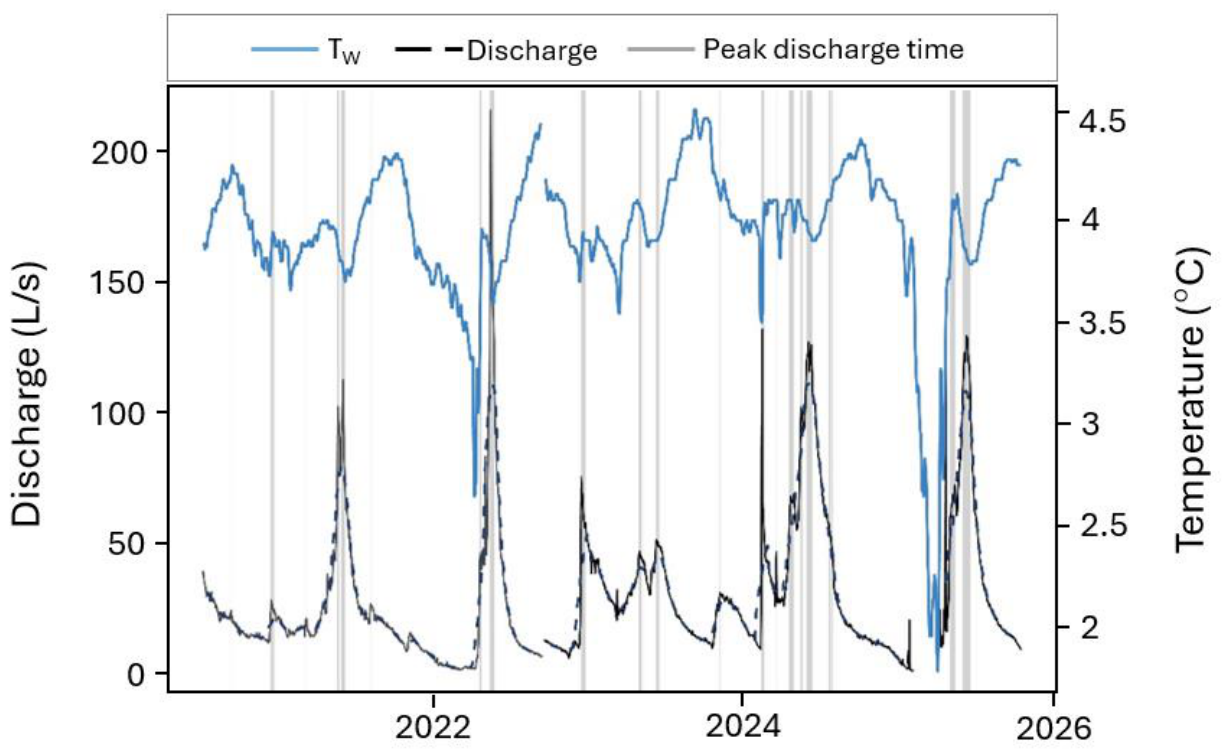
In addition, an inverse relationship between spring water temperature and discharge is observed (
Figure 5), with the highest discharges coinciding with periods of relatively lower spring temperatures. The mean temperature during baseflow conditions is approximately 4.0 °C, whereas the mean spring water temperature during peak discharge events is slightly lower, around 3.9 °C. Mean spring water temperature during the snowmelt period was approximately 0.14 °C lower than during the rest of the year. Although this difference was consistently observed, its magnitude is of the same order as the stated sensor accuracy, which limits the strength of its interpretation. The recurrent seasonal pattern is consistent with, but does not independently demonstrate, the contribution of colder snowmelt recharge. This effect can also be observed in
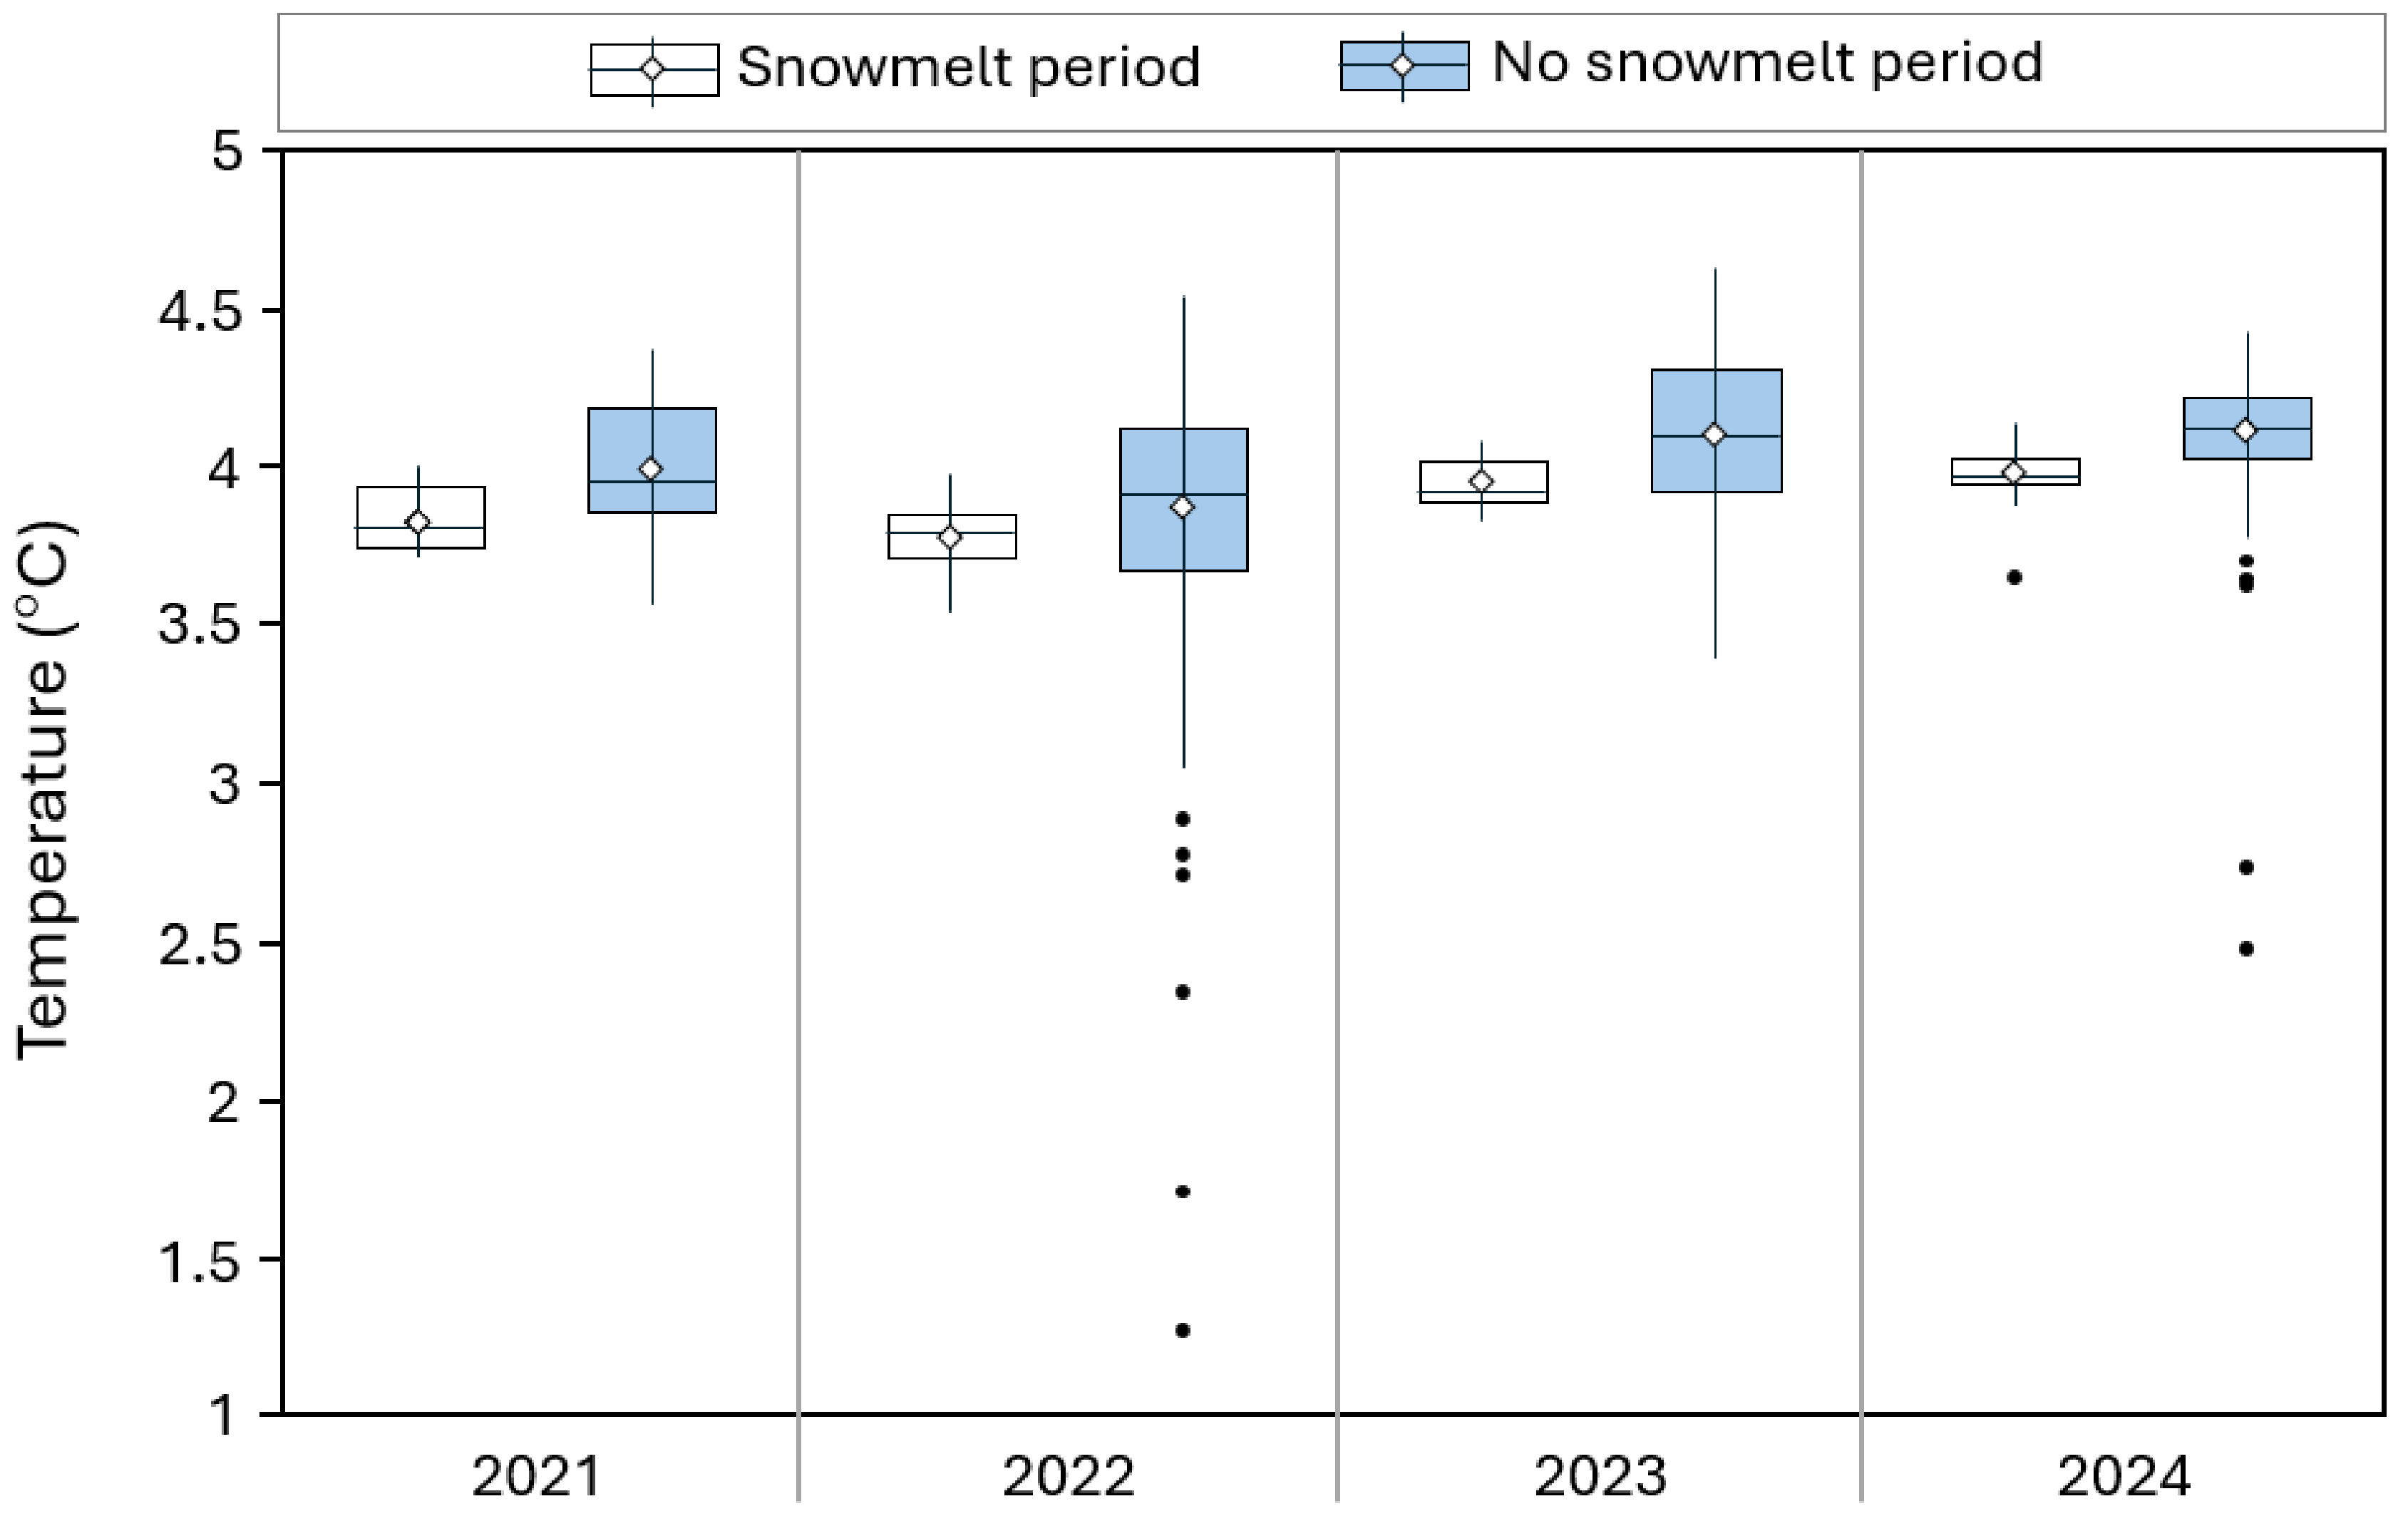
Figure 6, where it is compared with spring water temperatures during snowmelt periods and during the rest of the hydrological year for the period 2021 to 2024, highlighting both interannual consistency and seasonal differences. Across all years, spring water temperature remains remarkably stable, with median values generally clustered around 3.8–4.1 °C. Although the temperature difference is small, its recurrent occurrence during the monitoring period is consistent with the contribution of colder snowmelt recharge to the aquifer, although its magnitude remains within the range of instrumental uncertainty.
The time series indicates that discharge peaks can reach values on the order of 100–130 L/s, while baseflow conditions are generally characterized by much lower discharges, commonly below 20–30 L/s. Despite these pronounced hydrological fluctuations, the spring water temperature remains within a narrow range, typically between approximately 3.7 and 4.2 °C, even during the largest flow events.
This pattern is further illustrated by the boxplots (
Figure 6), which show a slightly lower median spring water temperature during the snowmelt period (May–June) compared to the rest of the year, as well as a broader dispersion of temperatures outside the snowmelt period. Minimum spring water temperatures below 3 °C are uncommon and occur almost exclusively outside the snowmelt period, mainly during February to April. These low-temperature outliers coincide with air temperatures close to 0 °C and, in some cases, with sharp increases in spring discharge. In contrast, during the snowmelt period, the temperature distribution is considerably narrower, with no temperatures below 3 °C.
These low-temperature outliers are not systematically observed but are mainly concentrated in two episodes, in 2022 and, to a lesser extent, in 2024. Apart from these isolated events, interannual variability is limited. In 2021 and 2023, median spring water temperatures during the snowmelt period are close to 3.8–3.9 °C, while slightly higher median temperatures (around 4.0–4.1 °C) are observed during non-snowmelt periods. In 2022, temperature distribution during the rest of the year is noticeably wider, with most low-temperature outliers (<3 °C) occurring during this year. In 2024, the contrast between snowmelt and no-snowmelt periods persists, although overall temperatures remain slightly higher, with medians above 4.0 °C.
The presence of outliers, particularly during non-snowmelt periods, contrasts with the relatively compact distributions observed during snowmelt. This suggests that, despite the colder recharge, the aquifer effectively mixes and buffers meltwater inputs, limiting their impact on the thermal signal at the spring.
4.3. Water Temperature Data Along the Flow Path
The mean water temperature at the source of the Alhorí River (S) (
Table 4) is markedly lower than would be expected if the river were already in thermal equilibrium with the local air temperature at that location (
Table 3). Based on the altitudinal air temperature gradient, the mean air temperature at the Gauging Station exceeds 12 °C.
If one assumes that atmospheric temperature is the only factor controlling stream temperature, it is possible to estimate a theoretical stream temperature (
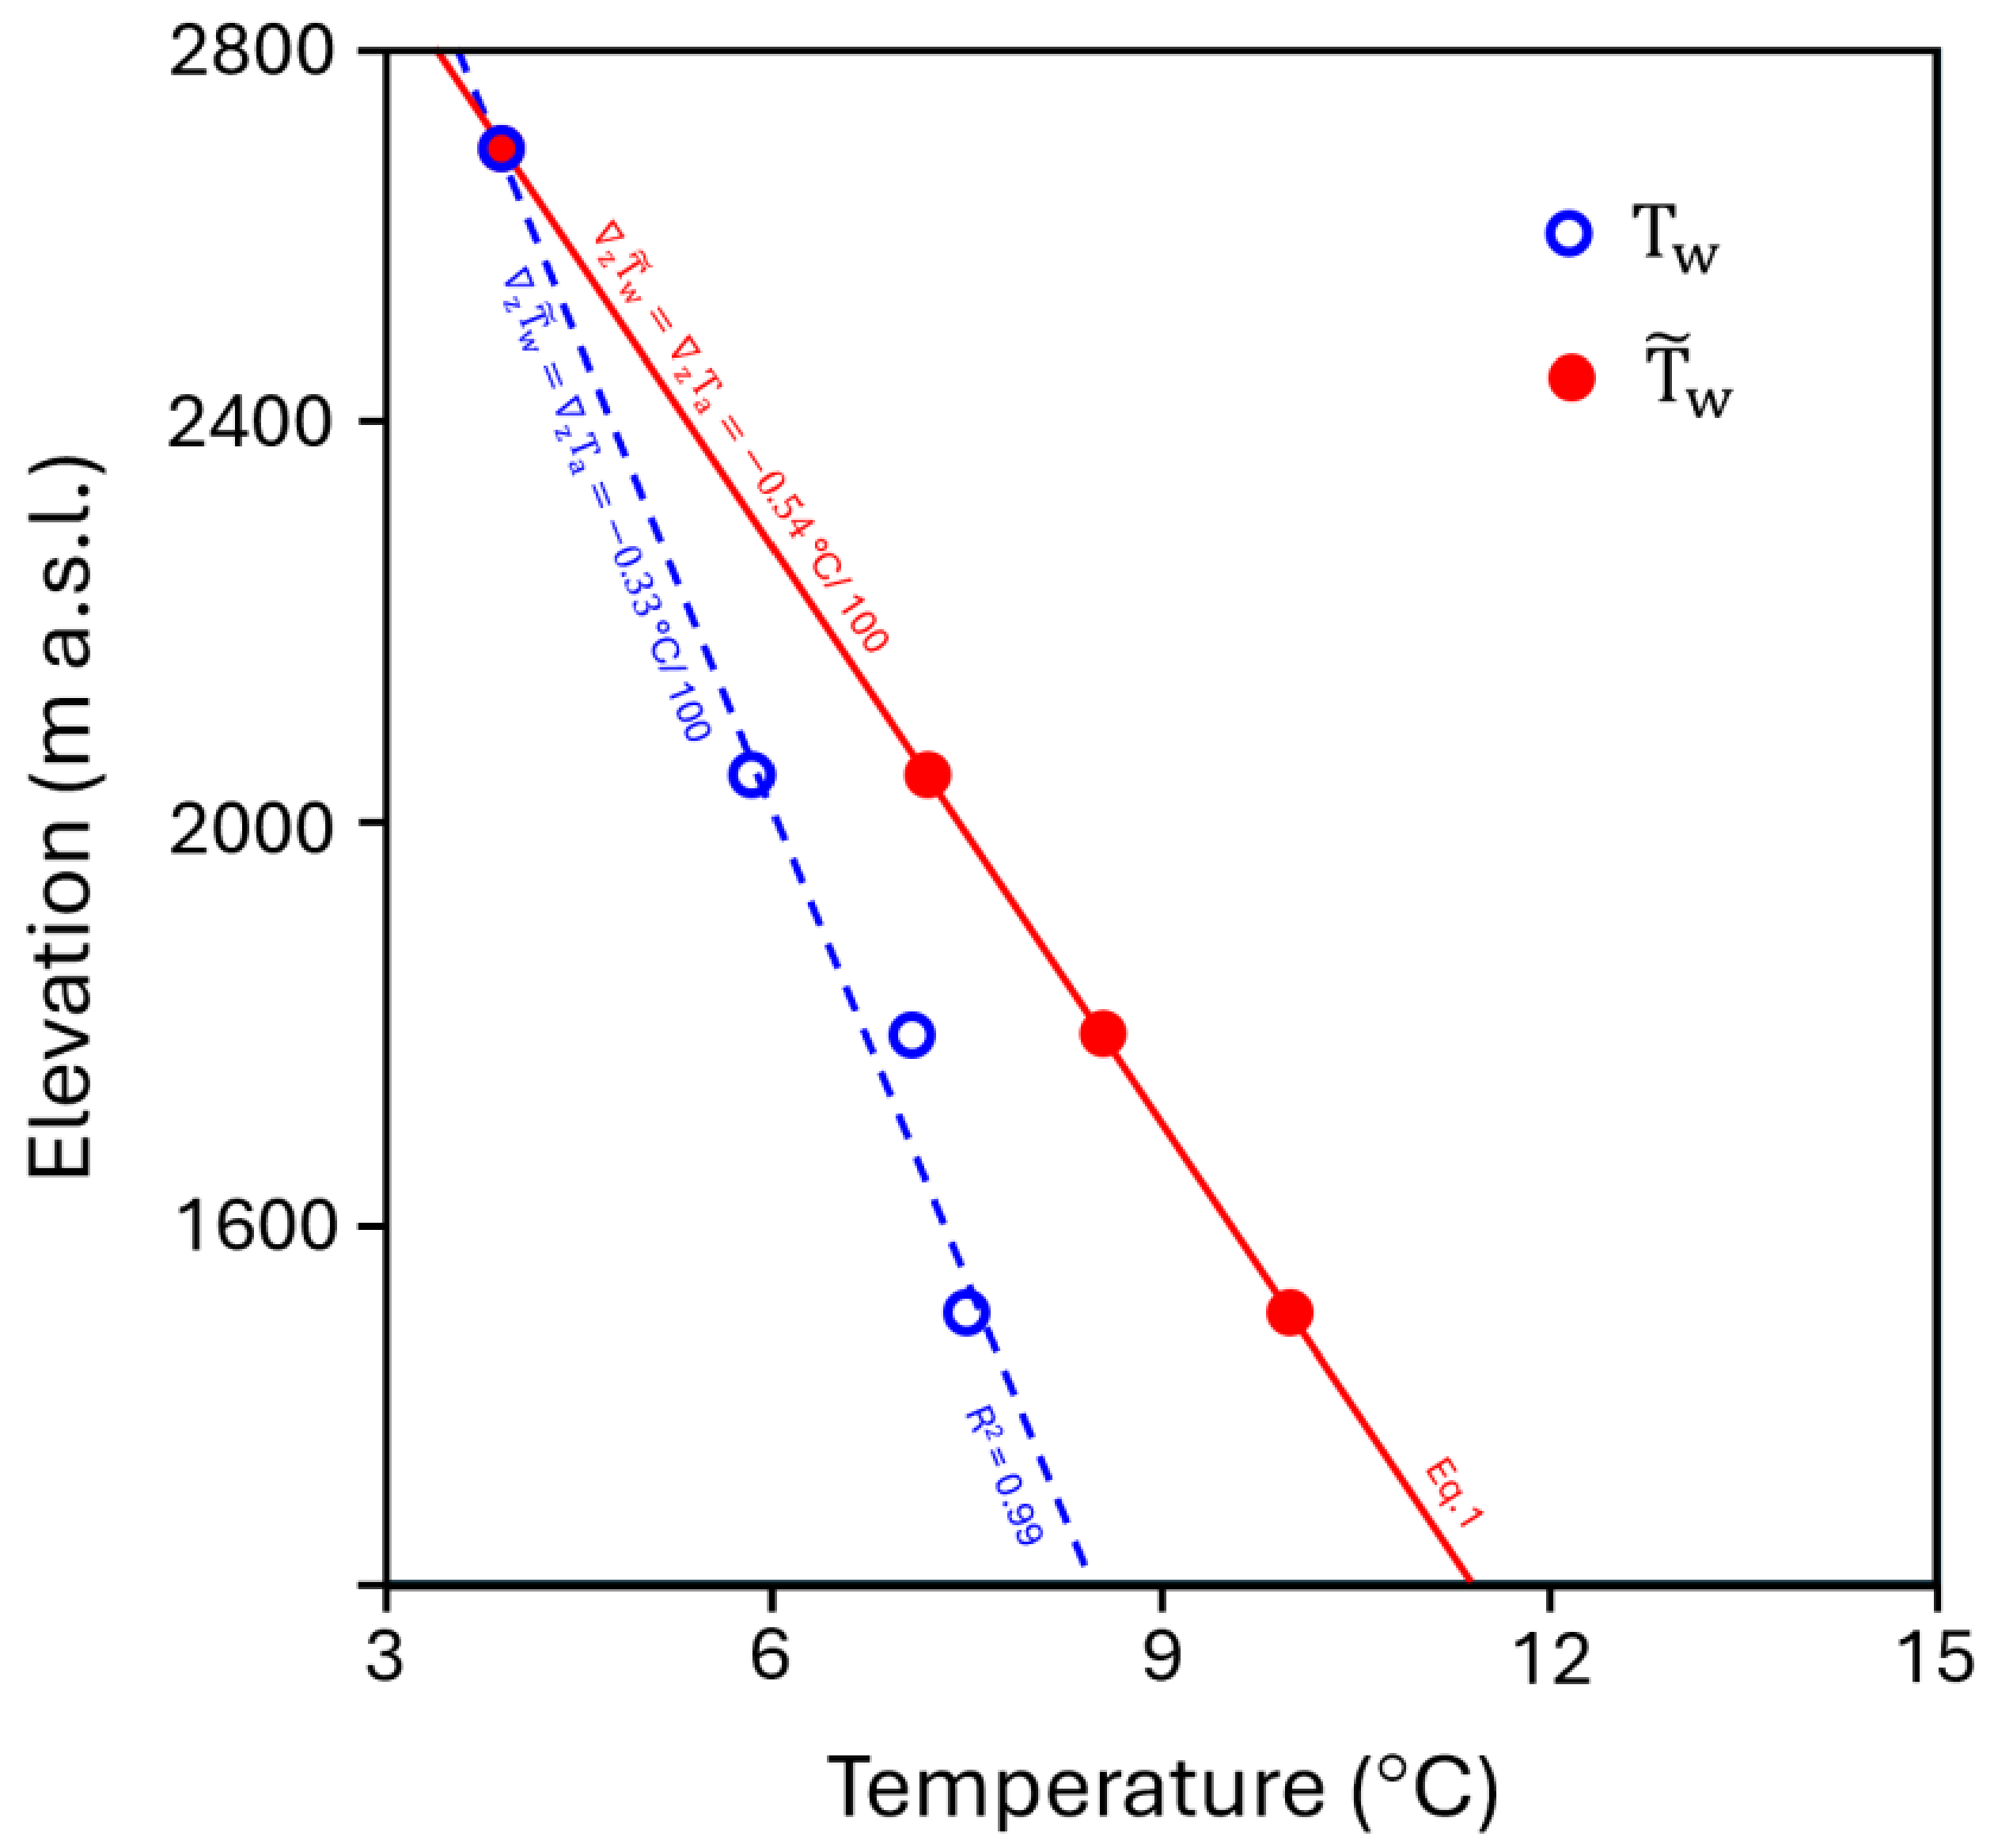
; Equation(1)) which is used here as a simplified atmospheric reference at the elevation of the control points. As can be shown in
Figure 7, the estimated temperature
is higher than the mean stream temperature measured at the control points (
). Daily comparisons showed that observed stream temperatures were on average 1.38, 1.55 and 2.59 °C lower than the corresponding theoretical atmospheric reference at PV, PZ and GS, respectively (
t-test,
p < 0.001 in all cases). In addition, the lapse rate for the mean
values is −0.33 °C/100 m, which is substantially lower than that of the air temperature at the study zone (i.e., −0.54 °C/100 m), indicating once again that the river temperature is not primarily controlled by atmospheric conditions. Instead, the reduced gradient reflects the persistence of the thermal signal inherited from the spring and the influence of groundwater inputs along the stream.
This means that at the monitoring point farthest from the spring, water temperature is approximately 5 °C colder than the air temperature and about 2.5 °C colder than the expected temperature assuming full thermal equilibration with the atmosphere since the spring source. This highlights the persistence of strong thermal buffering along the river system.
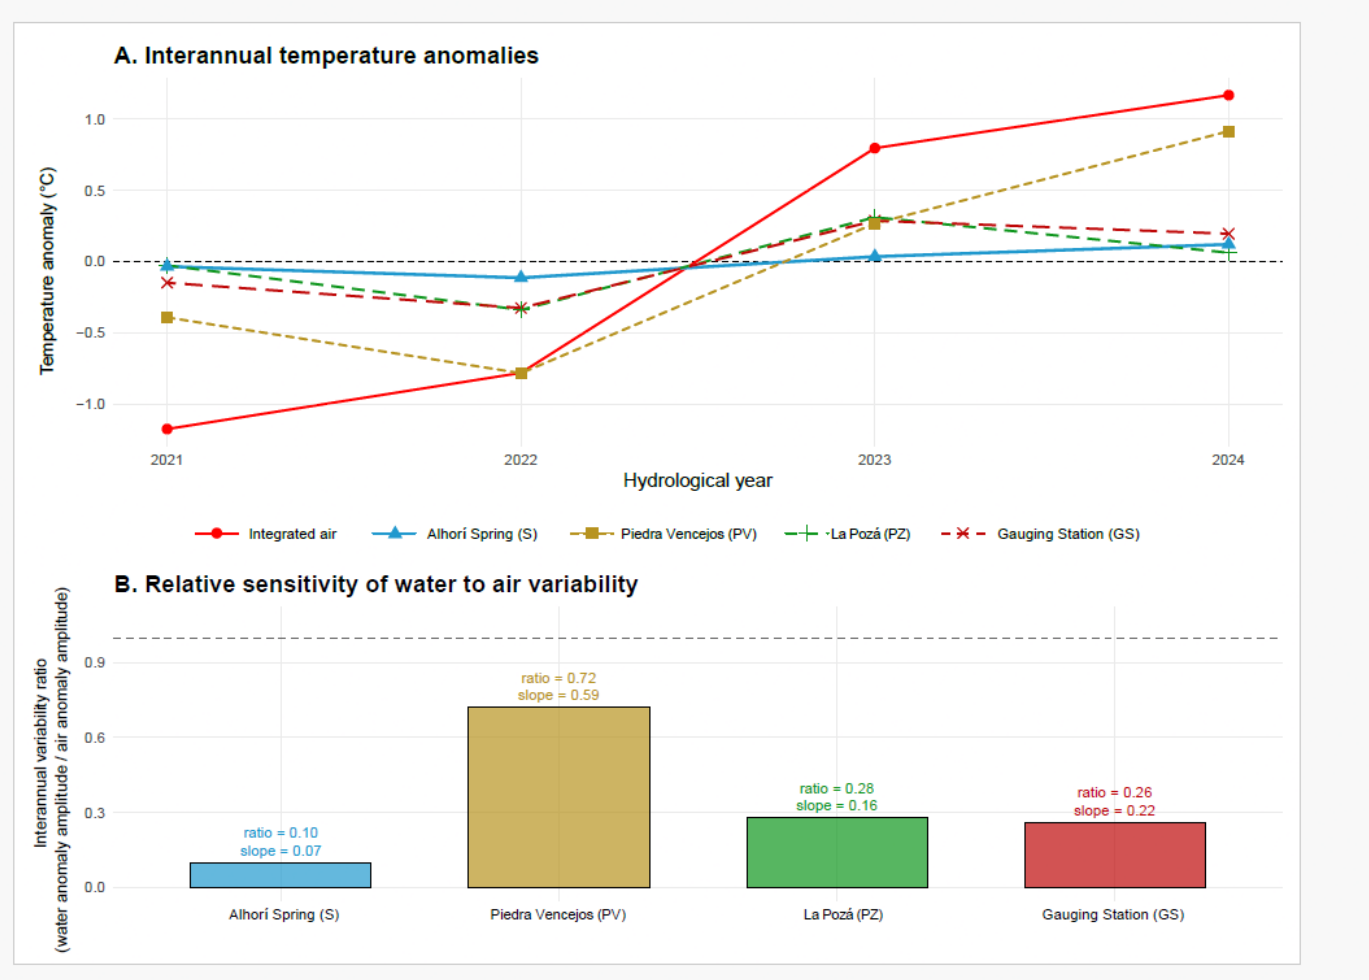
Finally, interannual variability was analyzed by hydrological years (October–September) over the period 2020–2024 to assess whether atmospheric temperature anomalies (i.e., relative to the mean temperature for the whole analyzed period) are transmitted to the river system (
Figure 8). Regional air temperature (
) was represented by an unweighted mean of four stations, while stream water temperature (
) was analyzed at the control sites S, PV, PZ and GS.
Air temperature anomalies varied among the four hydrological years analyzed, with higher values observed in 2023 and 2024. In contrast, spring water temperature remains highly stable, indicating strong thermal decoupling from atmospheric variability. At PV, water temperature anomalies closely follow those of the air, although with reduced amplitude, suggesting a stronger atmospheric influence at this site, potentially related to a reduced shading effect from vegetation.
Downstream, at PZ and GS, thermal anomalies are strongly attenuated again. This indicates that the atmospheric signal is not linearly propagated along the river. While groundwater inputs may contribute to buffering, the attenuation observed at these sites may also be partly related to channel shading by forest cover, which can limit solar heating despite rising air temperatures.
The analysis of sensitivity metrics (anomaly ratios and regression slopes) confirms this pattern: very low sensitivity at the spring, maximum sensitivity at PV, and reduced sensitivity downstream. Overall, the river system exhibits a spatially heterogeneous but coherent thermal response, consistent with aquifer buffering at the source, enhanced atmospheric exposure at PV, and a possible contribution of shading downstream.
5. Discussion
The results allow the refinement of the previous conceptual hydrogeological model, confirming that the Alhorí catchment operates as a snowmelt-driven, shallow alpine groundwater system strongly coupled to streamflow and thermal regimes. The system is characterized by three main processes: (i) recharge from seasonal snowmelt at high elevations, (ii) storage within shallow aquifers composed of weathered schists and glacial–periglacial deposits, and (iii) distributed groundwater discharge along the river network, resulting in a gaining stream along its entire course (
Figure 9). The progressive increase in streamflow along the river profile and the persistence of cold-water signatures downstream indicate an efficient hillslope–stream connectivity mediated by shallow subsurface flow pathways. Such connectivity is dynamic and intensifies during snowmelt periods, consistent with the conceptual framework proposed by [
26].
The strong spatial variability in discharge gains along the river profile provides important insight into the internal functioning of the catchment and allows for a first estimate of groundwater contributions, mainly lateral, and hypodermic flow. The largest relative increase observed in the upper reaches (S–PV, up to 164%) indicates that groundwater contributions are particularly concentrated in the upper part of the basin, where highly permeable moraine and periglacial deposits favor rapid snowmelt infiltration and subsurface flow. Downstream, the progressive reduction in relative gains (to ~14% between PZ and GS) suggests a transition towards a more hydraulically connected system, where groundwater inputs become more distributed. This pattern may also be influenced by multiple factors, including changes in stream discharge, and potentially, evapotranspiration associated with forest cover in the lower part of the basin [
27], although these effects were not quantified independently in this study. Previous hydrochemical and isotopic studies in the Alhorí catchment support the strong connectivity between surface water and groundwater. In such studies [
14] distinct groundwater signatures were identified, including δ
18O enrichment with decreasing elevation, the influence of careo channels (
Figure 9) on recharge processes, and low-mineralized bicarbonate waters consistent with relatively recent recharge.
This spatial pattern is consistent with alpine hydrogeological frameworks described by [
21] in which moraine, talus, and weathered bedrock aquifers play a key role in regulating headwater hydrology. Reaches exhibiting higher relative groundwater inputs also show stronger thermal buffering and lower sensitivity to atmospheric forcing, supporting the interpretation that groundwater inflows contribute substantially to both hydrological and thermal dynamics of the system. In the Alhorí basin, the combination of high permeability in superficial deposits and secondary permeability in schists promotes efficient snowmelt infiltration and groundwater flow, while the limited thickness of these units leads to relatively short but thermally buffered flow paths [
28]. These findings reinforce the idea that even thin and discontinuous aquifers can sustain significant baseflow when recharge is efficient and storage–release dynamics are well connected. This may help explain both the persistent groundwater contribution to streamflow and the strong attenuation of thermal signals observed throughout the system. From a thermal perspective, the system behaves as a low-pass filter of atmospheric variability, where groundwater behaves as a thermal reservoir that delays and dampens temperature fluctuations. The observed lag (~49 days) and low amplitude of groundwater temperature variations are consistent with theoretical heat transport models in porous media [
6,
7,
29]. These results are consistent with the delayed transmission of the seasonal thermal signal through the aquifer and the contribution of snowmelt recharge from higher elevations. The estimated thermal lag, together with the low amplitude of spring water temperature variations, is consistent with persistent thermal buffering within the aquifer. In addition, the difference in amplitude in the temperature found at S (10 °C air temperature vs 0.3 °C water temperature) highlights the strong damping of atmospheric thermal variability within the groundwater system. Wider temperature variation was observed in 2022, with most low-temperature outliers (<3 °C) occurring during this year, suggesting rainfall episodic inputs of supercooled liquid droplets generated in orographic clouds [
30].
The thermal patterns observed along the Alhorí River are consistent with previous hydrogeochemical estimates indicating that groundwater contributions exceed 50% of the annual basin discharge [
14]. The agreement between these independent thermal and hydrogeochemical observations reinforces the interpretation that groundwater exerts a major control on stream thermal dynamics within the catchment. Similar proportions have been reported in other mountain environments. For instance, studies in the Canadian Rockies show that groundwater can account for up to 60% of streamflow during snowmelt and nearly 100% during winter baseflow conditions [
2]. Likewise, in the western United States, groundwater plays a key role in maintaining summer low flows in snow-dominated basins [
3].
However, the Alhorí system differs from glaciated basins in Alpine or Andean regions, where glacier meltwater still contributes substantially to streamflow [
11]. In contrast, the fully deglaciated condition of the Alhorí basin implies that groundwater storage has entirely replaced glacial buffering, making subsurface storage the main regulator of hydrological continuity.
Another manifestation of this thermal decoupling is the difference between atmospheric and stream temperature lapse rates. Mean air temperature decreased with elevation at approximately −0.54 °C per 100 m, in agreement with lapse rates reported for mountain areas of Spain [
31], whereas stream water temperature exhibited a substantially weaker gradient (−0.33 °C per 100 m), representing a reduction of nearly 38%. This reduced thermal gradient indicates that stream temperature does not passively track atmospheric conditions but instead preserves the thermal signature inherited from groundwater discharge. It should be noted that the theoretical equilibrium temperature represents a simplified atmospheric reference. Because spring water emerges at a temperature substantially lower than the local atmospheric equilibrium, the calculated downstream equilibrium temperatures may be slightly overestimated. Nevertheless, the observed stream temperatures remain consistently below these theoretical values along the entire river profile, indicating that the river does not reach atmospheric thermal equilibrium and that groundwater maintains a persistent cooling effect downstream. This behavior is consistent with numerous studies highlighting the role of groundwater as a stabilizing factor in stream thermal regimes [
5,
32].
The attenuation of thermal gradients along the river, with a water temperature lapse rate substantially lower than that of air temperature, is consistent with a substantial groundwater influence on thermal conditions along much of the channel. Similar patterns have been observed in volcanic and alpine catchments where focused groundwater discharge reduces thermal sensitivity to atmospheric forcing [
10]. In contrast, catchments with limited groundwater influence typically show stronger coupling between air and stream temperature [
9].
At the reach scale, spatial variability in thermal response, such as increased sensitivity at PV and strong damping downstream, suggests a combination of processes, such as variable groundwater contributions through springs and riparian shading effects. This aligns with findings from forested headwater systems, where vegetation cover significantly modulates stream energy balance [
27]. The stronger attenuation observed at PZ and GS coincides with greater riparian vegetation cover at lower elevations and may therefore partly reflect shading effects. In these reaches, channel shading could reduce solar radiation inputs and limit atmospheric warming of stream water. Consequently, the observed water temperatures are consistent with a combined influence of groundwater inputs and riparian cover, although their respective contributions were not quantified. At the downstream gauging station, stream water remained approximately 5 °C cooler than local air temperature and about 2.5 °C cooler than the temperature expected under full atmospheric equilibration, consistent with strong longitudinal thermal buffering along the downstream reach. In addition, the slight cooling observed during peak discharge events supports the interpretation of focused recharge by cold snowmelt water, a mechanism widely documented in alpine basins [
33]. Although the magnitude of this cooling is small, its consistency suggests that recharge dynamics are detectable in the thermal signal despite strong mixing within the aquifer.
The systematic but limited cooling observed during snowmelt periods reflects the increased contribution of recently infiltrated snowmelt water. This behavior confirms the nival character of the aquifer, as discharge maxima coincides with the arrival of colder recharge water. Despite large increases in discharge, varying from less than 20–30 L s−1 during baseflow conditions to peaks of 100–130 L s−1, spring water temperature remained within a narrow range (approximately 3.7–4.2 °C). Even during snowmelt recharge periods, cooling was limited to around 0.1–0.2 °C, highlighting the large thermal inertia of the aquifer. Efficient mixing within the subsurface and substantial groundwater storage prevent recharge events from producing major perturbations in spring temperature, resulting in a highly stable thermal signal.
The results highlight the critical role of shallow groundwater systems in sustaining both hydrological and ecological processes in semi-arid mountain regions. In Sierra Nevada, groundwater discharge zones are closely linked to groundwater-dependent ecosystems such as alpine meadows (“borreguiles”), which rely on persistent moisture conditions [
34], and may also promote infiltration processes that contribute to the recharge, sustaining baseflow in the Alhorí River. The strong buffering capacity of the Alhorí aquifer suggests that these ecosystems may be relatively resilient to short-term climatic variability. Similar processes of enhanced infiltration and delayed groundwater release have been documented in Sierra Nevada through traditional “acequia de careo” systems, which artificially recharge aquifers and sustain springs and vegetation over extended periods [
13]. It can therefore be inferred that the increase in groundwater recharge induced by these infiltration (careo) channels will result in a reduction in river water temperature, as well as in its temporal variability.
From a sustainability perspective, these findings underline the importance of groundwater storage and recharge for maintaining streamflow, thermal stability, and water-resource resilience in semiarid mountain catchments [
35]. Maintaining connectivity between recharge areas, aquifers, and streams is therefore important for sustainable water-resource management, while traditional managed aquifer recharge practices, such as careo channels, may contribute to groundwater storage and hydrological resilience under changing climatic conditions [
36]. However, long-term climate change poses significant risks to these systems in the future. Reductions in snowpack, earlier snowmelt, and decreased recharge could weaken the hydraulic connection between surface and subsurface systems, ultimately reducing groundwater storage and baseflow. This is consistent with broader observations in mountain regions worldwide, where declining snow cover is expected to alter both hydrological and thermal regimes [
2,
3]. Our findings highlight the potential role of snowpack dynamics and groundwater recharge processes in influencing hydrological responses in deglaciated basins, particularly in Mediterranean mountain environments where snow represents an important seasonal water-storage component.
Several limitations should be considered when interpreting the results. First, although the dataset spans five hydrological years, the temporal coverage remains relatively short for capturing long-term climate variability and extreme events. The study period corresponds to relatively dry hydrological conditions compared with the long-term average. Therefore, the observed magnitude of groundwater contributions may not be directly representative of wetter years, when increased surface runoff generated by snowmelt is expected to modify their relative importance. Nevertheless, groundwater may play an even more important role during drought periods, making these findings potentially relevant under future hydroclimatic conditions. Future monitoring, including wetter years, would improve the assessment of interannual variability.
In addition, the use of water temperature as a tracer of groundwater contributions, while well established, is an indirect method. Although widely validated [
5,
37], it may be influenced by other factors such as shading, channel morphology, or hyporheic exchange, whose individual contributions were not explicitly quantified in this study. In particular, the Alhorí River exhibits highly heterogeneous channel morphology, with numerous large boulders, small steps, and local variations in flow conditions that may influence heat exchange processes. Similarly, the effects of riparian shading and evapotranspiration were not directly quantified. Therefore, the observed thermal patterns should be interpreted as evidence consistent with groundwater influence rather than as a quantitative partitioning of the different thermal controls. This interpretation is supported by the combined analysis of discharge and temperature data, together with the hydrogeological setting of the basin and previous hydrochemical and isotopic evidence [
14]. In addition, instrumental uncertainties (e.g., sensor accuracy of ±0.1–0.5 °C) may influence the interpretation of small temperature differences. While consistent patterns suggest a real signal, the magnitude of these changes approaches the measurement error range.
Spatial heterogeneity within the basin, such as localized groundwater inflows or variable sediment thickness, cannot be fully resolved with the current monitoring network. Higher-resolution spatial data, including distributed temperature sensing or tracer experiments, would help refine the conceptual model. Future work involving a detailed thermal balance analysis would further strengthen the conceptual model proposed in this study.
6. Conclusions
The observations collected during the monitoring period indicate a strong groundwater influence in this deglaciated high-mountain basin, where shallow subsurface storage contributes substantially to both streamflow and stream temperature during the monitored period. The river behaves as a gaining stream along its entire course, with lateral groundwater-derived contributions sustaining baseflow under the observed semi-arid conditions.
Snowmelt is an important recharge mechanism and contributes to the seasonal hydrological regime, producing peak flows in late spring and early summer. This recharge is efficiently stored and gradually released through weathered bedrock and glacio-periglacial deposits, supporting strong hillslope–stream connectivity throughout most of the year.
Thermally, the system shows strong buffering of atmospheric variability, with stable spring temperatures around 4 °C and a marked lag relative to air temperature. This groundwater control propagates downstream, contributing to consistently cool stream temperatures and weak longitudinal thermal gradients, with spatial variability potentially influenced by differences in riparian shading and channel conditions. High-flow events are associated with slight cooling of spring water, consistent with the influence of cold snowmelt recharge.
Overall, the results highlight the importance of considering shallow groundwater storage and groundwater–surface water interactions when assessing hydrological and thermal stability in mountain catchments. Changes in snow persistence and groundwater recharge may alter these processes under changing climatic conditions, underscoring the need for integrated, long-term monitoring and sustainable water-resource management strategies that account for groundwater–surface water connectivity and the ecological functions supported by these systems. Such approaches are also essential for anticipating how mountain catchments may respond to future changes in snow persistence and groundwater recharge.




 ,
,