


Abstract
Colonias are historically underserved communities along the Texas–Mexico border facing infrastructure deficiencies, socioeconomic vulnerability, and environmental hazards. This study examines parcel-level development conditions across 66,160 properties in Cameron, Hidalgo, Starr, and Willacy Counties, Texas. Property appraisal records, colonia boundaries and 2014 classifications, and geographic information system analyses were integrated to evaluate property values, platting, public service district coverage, floodplain exposure, and reconstructed building patterns from 1990 to 2025. These indicators represent physical and economic conditions associated with resilience rather than a comprehensive measure of community resilience. Results reveal variation among counties and 2014 baseline classification categories. Communities classified as Green exhibited higher property values, greater district coverage, and more established development, whereas those classified as Red showed lower values and greater developmental disadvantages. Reconstructed building inventories more than doubled in Hidalgo and Cameron Counties and increased in Starr County, although survivorship bias and missing year-built data limit interpretation of growth rates. Many colonia properties remain within mapped floodplains, particularly in Hidalgo County. Because the analysis is descriptive, these patterns cannot be causally attributed to specific policies. This study provides a replicable parcel-level framework for evaluating development disparities and floodplain exposure to inform equitable infrastructure investment and planning in underserved border communities.
1. Introduction
Colonias are substandard housing developments often found along the Texas–Mexico border, where residents lack basic services such as clean drinking water and access to adequate sewage treatment [1]. These communities emerged largely through the subdivision and sale of inexpensive rural land to low-income households seeking opportunities for homeownership outside municipal jurisdictions [1,2,3]. Although colonias vary considerably in size, age, and infrastructure conditions, many continue to experience challenges associated with inadequate housing, limited public services, environmental hazards, and economic marginalization [2,4,5,6]. Colonias have been identified in the four U.S. states bordering Mexico—Texas, New Mexico, Arizona, and California—and represent one of the most persistent forms of geographic and socioeconomic disadvantage in the border region [4,7,8,9]. According to the U.S. Department of Housing and Urban Development (HUD), approximately 2459 colonias have been identified across these four states. Texas contains approximately 1800 colonias, representing nearly 73% of all documented colonia communities, while New Mexico, Arizona, and California contain approximately 138 (5.6%), 77 (3.1%), and 72 (2.9%) colonias, respectively [4]. Among Texas border regions, the Rio Grande Valley (RGV) contains the largest concentration of colonias and colonia residents, particularly within Cameron and Hidalgo Counties, making the region a critical setting for understanding long-term colonia development, infrastructure conditions, environmental vulnerability, and development disparities [1,10].
The origins of colonias are closely linked to historical patterns of land subdivision, limited housing affordability, and weak development regulations along the Texas–Mexico border. Beginning in the mid-twentieth century, developers frequently sold small rural lots through contract-for-deed arrangements without providing basic infrastructure such as potable water, wastewater systems, drainage facilities, or paved roads [7,8,11]. These practices contributed to the rapid expansion of unincorporated settlements characterized by inadequate public services and heightened environmental vulnerability. In response, the Texas Legislature enacted a series of colonia-prevention laws beginning in 1989 that required developers to provide minimum infrastructure standards before residential lots could be sold [12]. Subsequent legislation expanded investments in water systems, wastewater facilities, drainage improvements, transportation infrastructure, housing assistance, and community development programs. A major milestone was Senate Bill 827 (79th Texas Legislature, 2005), which strengthened statewide colonia identification and reporting requirements and expanded the role of the Texas Secretary of State in maintaining the statewide Colonia Geographic Database, coordinating colonia-related information among agencies, and supporting statewide colonia planning and investment activities [12,13,14,15,16]. Together, these legislative and institutional efforts established a framework for monitoring colonia conditions, directing public investments, and improving living conditions in underserved border communities.
To improve the identification, classification, and monitoring of colonia communities along the Texas–Mexico border, the Texas Legislature enacted Senate Bill 99 (SB 99), which became effective on 15 June 2007 [17]. The legislation was authored by Senator Judith Zaffirini, co-authored by Senator Eddie Lucio, and sponsored in the Texas House of Representatives by Representative Ryan Guillen. SB 99 assigned the Texas Secretary of State (SOS) three primary responsibilities: (1) developing and maintaining a colonia identification system, (2) creating and maintaining a statewide classification system to identify colonias with the highest public health risks, and (3) reporting on the progress of state-funded infrastructure projects in border-region colonias [13]. The legislation also requires the SOS to periodically update state legislative leadership regarding colonia infrastructure improvements. As a result, the SOS established and maintains a comprehensive colonia database containing geographic boundaries and community attributes, which has become an important resource for research, planning, and policy evaluation. This study utilizes the colonia boundary and attribute information derived from this statewide database to identify and analyze land parcels located within colonia communities in Hidalgo, Cameron, Starr, and Willacy Counties [16].
One outcome of these efforts was the development of the colonia classification framework used by the Texas Office of the Attorney General (OAG), which categorizes colonias according to infrastructure and service conditions. Colonias are commonly classified as Green, Yellow, or Red based on the availability of potable water, wastewater systems, paved roads, drainage infrastructure, and other public services [18]. Green colonias generally represent communities with the highest levels of infrastructure and service provision, whereas Red colonias are characterized by the greatest infrastructure deficiencies and service needs. These classifications provide a practical framework for evaluating development trajectories and identifying disparities in infrastructure, environmental vulnerability, and community conditions among colonias. Consequently, the classification framework has been widely used in Texas’s six principal colonia counties—Cameron, Hidalgo, Starr, Webb, Maverick, and El Paso, which contain the state’s largest concentrations of colonias—to prioritize infrastructure investments, monitor community progress, and guide state and federal assistance programs. Through the Texas Colonia Initiatives Program and related agency efforts, substantial public investments have been directed toward improving water and wastewater systems, road access, drainage infrastructure, housing conditions, and public health outcomes in colonia communities [12,18].
Despite these interventions, colonias continue to experience persistent social, economic, and environmental vulnerabilities. Historical accounts describe how many households were attracted to colonias because land prices were affordable and ownership opportunities were accessible to families excluded from traditional housing markets [19,20]. However, these opportunities often came at the cost of inadequate infrastructure, poor housing conditions, limited access to healthcare, and exposure to flood hazards. Previous studies have documented widespread concerns regarding water quality, wastewater disposal, flooding, housing quality, public health conditions, and infrastructure disparities in colonia communities [7,20,21,22,23]. More recently, research has demonstrated that colonias remain disproportionately concentrated within socially vulnerable and environmentally at-risk areas. Kyne [1] found that many colonia communities in the Rio Grande Valley are located within census tracts characterized by low resilience capacity and elevated socioeconomic vulnerability, reinforcing concerns regarding environmental hazards and adaptive capacity in border communities. These findings suggest that colonia conditions remain closely connected to broader patterns of geographic disadvantage, uneven development, and environmental vulnerability across the region.
Although Texas has invested substantial resources in colonia infrastructure and community development programs over the past three decades, important questions remain regarding the long-term effectiveness of these investments in improving development conditions, infrastructure, and community resilience. In recent years, several colonia oversight and monitoring functions have been reduced or eliminated, including the discontinuation of colonia ombudsman positions and the scaling back of state-supported monitoring initiatives that previously tracked colonia conditions, infrastructure needs, and community development trends [24,25]. As monitoring capacity declined, the ability to systematically document colonia growth, evaluate development trajectories, assess changing environmental conditions, and measure infrastructure outcomes also diminished. The loss of these monitoring mechanisms has important implications for policy evaluation and decision-making. Without consistent data collection and reporting systems, it becomes increasingly difficult to determine whether colonia-prevention laws have successfully limited the creation of new substandard developments, whether public investments have improved community conditions, and whether infrastructure funding programs have achieved their intended outcomes [21]. Similarly, the absence of reliable longitudinal data constrains the ability of policymakers to identify emerging development patterns, monitor expansion into environmentally vulnerable areas, prioritize investments, and address persistent infrastructure deficiencies. As a result, decision-makers often lack the empirical evidence necessary to evaluate program performance and develop informed, data-driven policies for colonia communities. This challenge underscores the need for updated parcel-level analyses capable of documenting contemporary development patterns and providing an objective basis for assessing the effectiveness of past interventions and future resilience strategies.
For this study, colonia development refers to the observable physical, economic, and infrastructural conditions of colonia communities, operationalized through parcel development and vacancy, property values, platting status, location within public service district boundaries, reconstructed building inventories, and the 2014 colonia classifications. Colonia development patterns refer to the geographic distribution and variation in these indicators across counties, classification categories, platting conditions, public service district status, and the colonia-level floodplain attribute. Sustainable development is understood here as the long-term improvement of housing, infrastructure, services, and economic conditions in existing colonia communities while reducing environmental vulnerability and avoiding the creation of new substandard development. These concepts are used as organizing frameworks for the descriptive analysis and are not combined into a composite development or sustainability index.
To address these monitoring limitations and knowledge gaps, this study examines parcel-level development patterns across colonia communities in the Rio Grande Valley (RGV), which comprises Cameron, Hidalgo, Starr, and Willacy Counties. The region contains approximately 1266 colonia communities, representing about 70% of all colonias identified in Texas. Hidalgo County alone contains 846 colonias (47% of all Texas colonias), followed by Starr County (232 colonias; 12.9%), Cameron County (172 colonias; 9.6%), and Willacy County (16 colonias; 0.9%) [1,16]. These figures underscore the importance of the RGV as the principal concentration of colonia development in Texas and as a significant region for studying infrastructure conditions, environmental vulnerability, and development disparities. Using county appraisal district records, colonia boundary and 2014 classification data, mapped floodplain information, and geographic information system (GIS) analyses, the study evaluates property characteristics, market values, platting status, location within public service district boundaries, floodplain exposure, and reconstructed building patterns from 1990 through 2025. The analysis is descriptive: the 2014 classifications are treated as fixed baseline categories, and the historical building inventories are reconstructed from structures represented in the 2025 appraisal records. Particular attention is given to differences among counties and 2014 classification categories and to the relationship between recorded development and mapped floodplain exposure.
This study addresses the following research questions:
- How do property values, development intensity, and land-use characteristics vary among colonia communities across Cameron, Hidalgo, Starr, and Willacy counties?
- To what extent are colonia development patterns associated with floodplain exposure, platting status, and access to public utility districts?
- How have documented building inventories changed between 1990 and 2025 across colonia classifications and counties?
- Are colonia communities experiencing continued growth within areas vulnerable to flooding?
- How can parcel-level property valuation, public service district coverage, building development, and floodplain exposure indicators be used to characterize physical and economic conditions associated with resilience in Texas border colonias?
This study contributes to the literature on colonias and sustainable development in several important ways. First, it provides a comprehensive parcel-level assessment of colonia communities in the Rio Grande Valley by integrating appraisal district records, colonia geographic databases, and GIS-based analyses across four counties. Second, it develops a consistent framework for evaluating colonia development using property valuation metrics, building inventories, platting characteristics, public service district access, and floodplain exposure indicators. Third, the study provides new empirical evidence regarding long-term development patterns by documenting where development has occurred, identifying communities that continue to expand within environmentally vulnerable areas, and highlighting locations where infrastructure and service gaps remain evident. Finally, the findings contribute to broader discussions of sustainability, development disparities, environmental justice, and community resilience. The study treats property values, infrastructure access, building development, and floodplain exposure as limited proxy indicators of physical and economic conditions associated with resilience. Property values and building development reflect accumulated economic and physical investment; platting and public service district access indicate formalization and access to essential infrastructure; and floodplain exposure represents environmental vulnerability that may constrain development and adaptive capacity. These indicators do not constitute a comprehensive measure of community resilience and do not capture social networks, household adaptive capacity, institutional effectiveness, public health, or post-disaster recovery.
2. Materials and Methods
2.1. Study Area
This study examines colonia communities located within the Rio Grande Valley region of South Texas, including Cameron, Hidalgo, Starr, and Willacy Counties (Figure 1). Colonias are unincorporated or semi-incorporated residential subdivisions that have historically experienced varying levels of infrastructure provision, housing quality, and environmental vulnerability. The four counties represent the largest concentration of colonia communities in Texas and encompass a wide range of development conditions, socioeconomic characteristics, and flood-risk environments.
Figure 1.
Location of colonia communities within the four-county Rio Grande Valley region of South Texas (Cameron, Hidalgo, Starr, and Willacy Counties).
2.2. Data Sources
Multiple spatial and tabular datasets were integrated to evaluate parcel characteristics, development conditions, public service district coverage, reconstructed building patterns, and floodplain exposure within colonia communities (Figure 2).
Figure 2.
Workflow used to integrate parcel, colonia, and administrative datasets and generate indicators of development patterns, property valuation, infrastructure conditions, building growth, and floodplain exposure for colonia communities in the Rio Grande Valley, Texas. Note: Parcel data were obtained from county appraisal districts and the Texas Geographic Information Office (TxGIO), while colonia boundaries and attributes were obtained from the Texas Secretary of State Colonias Database. Parcel centroids were spatially joined to colonia boundaries, and the resulting parcel-level datasets were analyzed in Stata to calculate property, valuation, public service district, floodplain-exposure, and development indicators. Reconstructed building-inventory analyses were conducted only where recorded year-built information was available.
Floodplain status was obtained from the “colonia located in a floodplain” attribute variable in the 2014 Texas Secretary of State Colonias Database. The available attribute does not distinguish between 100-year and 500-year floodplains or provide information on flood depth, probability, or severity; it is therefore interpreted only as a general colonia-level indicator of floodplain location.
Parcel-level land records were obtained from county appraisal districts and publicly available geographic information system (GIS) repositories. Parcel datasets for Hidalgo and Cameron Counties were obtained directly from county GIS and appraisal district sources (2025 assessment year) [26,27]. Parcel data for Starr and Willacy Counties were obtained from the Texas Geographic Information Office (TxGIO) statewide land parcel database (2025 release) and supplemented with information from county appraisal districts where available [28].
Colonia boundary and attribute information were obtained from the Texas Secretary of State Colonias Database, last updated in 2014, which contains community boundaries and associated infrastructure and service indicators [16]. Because no statewide updates have been released since 2014, the colonia boundaries and associated attribute variables (e.g., public service availability, platting status, and infrastructure characteristics) were assumed to accurately represent colonia conditions throughout the study period. This represents an important limitation, as infrastructure improvements, service expansion, or boundary changes occurring after 2014 may not be reflected in the database. Nevertheless, the Texas Secretary of State Colonias Database remains the official statewide inventory and the most comprehensive source for colonia boundaries and community characteristics.
Administrative boundary layers, including census-designated places and other geographic reference units, were obtained from the U.S. Census Bureau 2022 TIGER/Line Shapefiles [29,30].
Parcel datasets contained property-level attributes including land area, market value, improvement value, appraised value, and, where available, year-built information. Colonia datasets included community-level characteristics such as platting status, public service district status, floodplain location, infrastructure indicators, and colonia classifications derived from the 2014 Texas Secretary of State Colonias Database. Because no updated statewide classification inventory was available, the 2014 Green, Yellow, Red, and Unknown classifications were treated as fixed baseline attributes for organizing the parcel-level comparisons. They were not assumed to represent colonia conditions in 2025. Individual communities may have experienced infrastructure investments, service expansions, deterioration, or reclassification after 2014; therefore, analyses of building development through 2025 compare subsequent development patterns across the 2014 baseline categories rather than across contemporaneous 2025 conditions. This temporal mismatch limits interpretation of differences among classification categories, particularly for the 2015–2025 period, and prevents the analysis from determining whether individual colonias improved, declined, or changed classification after 2014.
2.3. GIS Processing and Spatial Integration
All spatial processing was conducted using ArcGIS Pro (Version 3.5) [31]. Parcel polygon datasets were converted to parcel centroid points to facilitate spatial matching with colonia community boundaries. Parcel centroids located within colonia boundaries were identified using a spatial selection procedure based on the “within” relationship (Figure 3). Selected parcels were subsequently spatially joined with colonia community attribute tables to transfer community-level information to individual parcel records. The resulting geodatabase contained parcel-level property characteristics linked to colonia-specific attributes, creating a unified dataset suitable for statistical analysis. Data-quality checks included reviewing field definitions and coding consistency, harmonizing variable formats across county datasets, verifying coordinate systems before spatial processing, checking parcel and colonia identifiers for missing or duplicate records, and comparing parcel counts before and after spatial selection and joining. Frequency tables were examined for classification, platting, public service district, floodplain, and year-built variables to identify missing or implausible values. Records with unavailable classification, district, floodplain, or year-built information were retained and reported as Unknown or Not Classified rather than imputed.
Figure 3.
Example of parcel-centroid selection within colonia boundaries in Starr County, Texas. Parcel centroids (red points) located within mapped colonia boundaries (blue polygons) were selected for inclusion in the analysis. Note: Yellow polygons represent land parcels. Only parcels whose centroids fell within colonia boundaries were retained for subsequent statistical analysis.
Final parcel datasets were exported as shapefiles and converted to Stata 14 format for subsequent analysis. GIS procedures were used to integrate parcel and colonia datasets, assign community-level attributes to parcel records, and support descriptive geographic comparisons. The study did not conduct hotspot analysis, spatial-autocorrelation tests, or formal cluster analysis; consequently, the reported geographic differences should not be interpreted as statistically significant spatial clusters.
2.4. Statistical Analysis
Statistical analyses were conducted using Stata 14 [32]. Summary statistics were generated for all parcels located within colonia communities. Analyses were organized according to four key colonia characteristics: 2014 colonia classification (Green, Yellow, Red, or Unknown), platting status (platted or non-platted), public district status (presence or absence of public utility or service districts), and floodplain location (inside, outside, partially within, or unknown floodplain status). Parcel-level attributes were aggregated within these categories to produce summary measures of development conditions, land area, property values, building inventories, and growth patterns. All analyses were descriptive; no causal effects of colonia classification, infrastructure access, or public policy were estimated. Comparisons involving Green, Yellow, Red, and Unknown communities used the 2014 classifications as fixed baseline categories. Accordingly, building patterns observed through 2025 represent development associated with those baseline categories and should not be interpreted as comparisons among colonia conditions reclassified or reassessed in 2025. This approach enabled descriptive comparisons of development trajectories and physical, economic, infrastructural, and environmental conditions associated with resilience across colonia classifications and environmental settings throughout the Rio Grande Valley.
2.5. Computed Indicators
Parcel- and community-level indicators were calculated to characterize development patterns, property values, land-use conditions, public service district coverage, floodplain exposure, and reconstructed building patterns within colonia communities. Property and land metrics included the total number of developed properties, total lots, vacant lots, and total land area in acres. Vacant lots were identified as parcels lacking recorded building improvements or assessed improvement values. Property-valuation indicators included total market value, total appraised value, median market value, minimum market value, maximum market value, median appraised value, minimum appraised value, and maximum appraised value. To better represent developed residential conditions, market-value statistics excluded vacant parcels without documented building improvements. Public service district status indicates whether a parcel was geographically located within a mapped public utility or service district; it does not verify an individual connection or the adequacy, reliability, or affordability of services. Floodplain exposure was represented by the floodplain-location attribute provided in the colonia database, which identifies whether each colonia community was recorded as inside, outside, partially within, or of unknown status relative to a floodplain. Parcels inherited the floodplain status of the colonia community to which they were spatially assigned; parcel-level floodplain intersections were not independently calculated. In this study, flood exposure refers only to whether a colonia was identified as located in a floodplain through the corresponding attribute in the 2014 Texas Secretary of State Colonias Database. Flood vulnerability is a broader concept encompassing exposure together with sensitivity, housing conditions, socioeconomic resources, infrastructure capacity, and the ability to prepare for, respond to, and recover from flooding. Because the available data do not measure these additional dimensions or distinguish flood probability, depth, or potential damage, the analysis evaluates colonia-level flood exposure rather than comprehensive flood vulnerability.
For purposes of interpretation, property values, platting status, public service district coverage, building development, and floodplain exposure were treated as limited proxy indicators of physical and economic conditions associated with community resilience. Property values and building development were used to represent accumulated economic and physical investment; platting status and public service district access indicated regulatory formalization and access to infrastructure; and floodplain exposure represented environmental vulnerability that may constrain development and adaptive capacity. These indicators were analyzed separately and were not combined into a composite resilience index. Accordingly, they do not provide a comprehensive or direct measure of community resilience and do not capture social networks, household adaptive capacity, public health, institutional effectiveness, governance, or post-disaster recovery.
Historical development patterns were evaluated using year-built information where available. Because these inventories were reconstructed from the 2025 county appraisal databases using the recorded year-built attribute, cumulative building counts represent structures that remained in the appraisal records in 2025 and were recorded as having been constructed by each benchmark year. Consequently, the 1990 and 2014 counts are retrospective inventories of surviving recorded structures rather than complete historical inventories of all buildings present at those times. Buildings demolished, replaced, substantially redeveloped, destroyed, or otherwise removed from the appraisal records before 2025 are not captured.
This reconstruction introduces survivorship bias because omitted structures reduce the estimated baseline inventories. When the baseline count is understated, the calculated percentage increase to 2025 may be overstated. The magnitude of this bias cannot be quantified with the available data and may differ across counties, colonia classifications, and analysis periods. Communities experiencing higher rates of demolition, housing replacement, informal redevelopment, disaster loss, or appraisal-record changes may have more incomplete historical baselines than communities with more stable building inventories. Consequently, differences in calculated growth rates may reflect both actual building development and variation in the survival and recording of older structures. Growth-rate comparisons across counties and 2014 classification categories should therefore be interpreted cautiously and should not be treated as precise measures of net historical construction or changes in the total building stock.
Cumulative building inventories were reconstructed for structures built through 1990, 2014, and 2025. Additional indicators were calculated to quantify recorded construction occurring during 1991–2014, 2015–2025, and 1991–2025. Growth rates were computed as the percentage change in cumulative building inventories between benchmark years using the formula:
where Buildings0 represents the reconstructed baseline inventory of structures present in the 2025 appraisal records and Buildingst represents the corresponding reconstructed inventory at the end of the analysis period. These indicators were used to describe apparent building growth among structures represented in the 2025 records across 2014 colonia classifications, platting conditions, public service district status, and floodplain locations. They should not be interpreted as complete estimates of historical construction, demolition, net change in building stock, or causal effects of colonia conditions or policies.
Growth Rate = [(Buildingst − Buildings0)/Buildings0] × 100
Data availability varied among counties. Cameron and Hidalgo Counties contained sufficient year-built information to reconstruct benchmark building inventories and calculate apparent growth rates. Starr County included year-built information for many parcels; however, a substantial number of developed properties lacked recorded construction years and were classified as Unknown Year Built and reported separately. Missing year-built values limit the completeness of period-specific inventories, while survivorship bias may understate earlier baselines and overstate percentage growth; the combined direction and magnitude of these effects are unknown. In Willacy County, recorded year-built information was unavailable, preventing reconstruction of benchmark building inventories and calculation of apparent growth rates. Consequently, analyses for Willacy County focused on property inventories, land area, platting status, floodplain exposure, and valuation characteristics rather than reconstructed building patterns.
3. Results
3.1. Cameron County Colonias
Green colonias represent the largest concentration of developed properties and economic value in Cameron County. The largest Green-colonia category consists of platted communities with public district access outside mapped floodplains, containing 8911 properties on approximately 10,308 acres and accounting for more than USD 934 million in total market value (Table 1). Within the reconstructed inventory, recorded building counts increased from 3054 at the 1990 benchmark to 5776 at the 2025 benchmark, producing a calculated apparent growth rate of 89.1%. Green colonias located within mapped floodplains were comparatively limited, accounting for 128 properties and approximately USD 16.7 million in total market value. Overall, Green colonias accounted for 10,116 properties and approximately USD 1.04 billion in total market value, representing the largest concentration of developed properties and economic value among the 2014 classification categories in Cameron County.
Table 1.
Property characteristics, floodplain exposure, property values, and reconstructed building patterns across 2014 colonia classification categories in Cameron County, Texas (1990–2025).
Yellow colonias represent the second-largest development category, with recorded building development occurring across both floodplain and non-floodplain locations. The largest Yellow-colonia group consisted of platted communities with public district access outside mapped floodplains, containing 4545 properties and approximately USD 474 million in total market value. Development was also recorded within mapped floodplains, where 982 properties occupied approximately 5310 acres and accounted for approximately USD 95.7 million in total market value. Across all Yellow-colonia categories, the reconstructed building inventory increased from 1651 structures at the 1990 benchmark to 3795 at the 2025 benchmark, producing a calculated apparent growth rate of approximately 130%. This estimate exceeds the corresponding estimate for Green colonias, but the difference should be interpreted cautiously because the completeness of the reconstructed historical baselines may vary between classification categories.
Red colonias comprised a smaller share of total properties but produced the highest calculated proportional increase in the reconstructed building inventories between the 1990 and 2025 benchmarks. The largest non-floodplain category consisted of non-platted communities with public district access, containing 759 properties and approximately USD 97 million in total market value. The largest overall Red-colonia category comprised platted communities with public district access located within mapped floodplains, containing 864 properties on approximately 233 acres. Despite its relatively large number of properties, this category included 836 vacant lots and approximately USD 1.1 million in total market value, indicating limited recorded development despite substantial subdivision activity. Across all Red-colonia categories, the reconstructed inventory increased from 449 structures at the 1990 benchmark to 1208 at the 2025 benchmark, producing a calculated apparent growth rate of approximately 169%. Because the baseline includes only older structures remaining in the 2025 appraisal records, this estimate may be overstated and cannot establish that Red colonias experienced greater net historical construction than Green or Yellow colonias. The 2014 Red designation also may not represent the conditions of these communities throughout the full 1990–2025 period.
Together, these findings document substantial variation in property values, development intensity, infrastructure characteristics, and reconstructed building patterns among the 2014 colonia classification categories in Cameron County. Green colonias contain the greatest economic value and largest concentration of established development, while Yellow and Red colonias show substantial apparent additions to the building inventories represented in the 2025 records. The comparative growth estimates are descriptive and subject to potentially unequal survivorship bias across categories. They should therefore be interpreted as reconstructed development patterns rather than precise rankings of historical growth. The differences identify persistent development disparities and variation in floodplain exposure across Cameron County’s colonia communities.
3.2. Hidalgo County Colonias
Among the 2014 classified categories, Green colonias constitute the largest and highest-value segment of colonia communities in Hidalgo County. Development is concentrated within platted communities located in public service district areas and outside mapped floodplains. The largest Green-colonia category contains 10,933 properties occupying approximately 3249 acres and accounts for more than USD 1.34 billion in total market value (Table 2). Its reconstructed building inventory increased from 4085 structures at the 1990 benchmark to 9697 at the 2025 benchmark, producing a calculated apparent growth rate of 137.4%. Green colonias located within mapped floodplains were comparatively limited, containing 313 properties and approximately USD 28.3 million in market value. Across all Green-colonia categories, Green colonias contained 11,389 properties with a combined market value exceeding USD 1.39 billion. The reconstructed inventory increased from 4289 structures at the 1990 benchmark to 10,062 at the 2025 benchmark, producing a calculated apparent growth rate of 134.6%.
Table 2.
Property characteristics, floodplain exposure, property values, and reconstructed building patterns across 2014 colonia classification categories in Hidalgo County, Texas (1990–2025).
Yellow colonias represent a major component of Hidalgo County’s colonia landscape, with recorded development in both floodplain and non-floodplain communities. The largest Yellow-colonia category consists of platted communities located in public service district areas and within mapped floodplains, accounting for 6527 properties, approximately 2310 acres, and more than USD 609 million in total market value. Non-floodplain Yellow colonias contain 3688 properties and approximately USD 345 million in market value. Within the reconstructed inventories, recorded building counts in floodplain Yellow colonias increased from 3065 at the 1990 benchmark to 5696 at the 2025 benchmark, while corresponding counts in non-floodplain communities increased from 1704 to 3260. Across all Yellow-colonia categories, Yellow colonias contained 10,605 properties occupying approximately 3982 acres. The reconstructed inventory increased from 4911 structures at the 1990 benchmark to 9304 at the 2025 benchmark, producing a calculated apparent growth rate of 89.4%.
Red colonias comprise a smaller share of total properties but remain widely distributed across floodplain and non-floodplain environments, with considerable variation in platting status and public service district coverage. The largest Red-colonia category consists of platted communities located in public service district areas and within mapped floodplains, accounting for 1604 properties and approximately USD 208 million in total market value. Another major category includes platted communities located in public service district areas and outside mapped floodplains, containing 1381 properties and approximately USD 122 million in total market value. Non-platted Red colonias outside mapped floodplains comprise 551 properties and nearly USD 99 million in total market value. Across all Red-colonia categories, the reconstructed building inventory increased from 1757 structures at the 1990 benchmark to 3448 at the 2025 benchmark, producing a calculated apparent growth rate of 96.2%. Recorded building development is also present within floodplain-exposed areas. However, the growth estimate may be affected by survivorship bias, and the 2014 Red designation may not represent community conditions throughout the full analysis period.
An additional 11,526 properties were classified as Unknown because the 2014 Texas colonia database did not assign official colonia-condition classifications or associated infrastructure attributes to these communities. These properties accounted for approximately USD 1.45 billion in total market value and contained 9870 buildings in the 2025 records. The size of this category highlights important limitations in the completeness and currency of the statewide colonia database and underscores the need for updated colonia inventories and monitoring systems. The Unknown category represents approximately 30.4% of Hidalgo County’s colonia properties, approximately one-third of its aggregate market value, and approximately 30.2% of buildings recorded in 2025. Excluding these properties would therefore substantially reduce the county inventory and could affect county-level totals and comparisons. However, because the Unknown designation reflects missing classification information rather than a substantive community condition, these properties were retained in county totals and reported separately rather than assigned to Green, Yellow, or Red categories. Classification-specific findings should consequently be interpreted as applying only to properties with available 2014 classifications. The present analysis does not evaluate whether properties assigned to the Unknown classification are spatially clustered. Mapping and formal cluster analysis would help determine whether classification and infrastructure-data gaps are geographically concentrated and should be considered in future updates of the colonia inventory.
Overall, the results document substantial variation across the 2014 baseline classification categories in Hidalgo County. Green colonias contain the largest concentrations of economic value and established development among classified communities, while Yellow and Red categories include substantial numbers of properties within mapped floodplains. The reconstructed inventories indicate apparent building additions across all three categories, but potentially unequal survivorship bias prevents precise comparison of net historical growth. These findings document development disparities and floodplain exposure rather than changes in classification status or comprehensive differences in community resilience. The concentration of properties and recorded development within floodplain-exposed colonias highlights the importance of integrating flood mitigation, infrastructure investment, and adaptation planning into future colonia development strategies.
3.3. Starr County Colonias
Table 3 summarizes property characteristics, valuation metrics, floodplain exposure, and reconstructed building patterns across the 2014 colonia classification categories in Starr County. Compared with Cameron and Hidalgo Counties, Starr County colonias are smaller in overall scale but show large calculated increases between the reconstructed benchmark inventories. A substantial number of properties lack recorded construction years, and older structures absent from the 2025 appraisal records are not represented. Missing year-built values may undercount structures assigned to each benchmark, whereas survivorship bias may understate the earlier baselines and overstate percentage growth. Because the relative magnitude of these effects is unknown, the growth estimates cannot be characterized as either uniformly conservative or uniformly inflated.
Table 3.
Property characteristics, floodplain exposure, property values, and reconstructed building patterns across 2014 colonia classification categories in Starr County, Texas (1990–2025).
Among communities classified in 2014, Green colonias have the highest recorded property values and the largest concentration of established building development in Starr County. Development is concentrated almost entirely within platted communities located in public service district areas. The largest Green-colonia category, located outside floodplain areas according to the 2014 colonia attribute data, contains 3602 properties across approximately 955 acres and accounts for more than USD 315 million in total market value. Its reconstructed building inventory increased from 403 structures at the 1990 benchmark to 1345 at the 2025 benchmark, producing a calculated apparent growth rate of 233.7%. Green colonias identified as located within floodplain areas were comparatively limited, containing 70 properties and approximately USD 3.3 million in market value. Across all Green-colonia categories, there were 3672 properties with a combined market value exceeding USD 318 million. However, 2172 properties lacked recorded year-built information, limiting the completeness of the reconstructed inventories.
Yellow colonias occupy an intermediate position in terms of recorded development and investment. Non-floodplain Yellow colonias contain 1146 properties, approximately 829 acres, and more than USD 118 million in total market value, while floodplain Yellow colonias include 500 properties and nearly USD 38 million in total market value. The reconstructed building inventory increased from 159 structures at the 1990 benchmark to 644 at the 2025 benchmark, producing a calculated apparent growth rate of approximately 305%. At the same time, 918 properties lacked recorded year-built information, limiting the completeness and comparability of the benchmark inventories.
Red colonias comprise the largest share of classified colonia development in Starr County and exhibit substantial variation in platting status, public service district coverage, and floodplain exposure. The largest category consists of platted communities located in public service district areas and outside mapped floodplains, accounting for 2735 properties, approximately 1177 acres, and more than USD 265 million in total market value. Across all Red-colonia categories, there were 3608 properties and approximately USD 346 million in total market value. The reconstructed building inventory increased from 249 structures at the 1990 benchmark to 1433 at the 2025 benchmark. Several Red-colonia categories produced calculated apparent growth rates exceeding 400%, partly because their reconstructed 1990 baselines contained very few recorded structures. Small and potentially incomplete baseline counts can produce large percentage changes and should not be interpreted as precise evidence of exceptionally rapid net historical growth. In addition, 1839 properties lacked recorded year-built information, further limiting the completeness of the benchmark inventories.
Overall, the results document variation across the 2014 baseline classification categories in Starr County. Green colonias exhibit higher property values and larger concentrations of established development, while Yellow and Red colonias produce large calculated increases between the reconstructed benchmark inventories. Floodplain exposure occurs across all categories but is especially evident among Yellow and Red colonias. Compared with Hidalgo and Cameron Counties, Starr County has lower overall property values and higher calculated apparent growth rates. However, missing year-built information, small reconstructed baselines, and survivorship bias prevent precise ranking of historical growth among classifications or counties. The estimates document patterns among structures represented in the 2025 records rather than complete changes in Starr County’s historical building stock. These findings support the need for coordinated infrastructure planning, flood mitigation, and improved longitudinal property-record systems.
3.4. Willacy County Colonias
Table 4 presents property characteristics, valuation metrics, platting status, and development conditions for colonia communities in Willacy County. Unlike Cameron, Hidalgo, and Starr Counties, Willacy County was not included in the Green, Yellow, and Red classification framework applied to the six principal colonia counties—Cameron, El Paso, Hidalgo, Maverick, Starr, and Webb [33]. The absence of these classifications does not imply uniform or unknown community conditions; rather, it indicates that comparable classification data were unavailable for Willacy County in the dataset used for this study. Accordingly, Willacy communities are reported as “Not Classified” rather than treated as a substantive “Unknown” condition category.
Table 4.
Property characteristics, valuation metrics, platting status, and development conditions across colonia communities in Willacy County, Texas (2025).
The results indicate that Willacy County contains the smallest colonia inventory among the four study counties and exhibits substantially lower levels of development and market value than Cameron, Hidalgo, and Starr Counties. A total of 1548 lots were identified, including 1113 properties and 435 vacant lots. Because recorded year-built information was unavailable in the county appraisal data, historical building inventories and growth rates could not be reconstructed.
For descriptive comparison, Willacy County colonia properties were grouped according to the recorded platting status of their corresponding communities. Non-platted colonias account for the majority of recorded development, containing 751 properties distributed across 1080 lots and approximately 794 acres. These communities account for approximately USD 52.9 million in total market value, with a median property value of USD 58,909. Platted colonias contain 362 properties across 468 lots and approximately 267 acres, representing approximately USD 33.7 million in total market value and a median property value of USD 56,932. Although smaller in overall scale, the platted category contains the highest-valued individual properties, with maximum market values exceeding USD 5.5 million, indicating greater variation in recorded property values within formally platted communities.
Overall, non-platted colonias account for approximately 67% of all properties, 75% of total colonia land area, and 61% of aggregate market value in Willacy County. Despite these differences in scale, median property values are similar between platted and non-platted communities, suggesting relatively comparable residential market conditions. The combined market value across all colonia properties exceeds USD 86.6 million.
Unlike the other study counties, Willacy County lacks the recorded year-built information needed to reconstruct historical building inventories and evaluate long-term development trends. Similarly, the absence of Texas Secretary of State (SOS) colonia classifications limits direct comparison of colonia conditions across counties. Nevertheless, the findings demonstrate that Willacy County contains a notable inventory of colonia properties and vacant land despite its smaller overall scale. The predominance of non-platted communities, together with the absence of historical building inventories and community infrastructure attributes, highlights important data gaps that should be addressed in future colonia planning, resilience, and sustainability assessments.
3.5. Comparative Summary
Table 5 summarizes selected parcel characteristics, property-valuation measures, platting status, public service district coverage, colonia-level floodplain status, and reconstructed building patterns across colonia communities in Hidalgo, Cameron, Starr, and Willacy Counties. Hidalgo County contains the largest number of colonia properties (37,926) and the highest aggregate market value (USD 4.34 billion), followed by Cameron County with 18,181 properties and approximately USD 1.81 billion in total market value. Starr County contains fewer properties (8940) but has the highest calculated apparent growth rate, with its reconstructed building inventory increasing by 318.9% between the 1990 and 2025 benchmarks. This percentage should not be interpreted as a complete measure of net historical building growth because the reconstructed baseline excludes structures absent from the 2025 appraisal records and many Starr County properties lack recorded construction years. Willacy County contains the smallest colonia inventory (1113 properties) and the lowest total market value (USD 86.6 million); recorded year-built information was unavailable, preventing reconstruction of historical building inventories and growth rates.
Table 5.
Comparative summary of colonia property characteristics, property values, platting status, public service district coverage, colonia-level floodplain status, and reconstructed building patterns across Hidalgo, Cameron, Starr, and Willacy Counties, Texas.
Substantial differences are also evident in floodplain exposure and recorded development conditions. Hidalgo County has the highest proportion of properties assigned to colonias recorded as within floodplains (23.9%), compared with 12.3% in Cameron County and 7.9% in Starr County. Formal platting is most prevalent in Starr County (95.6%) and Cameron County (93.9%), followed by Hidalgo County (66.3%), and is considerably less prevalent in Willacy County (32.5%). Based on the 2014 colonia database, the proportion of properties located within mapped public service district areas is highest in Starr County (95.6%) and Cameron County (95.3%), followed by Hidalgo County (68.7%). These percentages indicate geographic inclusion within district boundaries rather than verified household connections or the adequacy, reliability, and affordability of services. Communities classified as Green in 2014 account for the largest share of properties in Cameron County (55.6%), compared with Starr County (41.1%) and Hidalgo County (30.0%). These classifications are treated as baseline attributes and may not represent community conditions in 2025.
Overall, the comparative analysis demonstrates substantial geographic variation in colonia development across the Rio Grande Valley. Hidalgo and Cameron Counties contain the largest concentrations of properties and economic value, while Starr County produces the highest calculated apparent building-growth rate despite comparatively lower property values. Because the historical inventories were reconstructed from structures represented in the 2025 appraisal records, growth-rate differences among counties may partly reflect survivorship bias, missing year-built information, and variation in the completeness of county records. Floodplain exposure, public service district coverage, subdivision status, and 2014 colonia classifications also vary considerably across counties. These patterns document an uneven geography of development conditions and environmental exposure within Texas border colonias and support place-based planning and investment strategies tailored to local needs. They should not be interpreted as formal measurements of spatial inequality, comprehensive community resilience, or the causal effects of public policies.
4. Discussion
This study examined development patterns, property values, infrastructure conditions, and floodplain exposure across colonia communities in Cameron, Hidalgo, Starr, and Willacy Counties using parcel-level property records, 2014 colonia classifications, floodplain data, public service district information, and reconstructed building inventories. The discussion is organized into two parts. Section 4.1 interprets the findings in relation to the five research questions, emphasizing geographic variation in development conditions, infrastructure access, reconstructed building patterns, floodplain exposure, and limited physical and economic conditions associated with resilience. Section 4.2 places these findings within the historical and regulatory context of Texas colonia-prevention policies and considers their implications for future planning, infrastructure investment, and adaptation. Because the study is descriptive and lacks a counterfactual or longitudinal policy-evaluation design, it does not estimate the causal effects or long-term effectiveness of specific policies.
4.1. Interpretation of Findings Through the Research Questions
RQ1. Geographic Variation in Property Values, Development Intensity, and Land-Use Characteristics. The findings reveal substantial geographic variation in property values, development intensity, and land-use characteristics across colonia communities in the Rio Grande Valley. Hidalgo County contains the largest colonia inventory and the highest aggregate market value, while Starr and Willacy Counties exhibit lower property values and less intensive development. Communities classified as Green in 2014 generally exhibit higher aggregate property values and greater concentrations of developed properties than those classified as Red. These associations may reflect differences in infrastructure conditions, housing investment, development history, location, market conditions, and other factors; the descriptive analysis does not determine their causes. Previous research has similarly identified relationships among infrastructure access, secure land tenure, public services, property investment, and neighborhood conditions in colonias [7,8,34,35]. Development is most intensive in Hidalgo and Cameron Counties, whereas Willacy County is characterized by smaller and less-developed settlements. Although most colonia properties are located within formally platted subdivisions, substantial numbers of vacant lots remain, particularly within communities classified as Red in 2014. Together, these patterns document persistent geographic disparities in development conditions and economic value across colonia communities.
RQ2. Associations Between Development Patterns, Infrastructure, and Flood Exposure. Development patterns are strongly associated with platting status and access to public utility districts, although the descriptive analysis cannot determine whether these relationships resulted from colonia-prevention policies, infrastructure programs, regional development, or other factors. High rates of platting and widespread access to public service districts document the current prevalence of regulatory formalization and infrastructure coverage in many colonia communities. However, because the study does not include historical measures of platting and service coverage, these conditions should not be interpreted as direct evidence of improvement or policy effectiveness. Green colonias exhibit higher rates of formal platting and public service provision, whereas Red colonias continue to display characteristics associated with lower development quality and infrastructure deficits. However, floodplain exposure remains common, particularly in Hidalgo County, indicating that environmental vulnerability coexists with comparatively high levels of platting and service-district coverage. These findings identify associations among development conditions, infrastructure access, and environmental exposure but do not establish that development regulations or infrastructure investments caused the observed differences.
RQ3. Building Growth and Development Trends, 1990–2025. Building inventories increased substantially across all counties between 1990 and 2025, with growth rates exceeding 100% in Hidalgo and Cameron Counties and surpassing 300% in Starr County. Growth occurred across all colonia classifications, although much of the absolute increase in building inventories occurred within Green and Yellow communities that were classified in 2014 as having relatively better infrastructure and public services. These trends indicate that colonia communities continue to play an important role in regional housing and population growth. The observed concentration of building growth within formally recognized, platted, and serviced communities is consistent with the development patterns encouraged by Texas colonia-prevention policies. However, it does not demonstrate that these policies caused or redirected the growth. The analysis lacks a counterfactual or comparison group and cannot separate potential policy influences from regional economic growth, demographic change, federal and state housing programs, infrastructure investments, or other factors. Growth estimates for Starr County should be interpreted with caution because a portion of structures lacked year-built information and could not be assigned to specific benchmark years.
RQ4. Growth Within Flood-Vulnerable Areas. Despite improvements in development standards, colonia growth continues within flood-vulnerable areas. Significant proportions of colonia properties remain located within mapped floodplains, particularly in Hidalgo County. Continued increases in building inventories suggest that residential expansion has persisted in these vulnerable locations over the past three decades. As a result, many colonia residents remain exposed to flood hazards despite gains in infrastructure and housing conditions. These findings are particularly important in the context of increasing flood risk associated with climate variability and extreme weather events in South Texas. The persistence of development within flood-prone areas suggests that future colonia policies should incorporate flood mitigation, hazard reduction, and climate adaptation measures alongside traditional infrastructure improvements.
RQ5. Characterizing Resilience-Related Physical and Economic Conditions Using Parcel-Level Indicators. Parcel-level property valuation, infrastructure access, building development, and floodplain exposure indicators provide a framework for descriptively characterizing selected physical and economic conditions associated with resilience in Texas border colonias. Higher property values and established building inventories may indicate greater accumulated economic and physical investment, while platting and public service district access reflect regulatory formalization and access to infrastructure. Conversely, lower property values, infrastructure limitations, and floodplain exposure may indicate conditions that constrain development and adaptive capacity. The observed differences among Green, Yellow, and Red colonias therefore identify development disparities and areas of concentrated vulnerability, but they do not establish the resilience capacity of individual households or communities. Because community resilience is multidimensional, these indicators should be interpreted as limited proxies rather than as a comprehensive or direct measure. The analysis does not capture social networks, household adaptive capacity, public health, institutional effectiveness, governance, access to public resources, or post-disaster recovery.
Taken together, the findings document substantial variation in platting, public service district access, property values, building development, and floodplain exposure across colonia classifications and counties. Although many colonia properties are located within platted and serviced communities, development disparities and environmental vulnerabilities remain, particularly in communities with lower property values, limited infrastructure access, and greater floodplain exposure. These patterns suggest that future planning in the Texas border region should prioritize improvements in existing colonia communities alongside measures intended to prevent new substandard development. As population growth, urban expansion, and weather-related hazards continue to affect the Rio Grande Valley, coordinated infrastructure investment, flood mitigation, and adaptation planning will be important for supporting equitable and sustainable development. Parcel-level indicators can assist this process by identifying development disparities and areas of concentrated physical, economic, and environmental vulnerability. However, they should be used alongside household-, social-, health-, and institutional-level information when evaluating community resilience or allocating resilience-related resources.
4.2. Development Patterns in the Context of Texas Colonia-Prevention Policies
4.2.1. Interpretive Scope and Limits of the Policy-Related Findings
The findings can be interpreted within the historical context of Texas colonia-prevention policies implemented beginning in the late 1980s and strengthened throughout the 1990s and 2000s. However, the study was not designed as a formal evaluation of these policies. The policies were developed in response to the rapid proliferation of substandard residential developments along the Texas–Mexico border, where inadequate infrastructure, limited regulatory oversight, and insecure land-development practices contributed to widespread public health, environmental, and socioeconomic challenges [8]. Key policy mechanisms included requirements for water and wastewater infrastructure prior to lot sales (“Build It or Bond It”) [36], subdivision plat approval before development, restrictions on utility connections to unapproved subdivisions, limitations on contract-for-deed transactions, adoption of the Texas Water Development Board’s Model Subdivision Rules, and expanded enforcement authority for counties and municipalities [15,37,38]. Collectively, these measures sought to prevent the creation of new colonias characterized by inadequate infrastructure, poor housing conditions, and limited regulatory oversight.
The present analysis documents development conditions within recognized colonia boundaries but cannot determine whether the observed patterns resulted from these policy interventions. The study does not include a counterfactual, an untreated comparison group, or consistent longitudinal measurements of infrastructure and colonia conditions. It therefore cannot separate the potential influence of colonia-prevention policies from regional economic growth, demographic change, federal and state housing programs, local infrastructure investments, market conditions, or other factors. In addition, statewide colonia monitoring was substantially reduced after 2008, and the most recent comprehensive colonia classification data available for this study were produced in 2014. The analysis consequently cannot determine whether new colonia-like developments have emerged outside the mapped inventory or whether the classifications and infrastructure conditions of recognized colonias changed between 2014 and 2025.
The high prevalence of platted development and public service district coverage observed in several counties is consistent with the regulatory and infrastructure objectives of colonia-prevention policies. Nevertheless, consistency with policy objectives should not be interpreted as evidence that the policies caused these conditions or were independently effective. Comparisons with conditions described in earlier studies provide historical context, but they do not constitute a longitudinal evaluation based on the same communities, indicators, and measurement procedures. Accordingly, the findings are used to describe contemporary development patterns during the broader period of policy intervention rather than to estimate policy effects.
4.2.2. Observed Conditions Relative to Policy Objectives
Prevalence of Formal Platting. The widespread prevalence of platted development across the study region represents an observed development condition that aligns with the regulatory objectives of colonia-prevention legislation. Approximately 66.3% of colonia properties in Hidalgo County, 93.9% in Cameron County, and 95.6% in Starr County are located within formally platted communities. Historically, the absence of formal platting was one of the defining characteristics of colonia development, allowing land to be subdivided and sold without adequate planning, infrastructure provision, or regulatory oversight [7,8]. The high proportions observed in the study counties document the prevalence of formal subdivision status within the available colonia inventory. However, the analysis does not include parcel-level platting records from earlier benchmark years and therefore cannot establish when these properties were platted, whether compliance increased during the study period, or whether colonia-prevention policies caused the observed pattern. Formal platting may also reflect local enforcement, market conditions, regional urbanization, and other regulatory or development processes. Accordingly, these results indicate consistency with policy objectives but do not independently demonstrate policy effectiveness.
Public Service District Coverage. Based on the 2014 Texas colonia geodatabase, approximately 68.7% of colonia properties in Hidalgo County, 95.3% in Cameron County, and 95.6% in Starr County are located within mapped public service district areas. Historically, many colonias lacked access to potable water, wastewater treatment, drainage systems, and other essential public services [2,8,21,39]. Programs such as the Economically Distressed Areas Program, the Model Subdivision Rules, the Colonia Self-Help Centers Program, and the Texas Community Development Block Grant Colonia Fund were intended to expand infrastructure and improve community conditions [40,41,42]. Nevertheless, the present data show geographic inclusion within mapped service areas rather than changes in service coverage over time. They do not establish that individual properties were connected to functioning services or that the services were adequate, affordable, or reliable. Moreover, because public service district status was derived from the 2014 database, the analysis does not capture infrastructure investments or changes occurring between 2014 and 2025. The observed coverage is therefore compatible with the objectives of these programs, but its causes and development over time cannot be determined from the available data.
Distribution of 2014 Colonia Classifications. The Texas colonia classification system categorizes communities as Green, Yellow, or Red based on infrastructure and community conditions, with Green representing comparatively more favorable conditions and Red representing greater infrastructure deficiencies. The distribution of properties among these categories describes colonia conditions recorded in the 2014 classification database. Because equivalent classifications from earlier and later years were unavailable, the analysis cannot determine whether individual communities improved, declined, or changed classification over time. The presence of substantial numbers of properties in Green and Yellow colonias is consistent with the broader objective of improving infrastructure conditions, but it should not be interpreted as evidence that particular policies produced those classifications. Similarly, the 2014 categories should be treated as fixed baseline attributes rather than as representations of colonia conditions in 2025.
4.2.3. Persistent Development and Environmental Challenges
Continued Residential Growth Within Colonias. Building inventories increased from 15,765 to 32,684 structures in Hidalgo County, from 5337 to 11,255 structures in Cameron County, and from 824 to 3452 structures in Starr County between 1990 and 2025. These trends indicate that colonia communities continue to play an important role in regional housing growth. Continued building growth should not, by itself, be interpreted as evidence of either policy success or failure. Colonia-prevention laws were intended primarily to regulate subdivision and infrastructure conditions rather than prohibit all development. The observed growth was concentrated largely within communities recorded as recognized, platted, and serviced in the available datasets. However, the study cannot determine whether regulation redirected development toward these communities or whether the pattern resulted from regional population growth, housing demand, market conditions, infrastructure investment, or other influences. In addition, the absence of comprehensive colonia monitoring after 2008 limits the ability to identify new colonia-like developments outside the mapped boundaries.
Persistence of Red Colonias. Thousands of properties remain located within communities classified as Red in the 2014 database, particularly in Hidalgo and Starr Counties. These communities generally exhibit lower property values, lower recorded levels of public service district coverage, and greater development disadvantages than communities classified as Green or Yellow. This pattern highlights the continued need for remediation in communities that had substantial infrastructure deficiencies when classified in 2014. However, because updated classifications were unavailable, the analysis cannot determine whether these colonias remained Red through 2025 or whether subsequent investments altered their conditions. The persistence of the 2014 Red designation in the analytical dataset therefore should not be interpreted as evidence that prevention policies failed or that no improvements occurred after classification. Rather, it identifies communities that warrant updated assessment and continued attention to infrastructure, housing, and socioeconomic needs.
Persistent Floodplain Exposure. Approximately 23.9% of colonia properties in Hidalgo County are located within mapped floodplains, compared with 12.3% in Cameron County and 7.9% in Starr County. These findings document continued physical exposure to flood hazards within mapped colonia boundaries. Because many colonias were established before contemporary floodplain-management standards and hazard-mitigation practices were widely implemented, existing communities may remain situated in flood-vulnerable locations [43,44]. The analysis does not establish whether flood exposure has increased or decreased over time, nor does it measure household-level vulnerability, flood damages, or adaptive capacity. Nevertheless, the coexistence of residential development and mapped floodplain exposure indicates that infrastructure and subdivision regulation alone may not address all environmental vulnerabilities. Future planning should therefore integrate flood mitigation, drainage improvements, hazard reduction, and long-term adaptation strategies with conventional infrastructure investments.
4.2.4. Prevention Versus Remediation
The findings illustrate the importance of distinguishing between preventing new substandard development and remediating conditions within existing colonias. Residential growth was concentrated largely within communities recorded as platted and located within public service district areas, while substantial development also continued within existing colonia boundaries. These observed patterns align with the regulatory emphasis of colonia-prevention policies, but the study cannot determine whether the policies produced the patterns or whether development conditions changed over time because comparable longitudinal measures are unavailable. At the same time, many properties remain within communities classified as Red in 2014, and substantial numbers are located within mapped floodplains or areas with limited recorded infrastructure access. These conditions indicate that regulatory compliance for new development and remediation of existing deficiencies represent distinct policy challenges. Prevention-oriented regulations do not, by themselves, address accumulated infrastructure deficits, housing needs, floodplain exposure, or socioeconomic disadvantage within established communities. Consequently, future policy should combine continued prevention and monitoring with sustained investment in community upgrading, flood mitigation, infrastructure access, and the broader social and institutional dimensions that support community resilience.
4.2.5. Policy Implications
The findings support a nuanced assessment of Texas colonia-prevention efforts. On the one hand, development within recognized colonia communities appears substantially more regulated than in previous decades. Platting requirements are widely observed, infrastructure availability has improved, and many colonia communities are classified as green or yellow rather than red. These outcomes are broadly consistent with the objectives of the regulatory framework established through EDAP, the Model Subdivision Rules, and related legislation. However, due to data limitations and the absence of comprehensive colonia monitoring after 2008, the emergence of new colonia-like developments outside known boundaries cannot be fully evaluated.
On the other hand, the remediation objective remains incomplete. Red colonias continue to persist, flood vulnerability remains significant, and ongoing population growth continues to place pressure on infrastructure systems. These findings indicate that while development standards have improved, longstanding socioeconomic, environmental, and infrastructure challenges remain embedded within many colonia communities.
Future policy efforts should therefore move beyond prevention and place greater emphasis on resilience-oriented community development. Priorities should include upgrading aging infrastructure, reducing flood vulnerability, improving housing conditions, expanding access to public services, and strengthening long-term monitoring systems. As population growth, urban expansion, and increasingly frequent weather-related hazards continue to reshape the Texas border region, sustainable colonia development will require integrating infrastructure planning, flood mitigation, and improved access to public services within a comprehensive resilience framework. Such efforts will be essential for ensuring that gains achieved through colonia-prevention policies translate into long-term improvements in community well-being, adaptive capacity, and environmental sustainability across the Texas border region.
5. Conclusions
This study provides a comprehensive parcel-level assessment of colonia development, property values, infrastructure conditions, and floodplain exposure across Cameron, Hidalgo, Starr, and Willacy Counties in the Rio Grande Valley. By integrating 2014 colonia classifications with cadastral records, floodplain data, public service district information, and reconstructed building inventories, the analysis documents development disparities and selected physical, economic, infrastructural, and environmental conditions within one of the largest concentrations of colonias in the United States.
The findings reveal substantial variation among counties and 2014 colonia classification categories. Communities classified as Green generally exhibit higher property values, more extensive public service district coverage, and larger concentrations of developed properties than those classified as Red. High proportions of colonia properties are located within platted communities and mapped public service district areas, particularly in Cameron and Starr Counties. These patterns describe differences within the available datasets but do not demonstrate that infrastructure or regulatory policies caused the observed conditions. Moreover, geographic inclusion within a service district does not confirm household-level access to adequate, reliable, or affordable services.
Building inventories reconstructed from the 2025 appraisal records more than doubled between the 1990 and 2025 benchmarks in Hidalgo and Cameron Counties and increased substantially in Starr County. At the same time, many colonia properties remain within mapped floodplains, particularly in Hidalgo County. Property values, infrastructure access, building development, and floodplain exposure were interpreted as limited proxy indicators of physical and economic conditions associated with resilience. They do not constitute a comprehensive measure of community resilience and do not capture household adaptive capacity, social networks, public health, governance, institutional effectiveness, or post-disaster recovery.
The findings should not be interpreted as a causal evaluation of Texas colonia-prevention policies. The study does not include a counterfactual, an untreated comparison group, or consistent longitudinal measures of platting, service coverage, and colonia conditions. The observed prevalence of formal platting and public service district coverage is consistent with the objectives of colonia-prevention policies, but the analysis cannot distinguish potential policy influences from regional economic growth, demographic change, housing programs, market conditions, local infrastructure investments, or other factors. Future policies should therefore combine continued prevention and monitoring with sustained investment in established communities, including drainage and flood mitigation, housing rehabilitation, infrastructure upgrades, and reliable public services.
The findings also demonstrate the importance of reestablishing systematic colonia monitoring and assessment. The classifications and public service district information used in this study reflect conditions recorded in 2014. Individual colonias may have improved, declined, or changed classification between 2014 and 2025; therefore, the Green, Yellow, and Red categories should be interpreted as fixed baseline attributes rather than current conditions. Without updated spatial inventories and comparable performance measures, it remains difficult to identify emerging needs, determine whether new colonia-like developments have formed outside mapped boundaries, or rigorously evaluate infrastructure programs and policy outcomes.
The reconstructed building inventories are also subject to survivorship bias. Counts for the 1990 and 2014 benchmarks include only structures recorded in the 2025 appraisal databases that were built by those years. Buildings demolished, replaced, substantially redeveloped, or otherwise removed from the records before 2025 are excluded. Consequently, the reconstructed baseline inventories may be understated and the calculated growth rates may be overstated. The magnitude of this bias is unknown and may differ across counties, classification categories, and periods, limiting direct comparisons of growth rates. The estimates should therefore be interpreted as changes among structures represented in the 2025 appraisal records rather than complete historical building trajectories.
Future research should integrate updated colonia classifications, historical parcel inventories, subdivision approvals, building-demolition records, remote-sensing products, and local planning data to develop harmonized longitudinal datasets. Household-, social-, health-, and institutional-level measures should also be incorporated to evaluate community resilience more comprehensively. These expanded datasets could support formal distributional measures, spatial-autocorrelation analysis, and multivariable models examining relationships among property values, infrastructure conditions, development patterns, and environmental exposure. A formal policy evaluation would additionally require comparable longitudinal observations, appropriate comparison areas, and an analytical design capable of distinguishing policy effects from other regional influences.
Overall, the study documents continued physical development alongside substantial geographic disparities in property values, infrastructure conditions, formal platting, and floodplain exposure. The results support a combined planning approach that maintains safeguards against new substandard development while prioritizing remediation and investment within existing colonia communities. Sustained infrastructure investment, flood mitigation, housing improvement, updated monitoring, and broader social and institutional assessment will be necessary to support equitable and sustainable development across Texas border colonias.
Author Contributions
Conceptualization, D.K.; methodology, D.K., B.R.S., Y.Z. and K.K.S.; software, D.K.; validation, D.K., B.R.S., Y.Z., K.K.S., B.P., W.L. and A.V.V.; formal analysis, D.K.; investigation, D.K. and A.V.V.; resources, B.R.S., Y.Z., K.K.S., B.P. and W.L.; data curation, D.K. and A.V.V.; writing—original draft preparation, D.K.; writing—review and editing, B.R.S., Y.Z., K.K.S., B.P., W.L. and A.V.V.; visualization, D.K.; supervision, D.K.; project administration, D.K.; funding acquisition, D.K., B.R.S., Y.Z., K.K.S., B.P. and W.L. All authors have read and agreed to the published version of the manuscript.
Funding
This research was funded by Texas General Land Office, grant number 24-200-000-E775/B-18-DP-48-0002.
Institutional Review Board Statement
Not applicable.
Informed Consent Statement
Not applicable.
Data Availability Statement
All datasets analyzed in this study are publicly available from the original data providers. These include the Cameron, Hidalgo, Starr, and Willacy County Appraisal Districts; the Texas Office of the Attorney General (OAG) Colonia Database; the Texas Geographic Information Office (TxGIO) statewide land parcel database; and the U.S. Census Bureau TIGER/Line Shapefiles. The corresponding URLs and references are provided in the manuscript.
Conflicts of Interest
The authors declare no conflicts of interest.
Correction Statement
This article has been republished with a minor correction to the Funding statement. This change does not affect the scientific content of the article.
References
- Kyne, D. A Bird’s-Eye View of Colonias Hosting Forgotten Americans and Their Community Resilience in the Rio Grande Valley. Geographies 2023, 3, 459–476. [Google Scholar] [CrossRef] [Scilit]
- Lewis, C. Texas Colonias: Injustice by Definition. Environ. Earth Law J. 2015, 5, 163–189. Available online: https://lawpublications.barry.edu/ejejj/vol5/iss1/1/ (accessed on 30 June 2026).
- Rivera, D.Z. The Forgotten Americans: A Visual Exploration of Lower Rio Grande Valley Colonias. Mich. J. Sustain. 2014, 2, 119–130. [Google Scholar] [CrossRef] [Scilit]
- U.S. Department of Housing and Urban Development. The Colonias in the 21st Century: Progress Along the Texas–Mexico Border; U.S. Department of Housing and Urban Development: Washington, DC, USA, 2015.
- Martinez, N.; Navarro, M. Fronteras: Why Colonias Exist and Persist Along the Texas-Mexico Border. Fronteras. 2026. Available online: https://www.tpr.org/podcast/fronteras/2026-06-12/fronteras-why-colonias-exist-and-persist-along-the-texas-mexico-border (accessed on 30 June 2026).
- Matthiesen, J. What Now for the Texas Colonias. New Mex. Law Rev. 1997, 27, 1–31. Available online: https://digitalrepository.unm.edu/nmlr/vol27/iss1/2 (accessed on 30 June 2026).
- Donelson, A.J.; Esparza, A.X. (Eds.) The Colonias Reader: Economy, Housing and Public Health in U.S.-Mexico Border Colonias; The University of Arizona Press: Tucson, AZ, USA, 2010. [Google Scholar]
- Ward, P.M. Colonias and Public Policy in Texas and Mexico: Urbanization by Stealth; University of Texas Press: Austin, TX, USA, 1999; Available online: https://www.jstor.org/stable/10.7560/791244 (accessed on 30 June 2026).
- Koerner, M. Colonias in New Mexico: Rethinking Policy Approaches to Substandard Housing Problems. In Proceedings of the Urban Issues Colloquium, “Constructing Urban Space”, Austin, TX, USA, 6 April 2002; Available online: https://digitalcommons.calpoly.edu/cgi/viewcontent.cgi?filename=9&article=1000&context=books_fac&type=additional (accessed on 30 June 2026).
- Barton, J.; Perlmeter, E.R.; Blum, E.S.; Marquez, R.R. Las Colonias in the 21st Century: Progress Along the Texas-Mexico Border; Community Development, Federal Rserve Bank of Dallas: Dallas, TX, USA, 2015; p. 33. Available online: https://fraser.stlouisfed.org/files/docs/publications/frbdal_mono/2015_lascolonias.pdf (accessed on 30 June 2026).
- Ward, P.M.; Way, H.K.; Wood, L. Protecting Homebuyers in Low-Income Communities: Evaluating the Success of Texas Legislative Reforms in the Informal Homeownership Market. Law Soc. Inq. 2016, 41, 152–183. [Google Scholar] [CrossRef] [Scilit]
- Paxton, K. Colonias Prevention Laws. Available online: https://www.texasattorneygeneral.gov/divisions/colonias-prevention/colonias-prevention-laws (accessed on 12 March 2026).
- Millikan, D.M.Y.; Falk, D.; Giberson, T.; Zaia, A.; Niemeyer, S.M.; Cabello, H.; Laing, G.; Loewe, M.; Cho, Y.; Entsminger, T.; et al. 84th Texas Legislature Regular Session: Tracking the Progress of State-Funded Projects that Benefit Colonias; Texas Office of the Secretary of State Colonia Initiatives Program: Austin, TX, USA, 2014.
- Texas Department of Housing Community Affairs. Background on the Colonias. Available online: https://www.tdhca.state.tx.us/oci/background.htm (accessed on 2 April 2026).
- Texas Legislature Online. S.B. No. 827: Relating to Systems for Identifying Colonias and for Tracking the Progress of State-Funded Projects that Benefit Colonias. Available online: https://capitol.texas.gov/tlodocs/79R/billtext/html/SB00827F.HTM (accessed on 10 April 2026).
- Texas Office of the Attorney General. Colonias Database. Available online: https://www.texasattorneygeneral.gov/divisions/colonias-database (accessed on 15 April 2026).
- Texas Legislature Online. SB 99: Relating to the Identification of and Provision of Assistance to Colonias and for Tracking the Progress of State-Funded Projects that Benefit Colonias. Available online: https://www.legis.state.tx.us/billlookup/History.aspx?LegSess=80R&Bill=SB99 (accessed on 1 May 2026).
- Texas Office of the Attorney General. Colonia Identification and Classification System. Available online: https://www.texasattorneygeneral.gov (accessed on 3 April 2026).
- Fregoso, L. The Development of Colonias and the Problems Affecting Residents; The Mexican American Experience Collection; Greenwood Publishing: Westport, CT, USA, 1980. [Google Scholar]
- Esparza, A.X.; Donelson, A.J. Colonias and Housing Conditions Along the U.S.-Mexico Border. In The Colonias Reader: Economy, Housing and Public Health in U.S.-Mexico Border Colonias; University of Arizona Press: Tucson, AZ, USA, 2010; pp. 35–56. [Google Scholar]
- U.S. Government Accountability Office. Rural Housing: Changing Conditions in the Border Colonias of the Southwest; U.S. Government Accountability Office: Washington, DC, USA, 2011. Available online: https://www.gao.gov/products/gao-24-106732 (accessed on 30 June 2026).
- Housing Assistance Council. Housing in the Border Colonias: Rural Research Report; Housing Assistance Council: Washington, DC, USA, 2013; Available online: https://ruralhome.org/wp-content/uploads/storage/documents/rpts_pubs/ts10_border_colonias.pdf (accessed on 30 June 2026).
- Bogolasky, F.; Ward, P.M. Housing, Health, and Ageing in Texas Colonias and Informal Subdivisions. Curr. Urban Stud. 2018, 6, 70–101. [Google Scholar] [CrossRef]
- Hirsch, J. As Funding Dries Up, Colonia Residents Struggle Without Basic Services. 7 August 2017. Available online: https://texasstandard.org/stories/as-funding-dries-up-colonia-residents-struggle-without-basic-services/ (accessed on 30 June 2026).
- Texas Housers. Governor’s Cut of Colonia Oversight Program Will Cost State and Endanger Residents. Available online: https://texashousers.org/2017/06/26/governors-cut-of-colonia-oversight-program-will-cost-state-and-endanger-residents/ (accessed on 9 March 2026).
- Cameron County Appraisal District. GIS Land Parcel Database. 2025. Available online: https://www.cameroncad.org/Pages/Data (accessed on 30 June 2026).
- Hidalgo County Appraisal District. GIS Shapefile Export. 2025. Available online: https://hidalgoad.org/maps (accessed on 30 June 2026).
- Texas Geographic Information Office. Land Parcels 2025: TxG.I.O. DataHub. TxGIO DataHub 2025. Available online: https://data.geographic.texas.gov/ (accessed on 30 June 2026).
- U. S. Census Bureau. 2018–2022 American Community Survey (ACS) 5-Year Estimates and 2022 TIGER/Line Shapefiles: Tract Geodatabase for Texas (ACS_2022_5YR_TRACT_48). 2023. Available online: https://www.census.gov/geographies/mapping-files/time-series/geo/tiger-data.html (accessed on 30 June 2026).
- U.S. Census Bureau. Cartographic Boundary Files: All Geographic Areas, 1:5,000,000 scale (cb_2023_us_all_5m). 2023. Available online: https://www.census.gov/geographies/mapping-files/2023/geo/carto-boundary-file.html (accessed on 30 June 2026).
- Esri Inc. ArcGIS Pro, version 3.5; Esri: Redlands, CA, USA, 2025. Available online: https://pro.arcgis.com/en/pro-app/3.5/help/main/welcome-to-the-arcgis-pro-app-help.htm (accessed on 30 June 2026).
- StataCorp. Stata 14 Base Reference Manual; Stata Press: College Station, TX, USA, 2015; Available online: https://www.stata.com/manuals14/ (accessed on 30 June 2026).
- Williams, R. Tracking the Progress of State-Funded Projects that Benefit Colonias; The Colonia Initiatives Program of the Office of Texas Secretary of State: Austin, TX, USA, 2006.
- Manusov, E.G.; Gomez De Ziegler, C.; Diego, V.P.; Munoz-Monaco, G.; Williams-Blangero, S. Frailty Index in the Colonias on the US-Mexico Border: A Special Report. Front. Med. 2021, 8, 650259. [Google Scholar] [CrossRef] [Scilit] [PubMed]
- Mroz, R.C.; Morales, L.L.; VanDerslice, J. Health and hygiene in the Colonias: Water and disease. Fam. Community Health 1996, 19, 49–58. [Google Scholar] [CrossRef] [Scilit]
- Texas Office of the Attorney General. Colonias Terms: Glossary of Terms & Abbreviations Related to Colonias-Prevention Laws. Available online: https://www.texasattorneygeneral.gov/divisions/colonias-prevention/colonias-terms (accessed on 30 June 2026).
- Texas Water Development Board. Model Subdivision Rules (MSR) Training. Available online: https://www.twdb.texas.gov/financial/programs/edap/msr/index.asp (accessed on 2 March 2026).
- The Colonia Initiatives Program. Senate Bill 99, 82nd Texas Legislature, Regular Session: Tracking the Progress of State Funded Projects that Benefits Colonias. 2010. Available online: https://www.sos.state.tx.us/border/reports/legislation.shtml (accessed on 30 June 2026).
- Paxton, K. Texas Colonia Communities. 2022. Available online: https://www.texasattorneygeneral.gov/colonias (accessed on 30 June 2026).
- Texas Department of Agriculture. Texas Community Development Block Grant (TxCDBG) Colonia Funds. 2025. Available online: https://texasagriculture.gov/Grants-Services/Rural-Economic-Development/-TxCDBG-Rural-Community-Development-Block-Grant/Fund-Categories-and-Applications/Colonia-Funds (accessed on 30 June 2026).
- Texas Department of Housing and Community Affairs. Colonia Self-Help Centers Program. 2025. Available online: https://www.tdhca.texas.gov/programs/colonia-self-help-center-program-shc (accessed on 30 June 2026).
- Texas Water Development Board. Economically Distressed Areas Program (EDAP). 2025. Available online: https://www.twdb.texas.gov/financial/programs/EDAP/ (accessed on 30 June 2026).
- Rivera, D.Z. Unincorporated and Underserved: Critical Stormwater Infrastructure Challenges in South Texas Colonias. Environ. Justice 2023, 16, 203–209. [Google Scholar] [CrossRef] [Scilit]
- So, K.; Marquez, L.; Gibson, K. How Climate Change Is Fueling More Deadly and Destructive Floods. Center for American Progress, 25 November 2025. Available online: https://www.americanprogress.org/article/how-climate-change-is-fueling-more-deadly-and-destructive-floods (accessed on 30 June 2026).
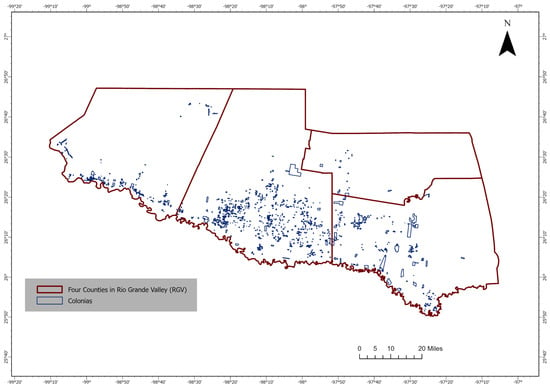
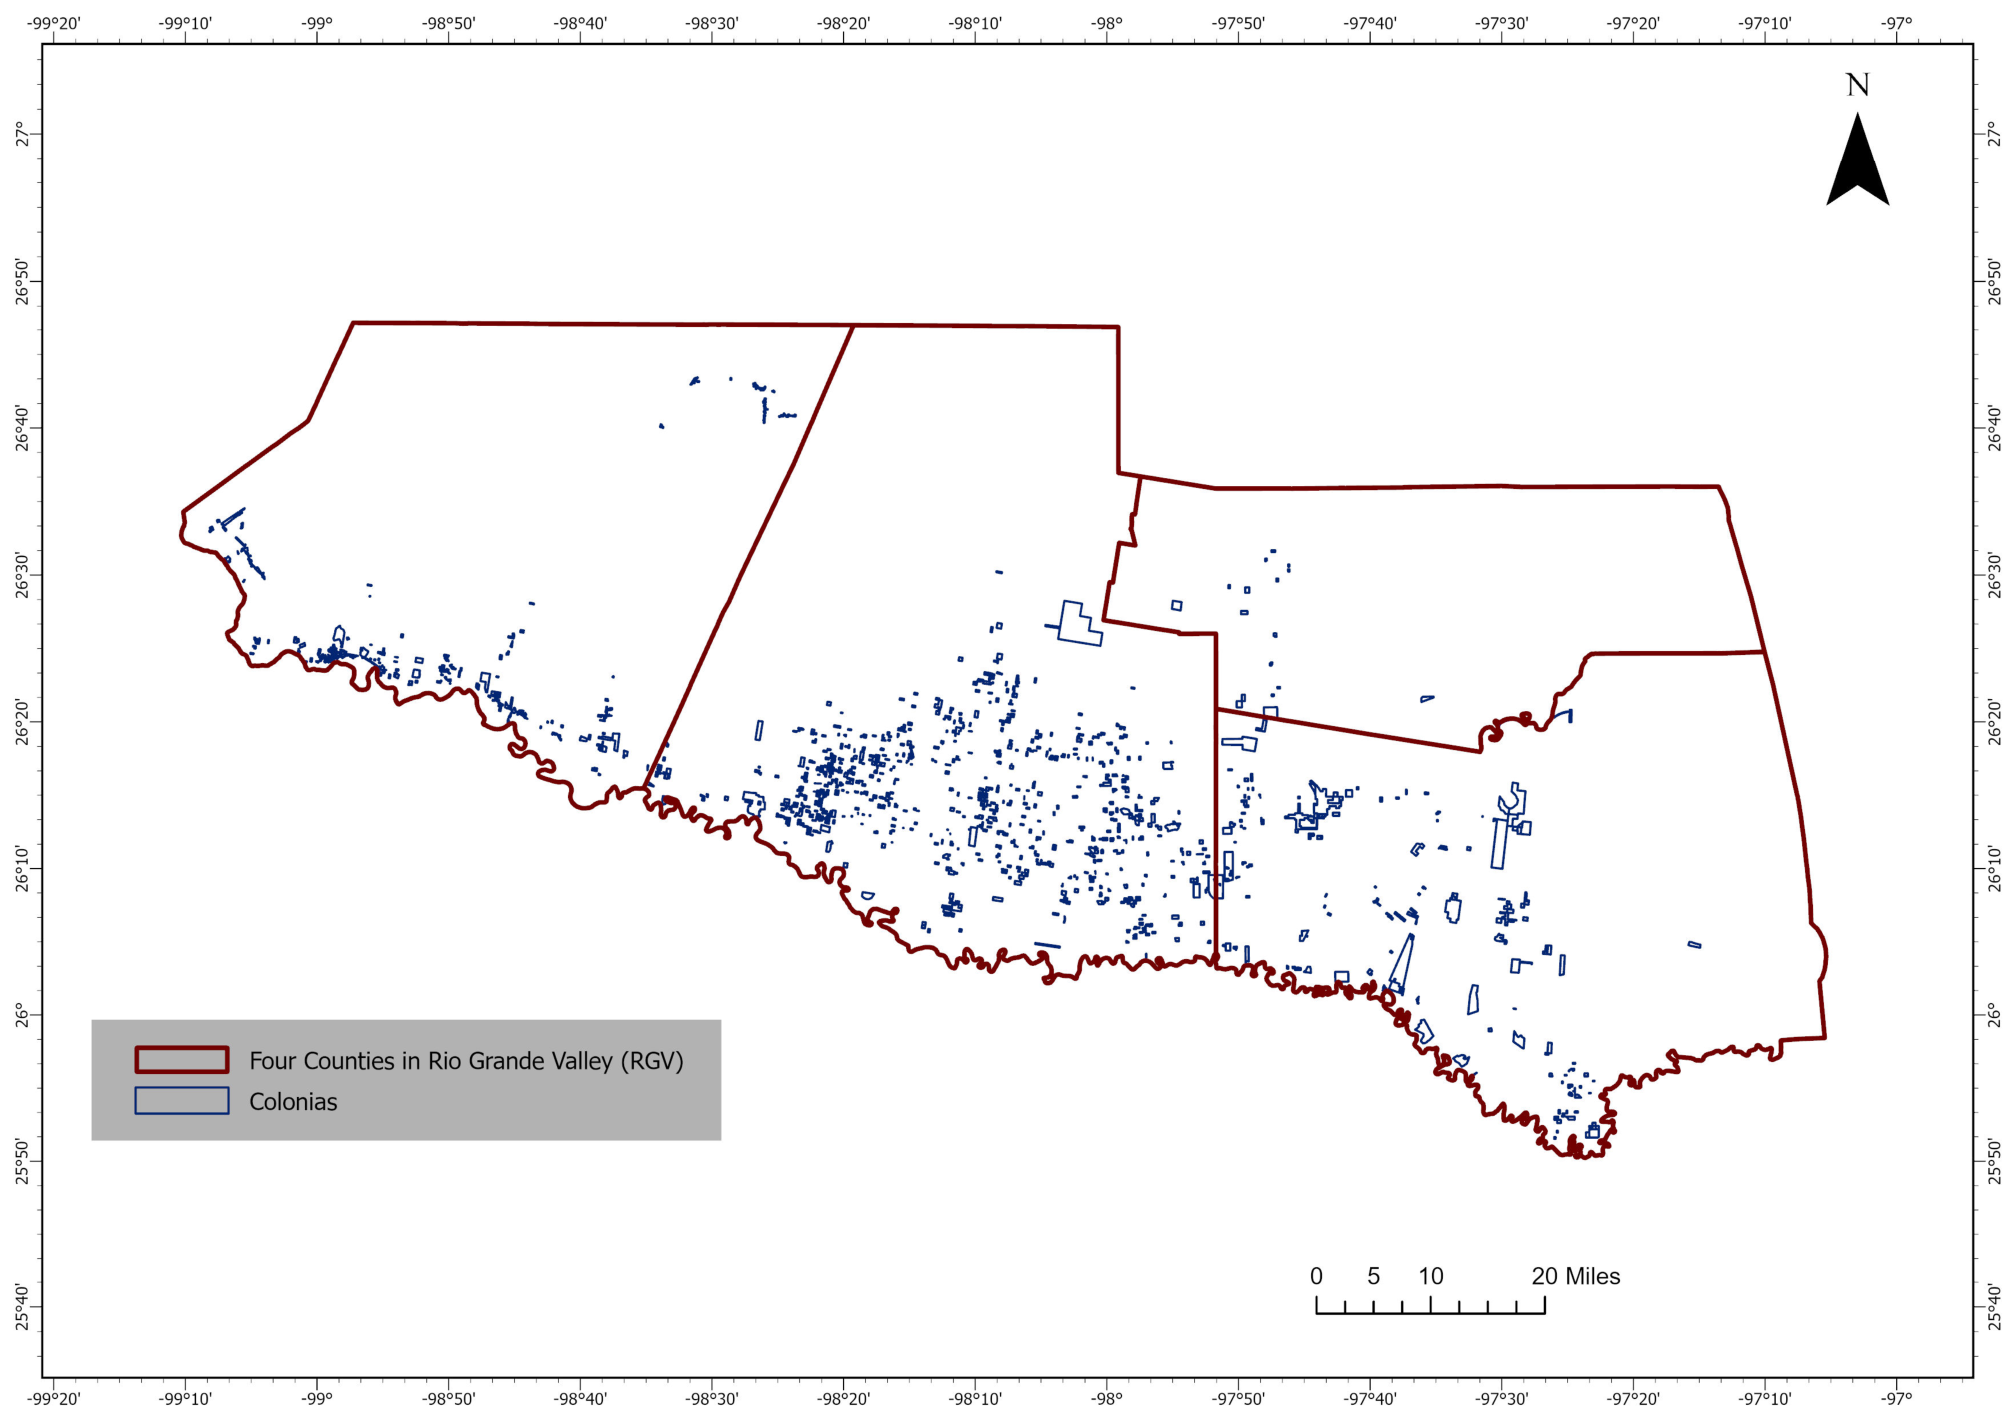
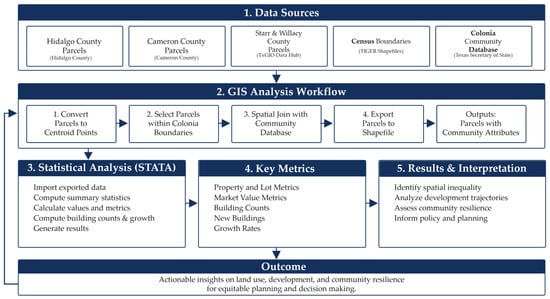
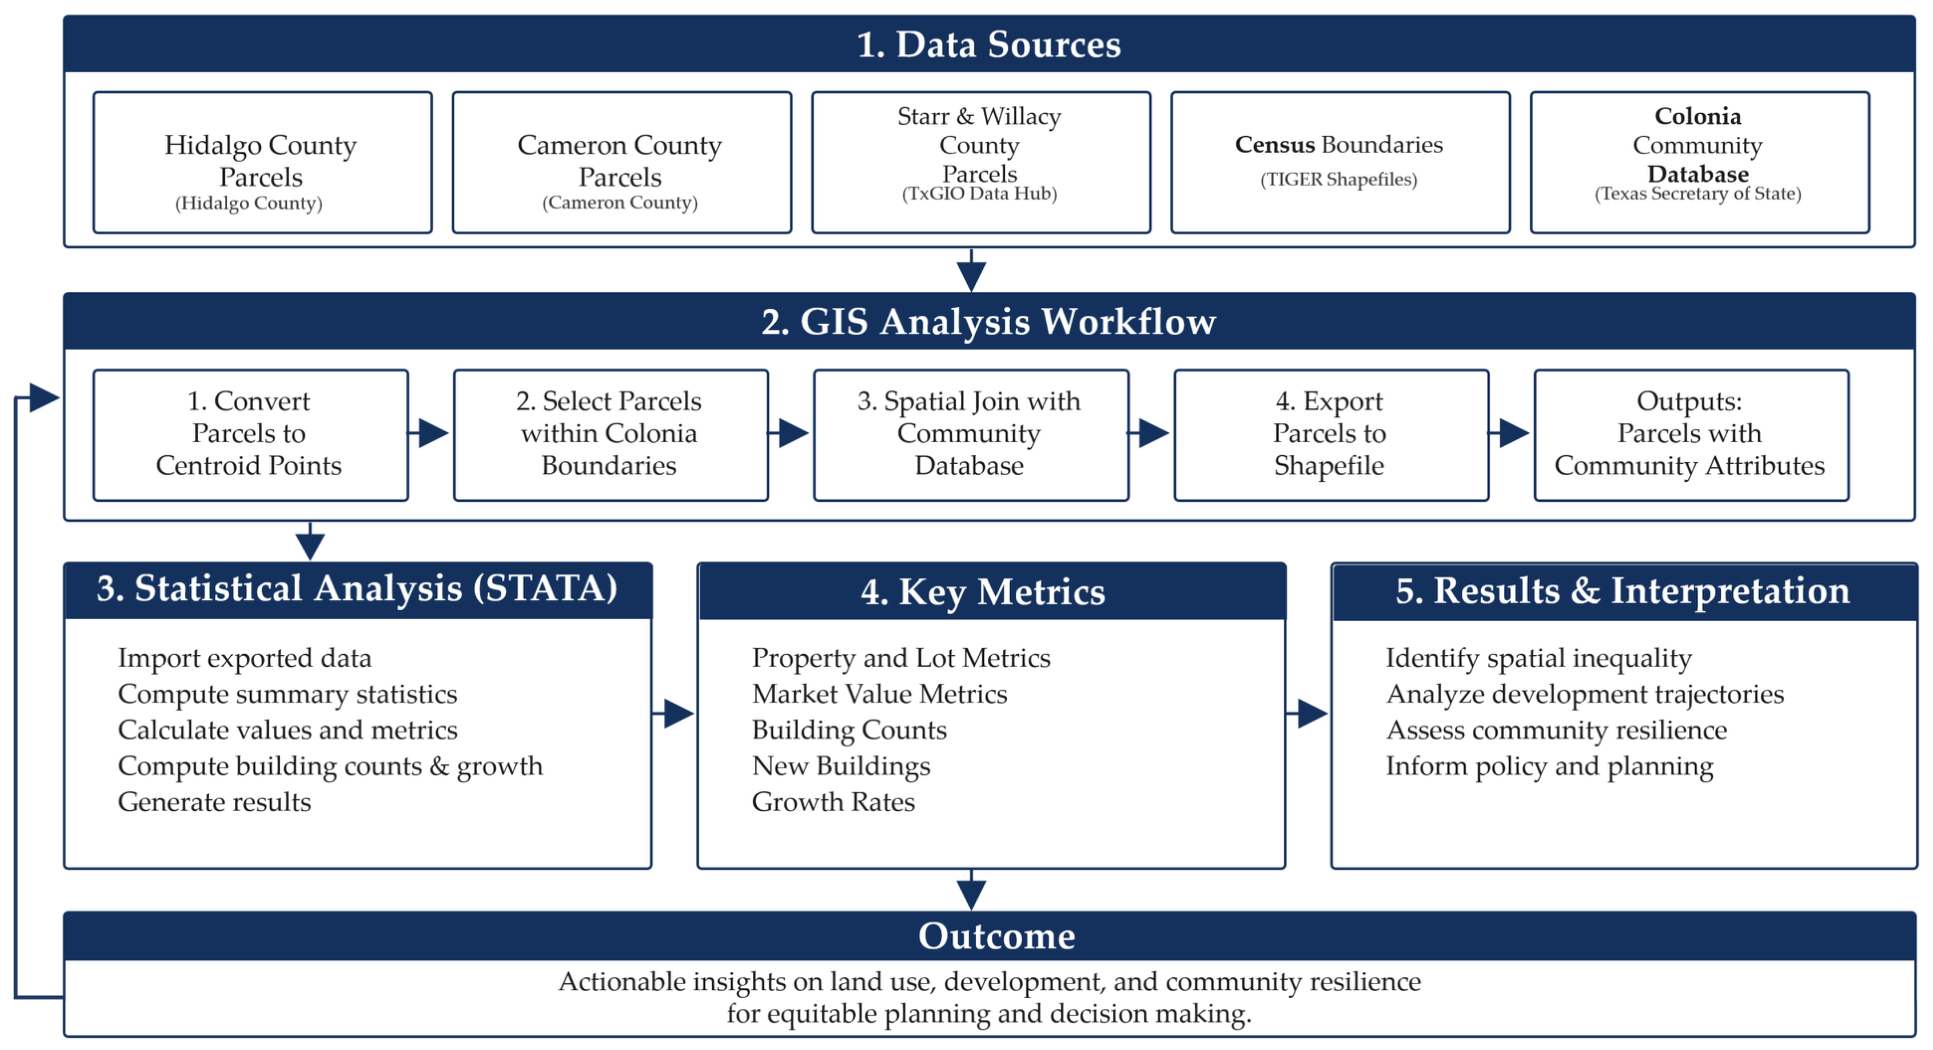
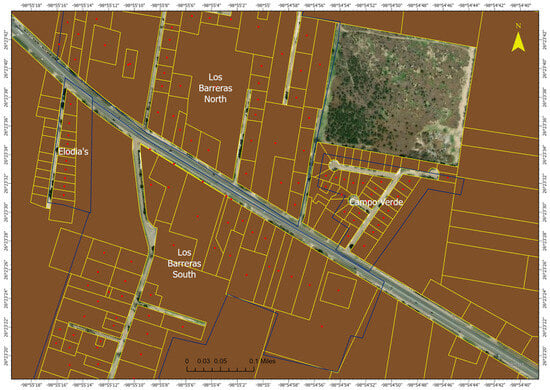
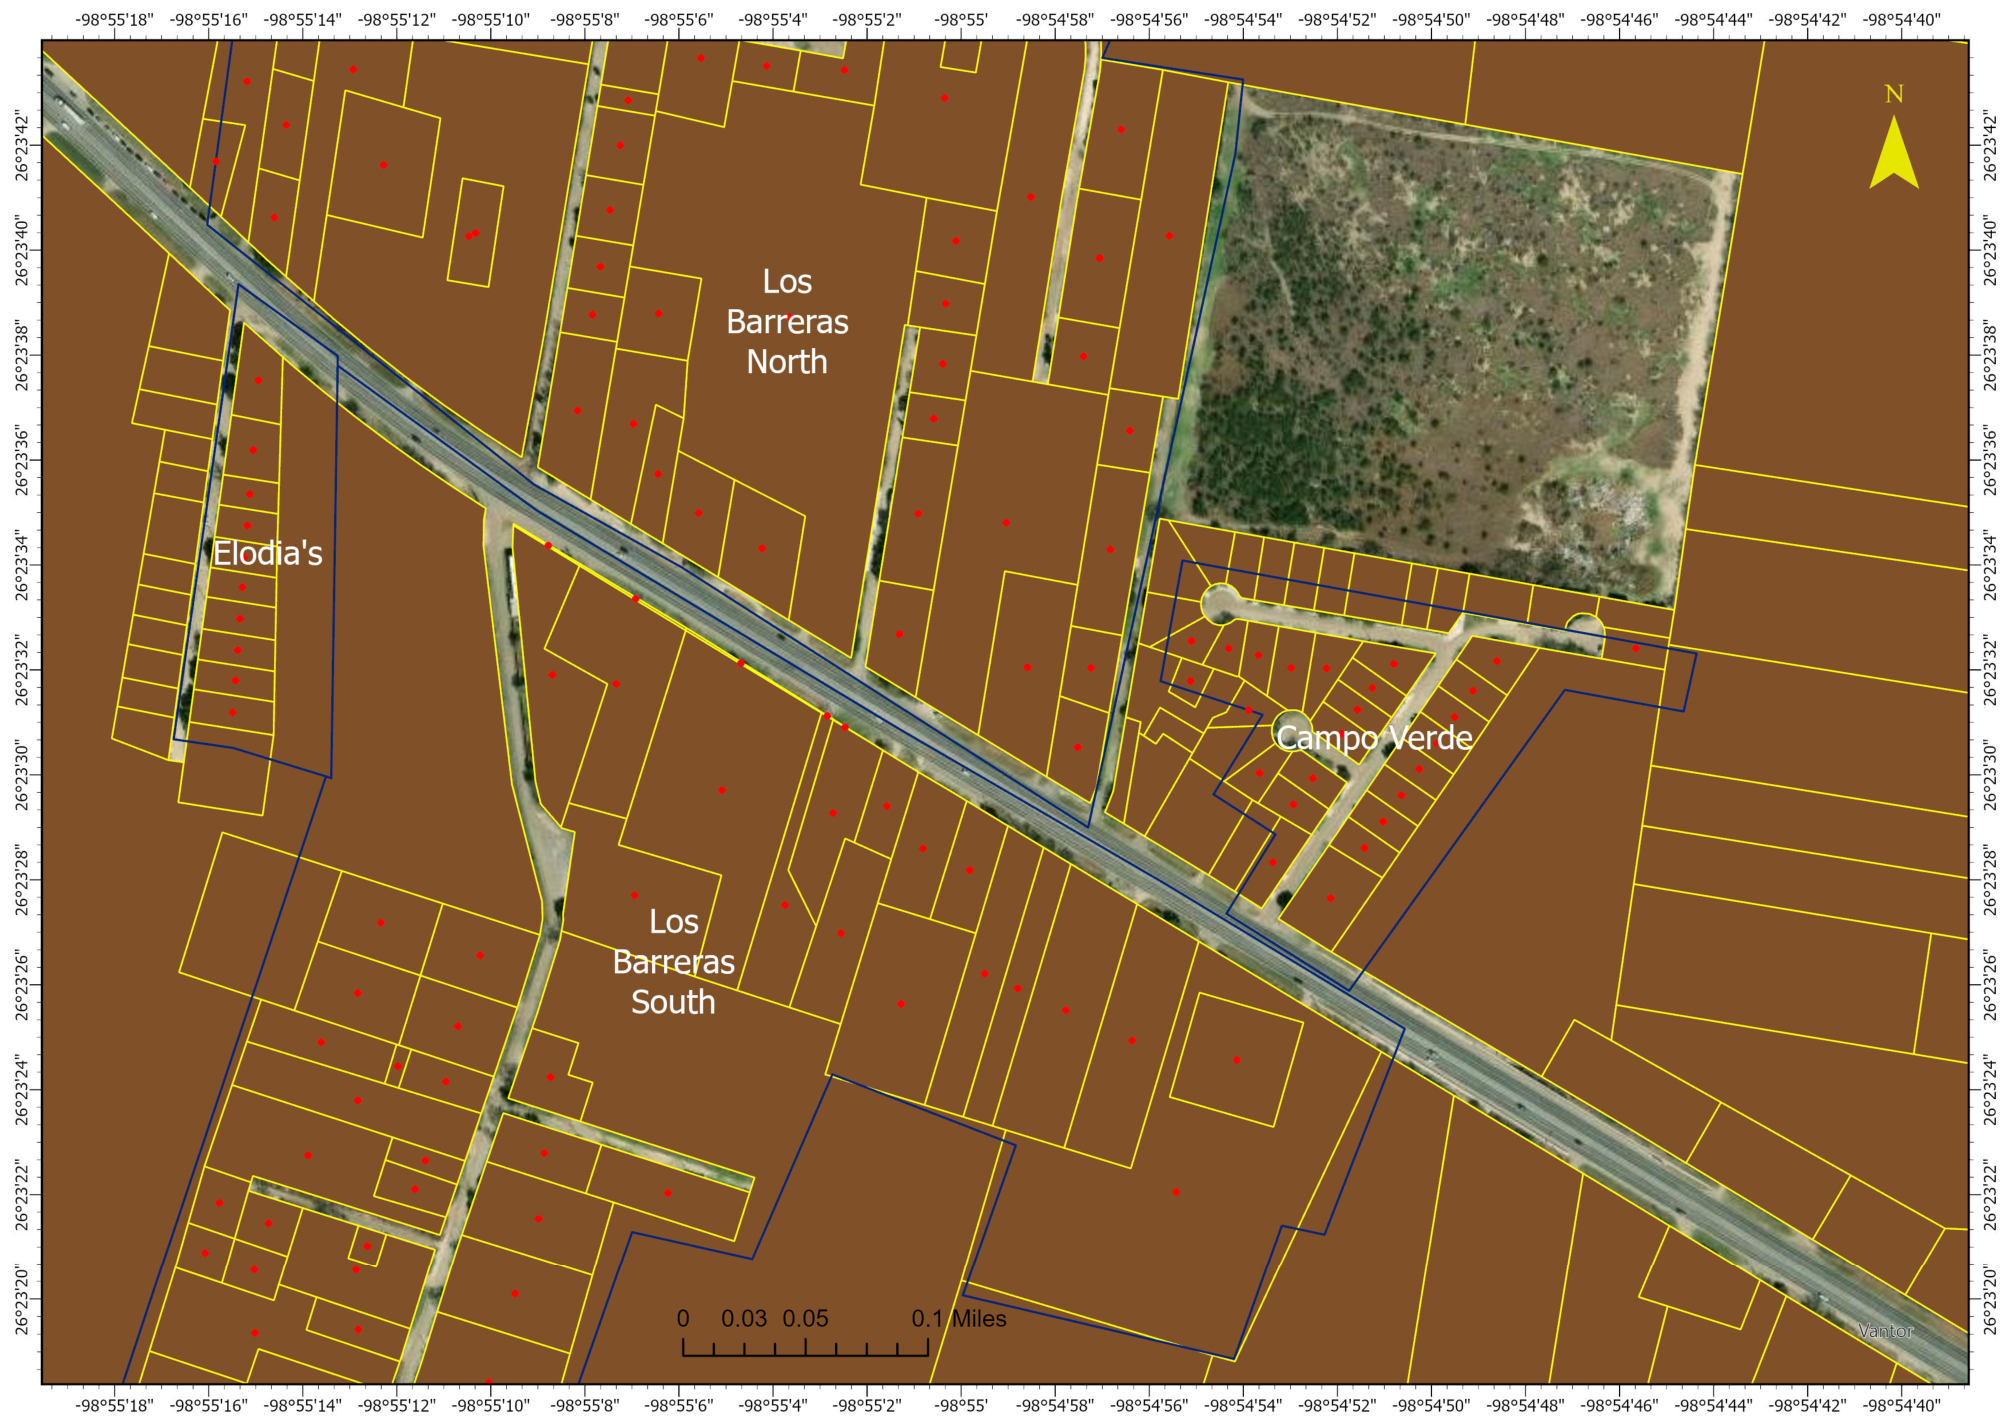

Disclaimer/Publisher’s Note: The statements, opinions and data contained in all publications are solely those of the individual author(s) and contributor(s) and not of MDPI and/or the editor(s). MDPI and/or the editor(s) disclaim responsibility for any injury to people or property resulting from any ideas, methods, instructions or products referred to in the content. |
© 2026 by the authors. Licensee MDPI, Basel, Switzerland. This article is an open access article distributed under the terms and conditions of the Creative Commons Attribution (CC BY) license.