


Abstract
Türkiye’s strategic geographical location offers an exceptional opportunity for solar energy harvesting, yet optimizing large-scale investments requires rigorous pre-assessment methodologies. This study presents a comprehensive multi-criteria techno-economic analysis and real-world validation of a 13.18 MWp solar power plant (SPP) located in Kirsehir, a region characterized by high solar irradiance (1750 kWh/m2). Utilizing PVsyst software, four distinct configurations—monofacial and bifacial modules at 21° and 25° tilt angles—were systematically simulated and evaluated across varying equity-to-loan ratios using key financial indicators (NPV, IRR, PI, and Payback Period). The simulation results identified the 21° bifacial configuration, enhanced by the innovative integration of high-albedo industrial calcite (CaCO3) waste as ground cover, as the optimal engineering solution. Crucially, the accuracy of this optimization was evaluated against 12 months of field data. While the raw measured annual production was recorded as 22,793,323 kWh, the validation was strictly based on the production adjusted for grid outages (23,499,604 kWh). Comparing this adjusted value with the simulated annual generation (22,816,114 kWh) yielded a total annual discrepancy of only 3% and a volumetrically weighted average error of 5.07%. Furthermore, to isolate model fidelity from inter-annual meteorological variability, the validation was assessed using the Performance Ratio (PR). The adjusted volumetrically weighted PR (87.43%) demonstrated a remarkably close alignment with the simulated PR (87.48%), exhibiting a marginal deviation of merely 0.05%. These performance metrics indicate a general consistency between the simulation model and operational field records across the evaluated period. Environmentally, the maximized energy yield of the 21° bifacial system facilitates the avoidance of approximately 6507.58 tonnes of CO2 emissions annually. This research not only establishes the viability of scalable, low-cost calcite ground covers but also provides a highly robust, de-risked decision-support framework for utility-scale PV investments in similar geographic latitudes.
1. Introduction
Solar energy is widely recognized as one of the most commonly used renewable energy sources due to its short installation time, ease of installation and maintenance, and the fact that it can be installed and operated at a significantly lower cost compared to other energy systems. Despite the existence of numerous methods for the generation of energy from sunlight, the fundamental principle of energy production entails the conversion of sunlight into electricity through the utilization of solar panels. Solar energy systems comprise a number of fundamental components interconnected to transform sunlight into electrical energy. These components include solar panels, inverters, cables, structural frameworks, and, in the case of a battery-based system, a charge controller and a sufficient number of batteries to store energy if the system is off-grid, as well as components such as protection, control and monitoring systems. Solar energy systems represent a cost-effective and environmentally sustainable solution that has been designed to meet the energy needs of sectors requiring energy directly via on-grid or off-grid connections. In addition, such systems facilitate the direct sale of the energy produced.
According to the Statistical Review of World Energy, global fossil fuel reserves are finite and their depletion timelines vary significantly by resource type. At current production rates, the proven reserve-to-production (R/P) ratios for oil and natural gas are estimated at approximately 50 years, while coal reserves are projected to last for roughly 110 years [1]. This imminent scarcity, coupled with the environmental impacts of fossil fuel combustion, necessitates an accelerated transition to renewable energy infrastructures [1]. Moreover, the combustion of fossil fuels and the consumption of fossil energy sources result in the release of toxic gases, such as carbon dioxide (CO2), sulphur dioxide (SO2) and nitrogen dioxide (NO2), into the atmosphere, creating serious environmental problems [2]. These environmental challenges contribute significantly to rising global temperatures and ecological degradation. Global energy-related CO2 emissions have experienced a sharp upward trend, increasing from approximately 24.5 gigatonnes (Gt) in 2002 to record levels in recent years, with projections suggesting that without aggressive mitigation, this figure could exceed 40 Gt per year by 2030 [3]. To mitigate these climate risks, a direct transition to environmentally friendly renewable energy sources and a stringent limitation on fossil fuel consumption are essential to prevent further anthropogenic impact on the planet.
In an effort to reduce its reliance on fossil fuels and ensure reliable energy security, Türkiye has initiated a strategic transition towards renewable energy sources with the objective of enhancing the stability of its energy system. This significant tendency contributes to enhancing resilience against potential disruptions in Türkiye’s natural gas supply and shortages of fossil fuels [4]. In addition to this resilience, Türkiye has initiated the exploration of diverse and multi-faceted alternatives to ensure the safe and sustainable supply of electricity without posing any threat to the energy sector. By transitioning towards a diverse array of renewable energy sources in its electricity generation, Türkiye has witnessed an increase in its renewable energy share, rising from 41% in 2013 to 46.4% in 2023. Projections indicate that this figure is poised to reach 70% by 2030 [5].
As stated in the Atlas of Türkiye’s Solar Energy Potential (GEPA) report by the Ministry of Energy and Natural Resources, the country’s total annual sunshine duration has been determined to be 2737 h. This figure indicates that the average daily sunshine duration is approximately 7.5 h.
A number of studies in the relevant literature focus specifically on the solar energy potential of Central Anatolia (the Aksaray, Kirikkale and Kirsehir regions) and the efficiency of power plants in these areas. The PVsyst software (Version 7.4.8), a globally recognized program, has been utilized as the primary tool for modelling solar energy systems and comparing performance. The majority of articles that have been published on this subject compare the production advantages of traditional monofacial (single-sided) panels with bifacial (double-sided) panels from a technical or economic perspective. These articles emphasize the positive effects of renewable energy investments on carbon emission reduction.
Whilst the study by Cosgun and Demir [6] focuses on floating PV systems, other studies examine ground-mounted power plants. The study by Yıldırım and Düzkaya [7] compares the accuracy of the software used in production (PVGIS vs. PVsyst), as well as their similar and superior aspects. The study by Kumbaroğlu et al. [8] focuses on price uncertainty and SWOT analysis using Monte Carlo simulation. The power plant capacities examined in the studies range from 1 MW to 35 MW.
The present study, however, focuses on design optimization and financing models. The study’s contribution to the existing literature is most significant in the field of Ground Albedo selection. Whilst other articles address the albedo effect using general data, this study proposes the use of calcite (CaCO3) waste material to increase bifacial gain. Furthermore, it compares the technical and economic advantages of this specific material. In a similar manner, the combination of tilt angle and technology is subject to variation in accordance with the terrain topography of the Central Anatolia region. However, the study makes a comparison within the tilt angle, and a 21° tilt angle is optimal for bifacial panels and a 25° tilt angle for monofacial panels, particularly on south-facing slopes. This provides a design guide that varies according to the technology. The Financial Structure analysis assesses the project’s feasibility not only through technical data but also by detailing various financing scenarios, including 100% equity, 50% loan and 25% equity. This creates a decision-support mechanism for investors. Furthermore, when establishing feasibility, the focus on self-consumption and net metering grounds the unit price of electricity not merely on market prices, but within the framework of the plant’s consumption profile and monthly net metering logic, thereby providing a realistic basis.
2. Materials and Methods
In this section, a design comparison is conducted by examining various simulations of a 13.18 MWp solar power plant utilizing the PVsyst software, with the consideration of mono- and bifacial panels, orientation with grouping variations, and panel tilt angles.
The PVsyst software constitutes a software package utilized for the purpose of simulating and comparing solar energy systems. The purpose of this software is to evaluate the performance and efficiency of solar power plants. The simulations are based on a range of parameters, including geographical location, climate data, panel type, efficiency, tilt angle and inverter selection. The software then presents the simulation results in the form of energy production reports, graphs and tables.
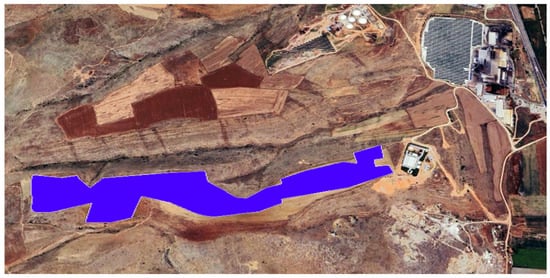
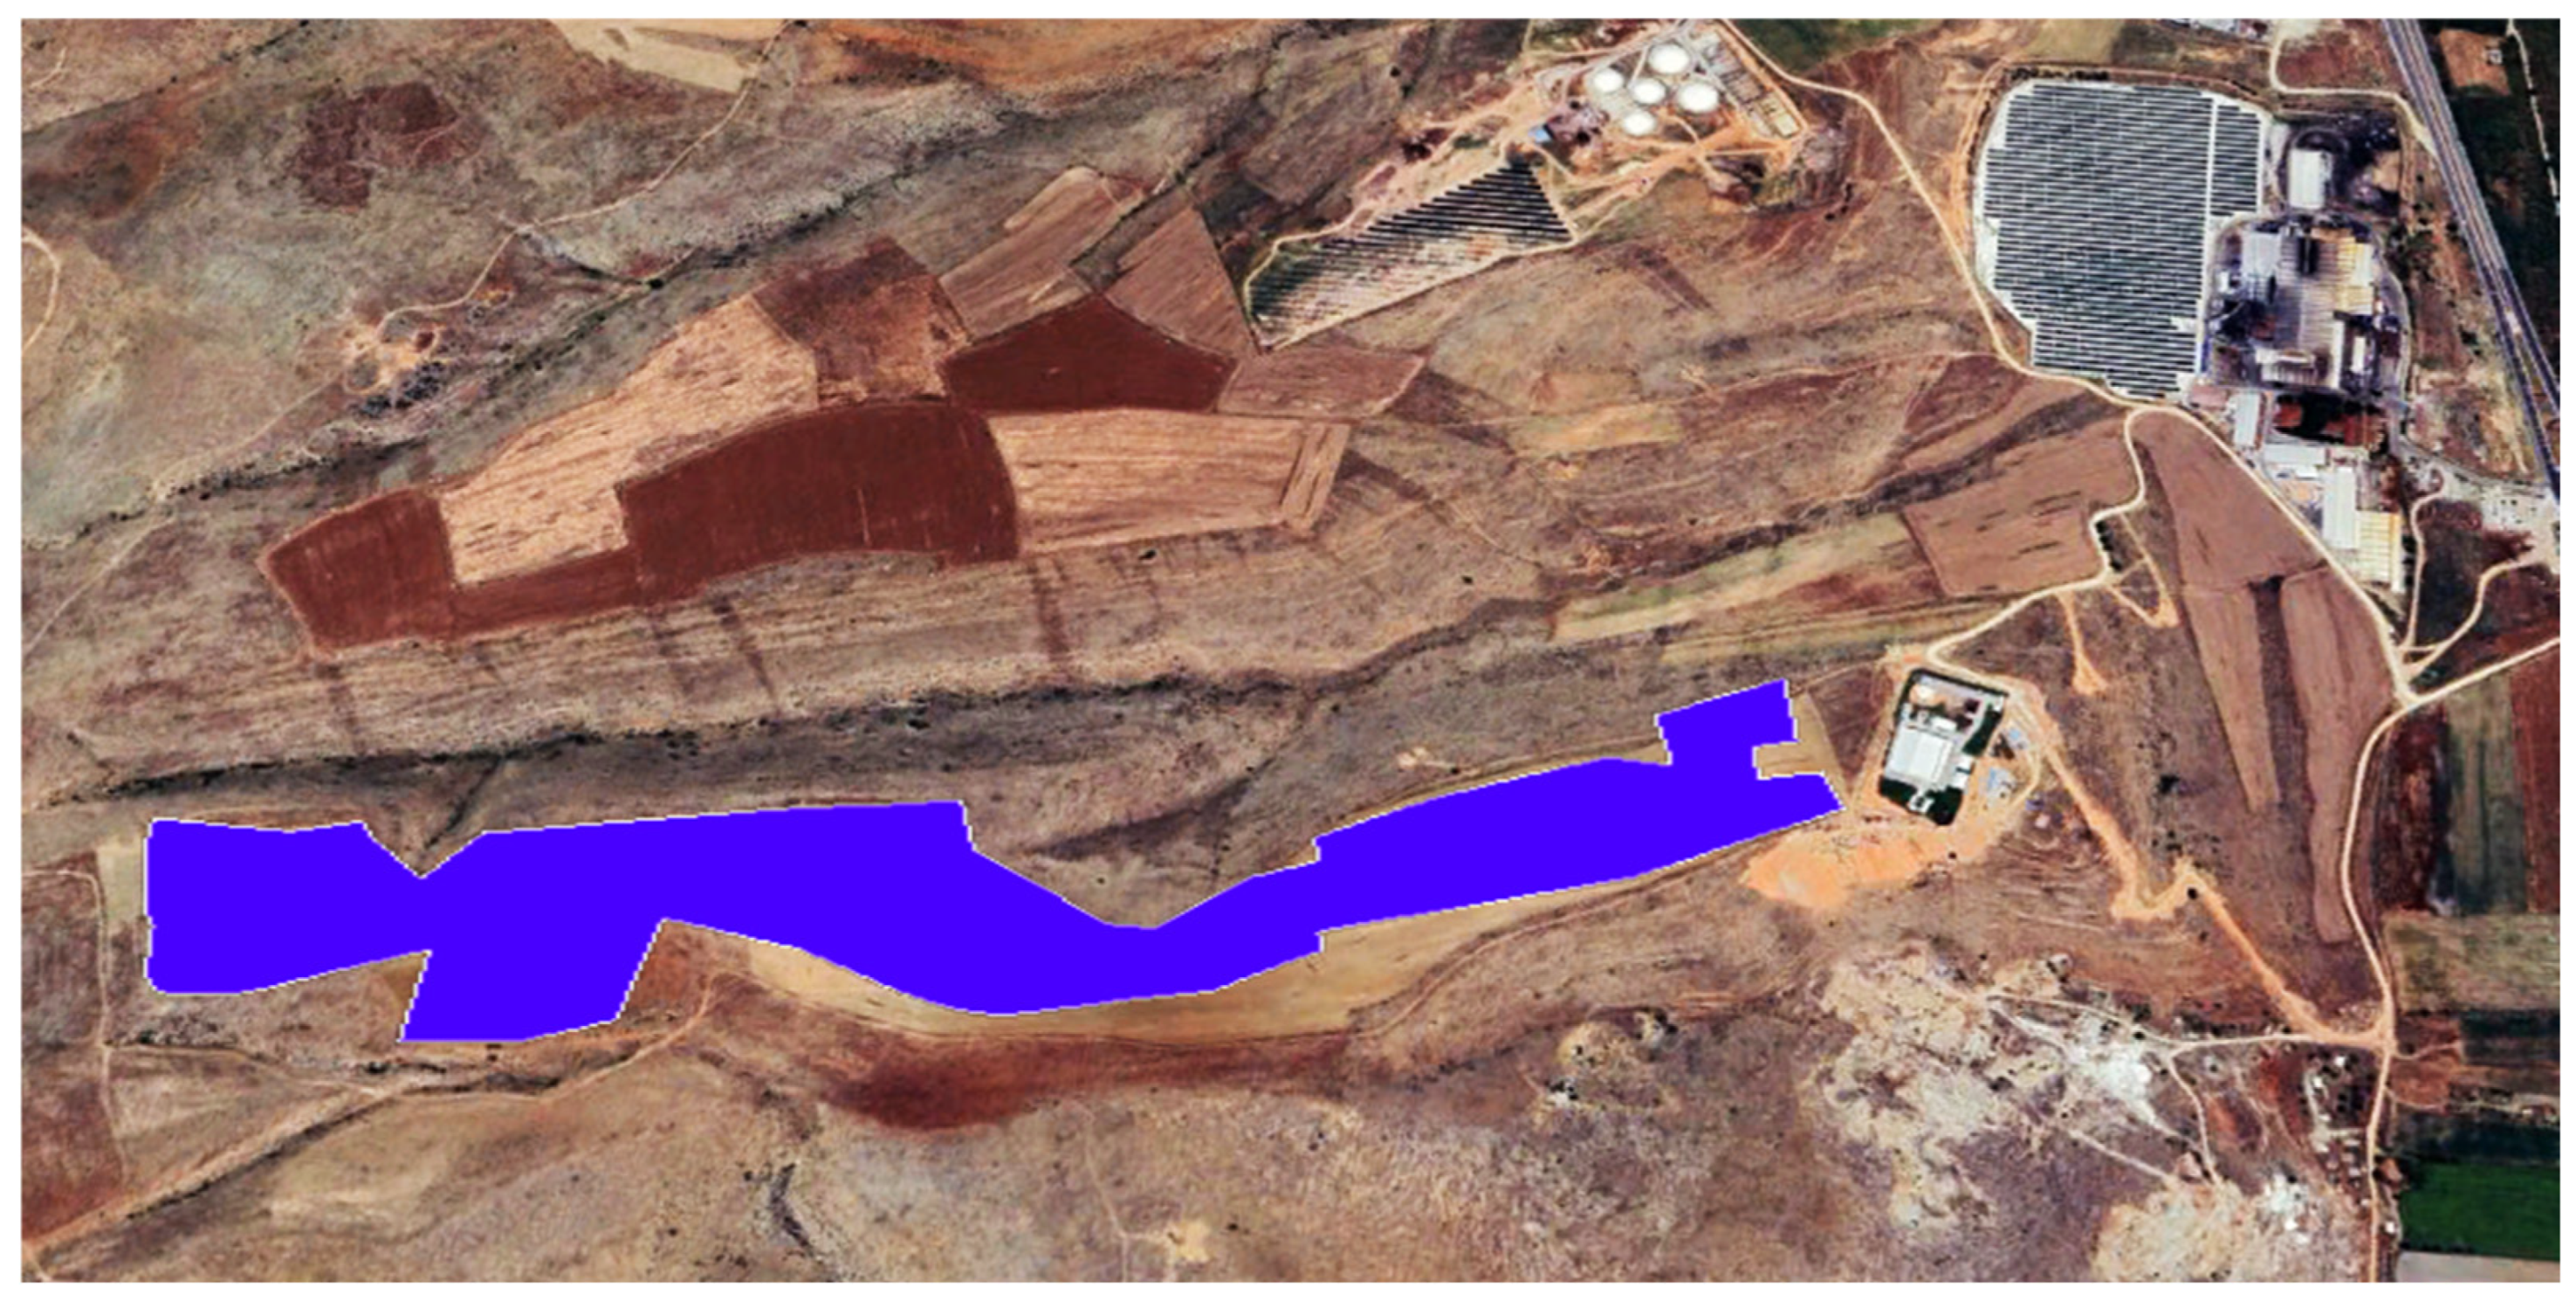
The solar power plant project is located in Kirsehir Province, in the Central Anatolia Region of Türkiye, at the following geographical coordinates: 39°14′32″ N latitude and 34°6′39″ E longitude, at an elevation of 1175 m above sea level (Figure 1). The annual mean temperature is approximately 11.3 °C, and the region receives an average of 1750 kWh of solar radiation per square meter per year. The planned solar power plant has a projected solar radiation level and an installed capacity of 13.18 MWp; however, due to the terrain, different tilt angles, different array configurations and different panel structures have resulted in varying production performance.
Figure 1.
Solar power plant site. The blue shaded area indicates the Solar Power Plant (SPP) area.
In order to ascertain the most suitable option for the site, a simulation was conducted using monocrystalline, bifacial and MonoPERC solar panels with a nominal power of 580 Wp and the same 22.50% efficiency (Talesun BIPRO_TM7G72M _16BB-30mm frame). These panels were positioned at 21° and 25° angles in relation to a solar power plant to determine the most suitable option for the site. In each design scenario, the solar power plant has a capacity of 13.18 MWp and consists of 22,724 solar panels.
It is imperative to undertake ground preparation prior to installation in order to optimize production performance. The compaction of the ground with a suitable material following a thorough ground preparation phase is instrumental in preventing the formation of mud and dust during the operational period. However, for bifacial panels, it has been demonstrated that merely levelling the ground will not, in isolation, engender a substantial alteration in the production process. Consequently, following the completion of ground preparation, the utilization of light-colored paints or materials exhibiting a high light reflectance ratio on the ground surface will enhance the amount of electrical energy generated from the rear side of the bifacial panel.
In the implementation of this project, crystallized calcium carbonate (CaCO3), commonly known as calcite, which has the highest reflectance, was used. The calcite supplied is a by-product of industrial calcite production, resulting in significant cost savings. The material’s white coloration and bright crystalline structure enable it to reflect a significant proportion of the light falling on it.
Calcite (CaCO3) exhibits a notably high albedo value, attributable to its white and lustrous nature. The reflectance capacity of pure or white calcite minerals is typically observed to range between 0.7 and 0.9. This value indicates that calcite reflects the vast majority of sunlight that falls on it, meaning it possesses a high reflectance capacity.
The selection of ground cover fundamentally dictates the rear-side energy yield of bifacial modules. Conventional utility-scale PV plants are typically installed on standard terrains such as dark-colored soil (albedo ~0.05–0.15), green grass (~0.20–0.25), or standard grey crushed stone aggregates (~0.18–0.22). While surfaces like fresh snow (0.55–0.75) or white concrete exhibit high reflectivity, their application is either seasonally restricted or economically prohibitive for large-scale projects. In contrast, this study leverages industrial calcite (CaCO3) waste as a cost-effective alternative. Although pure calcite can achieve theoretical reflectance values of 0.7 to 0.9, an operational albedo of 0.40 was conservatively adopted in this simulation to account for terrain profile, reflection losses, and inherent material impurities. Consequently, the utilization of calcite provides a highly reflective and sustainable alternative that significantly outperforms conventional ground conditions.
The utilization of calcite, a by-product with dimensions and mass comparable to gravel, ensures a supply at a cost that is solely the cost of transportation. The proximity of a calcite plant to the project site has the additional benefit of minimizing transport costs. The purchase cost of standard aggregate, when combined with transport expenses, remains relatively high. Furthermore, the light reflectance of aggregate is relatively low, which makes the use of calcite highly attractive. Notwithstanding the fact that bifacial panels are not a constituent element of the project, the requirement for compacted backfill material positions calcite as a cost-effective alternative to other materials.
In circumstances where photovoltaic panels are subject to frequent cleaning, the resultant dirty water that is discharged onto the ground during the cleaning process can lead to the contamination of the ground-level calcite, thereby diminishing its reflectivity. In operating conditions where cleaning is not required, however, natural climatic conditions (snow and rain) ensure that the panels remain clean and retain their original properties. As was the case in another pilot project commissioned in 2021, for facilities that become frequently soiled and require cleaning, the calcite will turn grey over the long term, resulting in a value of 0.20. This value is also favorable in comparison to the albedo value of standard basalt-based crushed stone, which ranges from 0.18 to 0.22 without ground reflection loss. However, in a novel design project where the panels are cleaned by natural snow and rainfall and no external cleaning is carried out, meaning the calcite will not become soiled, the albedo value of the calcite, which varies between 0.7 and 0.9, has been selected as 0.4, taking into account ground reflection losses throughout the year depending on the angle of the sun’s incidence. The parameter was established based on a comparative study of three on-site Sungrow PC-4 meteorological stations, including one configured to monitor albedo. It was observed that approximately 50% of the incident irradiance is reflected from the calcite surface directly toward the sensor in a non-diffuse (quasi-specular) manner, depending on the angle of incidence. This phenomenon is primarily attributed to the terrain profile, reflection losses, and impurities within the calcite.
Due to the structural design of the operational power plant, all bifacial modules were installed over calcite from the project’s inception. Consequently, a direct empirical comparison with a physical bifacial control group lacking calcite was not feasible, representing a limitation of this study. To model the environmental baseline and isolate the potential impact of the calcite application, this study utilized a one-year hourly time series of albedo and global horizontal irradiance (GHI) data extracted from the NASA POWER database. To ensure the accuracy of the localized solar resource data, this satellite-derived baseline was cross-validated using one month of empirical irradiance measurements obtained from three on-site meteorological stations. This combination of long-term satellite data and site-specific ground measurements provided a robust foundation for evaluating the rear-side generation enhancement.
It is important to note the environmental context when comparing the current utility-scale facility with the 2021 pilot plant, which remains in continuous operation. The pilot facility is located in an area exposed to industrial particulate pollution (coal dust). Over time, routine manual cleaning of the modules at that site caused soiled runoff to accumulate on the underlying calcite, gradually reducing its operational albedo to approximately 0.20. Conversely, the current utility-scale project is situated in a cleaner environment where natural precipitation has been sufficient for module maintenance. The absence of heavily soiled runoff has allowed the calcite layer at the new site to retain its cleaner state and maintain an operational albedo of 0.40. This contrast indicates that local environmental pollution and module cleaning practices play a significant role in the long-term optical performance of ground reflectors.
2.1. Design Variants and Simulation Parameters
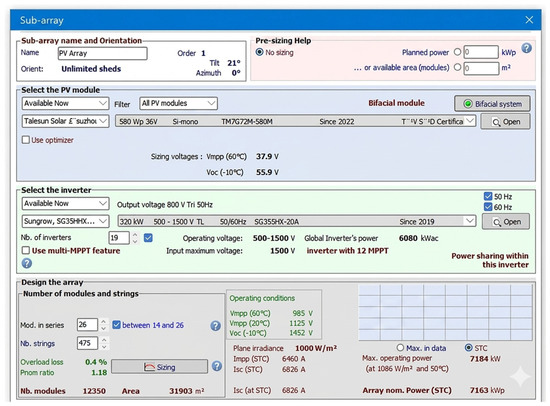
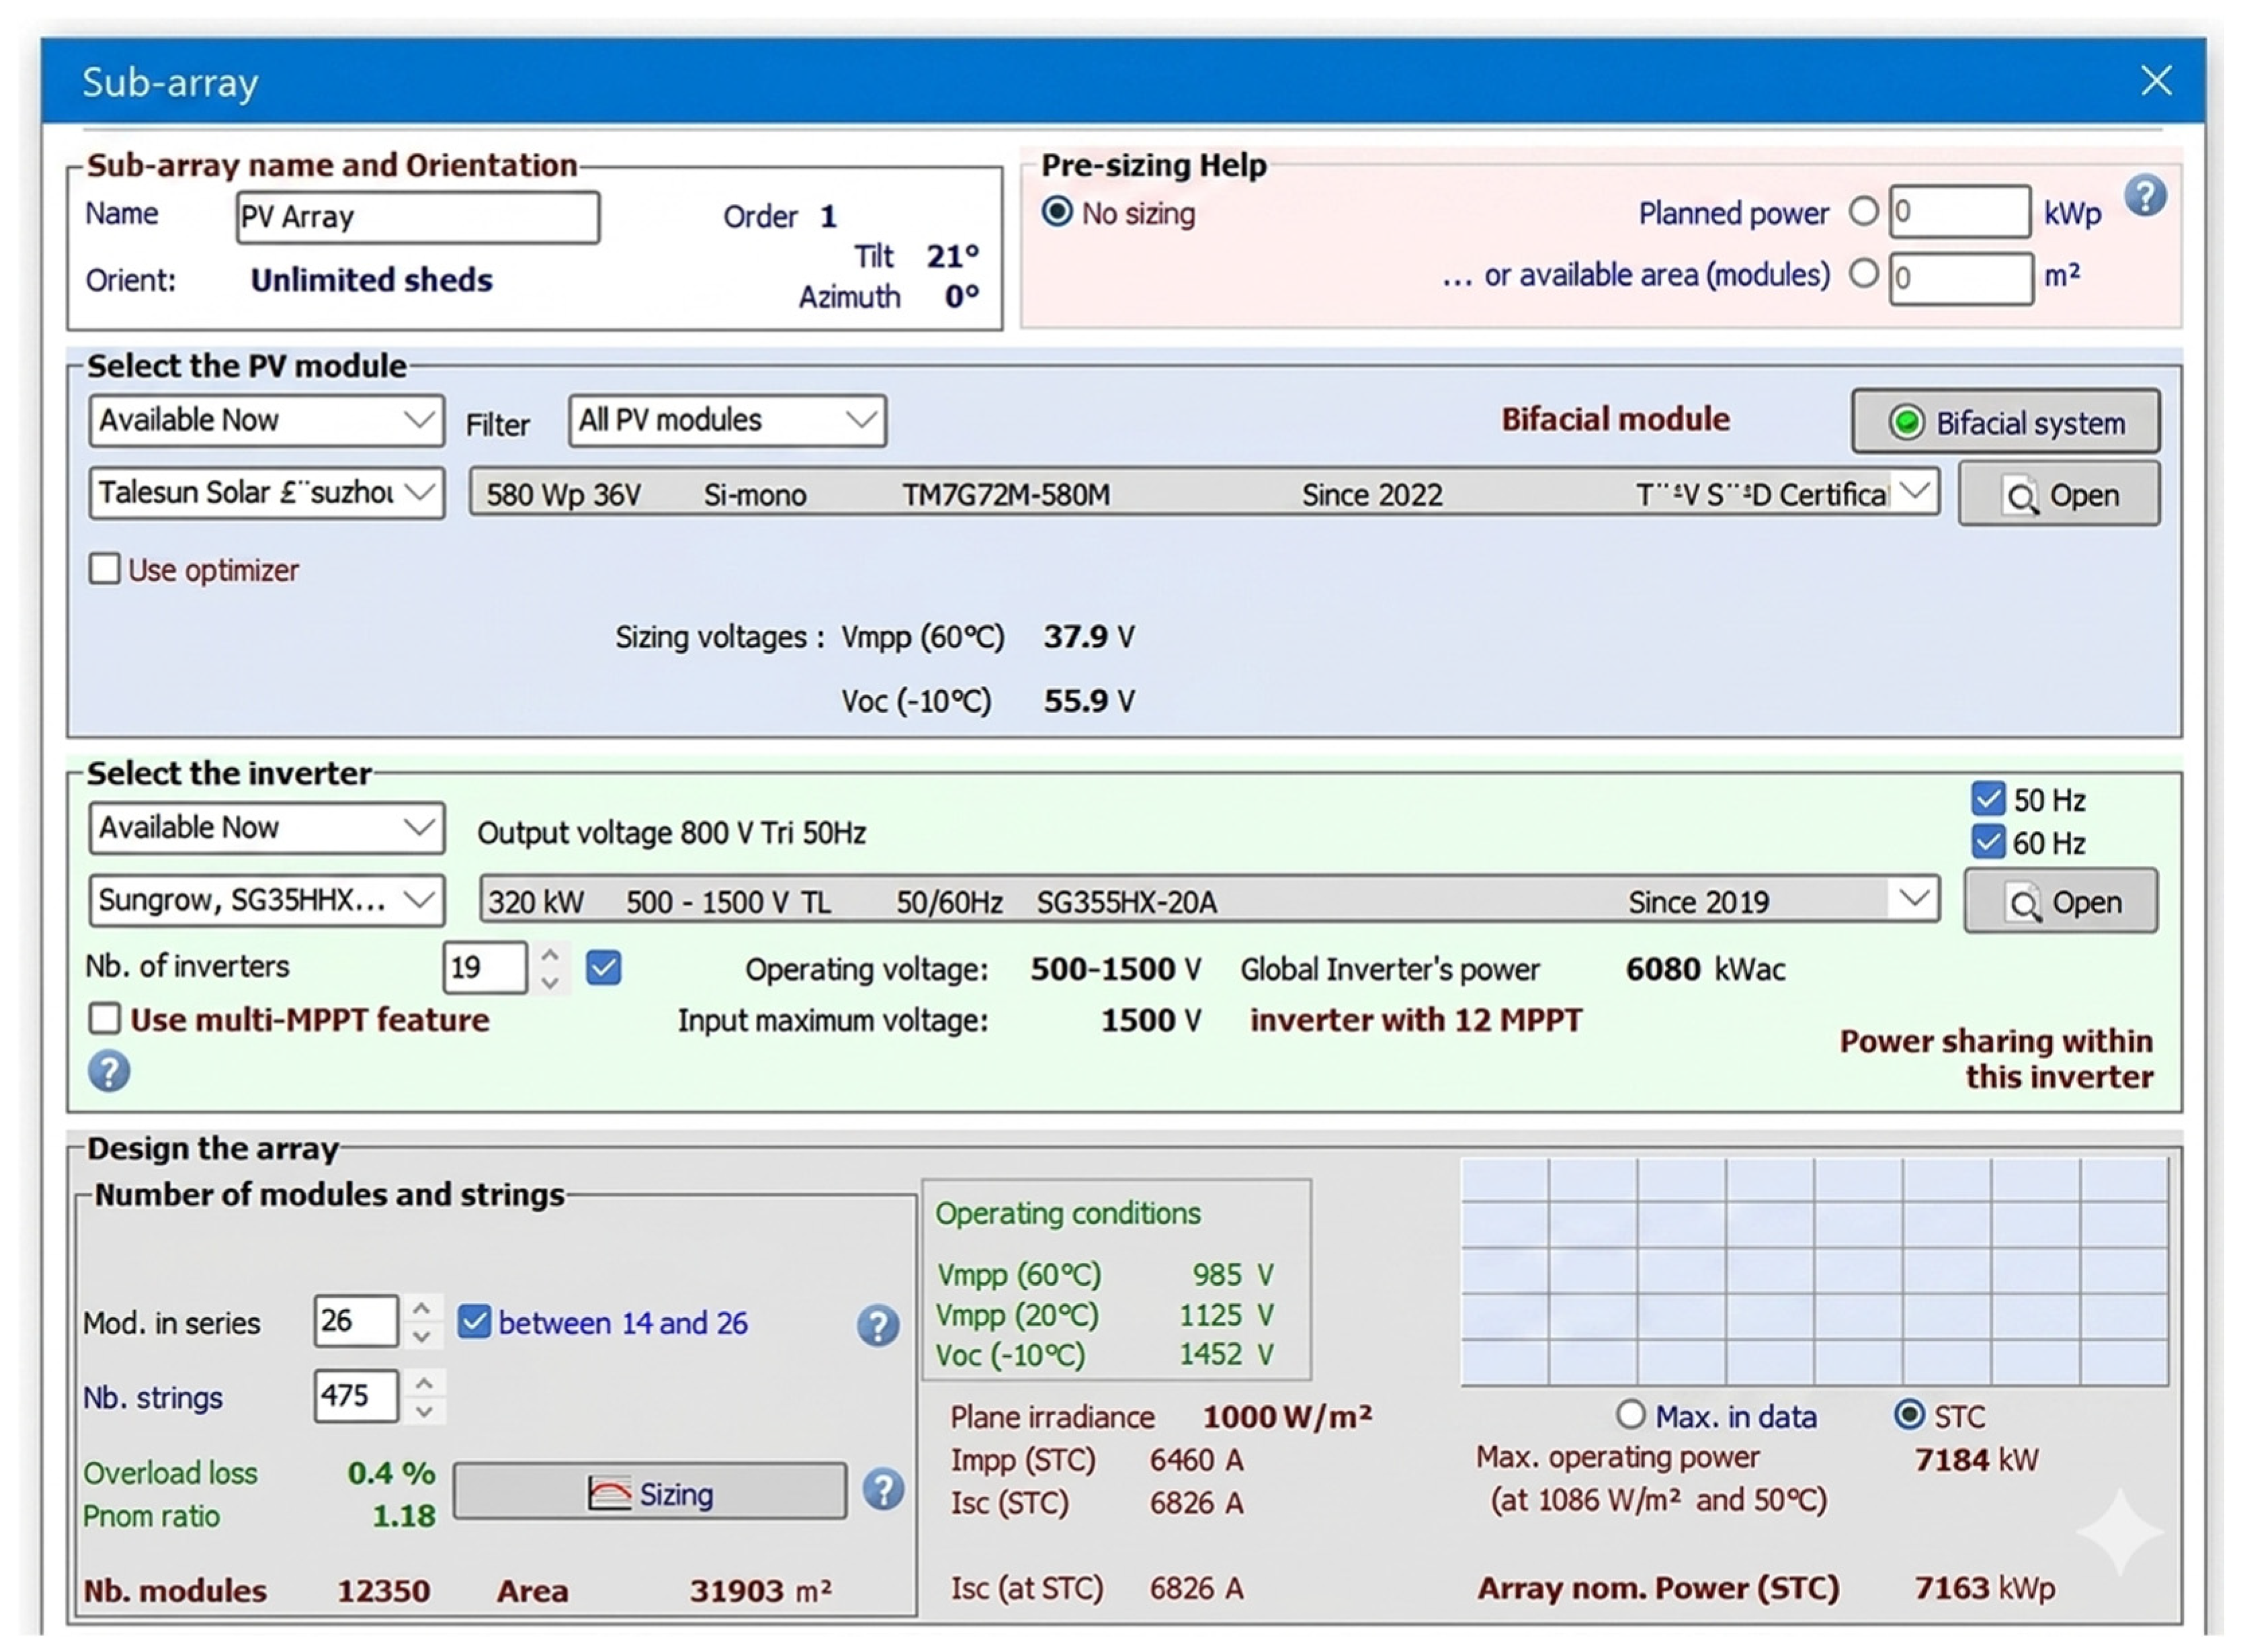
The image below illustrates an interface through which variables such as the number of panels, panel type, inverter type, number of inverters, and models used in a solar power plant are selected. This is based on the choice of a 21-degree tilted bifacial panel, which serves as an example representing different design criteria. The simulation, conducted utilizing the PVsyst software, demonstrates that the parameters employed in the plant design exert a substantial influence on energy production potential and performance efficiency. The criteria defined during this process play a critical role not only in enhancing the project’s success and efficiency but also in increasing its financial profitability. Utilizing sophisticated simulation methodologies and meticulous data analysis, a comprehensive evaluation is conducted encompassing the plant’s electricity generation capacity, environmental impacts, and economic benefits. The simulations provide the necessary information to ensure that the plant demonstrates superior performance among the available options, in line with its sustainability objectives.
In the power plant study conducted with a 21-degree tilt, the site was divided into seven distinct zones; it was observed that whilst the panel angle remained at 21 degrees across these zones, the natural slope direction of the ground varied. The distance between the racks on which the panels are mounted has been determined at varying intervals depending on the slope of the ground.
The power plant, which has been designed with a 25-degree tilt, has been subdivided into four distinct zones. This is due to the fact that the 25-degree panel tilt largely eliminates the disadvantages posed by the ground’s slope. In the various zones, while not to the same extent as with a 21-degree panel angle, orientations were determined by the natural slope direction of the ground varying; the distance between panel stands was set at minimal intervals according to the ground’s slope.
In the course of comparing different designs for the project, the selection was made of the Talesun brand model, with a nominal power of 580 Wp and an efficiency of 22.5%. This model features a bifacial or monofacial design and a monocrystalline double-glass structure. The inverter that has been selected is a Sungrow brand model. Despite the inverter possessing a power rating of 350 kW, it has been loaded at 320 kW, with this figure taking into account temperature-dependent performance drops. This rating of the inverter and the selected inverter type enable the inverter to start operating at earlier hours for lower power outputs when light arrives at an oblique angle in a bifacial panel design, and to continue operating until the light has completely faded in the evening. Moreover, the capacity is limited to 320 kW, thus ensuring that the total installed capacity of 11.2 MWe remains within safe limits at all times, even in the presence of the bifacial effect.
As illustrated in Figure 2, the interface displays the parameters of the power plant, which has been designed using bifacial panels at a 21-degree tilt. The fact that the selected panel is bifacial enables it to generate electricity from its rear surface as well. The utilization of materials exhibiting elevated light-reflecting properties on the ground has been demonstrated to enhance energy generation from the rear surface, thereby improving production performance. In the design, in the absence of material usage, the natural reflection from the ground will result in an enhancement in production. However, the utilization of a material with high reflectivity, such as calcite, could facilitate production growth, a prospect that merits investigation through feasibility studies. Consequently, calcite has been utilized as the ground reflector in the design study.
Figure 2.
PVsyst Parameter interface for a 13.18 MWp capacity power plant with bifacial panels and a 21-degree tilt.
The bifacial system design facilitates the generation of greater electricity, particularly during periods of sunlight at an angle (i.e., in the morning and evening). However, in the design planned with a 25-degree panel tilt, the high rate of shading on the rear face and the reduced area where reflected light meets the rear face of the panel means that the increase in production is expected to be lower compared to a design with a 21-degree panel tilt.
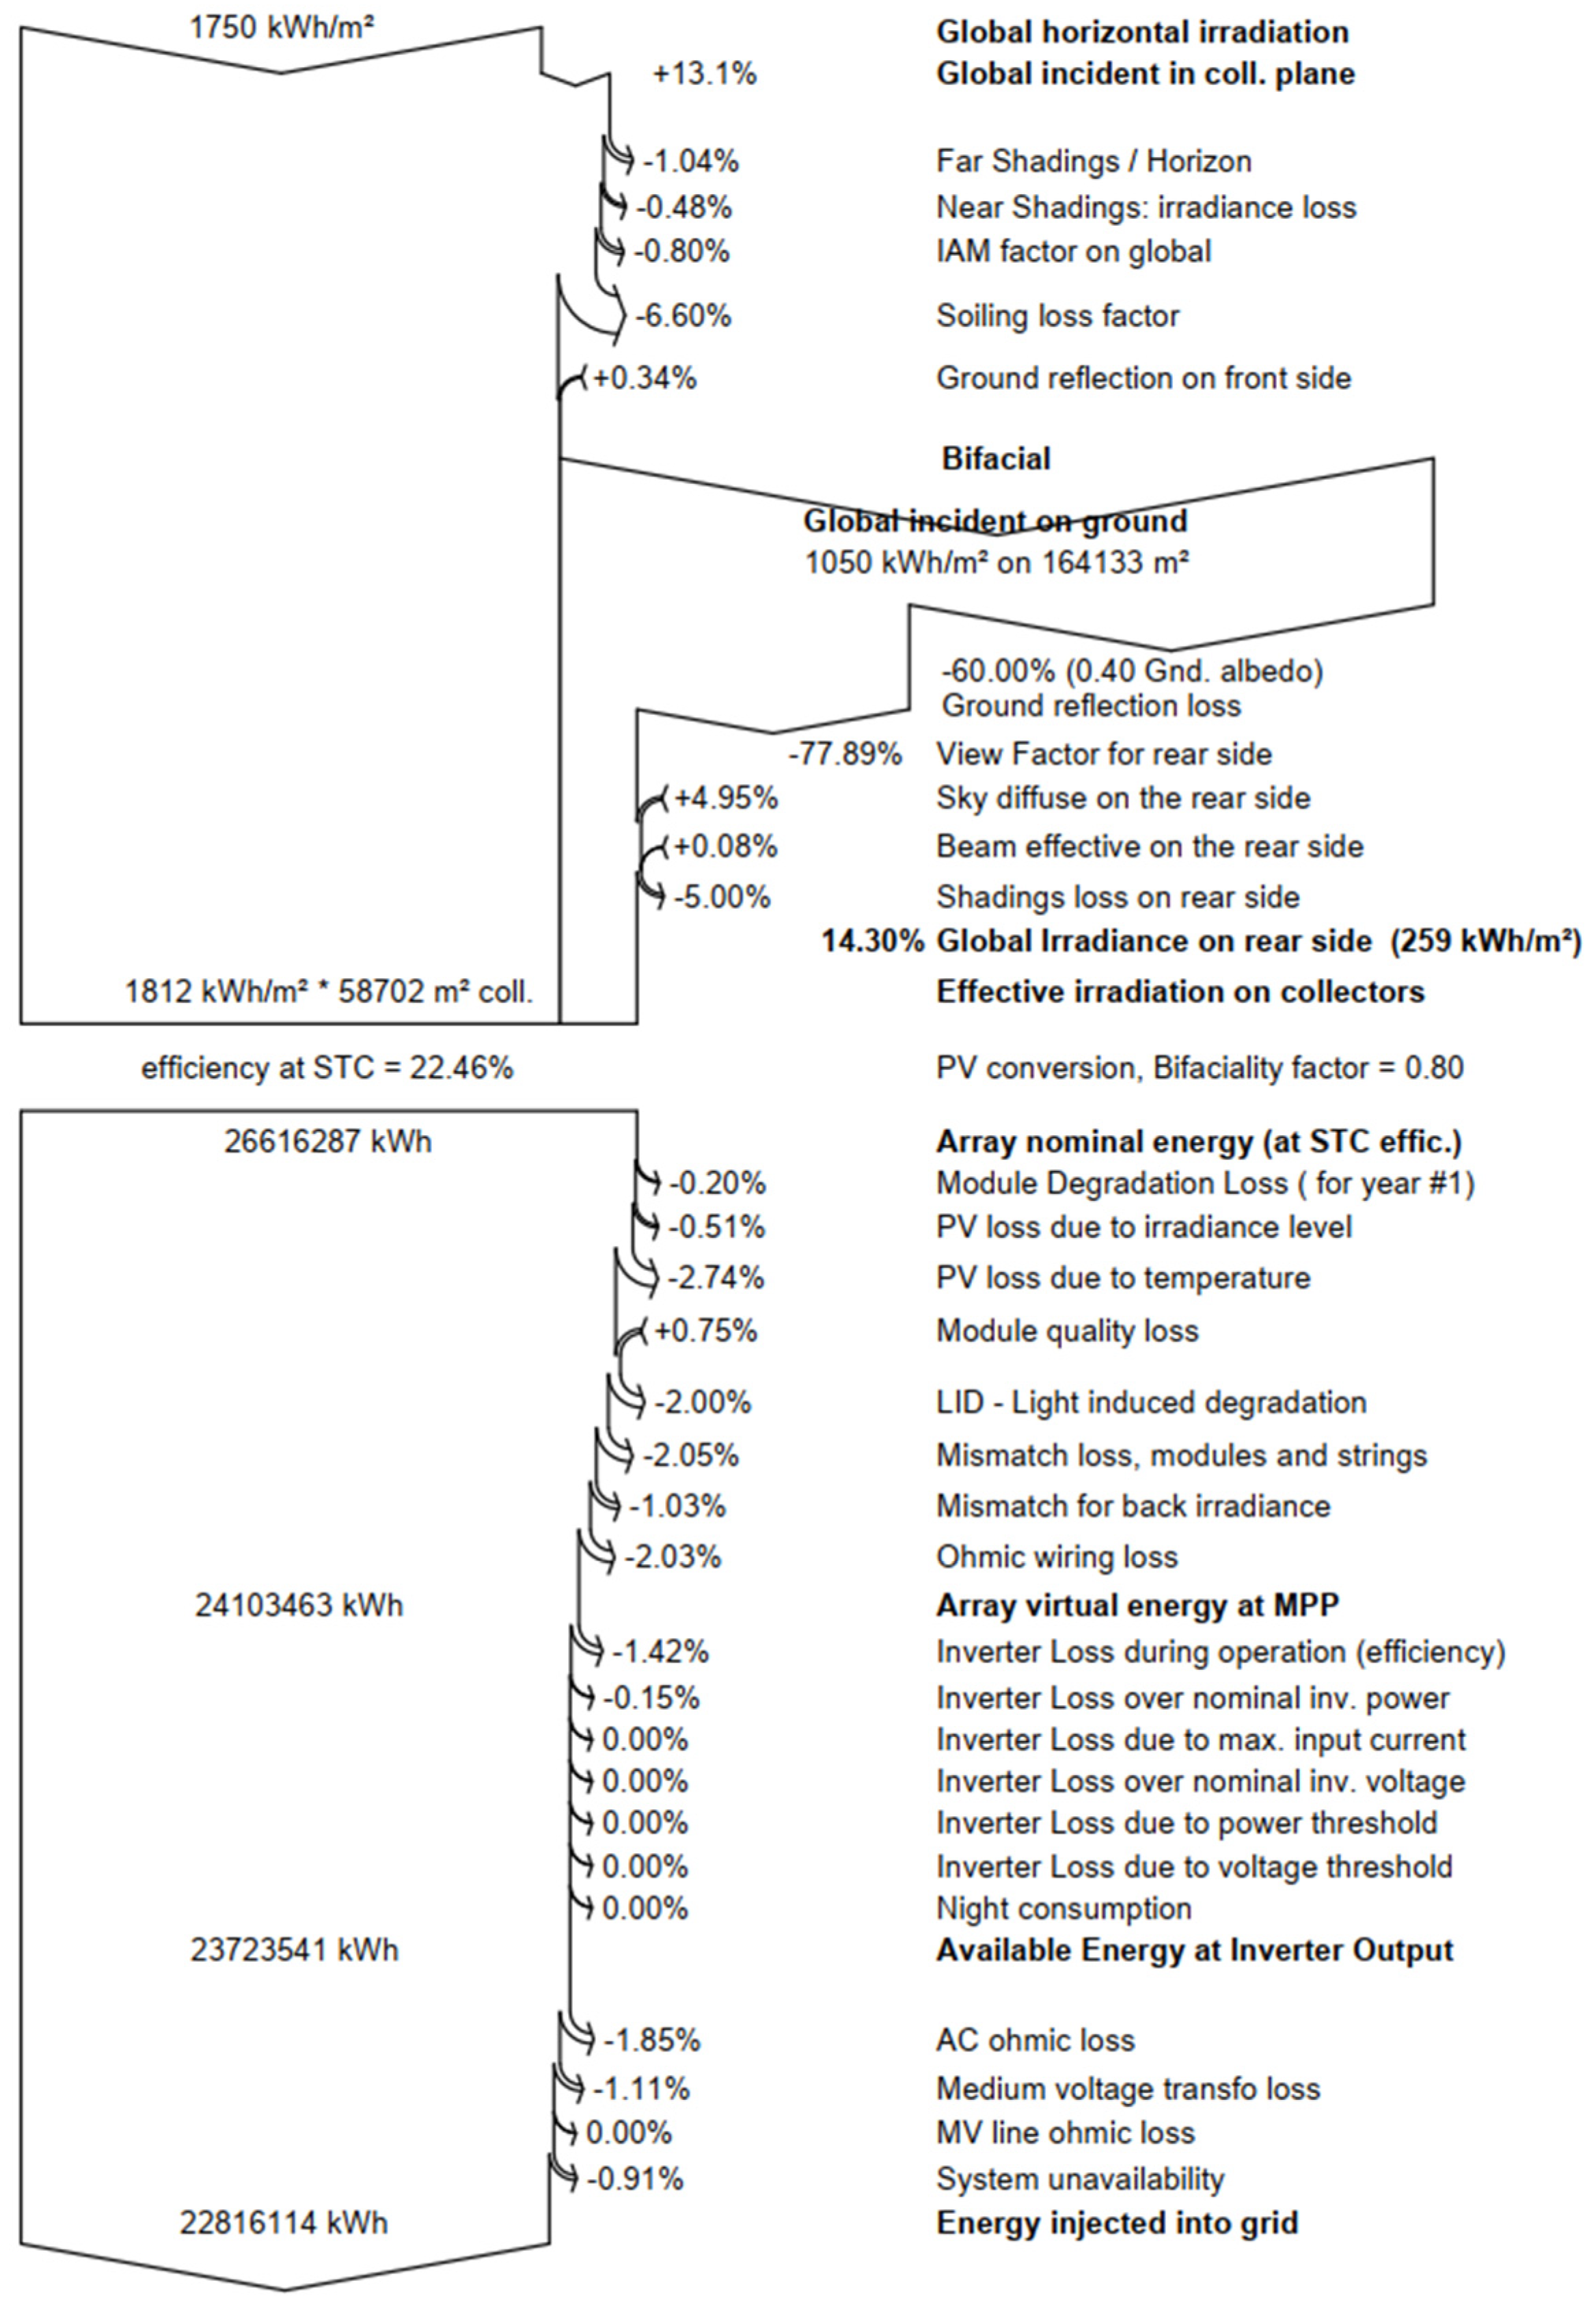
To ensure the full reproducibility of the PVsyst simulations and to provide a comprehensive overview of the plant’s physical configuration, all critical modeling and geometric parameters have been systematically documented. These parameters encompass the software specifications, meteorological datasets, transposition modeling, and specific site geometries, including module mounting height, row spacing (pitch), and structural gaps. Furthermore, detailed specifications regarding the physical application of the high-albedo calcite ground cover—such as particle size, layer thickness, and coverage area—have been explicitly defined. A complete summary of these simulation parameters and site-specific characteristics is presented in Appendix D, while the detailed PVsyst loss diagram illustrating the system’s energy flow and losses is provided in Appendix E.
2.2. Economic Feasibility Metrics
When comparing the cost-effectiveness of solar power plants, key indicators are crucial for assessing the return on investment. Common methods used to determine the economic viability and profitability of such projects include Net Present Value (NPV), Internal Rate of Return (IRR) and Profitability Index (PI).
The NPV is a metric used to calculate the present value of an investment project. A positive NPV indicates that the investment project provides an acceptable return; a negative NPV means that the investment project falls short of the expected return. Equation (1) shows how NPV is calculated. NPV represents the present value of the project, whilst Initial Investment Cost refers to the cost of the initial investment required to establish or launch the project.
In this model, (C0) denotes the initial investment cost, (Ct) is the annual return generated by the solar power plant, (r) is the discount rate or required rate of return (the rate of profit expected by the investor), and (T) is the project’s lifespan.
The IRR is a further significant metric utilized for the purpose of evaluating the return on an investment project. The IRR is a metric used to determine the discount rate at which the net present value of a project equals zero, as illustrated in Equation (2). In essence, the internal rate of return (IRR) of a project is defined as the discount rate at which the project’s expected annual cash flows result in a net present value equal to or greater than zero.
IRR is the interest rate that indicates a project’s ability to cover its investment costs through future cash flows. The rate is expressed as follows: the initial investment cost is denoted by (C0), the annual return generated by the solar power plant is denoted by (Ct), and the project’s lifespan is denoted by (t).
PI, alternatively referred to as the Profitability Ratio, is a financial metric employed to evaluate the attractiveness of an investment or project, as demonstrated in Equation (3). The PI is calculated by dividing the present value (PV) of the future cash flows by the initial investment cost. A PI greater than 1 indicates that the project’s expected returns exceed its costs, rendering it a potentially viable investment. Conversely, a PI less than 1 indicates that the costs of the project exceed the expected returns. The PI is a tool that enables investors to make informed comparisons between projects, taking into account their respective potential profitability and assisting them in determining whether to proceed with an investment.
Levelized Cost of Electricity (or Levelized Cost of Energy–LCOE): This parameter designates the aggregate capital and operational expenses of a generation facility over its entire lifetime, proportioned against the total electrical energy it is expected to generate.
I0 = Initial Investment Cost (CAPEX) in year 0 (USD), Mt = Operation and Maintenance Expenditures (OPEX—including operations, insurance, and grid usage fees) in year t (USD), Et = Electricity Generation in year t (kWh), r = Discount Rate (7.5%), n = Project Lifetime (30 years), t = Year of operation (from 1 to 30).
3. Results and Discussion
This section presents a comparative study of monthly generation volumes and economic returns for a solar power plant currently in the design phase, with an installed capacity of 13.18 MWp, based on different design criteria. Furthermore, the potential reduction in greenhouse gas emissions for each design, based on the same capacity but different design criteria, is also assessed. Therefore, a comparison is made between the designs to ascertain which design offers superior performance based on the specified criteria.
The city where the project is located experiences average temperatures of −4 °C in winter and 15 °C in summer. The average solar radiation recorded was 60.3 kWh/m2 in December and 232.1 kWh/m2 in July. The lowest and highest temperatures recorded were −28 °C in January 1942 and 39.4 °C in August 1954, respectively.
Four different simulations were created using the Pvsyst software to compare various design criteria. The simulations encompass pivotal parameters, including annual energy production and environmental impacts. The site’s predominantly south-east-facing natural topography enables the panel tilt to be optimized at lower angles, as opposed to the conventional 30-degree angle. A common feature across these designs is that the highest solar radiation value was recorded in July (232.1 kWh/m2), whilst the lowest value was recorded in December (60.3 kWh/m2).
As illustrated in Table 1, the simulation results for a 13.18 MWp solar power plant are presented, utilizing the PVsyst software and a 21-degree monocrystalline design as a basis. The initial columns of the table signify the potential solar energy incident on the designated site.
Table 1.
Simulation results for a 21-degree mono design with an installed capacity of 13.18 MWp.
GlobHor (Horizontal Global Irradiance): The total annual irradiance was measured at 1749.6 kWh/m2. The highest value was recorded in July (232.1), whilst the lowest was recorded in December (60.3).
GlobInc (Incident Irradiance on an Inclined Plane): The incident irradiance on the plane was found to reach an annual level of 1978.8 kWh/m2 due to the angle of the panels.
GlobEff (Effective Irradiance): This value, which is equivalent to 1805.6 kWh/m2 annually, signifies the net energy reaching the cells subsequent to accounting for factors such as reflection (IAM losses) and soiling.
The relationship between temperature and efficiency (T_(Amb) & PR): The performance of a system is significantly influenced by ambient temperature (T_(Amb)). Temperature Effect: During the summer months (July–August), when the temperature rises to approximately 25 °C, the PR (Performance Ratio) value is observed to decrease to its lowest levels (0.754–0.761). The voltage output of photovoltaic panels is inversely proportional to temperature. In January, at a temperature of 0.35 °C, the PR was 0.848, whereas in August, the efficiency decreased with an increase in temperature. This phenomenon is directly related to the thermal losses of the semiconductors.
Production Capacity: The annual total energy output (DC energy produced by the panels) is 21,788,895 kWh.
Energy Supplied to the Grid (E_Grid): Subsequent to accounting for inverter, cable and transformer losses, the net energy transferred to the grid is 20,684,179 kWh. The discrepancy between EArray and E_Grid signifies the electrical conversion losses within the system (AC/DC conversion).
The lowest recorded efficiency rate (75.4%) was observed in August, whilst the highest (84.8%) was observed in January.
As demonstrated in Table 2, the simulation results for a 13.18 MWp solar power plant, obtained using the PVsyst program for a 25-degree monocrystalline design, are presented. The annual total energy production of the solar panels (E-Array value) was calculated as 21,946,096 kWh; however, due to electrical conversion losses in the system, the energy available for feed-in to the grid was calculated as 20,829,158 kWh.
Table 2.
Simulation results for a 25-degree mono design with an installed capacity of 13.18 MWp.
The lowest recorded efficiency rate (75.2%) was observed in August, whilst the highest (84.5%) was observed in January.
As illustrated in Table 3, the simulation results for a 13.18 MWp solar power plant demonstrate a 21-degree bifacial design. The annual total energy production of the solar panels (E-Array value) was calculated to be 24,067,444 kWh; however, due to electrical conversion losses in the system, the energy available for feed-in to the grid was calculated to be 22,816,114 kWh. The lowest recorded efficiency rate was 82.8%, which was observed in August, whilst the highest rate of 93.9% was recorded in January.
Table 3.
Simulation results for a 21-degree bifacial design with an installed capacity of 13.18 MWp.
As presented in Table 4, the simulation results for a 13.18 MWp solar power plant with a 25-degree bifacial design are shown. The annual total energy production of the solar panels (E-Array value) was calculated to be 24,020,206 kWh; however, due to electrical conversion losses in the system, the energy available for feed-in to the grid was calculated to be 22,771,738 kWh. The lowest recorded efficiency rate was 82%, which was observed in August, whilst the highest efficiency rate of 91.9% was recorded in January.
Table 4.
Simulation results for a 25-degree bifacial design with an installed capacity of 13.18 MWp.
A comparison of the data, which has been compiled with environmental factors such as terrain in mind, revealed that while a 25° tilt maximizes yield for Mono systems in Central Anatolia, the 21° tilt is superior for bifacial systems. This is due to the 25° tilt increasing rear-side shading and reducing the effective projection area for ground-reflected light. The 21° bifacial configuration achieved the peak production of 22.8 GWh/year.
It is vital that, on the basis of the available data, an optimal solution be proposed. This will be achieved by calculating the economic return and payback period of the designs through an economic feasibility study. It is insufficient to rely solely on production performance when selecting the correct design methodology. Consequently, conducting an economic feasibility study for each design is imperative.
3.1. Financial Analysis and Payback Periods
As demonstrated in Table 5, the revenue derived from the sale of energy generated by a solar power plant is determined by the unit price of the electricity consumed by the facility that benefits from the solar power plant. The unit price of electricity is subject to variation depending on the configuration of the solar power plant’s grid connection and the type of license and permit. Consequently, it is not feasible to establish a fixed unit price for the energy procured from solar power plants in Türkiye. The project under discussion, however, is intended to address the energy requirements of a factory with a high-power consumption, with a view to either selling surplus energy to the grid or offsetting it against energy subsequently drawn from the grid. In this scenario, the economic feasibility of the project will be determined by multiple unit prices. The primary unit price denotes the cost of the energy purchased to satisfy the factory’s electricity requirements. The secondary unit price comprises the tariff unit prices disseminated by the EMRA (Energy Market Regulatory Authority) at regular intervals. The average unit price will be determined based on the factory’s energy purchase-to-sale ratio.
Table 5.
Sales Revenue and Economic Indicators for Four Different Designs.
The factory’s consumption, the focal point of this study, exhibits a significantly higher value in comparison to the output of the solar power generation plant. Consequently, the unit price to be utilized as the fundamental basis for this study will be the unit price at which the factory acquires energy, thereby eliminating the necessity for any ratio. The unit price is subject to variation according to the weighted averages of market exchange rates, and is approximately equivalent to 0.091 US dollars ($). In order to forecast future electricity unit costs, simulations such as the Monte Carlo Simulation can be conducted to estimate prices based on scenarios where unit prices either decrease or increase [8]. A thorough review of pertinent studies in this domain reveals that the mean values of long-term downward and upward trend expectations are 0.0620 USD/kWh. However, in the context of electricity generation facilities operating in conjunction with a consumption facility, it is important to note that other factors can significantly influence the unit price. The commissioning of an additional PV power plant in 2021, connected to the aforementioned consumption facility, results in the energy produced being deducted from the energy consumed during the day, thereby reducing the weight of daytime prices within the average.
The reference study [8] established a long-term base electricity price of 0.0620 USD/kWh by analyzing historical Market Clearing Prices (PTF) disclosed on the EXIST (Energy Exchange Istanbul) [9] platform from 2012 to 2021. However, that specific study calculated a 24 h full-day average, which inherently includes the significantly lower energy prices during nighttime hours—periods when the solar power plant (GES) does not generate electricity. When the pricing is accurately weighted according to the actual load flow of the consumption facility and aligned strictly with the daytime generation hours of the GES (which coincide with peak tariff periods), the effective unit price is calculated at 0.091 USD/kWh. Therefore, the 46.76% discrepancy is not an arbitrary surcharge, but rather the direct mathematical consequence of filtering the market prices to match the specific daytime generation profile and peak-hour consumption trends of the facility, validating the utilized unit price of 0.091 USD/kWh. It is important to note that the cost of this energy unit is specific to the hourly variation in electricity prices and the load flow analysis of the consumption facility. Consequently, it may vary for facilities with different connection types and consumption trends.
However, when projecting future trends, one of the unforeseeable factors that will closely influence the unit price forecast in the market is the commissioning date of the Akkuyu Nuclear Power Plant, currently under construction in Türkiye, and the position it will create in the supply–demand balance. Despite the prevalent expectation of a decline in electricity prices as the Akkuyu plant increases supply, it is evident that, in the long term, the unit price of electricity will approach these levels. This is due to the fact that the electricity sales price at the Akkuyu plant is set at 0.1235 USD/kWh [10], a consequence of incentives. The Akkuyu NPP is expected to function as a price driver, exerting an upward pressure on prices during periods of market deflation and a downward pressure during periods of market inflation. The long-term unit price of 0.091 USD/kWh, as discussed in this study, is 35.7% below the purchase guarantee for the energy produced at the Akkuyu NGS. This indicates that the specified unit price is founded on realistic market fundamentals in the long term.
In this context, determining the electricity price per kWh in the financial comparison of solar energy projects plays a critical role in assessing the project’s economic benefits. As illustrated in Table 5, a comparative analysis is presented of the annual electricity generation, selling price, annual return and return on investment of the solar power plant based on four different design criteria.
The financing for the solar power plant project is to be comprised entirely of the investor’s own funds, with 50% of the investment provided by the investor’s own funds and 50% from a bank loan or lease financing at a 7.5% interest rate. In a second scenario, 25% of the investment is to be funded by the investor’s own funds and 75% by a 10-year bank loan or lease financing at a 7.5% interest rate. In the feasibility study, the rediscount rate was set at 7.5%, which is equivalent to the bank interest rate. The objective of this analysis is to ascertain that the scenario resulting from the investment funds being held in the bank is sufficient to cover the investment. In summary, the implementation of this investment has become imperative for the associated consumption facility. Consequently, it will be sufficient for the portion of the funds held in the bank to yield a low level of interest income.
In the scope of the feasibility study, the costs section encompassed not only the initial installation costs of the facility, but also the annual staff costs, insurance premiums, operational expenses, maintenance costs, system usage fees, and unforeseen expenses. With regard to revenue, in addition to income from electricity sales or savings from the factory’s consumption, tax savings arising from the fact that taxes payable on the purchased energy would no longer be due following the construction of the solar power plant are also recorded under revenue. The correlation between tax savings and revenue, on the one hand, and the energy produced, on the other, is well-documented. With regard to the expenditure side, the amount of electricity generated is the only significant data point used in the calculation of the system usage fee.
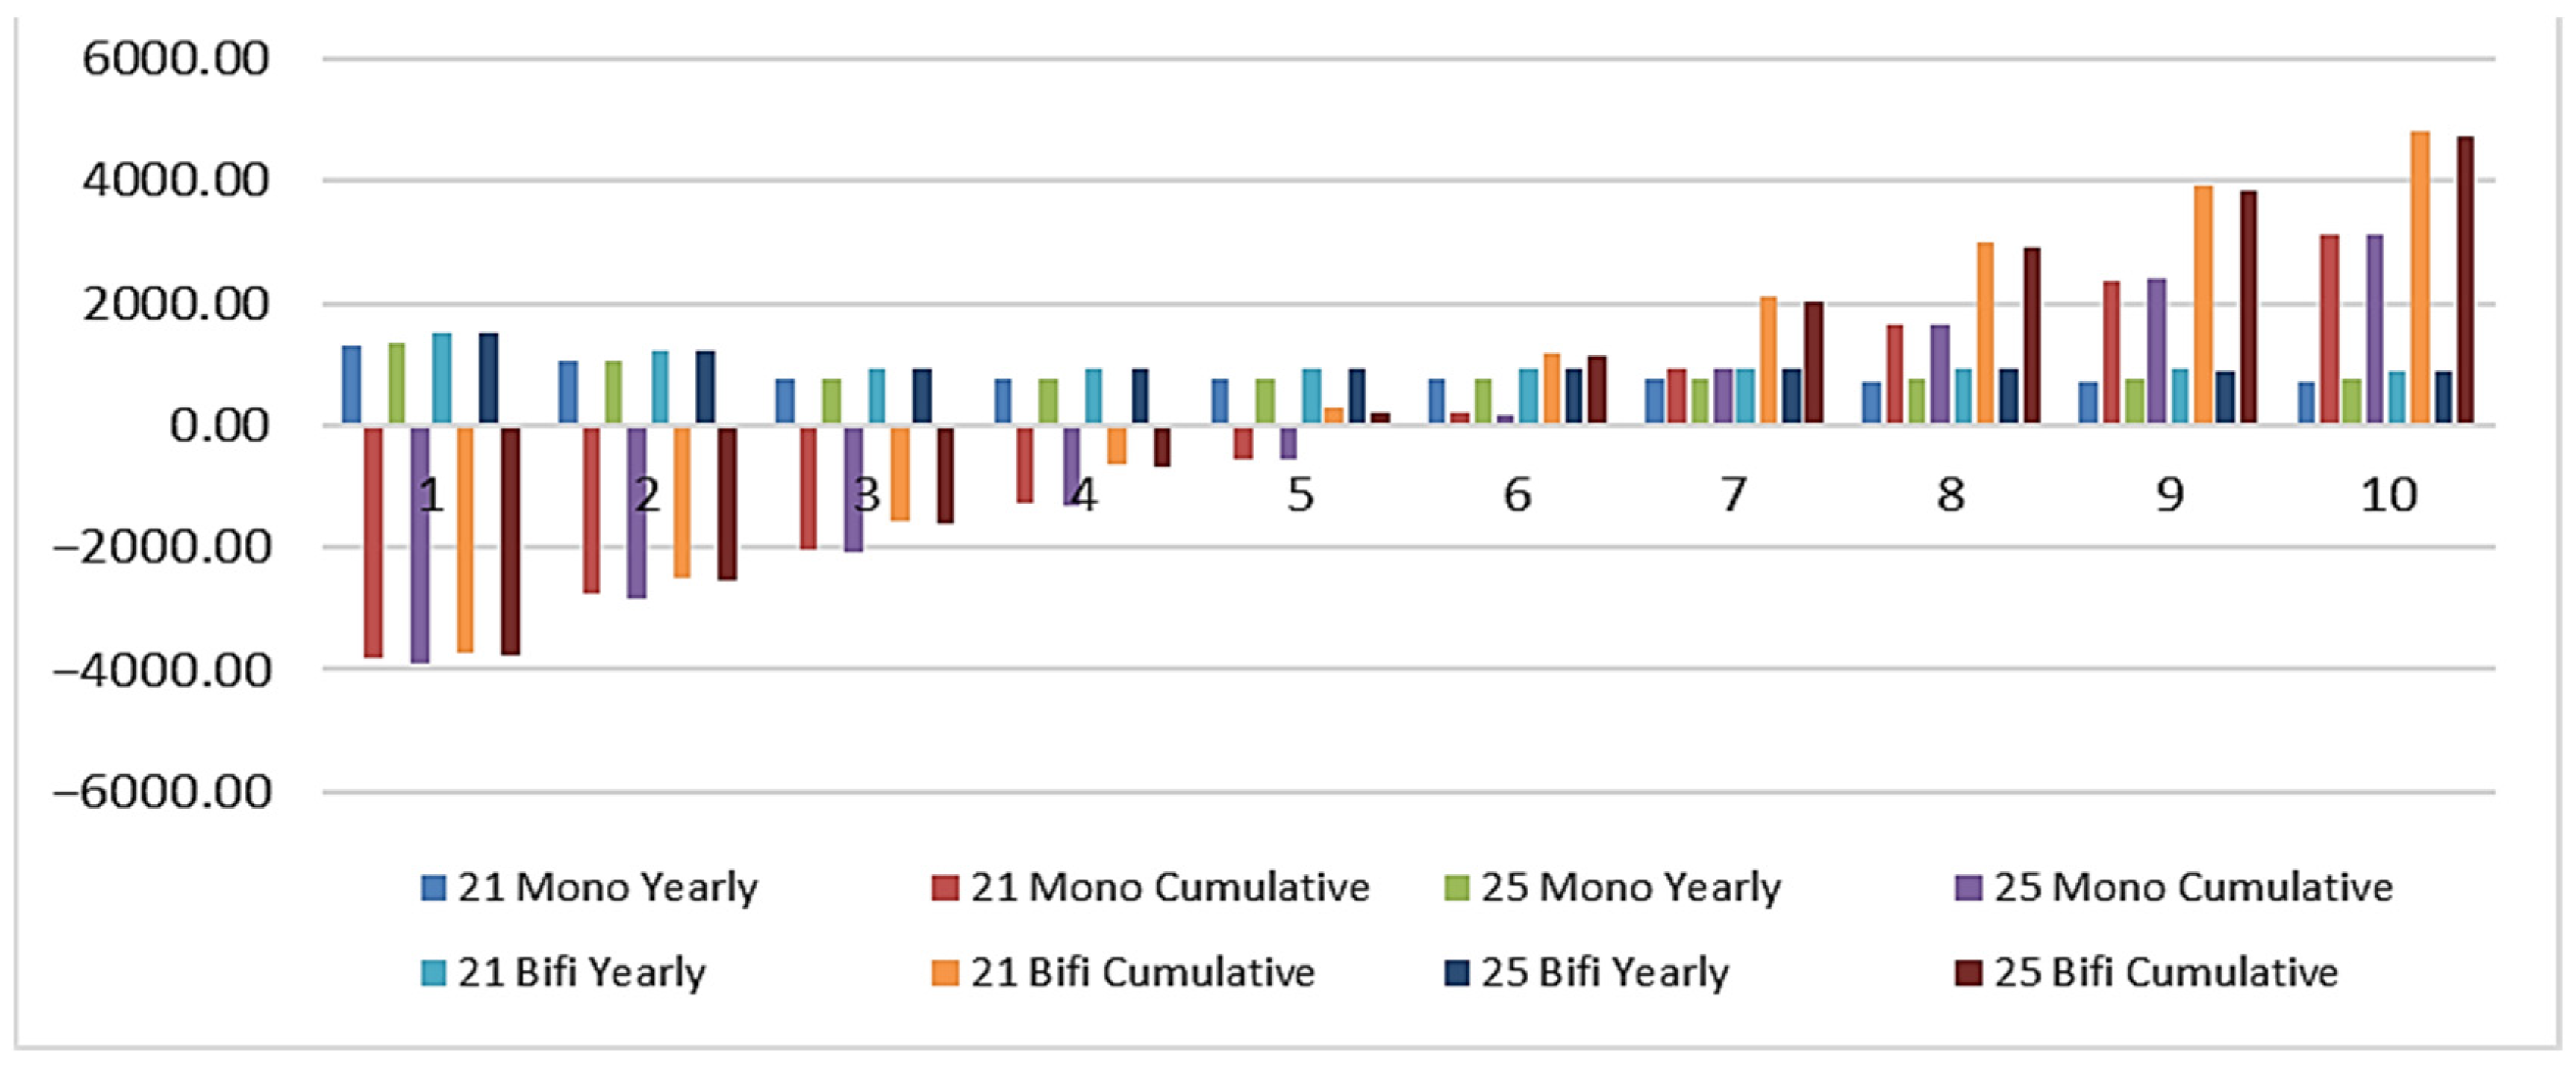
It is evident that, under the condition that the technical personnel at the consumption facility are adequately proficient in the operation of the PV power plant, considerable cost savings can be realized in operational and personnel expenses. The existence of an additional facility exhibiting equivalent design criteria, which was commissioned in 2021 and possesses a capacity of 6 MWp, situated in close proximity (illustrated in the top right corner of Figure 3), further facilitates substantial cost reductions.
Figure 3.
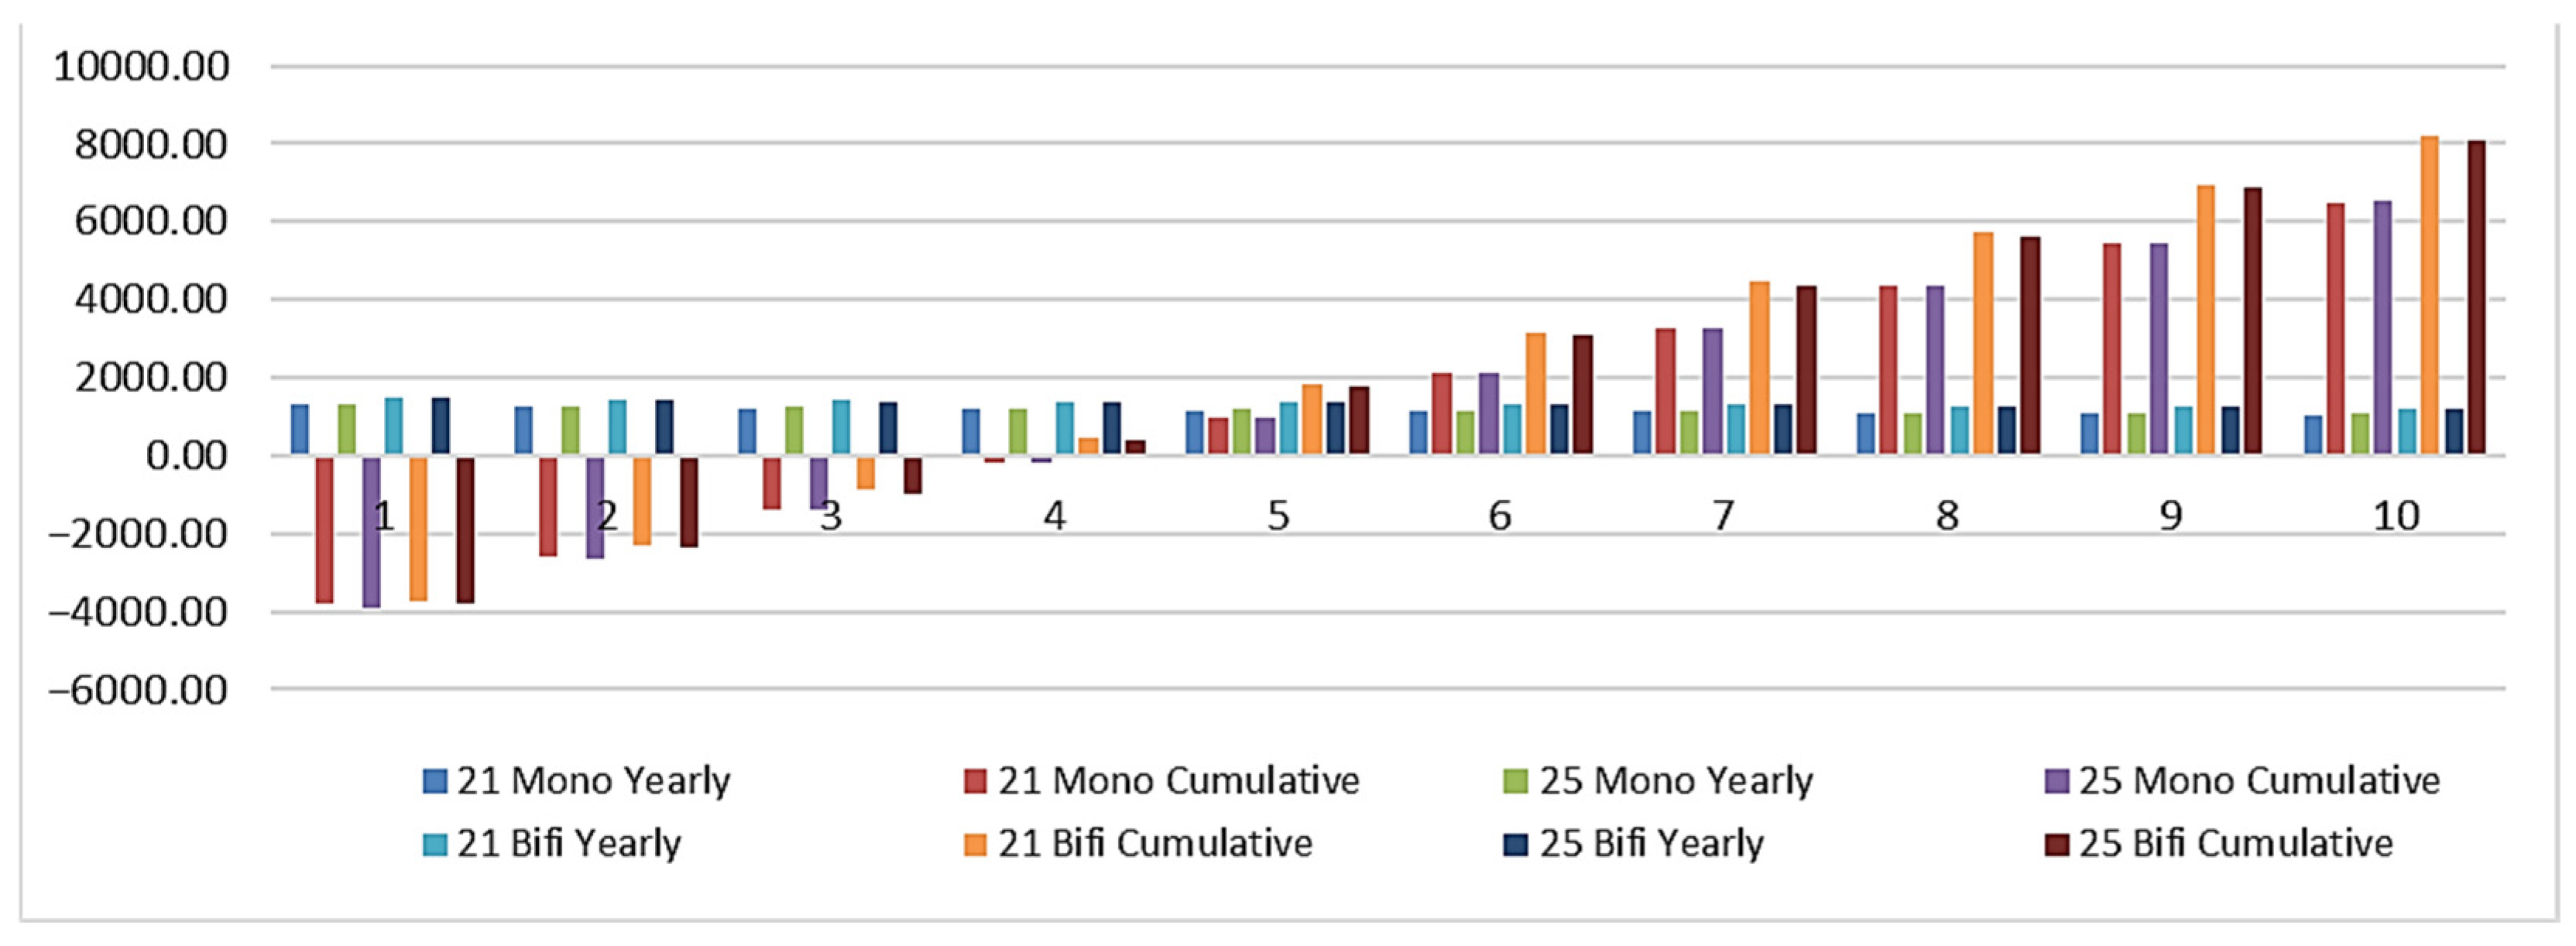
Cumulative benefit for 100% equity.
It is estimated that the total annual revenue is approximately 2,600,000 USD. In addition to this, the following costs have been factored in: personnel, insurance, operational, maintenance, system usage fees, and unforeseen costs, the total of which is approximately 1,190,000 USD. In consideration of annual tax and fund savings, which are contingent upon production levels, the total approximates 621,000 USD. The following is a detailed breakdown of taxes and levies for eligible consumers: The two main taxes considered in this study are the Municipal Consumption Tax (MCT) and the Value Added Tax (VAT). MCT constitutes 5% of the Energy Charge, whereas VAT constitutes 20% of the total of the Energy Charge and MCT.
The provision by the panel supplier of a 30-year linear power warranty and a 0.39% annual efficiency decline facilitates the incorporation of the anticipated long-term decline in the plant’s productivity into operational planning through the creation of long-term feasibility studies and projections.
The comparison is conducted methodically, with the costs, productivity, efficiency and other parameters of the solar power station being evaluated across a range of design configurations. Initially, a comparison was made of the initial costs. The assessment revealed no significant cost difference across the four design criteria. The financial outlay required for the installation of the plant is estimated to be within the range of $5.1–5.3 million. Secondly, an analysis was conducted on the annual returns. This comparison reveals that the 25-degree Mono design provides superior returns in comparison to the 21-degree Mono design, and that the 25-degree bifacial design provides even more favorable returns than the 25-degree Mono design. However, due to the influence of the terrain, the 21-degree bifacial design provides the optimal returns, with an annual production of 22,816,114 kWh. The annual production values presented in Table 5 denote the initial-year values derived from the linear performance curve of the utilized panels. However, during the course of the subsequent feasibility study, the accuracy of the model was enhanced by utilizing the performance curve guaranteed by the panel manufacturer over a 30-year period. This approach enabled the determination of the annual production value based on the decreasing panel performance for each year.
The findings indicate that minor modifications to the design configuration enable the solar power station to achieve a higher return on investment while maintaining a comparable cost. As demonstrated in Table 5, the financial outlay required for the 21-degree Mono design is $5,132,740, for the 25-degree Mono design it is $5,207,740, for the 21-degree bifacial design it is $5,225,000, and for the 25-degree bifacial design it is $5,275,000. The annual gross revenue for each design has been calculated as follows: $2,504,000, $2,516,000, $2,698,000, and $2,692,000, respectively.
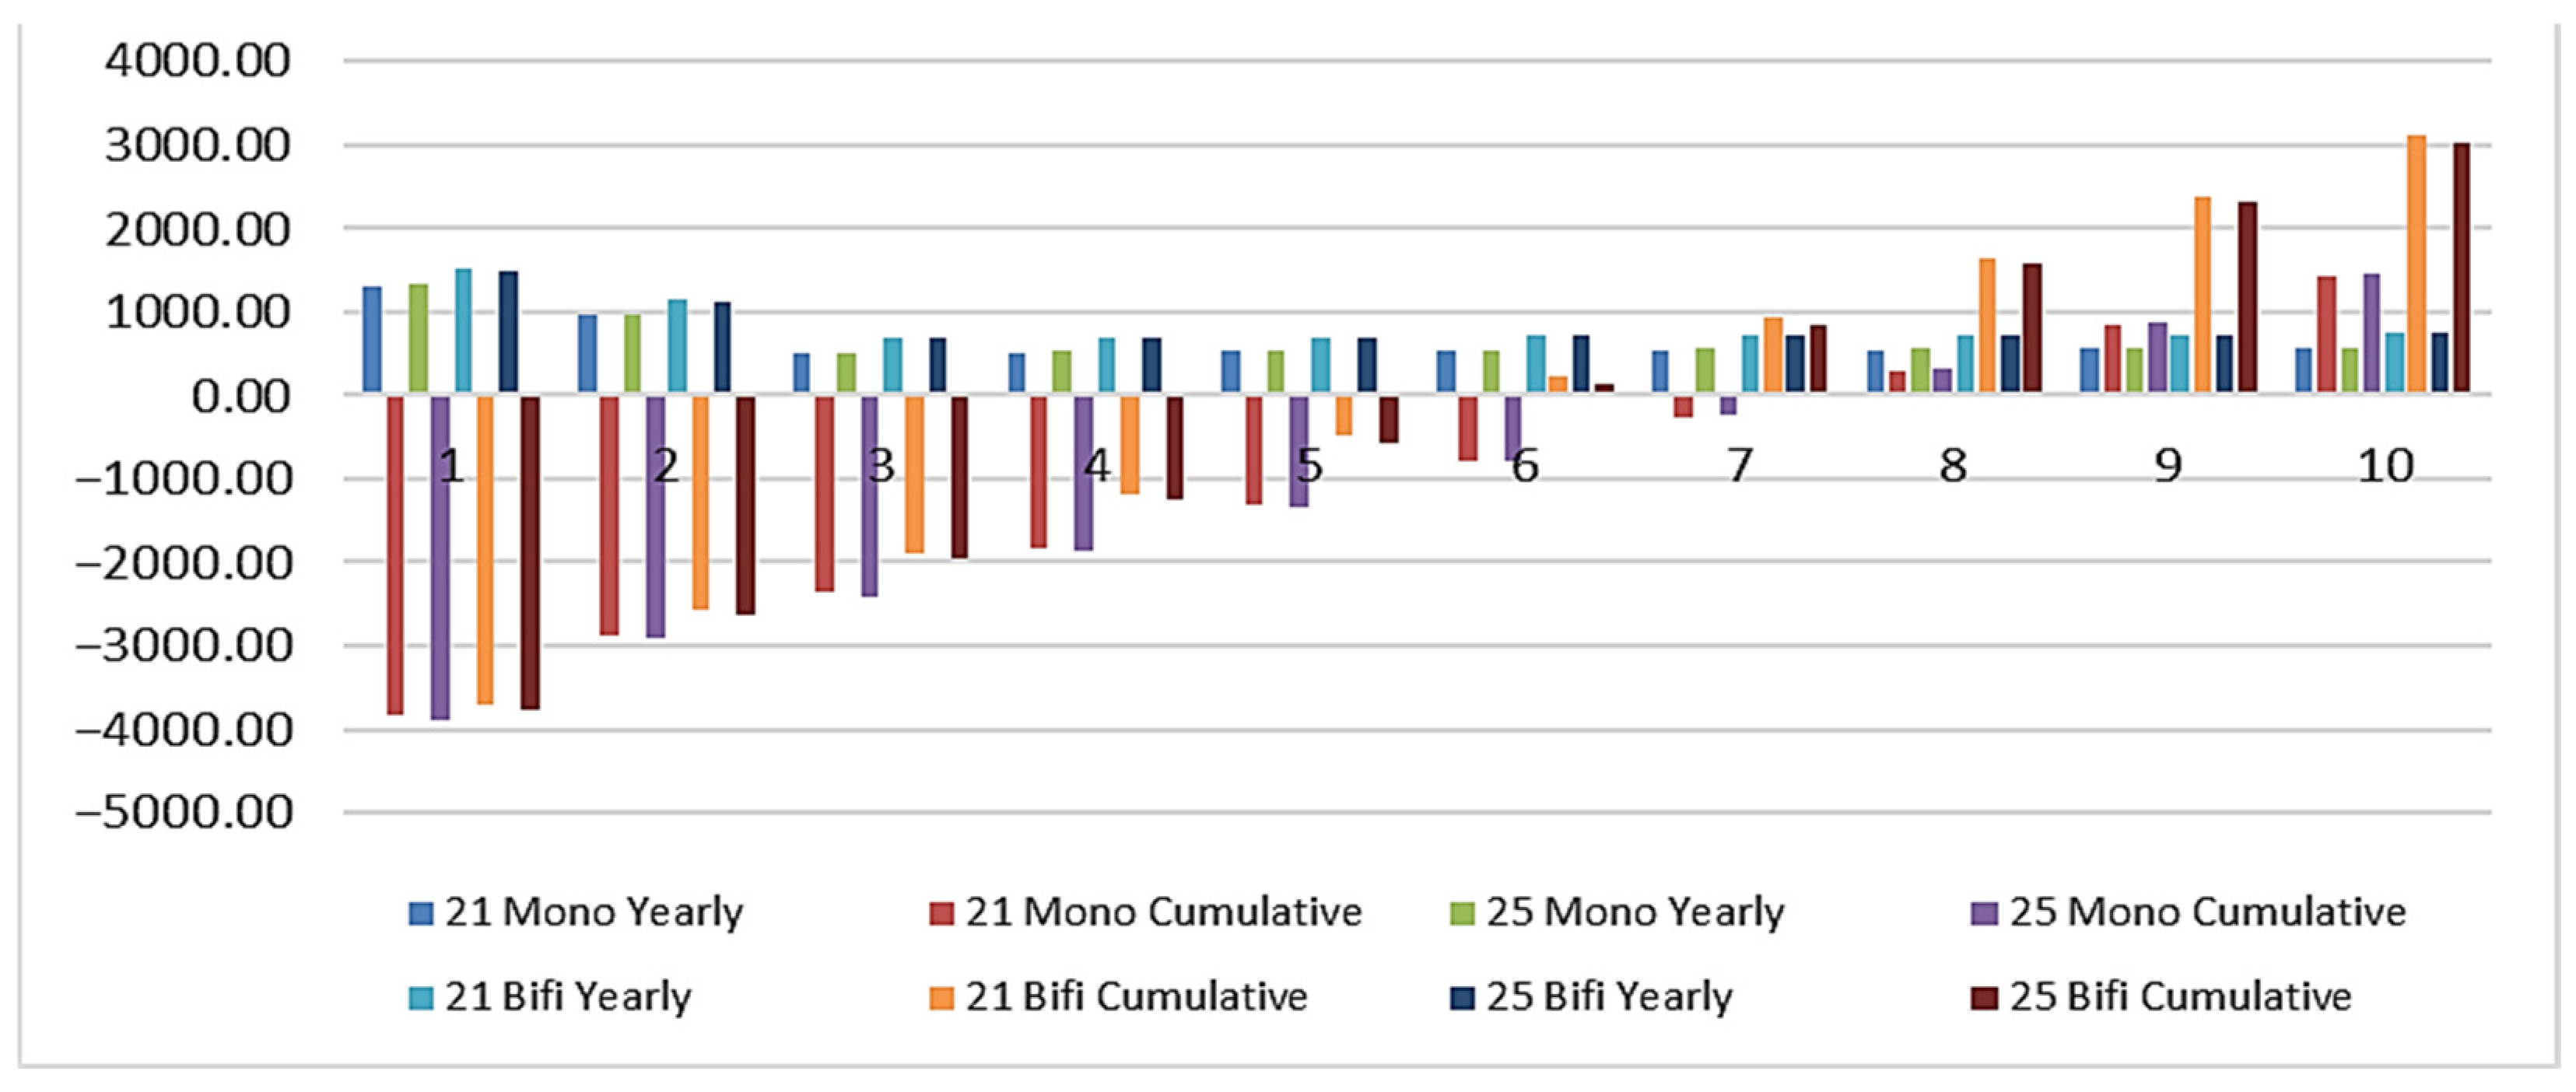
It is evident that the calculation of gross economic revenue has not incorporated the costs associated with annual operating, maintenance and repair activities. Solar power plants require minimal staff and, with the exception of maintenance (which is contingent on on-site conditions), require minimal maintenance and repair in the absence of faults. Consequently, these costs are not a decisive factor in establishing feasibility. However, it should be noted that the cumulative benefit graphs displayed in Figure 3, Figure 4 and Figure 5 present net return values after the deduction of operating costs.
Figure 4.
Cumulative benefit for 50% equity.
Figure 5.
Cumulative benefit for 25% equity.
The graph illustrates the annual decline in the economic return of a solar power plant, which is shown to be at a rate of 0.39% due to the degradation of solar panels over its 30-year operational lifespan. This is based on various simulated design criteria. This decline clearly highlights the difference between the high efficiency of the solar power plant in its early years and the performance loss experienced over time. Moreover, the graph provides a pivotal reference point for investors by incorporating the total economic return over the plant’s lifetime. Consequently, the impact of the efficiency loss experienced by solar panels over time on long-term economic returns can be clearly compared, and a highly accurate dataset is obtained for financial budgeting exercises for the following year, based on linear performance decline. Conversely, the price of electricity is subject to constant fluctuation, depending on prevailing market conditions. From January 2010 to November 2024, the Market Exchange Price for electricity increased by an average of approximately 39.69% per annum. However, the feasibility study was based on the real electricity price, and no increase in the electricity price was anticipated. It can be posited that the rise in electricity prices will positively impact the investment feasibility of solar power plants. It can be argued that the feasibility study was prepared based on the worst-case scenario.
Detailed year-by-year cash flow analyses over the 30-year project lifespan for the evaluated design configurations under 100%, 50%, and 25% equity financing scenarios are provided comprehensively in Appendix A (Table A1), Appendix B (Table A2), and Appendix C (Table A3), respectively. For conceptual clarity and ease of comparison, the cumulative net benefits illustrating the break-even points and financial trajectories over the initial 10-year operational period are visually summarized in Figure 3, Figure 4 and Figure 5.
According to the comparative analysis presented in Table 5 and Table A1 and Figure 3, all scenarios under 100% equity financing demonstrate a payback period of less than five years. Specifically, the 21° Mono and 25° Mono designs reach their break-even points in 4.15 and 4.17 years, yielding 10-year cumulative net benefits of 6,481,850 USD and 6,515,690 USD, respectively. The bifacial designs exhibit superior economic performance; the 25° bifacial configuration achieves a payback in 3.70 years, while the 21° bifacial design provides the most favorable result with a 3.66-year payback period and a cumulative net benefit of 8,184,970 USD over 10 years. The projects transition to a positive net value within the fourth year for the bifacial configurations, and within the fifth year for the mono configurations, with profitability sustained throughout the panel performance guarantee. While the technical lifespans and warranties of the panels are 30 years, the results are visualized over a 10-year period to optimize graphical readability.
It is asserted that, under a 50% equity financing scenario, the analysis presented in Table 5 and Table A2 and Figure 4 indicates that the 21° Mono and 25° Mono designs exhibit payback periods of 5.75 and 5.76 years, yielding 10-year cumulative net benefits of 3,109,920 USD and 3,143,770 USD, respectively. The bifacial configurations demonstrate superior financial performance; the 25° and 21° bifacial designs recoup their investments in 4.77 and 4.70 years, respectively, with the latter providing the highest cumulative net benefit of 4,813,050 USD over 10 years. In all scenarios, project financing transitions to a positive net value within the fifth or sixth year, with profitability sustained throughout the duration of the panel performance guarantee. To optimize graphical readability and clarity, the visualizations are restricted to a 10-year period, despite the 30-year technical warranty of the panels.
According to the results presented in Table 5 and Table A3 and Figure 5, under a 25% equity financing scenario, the 21° Mono and 25° Mono designs exhibit payback periods of 7.46 and 7.45 years, respectively. These designs transition to a positive net value within the eighth year, resulting in 10-year cumulative net benefits of 1,423,960 USD and 1,457,800 USD. Consistent with previous scenarios, the bifacial configurations demonstrate superior economic efficiency: the 25° and 21° bifacial designs achieve payback in 5.80 and 5.70 years, respectively, with the 21° design yielding the highest cumulative net benefit of 3,127,080 USD over a 10-year period. In all cases, profitability is sustained throughout the panel performance guarantee. To optimize graphical readability, the visualizations are restricted to a 10-year period, despite the panels’ 30-year technical warranty.
3.2. Sensitivity Analysis
A sensitivity analysis is conducted under various assumptions regarding the discount rate, electricity prices, and the economic lifetime. The following ranges were utilized:
Discount Rate: Base 7.5%; Sensitivity 5.5% and 9.5%
Electricity Prices (Base Real Market Price (RP)): 0.091($/kWh)
Sensitivity RP–2% and RP + 2%
Economic Life: 30 years (minimum)
It should be noted that the findings of the sensitivity analysis are applicable to an increase in price only. The same conclusions would apply to a constant or decreasing price. The findings of the sensitivity analysis are outlined in Table 6, Table 7 and Table 8. In these tables, values that are remarkably high and low are color-coded as follows: NPV < $6,500,000 is highlighted in red, NPV > $10,000,000 but >$6,500,000 is highlighted in green, and NPV > $10,000,000 is highlighted in blue. The color-coding system has been implemented to facilitate visual analysis and enable rapid comprehension The values $6.5M and $10M have been selected to highlight the difference between the scenarios, rather than having any specific meaning [8].
Table 6.
Sensitivity Analysis Results for 100% Equity: NPV (USD).
Table 7.
Sensitivity Analysis Results for 50% Equity: NPV (USD).
Table 8.
Sensitivity Analysis Results for 25% Equity: NPV (USD).
As demonstrated in the tables, the outcomes are found to be highly sensitive to the discount rate, and less sensitive to design type and prices. Utilizing the same discount rate and price point, bifacial panels yield Net Present Value (NPV) outcomes that are approximately 6–7% higher than those of competing panels. Furthermore, a 2% alteration in price elicits a 4% change in NPV, irrespective of the design type. A modification in the discount rate by 2% can result in a substantial alteration of approximately 34% in the net present value (NPV).
The calculation of CO2 emission reduction is fundamentally defined as the amount of CO2 that would otherwise be emitted from the combustion of fossil fuels to satisfy energy requirements.
In this context, ‘Unit Emission’ denotes the CO2 intensity per 1 kWh of electricity, while ‘Total Electricity Consumption’ signifies the facility’s total energy demand in kWh. As indicated by Equation (5), substituting conventional grid power with renewable energy results in an equivalent reduction in total CO2 emissions. Environmentally, different power plant designs of equal capacity yield similar benefits, mitigating emissions by 5899.51–6507.58 tonnes with negligible variance. Given these minimal differences, the potential for emission reduction does not serve as a decisive factor in the selection of a specific design configuration. The projected contributions of various simulated solar power plant designs to CO2 emission mitigation are summarized in Table 9.
Table 9.
Prevented CO2 emission for different designs.
According to Table 9, the 21° bifacial configuration provides the highest contribution to emission mitigation, consistent with its superior production capacity. These annual production figures correspond to the initial year of the panels’ linear performance curve. Based on the 30-year performance guarantee provided by the manufacturer, the annual CO2 emission reduction is projected to decline annually in correlation with the panel degradation rate. While renewable energy facilities may engage in international carbon credit trading depending on their grid connection type—with revenues fluctuating based on certification standards and market supply–demand dynamics—this potential income was omitted from the feasibility analysis due to its negligible financial impact.
The technical and economic parameters of the solar panel design scenario used in preparing the financial feasibility and simulation provided within the study are presented in Table 10. Following the conduction of the simulation studies, fieldwork and feasibility study, the decision was taken to implement the investment as a 21-degree bifacial design. The facility was completed in January 2025, testing was initiated, and full-capacity operation began as of April 2025. The monthly production values realized from April 2025 to the end of March 2026, along with their comparison to the simulation results, are presented in Table 11.
Table 10.
Assumptions Table.
Table 11.
Comparison of measured, adjusted, and simulated energy production.
As demonstrated in Table 11, the extent to which the simulation (PVsyst) corresponds to the adjusted production in the field has been evaluated on both a monthly basis and through volumetric weighting. The overall 3.00% discrepancy suggests that the PVsyst simulation provides a highly reliable estimate of the total annual production. The Volumetrically Weighted Average Absolute Relative Error (5.07%) scales the monthly percentage deviations according to their recorded volumetric (kWh) contribution to the annual total, providing a representative measure of operational accuracy.
Furthermore, to facilitate a direct comparison with existing forecasting studies in the PVsyst validation literature, standard statistical error metrics were evaluated based on the normalized monthly generation data. The Mean Absolute Error (MAE) was calculated to be 96,468 kWh/month, representing a mean absolute deviation of 4.93%. The Root Mean Square Error (RMSE), which assigns higher penalties to larger variances observed during seasonal transitions, was 123,055 kWh/month (6.28%). Additionally, the Mean Bias Error (MBE) was determined to be −56,958 kWh/month (−2.91%). The negative MBE is a critical indicator, highlighting that the simulation systematically underestimates the adjusted generation to a slight degree. This demonstrates that the parameterized PVsyst model operates safely on the conservative side, providing a robust forecasting framework rather than artificially overestimating the solar plant’s yield potential.
In April (1.93%), May (2.91%), and September (2.59%), the simulated values closely align with raw measured production. This alignment suggests that the model is adequately reliable under standard solar conditions characterized by stable radiation.
A comparative evaluation of the Performance Ratio (PR) further corroborates this operational consistency. The volumetrically weighted average Measured PR (87.43%) and the simulated PVsyst PR (87.48%) exhibit a marginal deviation of merely 0.05%. This close alignment in efficiency metrics suggests that, independent of absolute irradiance fluctuations, the model realistically reflects the inherent opto-electrical behavior and system-level losses of the power plant under real-world conditions.
The experimental datasets were derived from the remote monitoring of 35 inverters, complemented by data collected from three Sungrow PC-4 meteorological stations installed on-site. During the winter period, operation logs revealed that extreme weather conditions led to structural damage in the power distribution infrastructure, which subsequently constrained the operational continuity of the solar power plant. Power grid outages, each with a repair duration of 4 to 8 h, occurred in Kirsehir due to unusually severe winter conditions on the following dates: 6, 9, 16, 21, 23, and 26 December 2025; 8, 9, 11, 12, and 17 January 2026; and 5, 6, 10, 13, 18, 23, and 25 February 2026. To prevent validation bias caused by this physical grid unavailability, the raw measured production records for December, January, and February presented in Table 11 were explicitly normalized. To strictly avoid any circularity in the validation process, this normalization was not derived from theoretical PVsyst outputs but was calculated empirically. The curtailed energy corresponding to the exact hours of the documented grid outages was computed using the measured Plane-of-Array (POA) irradiance from the independent on-site meteorological stations. Following this empirical normalization, the absolute relative errors for these winter months align closely with the simulated values (5.35% for December, 0.00% for January, and 3.37% for February), demonstrating the simulation’s robust accuracy even under challenging seasonal conditions. The minor remaining discrepancies during this period can generally be attributed to the stochastic nature of local weather patterns—such as a higher frequency of rainy and overcast days compared to historical averages—which inherently differ from the long-term TMY (Typical Meteorological Year) datasets.
The empirical rear-side generation gains and predictive accuracy observed in this 13.18 MWp facility closely align with recent global efforts to optimize bifacial photovoltaic systems. A comprehensive 2026 review on solar energy harvesting highlights that while artificial, highly reflective ground treatments (such as white cement or foil) significantly enhance bifacial gain, their economic viability is frequently constrained by substantial material and installation costs [11]. Our research demonstrates that the integration of industrial calcite waste overcomes this critical financial barrier. By utilizing a zero-cost by-product, our facility achieves high-albedo performance without the economic trade-offs typically associated with engineered reflective surfaces [11]. Furthermore, our conclusion that a 21° tilt outperforms a 25° tilt for bifacial modules corroborates recent findings that optimal tilt angles for bifacial systems deviate from traditional monofacial standards, largely due to the complex dynamics of ground-reflected contributions and row spacing sensitivities [11].
The robustness of our PVsyst simulation, which demonstrated an annual discrepancy of just 3.00% against the production adjusted for grid outages, contributes significantly to the growing body of literature validating bifacial PV performance. Recent international studies, such as a 2025 evaluation of a grid-connected bifacial system in India, emphasize the critical need for predictive accuracy when using simulation and machine learning tools, noting performance ratios (PR) of approximately 81.6% for small-scale installations [12]. Our utility-scale validation extends this confidence, demonstrating that operational PR values ranging from 82.8% to 93.9% can be accurately forecasted even at a 13.18 MWp capacity, provided that site-specific parameters—such as localized albedo and meteorological fluctuations—are meticulously modeled.
Finally, the global pursuit of bifacial optimization spans from system-level macro-engineering to fundamental material science. While recent advancements in perovskite solar cells explore novel charge transport layers to push bifacial efficiency beyond 31% at the microscopic cell level [13], our study provides indispensable macro-level validation. It confirms that the theoretical and material-level advantages of bifacial technology [13] can be successfully realized and financially sustained in utility-scale deployments through strategic ground enhancement and meticulous techno-economic planning.
4. Conclusions
This study provides a comprehensive, multi-criteria techno-economic assessment of a 13.18 MWp solar power plant, evaluating varying design configurations—specifically, 21° and 25° tilt angles across monofacial and bifacial technologies—based on technical efficacy, financial viability, and environmental impact. The synthesis of simulation outputs and feasibility analyses reveals that each configuration yields distinct operational advantages.
Although all simulated designs exhibit suitability for debt financing, Prudential Financial management dictates that the cumulative investment cost, inclusive of financing expenses, should not surpass twice the initial capital expenditure. Consequently, the adoption of either a 100% equity model or a balanced 50/50 debt-to-equity strategy is highly recommended. Furthermore, given the consistently abbreviated payback periods across all evaluated scenarios, the final selection of a financing framework should be fundamentally tailored to the investor’s specific liquidity and cash flow imperatives.
A comparative analysis of these financing models and associated payback trajectories indicates that while the 25° monofacial design demonstrates marginal superiority over its 21° counterpart, bifacial technology categorically dominates the price–performance index. Notably, driven by substantial gains in generation capacity, the 21° bifacial configuration yields an annual energy output of 22,816,114 kWh. This specific architecture surpasses the 25° bifacial system by 44,376 kWh annually, concurrently outperforming the 21° and 25° monofacial configurations by 2,131,935 kWh and 1,986,956 kWh, respectively. Although the simulated energy yield of the 21° bifacial configuration shows a marginal advantage of approximately 0.195% over the 25° configuration, this difference falls within the standard boundaries of meteorological and modeling uncertainty. Therefore, rather than defining a definitively optimal angle based solely on minimal generation differences, operational decisions should be guided by broader techno-economic evaluations. In this context, sensitivity analyses confirm that despite the profound vulnerability of project profitability to discount rate volatility, the 21° bifacial design affords maximal financial resilience against macroeconomic perturbations, effectively mitigating long-term investment risk.
This research highlights the practical application of industrial calcite (CaCO3) as a high-albedo ground cover. Although a physical bifacial control configuration without calcite was unavailable to experimentally isolate the exact albedo contribution, field observations from this facility are highly consistent with the modeled benefits of enhanced albedo, indicating that this cost-efficient intervention improves the rear-side generation of bifacial modules. Consequently, the deployment of calcite represents a highly promising and scalable optimization strategy for utility-scale bifacial photovoltaic projects in high-irradiance regions like Central Anatolia, warranting further comparative research to fully determine its potential as a broader industry practice. It is important to note that for this specific facility, the industrial waste calcite was acquired at zero cost, with all transportation and storage expenses fully covered by the supplying calcite factory. Therefore, material and logistics costs for the albedo enhancer were not factored into the current financial evaluation. However, as the use of waste calcite for albedo enhancement becomes more widespread, it is highly probable that it will transition into a commercial commodity. Future feasibility studies and large-scale deployments must explicitly incorporate these potential material, transportation, and maintenance costs to accurately assess the long-term economic viability.
Empirical validation of the PVsyst simulation was evaluated against realized field generation data. While the raw measured annual production was recorded at 22,793,323 kWh because of severe winter grid outages, the validation was strictly based on the production adjusted for grid outages (23,499,604 kWh). Comparing this adjusted yield with the simulated generation (22,816,114 kWh) demonstrated a total annual discrepancy of 3.00% and a volumetrically weighted average error of 5.07%. Crucially, to explicitly decouple the model’s intrinsic fidelity from inter-annual meteorological variability, the validation was further assessed using the Performance Ratio (PR). The adjusted volumetrically weighted PR (87.43%) aligned remarkably well with the simulated PR (87.48%), exhibiting a marginal deviation of merely 0.05%. This nominal deviation corroborates the premise that simulation models, when rigorously parameterized with precise regional topography and material-specific albedo coefficients, function as robust, long-term decision-support frameworks for utility-scale energy investments. While the simulation demonstrated consistent accuracy across all seasons following the necessary normalization of data for documented winter grid outages using strictly independent empirical field measurements, the occurrence of these outages highlights a critical vulnerability. It reveals the susceptibility of operational continuity to extreme meteorological events and resultant grid instabilities. This dynamic underscores that the commercial viability of solar infrastructure is contingent not solely upon photovoltaic module efficiency and precise generation forecasting, but equally upon the structural resilience and reliability of the overarching regional power grid.
From an environmental standpoint, assessing system designs exclusively through theoretical emission metrics relative to nominal capacity proves inadequate; authentic emission mitigation is inextricably linked to the actualized energy yield under real-world operational constraints. By maximizing gross energy production, the 21° bifacial configuration facilitates the avoidance of approximately 6507.58 tonnes of CO2 emissions annually. This optimal architectural selection intrinsically aligns with Türkiye’s overarching strategic mandate to elevate the renewable energy fraction in its electricity generation matrix to 70% by 2030, thereby furnishing a pragmatic engineering trajectory toward realizing national energy sovereignty and carbon neutrality. Finally, to advance this domain of study, future research should prioritize longitudinal field monitoring of calcite ground covers to meticulously quantify potential albedo degradation resulting from sustained environmental soiling and natural weathering.
Author Contributions
S.H.: Conceptualization, Methodology, Software, Formal analysis, Validation, Writing—original draft. İ.E.: Supervision, Project administration, Data curation, Resources, Review & editing. S.S.T.: Supervision, Project administration, Resources, Data curation, Review & editing. All authors have read and agreed to the published version of the manuscript.
Funding
This research received no external funding.
Institutional Review Board Statement
Not applicable.
Informed Consent Statement
Not applicable.
Data Availability Statement
The data presented in this study are available on request from the corresponding author. The data are not publicly available due to privacy and commercial confidentiality restrictions regarding the operational power plant.
Acknowledgments
This study is extracted from the Ph.D. dissertation entitled ‘Artificial Intelligence Supported Minimization of Fluctuations in the Electricity Market’ at the Graduate School of Natural and Applied Sciences, Gazi University.
Conflicts of Interest
The authors declare no conflicts of interest.
Appendix A
Table A1.
Annual and Cumulative Cash Flow for 100% Equity Scenario (in Thousands USD).
Appendix B
Table A2.
Annual and Cumulative Cash Flow for 50% Equity Scenario (in Thousands USD).
Appendix C
Table A3.
Annual and Cumulative Cash Flow for 25% Equity Scenario (in Thousands USD).
Appendix D
Table A4.
Simulation Parameters.
Appendix E
Figure A1.
Loss Diagram of 21 Degree Bifacial Design Simulation.
References
- Energy Institute. Statistical Review of World Energy 2023 (72nd Edition). Available online: https://www.energyinst.org/statistical-review (accessed on 4 May 2026).
- Dincer, I. Renewable energy and sustainable development: A crucial review. Renew. Sustain. Energy Rev. 2000, 4, 157–175. [Google Scholar] [CrossRef] [Scilit]
- IEA. World Energy Outlook 2023; International Energy Agency: Paris, France, 2023; Available online: https://www.iea.org/reports/world-energy-outlook-2023 (accessed on 4 May 2026).
- T.C. Enerji ve Tabii Kaynaklar Bakanlığı. 2019–2023 Stratejik Planı; T.C. Enerji ve Tabii Kaynaklar Bakanlığı: Ankara, Türkiye, 2019.
- Aksoy, H.; Korkmaz, O.; Yigit, V.; Bavbek, K.G.; Koyuncuoglu Toma, E.; Rogner, M. 2030 Yılına Doğru Türkiye’nin Optimum Elektrik Üretim Kapasitesi; SHURA Enerji Dönüşümü Merkezi: İstanbul, Türkiye, 2020; Available online: https://shura.org.tr/2030-yilina-dogru-turkiyenin-optimum-elektrik-uretim-kapasitesi/ (accessed on 4 May 2026).
- Cosgun, A.E.; Demir, H. Investigating the effect of albedo in simulation-based floating photovoltaic system: 1 MW bifacial floating photovoltaic system design. Energies 2024, 17, 959. [Google Scholar] [CrossRef] [Scilit]
- Yıldırım, B.; Düzkaya, H. Comparative Analysis with PVGIS and PVsyst for Solar Energy Production in Bahşılı Region of Kırıkkale. Gazi Üniversitesi Fen Bilim. Derg. Part C Tasar. Teknol. 2025, 13, 877–891. [Google Scholar] [CrossRef] [Scilit]
- Kumbaroğlu, G.S.; Çamlibel, M.E.; Avcı, C. Techno-economic comparison of bifacial vs monofacial solar panels. Eng. Struct. Technol. 2021, 13, 7–18. [Google Scholar] [CrossRef] [Scilit]
- EPİAŞ. Transparency Platform. Energy Exchange Istanbul. 2026. Available online: https://seffaflik.epias.com.tr/home (accessed on 28 July 2026).
- Republic of Turkey. T.C. Resmî Gazete [Official Gazette of the Republic of Turkey], (27721). 2010. Available online: https://www.resmigazete.gov.tr/eskiler/2010/10/20101006.htm (accessed on 28 July 2026).
- Memme, S. Albedo and solar energy harvesting: A review on its impact and estimation in photovoltaic applications. Sol. Energy Mater. Sol. Cells 2026, 304, 114399. [Google Scholar] [CrossRef] [Scilit]
- Kumar, B.S.; Kunar, B.M.; Murthy, C.S.N. Performance Evaluation and Machine Learning Analysis of 3 kW Grid-Connected Bifacial Solar Photovoltaic Systems. J. Inst. Eng. Ser. B 2025, 106, 1929–1939. [Google Scholar] [CrossRef] [Scilit]
- Shimul, A.I.; Ghosh, A.; Sarker, S.R.; Alturaifi, H.A. Examining the contribution of charge transport layers to boost the performance over 26% in Sr3PCl3 absorber-based bifacial perovskite solar cells. RSC Adv. 2025, 15, 7663–7681. [Google Scholar] [CrossRef] [Scilit] [PubMed]

Disclaimer/Publisher’s Note: The statements, opinions and data contained in all publications are solely those of the individual author(s) and contributor(s) and not of MDPI and/or the editor(s). MDPI and/or the editor(s) disclaim responsibility for any injury to people or property resulting from any ideas, methods, instructions or products referred to in the content. |
© 2026 by the authors. Licensee MDPI, Basel, Switzerland. This article is an open access article distributed under the terms and conditions of the Creative Commons Attribution (CC BY) license.