


Abstract
Although drought is recognized as one of the major hydroclimatic hazards affecting the Mediterranean Basin, local-scale assessments to support planning for its agricultural, hydrological, and food security impacts remain limited. This study investigates historical and future drought dynamics in Manisa (Western Türkiye) using a multi-scale framework integrating the Standardized Precipitation Index (SPI) and the Standardized Precipitation Evapotranspiration Index (SPEI) with CMIP6 climate projections. A comprehensive dataset including ERA5-Land, CHIRPS, TerraClimate, and station observations was evaluated, revealing strong agreement in temperature but higher uncertainty in precipitation. SPI results indicate recurrent short-term droughts with extreme events reaching −2.5 in 2007–2008, alongside intensified long-term hydrological droughts since the early 1990s, while SPEI reveals a stronger temperature-driven drought signal, peaking near −2.0 during 2020–2024 as the most severe cumulative drought period in the past 40 years. Rapid wet–dry transitions have increased since 2000, indicating a more unstable hydroclimatic regime. Future projections (2025–2100) under a high-emission scenario suggest a progressive intensification of thermally driven drought conditions, with SPEI trends declining more steeply than SPI, indicating that evapotranspiration-driven water deficits may increasingly outweigh precipitation deficits as a driver of future drought risk. These findings offer localized, data-driven evidence relevant to climate adaptation and water resource planning in semi-arid Mediterranean agricultural regions.
1. Introduction
Climate change is projected to substantially increase human exposure to heat stress, even under the most optimistic warming trajectories. According to the Intergovernmental Panel on Climate Change (IPCC), approximately 13.8% of the global population may face excessive heat stress if warming is limited to 1.5 °C above pre-industrial levels, a proportion that could rise to 36.9% under a 2 °C scenario [1]. Among the cascading consequences of a warming climate, drought is considered one of the most pervasive, as it reflects the disruption of the natural temporal and spatial equilibrium of hydrological systems [2,3]. Drought is increasingly understood not as an isolated meteorological event but as a long-term, multidimensional environmental hazard closely tied to the broader climate system, with impacts that extend well beyond immediate water scarcity to affect agriculture, ecosystems, and human livelihoods [4,5,6,7,8]. Its prolonged duration and extensive spatial reach further distinguish it from other short-term climatic extremes, often resulting in considerable socio-economic and environmental consequences [9,10,11].
Situated within the Mediterranean Basin, Türkiye is considered one of the countries most susceptible to the effects of climate change, owing to its geographical position, topographic diversity, and climatic heterogeneity [12,13]. Rising temperatures and declining precipitation are reported to be placing increasing strain on the country’s water resources, and this sensitivity is expected to intensify further under future climate scenarios [14]. Meteorological and hydrological droughts have already been associated with considerable damage to agriculture, the economy, and daily life across Mediterranean countries [15,16], a pattern that appears to be compounded by the overexploitation of groundwater resources under shifting climatic regimes [17]. These conditions underscore the growing relevance of integrated basin-scale management as a proactive strategy for drought mitigation and adaptation [18].
Given this context, robust regional climate projections are essential not only for informing climate adaptation and mitigation strategies, but also for supporting sustainable development through the protection of water resources, agricultural productivity, ecosystem services, and food security. Reliable projections can provide a scientific basis for evidence-informed decision-making and climate-resilient planning under conditions of increasing hydroclimatic uncertainty. Despite this need, regional climate modelling studies addressing future conditions over Türkiye remain comparatively limited, which constrains the scientific basis available for regional adaptation planning and policy development. This scarcity is regarded as a central motivation for the present study.
Manisa Province, located within the Mediterranean climate zone of western Türkiye, is considered a representative case for examining drought vulnerability due to its high agricultural production potential and its documented susceptibility to drought hazards [19]. The province’s principal agricultural plains, the Lower Gediz, Middle Gediz, and Akselendi Plains, are particularly sensitive to hydroclimatic variability, given their dependence on a Mediterranean precipitation regime characterized by a pronounced seasonal water deficit of approximately six months. This vulnerability appears to have intensified over recent decades, coinciding with a persistent drying trend reported since the 1980s and culminating in severe drought episodes during 2007–2008 that affected both water availability and agricultural production. Related hydroclimatic processes have also been linked to the formation and migration of sand dunes reaching 3–4 m in thickness, with reported damage to the region’s economically important seedless grape vineyards [20]. Continued increases in temperature alongside declining winter precipitation are expected to further reduce water availability, placing sustained pressure on surface and groundwater resources and potentially elevating the risk of desertification and long-term drought vulnerability across the province.
Although SPI and SPEI are widely used and complementary indices for drought assessment, relatively few studies appear to have jointly applied them to characterize the progression from meteorological to agricultural and hydrological drought while simultaneously evaluating historical conditions and future climate projections at the provincial scale in Türkiye. Both indices can be computed across multiple accumulation periods to represent distinct components of the hydrological cycle [21,22]; in the present study, 3-, 6-, and 12-month scales were selected to capture, respectively, short-term meteorological and soil-moisture conditions relevant to rainfed agriculture, seasonal precipitation deficits affecting streamflow and irrigation availability, and long-term hydrological drought associated with groundwater recharge and reservoir storage [23,24]. This multi-timescale approach is intended to allow drought propagation to be traced from short-term atmospheric deficits to longer-term hydrological consequences.
This study seeks to address this gap by proposing an integrated, multi-timescale framework for drought characterization in Manisa Province that combines historical observations (1985–2024) with CMIP6-based future projections (2025–2100). Rather than proposing a new drought index, the contribution of this work lies in the development of a rigorously validated assessment framework: TerraClimate data were first evaluated against ground-based meteorological observations to establish their representativeness for the study area, following which CMIP6 global climate models were comparatively assessed to identify the model most suitable for regional drought projection. SPI and SPEI were then jointly applied across multiple timescales using these validated datasets, allowing both precipitation-driven and temperature-driven drought signals to be examined concurrently. This combined approach may help reveal drought conditions that would otherwise remain undetected by precipitation-based indicators alone, while offering a framework that could plausibly be adapted to other semi-arid Mediterranean settings facing comparable data and modelling constraints.
Accordingly, the specific objectives of this study are to: (i) validate observational and reanalysis datasets against station data for Manisa Province; (ii) evaluate the comparative performance of multiple CMIP6 global climate models in reproducing regional drought characteristics; (iii) characterize historical drought variability (1985–2024) using SPI and SPEI at 3-, 6-, and 12-month scales; and (iv) assess potential future drought evolution through 2100 under a high-emission climate scenario. In doing so, this study aims to provide locally grounded evidence on the relationship between climate change and drought dynamics in Manisa Province, with a view to informing risk-based climate adaptation, water management, and agricultural planning in water-dependent Mediterranean agricultural regions.
2. Data and Methods
2.1. Study Area
Manisa Province is characterized by a heterogeneous topography consisting of broad alluvial plains surrounded by mountainous terrain. Manisa province is a vulnerable area for drought studies [25,26] because of its topographical diversity, the intensity of agricultural activity, and growing urban pressures. It is located in the transition zone between Mediterranean and continental climates. Agricultural activities are concentrated mainly on the fertile Gediz Plain, where irrigated farming dominates the production of grapes, olives, cotton, maize, and vegetables, while higher elevations are covered by forests, shrublands, and natural vegetation. Climatically, Manisa is characterized by a transitional regime between the Mediterranean and continental climates, resulting in pronounced seasonal variability in temperature and precipitation. The region experiences hot, dry summers and mild, relatively wet winters, with the majority of annual precipitation occurring between November and March, while summer precipitation is generally limited. Hydrologically, the province is largely located within the Gediz River Basin, one of Türkiye’s most important agricultural basins, where irrigation water supports extensive vineyards, olive groves, and field crop production. In addition to its agricultural importance, Manisa is one of Türkiye’s leading industrial provinces, hosting well-developed organized industrial zones with manufacturing activities in the electronics, automotive, food processing, and machinery sectors. Water resources are primarily supplied by the Gediz River, one of western Türkiye’s major river systems, together with its tributaries and irrigation reservoirs, which support agricultural and industrial water use. Consequently, spatial variations in topography, land use, water availability, and socio-economic activities strongly influence the occurrence and severity of drought across the province. Consequently, changes in precipitation, temperature, and evapotranspiration directly influence water availability, agricultural productivity, and regional water resource management, making Manisa highly sensitive to the impacts of climate variability and future climate change. The administrative borders of Manisa Province were designated as the study area, and provincial-level analysis was conducted. This scale was selected to capture the spatial variability of drought conditions across the region, considering differences in topography, climate, and land use. In addition, the provincial scale represents an important administrative unit for climate adaptation, water management, and agricultural planning, enabling the results to provide a scientific basis for regional drought assessment and future projections. Figure 1 shows the location of Manisa and the locations of the meteorological stations present and located there.
Figure 1.
(a) Location of Türkiye in the world; (b) location of Manisa within Türkiye; (c) Digital Elevation Model (DEM) of the Manisa study area.
2.2. Datasets
A thorough multi-source dataset structure was created in order to examine the temporal variability and spatial distribution of drought in Manisa Province. Global climate models (GCMs), satellite-derived climate product reanalysis datasets, and ground-based meteorological observation datasets were all used in the study. Meteorological observations obtained from the Manisa Center and Kent Forest stations, provided by the General Directorate of Meteorology (MGM), were used as reference data for validation analyses. In addition to station observations, several gridded climate datasets and climate model outputs, including TerraClimate, CHIRPS, and ERA5-Land, were incorporated into the analysis to provide continuous spatial and temporal coverage, ensure meteorological consistency, and establish a robust historical baseline for the drought assessment. For future climate projections, outputs from CMIP6 (Coupled Model Intercomparison Project Phase 6) global climate models were utilized. These models include HadGEM3-GC31-LL, MPI-ESM1-2-HR, CNRM-CM6-1-HR, NorESM2-MM and IPSL-CM6A-LR. Considering the importance of accurately representing the Mediterranean climatic characteristics of Türkiye, these models were selected based on their demonstrated performance in regional climate studies [12].
Table 1 summarizes the characteristics of the datasets used in this study, including their temporal and spatial resolutions, variables, and periods of record. The historical drought assessment was conducted using multi-source climate datasets covering the period 1985–2015. ERA5-Land, CHIRPS v2, TerraClimate, and meteorological station observations were integrated to provide a comprehensive representation of precipitation and temperature variability by combining reanalysis, satellite–gauge-blended, observation-based-gridded, and ground-based measurements. These datasets provide monthly temporal resolution and different spatial scales, enabling the characterization of regional climate variability and drought dynamics. To investigate future drought evolution, outputs from four CMIP6 global climate models (HadGEM3-GC31-LL, MPI-ESM1-2-HR, CNRM-CM6-1-HR, and NorESM2-MM) were analyzed under the SSP1-2.6 scenario for the period 2025–2100. All climate model outputs were obtained at monthly temporal resolution and were used to evaluate projected changes in precipitation and temperature patterns and their implications for future drought conditions. The integration of multiple observational, reanalysis, and climate model datasets enhances the reliability of drought characterization by reducing uncertainties associated with individual data sources and providing a consistent framework for historical assessment and future projections.
Table 1.
Summary of the multi-source datasets used in the study.
2.3. Data Preprocessing
All datasets were subjected to a standardized preprocessing workflow to ensure spatial and temporal consistency. The administrative boundary of Manisa Province was obtained from the FAO Global Administrative Unit Layers (GAUL) database and used as the vector mask to clip all raster datasets to the study area. The preprocessing framework was executed through a rigorous four-stage sequential pipeline designed to ensure multi-source data integration and physical consistency. The process was initiated with a comprehensive dataset validation, where satellite-derived raster stacks were cross-referenced against grid-based ground station observations to establish a reliable baseline. Parallel to this validation, a robust model-selection protocol was implemented: CMIP6 global climate models were evaluated against regional climatic characteristics, leading to the identification of the most representative model for the study area. Once the optimal datasets were secured, the workflow transitioned into spatial harmonization and unit conversion. This stage involved re-gridding disparate data layers into a standardized coordinate reference system and uniform cell size, while simultaneously transforming variables into consistent physical units for seamless mathematical integration. To refine the analysis to the regional scale, the datasets were spatially clipped and masked to the official administrative boundaries of Manisa Province. The final phase focused on statistical refinement through quantile mapping and bias correction. Systematic errors inherent in satellite measurements and climate models were mitigated. This calibration process ensured that the resulting dataset not only reflects localized hydro-climatic nuances but also provides a high-fidelity foundation for subsequent SPI and SPEI drought indexing.
This study employed CMIP6 global climate models that have been reported to perform well for Türkiye and the Mediterranean climate region in previous studies [12]. Rather than directly applying all available climate models, a model evaluation framework was adopted to identify the most suitable model for drought assessment in the study area. Historical simulations obtained from the CMIP6 archive (historical: 1850–2014; SSP scenarios: 2015–2100) were compared with the TerraClimate observational dataset, which was previously validated against ground-based meteorological observations and identified as the most representative reference dataset for Manisa Province.
In the sixth phase of the Coupled Model Intercomparison Project (CMIP6), Global Climate Models (GCMs) are driven by a new generation of climate scenarios that combine Shared Socioeconomic Pathways (SSPs) with radiative forcing targets, providing an integrated framework for assessing future climate change [27]. Within this framework, SSPs describe alternative socioeconomic development pathways, including changes in population, economic growth, technological development, energy use, and climate policies, while radiative forcing pathways represent the resulting greenhouse gas concentrations and their influence on the climate system. The combination of these components enables the assessment of future climate responses under different socioeconomic and emission trajectories. In this study, future climate projections were derived under the SSP5-8.5 scenario, representing a high greenhouse gas emission pathway characterized by continued fossil fuel-based development and limited climate mitigation [28,29]. Historical simulations covered the period 1985–2014, whereas future drought projections for 2015–2100 were generated under the SSP5-8.5 scenario.
Based on this comparative evaluation, the CNRM-CM6-1-HR model demonstrated the highest agreement with the reference dataset and was therefore selected for future drought projections. To reduce systematic biases in climate model simulations, an Empirical Quantile Mapping (EQM) bias-correction approach was applied using the qmap package in the R statistical environment. Historical TerraClimate data were used as the reference observations, whereas the corresponding historical simulations of the selected CMIP6 model were used for calibration. The empirical cumulative distribution function (CDF) of the climate model outputs was adjusted to match that of the reference dataset, following the Quantile Mapping approach described by Gudmundsson [30]. The calibrated transfer function was subsequently applied to future climate projections, assuming that model biases estimated during the historical period remain stationary. Subsequently, SPI and SPEI were calculated at 3-, 6-, and 12-month time scales using the validated CNRM-CM6-1-HR projections to investigate the evolution of meteorological, agricultural, and hydrological drought under future climate change scenarios. This model-selection procedure reduced model-related uncertainty and provided a robust basis for subsequent drought analyses.
The model comparison process was carried out following a five-stage methodology. In the first stage, TerraClimate and CMIP6 raster data were read in the R (version 4.6.1) environment and monthly time series were created. In this study, the period 2015–2024 was used for model evaluation and a comparison was made with the observational reference dataset. Model data were checked for unit compatibility before analysis. CMIP6 precipitation data were converted from kg m−2 s−1 to mm/month, and temperature data were converted from Kelvin to °C. This made all model outputs comparable to the TerraClimate dataset. In the second stage, potential evapotranspiration (PET) was calculated using the Hargreaves–Samani (HS) method with maximum and minimum temperature variables in the CMIP6 datasets. In the third stage, Quantile Mapping was applied to eliminate systematic biases between model outputs and observational data; this included bias correction and downscaling. In the fourth stage, SPI and SPEI drought indices were calculated for 3-, 6-, and 12-month time scales using the corrected data. Finally, the performance of the models was evaluated using RMSE, MAE, Bias, and correlation coefficient statistics, and the models were ranked according to the results to determine the most suitable model for the study area.
2.4. Drought Indexes Calculation
The Standardized Precipitation Index (SPI) and the Standardized Precipitation–Evapotranspiration Index (SPEI) were used to determine drought conditions. While the SPI defines drought conditions based solely on precipitation data [21], the SPEI considers temperature and its associated potential evapotranspiration effects along with precipitation, offering a more climate change-sensitive drought indicator [22]. Both indices were calculated on 3-month (short-term, meteorological), 6-month (medium-term, agricultural), and 12-month (long-term, hydrological) time scales to represent different components of drought. All index calculations were performed in the R software environment.
2.4.1. Standardized Precipitation Index (SPI)
The Standardized Precipitation Index (SPI), developed by McKee et al. [21], is used to assess the effects of precipitation variations on water resources such as soil moisture, stream flow, and groundwater, to monitor droughts on a regional scale, and to estimate their severity. It is a statistical index calculated by dividing the deviation of the precipitation amount for a specific period from the long-term average by the standard deviation, and by converting long-term precipitation data into a probability distribution and normalizing it to a standard normal distribution [21,31]. The biggest advantage of this index is that it only requires precipitation data and offers a dimensionless structure that allows comparisons between different climate zones. When calculating the SPI, the two-parameter Gamma probability density function, which is one of the models that best represents the frequency distribution of precipitation data, is preferred. The Gamma distribution function is defined in Equation (1):
Here, x represents the amount of precipitation (x > 0), α the shape parameter, and β the scale parameter. Γ(α) is the mathematical Gamma function. To ensure the distribution fits the data, the parameters α and β must be estimated using the Maximum Likelihood method. The formulas used for estimating these parameters are given in Equations (2) and (3):
Here, the value of A is calculated using Equation (4) with the number of observations (n) and the average rainfall :
After obtaining the gamma distribution parameters, a cumulative probability value is calculated for a specific time period. However, since real-world data may include days with zero rainfall (dry days), the cumulative probability function is revised to include these zero probabilities. The cumulative probabilities were then transformed into standardized normal variates (Z-scores) with a mean of zero and a standard deviation of one to obtain the SPI values [32]). This final value constitutes the SPI for the relevant period, and it is recommended to use at least 30 years of continuous data for a reliable SPI analysis. In this proposed system, since the SPI values lie on a unit normal distribution, the distance of the values from 0 represents the severity of extreme weather events. In this context, positive SPI values indicate higher than average rainfall amounts, representing humid periods; negative values indicate dry periods due to a lack of rainfall [21]. Since its development, the SPI has become one of the most widely used tools in drought analysis, offering the flexibility to perform analyses across different time scales (short, medium, and long-term). This feature enables the index to be used effectively in both short-term agricultural assessments and long-term water resource planning [23]. Because of these qualities, the SPI is now considered a fundamental reference in both academic studies and applied planning processes.
2.4.2. Standardized Precipitation–Evapotranspiration Index (SPEI)
SPEI was developed by Vicente-Serrano et al. [22] at the Instituto Pirenaico de Ecologia in Zaragoza, Spain. SPEI offers a more comprehensive approach that can directly assess the impact of temperature changes on drought development. While SPI relies solely on precipitation data, SPEI provides more sensitive results in climatic drought analyses because it also includes the effect of temperature through evapotranspiration [33,34]. The SPEI is based on a simple water budget approach that considers the balance between precipitation and potential evaporation; this feature allows for a more realistic representation of drought dynamics, especially under conditions where increasing temperatures accelerate evaporation processes. Therefore, SPEI is widely and effectively used in the examination of drought impacts under climate change scenarios [35]. Thanks to its ability to be calculated at different time scales, SPEI allows for the determination of short-term and long-term wet–dry periods. PET represents the maximum water loss that can occur from the surface to the atmosphere. The PET can be estimated using the Penman–Monteith method, the Thornthwaite method based solely on temperature data, or the HS method based on temperature difference and radiation [36,37]. The choice of method depends on data availability and the climatic characteristics of the study area. Although different indices are used in the literature for monitoring drought, SPI and SPEI are among the most common approaches. The sequence followed when calculating SPEI is a mathematical model of the water cycle in nature. In this study, the HS [38] method was preferred due to the limited data requirement and the fact that it can be calculated using only temperature data. The first step in calculating SPEI is to calculate the potential amount of water (PET) that the region returns to the atmosphere:
Here, Ra represents extra-atmospheric radiation; Tmax, Tmin, and Tort represent the maximum, minimum, and average temperature values, respectively. Climatic water balance refers to the difference between the water entering the system (precipitation) and the water leaving the system (evapotranspiration) over a specific period. For each month (i), the difference between the total monthly precipitation (Pi) and the potential evapotranspiration (PETi) is determined. This difference represents the water surplus or deficit (Di) for that month.
Here, (Pi) represents the total rainfall for the relevant month. Drought affects different sectors at different times (a 3-month drought affects agriculture, a 12-month drought affects groundwater). Therefore, the (Di) values are summed according to the selected time scale (k). The resulting (Di) values indicate a water surplus if they are positive and a water deficit if they are negative. The (Di) series are accumulated according to the selected time scale (k):
While the Gamma distribution is used for precipitation data (SPI), the water balance (Di) series contains negative values, making the Gamma distribution unsuitable for this data. The log-logistic distribution is preferred in SPEI calculations because it provides a better fit for extreme negative values. Therefore, as stated in the literature, a three-parameter Log-Logistic distribution is used:
In the final stage, the obtained cumulative probability values are converted to a standard normal distribution. This conversion provides a comparable index across different regions and time periods. Positive SPEI values indicate humid conditions, while negative values indicate arid conditions [22]. The availability of high-resolution global datasets such as TerraClimate provides a significant advantage in the application of SPEI and contributes to a more reliable assessment of drought risks related to climate change [39].
2.5. Analytical Workflow
Following dataset preparation and preprocessing, drought indices were computed within the R environment to ensure a reproducible and consistent analytical framework. Historical climate data covering the period 1985–2024 were used to assess past drought characteristics in Manisa Province, while future climate projections for 2025–2100 were processed to evaluate potential changes in drought patterns under climate change scenarios.
The SPI and SPEI were calculated at selected temporal scales, and the resulting time series were analyzed to identify temporal variability and long-term trends. To quantify the direction and magnitude of temporal changes, the non-parametric Mann–Kendall trend test and Sen’s slope estimator were applied to the annual SPI and SPEI time series. This workflow enabled a comprehensive comparison between historical observations and projected future drought dynamics. The overall workflow of the drought analysis conducted in this study is presented in Figure 2.
Figure 2.
Workflow of the methodological framework used for historical and future drought assessment in Manisa Province.
3. Results
3.1. Comparative Analysis Results of Meteorological Station and Satellite-Derived Climate Data
Table 2 presents the validation performance of ERA5-Land, CHIRPS v2, and TerraClimate datasets against observations from the Central station. Overall, the temperature estimates showed very high agreement with observations, with both ERA5-Land and TerraClimate achieving strong correlations (r = 0.998). However, ERA5-Land exhibited a negative temperature bias (−2.72 °C) and a higher RMSE (2.78 °C), indicating a systematic underestimation of mean temperature. TerraClimate performed slightly better, with a lower bias (−1.49 °C) and RMSE (1.76 °C), suggesting a closer representation of observed temperature variability. For precipitation, all datasets demonstrated strong temporal agreement, with correlation coefficients ranging from 0.876 to 0.898. CHIRPS v2 showed the highest correlation (r = 0.898) and the lowest error magnitude (RMSE = 29.1 mm/month), indicating its superior capability in reproducing monthly precipitation patterns. TerraClimate also performed well, with a correlation of 0.884, a small positive bias (+5.9 mm), and an RMSE of 30.8 mm/month. In contrast, ERA5-Land displayed a considerable underestimation of precipitation (Bias = −56 mm) and the highest RMSE (83.3 mm/month), although it still captured the temporal variability reasonably well (r = 0.876). The standard deviation of differences further confirms the relative consistency of CHIRPS v2 and TerraClimate precipitation products, with lower deviations (28.4 and 30.3 mm, respectively) compared with ERA5-Land (61.8 mm). Overall, the validation results indicate that TerraClimate and CHIRPS v2 provide more reliable precipitation estimates, whereas ERA5-Land and TerraClimate show excellent performance for temperature representation at the Central station. These findings support the use of CHIRPS v2 and TerraClimate for precipitation-based drought analyses, while ERA5-Land remains suitable for temperature-related assessments.
Table 2.
Validation metrics (r, Bias, RMSE, and Std. Dev.) of temperature and precipitation variables for various satellite-based and reanalysis datasets.
3.2. Multi-Scale Analysis of Drought Dynamics in Manisa Using SPI (1985–2024)
Drought analyses conducted for the Manisa province were based on a multi-scale application of the SPI to disentangle the impacts of climatic anomalies on different systems. In this framework, SPI-3 (3-month Standardized Precipitation Index) was used to represent short-term meteorological drought and early-stage soil moisture variability affecting rainfed agricultural production, SPI-6 (6-month Standardized Precipitation Index) captured seasonal to semi-annual precipitation anomalies influencing river discharge and water availability for irrigation, and SPI-12 (12-month Standardized Precipitation Index) reflected long-term hydrological conditions closely associated with groundwater levels and reservoir storage [40]. This multi-dimensional approach enables a comprehensive assessment of drought not merely as an instantaneous meteorological phenomenon, but as a process with delayed and cumulative impacts on rainfed agriculture and water resource management.
In Figure 3, the blue line denotes positive SPI values, representing wetter-than-normal conditions, whereas the red line indicates negative SPI values associated with drought conditions throughout the study period. SPI-3-time series reveals a highly variable precipitation regime characterized by rapid transitions between dry and wet conditions. Frequent drops below −1 and, in some years, below −2 indicate recurrent moderate to severe short-term drought events. These negative anomalies imply early-stage agricultural stress and high vulnerability, particularly in irrigation-dependent areas such as the Manisa Plain. Conversely, the occurrence of SPI-3 values exceeding +1.5 suggests that droughts are not persistently intensifying but rather that precipitation oscillates between extremes. This pattern indicates increasing irregularity in the temporal distribution of precipitation and a shift toward a more unstable climatic regime. Rather than a clear linear drying trend, the results highlight increasing variability and more frequent short-term drought shocks. This finding is consistent with the IPCC AR6 assessment, which emphasizes that changes in precipitation timing and intensity are becoming more critical than total amounts in the Mediterranean Basin. While droughts in the 1985–2000 period were less frequent but more prolonged, the post-2000 period is marked by increased frequency and faster transitions, supporting the hypothesis that climate change primarily amplifies variability rather than mean conditions. This hydroclimatic structure leads to fluctuations in agricultural yields, reactive increases in groundwater extraction, and heightened water stress risk. The SPI-6 time series indicates that mild and moderate droughts occur frequently, while severe droughts are concentrated in the pre-1990 period, the early 2000s, and around 2005. Extreme drought conditions (SPI ≤ −2.0) are particularly evident around 1990, the mid-1990s, and 2008. In contrast, post-2010 periods exhibit notable extreme wet phases, with SPI values exceeding +2.0. Temporal analysis suggests a clear evolution in the drought regime of Manisa. The negative trend during 1985–1995, especially the prolonged drought signal between 1989 and 1992, aligns with the widely reported 1988–1994 drought across Türkiye. The extreme drought episode of 2007–2008, reaching values as low as −2.5, indicates that drought intensity has increased more than its duration. Although wetter phases have become more frequent after 2011, they are accompanied by abrupt negative fluctuations, reinforcing the hypothesis of increased climatic variability and irregular precipitation patterns. Overall, the hydroclimatic system appears to have evolved toward greater exposure to extremes and increased fragility. The SPI-12 time series reflects long-term hydrological impacts rather than short-term meteorological variability, particularly those affecting groundwater resources and reservoir storage. The analysis reveals significant variability in hydroclimatic conditions, with the early 1990s and the 2007–2009 period standing out as severe to extreme hydrological droughts (SPI between −1.5 and −2.0). Such prolonged negative anomalies exert considerable pressure on water resources and agricultural systems. Conversely, periods such as 1998–2001 and post-2010 exhibit SPI-12 values exceeding +1.0, indicating wet phases associated with increased flood risk. The post-2000 period is characterized by shorter intervals and sharper transitions between dry and wet phases, confirming the intensification of hydroclimatic extremes. This pattern, consistent with increasing climate variability in the Mediterranean Basin, highlights the vulnerability of Manisa to long-term hydrological droughts and underscores the necessity for integrated water resource and agricultural management strategies. Key drought periods identified in the analysis include: 1989–1991: A severe and prolonged drought episode, represented by one of the deepest negative anomalies. 1993–1995: Another period of intense drought conditions. 2001 and 2007–2008: Years characterized by substantially below-normal precipitation. Post-2020 to present: Increasing frequency of negative anomalies, with a renewed declining trend toward 2024.
Figure 3.
Multi-scale SPI time series for Manisa (1985–2024).
3.3. Multi-Scale Analysis of Drought Dynamics in Manisa Using SPEI (1985–2024)
SPEI is a statistical index that defines and monitors drought by considering the difference between precipitation and PET. It is calculated by dividing the deviation of the water balance (precipitation − PET) from its long-term mean by the standard deviation for a given time scale. Unlike precipitation-based indices, SPEI incorporates the effects of temperature increases on evaporation, providing a more comprehensive representation of drought conditions. For this reason, it has become one of the most widely used indices in climate change studies, as it accounts for the impact of rising temperatures on the water balance and allows drought assessment across multiple time scales, including short-term (3-month), medium-term (6-month), and long-term (12-month) periods. This flexibility enables its effective use in both short-term agricultural drought analyses and long-term hydrological drought assessments and water resource management planning. The 3-month SPEI time series reveals high variability and an unstable hydrothermal structure in Manisa’s short-term hydro-meteorological conditions. Sharp fluctuations between −2 (extremely dry) and +2 (extremely wet) indicate that the region exhibits a climate regime oscillating between extreme conditions rather than a stable pattern. Because SPEI incorporates both precipitation anomalies and temperature-driven PET, negative deviations reflect not only precipitation deficits but also increased atmospheric water demand. Severe and extreme drought episodes are particularly evident around 1990, 2000, 2007–2008, and after 2014. Since 2000, an increase in both the amplitude and frequency of fluctuations indicates that dry phases have become more clustered and transitions from wet to dry conditions have accelerated. The short-lived and sharp declines observed after 2010 suggest that wet periods are insufficient to compensate for drought shocks. This dynamic structure supports the increasing climate variability hypothesis emphasized in IPCC literature for the Mediterranean Basin. In Manisa, the timing of precipitation and water loss associated with rising temperatures have become more decisive than total precipitation amounts. Consequently, the SPEI-3 analysis indicates an increasing risk of sudden water stress during plant growth stages and highlights the need for more proactive and flexible agricultural and water management strategies. The SPEI-6 time series reflects medium-term hydroclimatic conditions and seasonal drought–wetness cycles in Manisa. Compared to SPEI-3, it exhibits a more smoothed pattern, indicating that dry and wet periods have more persistent effects. Periods where index values fall below −1.0 and persist for consecutive months demonstrate that moderate to severe droughts are not merely temporary anomalies but develop a seasonal character. Conversely, the lack of continuity in wet phases, represented by values above +1.0, highlights the unstable nature of the hydroclimatic system and the potential pressure on water resources. The SPEI-12 time series provides the clearest representation of long-term water balance and cumulative drought risk in the region. By filtering out short-term fluctuations, this scale reflects pressures on strategic water resources such as groundwater reserves and reservoir storage. Between 1985 and 2005, drought events were generally moderate, and although short-term severe negative deviations occurred in the mid-1990s, the system showed a rapid recovery tendency. The 2007–2009 period, during which the index dropped below −1.5 (severe drought), represents one of the first major cumulative water deficit phases in the last 40 years. The most critical finding emerges for the period between 2017 and 2024, where negative anomalies form an almost continuous block. As the index approaches −2.0 (extreme drought) toward 2024, it indicates that Manisa has entered the longest and most intense cumulative drought phase in its recent history. Overall, the SPEI-12 results suggest that drought in Manisa has evolved from a temporary natural phenomenon into a chronic water stress condition driven by increasing temperatures and evaporation. The rarity of positive anomalies and the deepening of negative anomalies over the last decade pose a serious threat to long-term water security in the region. The major drought periods identified in the analysis include 1989–1991 as a distinct drought phase, 2007–2009 as a prolonged and severe drought episode, 2016–2018 as an intermittent but effective drought period, and 2020–2024 as the most critical phase, characterized by deep (approaching −2) and nearly continuous negative anomalies (Figure 4).
Figure 4.
Multi-scale SPEI time series for Manisa (1985–2024).
3.4. Spatial Distribution of Drought Based on SPI and SPEI
Figure 5 shows the spatial distribution of drought frequency for Manisa province, calculated according to the SPI-3, SPI-6, and SPI-12 time scales, respectively. Examining the maps, it can be seen that the probability of drought, according to the SPI-3 index representing short-term drought conditions, reaches higher values, especially in the western and southwestern parts of the province. In the SPI-6 index, which reflects medium-term water balance conditions, it is noteworthy that the drought frequency shows a more balanced distribution throughout the province, but a relative increase in some inland areas. Examining the SPI-12 map, which represents long-term drought trends, it is seen that the probability of drought exhibits a more homogeneous distribution in different regions of the province, but there are areas where drought is particularly pronounced in the northern and eastern parts. These findings indicate that the spatial distribution of drought events changes depending on the time scale, and that short-term meteorological droughts are more pronounced in some regions.
Figure 5.
Frequency of drought conditions (%) in Manisa based on multi-scale indices, including SPI-3, SPI-6, SPI-12 and SPEI-3, SPEI-6, and SPEI-12.
Figure 5 shows the spatial distribution of drought frequency calculated for Manisa province according to the SPEI-3, SPEI-6, and SPEI-12 time scales, respectively. Examination of the maps reveals that, according to the SPEI-3 index, which represents short-term water balance conditions, the probability of drought reaches higher values, particularly in the western and southern parts of the province. The SPEI-6 map, reflecting medium-term water balance conditions, shows a more even distribution of drought frequency across the province, but relatively high values persist in some inland and southern areas. Examining the SPEI-12 map, which represents long-term water balance and cumulative drought trends, it is observed that the probability of drought shows a more homogeneous distribution across different regions of the province, although areas where drought is more pronounced are particularly evident in the western and southwestern parts. These results demonstrate that, according to the SPEI, which also takes evapotranspiration into account, drought risk can vary spatially and temporally depending not only on lack of precipitation but also on temperature and evaporation conditions. According to the results obtained, minimum SPEI values in most of Manisa are approximately in the range of −1.9 to −2.3, indicating severe and extreme drought conditions. When the spatial pattern is examined, it is understood that lower SPEI values are concentrated especially in the western and northwestern parts of the province, and the severity of drought is more pronounced in these regions. In contrast, although drought values are relatively higher in the central parts of the province, strong negative anomalies are still observed. This situation shows that drought in Manisa exhibits a heterogeneous distribution not only temporally but also spatially (Figure 5). This spatial heterogeneity reflects not only regional climatic forcing but also the combined influence of topography and land-use characteristics. The higher elevations and extensive forest cover in eastern Manisa contribute to lower evaporative demand and greater moisture retention, whereas the low-lying Gediz Plain is characterized by intensive irrigated agriculture, increasing urbanization, and high water demand, all of which enhance long-term drought vulnerability. The more pronounced spatial differentiation observed in SPEI further suggests that rising temperatures and increasing atmospheric evaporative demand amplify drought conditions beyond precipitation deficits alone. Therefore, these findings reveal that the risk of drought is widespread throughout the province, but more concentrated in some sub-regions, indicating that water resource management and agricultural planning strategies should be developed taking spatial differences into account.
3.5. Comparative Analysis Results of CMIP6 Models with TerraClimate Data
The performance of CMIP6 global climate models (GCM) used in drought analyses for the Manisa province for the period 1985–2024 was evaluated by comparing them with TerraClimate data, which was selected as the reference data set. Within the scope of the analysis, both the SPI, based solely on precipitation, and the SPEI, which uses both precipitation and potential evapotranspiration data, were calculated. The agreement of the models with the observational data was evaluated using statistical criteria such as Root Mean Square Error (RMSE), Mean Absolute Error (MAE), Bias (the model’s tendency to systematically over- or under-estimate), and Correlation Coefficient (R—indicating the strength of the linear relationship between the model and the observation), which are error and performance measures. The performance indicators presented in Table 3 represent the statistical summary values obtained from comparing the model and reference datasets of SPI-3 time series calculated on a monthly scale throughout the period 1985–2024. Therefore, these values represent the model performance for the entire analysis period, not just a specific year. This approach demonstrates the reliability of the models for local-scale drought projections and contributes to understanding the short- and medium-term impacts of climate change.
Table 3.
Comparing Climate Models with Reference Observational Data.
The findings demonstrated that the performance of CMIP6 models in representing drought indicators varied depending on the time and spatial scale. The ranking and performance evaluation of the relevant models are shown in Figure 6 below. As a result of this model ranking, CNRM-CM6-1-HR was determined to be the most suitable model for drought projections; this choice has been adopted as a fundamental approach in subsequent projection studies to increase model reliability and reduce uncertainties.
Figure 6.
Performance ranking of climate models based on multi-scale drought indices.
3.6. Future Drought Trends According to the SPI
Drought is a type of natural disaster that can have significant impacts on ecosystems, water resources, and agricultural production. Projections based on climate data are critical for predicting future drought risks and developing water management strategies. This study examines SPI projections for the period 2025–2100 specifically for the Manisa province, revealing future drought trends and potential impacts. The analyses provide guidance for long-term planning and the development of climate adaptation strategies. SPI values indicate deviations from the norm in precipitation: Positive (+) values represent rainy periods, while negative (−) values represent dry periods. The general trend shows an increase in the severity and frequency of droughts from the middle of the century onwards. According to Figure 7, when drought trends are examined period by period, the following findings are obtained.
Figure 7.
Projected drought trends in Manisa based on SPI-3, SPI-6, and SPI-12 for the period 2025–2100.
During the 2025–2027 period, high-amplitude fluctuations in SPI values (approximately +2 to −1.5) indicate rapid transitions between wet and dry conditions, increasing the likelihood of ecological stress and agricultural risks associated with deceptive spring conditions and late frost events. In the 2025–2035 period, frequent SPI-3 values approaching +2 suggest recurrent short-term wet conditions that may reduce soil infiltration capacity due to saturation and increase the potential for urban flooding. During 2028–2029, SPI-6 and SPI-12 values falling below −1 indicate the progression of meteorological drought toward hydrological drought, characterized by declining soil moisture and reduced streamflow. The 2030–2031 period represents the most severe phase of drought, with SPI-12 approaching −2, implying substantial pressure on basin-scale water resources and groundwater reserves. Although temporary increases in short-term moisture conditions are projected during 2032–2033, these improvements are insufficient to offset the cumulative structural water deficit. Between 2033 and 2040, persistent SPI values ranging from −1 to −2 indicate sustained drought conditions, accompanied by increasing irrigation demand and a transition toward a low-precipitation, high-evaporation climate regime by 2034–2035. During 2040–2050, particularly after 2045, persistently negative SPI-12 values suggest that drought evolves beyond a temporary meteorological phenomenon into long-term structural water scarcity, with increasing impacts on reservoirs, including the Demirköprü Dam, and groundwater resources. In the 2070–2080 period, pronounced declines in SPI-12 indicate severe hydrological drought with potentially substantial impacts on water storage infrastructure and aquifer recharge. By 2090 and beyond, the persistence and prolonged duration of negative SPI conditions suggest that chronic drought may become a dominant feature of regional climate conditions by the end of the century.
3.7. Future Drought Trends According to the SPEI
Projected SPEI analyses (2025–2100) for Manisa province indicate an increasing frequency of climate-induced droughts. By integrating both precipitation and temperature-driven evapotranspiration, SPEI accurately reflects soil moisture deficits critical to this agricultural region. The evaluated indices effectively monitor the area’s water balance across short-term/agricultural (SPEI-3), medium-term (SPEI-6), and long-term/hydrological (SPEI-12) scales.
According to Figure 8, the projected drought evolution exhibits distinct temporal phases throughout the study period. During 2025–2035, the basin initially experiences a relatively balanced water budget, with SPEI values generally ranging between +1 and +2. However, drought conditions intensify rapidly, particularly in the Manisa region, indicating the onset of structurally persistent drought. Between 2025 and 2027, increasing instability in the precipitation regime elevates atmospheric water demand, while declines in the SPEI-3 index to approximately −1.8 following short-lived wet conditions suggest an increased risk of sudden drought events. During 2028–2030, persistently negative SPEI-6 and SPEI-12 values indicate the cumulative development of water deficits and the gradual transition from meteorological to hydrological drought. The 2031–2035 period represents the most critical phase, with SPEI values approaching the extreme drought threshold of −2.0. Although a modest recovery is projected thereafter, the limited magnitude of improvement suggests that drought evolves into a long-term water deficit regime rather than remaining an episodic climatic event. During 2035–2045, rising temperatures substantially enhance evaporative demand, resulting in increased drought stress on vegetation even under near-normal precipitation conditions. Frequent negative anomalies in the SPEI-3 and SPEI-6 indices indicate a considerable increase in agricultural irrigation requirements across the Gediz Basin. In 2045–2055, SPEI values fluctuate around zero, representing a temporary stabilization phase that may permit limited short-term replenishment of water resources. However, this recovery is not sustained. During 2060–2075, SPEI-12 values remain consistently below −1, marking the onset of a severe hydrological drought in which evapotranspiration losses increasingly exceed precipitation inputs. Finally, throughout 2080–2100, persistently negative SPEI values approaching the extreme drought threshold (−2) indicate the establishment of chronic drought conditions. Under these circumstances, insufficient groundwater recharge and prolonged water deficits suggest that drought becomes a persistent component of the regional hydroclimatic regime rather than a temporary seasonal anomaly.
Figure 8.
Projected drought trends in Manisa based on SPEI-3, SPEI-6, and SPEI-12 for the period 2025–2100.
3.8. Long-Term Trends in Meteorological and Climatic Drought (SPI-12 and SPEI-12)
Long-term drought trends were assessed using the non-parametric Mann–Kendall trend test and Sen’s slope estimator applied to the annual SPI-12 and SPEI-12 series for the 1985–2100 period. Throughout the historical period (1985–2014), both indices fluctuated around near-normal conditions, although several wet and dry episodes were observed. In contrast, the projection period is characterized by a gradual shift toward increasingly negative values. After approximately the mid-century, drought events become more frequent and persistent, while positive (wet) anomalies occur less often. By the end of the century, both indices predominantly remain below zero, with several years approaching values below −2, indicating severe to extreme long-term drought conditions. The Mann–Kendall test revealed a significant decreasing trend for both indices (SPI-12: τ = −0.166, p = 0.0083; SPEI-12: τ = −0.311, p < 0.001). Likewise, Sen’s slope estimator confirmed a continuous decline in annual drought conditions, with a slope of −0.0066 year−1 for SPI-12 and −0.0131 year−1 for SPEI-12. The steeper negative slope obtained for SPEI-12 indicates that drought severity increases more rapidly when the influence of increasing atmospheric evaporative demand is incorporated. Figure 9 presents the long-term evolution of annual SPI-12 and SPEI-12 values for Manisa Province during the 1985–2100 period under the SSP5-8.5 climate scenario. Both drought indices exhibit statistically significant negative trends, indicating a progressive intensification of long-term drought conditions throughout the study period. This result suggests that evapotranspiration-driven water deficits will become an increasingly important component of future drought risk in Manisa under high greenhouse gas emission scenarios.
Figure 9.
Long-term trends of annual SPI-12 and SPEI-12 for Manisa Province during 1985–2100.
4. Discussion
This study evaluates drought dynamics in Manisa province for the period 1985–2100 using a multi-scale approach with SPI and SPEI indices. It reveals that drought is a delayed, cumulative, and progressively intensifying hydroclimatic process rather than a short-term anomaly. The increase in drought frequency and intensity, particularly in the post-2000 period, is consistent with climate change trends reported in the Mediterranean Basin [3,15,41]. Again, it is seen that the future drought situation under changing climatic conditions in different basins with Mediterranean climate characteristics is also compatible with the climate change trend revealed in some of the studies in which it was evaluated. They predicted a significant increase in the frequency of droughts towards the end of the century [42,43,44]. Temperature increases triggered by global climate change and irregularities in the precipitation regime directly increase the frequency, duration and severity of meteorological drought events. This dynamic process makes it necessary to monitor climate factors on drought with reliable indices in order to manage the risk in future climate scenarios.
SPI analyses show that drought exhibits different characteristics depending on the time scale. Short-term SPI-3 results indicate high volatility in precipitation regimes and frequently recurring meteorological droughts that increase vulnerability to agricultural systems [16,45]. In contrast, SPI-6 and especially SPI-12 values reveal the delayed and cumulative effects of drought. SPEI results, on the other hand, show that the severity of drought is not solely due to lack of precipitation, but is deepened by increasing temperatures and the effect of evapotranspiration. The more negative anomalies observed in SPEI series, especially in the post-2000 period, support the phenomenon of “thermal drought” as defined in the literature [2,22,34,46,47]. The fact that SPI indicates normal conditions in some periods while SPEI produces negative values reveals a “hidden drought” situation caused by temperature effects in Manisa and is consistent with similar findings [8,33,35]. Although SPI and SPEI exhibited similar temporal behaviour during the early projection period (2025–2035), a pronounced divergence emerged after the mid-century. This divergence reflects the increasing influence of temperature-driven evapotranspiration rather than changes in precipitation alone. Because SPI is based solely on precipitation, it tends to underestimate drought severity under warming conditions, whereas SPEI incorporates atmospheric evaporative demand and therefore captures the combined effects of declining precipitation and rising temperatures. These findings suggest that future droughts in Manisa will increasingly be governed by temperature-driven evapotranspiration rather than precipitation deficits alone, highlighting the growing importance of atmospheric evaporative demand under climate change. The combined interpretation of SPI and SPEI further demonstrates that drought evolves as a cascading process, whereby short-term meteorological drought progressively develops into agricultural and hydrological drought as water deficits accumulate over time. This temporal lag suggests that ecosystems may become increasingly vulnerable as drought conditions persist over time. Consequently, short-term drought indices are particularly valuable for early warning, whereas longer-term indices provide more meaningful information for strategic water resources management and adaptation planning [37,48].
Spatial analyses further demonstrate that drought sensitivity is strongly controlled by land-use characteristics and water demand rather than climate alone. Agricultural areas within the Gediz Basin and groundwater-dependent irrigated plains exhibit greater persistence of drought conditions than forested uplands, indicating that intensive irrigation practices and groundwater dependence amplify climatic drought signals. These findings suggest that agricultural vulnerability in Manisa is jointly determined by climatic change and human water use, placing increasing pressure on the long-term sustainability of regional water resources. Future projections reveal a clear transition in drought dynamics throughout the twenty-first century. During the early projection period (2025–2035), the similar behaviour of SPI and SPEI indicates that increased precipitation temporarily offsets enhanced evapotranspiration, resulting in a relatively balanced climatic water budget. However, this agreement gradually disappears after the mid-century as rising temperatures increasingly dominate regional water availability. While SPI continues to exhibit considerable interannual variability because it reflects only precipitation anomalies, SPEI shows a persistent negative trend driven by increasing atmospheric evaporative demand. This divergence demonstrates that precipitation-based drought assessments alone may underestimate future drought severity under warming conditions. The persistence of negative SPEI values towards the end of the century suggests that the projected “new normal” represents not merely more frequent drought events but a structural shift in regional water availability. Future drought severity in Manisa will be driven not only by changes in precipitation but also by enhanced evaporative losses. This finding is particularly relevant for Mediterranean environments such as Manisa, where increasing air temperatures and prolonged dry summers are expected to intensify soil moisture depletion and reduce water availability. Even in periods when precipitation does not decline substantially, increased evaporative demand may exacerbate hydrological and agricultural drought conditions. These findings emphasize the importance of incorporating evapotranspiration into drought assessments under future climate scenarios. Integrating temperature-sensitive drought indicators such as SPEI into regional water resource planning and climate adaptation policies would therefore provide a more comprehensive assessment of future drought vulnerability. Under such conditions, conventional reservoir operation, irrigation scheduling, and groundwater abstraction strategies based on historical climate conditions are likely to become progressively less effective. These findings highlight the need to integrate climate projections into basin-scale planning and adaptive water management strategies to enhance regional resilience to future drought conditions.
While previous studies have investigated historical drought variability and, in some cases, future drought projections in western Türkiye [42], this study combines multi-timescale SPI and SPEI analyses with CMIP6-based climate projections to assess the future evolution of meteorological, agricultural, and hydrological drought within a single analytical framework. The results demonstrate that future drought severity in Manisa cannot be explained solely by declining precipitation but is increasingly driven by rising temperatures and enhanced atmospheric evaporative demand. Consequently, incorporating temperature-sensitive indices such as SPEI alongside precipitation-based indices provides a more comprehensive framework for drought monitoring, climate adaptation planning, and sustainable water resource management.
Limitations and Future Directions
Despite its comprehensive multi-source and multi-scale framework, this study has several limitations that should be acknowledged. First, although TerraClimate, ERA5-Land, and CHIRPS datasets were rigorously validated against station observations, uncertainties remain particularly for precipitation, where correlation values ranged between 0.566 and 0.898 and bias errors were relatively high. These discrepancies highlight the influence of local topography and microclimatic variability, which cannot be fully captured by gridded datasets. Second, the use of a single best-performing CMIP6 model (CNRM-CM6-1-HR) for future projections, while improving consistency, may limit the representation of model uncertainty. Multi-model ensemble approaches could provide a broader range of possible future drought scenarios. Third, the SPEI calculations rely on the HS method for estimating PET, which, although practical under limited data conditions, may introduce simplifications compared to physically based methods such as Penman–Monteith. Another limitation is the spatial scale of analysis. While the provincial-scale approach enables policy relevance, it may mask finer-scale drought heterogeneity, particularly in complex terrains. Additionally, anthropogenic factors such as irrigation practices, groundwater extraction, and land-use change were not explicitly incorporated, despite their critical role in shaping drought impacts. Future research should focus on integrating high-resolution remote sensing datasets (e.g., Sentinel and SMAP) and physically based hydrological models to improve spatial accuracy. The application of multi-model ensembles and advanced bias correction techniques will enhance projection reliability. In additionally, investigate the driving mechanisms of the observed spatial differentiation of drought by integrating topographic characteristics, irrigation intensity, land-use change, urban expansion, and other anthropogenic factors with climatic variables. Such integrated analyses would provide a more comprehensive understanding of regional drought dynamics and their underlying controls. Finally, incorporating socio-economic vulnerability indicators and water management practices will support the development of holistic, climate-resilient adaptation strategies for Mediterranean agricultural systems.
5. Conclusions
The findings of this study present a coherent picture regarding the future hydroclimatic dynamics of Manisa province and confirm that the calculated drought indices function as useful indicators linking meteorological anomalies to changes in the region’s physical water systems and agricultural production. Within the limits of the datasets and modelling assumptions used, the following conclusions can be drawn.
In the near future (2025–2035), the hydroclimatic regime of the region is projected to shift toward a more variable structure, in which short-term extreme precipitation events and sudden drought episodes are expected to occur in succession. This higher-frequency fluctuation period, indicated by short- and medium-term indicators (SPI-3 and SPI-6) that serve as early warnings, tends to trigger soil moisture deficits and foster an accelerated transition from meteorological to agricultural drought. Under these conditions, the rain-fed agricultural production chain becomes less predictable, and water stress is likely to intensify during sensitive phenological periods, with corresponding negative consequences for crop yield.
From the medium term onwards (particularly the 2028–2031 period), drought conditions appear to extend beyond a purely agricultural risk and are projected to develop into a hydrological drought signal, as reflected in the long-term SPI-12 indicators. At this stage, considerable declines in river discharge, which constitutes a central component of the basin’s water balance, are anticipated due to altered surface runoff regimes. Such reductions in flow values are expected to restrict the recharge capacity of surface water systems and to produce sustained contractions in reservoir storage levels at dams and ponds. Short-term precipitation recoveries that may emerge during this period (SPI-3 anomalies) should therefore be interpreted with caution, as the hydrological system is unlikely to return to its previous humid conditions and reservoir deficits are expected to persist over time.
The SPEI analyses demonstrate that the growing deficit in the water budget cannot be explained solely by the precipitation deficiency described by the SPI. Increasing evapotranspiration losses associated with rising temperatures, together with decreasing river discharges, are likely to heighten pressure on groundwater resources as urban and agricultural water demands are met through compensatory pumping. As surface soils dry out and infiltration capacity declines, the natural recharge mechanisms of the system are expected to weaken considerably, leading to drawdowns that may challenge the long-term renewability of the aquifers.
Projections for the last quarter of the century suggest that long-term drought (SPI-12 and SPEI-12) will transition from a temporary anomaly toward a more persistent climate feature of the region. Consequently, the projected trajectory for Manisa represents a multidimensional risk shaped by agricultural extremes with implications for crop yield in the short term, alongside simultaneous but gradual challenges to river discharge, reservoir storage, and groundwater recharge cycles in the long term. Addressing this hydrological stress requires not only continued statistical index monitoring but also the timely implementation of multi-scale and integrated adaptation strategies focused on the affected water and agricultural systems.
The findings indicate that drought in Manisa has evolved beyond a purely precipitation-driven meteorological phenomenon into a multidimensional hazard affecting agricultural, hydrological, and socio-economic systems under increasing temperature and evapotranspiration pressures. These results underscore the need to shift from reactive drought response toward a proactive, risk-based management framework. Establishing integrated drought early warning systems that combine SPI and SPEI with remote sensing indicators and hydrological observations should be regarded as a priority. Moreover, sustainable water resources management at the basin scale, including rainwater harvesting, wastewater reuse, and nature-based solutions that enhance water retention within the landscape, will be essential for strengthening regional resilience. Adaptation measures in the agricultural sector, such as promoting drought-tolerant crops, improving irrigation efficiency, and adopting smart irrigation technologies, should be complemented by water-sensitive urban planning practices, including permeable surfaces and green infrastructure. Strengthening institutional coordination, integrating drought risk into spatial planning, and supporting adaptation through appropriate financial mechanisms will be critical for improving Manisa’s capacity to address future hydroclimatic challenges under a changing climate.
Author Contributions
S.A. and M.A.Ç.: Study concept and design, data collection. M.A.Ç., K.Ş. and S.A.: Analyses, interpretation of results, manuscript preparation, and critical revision. Y.P., Ç.H. and M.A.Ç.: Reviewed and approved the final version of the manuscript. All authors have read and agreed to the published version of the manuscript.
Funding
This research received no external funding.
Institutional Review Board Statement
Not applicable.
Informed Consent Statement
Not applicable.
Data Availability Statement
The datasets are available from the corresponding author upon reasonable request.
Acknowledgments
The authors acknowledge the use of the Google Earth Engine platform for providing part of the database used in this study. Climate projection data were obtained from the Coupled Model Intercomparison Project Phase 6 (CMIP6) archive in NetCDF format, while historical climate variables were derived from the TerraClimate dataset. Digital Elevation Model (DEM) data with 30 m spatial resolution were obtained from the Shuttle Radar Topography Mission dataset distributed through the USGS EarthExplorer platform. Data processing and analysis were conducted using the RStudio (version 4.6.1) environment. The authors also thank Manisa Metropolitan Municipality for providing institutional support and relevant data.
Conflicts of Interest
The authors declare no conflicts of interest.
Correction Statement
This article has been republished with a minor correction to the reference 33. This change does not affect the scientific content of the article.
References
- IPCC. Climate Change 2022: Impacts, Adaptation and Vulnerability. In Contribution of Working Group II to the Sixth Assessment Report of the Intergovernmental Panel on Climate Change; Pörtner, H.-O., Roberts, D.C., Tignor, M., Poloczanska, E.S., Mintenbeck, K., Alegría, A., Craig, M., Langsdorf, S., Löschke, S., Möller, V., et al., Eds.; Cambridge University Press: Cambridge, UK, 2022. [Google Scholar] [CrossRef] [Scilit]
- Liu, W.; Sun, F.; Lim, W.H.; Zhang, J.; Wang, H.; Shiogama, H.; Zhang, Y. Global drought under warming scenarios. Earth Syst. Dyn. 2018, 9, 267–283. [Google Scholar]
- Kogan, F.; Guo, W.; Yang, W. Drought trends and food security. Geomat. Nat. Hazards Risk 2020, 11, 469–490. [Google Scholar] [CrossRef] [Scilit]
- Eslamian, S.; Ostad-Ali-Askari, K.; Singh, V.P.; Dalezios, N.R.; Ghane, M.; Yihdego, Y.; Matouq, M. A review of drought indices. Int. J. Constr. Res. Civ. Eng. 2017, 3, 48–66. [Google Scholar] [CrossRef] [Scilit]
- Çelik, M.A.; Kıraç, A.; Gouveia, C.M. North Atlantic Oscillation modulation of drought and vegetation activity in Türkiye. Theor. Appl. Climatol. 2026, 157, 74. [Google Scholar] [CrossRef] [Scilit]
- Arslan, O.; Bilgil, A.; Veske, O. Meteorological drought analysis of the Kızılırmak Basin using the standardized precipitation index method. Niğde Ömer Halisdemir Univ. J. Eng. Sci. 2016, 5, 188–194. [Google Scholar] [CrossRef] [Scilit]
- Wilhite, D.A. Drought as a natural hazard. In Drought: A Global Assessment; Wilhite, D.A., Ed.; Routledge: London, UK, 2000; pp. 3–18. [Google Scholar] [CrossRef] [Scilit]
- Adnan, S.; Ullah, K.; Shuanglin, L.; Gao, S.; Khan, A.H.; Mahmood, R. Comparison of various drought indices to monitor drought status in Pakistan. Clim. Dyn. 2018, 51, 1885–1899. [Google Scholar] [CrossRef] [Scilit]
- Espinosa-Tasón, J.; Berbel, J.; Gutiérrez-Martín, C.; Musolino, D.A. Socioeconomic impact of 2005–2008 drought in Andalusian agriculture. Sci. Total Environ. 2022, 826, 154148. [Google Scholar] [CrossRef] [Scilit] [PubMed]
- Yang, X.; Liao, X.; Di, D.; Shi, W. A Review of Drought Disturbance on Socioeconomic Development. Water 2023, 15, 3912. [Google Scholar] [CrossRef] [Scilit]
- Mukherjee, S.; Mishra, A.; Trenberth, K.E. Climate Change and Drought: A Perspective on Drought Indices. Curr. Clim. Change Rep. 2018, 4, 145–163. [Google Scholar] [CrossRef] [Scilit]
- Öztürk, K. Küresel iklim değişikliği ve Türkiye’ye olası etkileri. Gazi Üniv. Gazi Eğitim Fak. Derg. 2002, 22, 47–65. [Google Scholar]
- Çelik, M.A.; Bilik, A.; Türkeş, M. Spatio-Temporal Analysis of Observed Drought Events in the Tigris–Euphrates Basin During the 1960–2023 Period Via SPI and SPEI Drought Indices. Pure Appl. Geophys. 2025, 183, 655–692. [Google Scholar] [CrossRef] [Scilit]
- Şen, Z. İklim değişikliği ve Türkiye. Çevre Şehir İklim Derg. 2022, 1, 1–19. [Google Scholar]
- Hoerling, M.; Eischeid, J.; Perlwitz, J.; Quan, X.; Zhang, T.; Pegion, P. On the Increased Frequency of Mediterranean Drought. J. Clim. 2012, 25, 2146–2161. [Google Scholar] [CrossRef] [Scilit]
- Türkeş, M. Biyocoğrafya: Paleocoğrafya ve Ekoloji Yaklaşımı; Kriter Yayınevi: İstanbul, Türkiye, 2025. [Google Scholar]
- Şekerci, K.; Tuna, M.C.; Doğan, M.Ş. Effects of reducing long-term groundwater overdraft in uluova micro-basin. Appl. Water Sci. 2025, 15, 218. [Google Scholar] [CrossRef] [Scilit]
- Şekerci, K.; Tuna, M.C.; Doğan, M.Ş. Integrated water operations under climate change: Uluova Micro Basin example. J. Water Clim. Change 2024, 15, 3689–3701. [Google Scholar] [CrossRef] [Scilit]
- Gülçin, D.; Deniz, B. Remote sensing and GIS-based forest fire risk zone mapping: The case of Manisa, Turkey. Turk. J. For. 2020, 21, 15–24. [Google Scholar] [CrossRef] [Scilit]
- Türkeş, M. Akhisar ve Manisa Yörelerinin Yağış ve Kuraklık İndisi Dizilerindeki Değişimlerin Hidroklimatolojik ve Zaman Dizisi Çözümlemesi ve Sonuçların Çölleşme Açısından Coğrafi Bireşimi. Coğrafi Bilim. Derg. 2011, 9, 79–99. [Google Scholar] [CrossRef] [Scilit]
- McKee, T.B.; Doesken, N.J.; Kleist, J. The relationship of drought frequency and duration to time scales. In Proceedings of the 8th Conference on Applied Climatology, Anaheim, CA, USA, 17–22 January 1993; pp. 179–184. [Google Scholar]
- Vicente-Serrano, S.M.; Beguería, S.; López-Moreno, J.I. The SPEI drought index. J. Clim. 2010, 23, 1696–1718. [Google Scholar] [CrossRef] [Scilit]
- Mishra, A.K.; Singh, V.P. Drought modeling: A review. J. Hydrol. 2011, 403, 157–175. [Google Scholar] [CrossRef] [Scilit]
- Svoboda, M.; Hayes, M.; Wood, D.A. Standardized Precipitation Index User Guide (WMO-No. 1090); World Meteorological Organization: Geneva, Switzerland, 2012. [Google Scholar]
- Tunalıoğlu, R.; Durdu, Ö.F. Assessment of future olive crop yield by a comparative evaluation of drought indices: A case study in western Turkey. Theor. Appl. Climatol. 2011, 108, 397–410. [Google Scholar] [CrossRef] [Scilit]
- Güner Bacanli, Ü. Trend analysis of precipitation and drought in the Aegean region, Turkey. Meteorol. Appl. 2017, 24, 239–249. [Google Scholar] [CrossRef] [Scilit]
- Petrie, R.; Denvil, S.; Ames, S.; Levavasseur, G.; Fiore, S.; Allen, C.; Antonio, F.; Berger, K.; Bretonnière, P.-A.; Cinquini, L.; et al. Coordinating an operational data distribution network for CMIP6 data. Geosci. Model Dev. 2021, 14, 629–644. [Google Scholar] [CrossRef] [Scilit]
- O’Neill, B.C.; Tebaldi, C.; van Vuuren, D.P.; Eyring, V.; Friedlingstein, P.; Hurtt, G.; Knutti, R.; Kriegler, E.; Lamarque, J.-F.; Lowe, J.; et al. The Scenario Model Intercomparison Project (ScenarioMIP) for CMIP6. Geosci. Model Dev. 2016, 9, 3461–3482. [Google Scholar] [CrossRef] [Scilit]
- Meinshausen, M.; Nicholls, Z.R.J.; Lewis, J.; Gidden, M.J.; Vogel, E.; Freund, M.; Beyerle, U.; Gessner, C.; Nauels, A.; Bauer, N.; et al. The shared socio-economic pathway (SSP) greenhouse gas concentrations and their extensions to 2500. Geosci. Model Dev. 2020, 13, 3571–3605. [Google Scholar] [CrossRef] [Scilit]
- Gudmundsson, L.; Bremnes, J.B.; Haugen, J.E.; Engen-Skaugen, T. Technical Note: Downscaling RCM precipitation to the station scale using statistical transformations—A comparison of methods. Hydrol. Earth Syst. Sci. 2012, 16, 3383–3390. [Google Scholar] [CrossRef] [Scilit]
- Wu, H.; Hayes, M.J.; Wilhite, D.A.; Svoboda, M.D. SPI calculation sensitivity. Int. J. Climatol. 2005, 25, 505–520. [Google Scholar] [CrossRef] [Scilit]
- Guttman, N.B. Accepting the Standardized Precipitation Index: A Calculation Algorithm. JAWRA J. Am. Water Resour. Assoc. 1999, 35, 311–322. [Google Scholar] [CrossRef] [Scilit]
- Terzi, T.B.; Önöz, B. Drought analysis based on nonparametric multivariate standardized drought index in the Seyhan River Basin. Nat. Hazards 2025, 121, 11051–11078. [Google Scholar] [CrossRef] [Scilit]
- Mwinjuma, M.; Wang, R.; Mtupili, M.; Twaha, M. SPI and SPEI comparison across climates. Atmos. Res. 2025, 329, 104875. [Google Scholar] [CrossRef] [Scilit]
- Bayissa, Y.; Maskey, S.; Tadesse, T.; Van Andel, S.J.; Moges, S.; Van Griensven, A.; Solomatine, D. Comparison of drought indices in the upper Blue Nile Basin. Geosciences 2018, 8, 81. [Google Scholar] [CrossRef] [Scilit]
- Thornthwaite, C.W. An Approach toward a Rational Classification of Climate. Geogr. Rev. 1948, 38, 55–94. [Google Scholar] [CrossRef] [Scilit] [PubMed]
- Hao, Z.; Singh, V.P.; Xia, Y. Seasonal drought prediction: Advances and challenges. Rev. Geophys. 2018, 56, 108–141. [Google Scholar] [CrossRef] [Scilit]
- Hargreaves, G.H.; Samani, Z.A. Reference evapotranspiration from temperature. Appl. Eng. Agric. 1985, 1, 96–99. [Google Scholar] [CrossRef] [Scilit]
- Abatzoglou, J.T.; Dobrowski, S.Z.; Parks, S.A.; Hegewisch, K.C. TerraClimate, a high-resolution global dataset of monthly climate and climatic water balance from 1958–2015. Sci. Data 2018, 5, 170191. [Google Scholar] [CrossRef] [Scilit] [PubMed]
- Mlenga, D.H.; Jordaan, A.J.; Mandebvu, B. Integrating Standard Precipitation Index and Normalised Difference Vegetation Index for near-real-time drought monitoring in Eswatini. Jàmbá J. Disaster Risk Stud. 2019, 11, a917. [Google Scholar] [CrossRef] [Scilit] [PubMed]
- Türkeş, M. İklim değişikliği: Kavramlar ve etkileri. İklim Değişikliği Çevre 2008, 1, 26–37. [Google Scholar]
- Rotbeei, F.; Nuri Balov, M.; Safari, M.J.S.; Vaheddoost, B. Projected Drought Intensification in the Büyük Menderes Basin Under CMIP6 Climate Scenarios. Climate 2025, 13, 47. [Google Scholar] [CrossRef] [Scilit]
- Deniz, A.; Toros, H.; Incecik, S. Spatial variations of climate indices in Turkey. Int. J. Climatol. 2011, 31, 394–403. [Google Scholar] [CrossRef] [Scilit]
- IPCC. Guidance notes for lead authors of the IPCC fourth assessment report on addressing uncertainties. Appendix in Manning 2006. Adv. Clim. Change Res. 2006, 2, 13–21. [Google Scholar]
- Caloiero, T.; Veltri, S.; Caloiero, P.; Frustaci, F. Drought analysis in Europe and the Mediterranean Basin using SPI. Water 2018, 10, 1043. [Google Scholar] [CrossRef] [Scilit]
- Wilhite, D.A.; Glantz, M.H. Understanding drought definitions. Water Int. 1985, 10, 111–120. [Google Scholar] [CrossRef] [Scilit]
- Guha-Sapir, D.; Vos, F.; Below, R.; Ponserre, S. Annual Disaster Statistical Review 2011: The Numbers and Trends; CRED: Brussels, Belgium, 2012. [Google Scholar]
- Svoboda, M.; LeComte, D.; Hayes, M.; Heim, R.; Gleason, K.; Angel, J.; Rippey, B.; Tinker, R.; Palecki, M.; Stooksbury, D.; et al. The drought monitor. Bull. Am. Meteorol. Soc. 2002, 83, 1181–1190. [Google Scholar] [CrossRef] [Scilit]
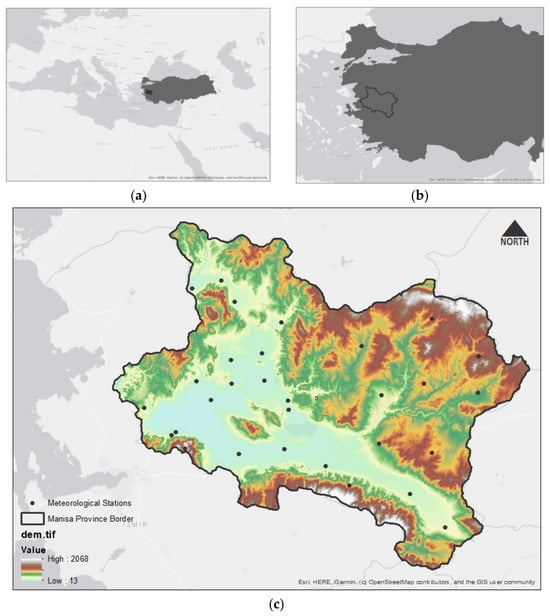
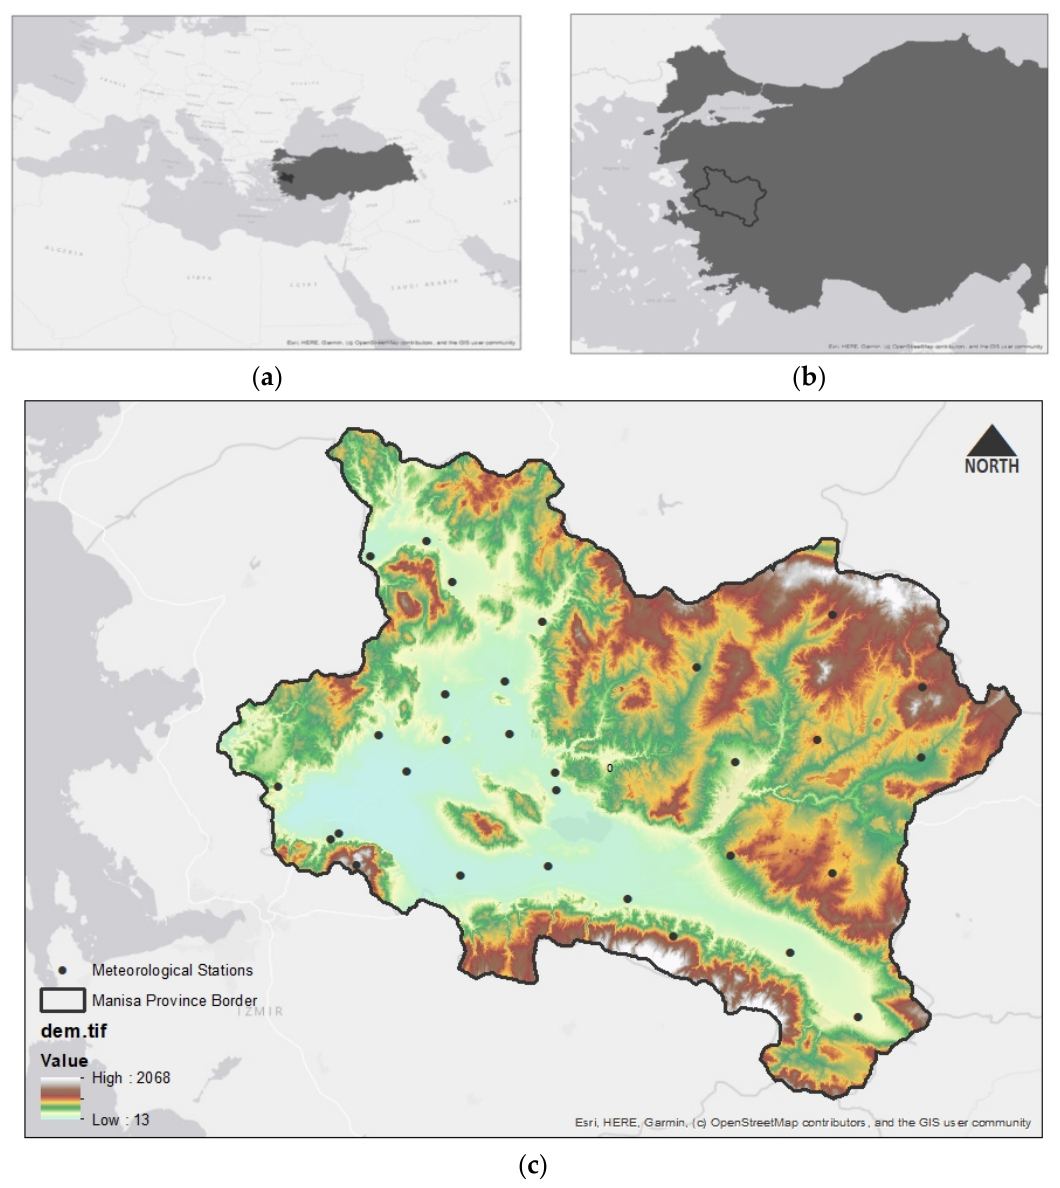
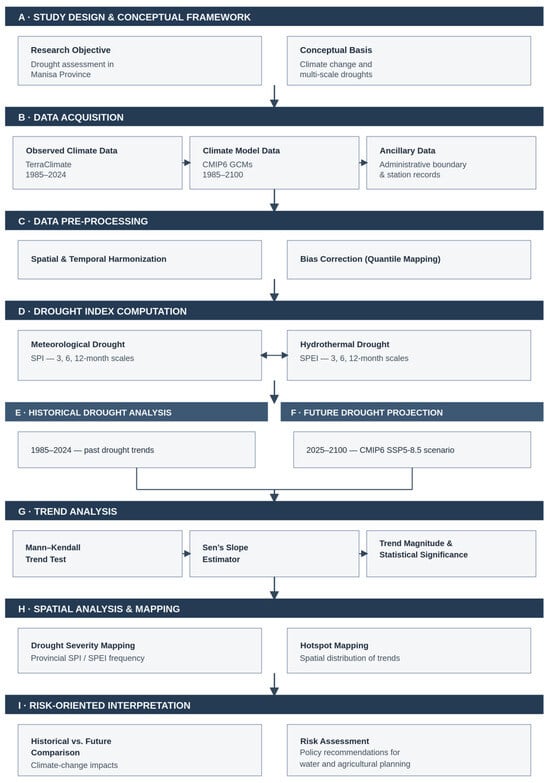
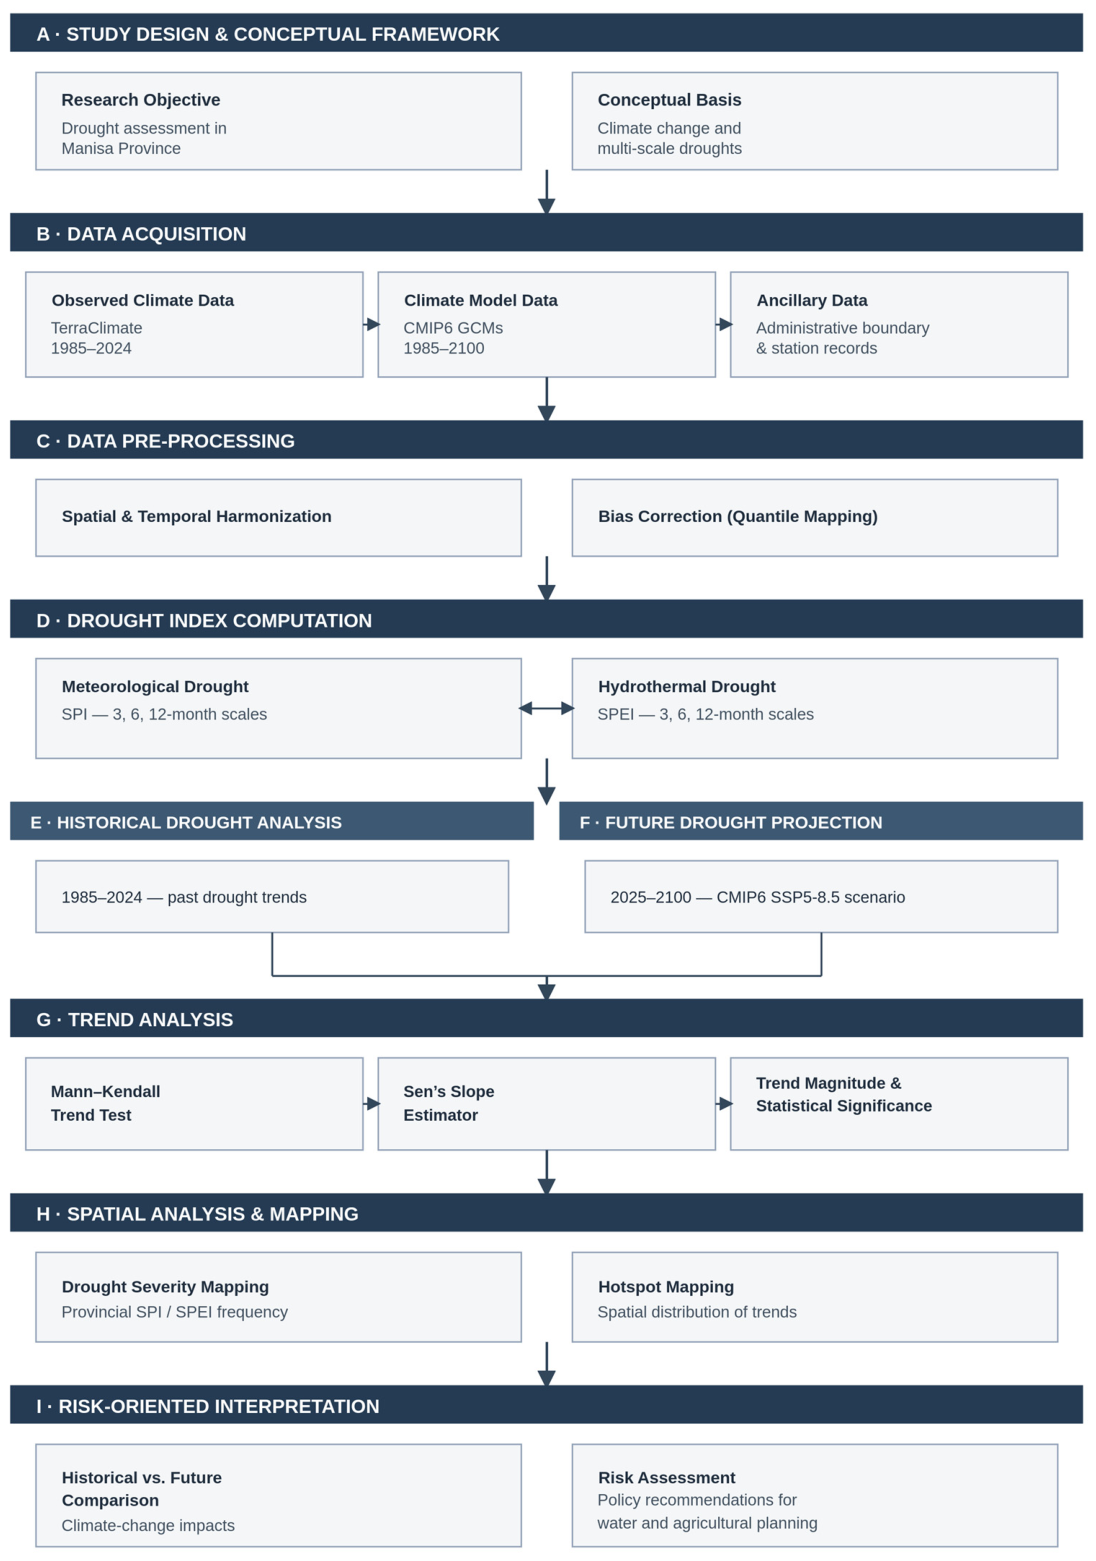
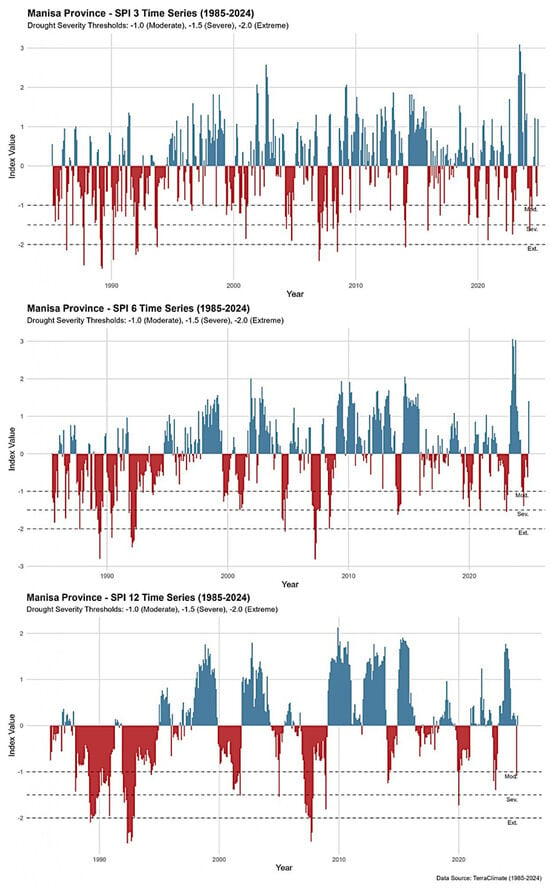
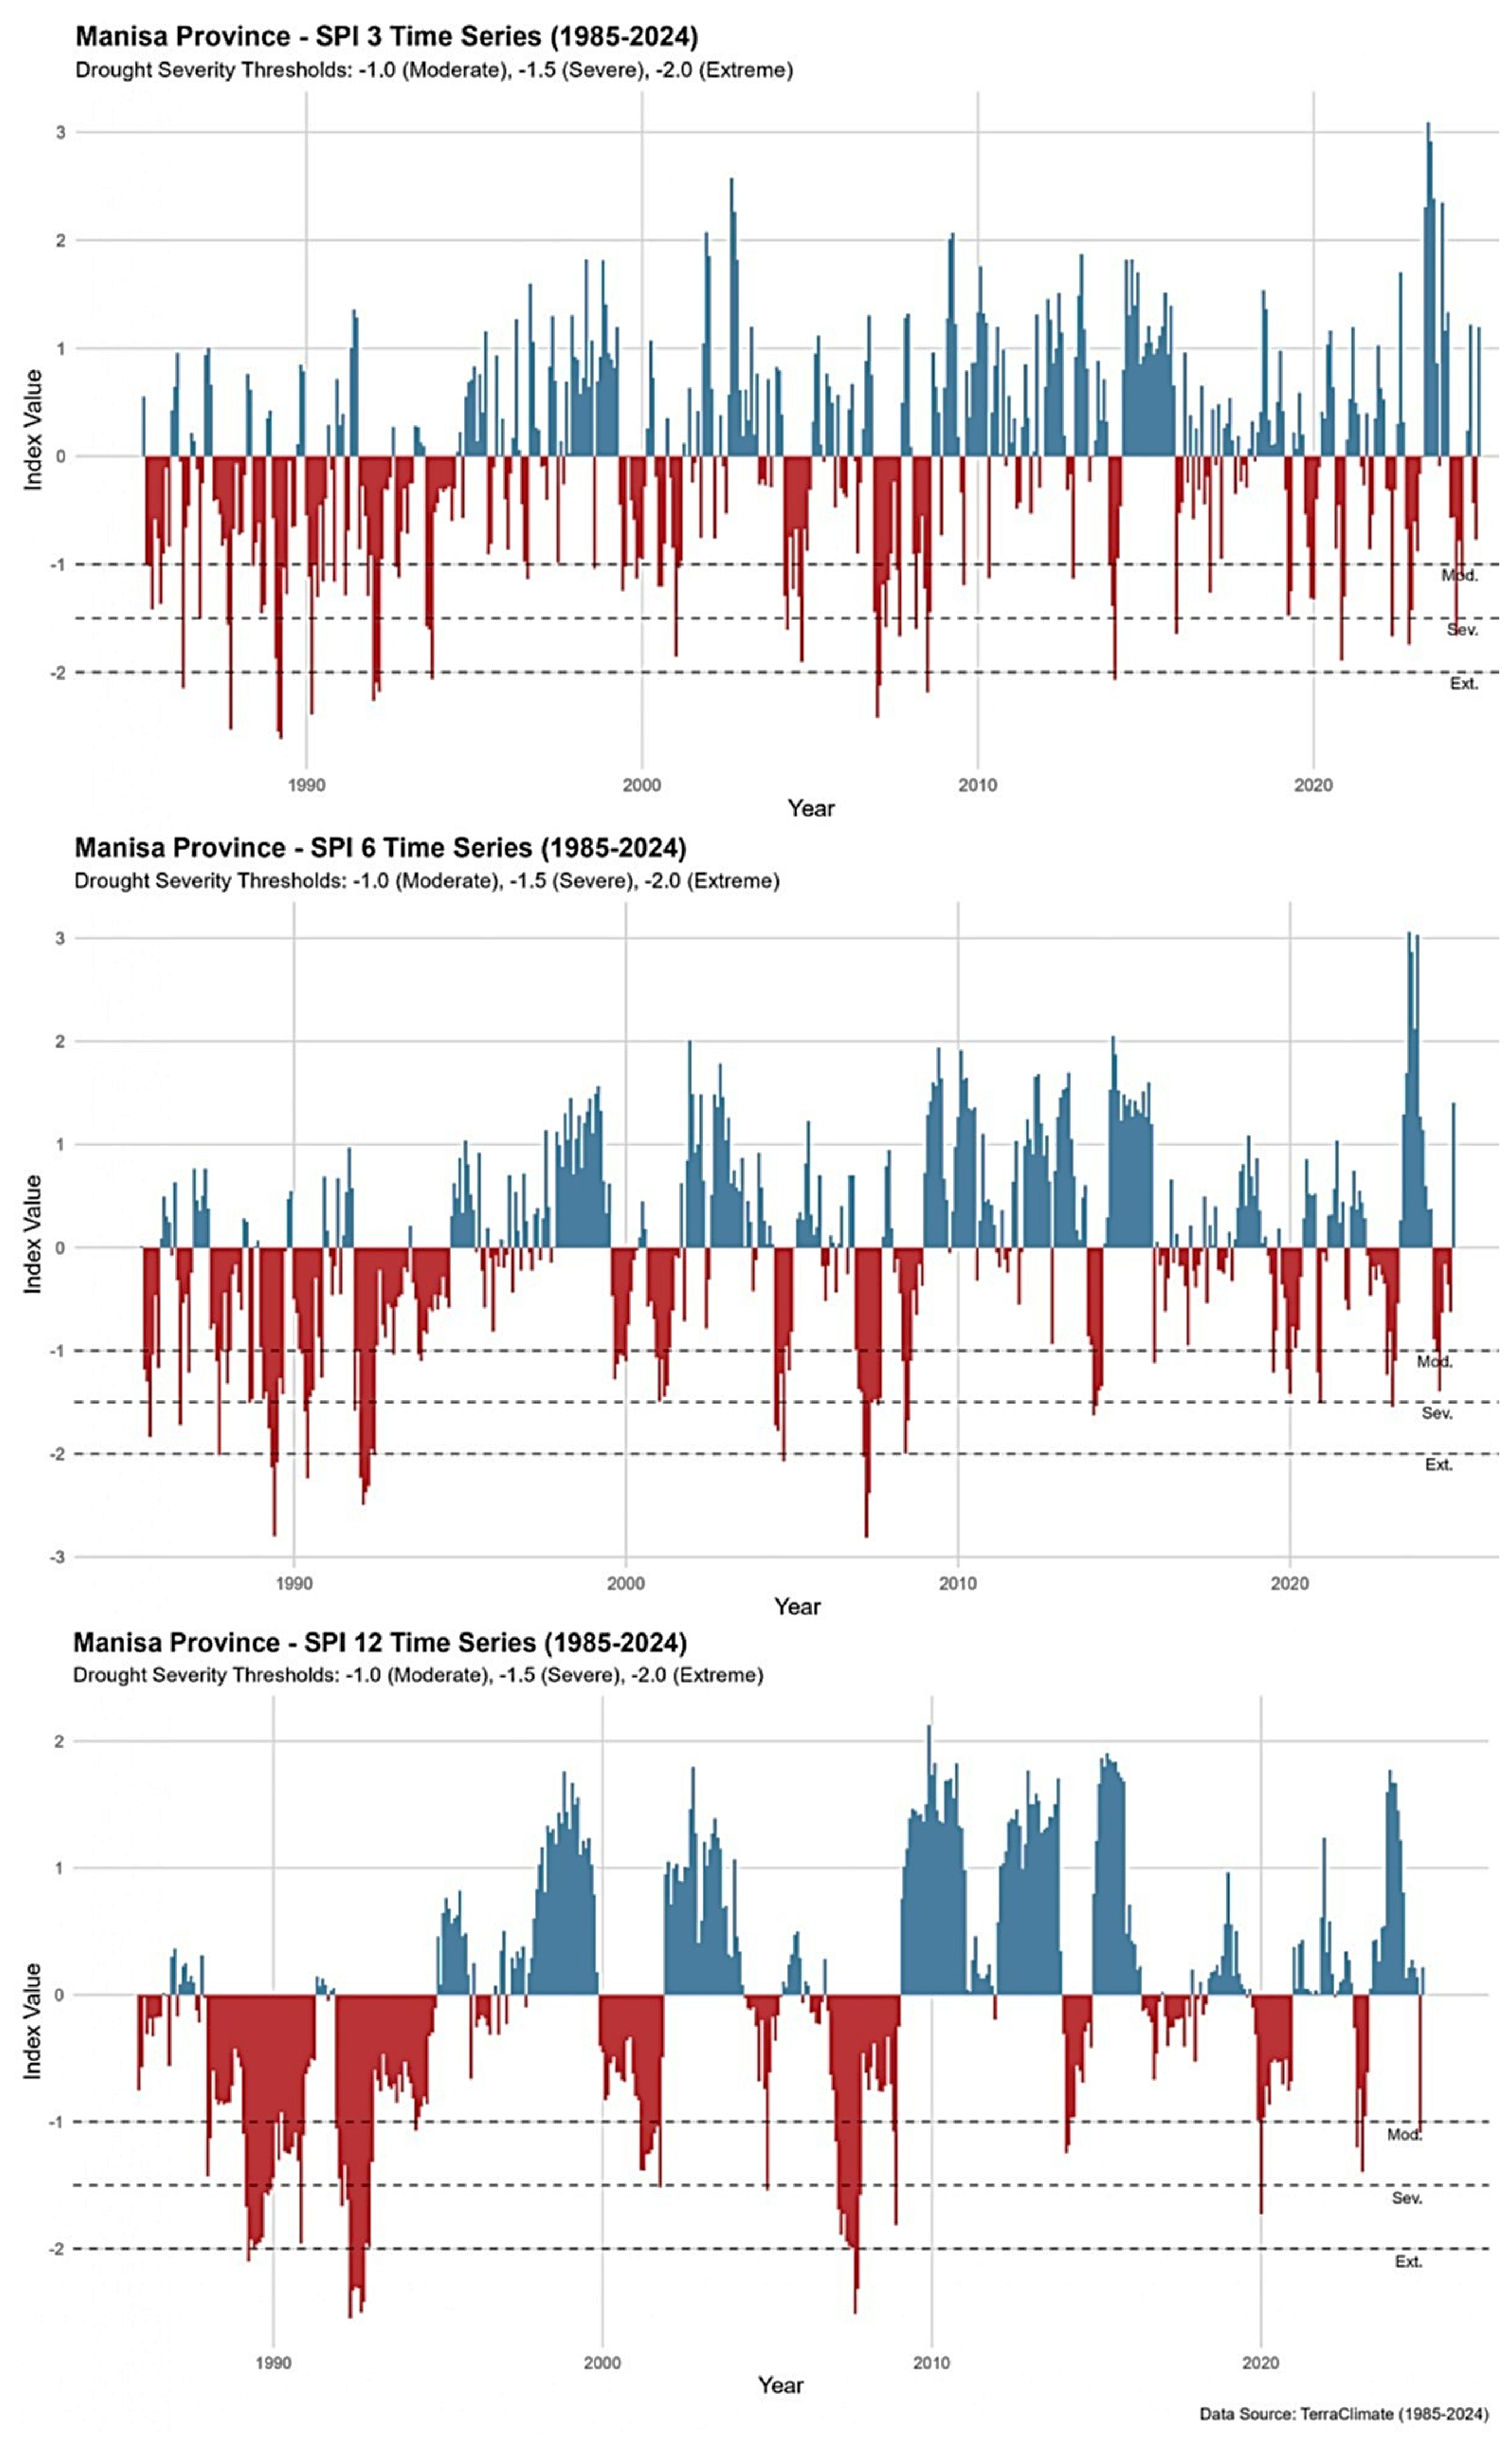
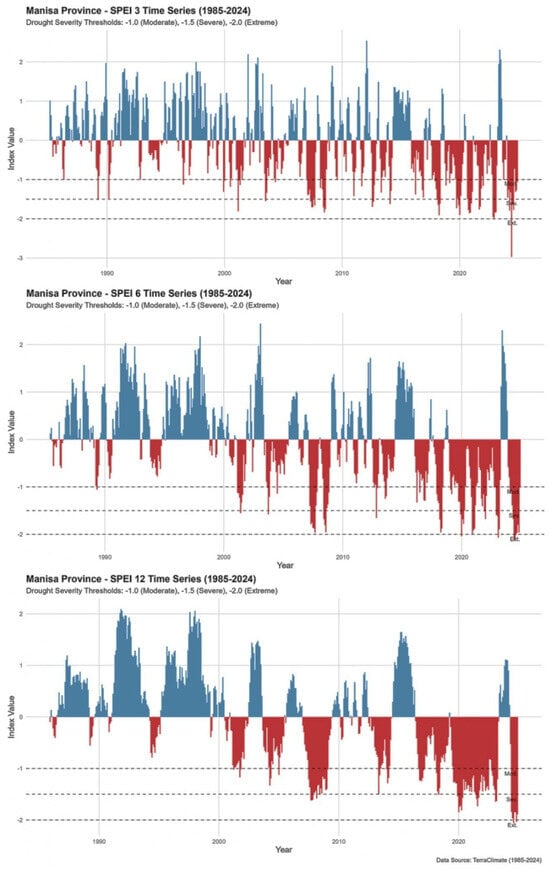
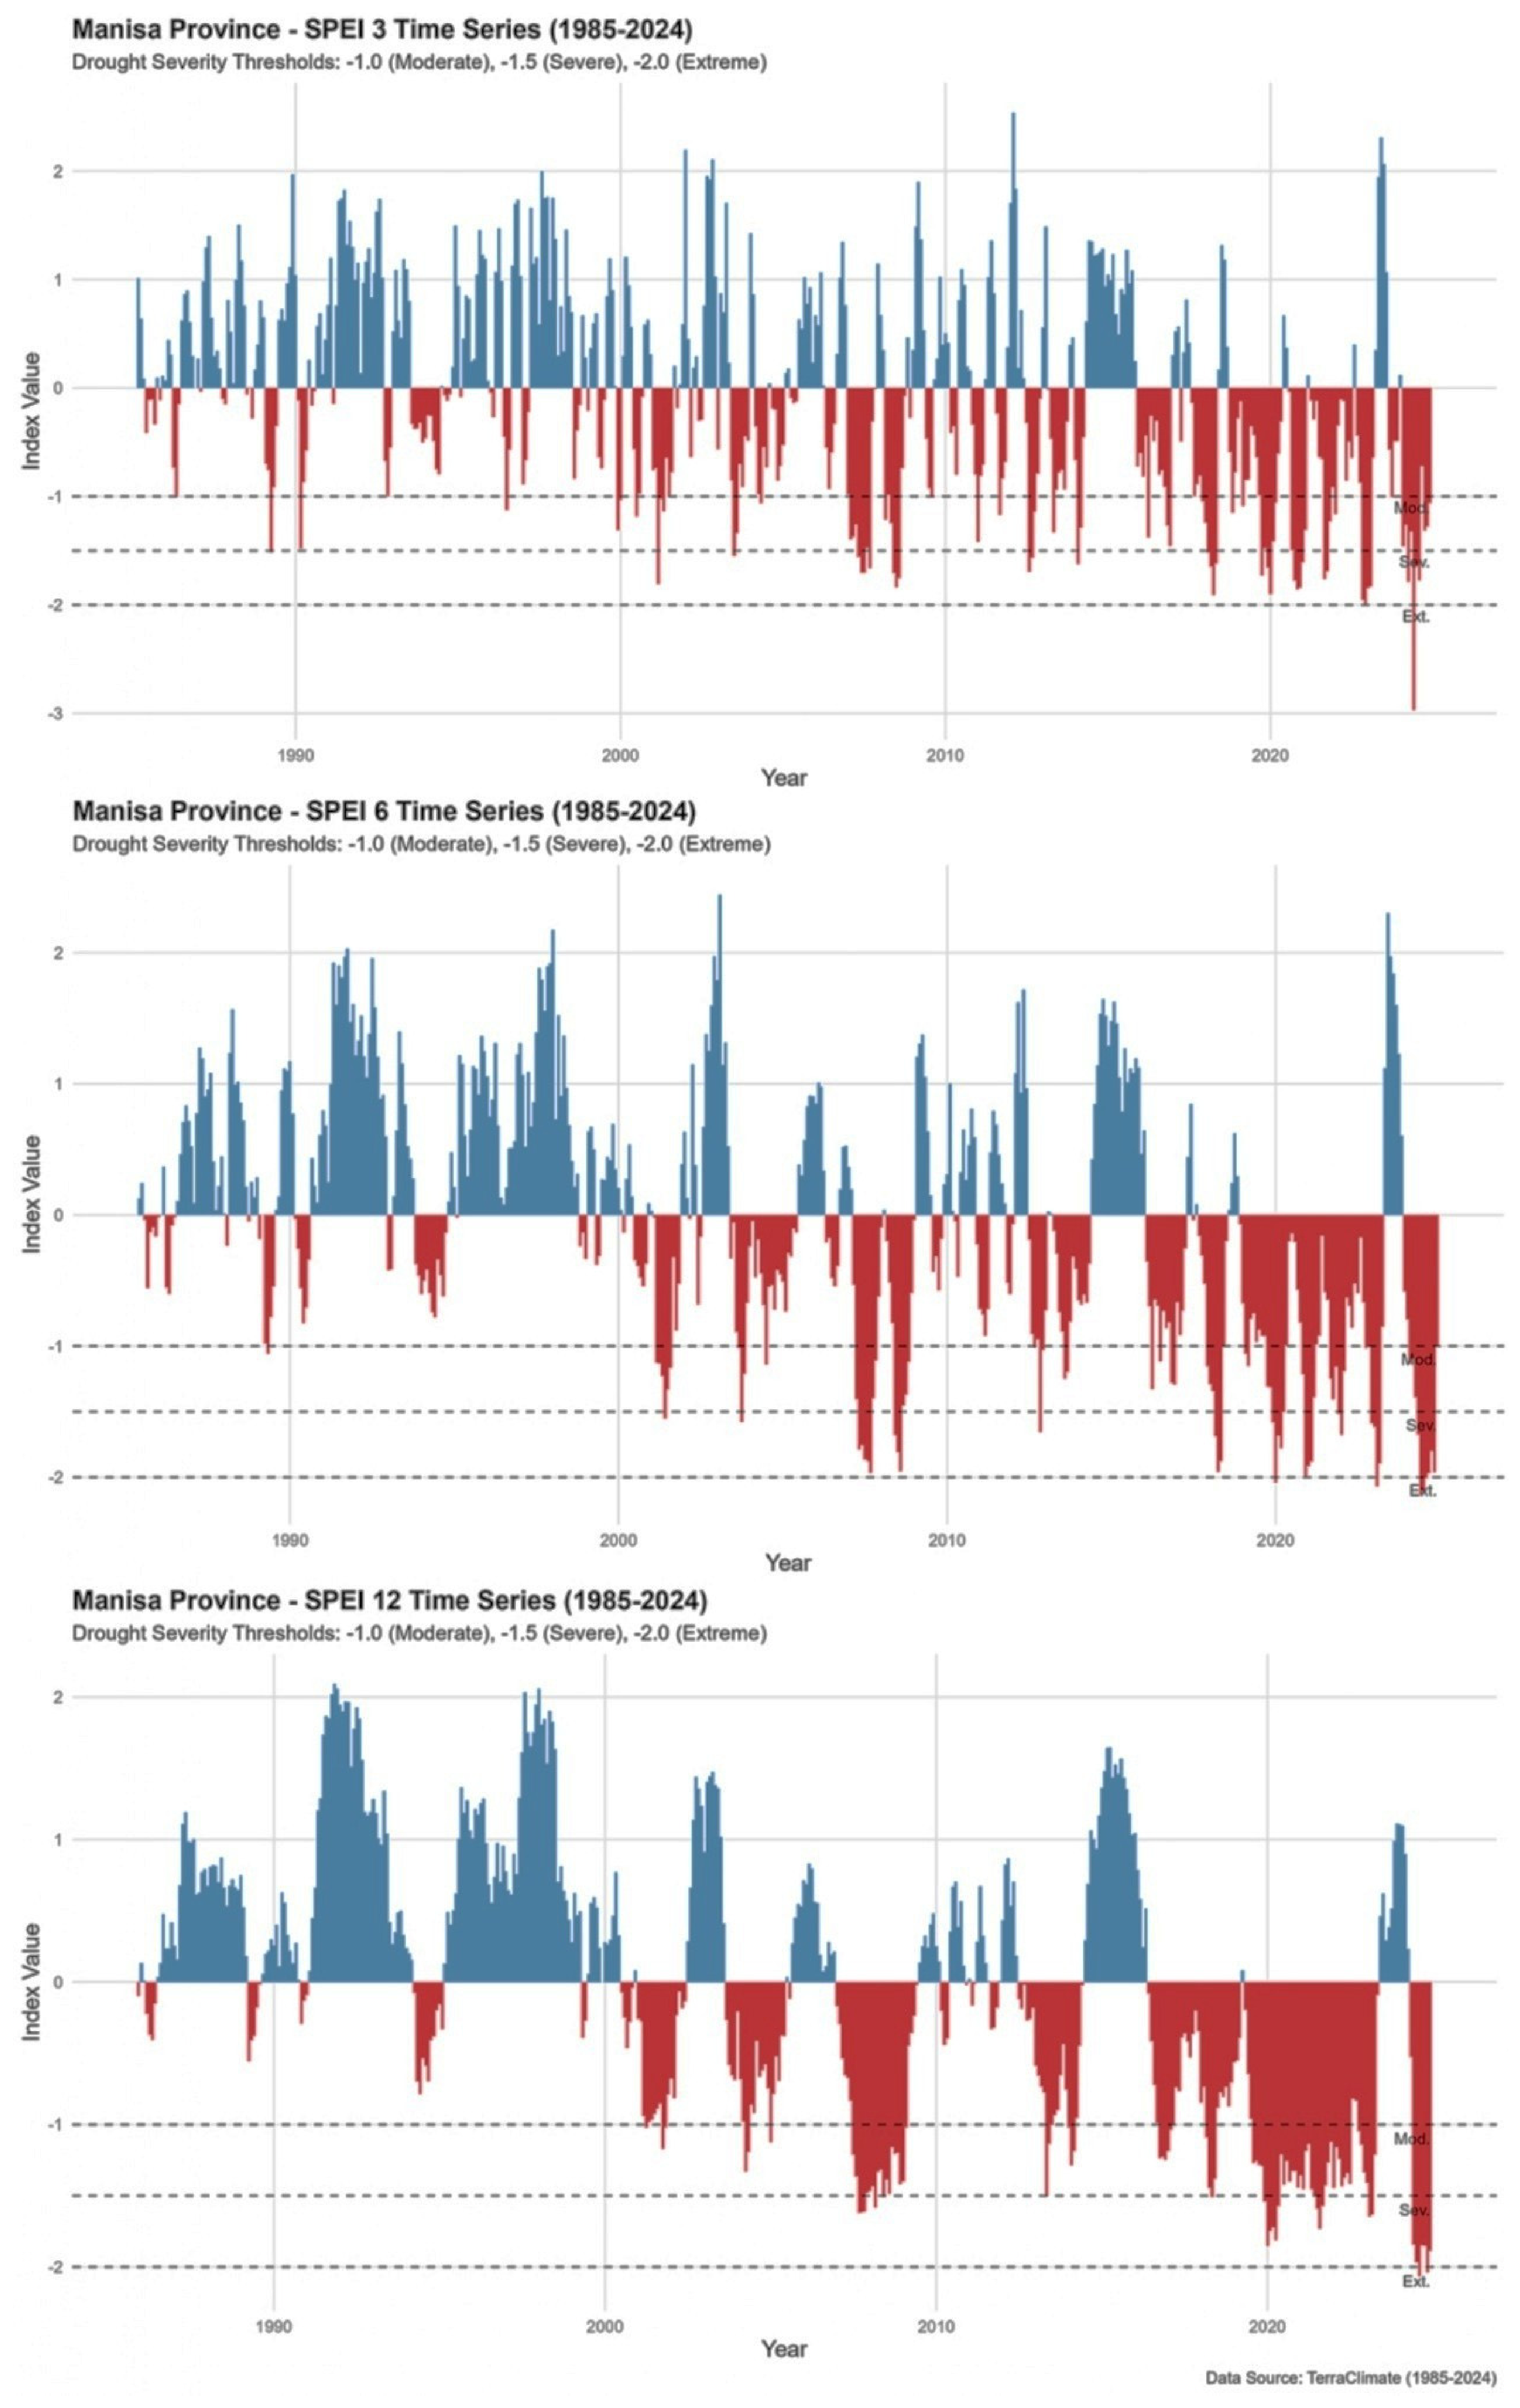
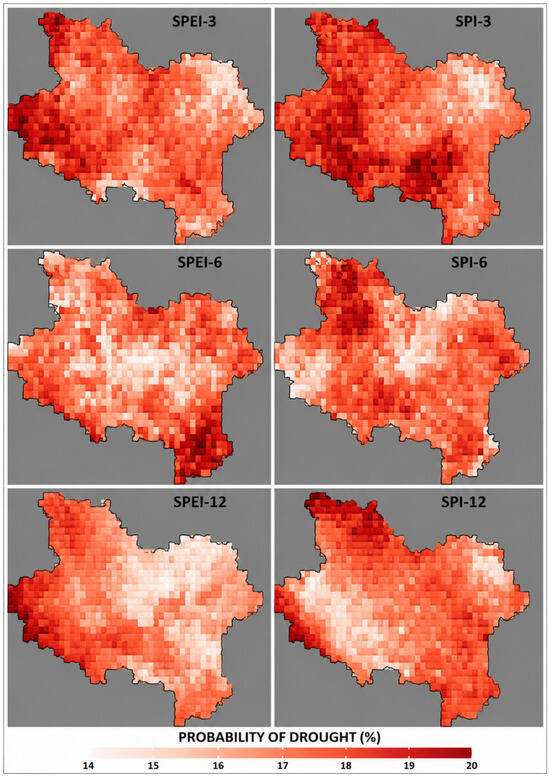
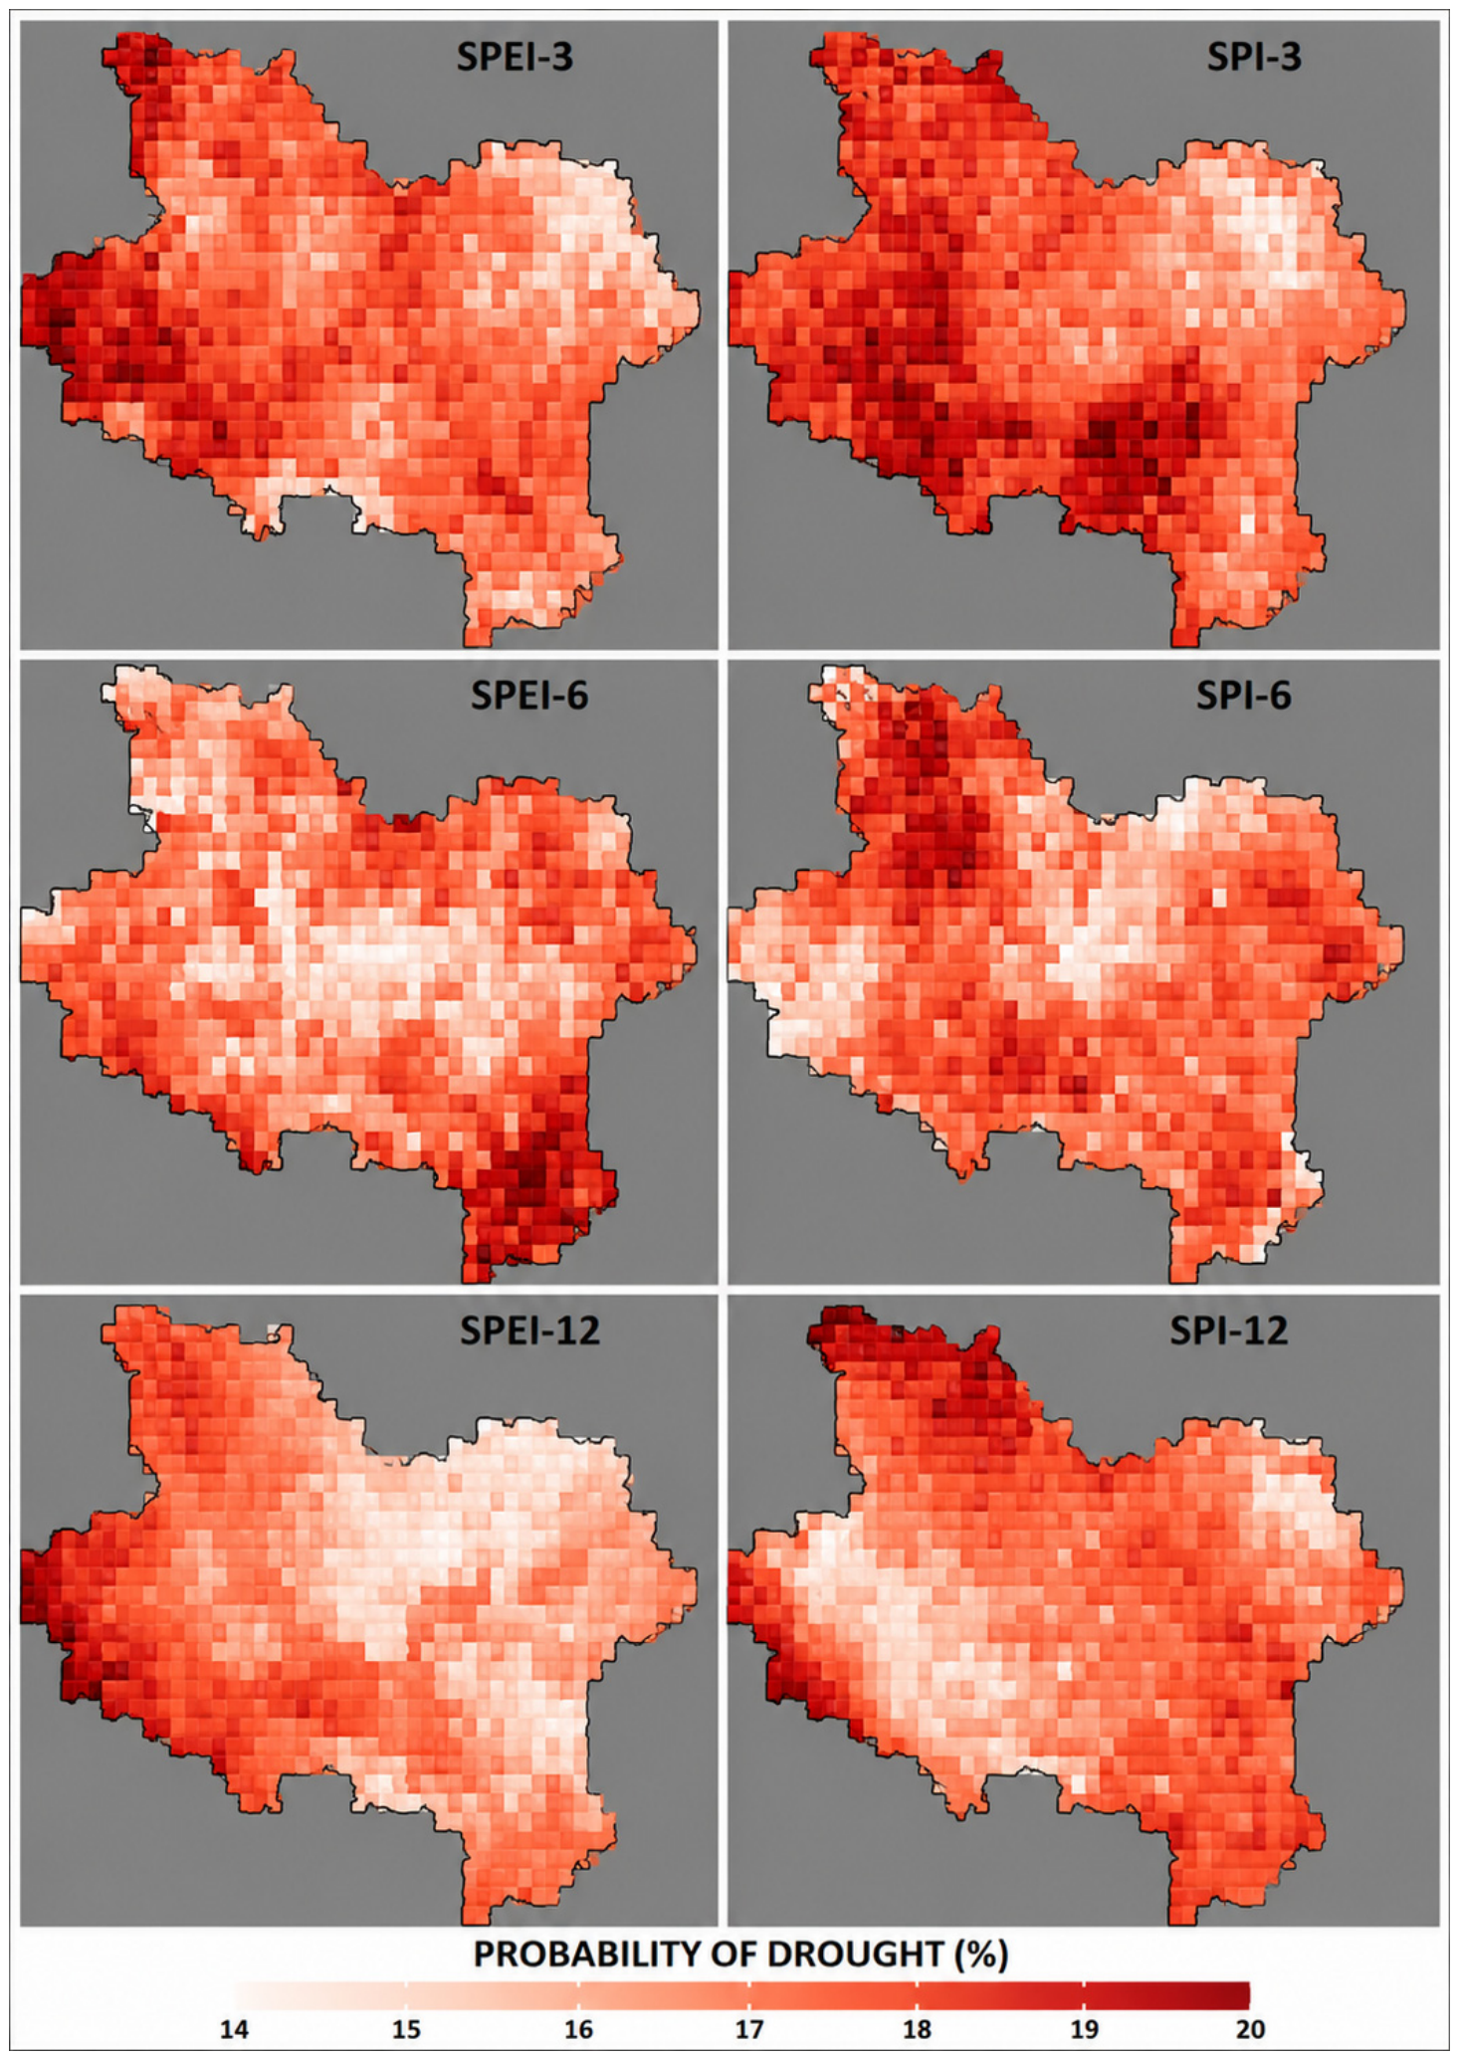
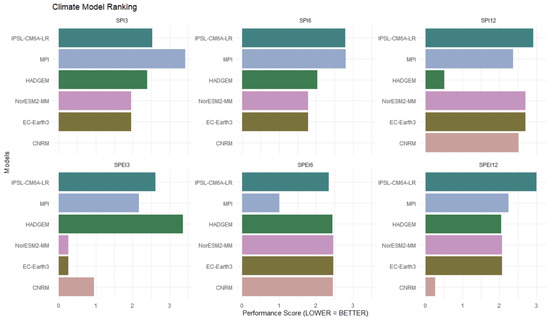
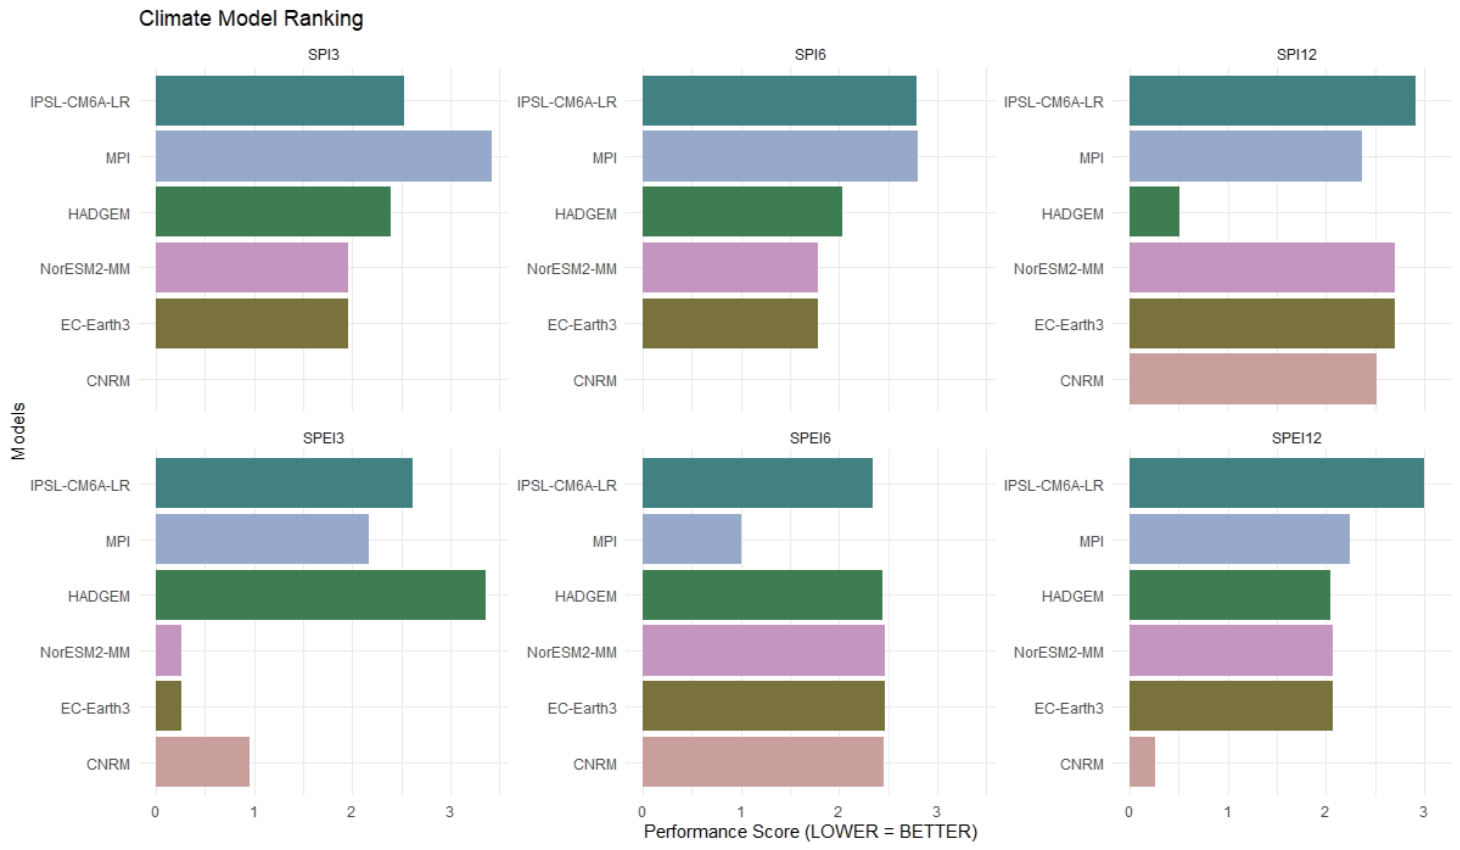
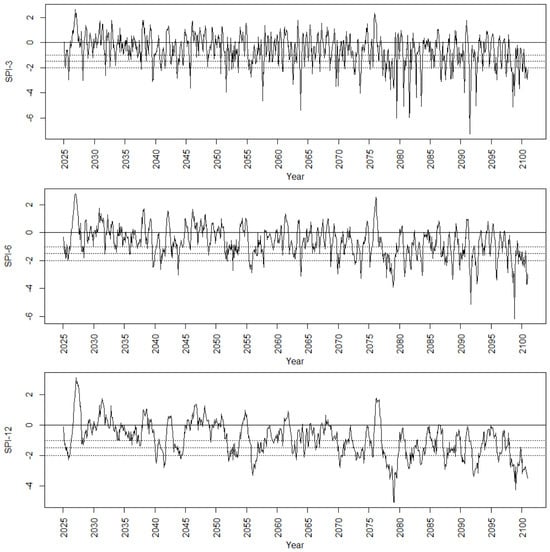
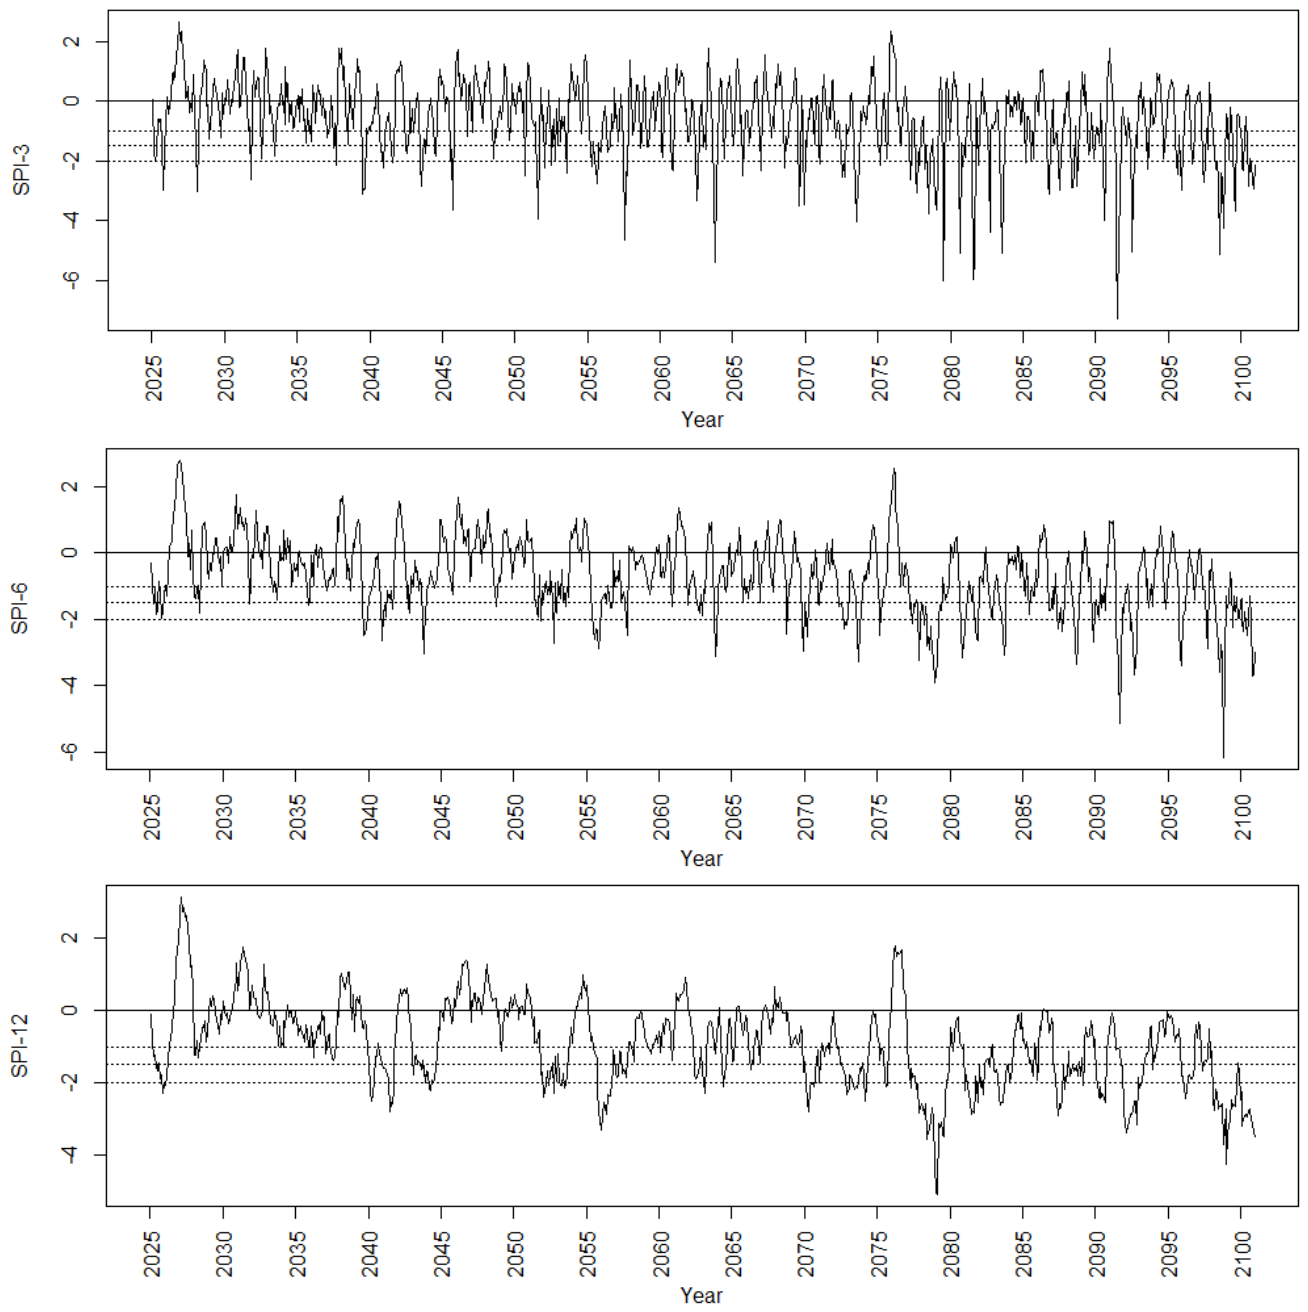
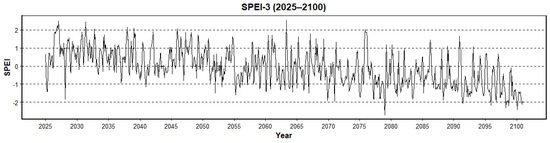
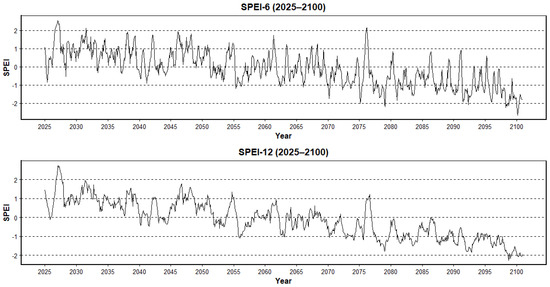
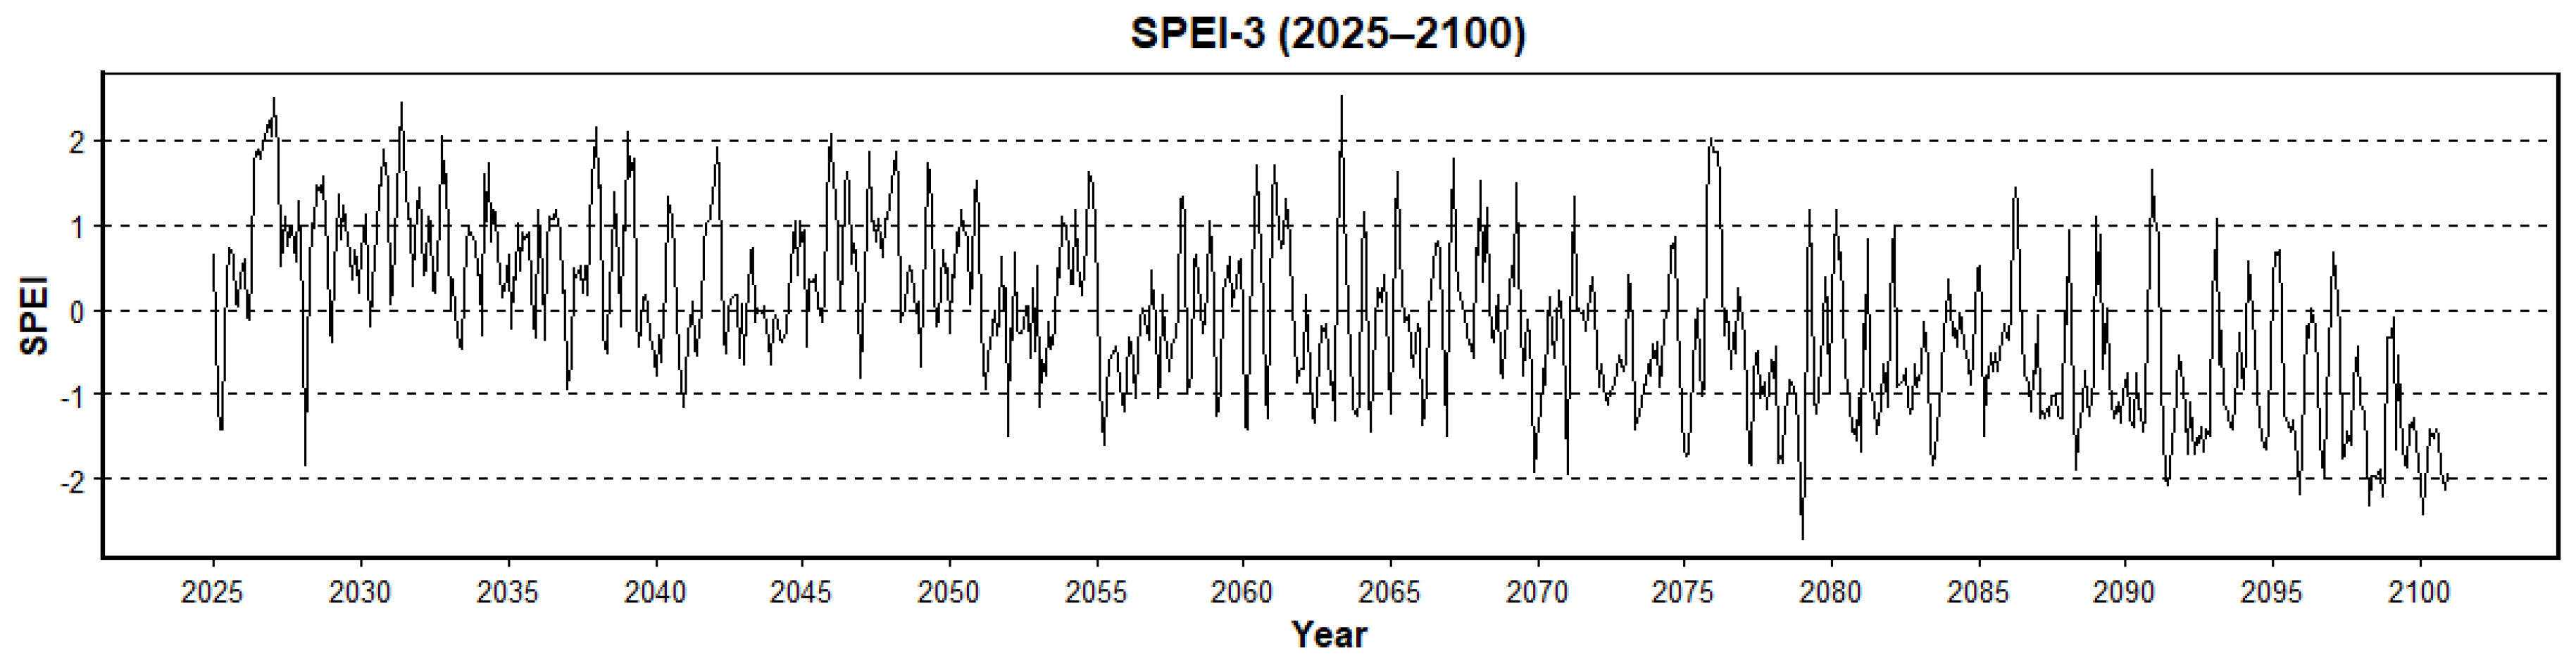
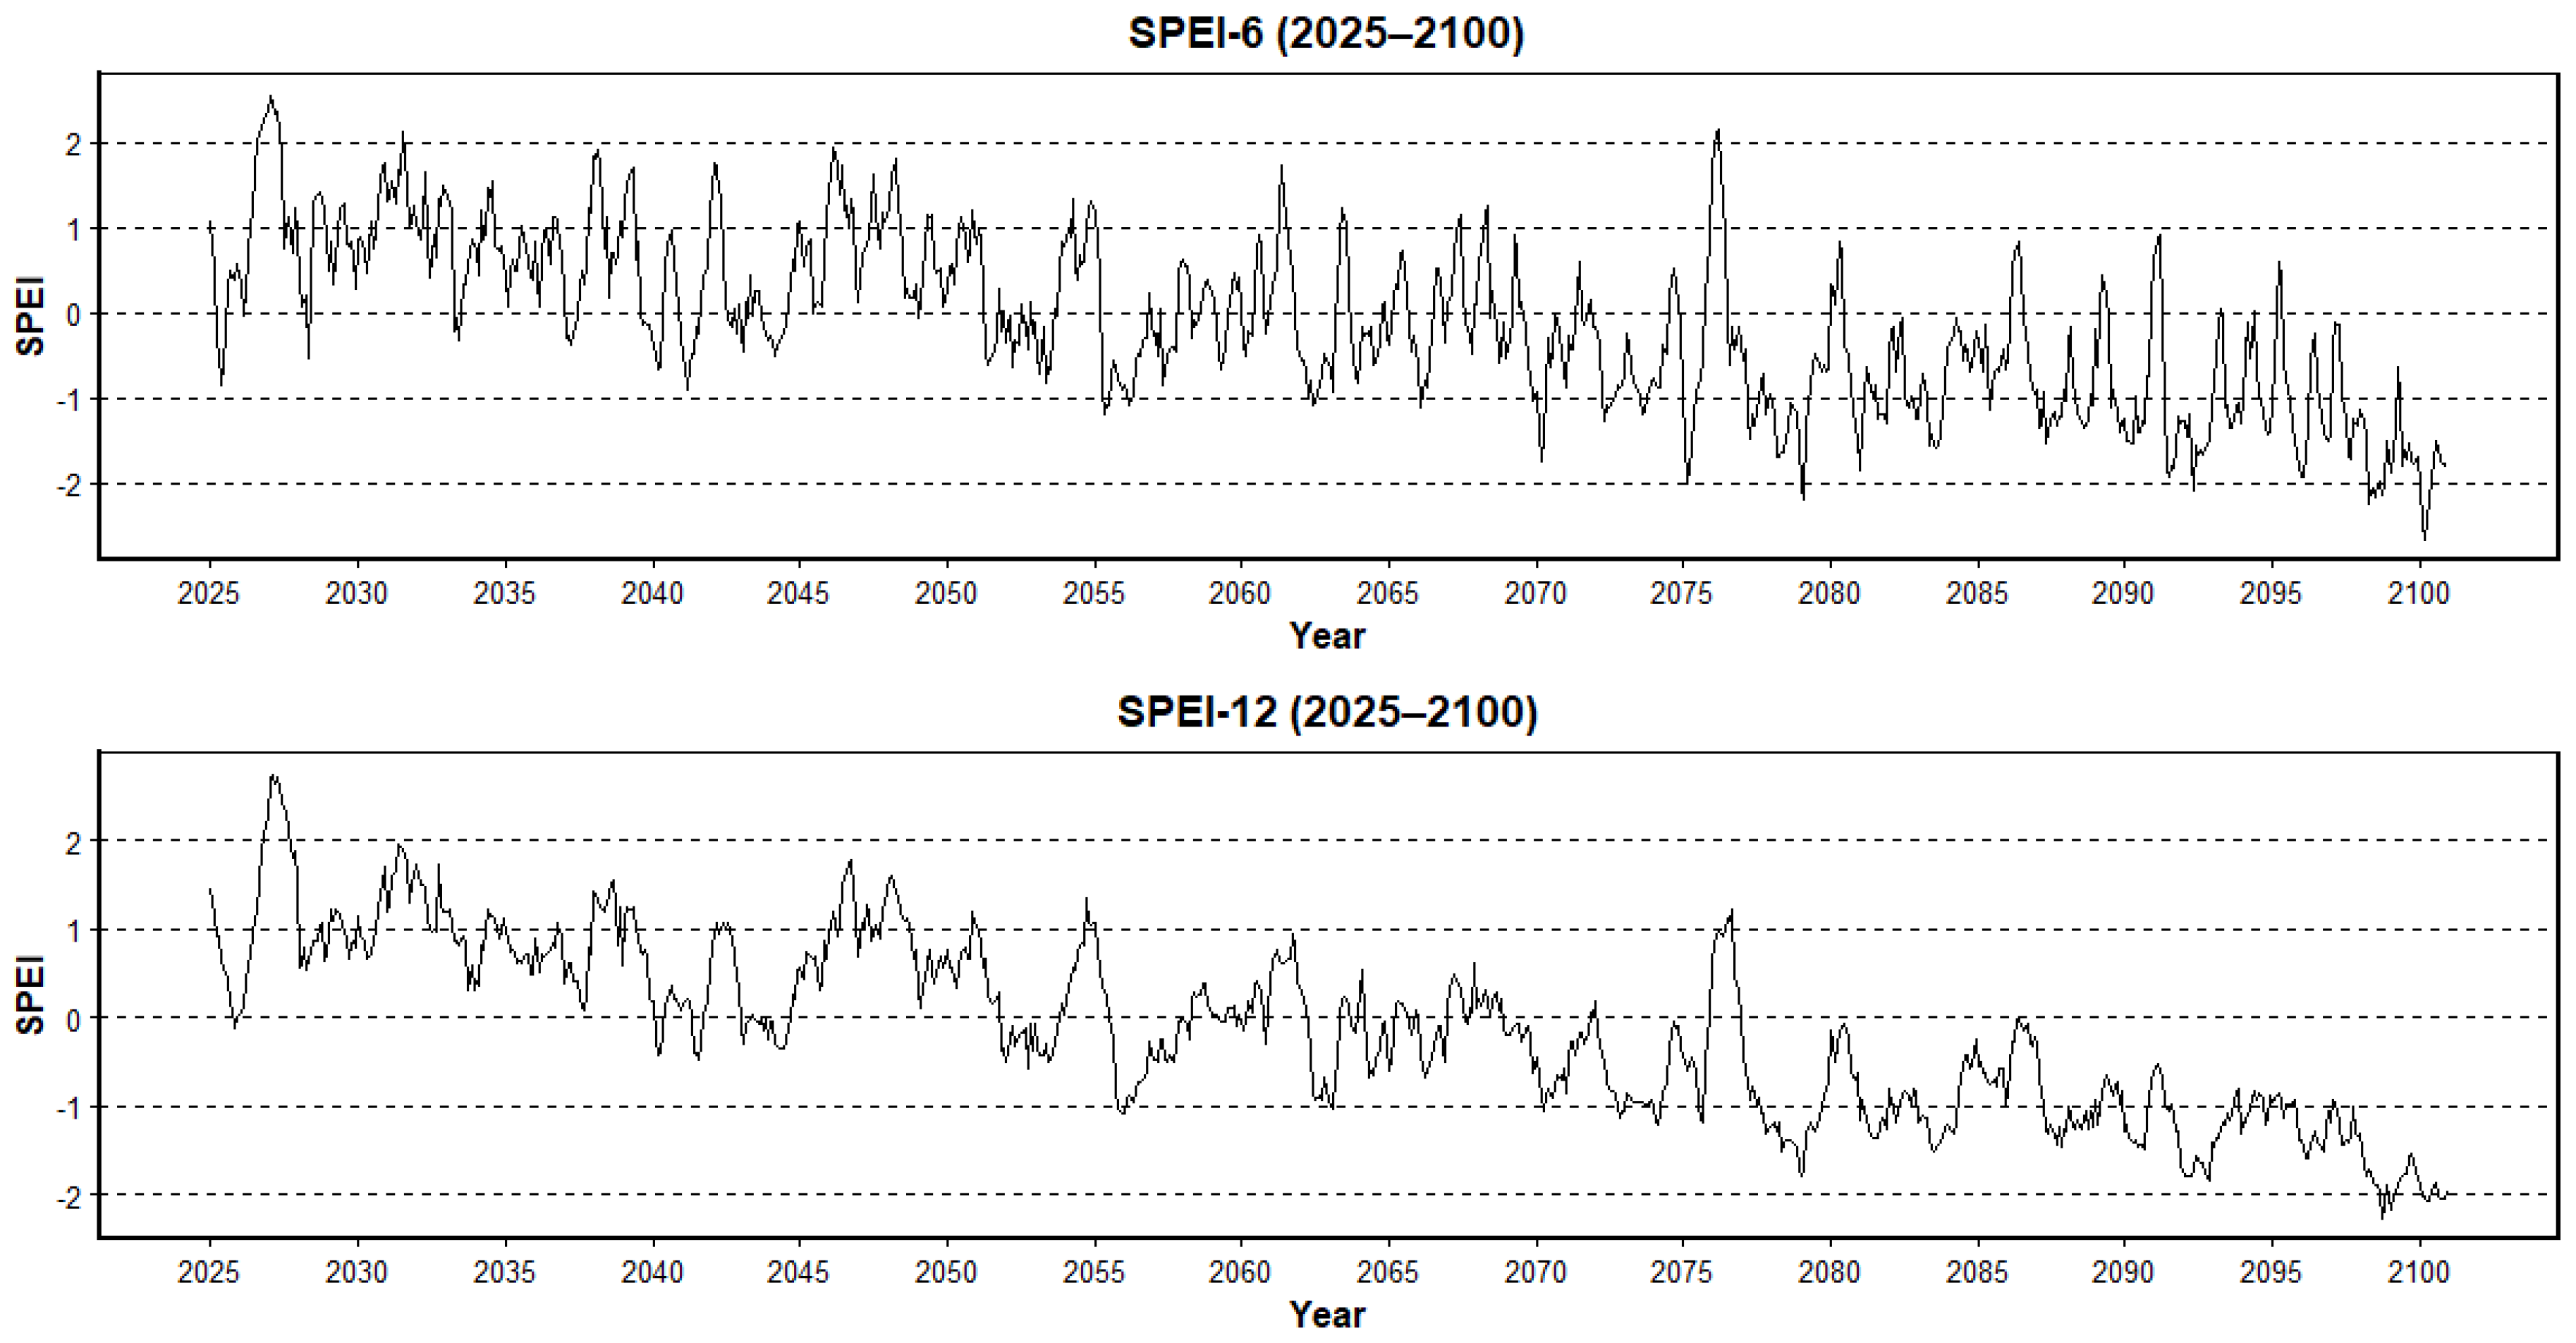
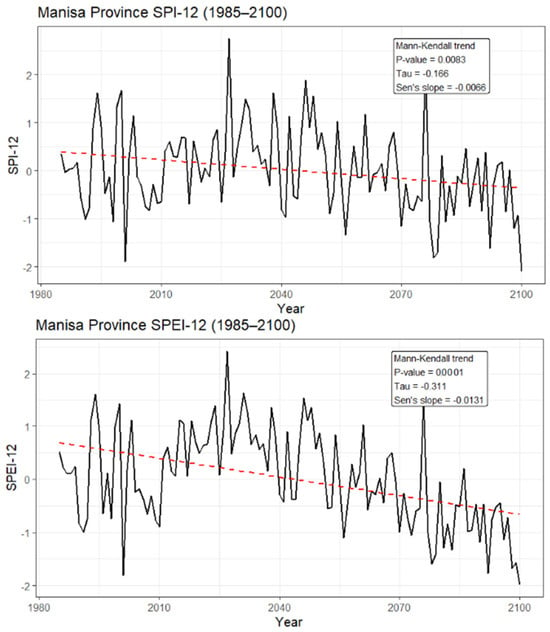
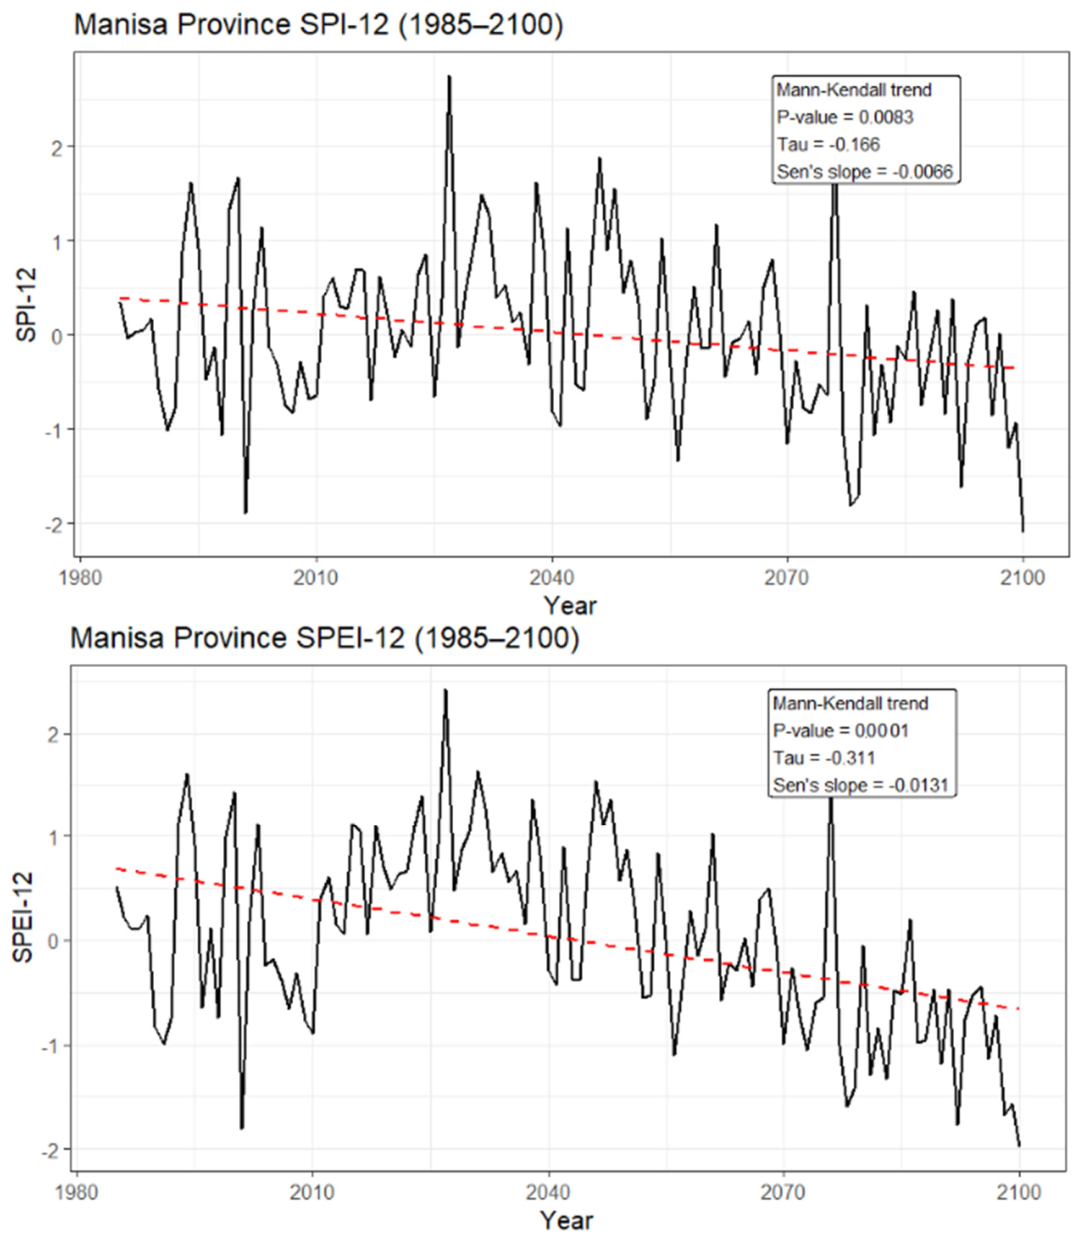

Disclaimer/Publisher’s Note: The statements, opinions and data contained in all publications are solely those of the individual author(s) and contributor(s) and not of MDPI and/or the editor(s). MDPI and/or the editor(s) disclaim responsibility for any injury to people or property resulting from any ideas, methods, instructions or products referred to in the content. |
© 2026 by the authors. Licensee MDPI, Basel, Switzerland. This article is an open access article distributed under the terms and conditions of the Creative Commons Attribution (CC BY) license.